september mike poteshman 2016 executive vp & cfo/media/files/t/tupperware-ir/... · executive...
TRANSCRIPT

Mike Poteshman Executive VP & CFO
September 2016
2
Forward looking statements
We are making some forward looking statements today that use
words like “outlook” or “target” or similar predictive words. Such
forward looking statements involve risks and uncertainties detailed in
our recent periodic reports as filed in accordance with the Securities
and Exchange Act of 1934. These risks and uncertainties may cause
actual results to differ materially from our statements today.
Visit www.tupperwarebrands.com
3
Agenda
Business Model
Diversified Portfolio
Growth Opportunities
Financial Performance
Uses of Cash

4
Powerful Business Model
Group Demonstration Selling Brands & Products
Business Fundamentals Sales Force Opportunity
5
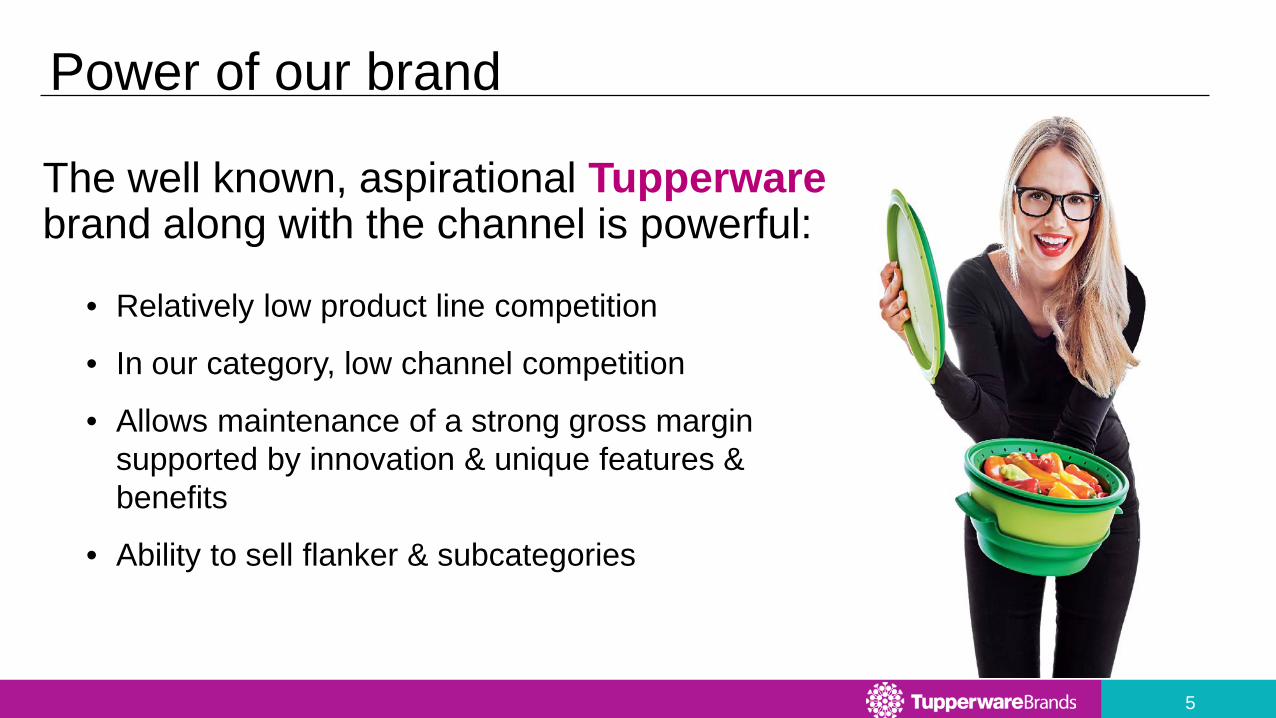
Power of our brand
The well known, aspirational Tupperware brand along with the channel is powerful:
• Relatively low product line competition
• In our category, low channel competition
• Allows maintenance of a strong gross margin supported by innovation & unique features & benefits
• Ability to sell flanker & subcategories

6
Innovative and demonstrable product
OVENWARE
KITCHEN ESSENTIALS
FAST MICROWAVE COOKING
DRINKING SOLUTIONS
MOVE / ON THE GO
FOOD CONSERVATION
CHEF COOKING
KITCHEN ESSENTIALS

7
Power of demonstration selling
Demonstration Unlocks Features & Benefits Education plus Entertainment Allows Selling of High Price Point Items Increases Hourly Earnings Brand Building Sales Force Additions Access to New Hostesses & Consumers

8
Sales Force Opportunity
Consultant
Demonstrates & sells product Income based on
Personal sales
Manager Team Leader
Distributor
Builds a team of 3 – 5 Consultants Income based on
Total team sales Personal sales
Develops Managers within her group Income based on
Sales of the group Total team sales Personal sales
Leads & Builds a Sales Organization Income based on Organizational sales
Independent Business Owners can choose to earn a Part or Full-Time Income

9
Business Fundamentals
Find new sellers
Train new sellers
Leadership Development
Grow the Sales Force
Meetings & Events
Group Demonstration
Recognition & Rewards
Support Consistent Activity
10
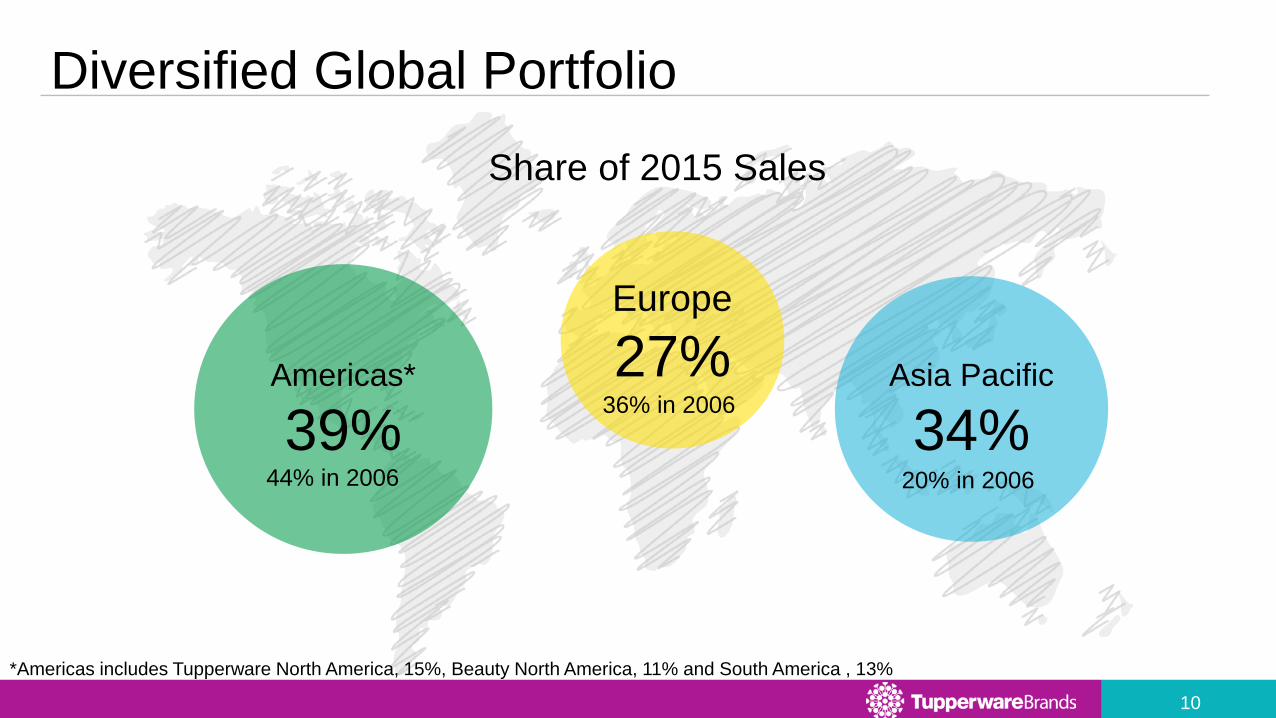
Diversified Global Portfolio
Americas*
39% Asia Pacific
34%
*Americas includes Tupperware North America, 15%, Beauty North America, 11% and South America , 13%
Europe
27% 36% in 2006
Share of 2015 Sales
44% in 2006
20% in 2006

11
Emerging Market Growth
Emerging Markets 66% of Sales 12% CAGR from 2006 to 2015*
Established Market
34% of Sales (2)% CAGR from 2006 to 2015*
*2006 – 2015 sales restated at September 2015 exchange rates

12
Seven units over $100 million in 2015 sales
Over
$200 Million
Over
$100 Million
Brazil Indonesia
China
Fuller Mexico
Germany
Tupperware Mexico
Tupperware U.S. & Canada
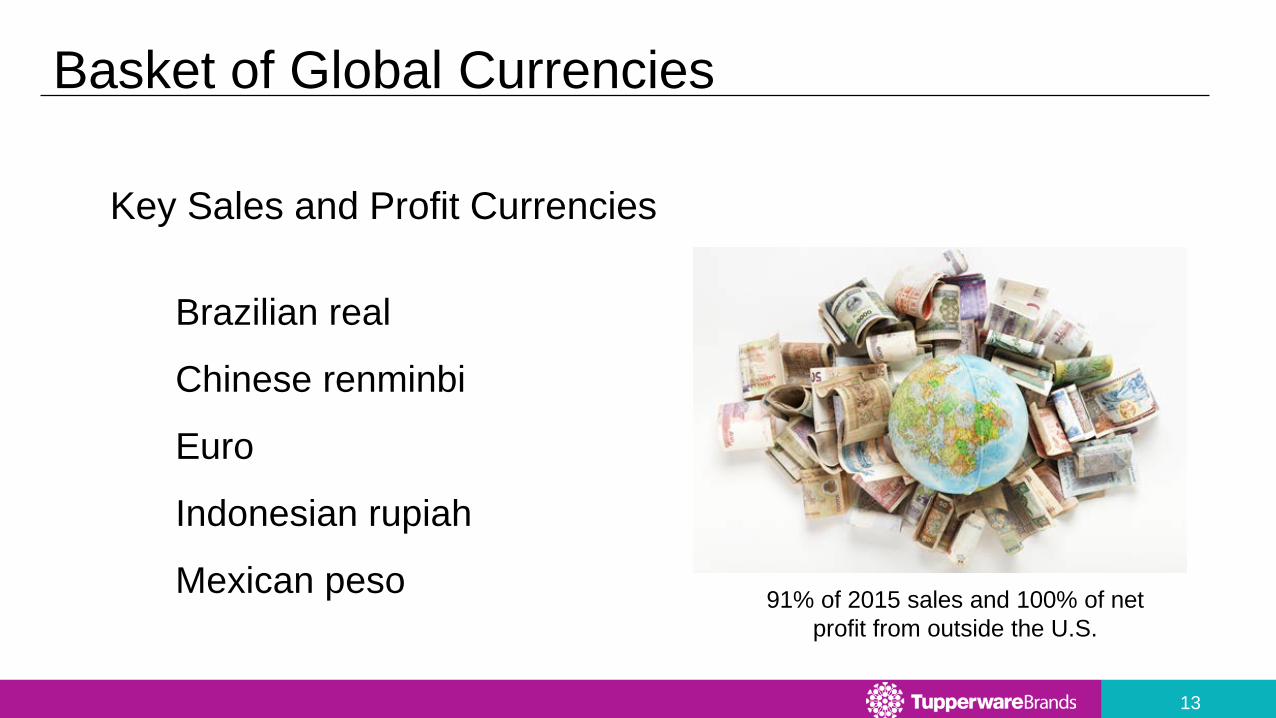
13
Key Sales and Profit Currencies
91% of 2015 sales and 100% of net profit from outside the U.S.
Basket of Global Currencies
Brazilian real
Chinese renminbi
Euro
Indonesian rupiah
Mexican peso

14
Growth Opportunities
1 Increase Penetration in Emerging Markets
Extend our Reach 3 2 Strengthen the Core Business Model

15
• 85% of the world’s population & 66% of sales in 2015
• Growing Middle Class
• Lower Employment of Women outside the home
• Direct Sales Channel Growth of 4-5% annually through 2019*
*Based on data found on Euromonitor
1 Increase Penetration in Emerging Markets
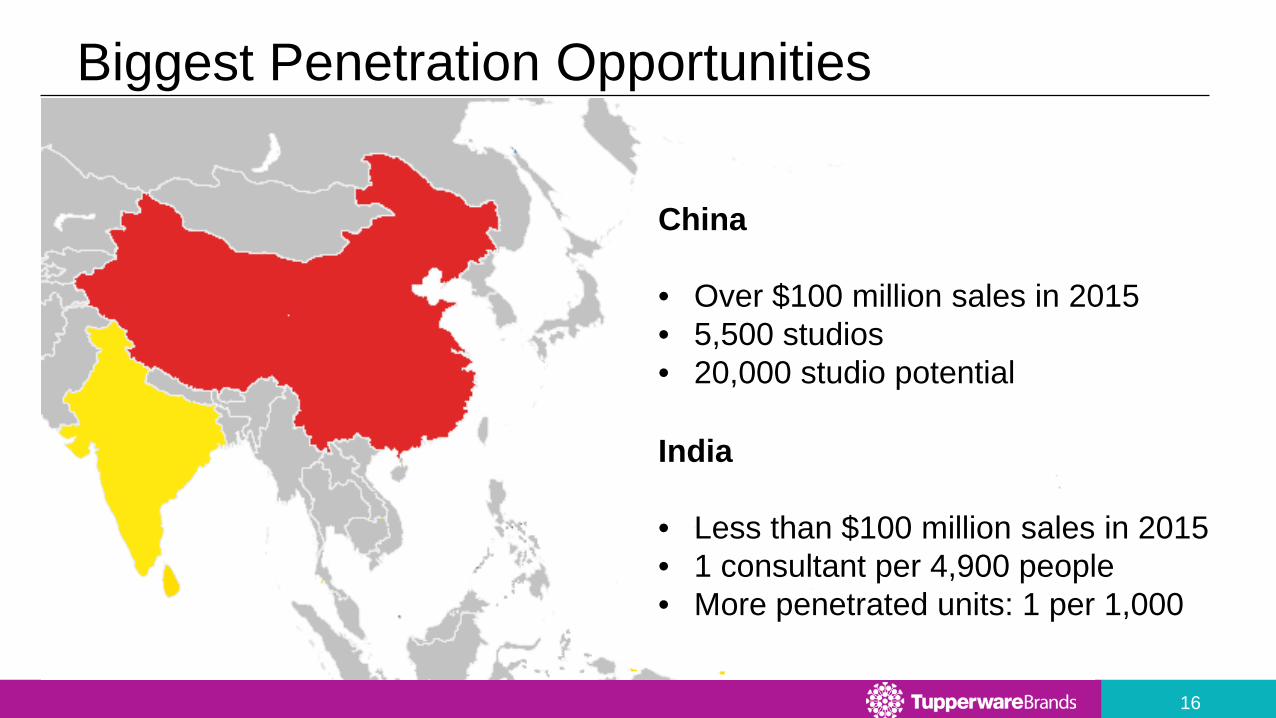
16
Biggest Penetration Opportunities
China • Over $100 million sales in 2015 • 5,500 studios • 20,000 studio potential
India • Less than $100 million sales in 2015 • 1 consultant per 4,900 people • More penetrated units: 1 per 1,000

17
Strengthen the Core Business Model
Extend our Reach

18
Strengthen the Core Business Model 2 Onboarding Success Formulas Demonstration Selling
Consistent global program of training, support, activities, and rewards for new consultants to learn fundamentals that will increase productivity & longevity
Brazil and Germany Pilot
+Single digit increase in productivity
Roadmap of weekly activities for all levels of the sales force, which lead to desired earnings and career opportunities
Mexico Pilot
Leaders performing 90% activities +11% Leaders performing 1/2 activities +6%
Greater penetration of demonstration selling • Brochure 1 on 1 demo • 1 on 1 group demo • Group demo culinary
Mexico Pilot
Party average increase low single digit

19
3 Extend our Reach
Party + Experience Studios Brand Ambassador
Blending of the live, in home party and e-commerce through video technology
Tupperware U.S. Pilot
+1-2 guests per party 2x order size than pure ecommerce
Partnering with sales force leaders to establish modern contact centers more accessible to our sales force and consumers
U.S. & Canada
30 remodeled or new studios to open in 2017
Opportunity to engage former sellers through the use of more consistent marketing efforts including digital
4 Europe Units
Pilot testing begins

20
The Studio

21
The Studio

22
Vision 2020 Strategies Timeline
Late 2013
Group Formed
1st Half 2014
Selection of areas of focus
2nd Half 2014
Creation of best practices & toolkits
1st Half 2015
Proof of concept begins
2nd Half 2015
First results for Pilots captured
Refinement of
toolkits
2016
Integration of Onboarding & Success Formula initiatives
Proof of concept for Extend the Reach initiatives
2017
Strengthen the Core & Extend the Reach
More widely adopted

23
4% to 9%* local currency sales growth each year
2007 - 2015
Strong history of growth
5.0% to 12.8%** pretax ROS in 2003 & 2015
65 bps** annual average margin
improvement from 2003 to 2015 *See appendix for the Company’s reported sales from 2007 to 2015 and annual basis point improvement in local currency **Pre-tax ROS shown is excluding items. See GAAP to non-GAAP reconciliation in the appendix
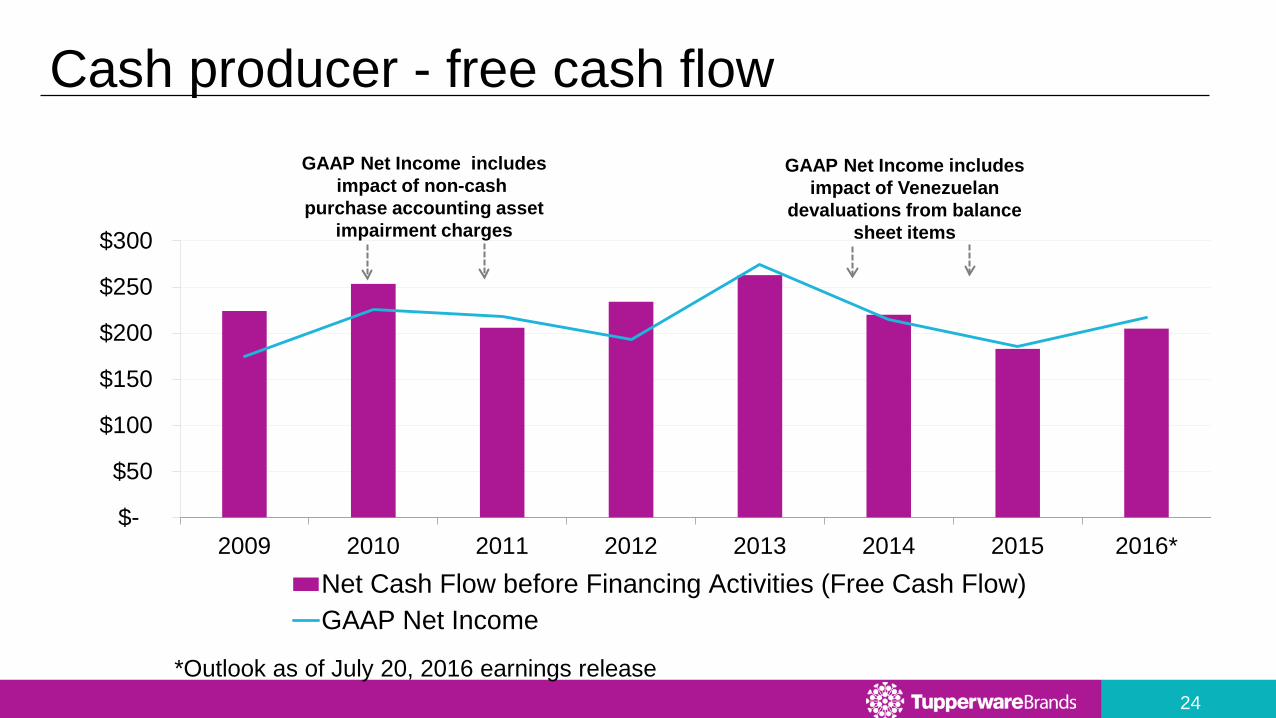
24
Cash producer - free cash flow
$-
$50
$100
$150
$200
$250
$300
2009 2010 2011 2012 2013 2014 2015 2016*Net Cash Flow before Financing Activities (Free Cash Flow)GAAP Net Income
GAAP Net Income includes impact of non-cash
purchase accounting asset impairment charges
GAAP Net Income includes impact of Venezuelan
devaluations from balance sheet items
*Outlook as of July 20, 2016 earnings release

25
Capital Allocation Policy
1
Dividend payout based on 50% of
trailing year’s EPS without items
Cash Flow from Operating net of Investing Activities
2
Manage Debt under leverage target of
1.75x Net Debt to EBITDA
3
Repurchase shares in the open market
with remaining cash and debt capacity
Allows Flexibility

26
Uses of Cash 2016 Guidance
Dividends 68 cents per share quarterly
Yield 4.2%**
Improve Leverage Ratio Toward 1.75X Target
through moderate EBITDA growth & debt repayment*
*As of July 20, 2016 earnings release **Yield based on $2.72 annual dividend and closing share price of $65.53 on August 31, 2016
Cash Flow from Operating Net of Investing Activities Guidance: $195 to $205 million
Includes $28 million in potential Q3 land proceeds

27
Why Invest
Competitive Business Model
Opportunities for Above Average Growth
Diversified Portfolio for Sustainable Performance
Significant Return of Capital to Shareholders

28
Appendix
29
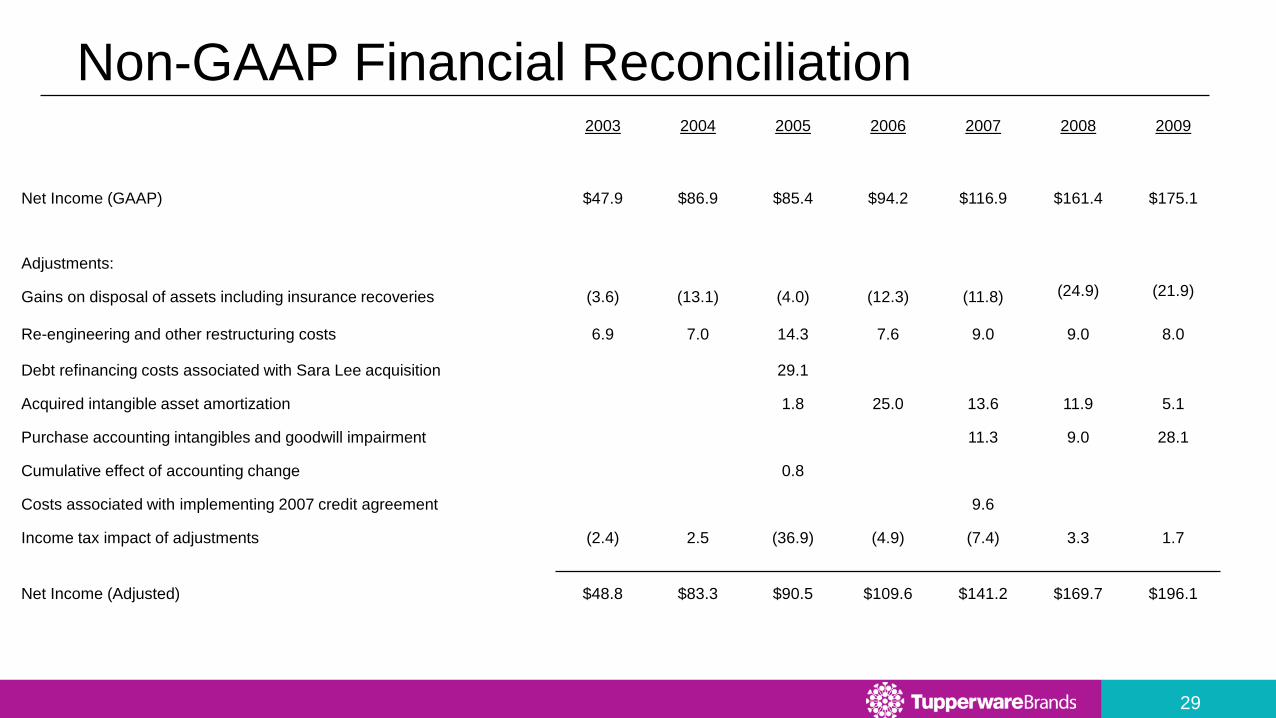
Non-GAAP Financial Reconciliation 2003 2004 2005 2006 2007 2008 2009
Net Income (GAAP) $47.9 $86.9 $85.4 $94.2 $116.9 $161.4 $175.1
Adjustments:
Gains on disposal of assets including insurance recoveries (3.6) (13.1) (4.0) (12.3) (11.8) (24.9) (21.9)
Re-engineering and other restructuring costs 6.9 7.0 14.3 7.6 9.0 9.0 8.0
Debt refinancing costs associated with Sara Lee acquisition 29.1
Acquired intangible asset amortization 1.8 25.0 13.6 11.9 5.1
Purchase accounting intangibles and goodwill impairment 11.3 9.0 28.1
Cumulative effect of accounting change 0.8
Costs associated with implementing 2007 credit agreement 9.6
Income tax impact of adjustments (2.4) 2.5 (36.9) (4.9) (7.4) 3.3 1.7
Net Income (Adjusted) $48.8 $83.3 $90.5 $109.6 $141.2 $169.7 $196.1

30
Non-GAAP Financial Reconciliation
*High end of guidance range provided in July 20, 2016 Earnings Release. Includes Q3 land transaction projected to generate about $28 million proceeds and EPS of 27 cents. Impact of changes in foreign currency versus prior year are updated monthly and posted on: http://ir.tupperwarebrands.com/foreign-exchange-impact.cfm.
2010 2011 2012 2013 2014 2015 Q1 2016 Q2 2016 Q3 2016* 2016*
Net Income (GAAP) $225.6 $218.3 $193.0 $274.2 $214.4 $185.8 $43.4 $52.4 $50.4 $217.1
Adjustments:
Gains on disposal of assets including insurance recoveries (0.2) (3.8) (7.9) (0.7) (2.7) (13.7) (0.1) (0.8) (22.4) (23.3)
Re-engineering and other restructuring costs (includes Pension Settlement costs) 7.6 9.6 22.1 9.3 13.4 21.8 1.1 2.7 4.5 11.6
Impact of Venezuelan bolivar devaluation from balance sheet positions 4.2 42.4 14.9 0.2 3.6 -- 3.8
Acquired intangible asset amortization 3.9 2.9 2.1 4.8 11.9 10.2 2.0 2.0 1.9 7.7
Swap impairment and debt cost write-off 19.8
Purchase accounting intangibles and goodwill impairment 4.3 36.1 76.9
Income tax impact of adjustments (3.3) (9.6) (4.8) (3.5) (4.8) 1.5 (0.7) (1.2) 7.0 (3.9)
Net Income (Adjusted) $237.9 $273.3 $281.4 $288.3 $274.6 $220.5 $45.9 $58.7 $41.4 $220.8
Pre –tax Adjusted ROS 13.9% 13.9% 14.1% 14.1% 13.9 % 12.8% 11.7% 13.7% 10.5% 13.1%
Average number of diluted shares (millions) 61.4 61.4 56.4 53.1 51.0 50.4 50.6 50.7 50.7 50.7
31
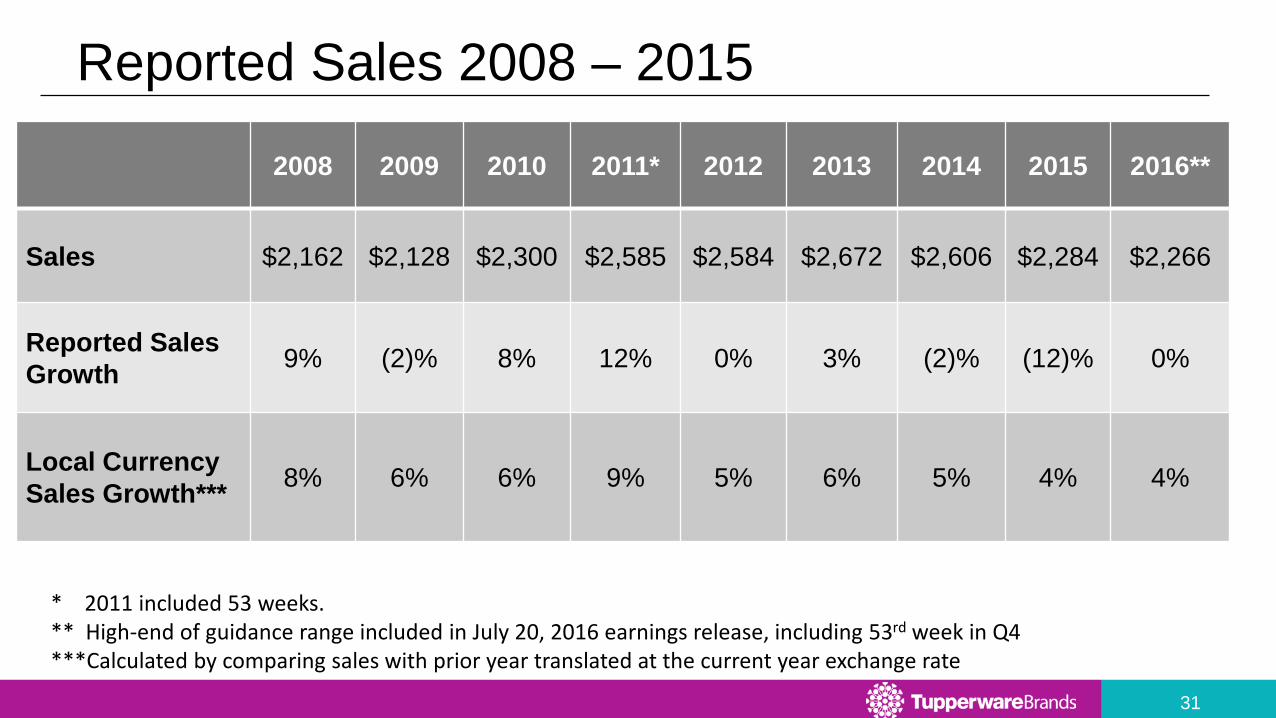
Reported Sales 2008 – 2015
2008 2009 2010 2011* 2012 2013 2014 2015 2016**
Sales $2,162 $2,128 $2,300 $2,585 $2,584 $2,672 $2,606 $2,284 $2,266
Reported Sales Growth 9% (2)% 8% 12% 0% 3% (2)% (12)% 0%
Local Currency Sales Growth*** 8% 6% 6% 9% 5% 6% 5% 4% 4%
* 2011 included 53 weeks. ** High-end of guidance range included in July 20, 2016 earnings release, including 53rd week in Q4 ***Calculated by comparing sales with prior year translated at the current year exchange rate

32
*Guidance provided in July 20, 2016 Earnings Release. Includes Q3 land transaction projected to generate $28 million in proceeds and EPS of 27 cents. ** GAAP to non-GAAP reconciliation on slide 28
Outlook* Third Quarter
2016 Guidance 2016 Full Year
Guidance USD Sales +1% – 3% (2)% – (1)%
GAAP EPS $0.94 – $0.99 $4.18 – $4.28
GAAP Pre-tax ROS 13.1% – 13.5% 12.9% – 13.1%
Local Currency Sales +2% – 4% +3% – 4%
EPS, excluding items** $0.77 – $0.82 $4.25 – $4.35
Pre-tax ROS, excluding items 10.0% – 10.5% 12.9% – 13.1%
FX Impact on EPS comparison, excluding items ($0.02) ($0.34)

33
* High end of guidance range provided in July 20, 2016 Earnings Release. **GAAP to non-GAAP reconciliation on slide 28
Return on Sales Guidance* 2016
Third Quarter High End Guidance
2016 Full Year
High End Guidance
2015 Pretax ROS 10.2% 12.8%
Translation FX -- (40) bp
2015 Pretax ROS (constant currency) 10.2% 12.4%
LC Operating Margin Improvement 40 bp 60 bp
Net Interest Expense (10) 10
2016 Pretax ROS (high end guidance)** 10.5% 13.1%

34
$4.37 ($0.34)
($0.04) ($0.03)
$0.35 $0.04 $4.35
$3.50
$4.00
$4.50
2015 FX 2015 at 2016Rates
Tax Shares Ops Unallocated 2016
2 cent decrease in Reported $
8% increase in Local Currency**
$4.03
Full Year 2016 EPS Outlook* (diluted)
*Excluding items. See Non-GAAP reconciliation on slide 28. ** High end of guidance range provided in July 20, 2016 Earnings Release.

Mike Poteshman Executive VP & CFO
September 2016