miif study report - aacounty.org
TRANSCRIPT

6-1 April 2016
TA
MIIF Study Report
FINAL - June 2016
Major Intersections/Important Facilities (MIIF) Study
Final Report

This page was intentionally left blank

Table of Contents
i
Table of Contents
Section Page #
Acknowledgements .................................................................................................................... viii
Preface ........................................................................................................................................ ix
1. Executive Summary .......................................................................................................... 1
1.1 Overview .................................................................................................................................... 1
1.1.1 Purpose and Scope .................................................................................................................... 2
1.1.2 Project Costs .............................................................................................................................. 2
1.1.3 Alternatives Tested .................................................................................................................... 3
1.1.4 Priorities ..................................................................................................................................... 5
1.1.5 Next Steps .................................................................................................................................. 6
1.2 Corridor Analysis ........................................................................................................................ 6
1.2.1 College Parkway ......................................................................................................................... 6
1.2.2 Forest Drive ................................................................................................................................ 8
1.2.3 MD 173 (Fort Smallwood Road) ............................................................................................... 10
1.2.4 MD 177 (Mountain Road) ........................................................................................................ 11
1.2.5 MD 214 (Central Avenue) ........................................................................................................ 14
1.2.6 MD 256 (Deale Road) & MD 468 (Shady Side Road) ................................................................ 16
1.2.7 MD 665 (Aris T. Allen Boulevard) ............................................................................................. 17
2. Introduction .................................................................................................................. 18
2.1 Introduction ............................................................................................................................. 18
2.2 Purpose and Need .................................................................................................................... 19
2.3 Transit Mode Investigation ...................................................................................................... 20
2.4 Alternative Screening/Measures of Effectiveness/Prioritization ............................................ 20
2.5 Stakeholder and Public Outreach ............................................................................................ 21
3. Existing Conditions Documentation ................................................................................ 22
3.1 Introduction ............................................................................................................................. 22
3.2 Existing Traffic Volumes ........................................................................................................... 22
3.2.1 College Parkway ....................................................................................................................... 24
3.2.2 Forest Drive .............................................................................................................................. 24
3.2.3 MD 173 ..................................................................................................................................... 24
3.2.4 MD 177 ..................................................................................................................................... 24
3.2.5 MD 214 ..................................................................................................................................... 25
3.2.6 MD 256 & MD 468 ................................................................................................................... 25
3.2.7 MD 665 ..................................................................................................................................... 26

Table of Contents
ii
3.3 Existing Level of Service ........................................................................................................... 27
3.4 Previous Studies ....................................................................................................................... 30
4. Travel Forecasting .......................................................................................................... 31
4.1 Introduction ............................................................................................................................. 31
4.2 Model Validation ...................................................................................................................... 31
4.2.1 College Parkway ....................................................................................................................... 32
4.2.2 Forest Drive .............................................................................................................................. 32
4.2.3 MD 173 ..................................................................................................................................... 32
4.2.4 MD 177 ..................................................................................................................................... 32
4.2.5 MD 214 ..................................................................................................................................... 33
4.2.6 MD 256 & MD 468 ................................................................................................................... 33
4.2.7 MD 665 ..................................................................................................................................... 33
4.3 Mode Investigation, Land Use, and Transit Node Identification ............................................. 33
4.3.1 College Parkway ....................................................................................................................... 36
4.3.2 Forest Drive .............................................................................................................................. 37
4.3.3 MD 173 ..................................................................................................................................... 38
4.3.4 MD 177 ..................................................................................................................................... 38
4.3.5 MD 214 ..................................................................................................................................... 39
4.3.6 MD 256 & MD 468 ................................................................................................................... 39
4.3.7 MD 665 ..................................................................................................................................... 40
4.4 Relationship to Land Use ......................................................................................................... 40
4.5 Travel Forecasts and Level of Service ...................................................................................... 41
4.5.1 CLRP Plan Scenario ................................................................................................................... 41
4.6 Build Scenario .......................................................................................................................... 43
4.7 Summary of Forecasts .............................................................................................................. 43
4.7.1 College Parkway ....................................................................................................................... 43
4.7.2 Forest Drive .............................................................................................................................. 43
4.7.3 MD 173 ..................................................................................................................................... 43
4.7.4 MD 177 ..................................................................................................................................... 43
4.7.5 MD 214 ..................................................................................................................................... 44
4.7.6 MD 256 & MD 468 ................................................................................................................... 44
4.7.7 MD 665 ..................................................................................................................................... 44
4.8 Summary of No Build and Build Level of Service ..................................................................... 44
5. Corridor Toolbox Strategies ............................................................................................ 49
5.1 Toolbox Strategies ................................................................................................................... 49
5.1.1 System Management Strategies .............................................................................................. 49
5.1.1.1 Signal System Operations ........................................................................................................ 49

Table of Contents
iii
5.1.1.2 Traveler Information and Intelligent Transportation Systems ................................................ 50
5.1.1.3 Event Traffic Management ...................................................................................................... 50
5.1.1.4 Demand Management Strategies ............................................................................................ 50
5.1.1.5 Bus Rapid Transit ..................................................................................................................... 51
5.1.2 Paratransit ................................................................................................................................ 51
5.1.3 Promote Transit Use/Transit Priority ....................................................................................... 51
5.1.4 Promote Carpooling ................................................................................................................. 52
5.1.5 Employer Based Incentives ...................................................................................................... 52
5.1.6 Alternative Work Schedule Arrangement ................................................................................ 53
5.1.7 Pedestrian and Bicycle Enhancements .................................................................................... 53
5.1.8 Traffic Calming ......................................................................................................................... 54
5.1.9 Complete Streets ..................................................................................................................... 54
5.1.10 Access Management ................................................................................................................ 54
5.1.11 Time-of-Day Controls/Active Traffic Management.................................................................. 55
5.1.12 Reversible Lanes....................................................................................................................... 55
5.2 Corridor Applications ............................................................................................................... 57
5.2.1 College Parkway ....................................................................................................................... 57
5.2.2 Forest Drive .............................................................................................................................. 58
5.2.3 MD 173 ..................................................................................................................................... 59
5.2.4 MD 177 ..................................................................................................................................... 60
5.2.5 MD 214 ..................................................................................................................................... 61
5.2.6 MD 256 & MD 468 ................................................................................................................... 62
5.2.7 MD 665 ..................................................................................................................................... 63
6. Corridor Footprint Assessment ....................................................................................... 64
6.1 Recommended Cross Sections ................................................................................................. 64
6.2 Impact Assessment .................................................................................................................. 64
6.3 Right-of-Way Considerations ................................................................................................... 64
6.3.1 College Parkway ....................................................................................................................... 64
6.3.2 Forest Drive .............................................................................................................................. 65
6.3.3 MD 173 ..................................................................................................................................... 66
6.3.4 MD 177 ..................................................................................................................................... 66
6.3.5 MD 214 ..................................................................................................................................... 67
6.3.6 MD 256 & MD 468 ................................................................................................................... 68
6.3.7 MD 665 ..................................................................................................................................... 69
6.4 Environmental Features ........................................................................................................... 69
6.4.1 College Parkway ....................................................................................................................... 69
6.4.2 MD 177 ..................................................................................................................................... 70

Table of Contents
iv
6.4.3 MD 214 ..................................................................................................................................... 70
6.4.4 MD 256 & MD 468 ................................................................................................................... 70
7. Cost Assessment ............................................................................................................ 71
7.1 Roadway Improvements .......................................................................................................... 71
7.2 Summary .................................................................................................................................. 71
8. Summary and Recommendations ................................................................................... 72
8.1 Summary and Recommendations ............................................................................................ 72
8.2 Primary Screening Criteria ....................................................................................................... 72
8.2.1 College Parkway ....................................................................................................................... 73
8.2.2 Forest Drive .............................................................................................................................. 73
8.2.3 MD 173 ..................................................................................................................................... 74
8.2.4 MD 177 ..................................................................................................................................... 74
8.2.5 MD 214 ..................................................................................................................................... 74
8.2.6 MD 256 & MD 468 ................................................................................................................... 74
8.3 Study Recommendation........................................................................................................... 74
8.3.1 College Parkway ....................................................................................................................... 74
8.3.2 Forest Drive .............................................................................................................................. 75
8.3.3 MD 173 ..................................................................................................................................... 77
8.3.4 MD 177 ..................................................................................................................................... 78
8.3.5 MD 214 ..................................................................................................................................... 79
8.3.6 MD 256 & MD 268 ................................................................................................................... 80
8.3.7 MD 665 ..................................................................................................................................... 80
8.3.8 Corridor Prioritization .............................................................................................................. 81
8.4 Next Steps and Implementation .............................................................................................. 82
8.4.1 Coordination with Further County Planning Efforts ................................................................ 82
8.4.2 Partnering and Funding ........................................................................................................... 83
Table of Contents
v
List of Tables
Section Page #
Table 1: Project Costs ....................................................................................................................... 5
Table 2: Recommendations for College Parkway ............................................................................... 7
Table 3: Recommendations for Forest Drive ...................................................................................... 8
Table 4: Recommendations for MD 173 ........................................................................................... 10
Table 5: Recommendations for MD 177 ........................................................................................... 11
Table 6: Recommendations for MD 214 ........................................................................................... 14
Table 7: Recommendations for MD 256 & MD 468 .......................................................................... 16
Table 8: Recommendations for MD 665 ........................................................................................... 17
Table 9: College Parkway Existing LOS ............................................................................................. 28
Table 10: Forest Drive Existing LOS................................................................................................... 28
Table 11: MD 173 Existing LOS ........................................................................................................ 28
Table 12: MD 177 Existing LOS ........................................................................................................ 29
Table 13: MD 214 Existing LOS ........................................................................................................ 29
Table 14: MD 256 & MD 468 Existing LOS ........................................................................................ 30
Table 15: Master List of Transportation and Land Use Reports Reviewed ......................................... 30
Table 16: Minimum Density Requirements for Transit Service ......................................................... 34
Table 17: Maryland Transit Guideline Minimum Density Levels for Activity Centers ......................... 34
Table 18: College Parkway Mode Investigation ................................................................................ 37
Table 19: Forest Drive Mode Investigation ...................................................................................... 38
Table 20: MD 173 Mode Investigation ............................................................................................. 38
Table 21: MD 177 Mode Investigation ............................................................................................. 39
Table 22: MD 214 Mode Investigation ............................................................................................. 39
Table 23: MD 256 & MD 468 Mode Investigation ............................................................................. 40
Table 24: MD 665 Mode Investigation ............................................................................................. 40
Table 25: College Parkway Corridor Toolbox .................................................................................... 57
Table 26: Forest Drive Corridor Toolbox .......................................................................................... 58
Table 27: MD 173 Corridor Toolbox ................................................................................................. 59
Table 28: Total Plan Costs ............................................................................................................... 60
Table 29: MD 214 Corridor Toolbox ................................................................................................. 61
Table 30: MD 256 & MD 468 Corridor Toolbox ................................................................................. 62
Table 31: MD 665 Corridor Toolbox ................................................................................................. 63
Table 32: Total Plan Costs ............................................................................................................... 71
Table 33: College Parkway Plan Recommendation ........................................................................... 75

Table of Contents
vi
Table 34: Forest Drive Plan Recommendation ................................................................................. 77
Table 35: MD 665 Plan Recommendation ........................................................................................ 78
Table 36: MD 177 Plan Recommendation ........................................................................................ 79
Table 37: MD 214 Plan Recommendation ........................................................................................ 80
Table 38: MD 256 & MD 468 Plan Recommendation ........................................................................ 80
Table 39: MD 665 Plan Recommendation ........................................................................................ 81
List of Figures
Section Page #
Figure 1: CGMP Preferred Transit Network ............................................................................... Preface
Figure 2: Corridor Key Map ............................................................................................................... 4
Figure 3: College Parkway Proposed Roadway Cross Section .............................................................. 7
Figure 4: Forest Drive Proposed Roadway Cross Sections .............................................................. 9-10
Figure 5: MD 177 Proposed Roadway Cross Sections .................................................................. 12-13
Figure 6: MD 214 Proposed Roadway Cross Sections ....................................................................... 15
Figure 7: MD 256 & MD 468 Proposed Typical Cross Section ............................................................ 16
Figure 8: MD 665 Proposed Typical Cross Section with Multi-Use Path ............................................. 17
Figure 9: Corridor Key Map ............................................................................................................. 23
Figure 10: CLRP Network ................................................................................................................. 42
Figure 11: College Parkway 2035 AADT and LOS .............................................................................. 45
Figure 12: College Parkway 2035 AADT and LOS with Roadway Widening ........................................ 45
Figure 13: Forest Drive 2035 AADT and LOS ..................................................................................... 45
Figure 14: MD 173 2035 AADT and LOS ........................................................................................... 46
Figure 15: MD 177 2035 AADT and LOS ........................................................................................... 46
Figure 16: MD 177 2035 AADT and LOS with Roadway Widening ..................................................... 47
Figure 17: MD 214 2035 AADT and LOS ........................................................................................... 47
Figure 18: MD 256 & MD 468 2035 AADT and LOS ........................................................................... 48
Figure 19: MD 665 2035 AADT and LOS ........................................................................................... 48
Figure 20: Forest Drive Right-of-Way Impacts .................................................................................. 65
Figure 21: MD 177 Right-of-Way Impacts Four Lane ......................................................................... 66
Figure 22: MD 177 Right-of-Way Impacts Three Lane ....................................................................... 67
Figure 23: Proposed MD 214 Right-of-Way Impacts Two Lane .......................................................... 68
Figure 24: MD 256 & MD 468 Right-of-Way Impacts ........................................................................ 69

Table of Contents
vii
Appendices
Appendix A – Validation Report (TM 1)
Appendix B – Existing Conditions Analysis (TM 2)
Appendix C – Modal Assessment Report (TM 3-4)
Appendix D – Revised Travel Demand Assessment by Corridor (TM 4.1)
Appendix E – Corridor Footprint Assessment (TM 5)
Appendix F – Corridor Toolbox (TM 6)
Appendix G – Socioeconomic Inputs Used for Model Validation (Zone Level, Year 2005)
Appendix H – Existing Transit Services
Appendix I – Existing Traffic Counts
Appendix J – Transportation Analysis Zone (TAZ) Maps
Appendix K – Zone-Level Land Use Assumptions (2035 Base)
Appendix L – Traffic Analysis Outputs
Appendix M– TDM and TSM Info Primer
Appendix N– Transit Primer
Appendix O – Summary of Previous Transportation and Land Use Plans
Appendix P – College Parkway Corridor Plan Sheets
Appendix Q – Forest Drive Corridor Plan Sheets
Appendix R – MD 177 Corridor Plan Sheets
Appendix S – MD 214 Corridor Plan Sheets
Appendix T – Glossary of Terms/List of Acronyms
Appendix U – Public Comments and PMT Meeting Minutes

Major Intersections/Important Facilities Study
viii
ACKNOWLEDGEMENTS
I would like to extend my personal gratitude to the following Team Members who spent many hours
beyond their normal day-to-day duties in developing a much-needed report describing the basis
and rationale for the County’s Major Intersections/Important Facilities Study:
Anne Arundel County Office of Planning and Zoning:
Brian Ulrich, Project Manager/Planning Administrator
Martha Arzu-McIntosh, Assistant Project Manager
Lynn Miller, Assistant Planning Administrator
Jon Mayer, Planner, Transportation
David Braun, Engineering Manager, Development Division
Tanya Bishop, Secretary, Transportation
Project Management Team:
Eric Sideras, Maryland State Highway Administration (MSHA) (DSED)
Jim Schroll, Anne Arundel County Department of Public Works
Daniel Anderson, Anne Arundel County Department of Public Works
Kevin Quinn, Maryland Transit Administration
Erich Florence, MSHA
Kim Tran, MSHA
Tara Penders, MSHA
Kwaku Agyemang-Duah, City of Annapolis
Todd Lang, Baltimore Metropolitan Council Consultants:
Paul Gilliam, PE, PTOE of Vision Engineering and Planning, LLC
Joe Ojeda of Vision Engineering and Planning, LLC
Eugene Bandy of Vision Engineering and Planning, LLC
Michael Perrotta, PE, AICP of Century Engineering, Inc.
Jenna Cooley of Century Engineering, Inc.
Dustin Kuzman, P.E. of Tindale Oliver
Elisabeth Schuck, AICP of Tindale Oliver
For all team staff who contributed their expertise to this project, I extend my personal thanks.
Brian Ulrich, AICP, Planning Administrator
Transportation Division, Office of Planning & Zoning, Anne Arundel County

Major Intersections/Important Facilities Study Preface
ix
PREFACE
The Major Intersections/Important Facilities Study (MIIF) is the final component of the County
Transportation Plan and emphasized seven key corridors that connect the peninsula areas of Anne
Arundel County to the rest of the county and the Baltimore/Washington region. These corridors serve
as either the primary access or only access to these areas, which was the impetus for this study. While
future development is generally minimized in the seven study corridors, the fact that several of the
study corridors are near and/or over capacity required a comprehensive planning approach that
evaluated multiple modes of transportation options in the corridors.
A key finding of the MIIF Study is that there are a number of operational, intersection, transit,
pedestrian, and bicycle improvements that can be implemented to improve traffic operations and
multi-modal connectivity along the study corridors. No travel network improvements are proposed
in the Baltimore Region Constrained Long Range Plan (CLRP) for any of the study corridors, however
two highway capacity improvements on College Parkway and MD 177 are appropriate and necessary
in the future based on 2035 forecasts.
Using the regional travel forecasting modeling process and Highway Capacity Manual (HCM)
capacity analysis procedures, the study evaluated a range of travel modes and transportation
systems management (TSM) strategies. Consistent with the Corridor Growth Management Plan
(CGMP), the study indicates that premium transit service between Annapolis and Washington D.C (i.e
Express Bus or Commuter Rail) could be an applicable transit strategy to several of the study
corridors and warrants further evaluation.
Figure 1: CGMP Preferred Transit Network
With regards to commuter rail, it is important to note the major differences between commuter rail
and heavy/light rail transit systems which were eliminated from consideration with the possible

Major Intersections/Important Facilities Study Preface
x
exception of the Parole/Annapolis Towne Center area. While light and heavy rail are most applicable
in large, dense urban environments such as Washington, DC, Chicago, and Philadelphia, commuter rail
is designed to carry commuters from suburban areas to large urban central business districts. This is
the case for existing MARC and VRE commuter rail service to downtown Washington D.C. These lines
service corridors similar to the Annapolis to Washington corridor and are operating near or at capacity
based on the high peak period demands in these corridors. Additional factors to be considered with
regards to providing commuter rail service include the high costs of parking in downtown
Washington, congested highway travel times between Annapolis and downtown Washington, and
existing and proposed land use densities in Prince George’s County where existing heavy rail service is
near capacity. These variables all directly impact transit ridership demand for commuter rail. Given
the proximity of Annapolis to Washington D.C., and the factors cited above, commuter rail service
should be evaluated further in the future through a detailed alternatives analysis and travel
forecasting process, particularly given that traffic is forecast to continually increase on US 50. Local
Bus service would be feasible in several of the study corridors based on household density analysis.
The College Parkway and MD 177 corridors show particular promise for this type of transit
improvement.
As referenced previously, the MIIF Study is the final component of a larger ongoing project to prepare
the County’s Transportation Functional Master Plan (TFMP) as recommended in the adopted General
Development Plan (2009). As stated, the MIIF Study analyzes opportunities to improve travel in the
County’s major peninsula corridors. Other components will incorporate enhanced pedestrian and
bicycle travel; identify potential regulatory changes that may facilitate efficient use of rights of
way for all travel modes; evaluate and develop opportunities to improve travel along the County’s
major highways; identify key relationships between land use patterns and transportation facilities;
and recommend intergovernmental coordination strategies.

Major Intersections/Important Facilities Study Executive Summary
1 June 2016
CHAPTER 1: EXECUTIVE SUMMARY
1.1 OVERVIEW
The Major Intersection/Important Facilities Study is the final component of the response to the 2009
General Development Plan which observed that growth in employment and households is projected
to continue over the next 20 years in Anne Arundel County, which will create additional travel
demand while the ability to add roadway capacity is limited. As the County continues to experience
growth in population and employment, it faces
both challenges to mobility and quality of life
that are associated with that growth. Some of
the study corridors are located in lower
density and/or rural locations of the county
where preserving the rural character is a
primary motivation for many of its residents.
This reinforces the need for context-sensitive
transportation solutions that minimize the
impacts to the natural environment while
maintaining the same traffic level of service.
The objective of this report is to develop
transportation solutions for viable alternative
modes of travel, with concept-level impacts
and costs. The goal of these recommendations is to enhance mobility, safety, and accessibility for all
travel modes in order to preserve the economic vitality and quality of life within the peninsula areas
of the County. A map of these corridors is shown on the next page. A glossary of terms and listing of
acronyms is provided in Appendix T.
This report presents specific recommendations for mobility improvements based on increases in
travel demand by the year 2035 in seven key corridors throughout the County:
1. College Parkway: MD 2 to MD 179 – 4.8 miles
2. Forest Drive: Chinquapin Round Road to Bay Ridge Avenue – 2.3 miles
3. MD 173 (Fort Smallwood Road): MD 607 to Bayside Beach Road – 1.7 miles
4. MD 177 (Mountain Road): MD 2 to Lake Shore Drive – 7.8 miles
5. MD 214 (Central Avenue): MD 424 to Shoreham Beach Road – 7.5 miles
6. MD 256 (Deale Road) & MD 468 (Shady Side Road): MD 2 to Snug Harbor Road – 8.1 miles
7. MD 665 (Aris T. Allen Boulevard): US 50 to Chinquapin Round Road – 2.7 miles
These seven corridors represent the busiest roadways in the peninsula areas of the County, and
serve as either the primary route or only route into these areas. Several of the study corridors have
traffic volumes that lead to recurring rush hour congestion. Improving access is critical to these
communities, particularly for emergency response units and during evacuation events.
Designing within existing constraints is a key
aspect of context sensitive design

Major Intersections/Important Facilities Study Executive Summary
2 June 2016
1.1.1 Purpose and Scope
This document and the proposed recommendations will assist County and State planners, land
developers, and decision-makers regarding future investments and priorities for improvements in
highway, intersection, transit and non-motorized facilities. The recommendations have been
carefully analyzed and vetted through the use of advanced travel forecasting and traffic analysis
software models and extensive coordination with local, state, and regional transportation planners.
The recommendations focus on intersection improvements which reduce corridor delays while
minimizing the right-of-way and environmental impacts, and the need to provide for additional
choices within each corridor other than travel by private automobile on the primary routes. These
choices also include implementing the County’s Complete Streets policy to improve the parallel
connections in these study corridors and add redundancy to the transportation system. As
appropriate alternative modes of travel such as carpool, rail, bus, cycling, and walking were
identified in each corridor, the feasibility of each mode was evaluated. The selected
recommendations represent “smart" transportation improvements that aim to:
provide parallel connections in peninsula areas of county,
reduce vehicle delays along each corridor,
enhance travel choices,
improve regional mobility,
improve access to peninsula areas of counties,
improve emergency vehicle access,
improve safety for vehicles, bicyclists, and pedestrians, and
support County land use plans while maintaining the character of the corridor.
For each corridor, the recommendations for roadway, transit, bicycle/pedestrian facilities, and land
use, along with toolbox strategies to provide enhanced management of day-to-day roadway/traffic
operations, as well as travel demand are presented in Figure 2. Capital costs for all improvements
are also presented.
1.1.2 Project Costs
Planning level construction cost estimates were developed for all roadway, bicycle, and pedestrian
improvements, based on costing guidance provided by the Maryland State Highway Administration
(MSHA). The raw roadway costs include construction costs such as pavement widening, intersection
upgrades, structure upgrades, environmental mitigation, traffic control, and design fees, but do not
include the costs of purchases of land for additional rights-of-way. The total estimated construction
cost to implement this plan on the seven corridors is $130.5 million. These costs exclude the costs for
constructing the Mountain Road Corridor Study improvements from MD 648 (Waterford Rd) to Edwin
Raynor Road (estimated at over $34 million), as these improvements are currently funded in the FY
17-22 County CIP. See Table 1.

Major Intersections/Important Facilities Study Executive Summary
3 June 2016
1.1.3 Alternatives Tested
Throughout the study, two alternatives were developed and tested for all corridors, including:
1. A No Build Alternative- Only constructing roadways that are currently funded for
construction, with no transit or bike/pedestrian improvements.
2. A Build Alternative- Constructing roadway and intersection improvements along each of the
study corridors along with transit improvements and bike/pedestrian improvements.
Based on the results of the future conditions analysis, the final and preferred alternative developed,
tested, and recommended for each study corridor focused on bicycle, pedestrian, and intersection
improvements with an emphasis on Transportation System Management (TSM) strategies which can
be implemented with minimal cost and right-of-way impacts.

4 June 2016
Major Intersections/Important Facilities Study Executive Summary
Figure 2: Corridor Key Map

5 June 2016
Major Intersections/Important Facilities Study Executive Summary
Table 1: Project Costs
Corridor
Roadway Cost
College Parkway $38,200,000 Forest Drive $36,700,000
MD 173 $300,000 MD 177 $21,700,000* MD 214 $26,700,000
MD 256/468 $6,900,000 MD 665 $0
GRAND TOTAL $130,500,000 *Excludes the costs from Mountain Road Corridor Study
1.1.4 Priorities
Based on a combination of projected benefits in travel time reliability, level of service improvement,
introduction of travel choices, and construction impacts and feasibility, the projects were prioritized
as near-term (projects that can be implemented with minimal design and construction), mid-term
(projects that can be feasibly constructed within a 5-10 year timeframe), and long-term (corresponds
with projects that need substantial construction funding and coordination with MSHA and/or BMC
and would likely be implemented as a part of the long range planning process). The study
recommendations are prioritized below.
Near-Term
MD 173 bike lanes
MD 256 & MD 468 bike lanes
MD 256 sidewalks
Mid-Term
MD 177 widening including bike lanes and sidewalks
MD 214 bike lanes
MD 214 sidewalks
College Parkway at MD 2 intersection improvement
College Parkway at MD 179 intersection improvement
Long-Term
College Parkway widening
College Parkway bike lane/sidewalks (incorporate in widening project)
Forest Drive bike lanes/sidewalks (incorporate in future reconstruction)

6 June 2016
Major Intersections/Important Facilities Study Executive Summary
1.1.5 Next Steps
This document is a stand-alone report that is intended to justify advancing each of these corridors
into either final design/construction of Near-Term improvements or into a detailed project planning
and preliminary engineering process, including identifying and securing funding commitments in
partnership with appropriate State, Federal and private partners. This document builds on elements
of the General Development Plan (2009); GDP Background Report on Transportation (2008), The
Corridor Growth Management Plan (2012), the Anne Arundel County Pedestrian and Bicycle
Master Plan (2012), and Complete Streets Guidelines (2014). This report will serve as the final
component of the Countywide Transportation Master Plan Document and will be used to develop
priorities for that document.
1.2 Corridor Analysis
A corridor Level of Service (LOS) analysis was conducted using the AATrvM travel demand model. The AATRvM travel demand model results were compared to existing and forecast roadway capacity which was used to determine the LOS at the highway link level. 1.2.1 College Parkway
College Parkway is projected to carry up to 36,000 vehicles per day in the year 2035 west of Jones Station Road and almost 22,000 vehicles per day east of Jones Station Road, which is over the daily capacity of 20,000 for a two lane arterial. College Parkway provides service to Anne Arundel Community College and is often used as a bypass route for traffic destined to the Chesapeake Bay Bridge. The roadway currently experiences some congestion at the intersections of MD 2 and MD 179, and the segment from west of Jones Station Road (where existing four lane highway tapers to two lanes) to MD 179 is projected to deteriorate to a Level of Service (LOS) F in the year 2035. The recommendations for College Parkway include roadway widening improvements, intersection improvements, and bicycle and pedestrian improvements. See Table 2.

7 June 2016
Major Intersections/Important Facilities Study Executive Summary
Table 2: Recommendations for College Parkway
Mode/Strategy Description
Roadway
Widen from 2 to 4 lanes from west of Jones Station Road to MD 179 Add additional southbound left turn lane on MD 2 at College Parkway intersection
Add additional eastbound left turn lane on College Parkway at MD 179 intersection
Transit Evaluate the extension of Annapolis Transit Gold Line service in future
Bicycle and Pedestrian
Extend Broadneck Trail to Baltimore/Annapolis Trail Add Bicycle Lanes on College Parkway Connect missing sidewalk gaps on College Parkway
Land Use Future development should occur in New Urbanism fashion with
complete streets network, no cul-de sacs
Toolbox Elements
Signal System coordination and optimization Special Event/evacuation signal timing plan
Anne Arundel Community College sponsored vanpool Pedestrian and Bicycle connections Complete Streets/development of parallel connections
The provision of an additional lane in each direction on College Parkway reduces the forecast
volume to capacity ratio from 1.10 to 0.57. Typical roadway cross-sections of this alternative are
illustrated in Figure 3.
Figure 3: College Parkway Proposed Roadway Cross Section

8 June 2016
Major Intersections/Important Facilities Study Executive Summary
1.2.2 Forest Drive
Forest Drive is projected to carry up to 40,000 vehicles per day east of Spa Road and over 60,000
vehicles per day between Hilltop Lane and Chinquapin Round Road in 2035. It provides an important
connection from a number of peninsula areas of the County to MD 665, US 50, and the rest of the
Baltimore/Washington region. This roadway experiences congestion between Chinquapin Round
Road and Hilltop Lane, as a number of shopping centers are located on the south side of Forest Drive
east of Chinquapin Round Road. This leads to large numbers of turning vehicles, effectively reducing
the capacity of this roadway segment, which lead to significant delays in the corridor. A previous study
conducted by the City of Annapolis using traffic micro-simulation indicated that the intersection of
Forest Drive and Chinquapin Round Road would experience congested conditions in the future based
on queuing captured in the simulations. The recommendations from the City of Annapolis study
included an additional left turn lane on the southbound approach of Chinquapin Round Road at Forest
Drive which would alleviate the future congestion at this intersection.
Additional recommendations for Forest Drive include improved transit service and amenities, bicycle
lanes on Forest Drive, Access Management on Forest Drive, and connecting sidewalk gaps. See Table 3.
Table 3: Recommendations for Forest Drive
Mode/Strategy Description Roadway No new travel lanes
Transit
Extension of existing MTA commuter bus service from Riva Road
Park & Ride lot to Bay Ridge Avenue
Improve transit amenities including bus shelters, real time bus
information, and improved sidewalk connections
Bicycle and Pedestrian
Add bicycle lanes on Forest Drive including segment from MD 2 to
Chinquapin Round Road
Construct missing sidewalk connections
Land Use
Allow for increased density and transit-oriented development in
Annapolis Towne Center area
Future development should occur in New Urbanism fashion with
complete streets network
Toolbox Elements
Signal System coordination and optimization
Real Time Travel Time Information on Changeable Message Signs
Special Event/evacuation signal timing plan
Annapolis Towne Center shuttle service
Improved Transit service and amenities
Conduct Future Origin-Destination study in study area to
determine framework for carpool/vanpool service
Pedestrian and Bicycle connections
Complete Streets/development of parallel connections
Access Management Plan
Reversible Lanes
9 June 2016
Major Intersections/Important Facilities Study Executive Summary
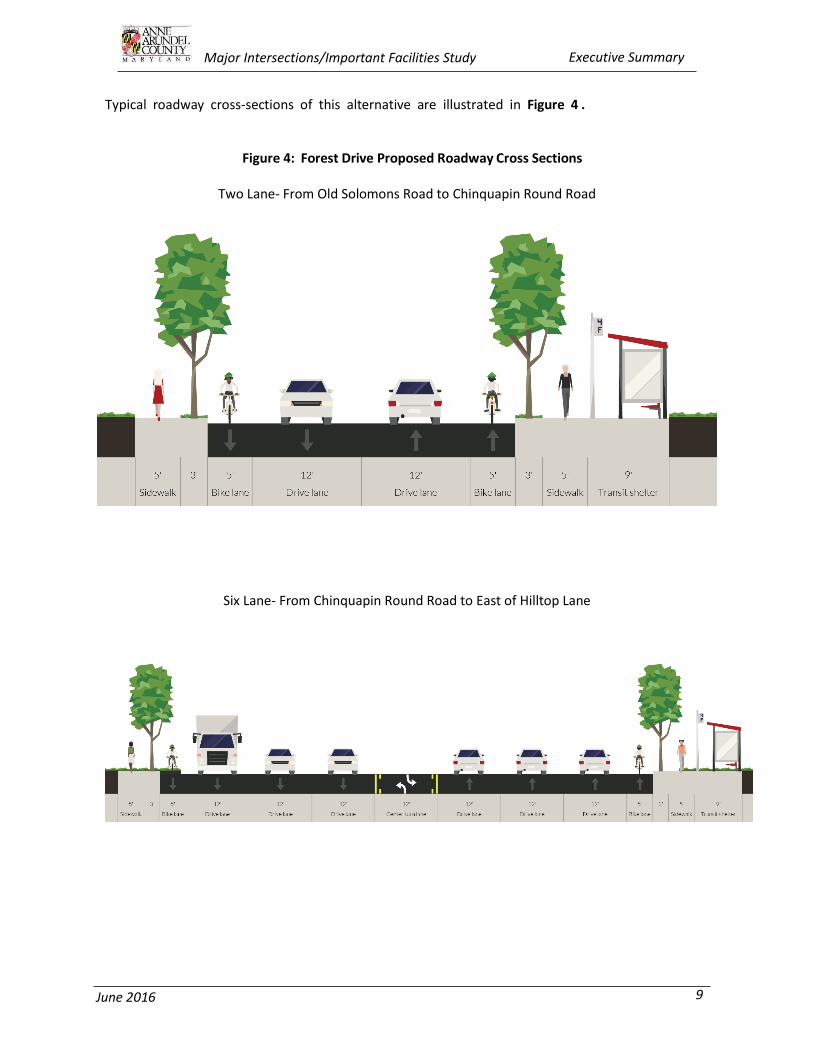
Typical roadway cross-sections of this alternative are illustrated in Figure 4 .
Figure 4: Forest Drive Proposed Roadway Cross Sections
Two Lane- From Old Solomons Road to Chinquapin Round Road
Six Lane- From Chinquapin Round Road to East of Hilltop Lane
10 June 2016
Major Intersections/Important Facilities Study Executive Summary
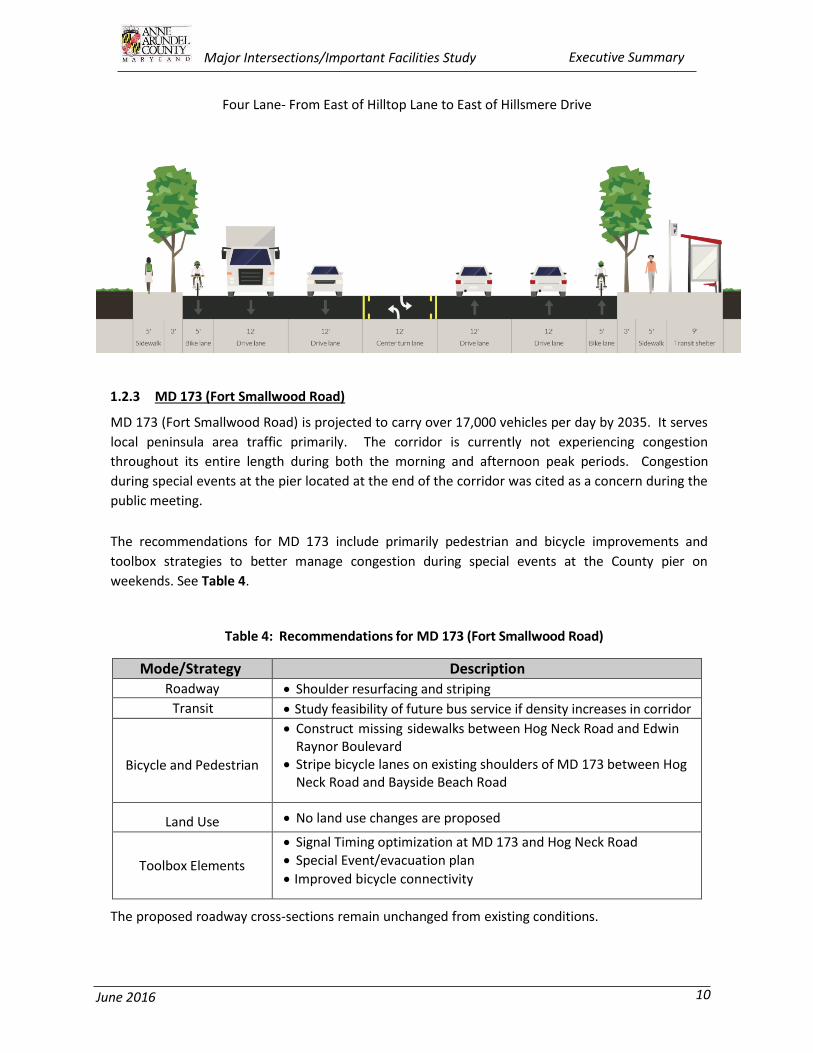
Four Lane- From East of Hilltop Lane to East of Hillsmere Drive
1.2.3 MD 173 (Fort Smallwood Road)
MD 173 (Fort Smallwood Road) is projected to carry over 17,000 vehicles per day by 2035. It serves
local peninsula area traffic primarily. The corridor is currently not experiencing congestion
throughout its entire length during both the morning and afternoon peak periods. Congestion
during special events at the pier located at the end of the corridor was cited as a concern during the
public meeting.
The recommendations for MD 173 include primarily pedestrian and bicycle improvements and
toolbox strategies to better manage congestion during special events at the County pier on
weekends. See Table 4.
Table 4: Recommendations for MD 173 (Fort Smallwood Road)
Mode/Strategy Description Roadway Shoulder resurfacing and striping
Transit Study feasibility of future bus service if density increases in corridor
Bicycle and Pedestrian
Construct missing sidewalks between Hog Neck Road and Edwin Raynor Boulevard
Stripe bicycle lanes on existing shoulders of MD 173 between Hog Neck Road and Bayside Beach Road
Land Use No land use changes are proposed
Toolbox Elements
Signal Timing optimization at MD 173 and Hog Neck Road Special Event/evacuation plan
Improved bicycle connectivity
The proposed roadway cross-sections remain unchanged from existing conditions.
11 June 2016
Major Intersections/Important Facilities Study Executive Summary
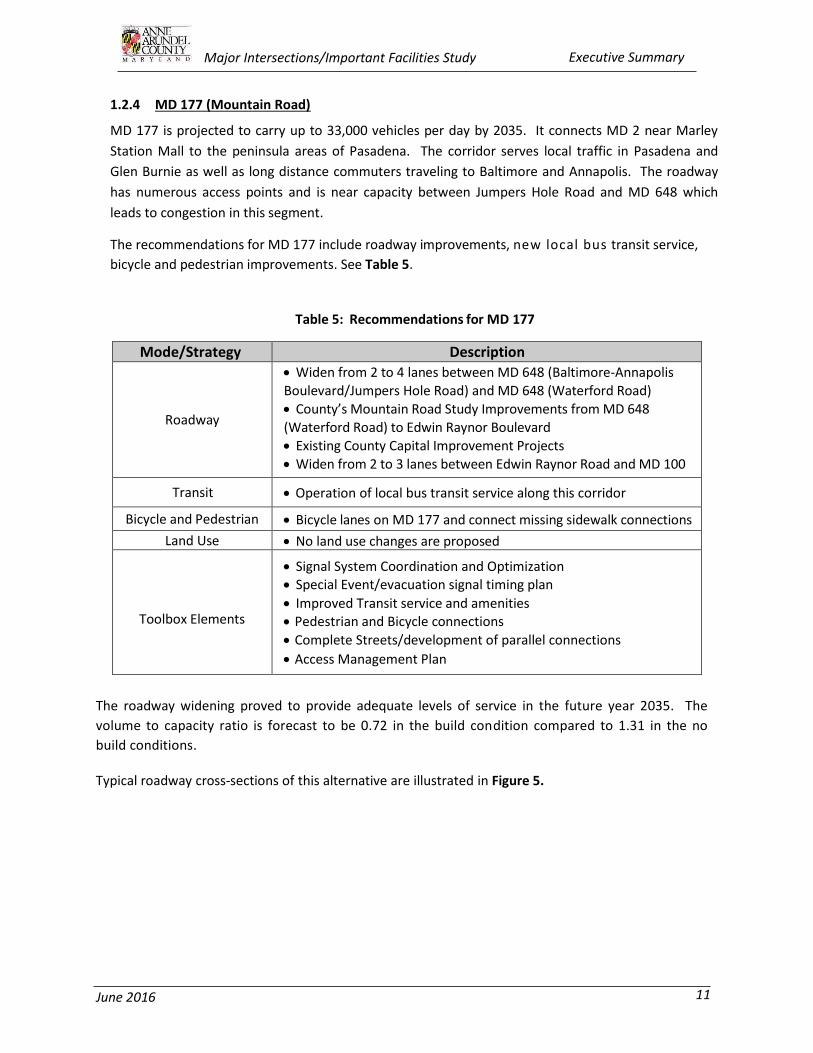
1.2.4 MD 177 (Mountain Road)
MD 177 is projected to carry up to 33,000 vehicles per day by 2035. It connects MD 2 near Marley
Station Mall to the peninsula areas of Pasadena. The corridor serves local traffic in Pasadena and
Glen Burnie as well as long distance commuters traveling to Baltimore and Annapolis. The roadway
has numerous access points and is near capacity between Jumpers Hole Road and MD 648 which
leads to congestion in this segment.
The recommendations for MD 177 include roadway improvements, new local bus transit service,
bicycle and pedestrian improvements. See Table 5.
Table 5: Recommendations for MD 177
Mode/Strategy Description
Roadway
Widen from 2 to 4 lanes between MD 648 (Baltimore-Annapolis
Boulevard/Jumpers Hole Road) and MD 648 (Waterford Road) County’s Mountain Road Study Improvements from MD 648
(Waterford Road) to Edwin Raynor Boulevard Existing County Capital Improvement Projects Widen from 2 to 3 lanes between Edwin Raynor Road and MD 100
Transit Operation of local bus transit service along this corridor
Bicycle and Pedestrian Bicycle lanes on MD 177 and connect missing sidewalk connections
Land Use No land use changes are proposed
Toolbox Elements
Signal System Coordination and Optimization Special Event/evacuation signal timing plan
Improved Transit service and amenities Pedestrian and Bicycle connections
Complete Streets/development of parallel connections
Access Management Plan
The roadway widening proved to provide adequate levels of service in the future year 2035. The
volume to capacity ratio is forecast to be 0.72 in the build condition compared to 1.31 in the no
build conditions.
Typical roadway cross-sections of this alternative are illustrated in Figure 5.

12 June 2016
Major Intersections/Important Facilities Study Executive Summary
Figure 5: MD 177 Proposed Roadway Cross Sections
Four Lane Section; Jumpers Hole Road to MD 648/Waterford Road
Three Lane Section; MD 648/Waterford Road to MD 100
Source: Mountain Road Corridor Study

13 June 2016
Major Intersections/Important Facilities Study Executive Summary
Three Lane- From MD 100 to South Carolina Ave
Two Lane- East of South Carolina Ave

14 June 2016
Major Intersections/Important Facilities Study Executive Summary
1.2.5 MD 214 (Central Avenue)
MD 214 is projected to carry up to 27,000 vehicles per day by 2035. MD 214 provides an essential
link between the Edgewater area to the rest of the County and Washington D.C. It serves local
traffic in Edgewater as well as commuters traveling to job centers in Washington D.C., Fort Meade,
the NSA, and Annapolis. The corridor currently experiences congestion at the intersection of MD
468; however, this section is programmed for a capacity improvement which will mitigate this
congestion in the future.
The recommendations for MD 214 include travel lane extensions east of MD 2, bicycle
improvements throughout most of the corridor and pedestrian improvements in segments. The
intersections of MD 214 at Riva Road and MD 214 at Stepneys Lane are recommended to have a
traffic signal warrant assessment conducted.
Typical roadway cross-sections of this alternative are illustrated in Figure 6.
Table 6: Recommendations for MD 214
Mode/Strategy Description
Roadway Eastbound travel lane extension to MD 468
Transit None
Bicycle and Pedestrian
Bicycle lanes on shoulders from MD 424 to west of Pike Ridge Road and MD 468 to Shoreham Beach Road; bicycle lanes on proposed curb and gutter cross section from west of Pike Ridge Road to MD 468
Sidewalks on proposed cross section from west of Pike Ridge Road
to MD 468
Land Use No land use changes are proposed
Toolbox Elements
Signal System coordination and optimization Special Event/evacuation signal timing plan
Improve Pedestrian and Bicycle compatibility

15 June 2016
Major Intersections/Important Facilities Study Executive Summary
Figure 6: MD 214 Proposed Roadway Cross Sections
Two Lane from MD 424 to Pike Ridge Road
Four Lane from West of MD 2 to MD 468
Two Lane from MD 468 to Shoreham Beach Road

16 June 2016
Major Intersections/Important Facilities Study Executive Summary
1.2.6 MD 256 (Deale Road) & MD 468 (Shady Side Road)
MD 256 & MD 468 are projected to carry up to 13,000 vehicles per day by 2035. This corridor
provides an essential link between the Shady Side and Deale peninsula areas to MD 2. It serves local
traffic in these areas primarily. The corridor currently does not experience peak hour congestion.
The recommendations for MD 256 & MD 468 include a potential roundabout at MD 2 and MD 256,
sidewalks in the central Deale area, and bicycle lanes on the shoulders of MD 256 & MD 468. See
Table 7.
Table 7: Recommendations for MD 256 & MD 468
Mode/Strategy Description
Roadway Potential roundabout at MD 2 and MD 256
Transit None
Bicycle and Pedestrian Bicycles lanes on shoulders and sidewalks in central Deale
Land Use No land use changes are proposed
Toolbox Elements Signal optimization at the intersection of MD 256 and MD 468
Improve bicycle and pedestrian connectivity
Typical roadway cross-sections of this alternative are illustrated in Figure 7.
Figure 7: MD 256 & MD 468 Proposed Typical Cross Section

17 June 2016
Major Intersections/Important Facilities Study Executive Summary
1.2.7 MD 665 (Aris T. Allen Boulevard)
MD 665 is projected to carry over 65,000 vehicles per day by 2035. This corridor provides an
essential link between Forest Drive and US 50/I-97. It serves a combination of local and regional
traffic in these areas including commuters to and from Annapolis, Baltimore, Fort Meade/NSA, and
Washington, DC. The corridor experiences peak hour congestion associated with queuing and
weaving conditions on US 50.
While there were no recommendations developed for MD 665, this corridor is recommended for
detailed study as a part of a larger US 50 corridor study which should be conducted in the future
based on the recommendations from the Corridor Growth Management Plan. See Table 8.
Table 8: Recommendations for MD 665
Mode/Strategy Description Roadway Future Study Recommended
Transit
Potential commuter rail to Washington DC with terminus at
Annapolis Towne Center
Potential bus rapid transit or light rail with Annapolis Towne Center
as the focal point
Bicycle and Pedestrian Potential multi-use path parallel to MD 665
Land Use Increase density in Annapolis Towne Center and adjacent areas to support high-quality transit service
Toolbox Elements
Real Time Travel Time information
Carpools and vanpools sponsored by Annapolis Towne Center employers
Improve pedestrian and bicycle network on parallel routes such as Forest Drive
Typical roadway cross-sections of this alternative are illustrated in Figure 8.
Figure 8: MD 665 Proposed Typical Cross Section with Multi-Use Path

18 June 2016
Major Intersections/Important Facilities Study Introduction
CHAPTER 2: INTRODUCTION
2.1 INTRODUCTION
The Major Intersection/Important Facilities Study is the last response to the 2009 General
Development Plan which observed that growth in employment and households is projected to
continue over the next 20 years. This growth will create additional travel demand while the ability
to add roadway capacity is limited. This report presents the analysis, forecasting, alternatives
development, testing, and recommended improvements to seven corridors that service the peninsula
areas within the County’s transportation network. As the County continues to experience growth in
population and employment, the intersections along the study corridors could become bottlenecks
that limit access to the peninsula areas for local residents, commuters, and emergency responders.
Improving access to these areas of the County requires a comprehensive strategy of intersection
improvements on the primary access routes, limited roadway capacity improvements, complete
streets to develop parallel routes into the peninsula areas, transit, bicycle, and pedestrian
improvements, Transportation System Management (TSM), and Travel Demand Management (TDM).
The objective of this report is to present concept-level transportation solutions with impacts and costs
for seven specific corridors that distribute traffic to the peninsula areas of the County. These
corridors include:
1. College Parkway: MD 2 to MD 179 – 4.8 miles
2. Forest Drive: Chinquapin Round Road to Bay Ridge Avenue – 2.3 miles
3. MD 173 (Fort Smallwood Road): MD 607 to Bayside Beach Road – 1.7 miles
4. MD 177 (Mountain Road): MD 2 to Lake Shore Drive – 7.8 miles
5. MD 214 (Central Avenue): MD 424 to Shoreham Beach Road – 7.5 miles
6. MD 256 (Deale Road) & MD 468 (Shady Side Road): MD 2 to Snug Harbor Road – 8.1 miles
7. MD 665 (Aris T. Allen Boulevard): US 50 to Chinquapin Round Road – 2.7 miles
This report identifies constraints and opportunities for each corridor and recommends
improvements for highway, transit and non-motorized facilities. This document builds on
elements of the recently adopted General Development Plan (2009), GDP Background Report on
Transportation (2008), The Corridor Growth Management Plan (2012), the Anne Arundel County
Pedestrian and Bicycle Master Plan, (2012), and Complete Streets Guidelines (2014). This report
will serve as the final component of the Countywide Transportation Master Plan Document.
The approach in this effort was to address forecasted future recurring congestion through evaluation
of the major intersections along seven key study corridors in the County, evaluating alternatives with
the AATRvM travel demand model using the adopted land use plan and cooperative demographic
forecasts to determine what mixture of recommendations, at an intersection and network level, will
serve to best reduce future travel congestion, at the lowest capital and operating costs while limiting
the impact to the adjacent natural and built environment. It should be noted that the travel
demand modeling approach for this effort was a regional approach with a focus on the county, and
that this approach was built upon the currently adopted Baltimore Metropolitan Council
Transportation Improvement Plan and Constrained Long Range Plan which are the current policies of
the County for future improvements to the transportation network.

19 June 2016
Major Intersections/Important Facilities Study Introduction
The study focused on identifying and analyzing intersection and multi-modal improvements that
would improve safety and mobility for all modes in the study corridors at a reasonable cost and
minimal right-of-way impact. Improvements were developed to improve traffic circulation within the
study corridors and improve their connectivity with the rest of the county and region. This document
and the proposed recommendations will assist County planners, land developers, decision makers,
and budgets regarding future investments and improvements for highway, transit and non-motorized
facilities.
The effort also included a review and revision to the Countywide travel forecasting and travel demand
models, compilation of traffic data, intersection and roadway level of service/capacity analyses,
modeling of future roadway networks, identification of system and demand management strategies,
conceptual footprint assessment including cross-section elements and preliminary costs, and
stakeholder and public outreach.
2.2 PURPOSE AND NEED
The focus of this report is to identify near and mid-term transportation solutions for key
intersections within each study corridor and develop non-motorized transportation options, with
concept-level impacts and costs. The purpose of these recommendations is to enhance mobility and
accessibility for all modes of travel in order to preserve the economic vitality and the quality of life
within the peninsula areas of the County. Anne Arundel County’s transportation planning process is a
comprehensive, coordinated and continuous process that follow’s current federal regulations and
is active at the local, State and Regional level. The emphasis of the study is to reduce corridor
delays through low cost intersection and operational improvements and exploring the feasibility of
improving alternative travel options such as complete streets, carpool, rail, bus, cycling and walking.
The goal of these recommendations is to identify "smart" transportation improvements that reduce
delays along each corridor, enhance travel choices, and improve safety for vehicles, bicyclists, and
pedestrians while not substantially changing the character of the corridors. This report is a critical
component to the County’s overall Transportation Master Plan. It will serve several needs including:
Developing a vision to guide investment in the County’s peninsula transportation corridors
over the next 20 years
Assessing, within each corridor, enhanced travel choices, parallel connections, optimal new
modes of travel, intermodal connections, and tools for better managing congestion
Assisting the County in having a greater leadership role in the pursuit of federal and regional
transportation funding
Supporting existing and future land uses including transit-oriented development and smart growth development
Developing concept level design elements and preliminary construction costs for each orridor
Developing a ‘toolbox’ of practical day-to-day strategies to better manage roadway/traffic
operations as well as travel demand for each corridor
Identify longer term right-of-way needs and make informed recommendations about land
requirements for future transportation facilities.

20 June 2016
Major Intersections/Important Facilities Study Introduction
2.3 TRANSIT MODE INVESTIGATION
Primary modes assessed in this study included highway, bicycle, pedestrian, and transit. In order to
begin identifying appropriate modes of transit, a household and employment density analysis was
conducted for each of the seven study corridors to determine if the density met the requirements
for transit service. Several of the study corridors had transportation analysis zones that met the
density requirements for commuter rail and several other corridors met the thresholds for local bus
service.
2.4 ALTERNATIVE SCREENING/MEASURES OF EFFECTIVENESS/PRIORITIZATION
Balancing the need for added roadway footprint with limited right of way, environmental
constraints, and the need to provide for more travel choices has been carefully considered on a
corridor-by-corridor and segment-by-segment basis to identify which roadway and transit capacity
improvements will be most operationally beneficial and justified. Given that most of the
recommendations were focused on intersection and bicycle/pedestrian improvements, the right-of-
way impacts are minimal overall. The following factors were considered in both screening
alternatives to identify preferred concepts as well as developing the final set of
recommendations for ranking corridor implementation priorities for advancement into detailed
project planning, preliminary and final engineering design, acquisition, and construction:
1. Travel Time Reliability. The ability of travel options in each corridor to provide consistent
future peak hour travel times either based on the lack of peak hour vehicle congestion or the
provision of alternative roadway connections and modes of travel.
2. Average Daily Traffic. The total daily number of vehicles traversing a particularly point
along a roadway over a 24-hour period.
3. Level of Service. A qualitative measure describing operational conditions within a traffic
stream, based on service measures such as speed, travel time, freedom to maneuver,
traffic interruption, comfort and convenience. For example, LOS A represents free flow,
almost complete freedom to maneuver within the traffic stream. LOS F represents forced
flow, more vehicles are attempting to use the facility than can be served resulting in stop-and-
go traffic.
4. Travel Choices. The number of future available options to travel from one point in a corridor to another, in comparison to existing conditions.
5. Cost. The total dollar value in current year dollars, to design and construct a proposed
improvement.
6. Feasibility (environmental, right-of-way impact). The amount of impact from construction
of proposed improvements due to sensitive environmental features such as streams,
wetlands or personal property such as homes and businesses.
7. Land Use Compatibility. The consistency of recommendations with currently zoned land
use regulations and small area plans.
21 June 2016
Major Intersections/Important Facilities Study Introduction
2.5 STAKEHOLDER AND PUBLIC OUTREACH
The Major Intersection/Important Facilities Study process facilitated extensive stakeholder and
public outreach along several facets throughout the 24-month timeline:
A Project Management Team met quarterly throughout the 24-month study and provided technical
guidance and feedback. Represented agencies included:
The Maryland State Highway Administration (Regional Intermodal Planning Division, Travel
Forecasting and Analysis Division, District 5)
Anne Arundel County Department of Public Works
Maryland Transit Administration
City of Annapolis
Baltimore Metropolitan Council
A series of public meetings and open houses were held throughout the project. Listening
sessions at two locations around the County were held after the completion of the existing conditions
analysis in March 2016, and a presentation of preliminary findings open house was held in June of
2016.
This website link is a repository for all technical documents including reports, meeting minutes,
graphics, and schedules: http://www.aacounty.org/PlanZone/TransPlan/index.cfm. See Appendix U
for meeting minutes from the PMT Meetings, public comments, and a response to those comments.

22 June 2016
Major Intersections/Important Facilities Study Existing Conditions Documentation
CHAPTER 3: EXISTING CONDITIONS DOCUMENTATION
3.1 INTRODUCTION
The purpose of this Chapter is to document the existing conditions of transportation-related elements
in each of the identified corridors, including existing traffic volumes, existing level of service and
existing transportation network characteristics. Existing conditions data was collected through a
series of field inventories and windshield surveys including number of lanes, cross-sectional elements,
bicycle routes and access, sidewalks, bus stop type and location, and transit ridership. In addition, the
key elements of completed transportation studies and land use plans were reviewed to ascertain
currently planned future transportation and land use conditions affecting these corridors.
Detailed traffic count data is included in Appendix I. Detailed level of service calculations are
included in Appendix L. Detailed corridor base mapping is included in Appendices P through S.
Existing transit service mapping is illustrated in Appendix H. Summaries of previous transportation
and land use plan recommendations affecting the County are included in Appendix O.
3.2 EXISTING TRAFFIC VOLUMES
Existing and historical traffic counts were compiled to determine the daily travel demand for each
corridor and to obtain the traffic data necessary for roadway capacity analyses and travel
demand model validation [e.g. average annual daily traffic (AADT), commuter peak hour traffic
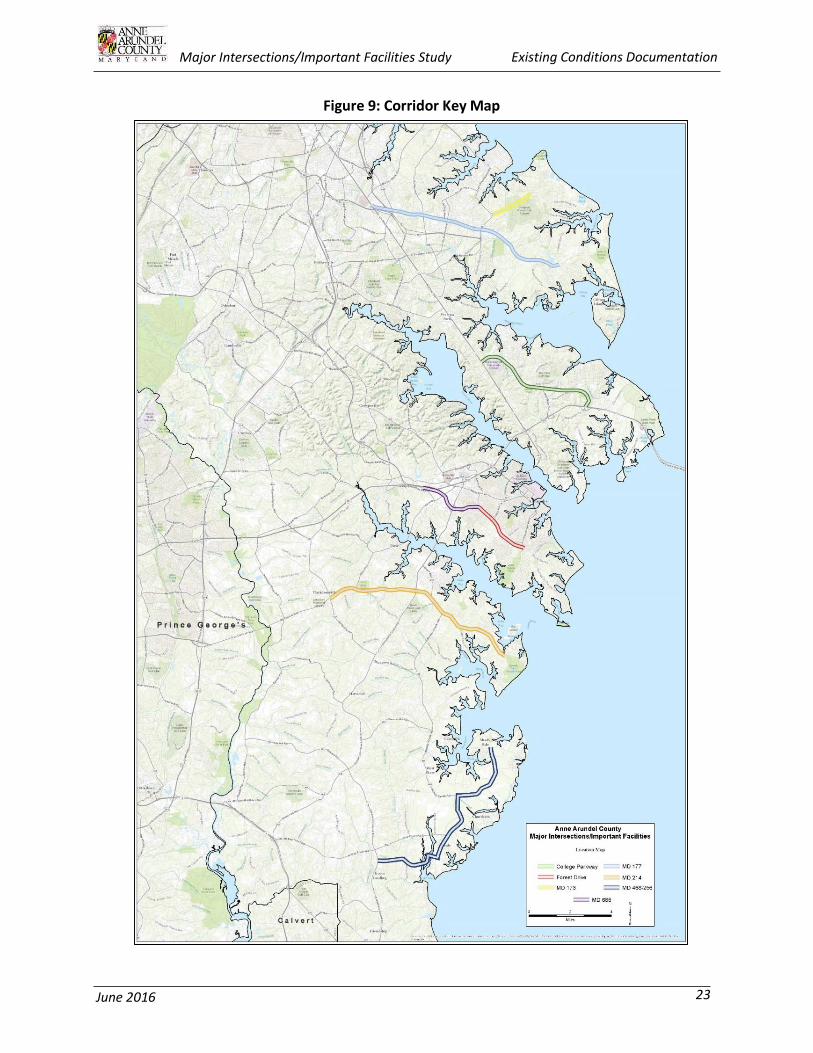
volumes]. An illustration of the seven corridors is shown in Figure 9.
23 June 2016
Major Intersections/Important Facilities Study Existing Conditions Documentation
Figure 9: Corridor Key Map

Major Intersections/Important Facilities Study Existing Conditions Documentation
24 June 2016
3.2.1 College Parkway
The County’s functional classification for College Parkway is ‘Minor Arterial’. The study corridor is
approximately 4.8 miles long and runs from MD 2/Governor Ritchie Highway to MD 179/Cape St.
Claire Road. College Parkway begins as a four-lane roadway intersecting MD 2 in Arnold. From this
intersection, the roadway heads east, gradually curving southeast. There are sections of curbed
median throughout the roadway. Between College Manor Drive and Ternwing Drive, the roadway
becomes two lanes. At Shore Acres Road, College Parkway begins traveling east again. At Destiny
Circle, the roadway turns southeast again and continues until its terminus at Cape St. Claire Road.
The speed limit ranges from 40 to 50 miles-per-hour with eight (8) signalized intersections spread
throughout the corridor. The 2012 average annual daily traffic (AADT) volume was 33,802 between
MD 2 and Jones Station Road, and 16,932 for the segment east of Jones Station Road.
3.2.2 Forest Drive
The County’s functional classification for Forest Drive is ‘Principal Arterial’ between Chinquapin Round Road/Bywater Road and Hilltop Lane, and ‘Minor Arterial’ between Hilltop Lane and Bay Ridge Avenue. The study corridor is approximately 2.3 miles long extending from Chinquapin Round Road/Bywater Road to Bay Ridge Avenue. Forest Drive continues on from the MD 665 terminus at Chinquapin Round Road/Bywater Road, transitioning from a 4-lane partially accessed-controlled freeway to a six-lane arterial roadway with sections of curbed median. At South Cherry Grove Avenue, eastbound Forest Drive loses one lane, making the roadway five lanes. Shortly thereafter, in the vicinity of Crystal Spring Farm Road, the roadway drops to four lanes with a center turn lane. Forest Drive regularly gains and loses this center turn lane as it intersects MD 387/Spa Road and Bay Ridge Avenue and represents the southern border of the city of Annapolis.
The speed limit on Forest Drive is 40 miles-per-hour with eight (8) signalized intersections along the study facility. The 2012 AADT was 56,873 between Chinquapin Round Road and Hilltop Lane, 36,241 between Hilltop Lane and Spa Road, and 27,921 between Spa Road and Hillsmere Drive.
3.2.3 MD 173
The County’s functional classification for MD 173/Ft. Smallwood Road within the study area is ‘Minor Arterial’. The study corridor is approximately 1.7 miles long and runs from Bayside Beach Road to MD 607/Hog Neck Road. MD 173 runs south as a two-lane road and then turns southwest at the intersection of Bayside Beach Road. The roadway has a section of diagonal-striped median. It passes along the northern edge of Jacobsville, where the road then meets the northern end of MD 607.
The speed limit ranges between 40 to 50 miles-per-hour. There is one signalized intersection located at MD 607. The 2012 AADT north of Bayside Beach Road is 12,880 and the 2011 AADT for the segment south of Edwin Raynor Boulevard is 9,252.
3.2.4 MD 177
The County’s functional classification for MD 177/Mountain Road is ‘Principal Arterial’ between MD 2
and MD 648/Baltimore-Annapolis Blvd., and between MD 100 and South Carolina Avenue. MD 177 is
classified as a ‘Minor Arterial’ between MD 648/Baltimore-Annapolis Blvd and MD 100, and between
South Carolina Avenue and Forest Glen Drive. The study corridor is approximately 7.8 miles long from
MD 2 to Forest Glen Drive. It begins in Pasadena at an intersection with MD 2. The intersection is
Major Intersections/Important Facilities Study Existing Conditions Documentation
25 June 2016
located just north of the MD 2 interchange with MD 100/Paul T. Pitcher Memorial Highway. The
roadway pavement section varies between 22 and 72 feet and has sections of median containing
raised-curb, center turn lanes, and stretches of no median.
The corridor continues east as a six-lane divided highway, and drops to four lanes at the intersection
with a ramp from southbound MD 10/Arundel Expressway and ramps to and from westbound MD
100. The corridor then passes under MD 10, adds a ramp onto northbound MD 10, and meets the
southern end of MD 648/Baltimore-Annapolis Boulevard at Sun Valley. At the next intersection, MD
915/Long Hill Road splits towards the south. MD 177 continues east as a two-lane road with a
frequent center turn lane. Travelling eastward, MD 177 intersects another section of MD
648/Waterford Road, as well as Catherine Avenue and Edwin Raynor Boulevard. The roadway then
intersects MD 607/Hog Neck Road heading northward and Magothy Bridge Road traveling southward.
Continuing east, MD 177 intersects Magothy Beach Road and the terminus of MD 100. MD 177
becomes a three-lane road section past MD 100 with a center lane controlled by directional lane use
signals. During rush hours, there are two lanes in the peak hour direction, but at all other times the
center lane serves as a center left turn lane. The eastern end of the three-lane section is at South
Carolina Avenue in the Lake Shore community. MD 177 continues east as a two-lane road, passing a
loop of Old Mountain Road. Shortly thereafter, Forest Glen Drive is located to the north of the
roadway.
The speed limit is 40 miles-per-hour and the study corridor has a total of fourteen (14) signalized
intersections spread throughout the corridor. The 2012 AADT was 21,241 east of Baltimore Annapolis
Boulevard, 12,441 west of MD 607, and 26,221 east of MD 100. The 2011 AADT was 14,900 east of
Waterford Road and 18,370 east of Bodkin Avenue.
3.2.5 MD 214
The County’s functional classification for MD 214/Central Avenue is ‘Principal Arterial’ between
MD 424/Davidsonville Road and MD 468/Shady Side Road, and ‘Minor Arterial’ between MD 468 and
Shoreham Beach Road. The study corridor is approximately 7.5 miles long from MD 424 to Shoreham
Beach Road. MD 214 is two lanes when it meets the southern end of MD 424 in the Davidsonville
Historic District. The roadway is 22 to 48 feet wide and has sections of raised-curb median. The
highway then gains a second lane westbound at MD 214A (Pike Ridge Road). MD 214 gains a second
eastbound lane and a median just east of its intersection with Pike Ridge Road. The highway veers
southeast and becomes undivided at Stepneys Lane and meets the southern end of MD 253/Mayo
Road opposite South River High School, and then drops back to two lanes before its intersection with
MD 468. MD 214 then continues east through the community of Selby-on-the-Bay, passing the
entrance to Camp Letts. Shoreham Beach Road then splits off of MD 214 at a fork just prior to Mayo.
The speed limit ranges from 30 to 50 miles-per-hour. There are six (6) signalized intersections spread
throughout the corridor. The 2012 AADT is 16,742 for the section immediately east of MD 424, is
15,182 for immediately west of MD 2, and is 19,222 east of MD 468. The 2011 AADT is 25,301
immediately west of MD 468.
3.2.6 MD 256 & MD 468
MD 256 is classified as ‘Minor Arterial’ between MD 2 and MD 258, and as ‘Principal Arterial’ between

Major Intersections/Important Facilities Study Existing Conditions Documentation
26 June 2016
MD 258 and MD 468. The classification for MD 468 is ‘Minor Arterial’. The overall study corridor
(MD 256 and MD 468) is approximately 8.1 miles long and runs from MD 2 to Snug Harbor Road.
MD 256 begins at its intersection with MD 2 as a two lane road ranging between a 20 and 25-foot
wide. It has sections of raised curbed median. The corridor heads east as two-lane Deale Road past
Traceys Elementary School and Deale-Traceys Park. MD 256 then enters the community of Deale,
which includes several marinas. The road then crosses Traceys Creek and curves north. MD 256 then
makes a right-angle turn east at Rockhold Creek Road and crosses Rockhold Creek. At Masons Beach
Road (the center of Deale), MD 256 turns north onto Deale Churchton Road, crossing a roundabout
with MD 258/Bay Front Road before intersecting with MD 468. MD 468 is a two lane, 24 to 26-foot
wide roadway with no median. From that intersection, MD 468 progressively curves east and heads
north as two-lane Shady Side Road.
The speed limit along MD 256 ranges from 30 to 45 miles-per-hour. There are two (2) signalized
intersections; one at the MD 256/MD468 intersection and the other at the MD 256/Franklin Manor
Road intersection. The 2012 AADT immediately east of MD 2 is 2,862 and increases to 9,422 at the
terminus with MD 468. The speed limit along MD 468 ranges from 30 to 45 miles-per-hour. The only
signalized intersection on MD 468 is located at its intersection with MD 256.
3.2.7 MD 665
The County’s functional classification for MD 665/Aris T. Allen Boulevard is ‘Freeway’. The study
corridor is approximately 2.7 miles long from US 50/301 to its terminus at Bywater Road. MD 665
begins in Parole at a directional interchange with US 50 and US 301 (John Hanson Highway). It is a
four lane, 48-foot wide roadway with partial and full access controls, and has various median types
including positive barrier, curbed, and unprotected grass. The corridor heads southeast as a four-lane
freeway crossing a single-point urban interchange with Riva Road. MD 665 then turns east to meet
MD 2 at a partial cloverleaf interchange. Prior to the MD 2 interchange there is an exit ramp from
westbound MD 665 to Annapolis Harbor Center Drive, which provides access to the Annapolis
Harbour Center. Past MD 2, the highway crosses Church Creek, entering the city of Annapolis and
becoming a four-lane divided highway with partial access control. It then intersects Chinquapin
Round Road and then terminates at Bywater Road, to continue as Forest Drive. Just prior to its
intersection with Chinquapin Round Road, two-foot concrete sidewalks begin on both sides of the
roadway that continue into Forest Drive.
The speed limit ranges from 40 to 55 miles-per-hour. The 40 miles-per-hour speed limit is based on
the stop condition at Forest Drive. There is one signalized intersection where MD 665 intersects with
Chinquapin Round Road (this signal is included in the Forest Drive summary). The 2012 AADT east of
Riva Road is 59,752.
Major Intersections/Important Facilities Study Existing Conditions Documentation
27 June 2016
3.3 EXISTING LEVEL OF SERVICE
Existing levels of service for each corridor and key intersections were calculated. Level of service
(LOS) is a grading system for transportation components (intersections, freeways, ramps, etc.) and a
qualitative measure describing operational conditions within a traffic stream, based on such factors as
speeds, travel time, freedom to maneuver, and stops. For example, LOS A represents free flow,
almost complete freedom to maneuver within the traffic stream. LOS F represents congested flow;
more vehicles are attempting to use the roadway than can be served resulting in stop-and-go traffic.
While the letter grades correlate to classroom grades, the acceptable level of service grade for most
jurisdictions is the letter D, which indicates an efficient use of roadway space but not oversaturated
flow. It should be noted that this analysis is a macroscopic analysis based on roadway geometric
characteristics and vehicle traffic composition, and may not always reflect friction caused by
weaving, acceleration and deceleration along freeways through interchanges, or along arterials due
to variable signal timing patterns which is best captured through detailed traffic micro-simulation.
Congested and failing peak hour conditions were primarily noted at the following locations:
at the intersection of College Parkway and MD 2
at the intersection of College Parkway and MD 179
along College Parkway from west of Jones Station to MD 179
at the intersection of MD 177 and New Freetown Road (unsignalized approaches)
at the intersection of MD 177 and Catherine Avenue
at the intersection of MD 177 and Edwin Raynor Road
at the intersection of MD 177 and MD 607 (Hog Neck Road)
at the intersection of MD 177 and Lake Shore Drive
along MD 177 from Jumpers Hole Road to Waterford Road
at the intersection of MD 214 and Riva Road (unsignalized approaches)
at the intersection of MD 214 and Stepneys Lane (unsignalized approach)
at the intersection of MD 256 and MD 2 (unsignalized approach)
at the intersection of MD 256 and MD 468
along MD 665 between US 50 and Riva Road
In each of the corridors, the known operational and capacity constraints that cause the current
congestion will be further addressed in more detailed project planning studies of the individual
corridor. The County has previously funded the Mountain Road Corridor project planning study which
included a detailed footprint assessment and preliminary engineering cost estimate for improvements
to MD 177 between MD 648 (Waterford Road) to Edwin Raynor Road. The next steps for this project
area will be final design and construction by MSHA.
Illustrations of existing corridor intersection level of service are shown in Tables 9 through 14.

Major Intersections/Important Facilities Study Existing Conditions Documentation
28 June 2016
Table 9: College Parkway Existing LOS
Study Intersections
Summary of Results
Existing Existing Delay (seconds
per vehicle)
Existing v/c
AM PM AM PM
College Parkway at MD 2 D E 38.0 67.8 1.10 1.15
College Parkway at Jones Station Road A C 9.1 27.2 0.65 0.88
College Parkway at Shore Acres Road A A 5.5 6.0 0.67 0.63
College Parkway at Bay Dale Drive C D 29.5 38.9 0.84 1.01
College Parkway at MD 179 D F 48.3 92.4 0.78 0.90
Table 10: Forest Drive Existing LOS
Study Intersections
Summary of Results
Existing Existing Delay (seconds
per vehicle)
Existing v/c
AM PM AM PM
Forest Drive at Chinquapin Round Road B C 19.9 23.7 0.79 0.84
Forest Drive at Bywater Road B B 14.1 13.2 0.79 0.76
Forest Drive at Hilltop Lane C C 20.4 26.1 0.68 0.71
Forest Drive at Spa Road D D 39.6 46.3 0.94 0.96
Forest Drive at Bay Ridge Avenue D D 53.7 42.9 0.92 0.79
Table 11: MD 173 Existing LOS
Study Intersections
Summary of Results
Existing Existing Delay (seconds
per vehicle)
Existing v/c
AM PM AM PM
MD 173 at MD 607 C B 20.7 19.8 0.71 0.73
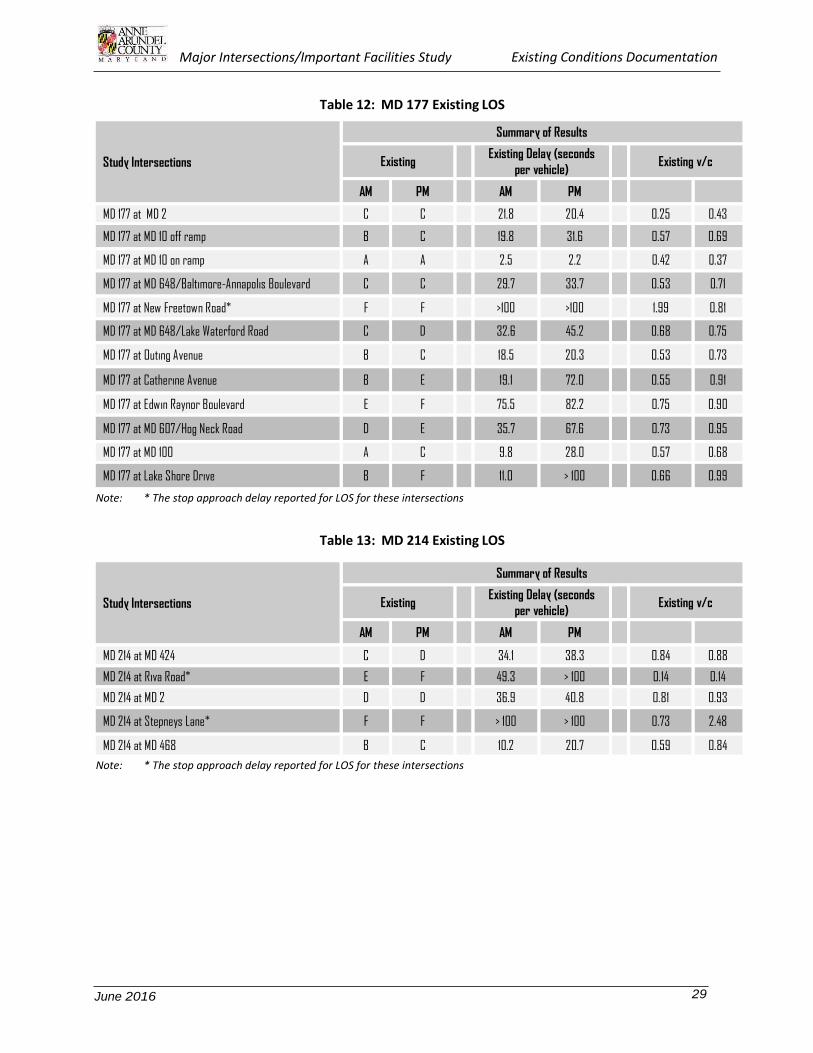
Major Intersections/Important Facilities Study Existing Conditions Documentation
29 June 2016
Table 12: MD 177 Existing LOS
Study Intersections
Summary of Results
Existing Existing Delay (seconds
per vehicle)
Existing v/c
AM PM AM PM
MD 177 at MD 2 C C 21.8 20.4 0.25 0.43
MD 177 at MD 10 off ramp B C 19.8 31.6 0.57 0.69
MD 177 at MD 10 on ramp A A 2.5 2.2 0.42 0.37
MD 177 at MD 648/Baltimore-Annapolis Boulevard C C 29.7 33.7 0.53 0.71
MD 177 at New Freetown Road* F F >100 >100 1.99 0.81
MD 177 at MD 648/Lake Waterford Road C D 32.6 45.2 0.68 0.75
MD 177 at Outing Avenue B C 18.5 20.3 0.53 0.73
MD 177 at Catherine Avenue B E 19.1 72.0 0.55 0.91
MD 177 at Edwin Raynor Boulevard E F 75.5 82.2 0.75 0.90
MD 177 at MD 607/Hog Neck Road D E 35.7 67.6 0.73 0.95
MD 177 at MD 100 A C 9.8 28.0 0.57 0.68
MD 177 at Lake Shore Drive B F 11.0 > 100 0.66 0.99
Note: * The stop approach delay reported for LOS for these intersections
Table 13: MD 214 Existing LOS
Study Intersections
Summary of Results
Existing Existing Delay (seconds
per vehicle)
Existing v/c
AM PM AM PM
MD 214 at MD 424 C D 34.1 38.3 0.84 0.88
MD 214 at Riva Road* E F 49.3 > 100 0.14 0.14
MD 214 at MD 2 D D 36.9 40.8 0.81 0.93
MD 214 at Stepneys Lane* F F > 100 > 100 0.73 2.48
MD 214 at MD 468 B C 10.2 20.7 0.59 0.84
Note: * The stop approach delay reported for LOS for these intersections

Major Intersections/Important Facilities Study Existing Conditions Documentation
30 June 2016
Table 14: MD 256 & MD 468 Existing LOS
Study Intersections
Summary of Results
Existing Existing Delay (seconds
per vehicle)
Existing v/c
AM PM AM PM
MD 256 at MD 2* C E 20.1 44.6 0.17 0.63
MD 256 at MD 258** A A 2.4 5.0 0.54 0.74
MD 256 at Franklin Manor Road A B 8.5 13.6 0.39 0.76
MD 256 at MD 468 D E 46.6 55.8 0.56 0.60
Note: * The stop approach delay reported for LOS for these intersections
Note: ** The Intersection Capacity Utilization (ICU) approximates the V/C ratio for these intersections
3.4 PREVIOUS STUDIES
Prior to developing any future recommendations, a thorough review of previous transportation and
land use studies was performed. These studies are indexed in Table 15.
Table 15: Master List of Transportation and Land Use Reports Reviewed
Title Date Published Publishing Agency Annapolis Comprehensive Plan August 2007 City of Annapolis
Anne Arundel County General Development Plan April 2009 Anne Arundel County
Anne Arundel County Greenways Master Plan October 2002 Anne Arundel County
Anne Arundel County FY 2015 Approved Capital Budget and Program
July 2014 Anne Arundel County
Anne Arundel County Corridor Growth Management Plan July 2012 Anne Arundel County
Anne Arundel County Pedestrian and Bicycle Master Plan Update
June 2013 Anne Arundel County
Anne Arundel County Transit Development Plan Update January 2010 Anne Arundel County
Annapolis Neck Small Area Plan March 2003 Anne Arundel County
Broadneck Small Area Plan December 2001 Anne Arundel County
Complete Streets Guidance November 2013 Anne Arundel County
Deale/Shadyside Small Area Plan June 2001 Anne Arundel County
Edgewater/Mayo Small Area Plan February 2002 Anne Arundel County
Glen Burnie Small Area Plan September 2004 Anne Arundel County
Lake Shore Small Area Plan May 2004 Anne Arundel County
Pasadena Small Area Plan August 2004 Anne Arundel County
MSHA Highway Needs Inventory- Anne Arundel County Section 2013 Maryland State Highway Administration

31 June 2016
Major Intersections/Important Facilities Study Travel Forecasting
CHAPTER 4: TRAVEL FORECASTING
4.1 INTRODUCTION
This chapter summarizes the travel demand model validation (see Appendix A and Appendix G), the
development of an initial set of alternatives, and the development of travel demand forecasts for the
initial set of alternatives (see Appendix D).
4.2 MODEL VALIDATION
The travel demand model which was used for this effort was developed from the Baltimore
Metropolitan Council’s regional travel demand model (version 3 .3e), which includes cooperative
forecasts of demographic data such as households and jobs for all local jurisdictions in the
metropolitan area. The model was further modified for the County’s analysis of BRAC (Base
Realignment and Closure) related impacts. These modifications included a more refined zone
structure and additional details were added to the roadway network. These refinements to the model
(referred to as the AATrvM model) were used to develop 2005 simulated volumes which is the
validation year of the AATRvM model. Forecasts and were developed under Round 7c land use
assumptions and compared to subsequent years of count data 2005-2010 for reasonableness.
As part of the Major Intersections/Important Facilities Study, it was assumed that the model structure
would be sufficient, but that adjustments to centroid connections and loadings would be required in
some of the study corridors to achieve validation. During the validation process, it was determined
that a number of adjustments to the centroid connections would be required in the MD 177/MD 100
area along with adjustments to the functional class of MD 177.
In addition, a 2035 forecast was performed, as opposed to the 2005 validation model run that was
previously conducted. Refined corridor level forecasts were developed using standard National
Cooperative Highway Research Project processes.
The overall goal of the model validation effort is to improve the model’s predictive capabilities
and ability to provide reasonable forecasts. This is done by developing a base year model and
evaluating how well the model is able to replicate the existing conditions. For this effort, the base
year was 2005. Existing traffic data was compiled that represents year 2005 conditions. The model
was then input with 2005 roadway characteristics (number of lanes, access controls, capacity, etc.)
and 2005 socioeconomic data (households, employment, etc.) and the model was refined and
adjusted to best replicate these existing conditions. See Appendix C.
The Federal Highway Administration (FHWA) has published targets for model validation, and these
targets provided the guidelines for this effort. The validation statistics that were used include
volume- to-count ratio, root mean squared error, and Percent Deviation. Emphasis has been placed
on the facilities responsible for accommodating higher volumes of traffic (e.g. MD 665, MD 177,
etc.) where the target is to simulate within 10%-15% of the observed count volumes. Other
facilities that carry less traffic (e.g., MD 173, MD 256, MD 214) would have a higher tolerance during

32 June 2016
Major Intersections/Important Facilities Study Travel Forecasting
validation; where simulating within ±25 percent of the observed traffic volumes would be considered
acceptable. The FHWA targets for volume-to-count ratios are as follows:
Freeways/Expressways ±7%
Principal Arterials ±10%
Minor Arterials ±15%
Collector Roadways ±25%
Based on the above and the roadway functional classifications used in the AATrvM model (this is
slightly different than county functional classifications), MD 665 was validated with a target goal of
±10%, MD 177 was validated with a target goal of ±15%, and College Parkway, MD 173, MD 256 & MD
468, Forest Drive, and MD 214 were validated using targets of ±25% of the count volume. With the
base year model replicating observed counts within these targets the future year model should
provide reasonable forecasts for the future year being evaluated.
The core of the validation effort included evaluating each corridor individually in order to verify
critical link attributes for accuracy. These attributes included number of lanes, facility type, roadway
type, etc., in addition to other more qualitative features such as roadway geometry. Addition of
collector roadways, repositioning of centroids, and adding centroid connectors were additional
techniques used in validation. Also, certain original roadway links were eliminated from the analysis if
they were considered redundant for the effort. These techniques have improved vehicular loadings
such that the simulated volumes become a better match with the existing counts.
4.2.1 College Parkway
Upon initial investigation, the College Parkway corridor was observed to be already validating. All of
the segments were within the FHWA guidelines of ±25%.
4.2.2 Forest Drive
Upon initial investigation, the Forest Drive corridor was observed to be already validating. All of the
segments were within the FHWA guidelines of ±25%. Hilltop Lane was added to the highway network
which further improved the validation for this corridor.
4.2.3 MD 173
Upon initial investigation, the MD 173 corridor was observed to be already validating. All of the
segments were within the FHWA guidelines of ±25%.
4.2.4 MD 177
The MD 177 corridor has historically undersimulated in both the BMC and AATrvM models, and this
was the case with the current state of the AATrvM model. The initial validation showed this corridor
to be undersimulating by 13-76% with many of the links undersimulating by 40-60%.
The consultant team reviewed the MD 177 network coding in detail and extended this review south of
MD 100 which indicated that the loadings in this area needed to be reoriented to direct more trips to

33 June 2016
Major Intersections/Important Facilities Study Travel Forecasting
MD 177 as what occurs in the field. This corridor reacted very well to these adjustments; though it
was determined that too many trips were being diverted to MD 100 via MD 607. Further adjustments
to MD 177 to increase the free flow speed and capacity further improved the validation, though some
segments were still undersimulating. After consulting with the county, final adjustments were made
to the MD 177 corridor, including changing the functional classification of the parallel route, MD 100,
from freeway to expressway, and this further improved the validation results on MD 177. The
performance of the corridor showed great improvement overall with the majority of the links
validating within the FHWA thresholds.
4.2.5 MD 214
Upon initial investigation, the MD 214 corridor was observed to be already validating. All of the
segments were within the FHWA guidelines of ±25%.
4.2.6 MD 256 & MD 468
MD 256/MD 468 was not coded into the existing AATrvM model as this is a two lane highway located in
a rural portion of the county. The consultant team coded MD 256/MD 468 as a collector in the AATrvM
model and conducted several iterations of model runs after adjusting centroid loadings to develop a
reasonable validation of the study corridor. Given the low volumes on MD 256 and MD 468, some of
the segments remain outside of the FHWA thresholds. However, it should be noted that the segments
that are outside of the FHWA thresholds are sections of MD 256 and MD 468 that are either carrying
particularly low volumes, i.e. 3-6k ADT or are located at the very edge of the model network where
there are minimal options for centroid loadings. Given these factors, no additional adjustments were
made to this corridor. To account for the difference between observed and simulated for the validation
links associated with the centroid locations, the growth factors from the adjacent links was used to
develop the year 2035 forecasts at these locations.
4.2.7 MD 665
Though MD 665 has many characteristics of a freeway in the short section between US 50 and MD 2,
the facility is coded in the AATrvM model as a Principal Arterial. The initial model results indicated
that one segment was outside of the FHWA threshold by 1% (11% compared to 10% threshold).
After making adjustments to validate the MD 177 corridor and adding MD 256 into the network, this
segment was within 10% of the observed count which is acceptable.
4.3 MODE INVESTIGATION, LAND USE, AND TRANSIT NODE IDENTIFICATION
An initial screening effort aimed to identify the most viable modes of travel in each study corridor was
conducted. Primary modes assessed in this study include highway (vehicle), transit (bus and rail),
bicycle, and pedestrian. In order to better understand how land use can support transit, some
guidance is presented from the Institute of Transportation Engineers (ITE) in the graphic below
regarding what levels of residential and non-residential density support various modes of transit.
Local bus service is recommended above a density of 4-5 dwelling units per acre, light rail service is
recommended above a density of 9 dwelling units per acre, and frequent-level bus is recommended
only above a density of 15 units per acre. Providing transit to areas with employment densities of 14
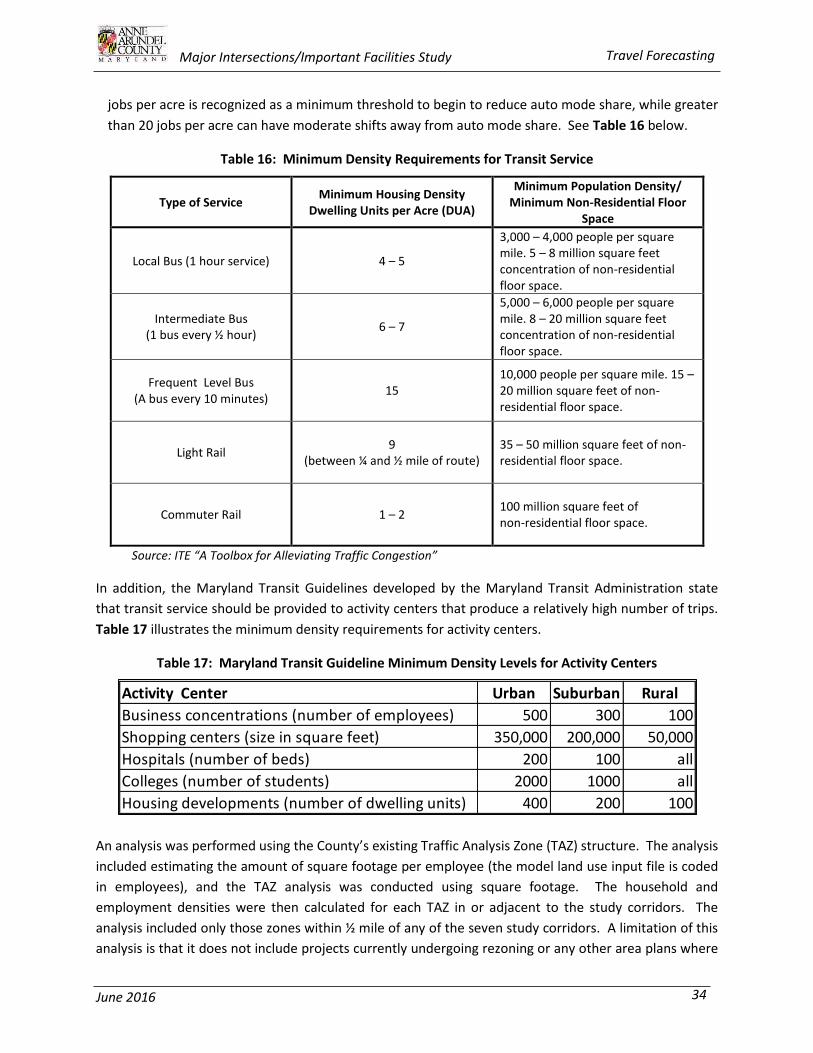
34 June 2016
Major Intersections/Important Facilities Study Travel Forecasting
jobs per acre is recognized as a minimum threshold to begin to reduce auto mode share, while greater
than 20 jobs per acre can have moderate shifts away from auto mode share. See Table 16 below.
Table 16: Minimum Density Requirements for Transit Service
Type of Service Minimum Housing Density
Dwelling Units per Acre (DUA)
Minimum Population Density/ Minimum Non-Residential Floor
Space
Local Bus (1 hour service) 4 – 5
3,000 – 4,000 people per square mile. 5 – 8 million square feet concentration of non-residential floor space.
Intermediate Bus (1 bus every ½ hour)
6 – 7
5,000 – 6,000 people per square mile. 8 – 20 million square feet concentration of non-residential floor space.
Frequent Level Bus (A bus every 10 minutes)
15 10,000 people per square mile. 15 – 20 million square feet of non-residential floor space.
Light Rail 9
(between ¼ and ½ mile of route) 35 – 50 million square feet of non-residential floor space.
Commuter Rail 1 – 2 100 million square feet of non-residential floor space.
Source: ITE “A Toolbox for Alleviating Traffic Congestion”
In addition, the Maryland Transit Guidelines developed by the Maryland Transit Administration state
that transit service should be provided to activity centers that produce a relatively high number of trips.
Table 17 illustrates the minimum density requirements for activity centers.
Table 17: Maryland Transit Guideline Minimum Density Levels for Activity Centers
An analysis was performed using the County’s existing Traffic Analysis Zone (TAZ) structure. The analysis
included estimating the amount of square footage per employee (the model land use input file is coded
in employees), and the TAZ analysis was conducted using square footage. The household and
employment densities were then calculated for each TAZ in or adjacent to the study corridors. The
analysis included only those zones within ½ mile of any of the seven study corridors. A limitation of this
analysis is that it does not include projects currently undergoing rezoning or any other area plans where
Activity Center Urban Suburban Rural
Business concentrations (number of employees) 500 300 100
Shopping centers (size in square feet) 350,000 200,000 50,000
Hospitals (number of beds) 200 100 all
Colleges (number of students) 2000 1000 all
Housing developments (number of dwelling units) 400 200 100

35 June 2016
Major Intersections/Important Facilities Study Travel Forecasting
increased density is recommended. However, the analysis for each corridor includes the additional
housing units and/or number of jobs that would be required to achieve the minimum ITE thresholds for
transit service. The results of this analysis are presented in each corridor modal assessment on the
following pages. The land use analysis recommendations, (i.e. increased households or employment)
were based on the assumption that the land use would remain consistent, i.e. households were added in
existing residential areas and employment was added where land use is currently zoned for
employment. The density was calculated by dividing the number of households in each study corridor
TAZ by the number of acres in each corresponding TAZ. The density for each zone was then compared to
both the ITE and MTA thresholds for providing transit service. While ITE lists thresholds for specific
types of transit service, the MTA thresholds were developed for bus service only. It should be noted
that the MTA thresholds are lower than the ITE thresholds that were used in the previous CGMP density
analysis.
The analysis indicates that in the existing and year 2035 conditions, there are some opportunities to
implement and/or improve existing transit service in some of the study corridors. The fact that there
are a number of zones with both the employment and residential density to support transit means that
alternative modes of travel (particularly combined with increased employment density in Activity
Centers such as the Annapolis Towne Center) can supplement the targeted expansion of the roadway
network. Without these improvements, many residents will be forced to commute by car to work on
congested roadways for longer distances to locations both within the County and outside of the County.
Without improvements to non-motorized modes of travel, short Home-Based-Work trips, Home-Based-
Shopping trips, and Home-Based-Other trips will also rely on vehicles as the primary mode of travel.
This situation is compounded by the fact that many of the subdivisions in the study corridors were
developed in typical suburban fashion with cul-de-sacs and limited connectivity between neighborhoods
which leads to an over-reliance of vehicles for short trips, many of which are concentrated on primary
routes such as Forest Drive and MD 177.
In order to begin identifying appropriate modes of transit within each corridor, varying levels and modes
of transit were considered, including commuter rail, heavy rail, light rail, streetcar, commuter bus,
premium bus, local bus, and bus rapid transit. More detailed information on transit can be found in the
Transit Primer (Appendix N). Where applicable, the regional travel modeling tool and model input files
were used to identify the following key issues regarding alternative modes of travel:
If currently approved land use patterns and future travel demand support new transit service.
If additional land use density, or increased service frequency and/or speed (through priority treatments) would make transit a viable travel choice.
If provision of alternative modes of travel would result in any measurable reduction in projected daily vehicle traffic and/or levels of congestion.
The analysis indicates that in the existing and year 2035 conditions, there are some opportunities to
implement and/or improve existing transit service in most of the study corridors. The fact that there
are a number of zones with both the employment and residential density to support transit means
that alternative modes of travel (particularly combined with increased employment density in Activity
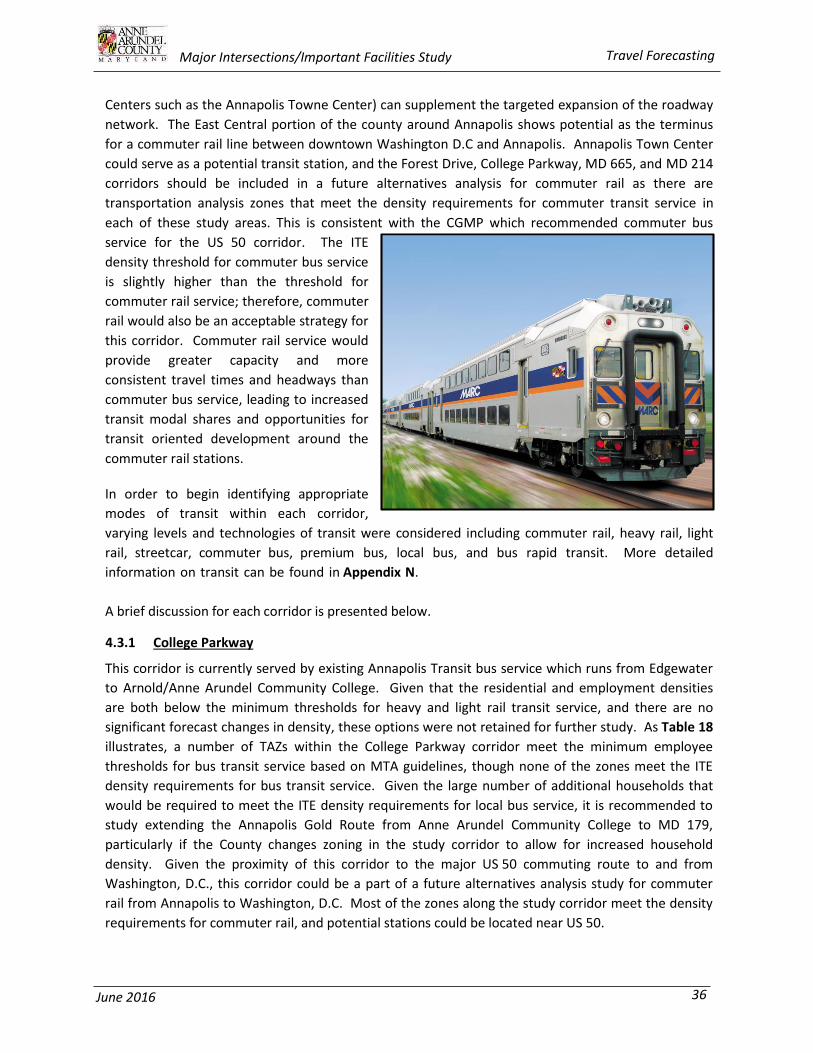
36 June 2016
Major Intersections/Important Facilities Study Travel Forecasting
Centers such as the Annapolis Towne Center) can supplement the targeted expansion of the roadway
network. The East Central portion of the county around Annapolis shows potential as the terminus
for a commuter rail line between downtown Washington D.C and Annapolis. Annapolis Town Center
could serve as a potential transit station, and the Forest Drive, College Parkway, MD 665, and MD 214
corridors should be included in a future alternatives analysis for commuter rail as there are
transportation analysis zones that meet the density requirements for commuter transit service in
each of these study areas. This is consistent with the CGMP which recommended commuter bus
service for the US 50 corridor. The ITE
density threshold for commuter bus service
is slightly higher than the threshold for
commuter rail service; therefore, commuter
rail would also be an acceptable strategy for
this corridor. Commuter rail service would
provide greater capacity and more
consistent travel times and headways than
commuter bus service, leading to increased
transit modal shares and opportunities for
transit oriented development around the
commuter rail stations.
In order to begin identifying appropriate
modes of transit within each corridor,
varying levels and technologies of transit were considered including commuter rail, heavy rail, light
rail, streetcar, commuter bus, premium bus, local bus, and bus rapid transit. More detailed
information on transit can be found in Appendix N.
A brief discussion for each corridor is presented below.
4.3.1 College Parkway
This corridor is currently served by existing Annapolis Transit bus service which runs from Edgewater
to Arnold/Anne Arundel Community College. Given that the residential and employment densities
are both below the minimum thresholds for heavy and light rail transit service, and there are no
significant forecast changes in density, these options were not retained for further study. As Table 18
illustrates, a number of TAZs within the College Parkway corridor meet the minimum employee
thresholds for bus transit service based on MTA guidelines, though none of the zones meet the ITE
density requirements for bus transit service. Given the large number of additional households that
would be required to meet the ITE density requirements for local bus service, it is recommended to
study extending the Annapolis Gold Route from Anne Arundel Community College to MD 179,
particularly if the County changes zoning in the study corridor to allow for increased household
density. Given the proximity of this corridor to the major US 50 commuting route to and from
Washington, D.C., this corridor could be a part of a future alternatives analysis study for commuter
rail from Annapolis to Washington, D.C. Most of the zones along the study corridor meet the density
requirements for commuter rail, and potential stations could be located near US 50.

37 June 2016
Major Intersections/Important Facilities Study Travel Forecasting
Table 18: College Parkway Mode Investigation
Existing Transit Annapolis Transit
MTA Transit along MD 2 and at the Anne Arundel Community College
Potential Improvements/Modes
Annapolis Transit Gold Route Extension
MTA Route 14 Extension/Adjustment; consider Paratransit
Sidewalks
Bicycle Lanes
Multi-use Paths
Intersection Improvements
Future Commuter Rail to Washington, D.C. (Long-term)
Potential Stations US 50 at MD 179, Anne Arundel Community College
Potential Terminals US 50 at MD 179, Anne Arundel Community College
Modal Connections MTA Bus Routes 230, 14; Paratransit service
4.3.2 Forest Drive
This corridor is currently served by the Annapolis Transit bus service which runs from Chinquapin Round
Road to Hilltop Lane. Given that the residential and employment densities are both below the minimum
thresholds for heavy and light rail transit service and there are no significant forecast changes in density,
these options were not retained for further study. A review of the existing Annapolis Transit ridership
indicated that approximately 3% of all daily corridor trips are made by Annapolis Transit, which equates
to approximately 200 peak hour Annapolis Transit trips in the Forest Drive Corridor. The household and
employment density analysis (Table 19) illustrates that all of the zones in the Forest Drive Corridor meet
the minimum thresholds for bus service based on MTA guidelines, and several of the zones also meet
the ITE thresholds for bus service. All of the zones in the corridor study area meet the ITE threshold for
commuter rail, which should be noted given this corridor leads directly to US 50, which is a major
commuting route between Annapolis and Washington, D.C. Forest Drive also serves the Annapolis
Towne Center which has the potential to be a multi-modal terminal, given the Transit-Oriented nature
of the development and the proximity to US 50 and downtown Annapolis.
The City of Annapolis has completed a pre-NEPA analysis and planning study funded by the Baltimore
Regional Transportation Board (BRTB) for the Annapolis/Parole Intermodal Center and the County has
requested additional funding for planning, design, Right-of-Way and construction in the Fiscal Year 2017
Priority Letter to MDOT. The density analysis also illustrates moderate growth is forecast for the study
corridor; however a detailed review of the demographic file used in the modeling and density analysis
indicated that the employment associated with the proposed Crystal Springs mixed-use development
was not accurately reflected in the demographic file. An additional travel demand model run was
conducted to include the estimated 500 employees associated with the retail component of Crystal
Springs. A number of zones in the study corridor show no change or minimal growth in households and
employment between 2005 and 2035, though other zones show moderate to significant growth.
Existing bus service routing and headway should be reviewed and adjusted to maximize transit service in
the Forest Drive corridor. Adjusting routes to better serve the proposed multi-modal station at
Annapolis Towne Center and existing MTA Commuter Bus stops would enhance mobility options for
commuters with and without vehicles which in an important environmental justice consideration.

38 June 2016
Major Intersections/Important Facilities Study Travel Forecasting
Table 19: Forest Drive Mode Investigation
Existing Transit Annapolis Transit
Potential Improvements/Modes
Commuter Rail to Washington D.C (Long-Term).
Sidewalks
Multi-use Paths
Bicycle Lanes
Intersection Improvements
Potential Stations Annapolis Towne Center
Potential Terminals Annapolis Towne Center
Modal Connections MTA Commuter Bus, Greyhound, Annapolis Transit
4.3.3 MD 173
This corridor is located in a low density residential area, and there is currently no transit service
serving the corridor. There is a small commercial hub at the study corridor’s terminus at MD 607/Hog
Neck Road. An analysis of the household and employment density illustrates that all of the zones in
the study corridor meet the MTA guidelines for transit service, and that one of the zones will also
meet the ITE threshold for bus service by the year 2035 (see Table 20). It should also be noted that a
number of additional zones would be approaching the ITE threshold for bus service by the year 2035,
indicating this corridor could be a feasible transit corridor in the future.
Table 20: MD 173 Mode Investigation
Existing Transit None
Potential Improvements / Modes
Future Local Bus Service (Long-Term)
Sidewalks
Multi-use Paths
Bicycle Lanes
Potential Stations None
Potential Terminals None
Modal Connections Dependent on bus route selected
4.3.4 MD 177
This corridor is currently served by existing Regional Transportation Agency (RTA) of Central
Maryland Transit bus service which runs from MD 648/Baltimore-Annapolis Boulevard to New
Freetown Road. Given that the residential and employment densities are both below the minimum
thresholds for heavy and light rail transit service, and there are no significant forecast changes in
density, these options were not retained for further study. The existing RTA Route 201/J provides
service to the Glen Burnie/Cromwell Light Rail Station. The existing and forecast density along MD
177 illustrate that several of the zones meet the ITE thresholds for local bus service (see Table 21).
All of the zones meet the MTA guidelines for transit service.
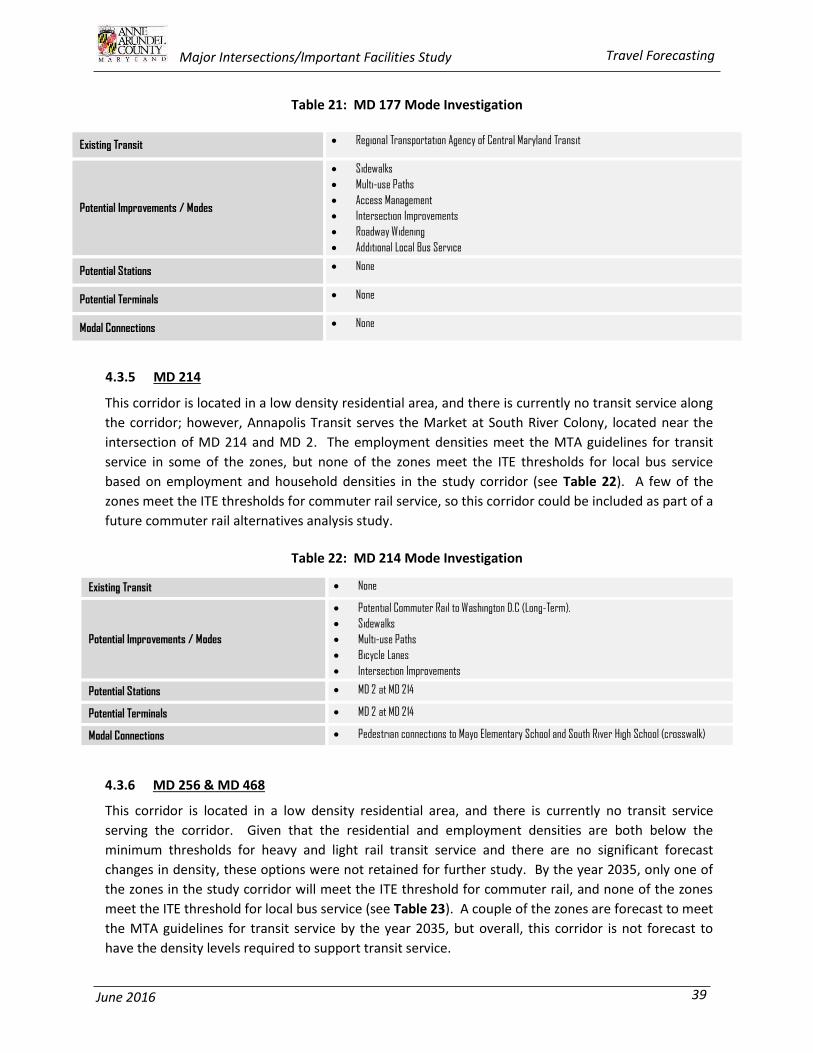
39 June 2016
Major Intersections/Important Facilities Study Travel Forecasting
Table 21: MD 177 Mode Investigation
Existing Transit Regional Transportation Agency of Central Maryland Transit
Potential Improvements / Modes
Sidewalks
Multi-use Paths
Access Management
Intersection Improvements
Roadway Widening
Additional Local Bus Service
Potential Stations None
Potential Terminals None
Modal Connections None
4.3.5 MD 214
This corridor is located in a low density residential area, and there is currently no transit service along
the corridor; however, Annapolis Transit serves the Market at South River Colony, located near the
intersection of MD 214 and MD 2. The employment densities meet the MTA guidelines for transit
service in some of the zones, but none of the zones meet the ITE thresholds for local bus service
based on employment and household densities in the study corridor (see Table 22). A few of the
zones meet the ITE thresholds for commuter rail service, so this corridor could be included as part of a
future commuter rail alternatives analysis study.
Table 22: MD 214 Mode Investigation
Existing Transit None
Potential Improvements / Modes
Potential Commuter Rail to Washington D.C (Long-Term).
Sidewalks
Multi-use Paths
Bicycle Lanes
Intersection Improvements
Potential Stations MD 2 at MD 214
Potential Terminals MD 2 at MD 214
Modal Connections Pedestrian connections to Mayo Elementary School and South River High School (crosswalk)
4.3.6 MD 256 & MD 468
This corridor is located in a low density residential area, and there is currently no transit service
serving the corridor. Given that the residential and employment densities are both below the
minimum thresholds for heavy and light rail transit service and there are no significant forecast
changes in density, these options were not retained for further study. By the year 2035, only one of
the zones in the study corridor will meet the ITE threshold for commuter rail, and none of the zones
meet the ITE threshold for local bus service (see Table 23). A couple of the zones are forecast to meet
the MTA guidelines for transit service by the year 2035, but overall, this corridor is not forecast to
have the density levels required to support transit service.
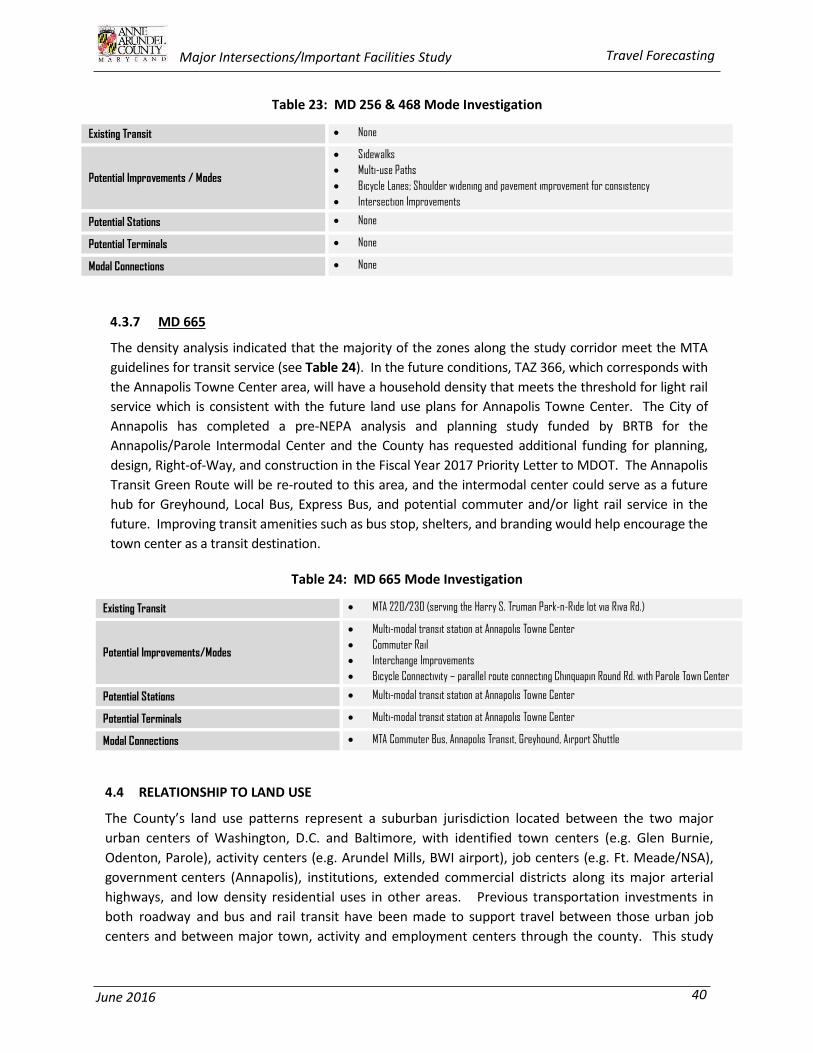
40 June 2016
Major Intersections/Important Facilities Study Travel Forecasting
Table 23: MD 256 & 468 Mode Investigation
Existing Transit None
Potential Improvements / Modes
Sidewalks
Multi-use Paths
Bicycle Lanes; Shoulder widening and pavement improvement for consistency
Intersection Improvements
Potential Stations None
Potential Terminals None
Modal Connections None
4.3.7 MD 665
The density analysis indicated that the majority of the zones along the study corridor meet the MTA
guidelines for transit service (see Table 24). In the future conditions, TAZ 366, which corresponds with
the Annapolis Towne Center area, will have a household density that meets the threshold for light rail
service which is consistent with the future land use plans for Annapolis Towne Center. The City of
Annapolis has completed a pre-NEPA analysis and planning study funded by BRTB for the
Annapolis/Parole Intermodal Center and the County has requested additional funding for planning,
design, Right-of-Way, and construction in the Fiscal Year 2017 Priority Letter to MDOT. The Annapolis
Transit Green Route will be re-routed to this area, and the intermodal center could serve as a future
hub for Greyhound, Local Bus, Express Bus, and potential commuter and/or light rail service in the
future. Improving transit amenities such as bus stop, shelters, and branding would help encourage the
town center as a transit destination.
Table 24: MD 665 Mode Investigation
Existing Transit MTA 220/230 (serving the Harry S. Truman Park-n-Ride lot via Riva Rd.)
Potential Improvements/Modes
Multi-modal transit station at Annapolis Towne Center
Commuter Rail
Interchange Improvements
Bicycle Connectivity – parallel route connecting Chinquapin Round Rd. with Parole Town Center
Potential Stations Multi-modal transit station at Annapolis Towne Center
Potential Terminals Multi-modal transit station at Annapolis Towne Center
Modal Connections MTA Commuter Bus, Annapolis Transit, Greyhound, Airport Shuttle
4.4 RELATIONSHIP TO LAND USE
The County’s land use patterns represent a suburban jurisdiction located between the two major
urban centers of Washington, D.C. and Baltimore, with identified town centers (e.g. Glen Burnie,
Odenton, Parole), activity centers (e.g. Arundel Mills, BWI airport), job centers (e.g. Ft. Meade/NSA),
government centers (Annapolis), institutions, extended commercial districts along its major arterial
highways, and low density residential uses in other areas. Previous transportation investments in
both roadway and bus and rail transit have been made to support travel between those urban job
centers and between major town, activity and employment centers through the county. This study

41 June 2016
Major Intersections/Important Facilities Study Travel Forecasting
reflects both current and future travel demand through, into, within and out of the county, as well as
the impact of roadway widening and introduction of other modes of travel in each of these corridors.
The impact of proposed roadway and/or transit improvements on adjacent land uses in terms of
density and activities, right-of-way availability, connectivity to existing transit/bicycle and pedestrian
facilities, supporting infrastructure (park & ride lots, transit stations) is considered and evaluated at a
county and regional context.
4.5 TRAVEL FORECASTS AND LEVEL OF SERVICE
4.5.1 CLRP Plan Scenario
The current Constrained Long-Range Plan (CLRP) scenario represents the future “no-build” year 2035 condition for this analysis; and represents:
Existing highway and transit networks
Highway and transit projects currently under construction
Planned highway and transit projects in CLRP
This scenario includes all CLRP projects within Anne Arundel County, and major CLRP projects in
neighboring jurisdictions. There were no CLRP projects in any of the seven study corridors. This
scenario was the pivot-point in which other forecasts were compared. An illustration of the CLRP
network from Maximize 2040 is shown in Figure 10.
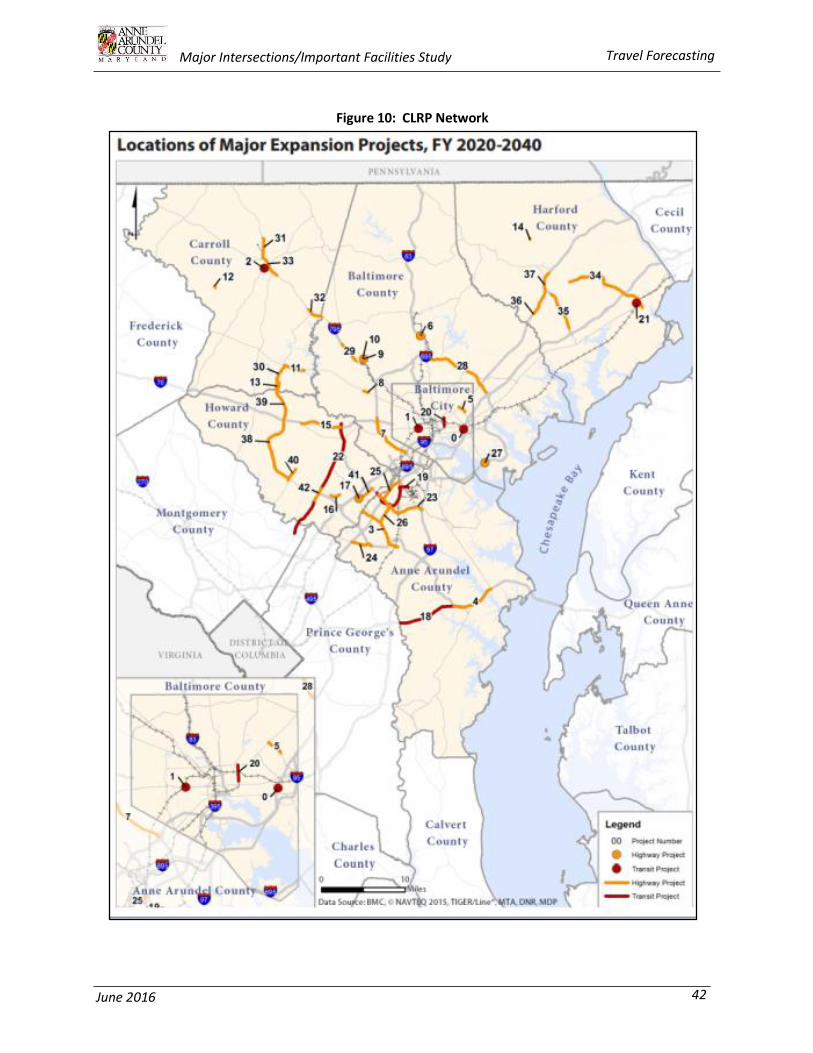
42 June 2016
Major Intersections/Important Facilities Study Travel Forecasting
Figure 10: CLRP Network

43 June 2016
Major Intersections/Important Facilities Study Travel Forecasting
4.6 BUILD SCENARIO
The Build Scenario included the CLRP network plus the roadway widening of College Parkway from two to four lanes from west of Jones Station Road to MD 179 and MD 177 from Jumpers Hole Road to Waterford Road. Only the roadway widening improvements were modeled as regional travel demand models do not explicitly model intersection improvements, bicycle lanes, or sidewalks.
4.7 SUMMARY OF FORECASTS
During the analysis of the results of the No Build (CLRP) and Build (CLRP + widening), the following findings were derived:
Widening the section of College Parkway between Bay Dale Drive and MD 179 would improve
the Level of Service to A in the year 2035 compared to LOS F conditions in the No Build
conditions.
Widening the section of MD 177 from Jumpers Hole Road to Waterford Road would improve
the Level of Service to B in the year 2035 compared to LOS F conditions in the No Build
conditions.
4.7.1 College Parkway
Without any improvement along College Parkway (No Build) growth in daily traffic volumes averages
6% for the study corridor. With the roadway widening the growth in traffic volumes would still
average 6% or 0.4% annually; indicating this widening would not induce additional vehicle trips unless
the land use forecasts along the corridor are changed in the future.
4.7.2 Forest Drive
No roadway capacity or major transit improvements were recommended for the Forest Drive
corridor. Therefore, the Build and No Build forecasts are statistically equal with only minor changes
in volume between the scenarios resulting from the equilibrium assignment instability. Growth in
daily traffic volumes along this corridor ranges from 12% (east of Chinquapin Round Road) to 7%
(west of Bay Ridge Avenue). Overall, the average growth along the corridor segments is 9.9%, or 0.3%
annually.
4.7.3 MD 173
No roadway capacity or major transit improvements were recommended for the MD 173 (Fort
Smallwood Road) corridor. Therefore, the Build and No Build forecasts are statistically equal with
only minor changes in volume between the scenarios resulting from the equilibrium assignment
instability. ADT growth along this corridor is 15% (between MD 607 and Bayside Beach Road) 0.5%
annually.
4.7.4 MD 177
Without any additional improvements in the corridor (No Build Scenario), growth in daily traffic
volumes along this corridor ranges from 5% (east of Edwin Raynor) to 56% (east of Jumpers Hole).
Overall, the average growth along the corridor segments is 17.5%, or 0.54% annually. With the

44 June 2016
Major Intersections/Important Facilities Study Travel Forecasting
capacity improvements in the Build scenario, the volumes on that link segment would increase by
10% while the adjacent link segments would remain similar to the No Build conditions. Overall the
volumes along the corridor segments are increased by 2.4% in the Build scenario when compared to
the No Build Scenario. The ADT growth with the capacity improvement would increase to 72% or
1.84% annually.
4.7.5 MD 214
No roadway capacity or major transit improvements were recommended for the MD 214 (Central
Avenue) corridor. Therefore, the Build and No Build forecasts are statistically equal with only minor
changes in volume between the scenarios resulting from the equilibrium assignment instability. ADT
growth along this corridor ranges from 8% (east of MD 2) to 15% (east of MD 424).
4.7.6 MD 256 & MD 468
No roadway capacity or major transit improvements were recommended for the MD 256/468
corridor. Therefore, the Build and No Build forecasts are statistically equal with only minor changes
in volume between the scenarios resulting from the equilibrium assignment instability. ADT growth
along this corridor ranges from 11% (east of MD 2) to 19% (south of MD 468). Overall, the average
growth rate along this corridor is 19% or 0.6% annually.
4.7.7 MD 665
No capacity or major transit improvements were recommended for the MD 665 corridor. Therefore,
the Build and No Build forecasts are statistically equal with only minor changes in volume between
the scenarios resulting from the equilibrium assignment instability. ADT growth along this corridor
ranges from 20% (east of MD 2) to 28% (east of Riva Road). Overall, the average growth rate along
this corridor is 25.6% or 0.76% annually.
Detailed corridor-by-corridor forecasts are summarized in Figures 11 through 19.
4.8 SUMMARY OF NO BUILD AND BUILD LEVEL OF SERVICE
Generally, where roadway widening projects were planned (MD 177 and College Parkway), the
portions of those roadways widened showed improved level of service in relation to the No-Build
future condition.

Major Intersections/Important Facilities Study Travel Forecasting
45 June 2016
Figure 11: College Parkway 2035 AADT and LOS
Figure 12: College Parkway 2035 AADT and LOS with Roadway Widening
Figure 13: Forest Drive 2035 AADT and LOS
College Pkwy
V/C 0.75 V/C 1.10 V/C 0.39
Forecast Volume 30133 21965 7726
LOS B* LOS F LOS A
MD 2 Bay Dale Dr MD 179
*Note; This LOS applies specifically to the section of College Parkway between MD 2 to just west of Jones Station
College Pkwy
V/C 0.75 V/C 0.57 V/C 0.39
Forecast Volume 30116 22700 7726
LOS B LOS A LOS A
MD 2 Bay Dale Dr MD 179

Major Intersections/Important Facilities Study Travel Forecasting
46 June 2016
Figure 14: MD 173 2035 AADT and LOS
Figure 15: MD 177 2035 AADT and LOS
MD 173
V/C 0.54 V/C 0.87 V/C 0.82
Forecast Volume 10822 17390 16392
LOS A LOS D LOS C
MD 607 Bayside Beach Rd
(zone 325)
MD 177 MD 177
V/C 0.23 V/C 0.65 V/C 1.31 V/C 0.81
17314 32457 32699 20133
LOS A LOS A LOS F LOS C
MD 2 MD 10 Jumpers Hole Rd MD 648
Forecast Volume
MD 177 MD 177
V/C 0.81 V/C 0.63 V/C 0.42 V/C 0.63 V/C 0.78
20133 15786 10390 15702 29295
LOS C LOS A LOS A LOS A LOS B
Catherine Ave Edwin Raynor Blvd MD 607 MD 100
Match
line
Match
line

Major Intersections/Important Facilities Study Travel Forecasting
47 June 2016
Figure 16: MD 177 2035 AADT and LOS with Roadway Widening
Figure 17: MD 214 2035 AADT and LOS
MD 177 MD 177
V/C 0.23 V/C 0.65 V/C 0.72 V/C 0.84
17314 32457 36094 20962
LOS A LOS A LOS B LOS C
MD 2 MD 10 Jumpers Hole Rd MD 648
Forecast Volume
MD 177 MD 177
V/C 0.84 V/C 0.63 V/C 0.42 V/C 0.63 V/C 0.78
20962 15786 10390 15702 29295
LOS C LOS A LOS A LOS A LOS B
Catherine Ave Edwin Raynor Blvd MD 607 MD 100
Match
line
Match
line
Mayo Rd Shoreham Beach Rd
Zone 411
MD 214
V/C 0.54 V/C 0.64 V/C 0.99 V/C 0.78 V/C 0.78
Forecast Volume 13410 31752 24797 19412 15593 Zone 412
LOS A LOS A LOS E LOS B LOS B
MD 2 MD 468
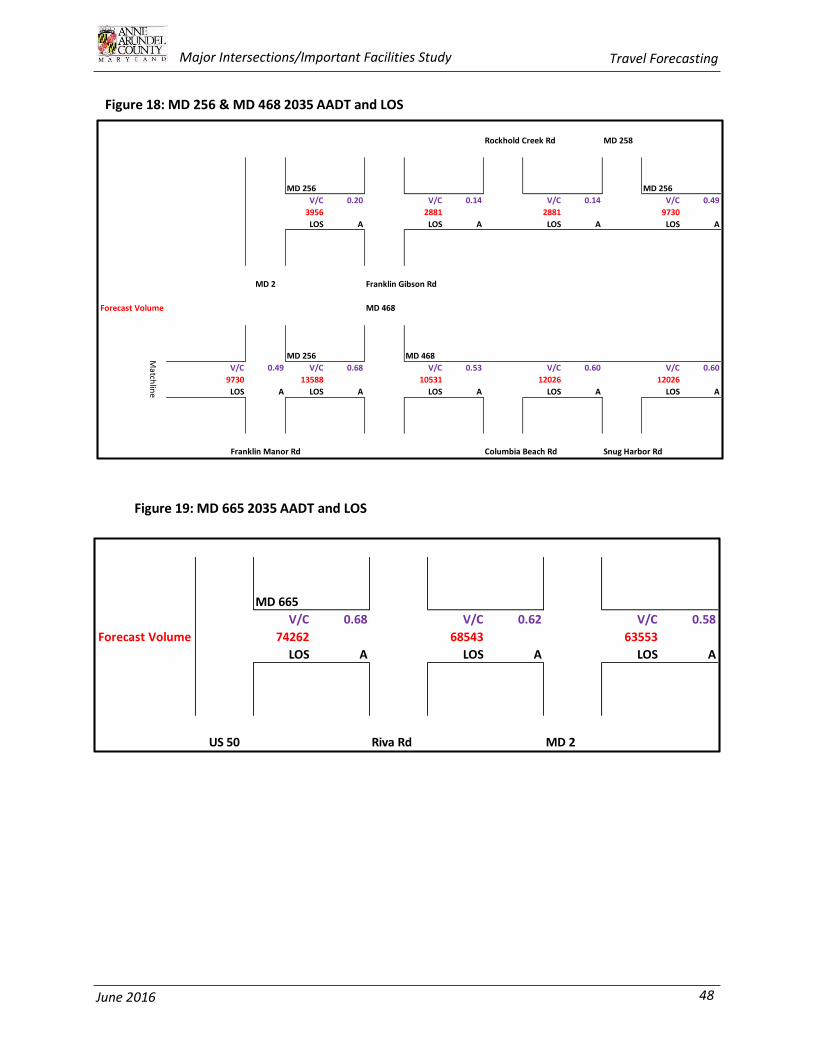
Major Intersections/Important Facilities Study Travel Forecasting
48 June 2016
Figure 18: MD 256 & MD 468 2035 AADT and LOS
Figure 19: MD 665 2035 AADT and LOS
Rockhold Creek Rd MD 258
MD 256 MD 256
V/C 0.20 V/C 0.14 V/C 0.14 V/C 0.49
3956 2881 2881 9730
LOS A LOS A LOS A LOS A
MD 2 Franklin Gibson Rd
Forecast Volume MD 468
MD 256 MD 468
V/C 0.49 V/C 0.68 V/C 0.53 V/C 0.60 V/C 0.60
9730 13588 10531 12026 12026
LOS A LOS A LOS A LOS A LOS A
Franklin Manor Rd Columbia Beach Rd Snug Harbor Rd
Match
line
MD 665
V/C 0.68 V/C 0.62 V/C 0.58
Forecast Volume 74262 68543 63553
LOS A LOS A LOS A
US 50 Riva Rd MD 2

49 June 2016
Major Intersections/Important Facilities Study Corridor Toolbox Strategies
CHAPTER 5: CORRIDOR TOOLBOX STRATEGIES
5.1 TOOLBOX STRATEGIES
The discussion of toolbox strategies focuses on short-term day-to-day strategies to enhance
roadway/traffic operations as well as better manage the demand for travel on the roadway
network. The two types of toolbox strategies include Transportation System Management and
Transportation Demand Management. Descriptions of a range of measures are presented for each
category, followed by specific applications for each study corridor.
5.1.1 System Management Strategies
Transportation system management (TSM) strategies are improvements that enhance operations of
the existing transportation network without directly providing increased roadway capacity through
traditional strategies such as roadway widening (see Appendix M). Through better management of
the transportation network and traffic control systems, traffic can flow more efficiently without the
provision of any additional roadway capacity.
5.1.1.1 Signal System Operations
Signal retiming has significant benefits for the traveling public. One of the direct benefits is the reduced
delay experienced by motorists. Delay savings are more apparent for motorists traveling along
coordinated signalized arterials. Motorists experience fewer stops and reduced fuel consumption.
Apart from the direct benefits, there also is a general public perception of reduced delay during travel.
A side benefit may be reduced motorist frustration and improved safety.
Traffic responsive signal control that adjusts signal timing parameters such as cycle lengths, in real-
time has the ability to improve traffic operations when compared to traditional fixed-time control
systems. These systems use vehicle detection to manage signal coordination designed to optimize
flow throughout the roadway network. Different measures of effectiveness such as optimal travel
time on the mainline or reduced overall delay can be targeted depending on the priorities of the
area or corridor. The County currently has adaptive control on several corridors, such as Riva
Road Jennifer Road and Forest Drive, and the State is considering several more.

50 June 2016
Major Intersections/Important Facilities Study Corridor Toolbox Strategies
5.1.1.2 Traveler Information and Intelligent Transportation Systems
Traveler information can be disseminated through a variety of media including variable message
boards, radio, internet, telephone, and in-vehicle or handheld navigation systems. Travelers who are
informed about weather and driving conditions, delays and detours, parking and other situations that
may affect their travel can use the information to make decisions and increase the mobility, safety,
and satisfaction of their trip.
Detection of traffic conditions and communication throughout the transportation system is the
principle behind intelligent transportation systems. It allows real-time response in the form of active
traffic management and can be used to measure the results of implemented strategies.
5.1.1.3 Event Traffic Management
Event and incident management is a specific type of traveler information that guides travelers through
hazardous or atypical situations. These could include crashes, police activity, disabled vehicles,
inclement weather, construction, or special events. There are a number of regional monitoring systems
such as the MSHA Coordinated Highways Action Response Team (CHART) currently operating in the
region that collaborate to monitor, respond, and share information across jurisdictions. The use of
devices such as Closed Circuit Television Cameras, Variable Message Signing, Highway Advisory Radio,
Roadway Weather Information Systems, and Automated Traffic Recorders are a few devices that allow
for improved monitoring and response during emergency situations, and is useful in presenting real-
time travel information such as travel times to the general public. It should also be noted that other
toolbox strategies, such as the provision of subscription bus service for special events, could also be
applied to ease congestion for major events.
5.1.1.4 Demand Management Strategies
Transportation demand management (TDM) strategies are techniques that focus on influencing driver
behavior and demand. Transportation demand derives from individual decisions based on numerous
factors such as trip purpose, available modes, distance, and costs. By shifting these factors to favor

51 June 2016
Major Intersections/Important Facilities Study Corridor Toolbox Strategies
non-auto travel for some travelers, programmatic TDM strategies have the potential to have a large
positive impact. Managing trips may include:
• Trips shifted to another mode
• Trips shifted to another time (outside of peak hour)
• Trips shifted to another route
• Trips not made
By making other options more appealing, TDM aims to sway drivers away from choosing to drive alone
during peak rush hours. 5.1.1 Bus Rapid Transit
Bus Rapid Transit (BRT) represents a shift in perception, so decision-makers recognize that buses can provide high quality service which can attract discretionary travelers (those who have alternative travel options). For many trips, BRT can provide faster and more direct service than urban rail, since routes can accommodate multiple bus routes from various destinations, reducing the need for transfers.
Bus Rapid Transit is considered a more affordable alternative to Rail for improving transit service quality and attracting travelers who would otherwise drive on congested urban corridors. It was initially implemented in less developed countries such as Brazil and Columbia during the 1990s, but the concept has become widely accepted by transportation planners and transit advocates throughout the world.
Bus Rapid Transit systems are usually implemented through a cooperative effort involving local planning agencies and transit service providers. Bus lanes and other BRT design features sometimes are incorporated into Complete Streets projects. To be effective, it requires coordination of roadway design and management, bus purchasing, transit operations, local land use planning decisions, transit marketing and TDM programs.
5.1.2 Paratransit
Paratransit is a special transportation service for people with disabilities, often provided as a supplement to fixed-route bus and rail systems by public transit agencies. Paratransit services may vary considerably on the degree of flexibility they provide their customers. At their simplest they may consist of a taxi or small bus that will run along a more or less defined route and then stop to pick up or discharge passengers on request. At the other end of the spectrum—fully demand responsive transport—the most flexible paratransit systems offer on-demand call-up door-to-door service from any origin to any destination in a service area. In addition to public transit agencies, Paratransit services are operated by community groups or not-for-profit organizations, and for-profit private companies or operators.
5.1.3 Promote Transit Use/Transit Priority
Transit has to be comfortable and convenient in order for users to perceive it as a viable mode of
transportation. Faster travel times, more frequent service, and enhanced traveler information can
encourage commuters to ride transit. Bus speeds can be improved by implementing bus priority
treatments that help buses maneuver through traffic. Queue jumps allow a bus to bypass traffic
through an intersection by accessing a restricted or underused lane. Signals can be programmed to
detect approaching buses and give them an early or extended green indication to minimize the amount
of time they spend behind traffic.

52 June 2016
Major Intersections/Important Facilities Study Corridor Toolbox Strategies
Apart from improved service which includes providing new service, reducing headways, and modifying
routes, adequate amenities for riders to improve passenger comfort both on and off transit vehicles
can also promote the use of transit. Shelters, benches, lighting, and adequate sidewalk access at
transit stops can make riding transit a more pleasant experience. Wayfinding signs in areas served by
transit, route maps at transit stops, and real-time vehicle location information (e.g. NextBus) can make
taking transit much easier for those unfamiliar with the service.
5.1.4 Promote Carpooling
By having more people using one vehicle, carpooling reduces each person’s travel costs and results
in less demand for roadway space. Carpooling can be promoted through a variety of ways including
tolling on select travel lanes, designated high occupancy vehicle lanes, parking priority, or direct
financial incentives that can be applied at many levels. Car sharing, such as Zip Car, also falls under this
category. It should be noted that the County currently promotes rideshare programs through two
separate Transportation Management Associations (TMA): the BWI business Partnership and the
Annapolis Regional Transportation Management Association, who are affiliated with the business
communities of West County and the Annapolis area. The expansion of these TMAs and creation of
new TMAs are encouraged.
5.1.5 Employer Based Incentives
Employers can help employees form vanpools through rideshare matching. Rideshare matching helps
potential vanpoolers locate others nearby with similar schedules. Regional rideshare services in most
areas allow interested employees to register for matching services directly at no cost. Employers can
direct their employees to these free
services. Rideshare agencies can also
help organize vanpools directly with
employees.
Employees realize a variety of
benefits from vanpooling including
cost savings, decreased vehicle wear
and tear, time savings in regions with
HOV lanes, and the ability to talk,
eat, sleep, or read while commuting.
Vanpool participants report saving up
to $3,000 or more a year on gas, car maintenance, and wear and tear as well as reduced stress and
commuting time. The primary employer advantage is the need for fewer parking spaces; other
advantages include less employee stress and improved productivity.

53 June 2016
Major Intersections/Important Facilities Study Corridor Toolbox Strategies
5.1.6 Alternative Work Schedule Arrangement
Alternative work arrangements could be established and encouraged to allow employees greater
flexibility. Flexible work hours reduce traffic volume and congestion during peak times by shifting
drivers’ commutes to less congested periods. Flexible schedules and staggered work hours help increase
productivity and reduce costs of overtime and sick leave for businesses. The reduced road and parking
lot congestion minimizes wasted time and frustration. Also, the flexible work hours allow workers to
determine their own schedule at times, and build their work hours around other appointments that may
typically result in absences.
5.1.7 Pedestrian and Bicycle Enhancements
Creating a bicycle network and roadways with bicycle compatibility can be accomplished in several
measures: Bicycle Routes: Installing signs and pavement markings that designate bike routes on the street
in a shared lane arrangement with vehicles.
Bicycle Lanes: Creating exclusive right-of-way through the use of pavement markings along a
roadway. These lanes can be adjacent to a vehicle lane or can be separated by a physical
barrier for enhanced safety and comfort.
Bicycle Trails: Can include shared use paths along a roadway or an off-street path or trails.
Each is appropriate in different circumstances but
have similar goals of promoting the use of public
roadway space for modes other than vehicles
and guiding cyclists through convenient routes
and making them feel safe and comfortable while
riding. Pedestrian enhancements can include new or
widened sidewalks, improving ADA compliance,
implementing audible and accessible pedestrian
indication signals, implementing countdown timers
for pedestrians, and providing well-maintained and
well-lit sidewalks. These enhancements make a
pedestrian facility more accessible and attractive.
Both pedestrian and bicycle enhancements should
aim to improve connections to other modes of
transportation– especially so that transit riders can
complete their trips safely and conveniently.
Additionally, adequate design of bicycle and
pedestrian facilities will encourage more people to
take advantage of them.

54 June 2016
Major Intersections/Important Facilities Study Corridor Toolbox Strategies
5.1.8 Traffic Calming
Traffic calming consists of using physical, regulatory, or enforcement measures to either control speed
or manage traffic volume on a particular street. Typical devices may include chokers, chicanes, speed
humps, or roundabouts. Additionally, access restrictions to particular streets at certain points and
times of day can be implemented to discourage through trips and reduce traffic volumes where
appropriate. 5.1.9 Complete Streets
The County developed Complete Streets guidance in 2013 using the MD 648/Baltimore-Annapolis Road
corridor as a case study. The emphasis of this guidance was on creating truly multi-modal arterial
environments. Complete Streets policies also emphasize the development of parallel facilities in
congested areas, particularly areas with a large number of access points on the primary highway. By
developing lower functional class roadways parallel to the primary highway, short distance trips and/or
trips destined to shopping or office developments can be diverted away from the primary highway
which reduces demand and improves traffic flow on the primary highway by removing large numbers
of turning vehicles at driveways. The lower functional class parallel routes can also be used for the
development of bicycle routes, as these roadways would have lower volumes and design speeds than
primary highways and serve as a safer environment for bicyclists. Other important benefits of a
Complete Streets network are that the additional network redundancy can reduce the impacts of non-
recurring congestion on the primary arterial (i.e. congestion occurring from traffic accidents,
breakdowns, construction delays), improve access for emergency vehicles during peak periods, and
provide additional roadway capacity for emergency evacuations. Complete Streets policies also aid the
development of access management plans on primary corridors as access can be provided to retail and
office areas from the secondary routes. 5.1.10 Access Management
Access Management involves changing roadway designs and land use development patterns to limit
the number of driveways and intersections on arterials and highways, constructing medians to control
turning movements, encouraging Clustered development, creating more pedestrian-oriented
Streetscapes, improved Connectivity, and Road Space Reallocation to encourage efficiency. Although
Access Management is primarily intended to improve motor vehicle traffic flow, it can support Travel
Demand Management by integrating transportation and land use planning, and by improving
Transportation options. It can help convert automobile-oriented strip development into more
Accessible land use patterns that are better suited to walking, cycling and public transit.
Below are ten access management strategies (CUTR 1998; Dixon, Yi and Brown 2012).
1. Lay the foundation for access management in your local comprehensive plan.
2. Limit the number of driveways per lot (generally, one per parcel).
3. Locate driveways away from intersections.
4. Connect parking lots and consolidate driveways (so vehicles can travel between parcels without
reentering an arterial).
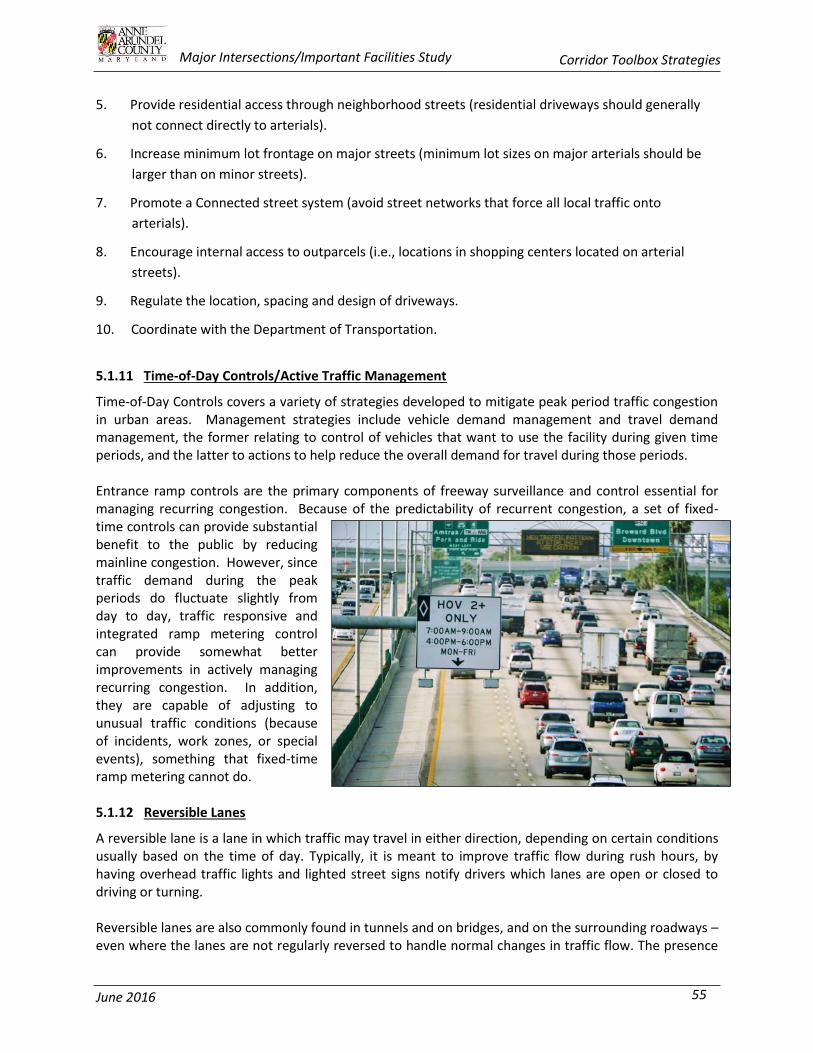
55 June 2016
Major Intersections/Important Facilities Study Corridor Toolbox Strategies
5. Provide residential access through neighborhood streets (residential driveways should generally
not connect directly to arterials).
6. Increase minimum lot frontage on major streets (minimum lot sizes on major arterials should be
larger than on minor streets).
7. Promote a Connected street system (avoid street networks that force all local traffic onto
arterials).
8. Encourage internal access to outparcels (i.e., locations in shopping centers located on arterial
streets).
9. Regulate the location, spacing and design of driveways.
10. Coordinate with the Department of Transportation.
5.1.11 Time-of-Day Controls/Active Traffic Management
Time-of-Day Controls covers a variety of strategies developed to mitigate peak period traffic congestion in urban areas. Management strategies include vehicle demand management and travel demand management, the former relating to control of vehicles that want to use the facility during given time periods, and the latter to actions to help reduce the overall demand for travel during those periods. Entrance ramp controls are the primary components of freeway surveillance and control essential for managing recurring congestion. Because of the predictability of recurrent congestion, a set of fixed-time controls can provide substantial benefit to the public by reducing mainline congestion. However, since traffic demand during the peak periods do fluctuate slightly from day to day, traffic responsive and integrated ramp metering control can provide somewhat better improvements in actively managing recurring congestion. In addition, they are capable of adjusting to unusual traffic conditions (because of incidents, work zones, or special events), something that fixed-time ramp metering cannot do. 5.1.12 Reversible Lanes
A reversible lane is a lane in which traffic may travel in either direction, depending on certain conditions usually based on the time of day. Typically, it is meant to improve traffic flow during rush hours, by having overhead traffic lights and lighted street signs notify drivers which lanes are open or closed to driving or turning. Reversible lanes are also commonly found in tunnels and on bridges, and on the surrounding roadways – even where the lanes are not regularly reversed to handle normal changes in traffic flow. The presence

56 June 2016
Major Intersections/Important Facilities Study Corridor Toolbox Strategies
of lane controls allows authorities to close or reverse lanes when unusual circumstances (such as construction or a traffic mishap) requires the use of fewer or more lanes to maintain the orderly flow of traffic. Some more recent implementations of reversible lanes use a movable barrier to establish a physical separation between allowed and disallowed lanes of travel. The Dallas I-30 HOV lanes are an example of this system being implemented in the U.S. In some systems, a concrete barrier is moved during low-traffic periods to switch a central lane from one side of the road to another; some examples are the five-lane San Diego-Coronado Bay Bridge in San Diego, California, the seven-lane Tappan Zee Bridge on the Hudson River in New York and the eight-lane Auckland Harbour Bridge across the Waitemata Harbour in Auckland, New Zealand. Other systems use retractable cones or bollards which are built into the road, or retractable fences which can divert traffic from a reversible ramp. The two center lanes of the six-lane Golden Gate Bridge are reversible; they are southbound during morning rush hour and northbound at evening rush hour. Prior to the installation of a movable median barrier in January 2015, they were demarcated by vertical yellow markers placed manually in sockets in the roadway. Many urban freeways have entirely separate carriageways (and connecting ramps) to hold reversible lanes (the reversible lanes in such a configuration are often referred to as "express lanes"). Generally, traffic flows in one direction or another in such a configuration (or not at all); the carriageways are not "split" into two-lane roadways during non-rush periods. Typically, this sort of express lane will have fewer interchanges than the primary lanes, and many such roadways only provide on ramps for inbound traffic, and off ramps for outbound traffic. This is the case with the I-395 HOT lanes in Northern Virginia.
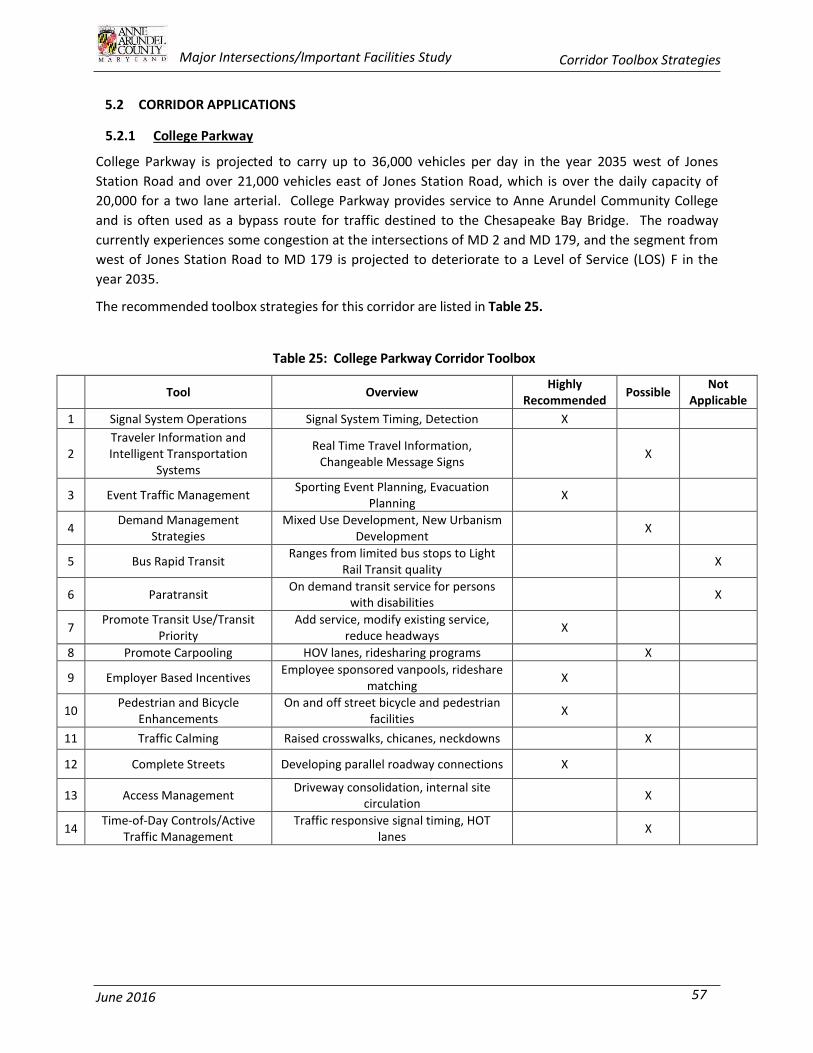
57 June 2016
Major Intersections/Important Facilities Study Corridor Toolbox Strategies
5.2 CORRIDOR APPLICATIONS
5.2.1 College Parkway
College Parkway is projected to carry up to 36,000 vehicles per day in the year 2035 west of Jones
Station Road and over 21,000 vehicles east of Jones Station Road, which is over the daily capacity of
20,000 for a two lane arterial. College Parkway provides service to Anne Arundel Community College
and is often used as a bypass route for traffic destined to the Chesapeake Bay Bridge. The roadway
currently experiences some congestion at the intersections of MD 2 and MD 179, and the segment from
west of Jones Station Road to MD 179 is projected to deteriorate to a Level of Service (LOS) F in the
year 2035.
The recommended toolbox strategies for this corridor are listed in Table 25.
Table 25: College Parkway Corridor Toolbox
Tool Overview Highly
Recommended Possible
Not Applicable
1 Signal System Operations Signal System Timing, Detection X
2 Traveler Information and Intelligent Transportation
Systems
Real Time Travel Information, Changeable Message Signs
X
3 Event Traffic Management Sporting Event Planning, Evacuation
Planning X
4 Demand Management
Strategies Mixed Use Development, New Urbanism
Development X
5 Bus Rapid Transit Ranges from limited bus stops to Light
Rail Transit quality X
6 Paratransit On demand transit service for persons
with disabilities X
7 Promote Transit Use/Transit
Priority Add service, modify existing service,
reduce headways X
8 Promote Carpooling HOV lanes, ridesharing programs X
9 Employer Based Incentives Employee sponsored vanpools, rideshare
matching X
10 Pedestrian and Bicycle
Enhancements On and off street bicycle and pedestrian
facilities X
11 Traffic Calming Raised crosswalks, chicanes, neckdowns X
12 Complete Streets Developing parallel roadway connections X
13 Access Management Driveway consolidation, internal site
circulation X
14 Time-of-Day Controls/Active
Traffic Management Traffic responsive signal timing, HOT
lanes X

58 June 2016
Major Intersections/Important Facilities Study Corridor Toolbox Strategies
5.2.2 Forest Drive
Forest Drive is projected to carry up to 40,000 vehicles per day east of Spa Road and over 60,000
vehicles per day between Hilltop Lane and Chinquapin Round Road in 2035. It provides an important
connection from a number of peninsula areas of the County to MD 665, US 50 and the rest of the
Baltimore/Washington region. This roadway experiences congestion between Chinquapin Round Road
and Hilltop Lane, as a number of shopping centers are located on the south side of Forest Drive east of
Chinquapin Round Road. This leads to large numbers of turning vehicles, which lead to additional delays
in the corridor.
The recommended toolbox strategies for this corridor are listed in Table 26.
Table 26: Forest Drive Corridor Toolbox
Tool Overview Highly
Recommended Possible
Not Applicable
1 Signal System Operations Signal System Timing, Detection X
2 Traveler Information and Intelligent Transportation
Systems
Real Time Travel Information, Changeable Message Signs
X
3 Event Traffic Management Sporting Event Planning, Evacuation
Planning X
4 Demand Management
Strategies Mixed Use Development, New Urbanism
Development X
5 Bus Rapid Transit Ranges from limited bus stops to Light
Rail Transit quality X
6 Paratransit On demand transit service for persons
with disabilities X
7 Promote Transit Use/Transit
Priority Add service, modify existing service,
reduce headways X
8 Promote Carpooling HOV lanes, ridesharing programs X
9 Employer Based Incentives Employee sponsored vanpools, rideshare
matching X
10 Pedestrian and Bicycle
Enhancements On and off street bicycle and pedestrian
facilities X
11 Traffic Calming Raised crosswalks, chicanes, neckdowns X
12 Complete Streets Developing parallel roadway connections X
13 Access Management Driveway consolidation, internal site
circulation X
14 Time-of-Day Controls/Active
Traffic Management Traffic responsive signal timing, HOT
lanes X
15 Reversible Lanes Using one or more travel lanes for
multiple directions depending on time of day
X

59 June 2016
Major Intersections/Important Facilities Study Corridor Toolbox Strategies
5.2.3 MD 173
MD 173 is projected to carry over 17,000 vehicles per day by 2035. It serves local peninsula area traffic
primarily. The corridor is currently not experiencing congestion throughout its entire length during
both the morning and afternoon peak periods. Congestion during special events at the pier located at
the end of the corridor was cited as a concern during the March 2016 public meeting.
The recommended toolbox strategies for this corridor are shown in Table 27.
Table 27: MD 173 Corridor Toolbox
Tool Overview Highly
Recommended Possible
Not Applicable
1 Signal System Operations Signal System Timing, Detection X
2 Traveler Information and Intelligent Transportation
Systems
Real Time Travel Information, Changeable Message Signs
X
3 Event Traffic Management Sporting Event Planning, Evacuation
Planning X
4 Demand Management
Strategies Mixed Use Development, New Urbanism
Development X
5 Bus Rapid Transit Ranges from limited bus stops to Light
Rail Transit quality X
6 Paratransit On demand transit service for persons
with disabilities X
7 Promote Transit Use/Transit
Priority Add service, modify existing service,
reduce headways X
8 Promote Carpooling HOV lanes, ridesharing programs X
9 Employer Based Incentives Employee sponsored vanpools, rideshare
matching X
10 Pedestrian and Bicycle
Enhancements On and off street bicycle and pedestrian
facilities X
11 Traffic Calming Raised crosswalks, chicanes, neckdowns X
12 Complete Streets Developing parallel roadway connections X
13 Access Management Driveway consolidation, internal site
circulation X
14 Time-of-Day Controls/Active
Traffic Management Traffic responsive signal timing, HOT
lanes X
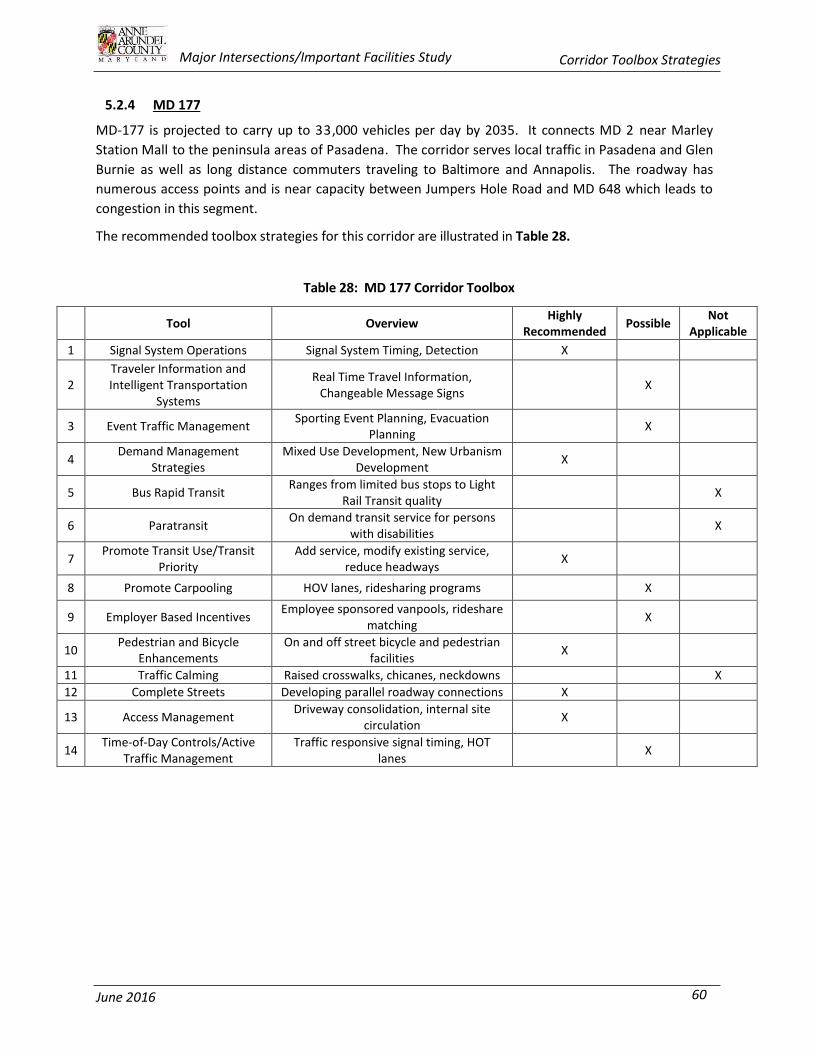
60 June 2016
Major Intersections/Important Facilities Study Corridor Toolbox Strategies
5.2.4 MD 177
MD-177 is projected to carry up to 33,000 vehicles per day by 2035. It connects MD 2 near Marley
Station Mall to the peninsula areas of Pasadena. The corridor serves local traffic in Pasadena and Glen
Burnie as well as long distance commuters traveling to Baltimore and Annapolis. The roadway has
numerous access points and is near capacity between Jumpers Hole Road and MD 648 which leads to
congestion in this segment.
The recommended toolbox strategies for this corridor are illustrated in Table 28.
Table 28: MD 177 Corridor Toolbox
Tool Overview Highly
Recommended Possible
Not Applicable
1 Signal System Operations Signal System Timing, Detection X
2 Traveler Information and Intelligent Transportation
Systems
Real Time Travel Information, Changeable Message Signs
X
3 Event Traffic Management Sporting Event Planning, Evacuation
Planning X
4 Demand Management
Strategies Mixed Use Development, New Urbanism
Development X
5 Bus Rapid Transit Ranges from limited bus stops to Light
Rail Transit quality X
6 Paratransit On demand transit service for persons
with disabilities X
7 Promote Transit Use/Transit
Priority Add service, modify existing service,
reduce headways X
8 Promote Carpooling HOV lanes, ridesharing programs X
9 Employer Based Incentives Employee sponsored vanpools, rideshare
matching X
10 Pedestrian and Bicycle
Enhancements On and off street bicycle and pedestrian
facilities X
11 Traffic Calming Raised crosswalks, chicanes, neckdowns X
12 Complete Streets Developing parallel roadway connections X
13 Access Management Driveway consolidation, internal site
circulation X
14 Time-of-Day Controls/Active
Traffic Management Traffic responsive signal timing, HOT
lanes X

61 June 2016
Major Intersections/Important Facilities Study Corridor Toolbox Strategies
5.2.5 MD 214
MD 214 is projected to carry up to 27,000 vehicles per day by 2035. MD 214 provides an essential link
between the Edgewater area to the rest of the County and the Washington D.C. region. It serves local
traffic in Edgewater as well as commuters traveling to job centers in Washington D.C., Fort Meade, the
NSA, and Annapolis. The corridor currently experiences congestion at the intersection of MD 468;
however, this section is programmed for a capacity improvement which will mitigate this congestion in
the future.
The recommended toolbox strategies for this corridor are shown in Table 29.
Table 29: MD 214/Central Avenue Corridor Toolbox
Tool Overview Highly
Recommended Possible
Not Applicable
1 Signal System Operations Signal System Timing, Detection X
2 Traveler Information and Intelligent Transportation
Systems
Real Time Travel Information, Changeable Message Signs
X
3 Event Traffic Management Sporting Event Planning, Evacuation
Planning X
4 Demand Management
Strategies Mixed Use Development, New Urbanism
Development X
5 Bus Rapid Transit Ranges from limited bus stops to Light
Rail Transit quality X
6 Paratransit On demand transit service for persons
with disabilities X
7 Promote Transit Use/Transit
Priority Add service, modify existing service,
reduce headways X
8 Promote Carpooling HOV lanes, ridesharing programs X
9 Employer Based Incentives Employee sponsored vanpools, rideshare
matching X
10 Pedestrian and Bicycle
Enhancements On and off street bicycle and pedestrian
facilities X
11 Traffic Calming Raised crosswalks, chicanes, neckdowns X
12 Complete Streets Developing parallel roadway connections X
13 Access Management Driveway consolidation, internal site
circulation X
14 Time-of-Day Controls/Active
Traffic Management Traffic responsive signal timing, HOT
lanes X

62 June 2016
Major Intersections/Important Facilities Study Corridor Toolbox Strategies
5.2.6 MD 256 & MD 468
MD 256 & MD 468 are projected to carry up to 13,000 vehicles per day by 2035. This corridor
provides an essential link between the Shady Side and Deale peninsula areas to MD 2. It serves local
traffic in these areas primarily. The corridor currently does not experience peak hour congestion.
The recommended toolbox strategies for this corridor are shown in Table 30.
Table 30: MD 256 & MD 468 Corridor Toolbox
Tool Overview Highly
Recommended Possible
Not Applicable
1 Signal System Operations Signal System Timing, Detection X
2 Traveler Information and Intelligent Transportation
Systems
Real Time Travel Information, Changeable Message Signs
X
3 Event Traffic Management Sporting Event Planning, Evacuation
Planning X
4 Demand Management
Strategies Mixed Use Development, New Urbanism
Development X
5 Bus Rapid Transit Ranges from limited bus stops to Light
Rail Transit quality X
6 Paratransit On demand transit service for persons
with disabilities X
7 Promote Transit Use/Transit
Priority Add service, modify existing service,
reduce headways X
8 Promote Carpooling HOV lanes, ridesharing programs X
9 Employer Based Incentives Employee sponsored vanpools, rideshare
matching X
10 Pedestrian and Bicycle
Enhancements On and off street bicycle and pedestrian
facilities X
11 Traffic Calming Raised crosswalks, chicanes, neckdowns X
12 Complete Streets Developing parallel roadway connections X
13 Access Management Driveway consolidation, internal site
circulation X
14 Time-of-Day Controls/Active
Traffic Management Traffic responsive signal timing, HOT
lanes X

63 June 2016
Major Intersections/Important Facilities Study Corridor Toolbox Strategies
5.2.7 MD 665
MD 665 is projected to carry over 65,000 vehicles per day by 2035. This corridor provides an
essential link between Forest Drive and US 50/I-97. It serves a combination local and regional traffic in
these areas including commuters to and from Annapolis, Baltimore, Fort Meade/NSA, and Washington,
D.C. The corridor experiences peak hour congestion associated with queuing and weaving conditions
on US 50.
The recommended toolbox strategies for this corridor are shown in Table 31.
Table 31: MD 665 Corridor Toolbox
Tool Overview Highly
Recommended Possible
Not Applicable
1 Signal System Operations Signal System Timing, Detection X
2 Traveler Information and Intelligent Transportation
Systems
Real Time Travel Information, Changeable Message Signs
X
3 Event Traffic Management Sporting Event Planning, Evacuation
Planning X
4 Demand Management
Strategies Mixed Use Development, New Urbanism
Development X
5 Bus Rapid Transit Ranges from limited bus stops to Light
Rail Transit quality X
6 Paratransit On demand transit service for persons
with disabilities X
7 Promote Transit Use/Transit
Priority Add service, modify existing service,
reduce headways X
8 Promote Carpooling HOV lanes, ridesharing programs X
9 Employer Based Incentives Employee sponsored vanpools, rideshare
matching X
10 Pedestrian and Bicycle
Enhancements On and off street bicycle and pedestrian
facilities X
11 Traffic Calming Raised crosswalks, chicanes, neckdowns X
12 Complete Streets Developing parallel roadway connections X
13 Access Management Driveway consolidation, internal site
circulation X
14 Time-of-Day Controls/Active
Traffic Management Ramp metering, traffic responsive signal
timing, HOT lanes X

64 June 2016
Major Intersections/Important Facilities Study Corridor Footprint Assessment
CHAPTER 6: CORRIDOR FOOTPRINT ASSESSMENT
6.1 RECOMMENDED CROSS SECTIONS
This section illustrates and describes the potential right-of-way impacts caused by the cross-sections
footprints within the corridors recommended for physical widening improvements. New lanes,
bicycle lanes, and sidewalks are highlighted in the footprint snapshot figures. The full footprint
assessment of each corridor is included as Appendix E.
1. College Parkway. Widening from 2 to 4 lanes from west of Jones Station Road and MD 179.
2. Forest Drive. The addition of bicycle lanes between Chinquapin Round Road and Bay Ridge
Avenue.
3. MD 173. Bicycle lanes are recommended to be striped on the existing shoulders between
MD 607 and Bayside Beach Road. Therefore, there are no changes in the existing cross
section.
4. MD 177. Widening from 2 to 4 lanes between Jumpers Hole Road and Waterford Road.
5. MD 214. The addition of bicycle lanes and sidewalks from west of Pike Ridge Road to MD 468.
6. MD 256 & MD 468. Bicycle lanes are recommended to be striped on the existing shoulders
between MD 2 and Snug Harbor Road. Therefore, there are no changes in the existing cross
section.
7. MD 665. There are no proposed changes to the existing cross section.
6.2 IMPACT ASSESSMENT
County GIS data was used to compare the proposed typical cross sections through each corridor to
the existing right-of-way available in order to identify any constraints as well as any areas of
environmental sensitivity that need to be considered. Detailed right-of-way summaries are included
in Appendix E.
6.3 RIGHT-OF-WAY CONSIDERATIONS
6.3.1 College Parkway:
The width of county-owned right-of way on College Parkway ranges from 110 to 200 feet as the
County had previously planned for College Parkway to be widened to 4 lanes from west of Jones
Station Road to MD 179. The proposed cross section of College Parkway is recommended to
include an additional two 12’ travel lanes, an 18-foot median, a minimum of 5’ bicycle lanes and 5’
sidewalks in both directions, and the planned extension of the Peninsula Trail on the north side of
the roadway. Due to the large width of existing County-owned right-of-way, there are no right-of-
way impacts associated with this improvement. For a full set of plan sheets showing the entire
corridor please see Appendix P.

65 June 2016
Major Intersections/Important Facilities Study Corridor Footprint Assessment
6.3.2 Forest Drive:
Bicycle Lanes on Forest Drive: An additional 10’ of roadway would be needed to accommodate bicycle
lanes on Forest Drive. As this roadway was recently streetscaped and reconstructed by the county, the
bicycle lanes on this corridor would be implemented on a future reconstruction project which would
likely not occur in the next 25 years given the typical lifecycle of highway projects.
The footprint assessment for Forest Drive illustrates that there would be right-of-way impacts at
multiple locations along the corridor when bicycle lanes are added on a future reconstruction project. It
is highly recommended not to retrofit, or prepare a separate PS&E exclusively for bicycle lanes given the
cost of roadway reconstruction which was just encumbered by the County on the recent improvements.
Figure 20 represents a snapshot of the anticipated right-of-way impacted area if these improvements
are implemented (see Appendix E for the detailed right-of-way impacts analysis). For a full set of plan
sheets showing the entire corridor please see Appendix Q.
Figure 20: Forest Drive Right-of-Way Impacts

66 June 2016
Major Intersections/Important Facilities Study Corridor Footprint Assessment
6.3.3 MD 173:
Bicycle Lanes on MD 173: Bicycle lanes would be striped on the existing shoulders of MD 173, and there would be no right-of-way impacts. 6.3.4 MD 177:
Bicycle Lanes on MD 177: The County’s “Mountain Road Study” recommended a preferred alternative cross section that included bicycle lanes as illustrated in Figure 5. This cross section would be constructed between MD 648/Waterford Road and Edwin Raynor Boulevard. The analysis from TM 4 recommended matching this proposed cross section from Edwin Raynor Boulevard to MD 100. The Mountain Road Study established the proposed right-of-way for the preferred concept and completed cost estimates including right-of-way impact analysis. Areas of right-of-way impacts were computed and categorized by adjacent land uses. The zoning categories along Mountain Road were determined using the “My Anne Arundel Zoning Viewer,” available on the County’s Office of Planning and Zoning website. The available right-of way along MD 177 varies greatly throughout the study corridor. One segment
between Woods Road and Lake Shore Drive is only 36 feet wide, which is less than the paved width of
roadway. Most sections are between 50 feet and 80 feet, depending on the turn-lane configurations.
The segment between MD 10 and MD 2 is approximately 100 feet wide. See Figure 21 for the
proposed widening from Jumpers Hole Road to MD 648/Waterford Road. Detailed right-of-way
calculations are included in Appendix E. For a full set of plan sheets showing the entire corridor
please see Appendix R.
Figure 21: MD 177 Right-of Way-Impacts
Four Lane
To improve the eastern segment of MD 177, The County’s “Mountain Road Study” recommended a

67 June 2016
Major Intersections/Important Facilities Study Corridor Footprint Assessment
three-lane preferred alternative cross section that included bicycle lanes as illustrated in Figure 5. The analysis from TM 4 recommended matching this proposed cross section from Edwin Raynor Boulevard to MD 100 as well. The MIIF Study team also recommends a narrower buffer between the proposed sidewalks and curbing, to minimize at least 6 feet of right-of-way impacts, as shown in Figure 22.
Figure 22: Proposed MD 177 Right-of-Way Impacts
Three Lane
6.3.5 MD 214:
Bicycle Lanes on MD 214: The bicycle lanes would be striped on the shoulders of MD 214 from MD 424 to Pike Ridge Road and east of MD 468. The shoulders would need to be improved to MSHA standards for bicycle lanes to safely accommodate bicycle lanes east of MD 468. The section from Pike Ridge Road to Stepneys Lane would require additional roadway surface to accommodate the bicycle lanes, and would be located inside of the right-turn lanes. Sidewalks are also recommended to be implemented within this segment. Travel Lane Extensions: The segment of MD 214 east of Stepneys Lane is recommended to be a four-lane roadway, with through lanes extended eastward to the MD 468 intersection. There would be minor right-of-way impacts on both sides of MD 214 within this segment, with several properties potentially impacted. There would also be some minor impacts in other portions of the corridor due to the shoulder/bicycle lane improvements. Figure 23 illustrates a portion of the proposed two lane concept with bicycle lanes. For a full set of plan sheets showing the entire corridor see Appendix S.

68 June 2016
Major Intersections/Important Facilities Study Corridor Footprint Assessment
Figure 23: Proposed MD 214 Right-of-Way Impacts Two Lane
6.3.6 MD 256 & MD 468:
The proposed bicycle lanes would be striped on the shoulders of MD 256/Deale Road and MD 468/Shady Side Road which would require improving the shoulders to SHA standards at some locations. There would be minor right-of-way impacts associated with these improvements, as represented in Figure 24. The recommended implementation of a roundabout (traffic circle) at the intersection of MD 2 and MD 256 would not require any right-of-way acquisition.

69 June 2016
Major Intersections/Important Facilities Study Corridor Footprint Assessment
Figure 24: MD 256 & MD 468 Right-of-Way Impacts
6.3.7 MD 665:
MD 665 was recommended for detailed study as a part of a larger US 50 corridor study. Therefore, there are no recommendations for this corridor at this time outside of future bicycle compatibility. The county is currently studying a multi-use off-road path parallel to MD 665.
6.4 ENVIRONMENTAL FEATURES
A preliminary assessment of the impact of the proposed roadway cross-sections to streams and
wetlands is summarized, based on the available County GIS mapping.
6.4.1 College Parkway:
There are two streams associated with the Magothy River that terminate just north of College
Parkway. The locations are:
east of Jones Station Road/Kimwood Road
east of Bellerive Road
The stream east of Jones Station Road terminates approximately 60’ north of College Parkway which is
beyond the limits of the widening. Therefore, this stream would not be impacted by the widening.
However, appropriate erosion control measures should be taken during construction to mitigate run-
off to this area. The stream east of Bellerive Road terminates approximately 200 feet north of
College Parkway which is also beyond the limits of the widening.

70 June 2016
Major Intersections/Important Facilities Study Corridor Footprint Assessment
6.4.2 MD 177:
There are several streams that traverse MD 177 throughout the study corridor, and a pond in close
proximity to the roadway. These include:
Stoney Creek west of Solley Road
Eli Cove Creek west of Outing Avenue
Main Creek west of MD 100
Cooks Pond is just south of MD 177 at Dock Road
Stoney Creek would be impacted by the proposed roadway widening between Jumpers Hole Road and
MD 648/Lake Waterford. The widening would likely require new box culverts at this location, and
proper planning is important to ensure this resource is not adversely affected during construction.
6.4.3 MD 214:
There are several streams that traverse MD 214 throughout the study corridor. These include:
Beards Creek east of Beards Point Road
Scotts Cove Branch west of Pike Ridge Road
Glebe Branch west of MD 468
Pooles Gut west of Shoreham Beach Road
Beards Creek and Scotts Cove Branch are west of Pike Ridge Road and would not be impacted by the
proposed bicycle lane improvements in that cross section as the bicycle lanes would be striped on
the existing shoulders. Glebe Branch will be impacted by the programmed improvements at MD 214
and MD 468. Pooles Gut is over 100 feet north of MD 214 and would not be impacted by the
proposed bicycle lanes on the shoulders.
6.4.4 MD 256 & MD 468:
There are several streams and rivers that traverse or are nearby the MD 256/468 the study corridor.
These include:
Tracy’s Creek east of Franklin Gibson Road
Rockhold Creek directly east of Tracy’s Creek
Deep Cove Creek south of MD 468 (Muddy Creek Road)
South Creek south of Shady Rest Road
The bridges over Tracy’s Creek and Rockhold Creek are recommended to have shared bike lanes as
there is not sufficient width to accommodate exclusive bike lanes. Given the low traffic volumes and
cost of bridge reconstruction, this is the most feasible approach for these segments. Deep Cove
Creek does not impact MD 256 as it terminates prior to crossing the roadway. The South Creek
would be potentially impacted during shoulder improvements and mitigation measures should be
taken during the shoulder restriping process.

71 June 2016
Major Intersections/Important Facilities Study Cost Assessment
CHAPTER 7: COST ASSESSMENT
7.1 ROADWAY IMPROVEMENTS
Planning-level cost estimates were developed for the recommended improvements along the study
corridors using MSHA cost estimating procedures, estimated construction quantities based on the
concept designs, and unit bid prices from past construction projects. The costs do not include right-
of-way acquisition as these costs can vary widely across a corridor. The MSHA planning level cost
estimating procedures account for items that cannot be designed and estimated without detailed
survey information (i.e. preliminary design phase) such as drainage culverts, bridges, and utility
relocation, by adding these items as a percentage of excavation, asphalt paving, and striping costs
which can be estimated during the concept design phase.
7.2 Summary
In order to estimate the total recommendation costs, the roadway costs for each corridor were
aggregated, and the total estimated cost to implement this plan on the seven study corridors is
$130.5 million as shown in Table 32. The costs for MD 177 do not include the costs of the Mountain
Road Study improvements as these would be constructed under a separate project by MHSA.
Table 32: Total Plan Costs
Corridor
Roadway Cost
College Parkway $38,200,000 Forest Drive $36,700,000
MD 173 $300,000 MD 177 $21,700,000* MD 214 $26,700,000
MD 256/468 $6,900,000 MD 665 $0
GRAND TOTAL $130,500,000 *Does not include Mountain Road Study costs

72 June 2016
Major Intersections/Important Facilities Study Summary and Recommendations
CHAPTER 8: SUMMARY AND RECOMMENDATIONS 8.1 SUMMARY AND RECOMMENDATIONS
The approach in this study was to address forecasted future recurring congestion through evaluation
of the major intersections along seven key study corridors in the County, evaluating alternatives with
the AATRvM travel demand model using the adopted land use plan and cooperative demographic
forecasts to determine what mixture of recommendations, at an intersection and network level, will
serve to best reduce future travel congestion, at the lowest capital and operating costs while limiting
the impact to the adjacent natural and built environment.
The existing conditions were documented, a travel demand model was refined and validated,
alternative scenarios and traffic forecasts were developed and tested at both a corridor and
intersection level, for the following scenarios:
1. A No Build Alternative- Only constructing roadways that are currently funded for
construction, with no transit or bike/pedestrian improvements.
2. A Build Alternative- Constructing roadway and intersection improvements along each of the
study corridors along with transit improvements and bike/pedestrian improvements.
Balancing the need for added roadway footprint with limited right of way, environmental
constraints, and the need to provide for more travel choices was carefully considered on a corridor-
by-corridor and segment-by-segment basis to identify which roadway, transit, bicycle, and pedestrian
improvements will be most operationally beneficial and justified. The focus of this study was on
developing intersection level improvements that could significantly reduce congestion in the study
corridors at moderate construction costs. The additional focus was on the development of multi-
modal and parallel connections along the study corridors as these improvements can further improve
traffic operations on the primary corridors by diverting local vehicle trips and shifting existing vehicle
trips to other modes such as transit, bicycling, and walking. An additional benefit of developing
parallel connections in the peninsula areas of the county would be the added transportation network
redundancy that is critical for emergency responders and emergency evacuation/special event
situations. 8.2 PRIMARY SCREENING CRITERIA:
In screening the alternatives to evaluate the preferred option, several factors are considered:
1. Travel Time Reliability. The ability of travel options in each corridor to provide consistent
future peak hour travel times either based on the lack of peak hour vehicle congestion or the
provision of alternative roadway connections and modes of travel.
2. Average Daily Traffic. The total daily number of vehicles traversing a particularly point
along a roadway over a 24-hour period.

73 June 2016
Major Intersections/Important Facilities Study Summary and Recommendations
3. Level of Service. A qualitative measure describing operational conditions within a traffic
stream, based on service measures such as speed, travel time, freedom to maneuver,
traffic interruption, comfort and convenience. For example, LOS A represents free flow,
almost complete freedom to maneuver within the traffic stream. LOS F represents forced
flow, more vehicles are attempting to use the facility than can be served resulting in stop and
go traffic.
4. Travel Choices. The number of future available options to travel from one point in a corridor
to another, in comparison to existing conditions.
5. Cost. The total dollar value in current year dollars, to design and construct a proposed
improvement.
6. Feasibility (environmental, right-of-way impact).The amount of impact from construction
of proposed improvements due to sensitive environmental features such as streams,
wetlands or personal property such as homes and businesses.
7. Land Use Compatibility. The consistency of recommendations with currently zoned land
use regulations and small area plans.
8.2.1 College Parkway
The No-Build scenario failed to address problems with congestion that are forecasted to affect the
roadway by 2035. The CLRP did not include any projects on College Parkway, and the section from
west of Jones Station Road (where existing four lane section tapers to two lanes) to MD 179 is
forecast to operate at over-capacity conditions. The Build alternative for College Parkway improves
the roadway to provide additional highway capacity and more reliable travel times with a LOS of A
with the roadway widened. Pedestrian and bicycle improvements recommended for this corridor
under the build alternative will provide additional modal choices for the corridor.
8.2.2 Forest Drive
Forest Drive is not forecast to have failing Levels of Service in the future, however congestion
currently exists in the shopping center areas around Chinquapin Round Road and Bywater Lane.
While the recent signal timing optimization and capacity enhancements have improved the LOS on
Forest Drive, a comprehensive access management and complete streets plan is recommended in
this area to improve the traffic flow. The City of Annapolis Forest Drive Study recommendation to
add an additional left turn lane on the southbound approach of Chinquapin Round would also help
alleviate congestion at the critical intersection entering the study area. Additional
recommendations on advanced signage will further improve lane utilization and traffic flow in this
area. Pedestrian and bicycle improvements recommended for this corridor under the build
alternative will provide additional modal choices for the corridor. To address public concerns
regarding emergency vehicle access on Forest Drive, the bicycle lanes on Forest Drive could be
designed with a slightly wider buffer and lane width which would effectively allow the bicycle lanes
to be utilized by emergency vehicles when the vehicle travel lanes are blocked due to residual
74 June 2016
Major Intersections/Important Facilities Study Summary and Recommendations
queuing related to crashes. The effective width of the bicycle lane and buffer should be a maximum
of 9’ to discourage vehicles from using the bicycle lanes during peak hour conditions. The typical
width for an ambulance is 8 while most fire trucks are between 8’ and 10’.
8.2.3 MD 173
No roadway or new transit service improvements are proposed in either alternative due to
constrained growth forecasts in this portion of the County, but the build alternative provides
additional travel choices through enhanced pedestrian and bicycle facilities along the corridor.
8.2.4 MD 177
The MD 177 (Mountain Road) corridor is expected to have a number of improvements constructed
between Solley/Waterford Road and Edwin Raynor Road based on the results of the County-funded
Mountain Road Study which provide acceptable levels of service during both the morning and
afternoon peak periods for this segment of the study area. The improvements recommended in the
Build Scenario include widening MD 177 from Jumpers Hole Road to Waterford Road from two to four
lanes which would address the failing LOS based on forecasted volumes for the year 2035. The LOS
would improve from F to B with this improvement.
8.2.5 MD 214
No roadway or new transit service improvements are proposed in either alternative due to
constrained growth forecasts in South County, but the build alternative provides additional travel
choices through enhanced pedestrian and bicycle facilities along the corridor.
8.2.6 MD 256 & MD 468
No roadway or new transit service improvements are proposed in either alternative due to
constrained growth forecasts in South County, but the build alternative provides additional travel
choices through enhanced pedestrian and bicycle facilities along the corridor.
8.2.7 MD 665
MD 665 (Aris T. Allen Boulevard) is forecast to have one weaving segment with a failing Level of Service
in the future, however congestion currently exists in the interchange areas of Riva Road and MD 2
which is related to congestion on US 50 and the respective side streets. It is recommended that MD
665 be included in the more detailed study for US 50 recommended in the CGMP.
8.3 STUDY RECOMMENDATION
The following summarizes the combined recommended roadway, transit, bicycle and pedestrian,
land use and toolbox strategy elements for each corridor. 8.3.1 College Parkway
College Parkway is projected to carry up to 36,000 vehicles per day in the year 2035 west of Jones
Station Road and over 21,000 vehicles east of Jones Station Road, which is over the daily capacity of

75 June 2016
Major Intersections/Important Facilities Study Summary and Recommendations
20,000 for a two lane arterial. College Parkway provides service to Anne Arundel Community College
and is often used as a bypass route for traffic destined to the Chesapeake Bay Bridge.
The recommendations for College Parkway include roadway and intersection improvements, sidewalks, and bicycle lanes. See Table 33.
The provision of additional lanes from west of Jones Station Road to MD 179 would improve the LOS
from F to A in the future conditions.
Table 33: College Parkway Plan Recommendation
Mode/Strategy Description Roadway Widen from 2 to 4 lanes from west of Jones Station Road to MD 179
Transit
Extend existing Annapolis Gold Route from Annapolis Community College to MD 179
Improve visibility of existing county paratransit service
Bicycle and Pedestrian
Bicycles lanes and sidewalks Broadneck Trail extension to Baltimore/Annapolis trail
Intersection Improve intersection of MD 2 and College Parkway Add left turn lane on eastbound College Parkway at MD 179
Toolbox Elements
Signal System Timing/detection Sporting Event Planning/evacuation planning
Add transit service Employer sponsored vanpools/rideshare matching On and off street bicycle lane/sidewalks Developing parallel connections
8.3.2 Forest Drive
Forest Drive is projected to carry up to 40,000 vehicles per day east of Spa Road and over 60,000 vehicles
per day between Hilltop Lane and Chinquapin Round Road in 2035. It provides an important connection
from a number of peninsula areas of the County to MD 665, US 50, and the rest of the
Baltimore/Washington region. Public feedback on the Forest Drive corridor indicated that there are
concerns regarding traffic congestion, future development, and emergency vehicle access. A number of
proposed developments would increase traffic volumes in the corridor in the future. These
developments include:
Stop & Shop – 8 vehicle fueling position gasoline station
Quiet Waters Preserve – 72 townhomes and 86 single-family homes
Village Greens – 89 townhomes
Rocky Gorge – 31 townhomes and 17 single-family homes
Bay Village – pharmacy (built), restaurant and office space
1503 Forest Drive – general office and specialty retail space
Crystal Springs- mixed use development with approximately 500 residential units and 250,000
76 June 2016
Major Intersections/Important Facilities Study Summary and Recommendations
square feet of retail
Rodgers Property – 45 townhomes
The AATrvM travel demand model demographic files were reviewed in detail to verify these proposed
developments were included. The review indicated that all of the development was included in the
Round 7c cooperative forecasts with the exception of the retail employment associated with Crystal
Springs. Using the ITE Trip Generation Manual, the number of retail employees was estimated at 500 for
this development. A supplemental travel demand model run was conducted with 500 retail employees
added to the appropriate TAZ corresponding with Crystal Springs. These model results illustrated a 2%
increase in forecast demand compared to the original model runs. Additional HCM analysis was
conducted using Synchro which indicated the intersection of Forest Drive and Spa Road would operate at
a LOS E during the PM peak hour with the additional employment from Crystal Springs included. This is
consistent with the PM peak hour LOS E SimTraffic results from the City of Annapolis Forest Drive Study.
Therefore, the recommendations from that study should be implemented at Spa Road (additional left
turn lane on northbound Spa Road, additional right turn lane on eastbound Forest Drive, new traffic
signal at Crystal Spring Farm Road). It should be noted that the new signal at Crystal Spring Farm Road
would require coordination with the existing signal system in place on Forest Drive.
Additional travel demand model runs were conducted to determine the impacts of developing a parallel
roadway connection to Forest Drive. Two model runs were conducted. The first model run included a
two lane minor arterial between Spa Road and Chinquapin Round Road, and the second model run
included a two lane minor arterial between Spa Road and MD 2. The results from the first model run
indicated a 5% decrease in mainline traffic volumes on Forest Drive between Spa Road and Chinquapin
Round Road. The second model run indicated that extending the parallel arterial to MD 2 would reduce
traffic volumes by over 7% on Forest Drive in this same segment. Given this benefit to traffic operations
on Forest Drive, the county should re-examine the feasibility of constructing a parallel roadway south of
Forest Drive. This would require coordination with the proposed Crystal Springs development, and the
purchase of several easements within existing developments. However, both the existing and proposed
developments would benefit from this proposed connection, as it would provide direct access to their
communities without using Forest Drive between Chinquapin Round Road and Spa Road. Moreover, this
proposed parallel connection would directly address the public concerns regarding emergency vehicle
access to the Forest Drive corridor as emergency vehicles would have an additional route potentially
between MD 2 and Spa Road.
An additional consideration for Forest Drive is the proposed right-in/right-out access point proposed by
MSHA immediately west of Chinquapin Round Road. Given the short weaving distance between this
new access point and the Chinquapin Round Road intersection, MSHA should study this entire area in
detail as a part of an intersection upgrade project at Chinquapin Round Road.
The recommendations for Forest Drive also include new sidewalks and bicycle lanes. See Table 34.

77 June 2016
Major Intersections/Important Facilities Study Summary and Recommendations
Table 34: Forest Drive Plan Recommendation
Mode/Strategy Description
Roadway Intersection Improvements at Spa Road and Chinquapin Round
Road
Transit
Extension of existing MTA commuter bus service from Riva
Road Park & Ride lot to Bay Ridge Avenue
Improve transit amenities including bus shelters, real time bus
information, and improved sidewalk connections
Bicycle and Pedestrian
Add bicycle lanes on Forest Drive including segment from MD 2
to Chinquapin Round Road
Construct missing sidewalk connections
Land Use
Allow for increased density and transit-oriented development
in Annapolis Towne Center area
Future development should occur in New Urbanism fashion
with complete streets network
Toolbox Elements
Signal System coordination and optimization
Real Time Travel Time Information on Changeable Message
Signs
Special Event/evacuation signal timing plan
Annapolis Towne Center shuttle service
Improved Transit service and amenities
Conduct Future Origin-Destination study in study area to
determine framework for carpool/vanpool service
Pedestrian and Bicycle connections
Complete Streets/development of parallel connections
Access Management Plan
Reversible Lanes
8.3.3 MD 173
MD 173 is projected to carry over 17,000 vehicles per day by 2035. It serves local peninsula area
traffic primarily. The corridor is currently not experiencing congestion throughout its entire length
during both the morning and afternoon peak periods. Congestion during special events at the pier
located at the end of the corridor was cited as a concern during the March public meeting.
The recommendations for MD 173 include primarily pedestrian and bicycle improvements and
toolbox strategies to better manage congestion. See Table 35.

78 June 2016
Major Intersections/Important Facilities Study Summary and Recommendations
Table 35: MD 173 Plan Recommendation
Mode/Strategy Description Roadway Shoulder resurfacing and striping
Transit Improve visibility of existing county paratransit service
Bicycle and Pedestrian construct sidewalks west of MD 607, add bike lanes on existing shoulders
Intersection none
Toolbox Elements
Signal timing optimization at MD 607 and MD 173 Special Event/Evacuation Planning On street bicycle facilities on MD 173
The proposed roadway cross-section remains unchanged from existing conditions.
8.3.4 MD 177
MD 177 is projected to carry up to 33,000 vehicles per day by 2035. It connects MD 2 near Marley Station Mall to the peninsula areas of Pasadena. The corridor serves local traffic in Pasadena and Glen Burnie as well as long distance commuters traveling to Baltimore and Annapolis. The roadway has numerous access points and is near capacity between Jumpers Hole Road and MD 648 which leads to congestion between Jumpers Hole Road and MD 607.
The recommendations for MD 177 include roadway improvements, new transit service, bicycle and pedestrian improvements. See Table 36.
The roadway widening between Jumpers Hole Road and Solley/Waterford Road proved to provide adequate levels of service in the future for this segment. The recommendations developed in the MSHA MD 177 Operational Analysis Study and the County-funded Mountain Road Study would improve the LOS to D or better for the remaining study intersections with the exception of Lake Shore Drive which would have an acceptable LOS with optimized signal timing.

79 June 2016
Major Intersections/Important Facilities Study Summary and Recommendations
Table 36: MD 177 Plan Recommendation
Mode/Strategy Description
Roadway
Widen from 2 to 4 lanes between MD 648 (Baltimore/Annapolis Road) and MD 648 (Waterford Road) Mountain Road Study Improvements from MD 648 (Waterford Road)
to Edwin Raynor Road Existing County Capital Improvement Projects
Transit Operation of local bus transit service along this corridor
Bicycle and Pedestrian Bicycle lanes on MD 177 and connect missing sidewalk connections
Land Use No land use changes are proposed
Toolbox Elements
Signal System Coordination and Optimization Special Event/evacuation signal timing plan
Improve Transit Service
Improve visibility of existing County paratransit service
Improved Transit service and amenities Pedestrian and Bicycle connections
Complete Streets/development of parallel connections
Access Management Plan
8.3.5 MD 214
MD 214 is projected to carry up to 27,000 vehicles per day by 2035. MD 214 provides an essential
link between the Edgewater area to the rest of the County and the Washington D.C. region. It
serves local traffic in Edgewater as well as commuters traveling to job centers in Washington D.C.,
Fort Meade, the NSA, and Annapolis. The corridor currently experiences congestion at the
intersection of MD 468; however,
this section is programmed for a
capacity improvement which will
mitigate this congestion in the
future.
The recommendations for MD 214
include bicycle and pedestrian
improvements. The public comments
for the MD 214 corridor focused on
the unsafe conditions for bicycle and
pedestrians in the corridor. Given
these public concerns and the high
vehicular speeds on MD 214, the
buffer between the bicycle lanes and
vehicle lanes is recommended to be
either increased in width by 1-2 feet
or a textured pavement surface
Textured bike lane buffer
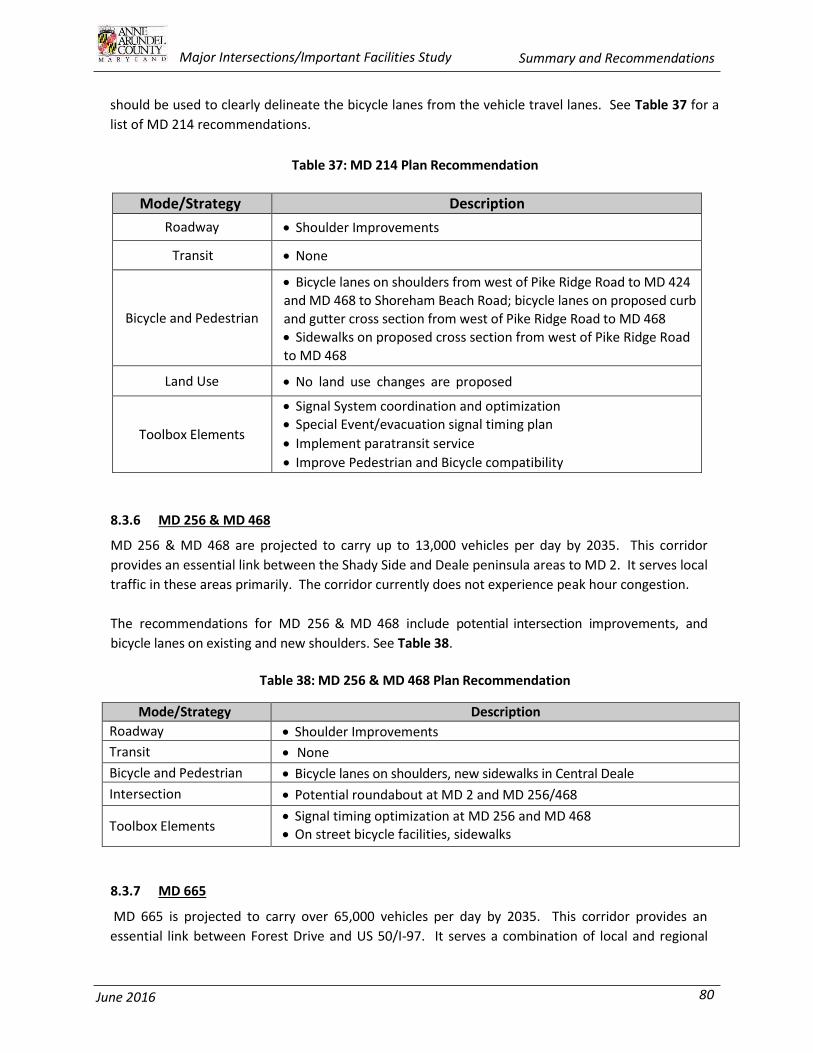
80 June 2016
Major Intersections/Important Facilities Study Summary and Recommendations
should be used to clearly delineate the bicycle lanes from the vehicle travel lanes. See Table 37 for a
list of MD 214 recommendations.
Table 37: MD 214 Plan Recommendation
Mode/Strategy Description
Roadway Shoulder Improvements
Transit None
Bicycle and Pedestrian
Bicycle lanes on shoulders from west of Pike Ridge Road to MD 424 and MD 468 to Shoreham Beach Road; bicycle lanes on proposed curb and gutter cross section from west of Pike Ridge Road to MD 468 Sidewalks on proposed cross section from west of Pike Ridge Road
to MD 468
Land Use No land use changes are proposed
Toolbox Elements
Signal System coordination and optimization Special Event/evacuation signal timing plan
Implement paratransit service
Improve Pedestrian and Bicycle compatibility
8.3.6 MD 256 & MD 468
MD 256 & MD 468 are projected to carry up to 13,000 vehicles per day by 2035. This corridor
provides an essential link between the Shady Side and Deale peninsula areas to MD 2. It serves local
traffic in these areas primarily. The corridor currently does not experience peak hour congestion.
The recommendations for MD 256 & MD 468 include potential intersection improvements, and
bicycle lanes on existing and new shoulders. See Table 38.
Table 38: MD 256 & MD 468 Plan Recommendation
Mode/Strategy Description
Roadway Shoulder Improvements
Transit None
Bicycle and Pedestrian Bicycle lanes on shoulders, new sidewalks in Central Deale
Intersection Potential roundabout at MD 2 and MD 256/468
Toolbox Elements Signal timing optimization at MD 256 and MD 468 On street bicycle facilities, sidewalks
8.3.7 MD 665
MD 665 is projected to carry over 65,000 vehicles per day by 2035. This corridor provides an
essential link between Forest Drive and US 50/I-97. It serves a combination of local and regional

81 June 2016
Major Intersections/Important Facilities Study Summary and Recommendations
traffic in these areas including commuters to and from Annapolis, Baltimore, Fort Meade/NSA, and
Washington DC. The corridor experiences peak hour congestion associated with queuing and
weaving conditions on US 50.
MD 665 is recommended for future detailed operational analysis as a part of a larger US 50 operational analysis and alternatives study. See Table 39.
Table 39: MD 665 Plan Recommendation
Mode/Strategy Description
Roadway Future detailed study with US 50
Transit none
Bicycle and Pedestrian off street bicycle trail
Intersection none
Toolbox Elements
Real time travel information, changeable message signs HOV lanes, ridesharing programs
Employer sponsored vanpools, rideshare matching for Annapolis Towne Center area
Off street bicycle trail
8.3.8 Corridor Prioritization
The Major Intersections/Important Facilities Study comprises numerous recommendations across 7
corridors and multiple modes of travel that cannot be implemented all at once. Decisions will have
to be made as to which projects and which corridors should be prioritized to make the most
efficient use of available resources. Measures of performance used for prioritization include
Average Daily Traffic (ADT) volumes, level of service, travel time, modal connectivity, and cost.
Based on a combination of projected benefits in travel time reliability, level of service improvement,
introduction of travel choices, and construction impacts and feasibility, the projects were prioritized
as near-term, or projects that can be implemented with minimal design and construction, mid-term,
or projects that can be feasibly constructed within a 5-10 year timeframe, and long-term which
corresponds with projects that need substantial construction funding and coordination with MSHA
and/or BMC and would likely be implemented as a part of the long range planning process. The
study recommendations are prioritized below.
Near-Term
MD 173 bike lanes
MD 256 & MD 468 bike lanes
MD 256 sidewalks
Mid-Term
MD 177 widening including bike lanes and sidewalks
MD 214 bike lanes
MD 214 sidewalks
College Parkway at MD 2 intersection improvement
College Parkway at MD 179 intersection improvement
82 June 2016
Major Intersections/Important Facilities Study Summary and Recommendations
Long-Term
College Parkway widening
College Parkway bike lane/sidewalks (incorporate in widening project)
Forest Drive bike lanes/sidewalks (incorporate in future reconstruction)
8.4 NEXT STEPS AND IMPLEMENTATION
8.4.1 Coordination with Further County Planning Efforts
This document is the final stand-alone report that is intended to justify advancing each of these
corridors into either final design/construction for near-term improvements or detailed project
planning and preliminary engineering for the remaining improvements, and identifying and securing
funding commitments in partnership with appropriate State, Federal and private partners. This
document builds on and supports the findings and recommendations of the recently adopted General
Development Plan (2009); GDP Background Report on Transportation, (2008); the Anne Arundel
County Pedestrian and Bicycle Master Plan, (2012), and Complete Streets Guidelines (2014).
Response to Public Comments:
In response the public comments received at the June public meetings, in which the materials from
the draft MIIF report was presented, some additional recommendations have been made to be
included into the study for several of the corridors, specifically the following:
MD 214:
The development of the Park and the possible lifting of the moratorium were not included in the
original scope of the study. Due to the possible impacts, an updated traffic analysis will be conducted
in FY 17 to include the traffic associated with both public and private development which will include
updated transportation infrastructure recommendations.
Emergency response concerns have been forwarded to the Office of Emergency Management. One of
the recommendations has been interconnections between subdivisions to allow for connectivity that
would parallel MD 214 in certain areas that could allow for an alternate route in the even the roadway
is closed. This could include gated connections that would be opened only in emergency situations.
We will work with the communities and various county and state agencies to investigate the best
locations for these permanent and emergency connections.
The state has recently turned down a request for a signal at Loch Haven and MD 214 due to it not
meeting signal warrants. While no specific improvement was recommended in the study, we will
work with the community and the state to look at alternative improvements that could address the
problem including interconnectivity between Loch Haven and Selby or alternative intersection
improvements that do not involve signalization.

83 June 2016
Major Intersections/Important Facilities Study Summary and Recommendations
Forest Drive:
The County agrees that the study tools used do not accurately reflect the operational deficiencies. At
the City of Annapolis’s request, the County has placed the Forest Drive and Chinquapin Round Road
intersection in the 2016 Priority Letter to the Maryland Department of Transportation (MDOT) for
planning and design money. Further study of this intersection with more appropriate traffic analysis
tools that more accurately reflect traffic operations is required.
College Parkway:
While the widening addressed corridor Level of Service (LOS), community support is vital to moving a
project from a recommended infrastructure improvement to a funded project. The Transportation
Functional Master Plan (TFMP) will take community support into account during the prioritization
process before any projects move to funded status.
Countywide:
The County is in the process of hiring a transportation planner whose primary (but not only) focus will
be on bicycle and pedestrian issues. Their job will be to implement many of the recommendations of
the Complete Streets Guidance report and Pedestrian and Bicycle Master Plan: 2013 Plan Update
including updating the Design Manual Standards as well as County ordinances, for a more
comprehensive approach to bicycle infrastructure that is not limited to the study corridors.
8.4.2 Partnering and Funding
Within the County, the Major Intersections/Important Facilities Study, as part of the ultimate
Transportation Master Plan, will need formal adoption by the County Council. Once adopted it
becomes a formal policy, the County can then revise the priority letter to the State Secretary of
Transportation. This letter will serve as justification for revising the County’s transportation priorities
for the Baltimore Metropolitan Council’s Consolidated Long-Range Transportation Plan, and
ultimately, if successfully advanced through Project Development, the State’s Consolidated
Transportation Program.
As five of the study corridors are State roadways, in order to advance each project, extensive project
coordination with State and Federal agencies, and detailed environmental documentation will be
required. The Mid-Term and Long-Term projects will need to go through the following steps in
coordination with the Maryland State Highway’s Office of Planning and Preliminary Engineering:
1. Detailed Project Planning Study. During this phase the project’s logical termini, and purpose
and need are identified, and alternatives are developed, and initial public outreach begins
2. Project Development. During this phase, detailed environmental analyses is undertaken,
such as development of peak-hour traffic forecasts, capacity and level of service/traffic
simulation, air and noise analyses, development of preliminary geometry (cross-
sections and vertical and horizontal alignment), hydraulic analysis, environmental impacts
(streams, wetlands, historical and cultural resources), right-of-way impacts, construction cost
estimates, refinement of alternatives, as well as Federal Highway coordination and
additional public outreach. Specific steps include:

84 June 2016
Major Intersections/Important Facilities Study Summary and Recommendations
a. Alternatives Retained for Detailed Study
b. Environmental Alternatives/Draft and Final Environmental Impact Statement
c. Location and Design Approval/Record of Decision of Preferred Alternative
3. Final Engineering Design. During this stage, final construction documents are prepared
including specific mitigation for any utility, environmental or property impacts, detailed field
reviews are performed, approvals from necessary permitting agencies such as the Maryland
Department of the Environment are sought, and final itemized construction costs are
developed. In addition, a detailed Transportation Management Plan is developed to
minimize impacts to traffic during construction.
4. Acquisition. During this stage all right-of-way is acquired, and relocation is performed
5. Construction. During this stage, the improvement is constructed.
Funding sources may include the US DOT (Federal Highway Administration, Federal Transit
Administration), State (Maryland Department of Transportation CTP), Grants (e.g. Transportation
Investments Generating Economic Recovery) or private funding (developer improvements).
It should again be noted that all of the aforementioned agencies have been engaged in the
development of this plan and are receptive to considering each of the recommended improvements
for more detailed planning and project development.