mexico city, mexico - ucl · urban slums reports: the case of mexico city, mexico provided by world...
TRANSCRIPT
I. INTRODUCTION: THE CITY
A. URBAN CONTEXT
1. National Overview
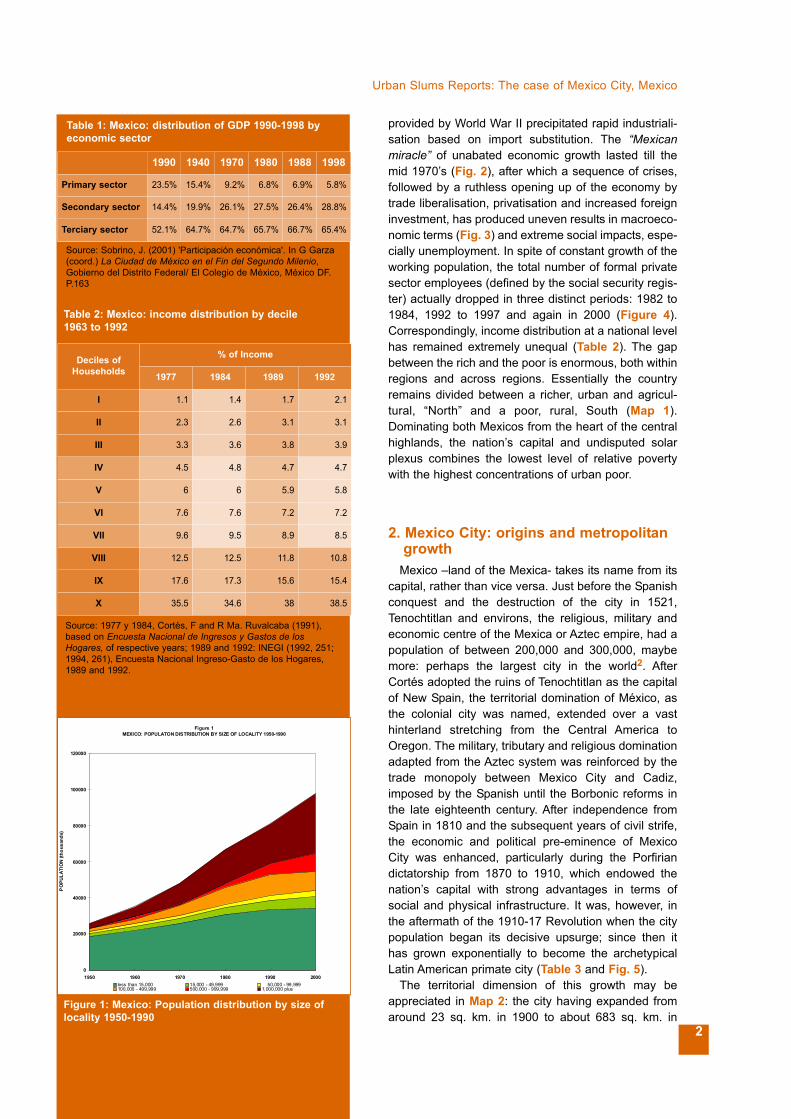
Some time in 2001 Mexico’s total populationexceeded one hundred million, of which at least two-thirds are considered to be urban by virtue of inhabitinglocalities with more than 15,000 inhabitants (Figure 1).The urbanisation process has taken place at greatspeed, mainly in the latter half of the twentieth century.Thirty three million Mexicans now live in cities with overa million inhabitants, another 20.6 million live inmedium cities of between 100,000 and one million,while a further 15 million live in the smaller towns andcities. The remaining third of the total population livingin localities of less than 15,000 inhabitants is consid-ered to be “rural”, although the distinction between“urban” and “rural” is often inappropriate, beyond therather arbitrary delimitation of census localities. Insome parts of Mexico, so-called “rural” localities arephysically urbanised, if not actually integrated intourban areas. Yet rural localities do include a largecontingent of marginalized poor, including many indige-nous communities and others involved in subsistenceagriculture. And the poorest of these –approximately 10million people- are dispersed in localities of less than500, two-third of which are completely isolated fromurban areas1.
The persistence of extreme rural poverty contrastswith Mexico’s dubious distinction of also becoming in2001 the world’s ninth largest economy2 (measured indollars) having ousted Brazil from that position on thestrength of an over-valued peso. Relative to its popula-tion, the Mexican economy is less impressive, rankingin sixty-ninth place among the developing nations, witha per capita GDP of US $5,070 in 20003. Almost a thirdof GDP is now generated by exports, of which 37.5 percent are manufactured goods and a further 43.8 percent is bonded industrial production. Tertiary activitieshave always played an important role, but it is industrythat has been the driving force of Mexico’s urbanisa-tion, at least until recently (Table 1). A first wave ofindustrialisation occurred during the latter half of thenineteenth century and beginning of the twentieth,when the basic infrastructure was introduced: railways,roads, ports, electricity. At the same time, the majorcities acquired the essential items of contemporaryurbanisation: paved roads, water and drainage, publicparks and civic centres, street lighting and tramways.
The Revolutionary struggles of the second decade ofthe century prevented Mexico from fully reaping thefruits of this investment until the favourable conditions
The case of
Mexico City, Mexico
by Priscilla Connolly
Contact:Priscilla Connolly, DrUniversidad Autonoma Metropolitana-AzcapotzalcoCalvario 70-4 TLALPAN 14000 MEXICO DFTel. (home) +52 5 54834045 Fax. +52 5 53825899E-mail: [email protected]
1
Sou
rce:
CIA
fact
book
2
Urban Slums Reports: The case of Mexico City, Mexico
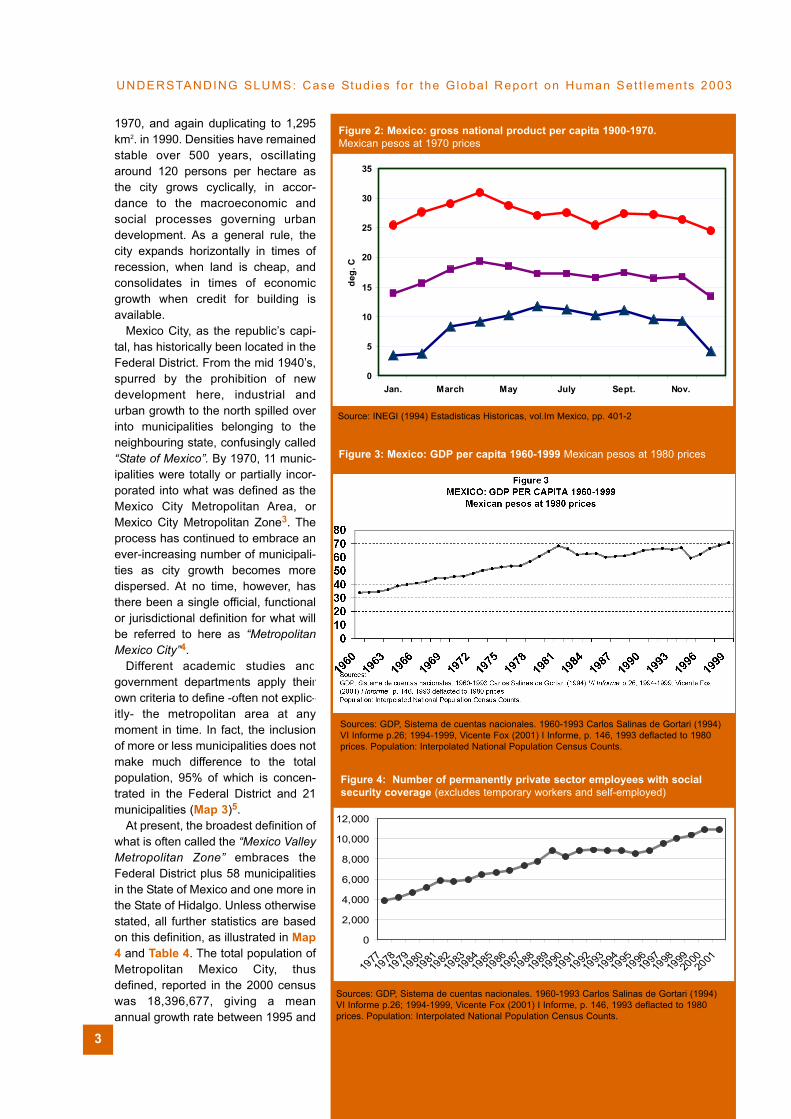
provided by World War II precipitated rapid industriali-sation based on import substitution. The “Mexicanmiracle” of unabated economic growth lasted till themid 1970’s (Fig. 2), after which a sequence of crises,followed by a ruthless opening up of the economy bytrade liberalisation, privatisation and increased foreigninvestment, has produced uneven results in macroeco-nomic terms (Fig. 3) and extreme social impacts, espe-cially unemployment. In spite of constant growth of theworking population, the total number of formal privatesector employees (defined by the social security regis-ter) actually dropped in three distinct periods: 1982 to1984, 1992 to 1997 and again in 2000 (Figure 4).Correspondingly, income distribution at a national levelhas remained extremely unequal (Table 2). The gapbetween the rich and the poor is enormous, both withinregions and across regions. Essentially the countryremains divided between a richer, urban and agricul-tural, “North” and a poor, rural, South (Map 1).Dominating both Mexicos from the heart of the centralhighlands, the nation’s capital and undisputed solarplexus combines the lowest level of relative povertywith the highest concentrations of urban poor.
2. Mexico City: origins and metropolitan growth
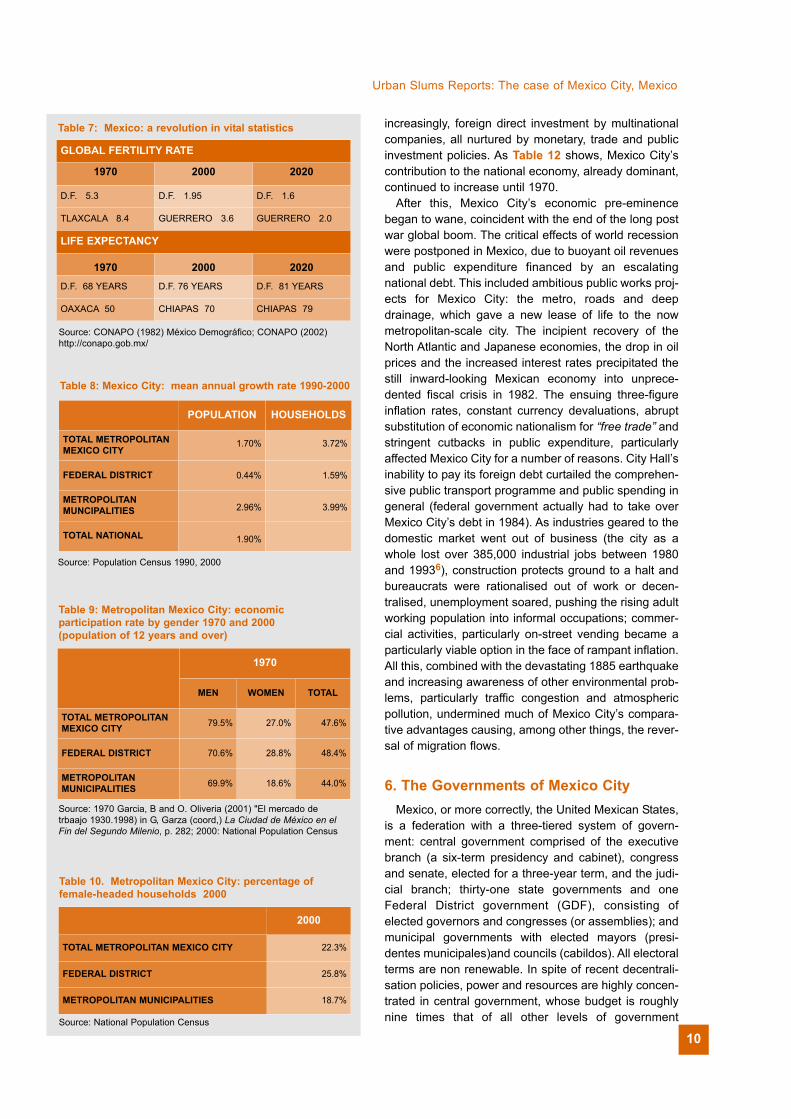
Mexico –land of the Mexica- takes its name from itscapital, rather than vice versa. Just before the Spanishconquest and the destruction of the city in 1521,Tenochtitlan and environs, the religious, military andeconomic centre of the Mexica or Aztec empire, had apopulation of between 200,000 and 300,000, maybemore: perhaps the largest city in the world2. AfterCortés adopted the ruins of Tenochtitlan as the capitalof New Spain, the territorial domination of México, asthe colonial city was named, extended over a vasthinterland stretching from the Central America toOregon. The military, tributary and religious dominationadapted from the Aztec system was reinforced by thetrade monopoly between Mexico City and Cadiz,imposed by the Spanish until the Borbonic reforms inthe late eighteenth century. After independence fromSpain in 1810 and the subsequent years of civil strife,the economic and political pre-eminence of MexicoCity was enhanced, particularly during the Porfiriandictatorship from 1870 to 1910, which endowed thenation’s capital with strong advantages in terms ofsocial and physical infrastructure. It was, however, inthe aftermath of the 1910-17 Revolution when the citypopulation began its decisive upsurge; since then ithas grown exponentially to become the archetypicalLatin American primate city (Table 3 and Fig. 5).
The territorial dimension of this growth may beappreciated in Map 2: the city having expanded fromaround 23 sq. km. in 1900 to about 683 sq. km. in
Table 1: Mexico: distribution of GDP 1990-1998 byeconomic sector
1990 1940 1970 1980 1988 1998
Primary sector 23.5% 15.4% 9.2% 6.8% 6.9% 5.8%
Secondary sector 14.4% 19.9% 26.1% 27.5% 26.4% 28.8%
Terciary sector 52.1% 64.7% 64.7% 65.7% 66.7% 65.4%
Source: Sobrino, J. (2001) 'Participación económica'. In G Garza(coord.) La Ciudad de México en el Fin del Segundo Milenio,Gobierno del Distrito Federal/ El Colegio de México, México DF.P.163
Table 2: Mexico: income distribution by decile 1963 to 1992
Deciles ofHouseholds
% of Income
1977 1984 1989 1992
I 1.1 1.4 1.7 2.1
II 2.3 2.6 3.1 3.1
III 3.3 3.6 3.8 3.9
IV 4.5 4.8 4.7 4.7
V 6 6 5.9 5.8
VI 7.6 7.6 7.2 7.2
VII 9.6 9.5 8.9 8.5
VIII 12.5 12.5 11.8 10.8
IX 17.6 17.3 15.6 15.4
X 35.5 34.6 38 38.5
Source: 1977 y 1984, Cortés, F and R Ma. Ruvalcaba (1991),based on Encuesta Nacional de Ingresos y Gastos de losHogares, of respective years; 1989 and 1992: INEGI (1992, 251;1994, 261), Encuesta Nacional Ingreso-Gasto de los Hogares,1989 and 1992.
Figure 1MEXICO: POPULATON DISTRIBUTION BY SIZE OF LOCALITY 1950-1990
0
20000
40000
60000
80000
100000
120000
1950 1960 1970 1980 1990 2000
PO
PULA
TIO
N (th
ousa
nds)
less than 15,000 15,000 - 49,999 50,000 - 99,999100,000 - 499,999 500,000 - 999,999 1,000,000 plus
Figure 1: Mexico: Population distribution by size oflocality 1950-1990
1970, and again duplicating to 1,295km2. in 1990. Densities have remainedstable over 500 years, oscillatingaround 120 persons per hectare asthe city grows cyclically, in accor-dance to the macroeconomic andsocial processes governing urbandevelopment. As a general rule, thecity expands horizontally in times ofrecession, when land is cheap, andconsolidates in times of economicgrowth when credit for building isavailable.
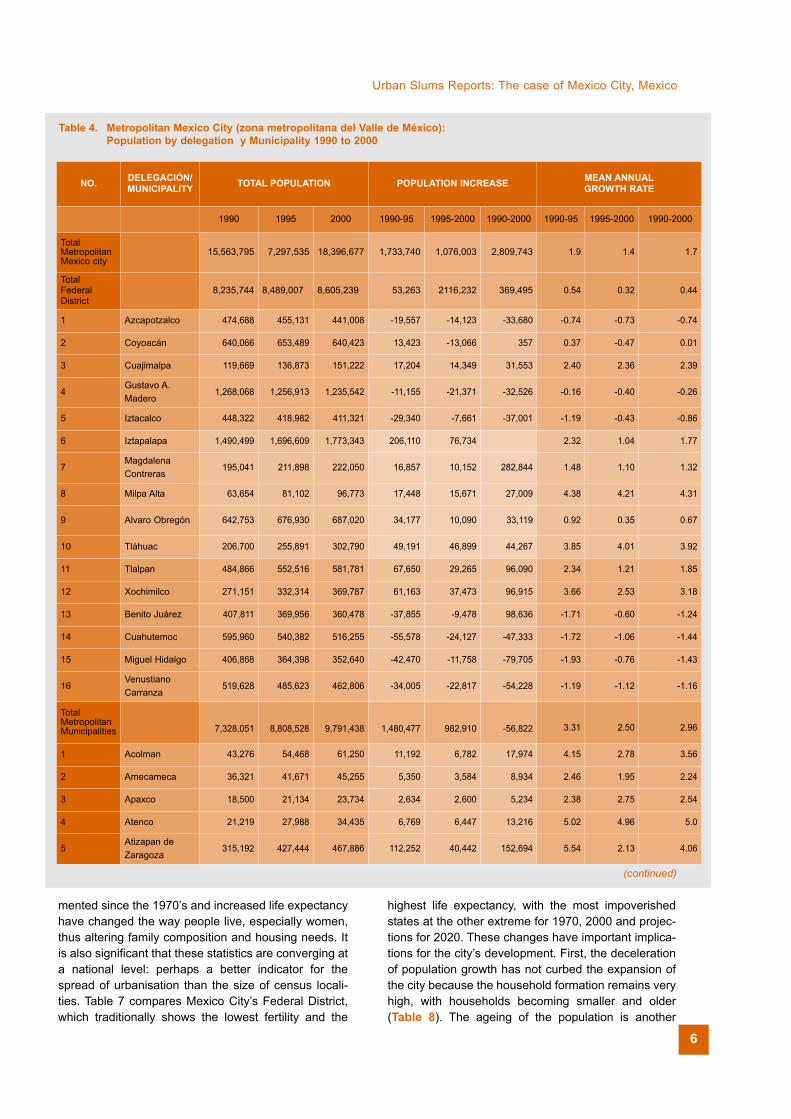
Mexico City, as the republic’s capi-tal, has historically been located in theFederal District. From the mid 1940’s,spurred by the prohibition of newdevelopment here, industrial andurban growth to the north spilled overinto municipalities belonging to theneighbouring state, confusingly called“State of Mexico”. By 1970, 11 munic-ipalities were totally or partially incor-porated into what was defined as theMexico City Metropolitan Area, orMexico City Metropolitan Zone3. Theprocess has continued to embrace anever-increasing number of municipali-ties as city growth becomes moredispersed. At no time, however, hasthere been a single official, functionalor jurisdictional definition for what willbe referred to here as “MetropolitanMexico City”4.
Different academic studies andgovernment departments apply theirown criteria to define -often not explic-itly- the metropolitan area at anymoment in time. In fact, the inclusionof more or less municipalities does notmake much difference to the totalpopulation, 95% of which is concen-trated in the Federal District and 21municipalities (Map 3)5.
At present, the broadest definition ofwhat is often called the “Mexico ValleyMetropolitan Zone” embraces theFederal District plus 58 municipalitiesin the State of Mexico and one more inthe State of Hidalgo. Unless otherwisestated, all further statistics are basedon this definition, as illustrated in Map4 and Table 4. The total population ofMetropolitan Mexico City, thusdefined, reported in the 2000 censuswas 18,396,677, giving a meanannual growth rate between 1995 and
3
UNDERSTANDING SLUMS: Case Stud ies fo r the G loba l Repor t on Human Set t lements 2003
Figure 2: Mexico: gross national product per capita 1900-1970. Mexican pesos at 1970 prices
0
5
10
15
20
25
30
35
Jan. March May July Sept. Nov.
deg.
C
Source: INEGI (1994) Estadisticas Historicas, vol.Im Mexico, pp. 401-2
0
2,000
4,000
6,000
8,000
10,000
12,000
197719
7819
7919
8019
8119
8219
8319
8419
8519
8619
8719
8819
8919
9019
9119
9219
9319
9419
9519
9619
9719
9819
9920
0020
01
Figure 3: Mexico: GDP per capita 1960-1999 Mexican pesos at 1980 prices
Figure 4: Number of permanently private sector employees with socialsecurity coverage (excludes temporary workers and self-employed)
Sources: GDP, Sistema de cuentas nacionales. 1960-1993 Carlos Salinas de Gortari (1994)VI Informe p.26; 1994-1999, Vicente Fox (2001) I Informe, p. 146, 1993 deflacted to 1980prices. Population: Interpolated National Population Census Counts.
Sources: GDP, Sistema de cuentas nacionales. 1960-1993 Carlos Salinas de Gortari (1994)VI Informe p.26; 1994-1999, Vicente Fox (2001) I Informe, p. 146, 1993 deflacted to 1980prices. Population: Interpolated National Population Census Counts.
4
Urban Slums Reports: The case of Mexico City, Mexico
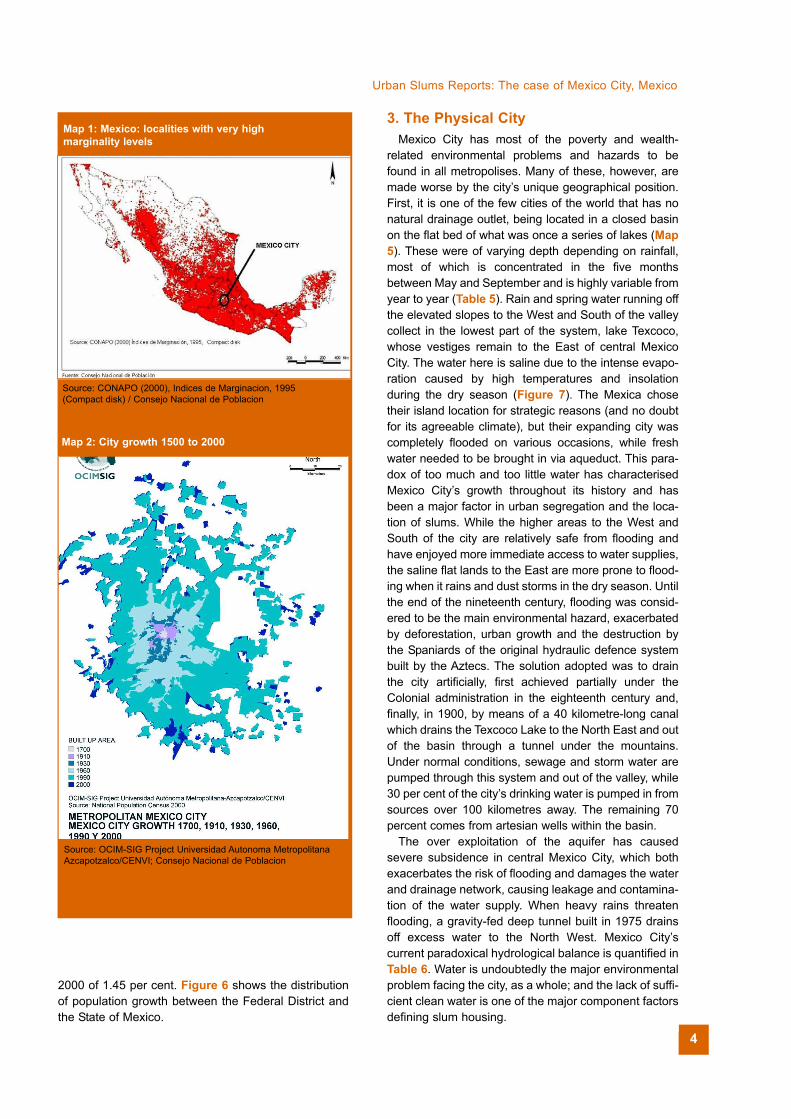
3. The Physical CityMexico City has most of the poverty and wealth-
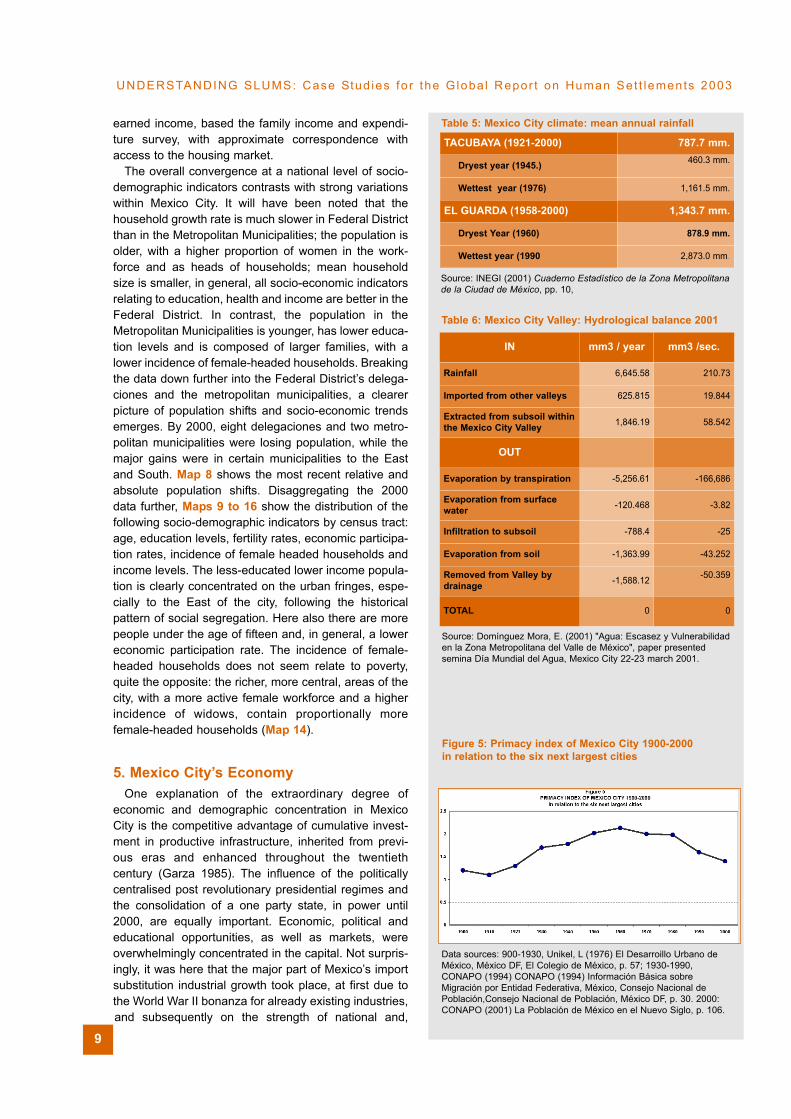
related environmental problems and hazards to befound in all metropolises. Many of these, however, aremade worse by the city’s unique geographical position.First, it is one of the few cities of the world that has nonatural drainage outlet, being located in a closed basinon the flat bed of what was once a series of lakes (Map5). These were of varying depth depending on rainfall,most of which is concentrated in the five monthsbetween May and September and is highly variable fromyear to year (Table 5). Rain and spring water running offthe elevated slopes to the West and South of the valleycollect in the lowest part of the system, lake Texcoco,whose vestiges remain to the East of central MexicoCity. The water here is saline due to the intense evapo-ration caused by high temperatures and insolationduring the dry season (Figure 7). The Mexica chosetheir island location for strategic reasons (and no doubtfor its agreeable climate), but their expanding city wascompletely flooded on various occasions, while freshwater needed to be brought in via aqueduct. This para-dox of too much and too little water has characterisedMexico City’s growth throughout its history and hasbeen a major factor in urban segregation and the loca-tion of slums. While the higher areas to the West andSouth of the city are relatively safe from flooding andhave enjoyed more immediate access to water supplies,the saline flat lands to the East are more prone to flood-ing when it rains and dust storms in the dry season. Untilthe end of the nineteenth century, flooding was consid-ered to be the main environmental hazard, exacerbatedby deforestation, urban growth and the destruction bythe Spaniards of the original hydraulic defence systembuilt by the Aztecs. The solution adopted was to drainthe city artificially, first achieved partially under theColonial administration in the eighteenth century and,finally, in 1900, by means of a 40 kilometre-long canalwhich drains the Texcoco Lake to the North East and outof the basin through a tunnel under the mountains.Under normal conditions, sewage and storm water arepumped through this system and out of the valley, while30 per cent of the city’s drinking water is pumped in fromsources over 100 kilometres away. The remaining 70percent comes from artesian wells within the basin.
The over exploitation of the aquifer has causedsevere subsidence in central Mexico City, which bothexacerbates the risk of flooding and damages the waterand drainage network, causing leakage and contamina-tion of the water supply. When heavy rains threatenflooding, a gravity-fed deep tunnel built in 1975 drainsoff excess water to the North West. Mexico City’scurrent paradoxical hydrological balance is quantified inTable 6. Water is undoubtedly the major environmentalproblem facing the city, as a whole; and the lack of suffi-cient clean water is one of the major component factorsdefining slum housing.
2000 of 1.45 per cent. Figure 6 shows the distributionof population growth between the Federal District andthe State of Mexico.
Source: CONAPO (2000), Indices de Marginacion, 1995(Compact disk) / Consejo Nacional de Poblacion
Map 1: Mexico: localities with very high marginality levels
Source: OCIM-SIG Project Universidad Autonoma MetropolitanaAzcapotzalco/CENVI; Consejo Nacional de Poblacion
Map 2: City growth 1500 to 2000
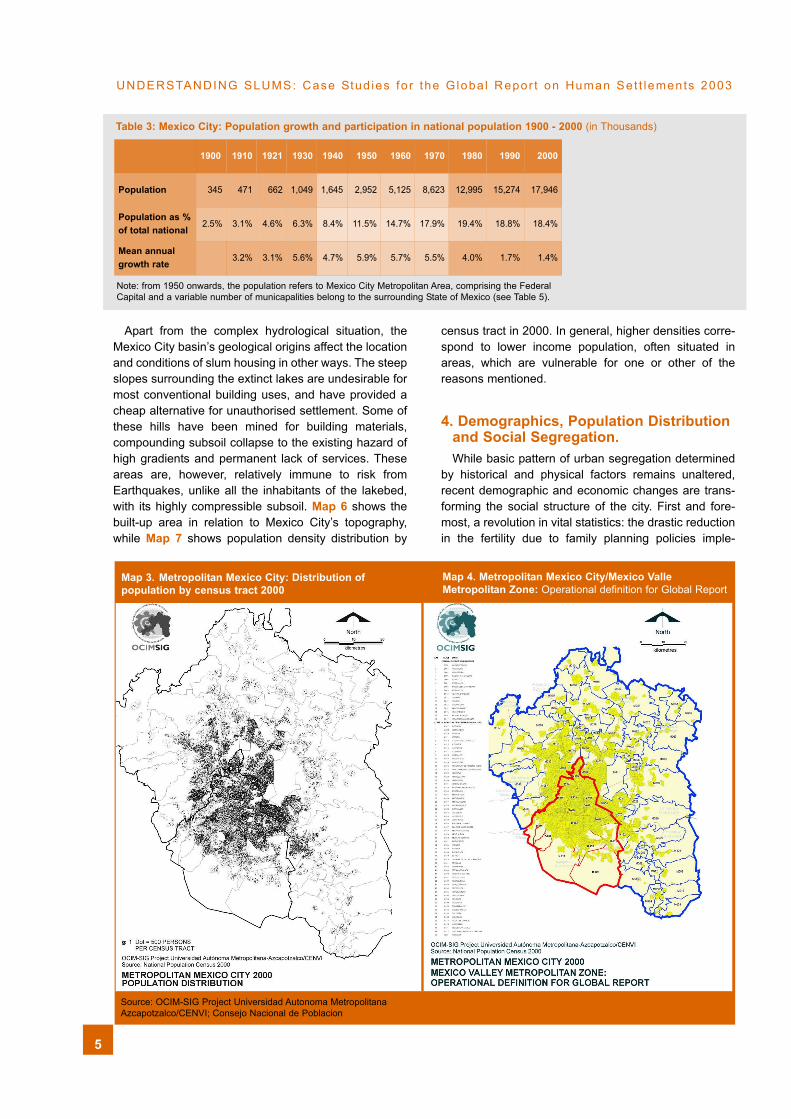
Apart from the complex hydrological situation, theMexico City basin’s geological origins affect the locationand conditions of slum housing in other ways. The steepslopes surrounding the extinct lakes are undesirable formost conventional building uses, and have provided acheap alternative for unauthorised settlement. Some ofthese hills have been mined for building materials,compounding subsoil collapse to the existing hazard ofhigh gradients and permanent lack of services. Theseareas are, however, relatively immune to risk fromEarthquakes, unlike all the inhabitants of the lakebed,with its highly compressible subsoil. Map 6 shows thebuilt-up area in relation to Mexico City’s topography,while Map 7 shows population density distribution by
census tract in 2000. In general, higher densities corre-spond to lower income population, often situated inareas, which are vulnerable for one or other of thereasons mentioned.
4. Demographics, Population Distributionand Social Segregation. While basic pattern of urban segregation determined
by historical and physical factors remains unaltered,recent demographic and economic changes are trans-forming the social structure of the city. First and fore-most, a revolution in vital statistics: the drastic reductionin the fertility due to family planning policies imple-
5
UNDERSTANDING SLUMS: Case Stud ies fo r the G loba l Repor t on Human Set t lements 2003
Table 3: Mexico City: Population growth and participation in national population 1900 - 2000 (in Thousands)
1900 1910 1921 1930 1940 1950 1960 1970 1980 1990 2000
Population 345 471 662 1,049 1,645 2,952 5,125 8,623 12,995 15,274 17,946
Population as %of total national
2.5% 3.1% 4.6% 6.3% 8.4% 11.5% 14.7% 17.9% 19.4% 18.8% 18.4%
Mean annualgrowth rate
3.2% 3.1% 5.6% 4.7% 5.9% 5.7% 5.5% 4.0% 1.7% 1.4%
Note: from 1950 onwards, the population refers to Mexico City Metropolitan Area, comprising the FederalCapital and a variable number of municapalities belong to the surrounding State of Mexico (see Table 5).
Map 3. Metropolitan Mexico City: Distribution ofpopulation by census tract 2000
Map 4. Metropolitan Mexico City/Mexico ValleMetropolitan Zone: Operational definition for Global Report
Source: OCIM-SIG Project Universidad Autonoma MetropolitanaAzcapotzalco/CENVI; Consejo Nacional de Poblacion
6
Urban Slums Reports: The case of Mexico City, Mexico
mented since the 1970’s and increased life expectancyhave changed the way people live, especially women,thus altering family composition and housing needs. Itis also significant that these statistics are converging ata national level: perhaps a better indicator for thespread of urbanisation than the size of census locali-ties. Table 7 compares Mexico City’s Federal District,which traditionally shows the lowest fertility and the
highest life expectancy, with the most impoverishedstates at the other extreme for 1970, 2000 and projec-tions for 2020. These changes have important implica-tions for the city’s development. First, the decelerationof population growth has not curbed the expansion ofthe city because the household formation remains veryhigh, with households becoming smaller and older(Table 8). The ageing of the population is another
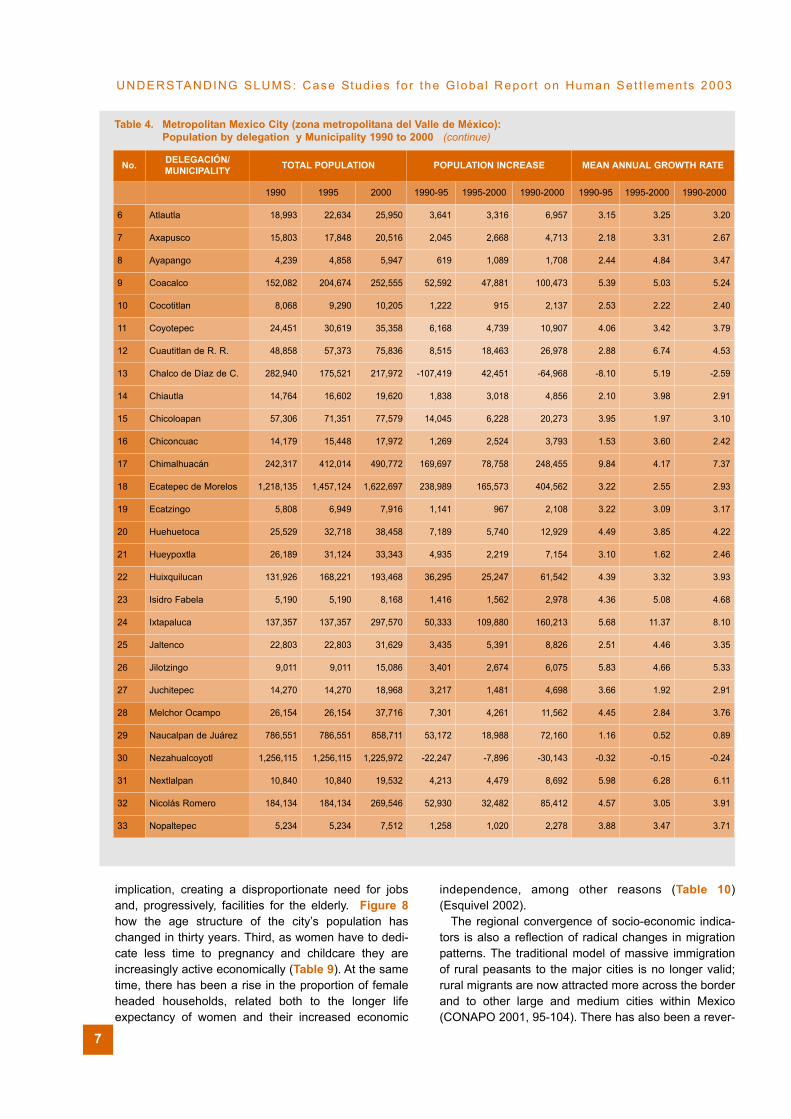
Table 4. Metropolitan Mexico City (zona metropolitana del Valle de México): Population by delegation y Municipality 1990 to 2000
NO. DELEGACIÓN/ MUNICIPALITY TOTAL POPULATION POPULATION INCREASE MEAN ANNUAL
GROWTH RATE
1990 1995 2000 1990-95 1995-2000 1990-2000 1990-95 1995-2000 1990-2000
TotalMetropolitanMexico city
15,563,795 7,297,535 18,396,677 1,733,740 1,076,003 2,809,743 1.9 1.4 1.7
Total FederalDistrict
8,235,744 8,489,007 8,605,239 53,263 2116,232 369,495 0.54 0.32 0.44
1 Azcapotzalco 474,688 455,131 441,008 -19,557 -14,123 -33,680 -0.74 -0.73 -0.74
2 Coyoacán 640,066 653,489 640,423 13,423 -13,066 357 0.37 -0.47 0.01
3 Cuajimalpa 119,669 136,873 151,222 17,204 14,349 31,553 2.40 2.36 2.39
4Gustavo A.Madero
1,268,068 1,256,913 1,235,542 -11,155 -21,371 -32,526 -0.16 -0.40 -0.26
5 Iztacalco 448,322 418,982 411,321 -29,340 -7,661 -37,001 -1.19 -0.43 -0.86
6 Iztapalapa 1,490,499 1,696,609 1,773,343 206,110 76,734 2.32 1.04 1.77
7MagdalenaContreras
195,041 211,898 222,050 16,857 10,152 282,844 1.48 1.10 1.32
8 Milpa Alta 63,654 81,102 96,773 17,448 15,671 27,009 4.38 4.21 4.31
9 Alvaro Obregón 642,753 676,930 687,020 34,177 10,090 33,119 0.92 0.35 0.67
10 Tláhuac 206,700 255,891 302,790 49,191 46,899 44,267 3.85 4.01 3.92
11 Tlalpan 484,866 552,516 581,781 67,650 29,265 96,090 2.34 1.21 1.85
12 Xochimilco 271,151 332,314 369,787 61,163 37,473 96,915 3.66 2.53 3.18
13 Benito Juárez 407,811 369,956 360,478 -37,855 -9,478 98,636 -1.71 -0.60 -1.24
14 Cuahutemoc 595,960 540,382 516,255 -55,578 -24,127 -47,333 -1.72 -1.06 -1.44
15 Miguel Hidalgo 406,868 364,398 352,640 -42,470 -11,758 -79,705 -1.93 -0.76 -1.43
16VenustianoCarranza
519,628 485,623 462,806 -34,005 -22,817 -54,228 -1.19 -1.12 -1.16
TotalMetropolitanMunicipalities 7,328,051 8,808,528 9,791,438 1,480,477 982,910 -56,822 3.31 2.50 2.96
1 Acolman 43,276 54,468 61,250 11,192 6,782 17,974 4.15 2.78 3.56
2 Amecameca 36,321 41,671 45,255 5,350 3,584 8,934 2.46 1.95 2.24
3 Apaxco 18,500 21,134 23,734 2,634 2,600 5,234 2.38 2.75 2.54
4 Atenco 21,219 27,988 34,435 6,769 6,447 13,216 5.02 4.96 5.0
5Atizapan deZaragoza
315,192 427,444 467,886 112,252 40,442 152,694 5.54 2.13 4.06
(continued)
7
UNDERSTANDING SLUMS: Case Stud ies fo r the G loba l Repor t on Human Set t lements 2003
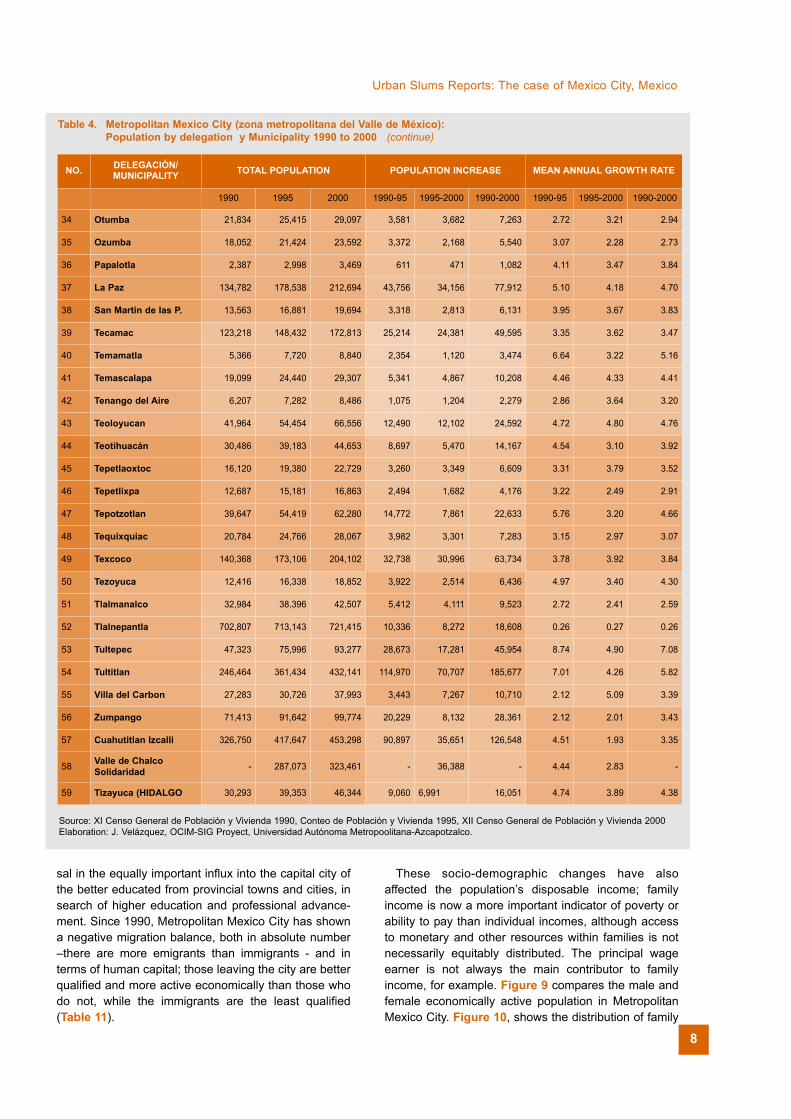
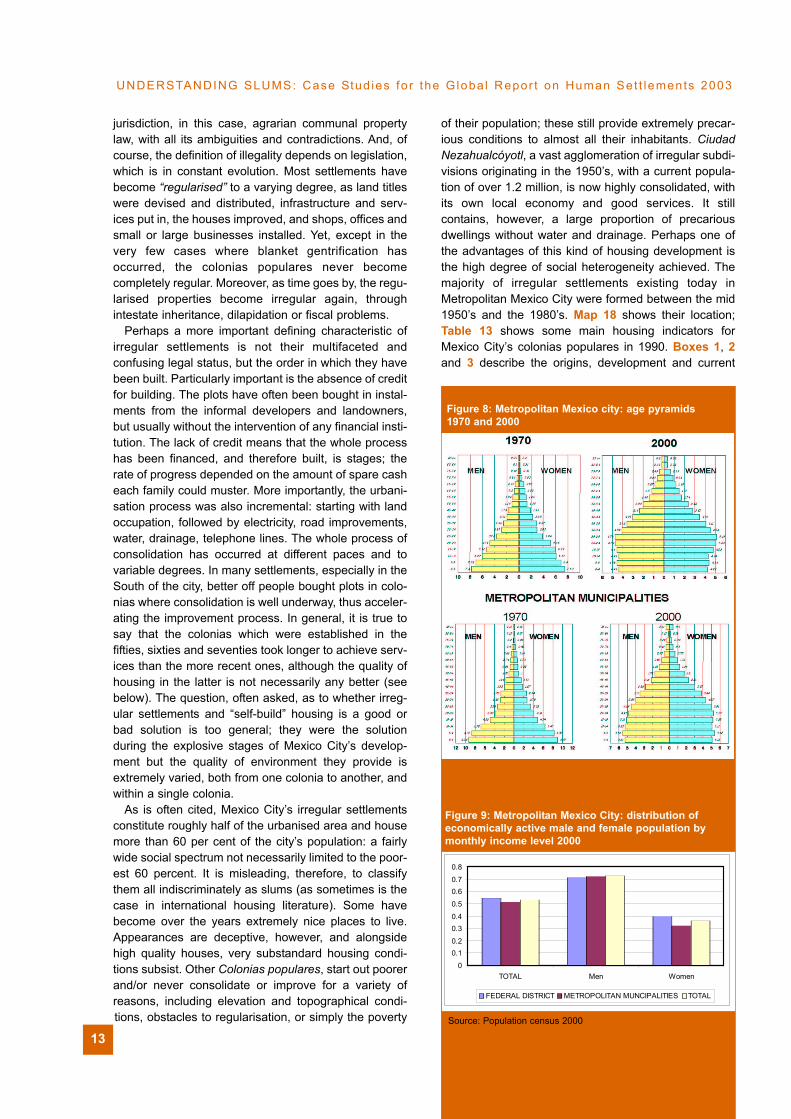
implication, creating a disproportionate need for jobsand, progressively, facilities for the elderly. Figure 8how the age structure of the city’s population haschanged in thirty years. Third, as women have to dedi-cate less time to pregnancy and childcare they areincreasingly active economically (Table 9). At the sametime, there has been a rise in the proportion of femaleheaded households, related both to the longer lifeexpectancy of women and their increased economic
independence, among other reasons (Table 10)(Esquivel 2002).
The regional convergence of socio-economic indica-tors is also a reflection of radical changes in migrationpatterns. The traditional model of massive immigrationof rural peasants to the major cities is no longer valid;rural migrants are now attracted more across the borderand to other large and medium cities within Mexico(CONAPO 2001, 95-104). There has also been a rever-
No. DELEGACIÓN/MUNICIPALITY TOTAL POPULATION POPULATION INCREASE MEAN ANNUAL GROWTH RATE
1990 1995 2000 1990-95 1995-2000 1990-2000 1990-95 1995-2000 1990-2000
6 Atlautla 18,993 22,634 25,950 3,641 3,316 6,957 3.15 3.25 3.20
7 Axapusco 15,803 17,848 20,516 2,045 2,668 4,713 2.18 3.31 2.67
8 Ayapango 4,239 4,858 5,947 619 1,089 1,708 2.44 4.84 3.47
9 Coacalco 152,082 204,674 252,555 52,592 47,881 100,473 5.39 5.03 5.24
10 Cocotitlan 8,068 9,290 10,205 1,222 915 2,137 2.53 2.22 2.40
11 Coyotepec 24,451 30,619 35,358 6,168 4,739 10,907 4.06 3.42 3.79
12 Cuautitlan de R. R. 48,858 57,373 75,836 8,515 18,463 26,978 2.88 6.74 4.53
13 Chalco de Díaz de C. 282,940 175,521 217,972 -107,419 42,451 -64,968 -8.10 5.19 -2.59
14 Chiautla 14,764 16,602 19,620 1,838 3,018 4,856 2.10 3.98 2.91
15 Chicoloapan 57,306 71,351 77,579 14,045 6,228 20,273 3.95 1.97 3.10
16 Chiconcuac 14,179 15,448 17,972 1,269 2,524 3,793 1.53 3.60 2.42
17 Chimalhuacán 242,317 412,014 490,772 169,697 78,758 248,455 9.84 4.17 7.37
18 Ecatepec de Morelos 1,218,135 1,457,124 1,622,697 238,989 165,573 404,562 3.22 2.55 2.93
19 Ecatzingo 5,808 6,949 7,916 1,141 967 2,108 3.22 3.09 3.17
20 Huehuetoca 25,529 32,718 38,458 7,189 5,740 12,929 4.49 3.85 4.22
21 Hueypoxtla 26,189 31,124 33,343 4,935 2,219 7,154 3.10 1.62 2.46
22 Huixquilucan 131,926 168,221 193,468 36,295 25,247 61,542 4.39 3.32 3.93
23 Isidro Fabela 5,190 5,190 8,168 1,416 1,562 2,978 4.36 5.08 4.68
24 Ixtapaluca 137,357 137,357 297,570 50,333 109,880 160,213 5.68 11.37 8.10
25 Jaltenco 22,803 22,803 31,629 3,435 5,391 8,826 2.51 4.46 3.35
26 Jilotzingo 9,011 9,011 15,086 3,401 2,674 6,075 5.83 4.66 5.33
27 Juchitepec 14,270 14,270 18,968 3,217 1,481 4,698 3.66 1.92 2.91
28 Melchor Ocampo 26,154 26,154 37,716 7,301 4,261 11,562 4.45 2.84 3.76
29 Naucalpan de Juárez 786,551 786,551 858,711 53,172 18,988 72,160 1.16 0.52 0.89
30 Nezahualcoyotl 1,256,115 1,256,115 1,225,972 -22,247 -7,896 -30,143 -0.32 -0.15 -0.24
31 Nextlalpan 10,840 10,840 19,532 4,213 4,479 8,692 5.98 6.28 6.11
32 Nicolás Romero 184,134 184,134 269,546 52,930 32,482 85,412 4.57 3.05 3.91
33 Nopaltepec 5,234 5,234 7,512 1,258 1,020 2,278 3.88 3.47 3.71
Table 4. Metropolitan Mexico City (zona metropolitana del Valle de México): Population by delegation y Municipality 1990 to 2000 (continue)
8
Urban Slums Reports: The case of Mexico City, Mexico
sal in the equally important influx into the capital city ofthe better educated from provincial towns and cities, insearch of higher education and professional advance-ment. Since 1990, Metropolitan Mexico City has showna negative migration balance, both in absolute number–there are more emigrants than immigrants - and interms of human capital; those leaving the city are betterqualified and more active economically than those whodo not, while the immigrants are the least qualified(Table 11).
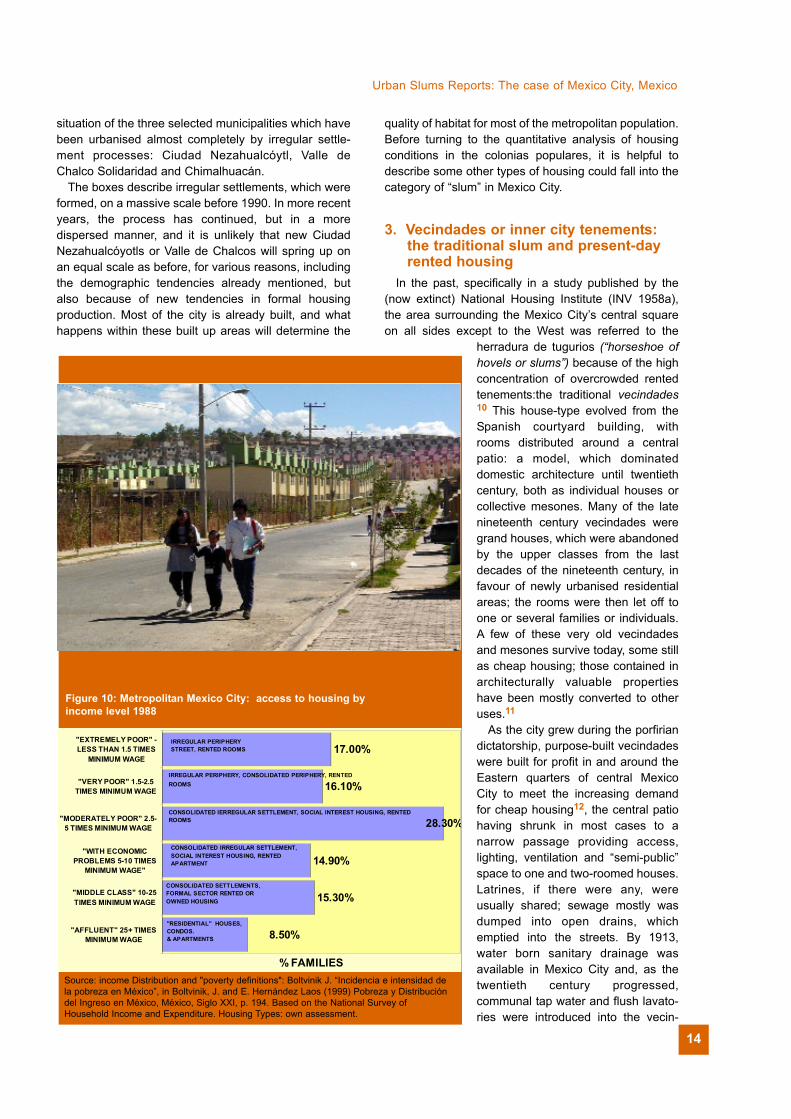
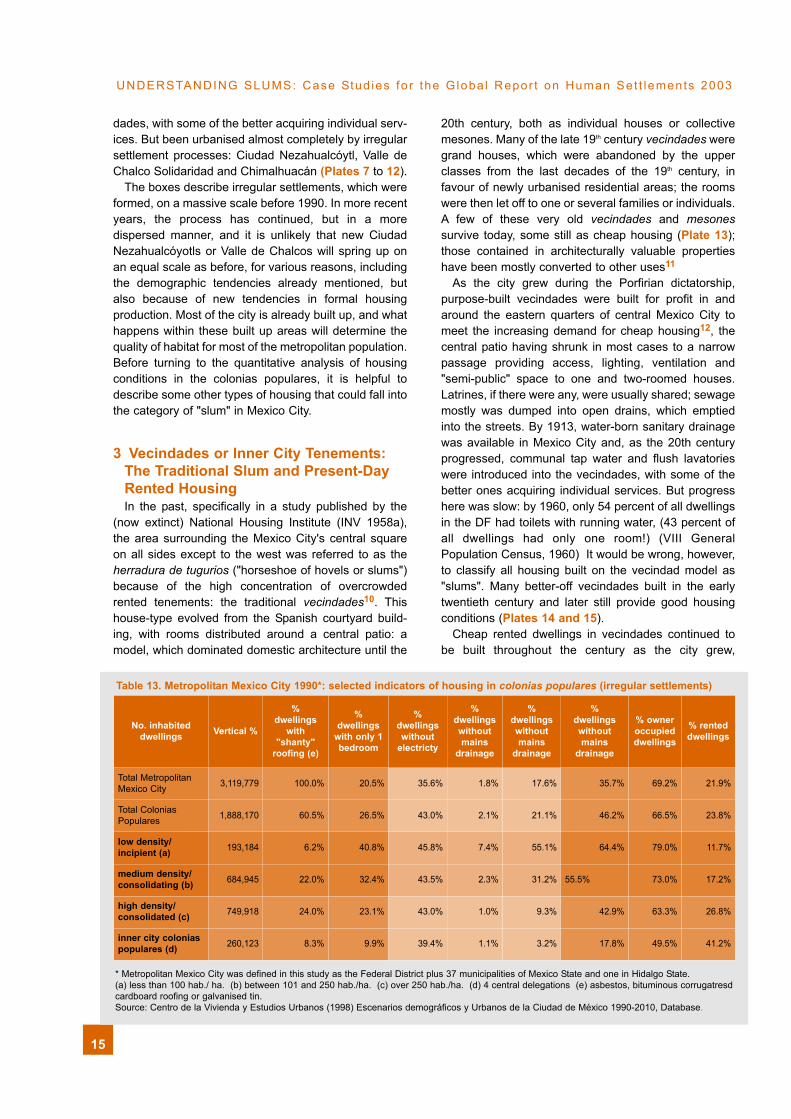
These socio-demographic changes have alsoaffected the population’s disposable income; familyincome is now a more important indicator of poverty orability to pay than individual incomes, although accessto monetary and other resources within families is notnecessarily equitably distributed. The principal wageearner is not always the main contributor to familyincome, for example. Figure 9 compares the male andfemale economically active population in MetropolitanMexico City. Figure 10, shows the distribution of family
NO. DELEGACIÓN/ MUNICIPALITY TOTAL POPULATION POPULATION INCREASE MEAN ANNUAL GROWTH RATE
1990 1995 2000 1990-95 1995-2000 1990-2000 1990-95 1995-2000 1990-2000
34 Otumba 21,834 25,415 29,097 3,581 3,682 7,263 2.72 3.21 2.94
35 Ozumba 18,052 21,424 23,592 3,372 2,168 5,540 3.07 2.28 2.73
36 Papalotla 2,387 2,998 3,469 611 471 1,082 4.11 3.47 3.84
37 La Paz 134,782 178,538 212,694 43,756 34,156 77,912 5.10 4.18 4.70
38 San Martin de las P. 13,563 16,881 19,694 3,318 2,813 6,131 3.95 3.67 3.83
39 Tecamac 123,218 148,432 172,813 25,214 24,381 49,595 3.35 3.62 3.47
40 Temamatla 5,366 7,720 8,840 2,354 1,120 3,474 6.64 3.22 5.16
41 Temascalapa 19,099 24,440 29,307 5,341 4,867 10,208 4.46 4.33 4.41
42 Tenango del Aire 6,207 7,282 8,486 1,075 1,204 2,279 2.86 3.64 3.20
43 Teoloyucan 41,964 54,454 66,556 12,490 12,102 24,592 4.72 4.80 4.76
44 Teotihuacán 30,486 39,183 44,653 8,697 5,470 14,167 4.54 3.10 3.92
45 Tepetlaoxtoc 16,120 19,380 22,729 3,260 3,349 6,609 3.31 3.79 3.52
46 Tepetlixpa 12,687 15,181 16,863 2,494 1,682 4,176 3.22 2.49 2.91
47 Tepotzotlan 39,647 54,419 62,280 14,772 7,861 22,633 5.76 3.20 4.66
48 Tequixquiac 20,784 24,766 28,067 3,982 3,301 7,283 3.15 2.97 3.07
49 Texcoco 140,368 173,106 204,102 32,738 30,996 63,734 3.78 3.92 3.84
50 Tezoyuca 12,416 16,338 18,852 3,922 2,514 6,436 4.97 3.40 4.30
51 Tlalmanalco 32,984 38,396 42,507 5,412 4,111 9,523 2.72 2.41 2.59
52 Tlalnepantla 702,807 713,143 721,415 10,336 8,272 18,608 0.26 0.27 0.26
53 Tultepec 47,323 75,996 93,277 28,673 17,281 45,954 8.74 4.90 7.08
54 Tultitlan 246,464 361,434 432,141 114,970 70,707 185,677 7.01 4.26 5.82
55 Villa del Carbon 27,283 30,726 37,993 3,443 7,267 10,710 2.12 5.09 3.39
56 Zumpango 71,413 91,642 99,774 20,229 8,132 28,361 2.12 2.01 3.43
57 Cuahutitlan Izcalli 326,750 417,647 453,298 90,897 35,651 126,548 4.51 1.93 3.35
58 Valle de ChalcoSolidaridad - 287,073 323,461 - 36,388 - 4.44 2.83 -
59 Tizayuca (HIDALGO 30,293 39,353 46,344 9,060 6,991 16,051 4.74 3.89 4.38
Source: XI Censo General de Población y Vivienda 1990, Conteo de Población y Vivienda 1995, XII Censo General de Población y Vivienda 2000Elaboration: J. Velázquez, OCIM-SIG Proyect, Universidad Autónoma Metropoolitana-Azcapotzalco.
Table 4. Metropolitan Mexico City (zona metropolitana del Valle de México): Population by delegation y Municipality 1990 to 2000 (continue)
earned income, based the family income and expendi-ture survey, with approximate correspondence withaccess to the housing market.
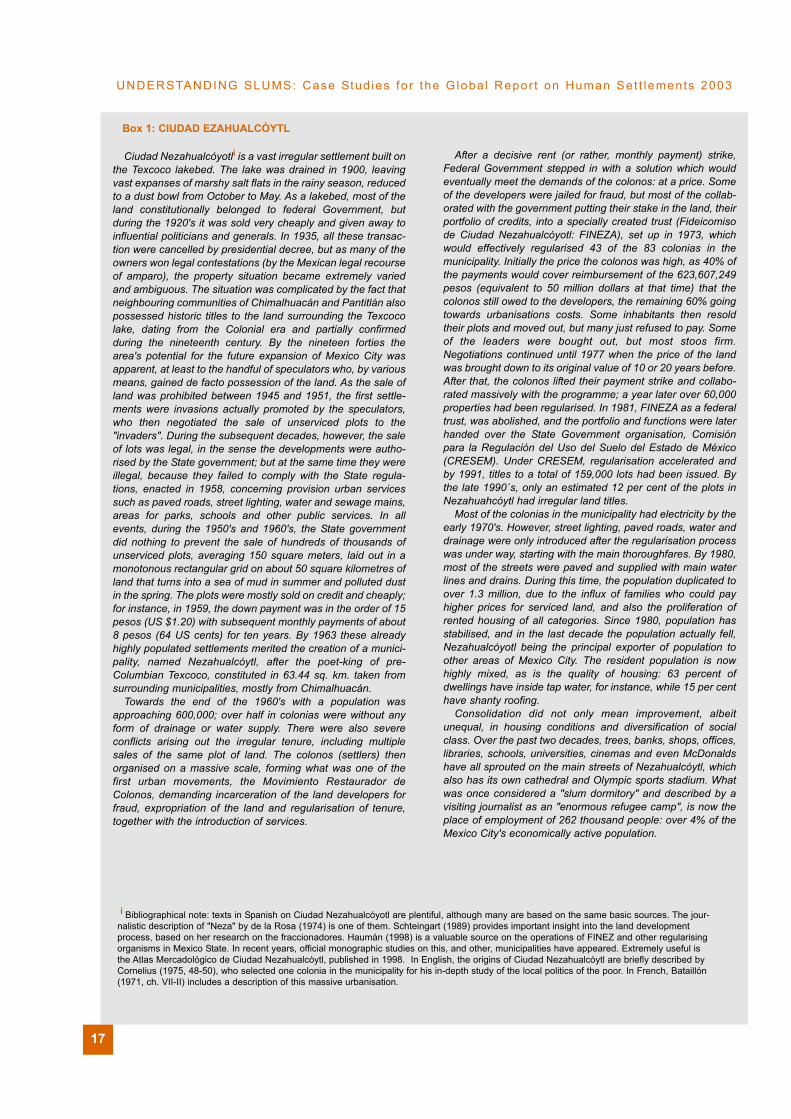
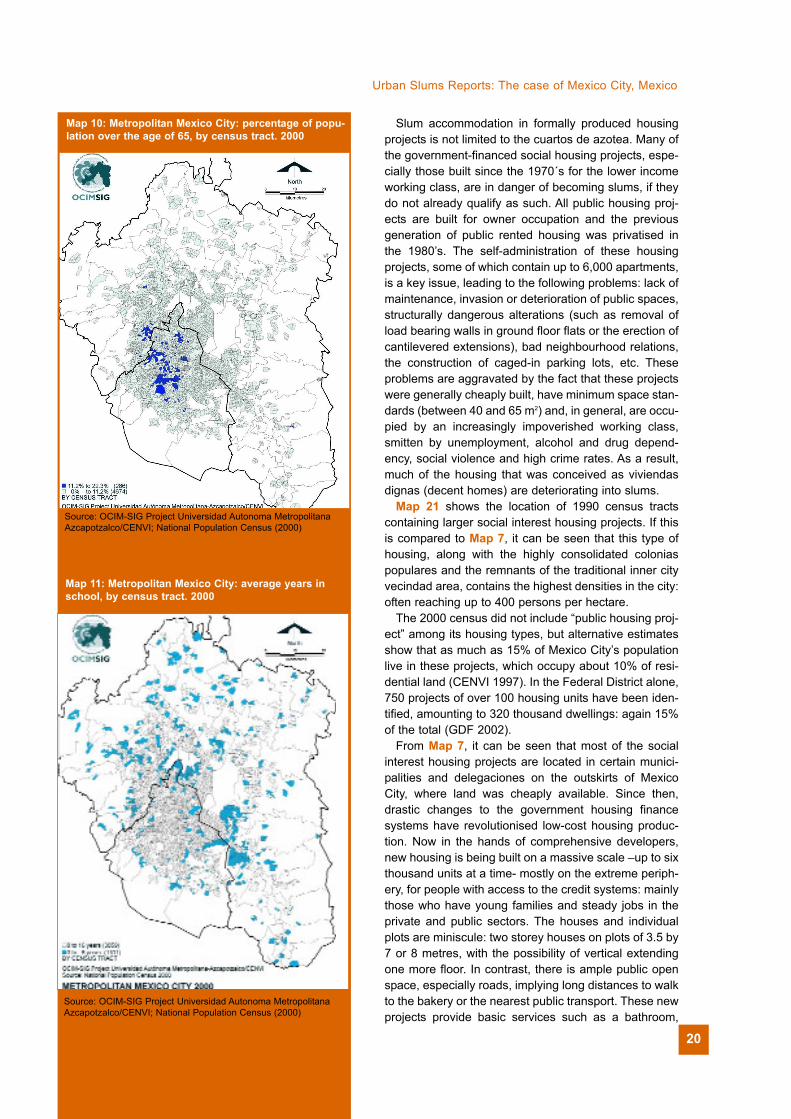
The overall convergence at a national level of socio-demographic indicators contrasts with strong variationswithin Mexico City. It will have been noted that thehousehold growth rate is much slower in Federal Districtthan in the Metropolitan Municipalities; the population isolder, with a higher proportion of women in the work-force and as heads of households; mean householdsize is smaller, in general, all socio-economic indicatorsrelating to education, health and income are better in theFederal District. In contrast, the population in theMetropolitan Municipalities is younger, has lower educa-tion levels and is composed of larger families, with alower incidence of female-headed households. Breakingthe data down further into the Federal District’s delega-ciones and the metropolitan municipalities, a clearerpicture of population shifts and socio-economic trendsemerges. By 2000, eight delegaciones and two metro-politan municipalities were losing population, while themajor gains were in certain municipalities to the Eastand South. Map 8 shows the most recent relative andabsolute population shifts. Disaggregating the 2000data further, Maps 9 to 16 show the distribution of thefollowing socio-demographic indicators by census tract:age, education levels, fertility rates, economic participa-tion rates, incidence of female headed households andincome levels. The less-educated lower income popula-tion is clearly concentrated on the urban fringes, espe-cially to the East of the city, following the historicalpattern of social segregation. Here also there are morepeople under the age of fifteen and, in general, a lowereconomic participation rate. The incidence of female-headed households does not seem relate to poverty,quite the opposite: the richer, more central, areas of thecity, with a more active female workforce and a higherincidence of widows, contain proportionally morefemale-headed households (Map 14).
5. Mexico City’s EconomyOne explanation of the extraordinary degree of
economic and demographic concentration in MexicoCity is the competitive advantage of cumulative invest-ment in productive infrastructure, inherited from previ-ous eras and enhanced throughout the twentiethcentury (Garza 1985). The influence of the politicallycentralised post revolutionary presidential regimes andthe consolidation of a one party state, in power until2000, are equally important. Economic, political andeducational opportunities, as well as markets, wereoverwhelmingly concentrated in the capital. Not surpris-ingly, it was here that the major part of Mexico’s importsubstitution industrial growth took place, at first due tothe World War II bonanza for already existing industries,and subsequently on the strength of national and,
9
UNDERSTANDING SLUMS: Case Stud ies fo r the G loba l Repor t on Human Set t lements 2003
Table 5: Mexico City climate: mean annual rainfall
TACUBAYA (1921-2000) 787.7 mm.
Dryest year (1945.) 460.3 mm.
Wettest year (1976) 1,161.5 mm.
EL GUARDA (1958-2000) 1,343.7 mm.
Dryest Year (1960) 878.9 mm.
Wettest year (1990 2,873.0 mm.
Source: INEGI (2001) Cuaderno Estadístico de la Zona Metropolitanade la Ciudad de México, pp. 10,
Table 6: Mexico City Valley: Hydrological balance 2001
IN mm3 / year mm3 /sec.
Rainfall 6,645.58 210.73
Imported from other valleys 625.815 19.844
Extracted from subsoil withinthe Mexico City Valley 1,846.19 58.542
OUT
Evaporation by transpiration -5,256.61 -166,686
Evaporation from surfacewater -120.468 -3.82
Infiltration to subsoil -788.4 -25
Evaporation from soil -1,363.99 -43.252
Removed from Valley bydrainage -1,588.12 -50.359
TOTAL 0 0
Source: Domínguez Mora, E. (2001) "Agua: Escasez y Vulnerabilidaden la Zona Metropolitana del Valle de México", paper presentedsemina Día Mundial del Agua, Mexico City 22-23 march 2001.
Data sources: 900-1930, Unikel, L (1976) El Desarroillo Urbano deMéxico, México DF, El Colegio de México, p. 57; 1930-1990,CONAPO (1994) CONAPO (1994) Información Básica sobreMigración por Entidad Federativa, México, Consejo Nacional dePoblación,Consejo Nacional de Población, México DF, p. 30. 2000:CONAPO (2001) La Población de México en el Nuevo Siglo, p. 106.
Figure 5: Primacy index of Mexico City 1900-2000in relation to the six next largest cities
10
Urban Slums Reports: The case of Mexico City, Mexico
increasingly, foreign direct investment by multinationalcompanies, all nurtured by monetary, trade and publicinvestment policies. As Table 12 shows, Mexico City’scontribution to the national economy, already dominant,continued to increase until 1970.
After this, Mexico City’s economic pre-eminencebegan to wane, coincident with the end of the long postwar global boom. The critical effects of world recessionwere postponed in Mexico, due to buoyant oil revenuesand public expenditure financed by an escalatingnational debt. This included ambitious public works proj-ects for Mexico City: the metro, roads and deepdrainage, which gave a new lease of life to the nowmetropolitan-scale city. The incipient recovery of theNorth Atlantic and Japanese economies, the drop in oilprices and the increased interest rates precipitated thestill inward-looking Mexican economy into unprece-dented fiscal crisis in 1982. The ensuing three-figureinflation rates, constant currency devaluations, abruptsubstitution of economic nationalism for “free trade” andstringent cutbacks in public expenditure, particularlyaffected Mexico City for a number of reasons. City Hall’sinability to pay its foreign debt curtailed the comprehen-sive public transport programme and public spending ingeneral (federal government actually had to take overMexico City’s debt in 1984). As industries geared to thedomestic market went out of business (the city as awhole lost over 385,000 industrial jobs between 1980and 19936), construction protects ground to a halt andbureaucrats were rationalised out of work or decen-tralised, unemployment soared, pushing the rising adultworking population into informal occupations; commer-cial activities, particularly on-street vending became aparticularly viable option in the face of rampant inflation.All this, combined with the devastating 1885 earthquakeand increasing awareness of other environmental prob-lems, particularly traffic congestion and atmosphericpollution, undermined much of Mexico City’s compara-tive advantages causing, among other things, the rever-sal of migration flows.
6. The Governments of Mexico CityMexico, or more correctly, the United Mexican States,
is a federation with a three-tiered system of govern-ment: central government comprised of the executivebranch (a six-term presidency and cabinet), congressand senate, elected for a three-year term, and the judi-cial branch; thirty-one state governments and oneFederal District government (GDF), consisting ofelected governors and congresses (or assemblies); andmunicipal governments with elected mayors (presi-dentes municipales)and councils (cabildos). All electoralterms are non renewable. In spite of recent decentrali-sation policies, power and resources are highly concen-trated in central government, whose budget is roughlynine times that of all other levels of government
Table 7: Mexico: a revolution in vital statistics
GLOBAL FERTILITY RATE
1970 2000 2020
D.F. 5.3 D.F. 1.95 D.F. 1.6
TLAXCALA 8.4 GUERRERO 3.6 GUERRERO 2.0
LIFE EXPECTANCY
1970 2000 2020
D.F. 68 YEARS D.F. 76 YEARS D.F. 81 YEARS
OAXACA 50 CHIAPAS 70 CHIAPAS 79
Source: CONAPO (1982) México Demográfico; CONAPO (2002)http://conapo.gob.mx/
Table 8: Mexico City: mean annual growth rate 1990-2000
POPULATION HOUSEHOLDS
TOTAL METROPOLITANMEXICO CITY
1.70% 3.72%
FEDERAL DISTRICT 0.44% 1.59%
METROPOLITAN MUNCIPALITIES 2.96% 3.99%
TOTAL NATIONAL 1.90%
Source: Population Census 1990, 2000
Table 9: Metropolitan Mexico City: economic participation rate by gender 1970 and 2000 (population of 12 years and over)
1970
MEN WOMEN TOTAL
TOTAL METROPOLITANMEXICO CITY 79.5% 27.0% 47.6%
FEDERAL DISTRICT 70.6% 28.8% 48.4%
METROPOLITAN MUNICIPALITIES 69.9% 18.6% 44.0%
Source: 1970 Garcia, B and O. Oliveria (2001) "El mercado detrbaajo 1930.1998) in G, Garza (coord,) La Ciudad de México en elFin del Segundo Milenio, p. 282; 2000: National Population Census
Table 10. Metropolitan Mexico City: percentage offemale-headed households 2000
2000
TOTAL METROPOLITAN MEXICO CITY 22.3%
FEDERAL DISTRICT 25.8%
METROPOLITAN MUNICIPALITIES 18.7%
Source: National Population Census
combined. Throughout most of the twentieth century,political power at all levels of government was virtuallymonopolised by a single party: the RevolutionaryInstitutional Party (PRI). Political reform was started inthe late 1970’s, slowly at first, with electoral successesof opposition parties being limited to lower levels ofgovernment, but gathering momentum towards the endof the century. The 2000 presidential elections returnedVicente Fox, representing the centre-right NationalAction Party (PAN). Until 1998, the national Presidentdesignated the Federal District government, like aministerial post, and he in turn designated heads (dele-gados) of the 16 delegaciones or boroughs. The firstelected Head of Government in the federal District wasCuauhtémoc Cárdenas of the centre-left RevolutionaryDemocratic Party (PRD), son of Lázaro Cárdenas, thenationalist president of the 1930’s. The delegados werealso elected for the first time in 2000, resulting roughlyin an even split between the PAN and the PRD, while atthe same time, the Federal District’s electorate’s prefer-ence for the centre-left was confirmed by the victory ofPRD candidate Andrés Manuel López Obrador. In thesame year, municipal and state government elections inMexico State returned a PRI governor and a mixture ofparties at the municipal level. The resulting highlycomplex electoral geography Metropolitan Mexico Cityis illustrated in Map 17.
The effects of these political and administrativereforms are equally complex; the following are onlysome of the main impacts on the lives of Mexico City’slow-income populations. First, the replacement of thetraditional one-party corporativist clientilism by competi-tive electioneering has altered the unwritten rulesgoverning access to benefits and basic necessities,such as housing credits, urban services, regularisationprogrammes and social subsidies. The role of politicalintermediaries, such as the “official” trade unions,community leaders, professional invaders and otherkinds of grass-roots organisation representatives isbeing undermined, though in many cases the samepractices and political culture persists, with different –orsometimes the same- social actors on the scene.Political reform is combined with changes in socialpolicy, which aims at replacing collective targeting andaspirations of global coverage by the individualisation ofbenefits with a view to “targeting the most needy”. Thepractical effects are, however, uneven, given that alllevels of government, and different agencies within eachlevel of government, implement social policy. Forinstance, the whole social policy framework of the newFederal District Government, in which investment andsubsidies are allocated by committees at a micro territo-rial level, is a radical departure from the systems oper-ated by central government. And within the FederalDistrict, the interaction between the GDF and the dele-gaciones varies according to the political colour andparticular policy of each delegación, giving rise to a
11
UNDERSTANDING SLUMS: Case Stud ies fo r the G loba l Repor t on Human Set t lements 2003
Table 11. Metropolitan Mexico City: comparison betweenemigrants, immigrants and those who did not migrate1995 to 2000
NON MIGRANT INMIGRANT EMMIGRANT
UNDER 15 YEARS OLD
30.4% 19.0% 25.1%
OVER 15 YEARS OLD
69.6% 81.0% 74.9%
OVER 15 WITH ONLYPRIMARY EDUCATIONOR LESS
21.4% 31.7% 19.9%
WITH HIGHER EDUCATION* 16.8% 15.2% 23.3%
ECONOMICALLYACTIVE** 40.6% 52.8% 53.8%
* Teacher Training, Technical carreer, University and posgraduate** Population of 12 years and over who work or a looking for work
Source: 2000 National Population and Housing Census, Microdata of10% sample with extended questionaire
Table 12. Mexico: contribution of Mexico City to totalGDP 1990-1998, by economic sector
1900 1940 1970 1980 1988 1998
Primarysector 1.3% 2.0% 1.7% 2.2% 1.2% 1.5%
Secondarysector 7.9% 35.2% 41.9% 40.3% 31.0% 26.5%
Terciarysector 12.5% 35.2% 40.8% 40.3% 35.4% 37.9%
total9.2% 30.1% 37.5% 37.7% 31.9% 32.5%
Note: from 1950 onwards, the population refers to Mexico CityMetropolitan Area, comprising the Federal Capital and a variablenumber of municapalities belong to the surrounding State of Mexico(see Table 6). Source: Sobrino, J. (2001) 'Participación económica'. In G Garza(coord.) La Ciudad de México en el Fin del Segundo Milenio, Gobiernodel Distrito Federal/ El Colegio de México, México DF. P.163
Source: Population census of respective years
Figure 6 Metropolitan Mexico city: Population growth1950-2000
12
Urban Slums Reports: The case of Mexico City, Mexico
multiplicity of situations regarding social policy imple-mentation and public participation. All these changesare extremely recent and, given the wide variety ofoutcomes, it is impossible at the moment to describe,much less evaluate, the new styles of governance ofthe various levels and instances of Metropolitan MexicoCity’s public administration.
II. HOUSING AND POVERTY
1. Types of “Slums” and Housing Povertyin Mexico City: Introduction
Although most housing in Mexico would probably beconsidered to be a slum by Northern European stan-dards, the term “slum” –barrio bajo o tugurio inSpanish- is not generally used to describe any specifictype of settlement or dwelling in this country today7.This does not mean that the problem of bad housing isnot recognised; in fact many definitions of povertyinclude unsatisfied housing needs8. But unsatisfiedbasic housing needs, or “housing poverty”, is spreadthroughout large areas of the city and seldom limited toneighbourhoods identifiable as “slums”. It is also to befound in a variety of housing types and settlementsincluding projects, which have been designed toprovide “decent homes” (una morada digna), all ofwhich also provide some excellent places to live. Thebest way to describe and classify the “slums” of MexicoCity is therefore to identify the main types of housingand settlements where unsatisfied housing needs arepresent. Clearly this description must refer to pastprocesses. The nature and extent of these unsatisfiedhousing needs can then be quantified, together withother indicators of poverty.
2. Irregular SettlementsThe most critical housing conditions in Mexico City
today are undoubtedly to be found in the asentamien-tos irregulares or colonias populares (“irregular settle-ments” or “popular colonies)9 The term colonias popu-lares –the Mexican equivalent to the Brazilian favelas,the barrios de rancho of Caracas or the pueblos nuevosof Lima- is really a residual category: the colonias aredefined not by what they are, but by what they are not.Essentially, popular denotes not “well to do”, though notnecessarily “poor” or “extremely poor” and “irregular”means that they were not legally developed. Thecauses of their illegality, however, have included a vari-ety of closely interlinked conditions: unauthorised landdevelopment, non-fulfilment and inexistence of buildingpermits, initial and sometimes permanent lack of urbanservices, high risk of flooding, landslides or otherhazards, dubious or inexistent original and subsequentproperty titles, the operation of alternative property
Source: OCIM-SIG Project Universidad Autonoma MetropolitanaAzcapotzalco/CENVI; National Population Census (2000)
Source: INEGI: Cuaderno Estadístico de la Zona Metropolitanade la Ciudad de México pp- 8-9
Map 5: Mexico City: approximate location of lakes atthe time of the Spanish Conquest
Figure 7: Mexico City: mean, maximum and minimumtemperatures 2000 (Tacuba)
0
5
10
15
20
25
30
35
Jan. March May July Sept. Nov.
deg.
C
MEAN
MAXIMUM
MINIMUM
jurisdiction, in this case, agrarian communal propertylaw, with all its ambiguities and contradictions. And, ofcourse, the definition of illegality depends on legislation,which is in constant evolution. Most settlements havebecome “regularised” to a varying degree, as land titleswere devised and distributed, infrastructure and serv-ices put in, the houses improved, and shops, offices andsmall or large businesses installed. Yet, except in thevery few cases where blanket gentrification hasoccurred, the colonias populares never becomecompletely regular. Moreover, as time goes by, the regu-larised properties become irregular again, throughintestate inheritance, dilapidation or fiscal problems.
Perhaps a more important defining characteristic ofirregular settlements is not their multifaceted andconfusing legal status, but the order in which they havebeen built. Particularly important is the absence of creditfor building. The plots have often been bought in instal-ments from the informal developers and landowners,but usually without the intervention of any financial insti-tution. The lack of credit means that the whole processhas been financed, and therefore built, is stages; therate of progress depended on the amount of spare casheach family could muster. More importantly, the urbani-sation process was also incremental: starting with landoccupation, followed by electricity, road improvements,water, drainage, telephone lines. The whole process ofconsolidation has occurred at different paces and tovariable degrees. In many settlements, especially in theSouth of the city, better off people bought plots in colo-nias where consolidation is well underway, thus acceler-ating the improvement process. In general, it is true tosay that the colonias which were established in thefifties, sixties and seventies took longer to achieve serv-ices than the more recent ones, although the quality ofhousing in the latter is not necessarily any better (seebelow). The question, often asked, as to whether irreg-ular settlements and “self-build” housing is a good orbad solution is too general; they were the solutionduring the explosive stages of Mexico City’s develop-ment but the quality of environment they provide isextremely varied, both from one colonia to another, andwithin a single colonia.
As is often cited, Mexico City’s irregular settlementsconstitute roughly half of the urbanised area and housemore than 60 per cent of the city’s population: a fairlywide social spectrum not necessarily limited to the poor-est 60 percent. It is misleading, therefore, to classifythem all indiscriminately as slums (as sometimes is thecase in international housing literature). Some havebecome over the years extremely nice places to live.Appearances are deceptive, however, and alongsidehigh quality houses, very substandard housing condi-tions subsist. Other Colonias populares, start out poorerand/or never consolidate or improve for a variety ofreasons, including elevation and topographical condi-tions, obstacles to regularisation, or simply the poverty
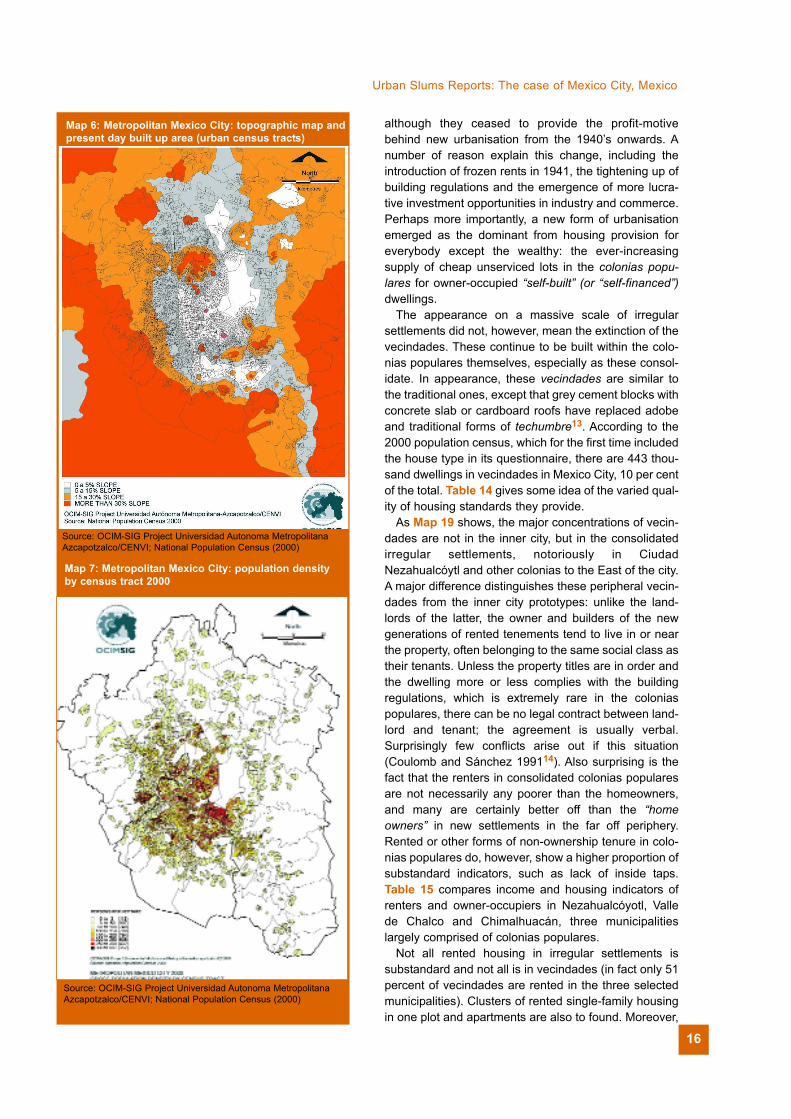
of their population; these still provide extremely precar-ious conditions to almost all their inhabitants. CiudadNezahualcóyotl, a vast agglomeration of irregular subdi-visions originating in the 1950’s, with a current popula-tion of over 1.2 million, is now highly consolidated, withits own local economy and good services. It stillcontains, however, a large proportion of precariousdwellings without water and drainage. Perhaps one ofthe advantages of this kind of housing development isthe high degree of social heterogeneity achieved. Themajority of irregular settlements existing today inMetropolitan Mexico City were formed between the mid1950’s and the 1980’s. Map 18 shows their location;Table 13 shows some main housing indicators forMexico City’s colonias populares in 1990. Boxes 1, 2and 3 describe the origins, development and current
13
UNDERSTANDING SLUMS: Case Stud ies fo r the G loba l Repor t on Human Set t lements 2003
Figure 8: Metropolitan Mexico city: age pyramids 1970 and 2000
Figure 9: Metropolitan Mexico City: distribution ofeconomically active male and female population bymonthly income level 2000
0
0.10.2
0.30.4
0.5
0.60.7
0.8
TOTAL Men Women
FEDERAL DISTRICT METROPOLITAN MUNCIPALITIES TOTAL
Source: Population census 2000
situation of the three selected municipalities which havebeen urbanised almost completely by irregular settle-ment processes: Ciudad Nezahualcóytl, Valle deChalco Solidaridad and Chimalhuacán.
The boxes describe irregular settlements, which wereformed, on a massive scale before 1990. In more recentyears, the process has continued, but in a moredispersed manner, and it is unlikely that new CiudadNezahualcóyotls or Valle de Chalcos will spring up onan equal scale as before, for various reasons, includingthe demographic tendencies already mentioned, butalso because of new tendencies in formal housingproduction. Most of the city is already built, and whathappens within these built up areas will determine the
14
Urban Slums Reports: The case of Mexico City, Mexico
quality of habitat for most of the metropolitan population.Before turning to the quantitative analysis of housingconditions in the colonias populares, it is helpful todescribe some other types of housing could fall into thecategory of “slum” in Mexico City.
3. Vecindades or inner city tenements: the traditional slum and present-day rented housing
In the past, specifically in a study published by the(now extinct) National Housing Institute (INV 1958a),the area surrounding the Mexico City’s central squareon all sides except to the West was referred to the
herradura de tugurios (“horseshoe ofhovels or slums”) because of the highconcentration of overcrowded rentedtenements:the traditional vecindades10 This house-type evolved from theSpanish courtyard building, withrooms distributed around a centralpatio: a model, which dominateddomestic architecture until twentiethcentury, both as individual houses orcollective mesones. Many of the latenineteenth century vecindades weregrand houses, which were abandonedby the upper classes from the lastdecades of the nineteenth century, infavour of newly urbanised residentialareas; the rooms were then let off toone or several families or individuals.A few of these very old vecindadesand mesones survive today, some stillas cheap housing; those contained inarchitecturally valuable propertieshave been mostly converted to otheruses.11
As the city grew during the porfiriandictatorship, purpose-built vecindadeswere built for profit in and around theEastern quarters of central MexicoCity to meet the increasing demandfor cheap housing12, the central patiohaving shrunk in most cases to anarrow passage providing access,lighting, ventilation and “semi-public”space to one and two-roomed houses.Latrines, if there were any, wereusually shared; sewage mostly wasdumped into open drains, whichemptied into the streets. By 1913,water born sanitary drainage wasavailable in Mexico City and, as thetwentieth century progressed,communal tap water and flush lavato-ries were introduced into the vecin-
Figure 10: Metropolitan Mexico City: access to housing by income level 1988
Source: income Distribution and "poverty definitions": Boltvinik J. “Incidencia e intensidad dela pobreza en México”, in Boltvinik, J. and E. Hernández Laos (1999) Pobreza y Distribucióndel Ingreso en México, México, Siglo XXI, p. 194. Based on the National Survey ofHousehold Income and Expenditure. Housing Types: own assessment.
15.30%
14.90%
28.30%
16.10%
17.00%
8.50%"AFFLUENT" 25+ TIMESMINIMUM WAGE
"MIDDLE CLASS" 10-25TIMES MINIMUM WAGE
"WITH ECONOMICPROBLEMS 5-10 TIMES
MINIMUM WAGE"
"MODERATELY POOR" 2.5-5 TIMES MINIMUM WAGE
"VERY POOR" 1.5-2.5TIMES MINIMUM WAGE
"EXTREMELY POOR" -LESS THAN 1.5 TIMES
MINIMUM WAGE
% FAMILIES
IRREGULAR PERIPHERYSTREET, RENTED ROOMS
IRREGULAR PERIPHERY, CONSOLIDATED PERIPHERY, RENTED ROOMS
CONSOLIDATED IERREGULAR SETTLEMENT, SOCIAL INTEREST HOUSING, RENTED ROOMS
CONSOLIDATED IRREGULAR SETTLEMENT, SOCIAL INTEREST HOUSING, RENTED APARTMENT
CONSOLIDATED SETTLEMENTS, FORMAL SECTOR RENTED OR OWNED HOUSING
"RESIDENTIAL" HOUSES, CONDOS. & APARTMENTS
dades, with some of the better acquiring individual serv-ices. But been urbanised almost completely by irregularsettlement processes: Ciudad Nezahualcóytl, Valle deChalco Solidaridad and Chimalhuacán (Plates 7 to 12).
The boxes describe irregular settlements, which wereformed, on a massive scale before 1990. In more recentyears, the process has continued, but in a moredispersed manner, and it is unlikely that new CiudadNezahualcóyotls or Valle de Chalcos will spring up onan equal scale as before, for various reasons, includingthe demographic tendencies already mentioned, butalso because of new tendencies in formal housingproduction. Most of the city is already built up, and whathappens within these built up areas will determine thequality of habitat for most of the metropolitan population.Before turning to the quantitative analysis of housingconditions in the colonias populares, it is helpful todescribe some other types of housing that could fall intothe category of "slum" in Mexico City.
3 Vecindades or Inner City Tenements:The Traditional Slum and Present-DayRented HousingIn the past, specifically in a study published by the
(now extinct) National Housing Institute (INV 1958a),the area surrounding the Mexico City's central squareon all sides except to the west was referred to as theherradura de tugurios ("horseshoe of hovels or slums")because of the high concentration of overcrowdedrented tenements: the traditional vecindades10. Thishouse-type evolved from the Spanish courtyard build-ing, with rooms distributed around a central patio: amodel, which dominated domestic architecture until the
20th century, both as individual houses or collectivemesones. Many of the late 19th century vecindades weregrand houses, which were abandoned by the upperclasses from the last decades of the 19th century, infavour of newly urbanised residential areas; the roomswere then let off to one or several families or individuals.A few of these very old vecindades and mesonessurvive today, some still as cheap housing (Plate 13);those contained in architecturally valuable propertieshave been mostly converted to other uses11
As the city grew during the Porfirian dictatorship,purpose-built vecindades were built for profit in andaround the eastern quarters of central Mexico City tomeet the increasing demand for cheap housing12, thecentral patio having shrunk in most cases to a narrowpassage providing access, lighting, ventilation and"semi-public" space to one and two-roomed houses.Latrines, if there were any, were usually shared; sewagemostly was dumped into open drains, which emptiedinto the streets. By 1913, water-born sanitary drainagewas available in Mexico City and, as the 20th centuryprogressed, communal tap water and flush lavatorieswere introduced into the vecindades, with some of thebetter ones acquiring individual services. But progresshere was slow: by 1960, only 54 percent of all dwellingsin the DF had toilets with running water, (43 percent ofall dwellings had only one room!) (VIII GeneralPopulation Census, 1960) It would be wrong, however,to classify all housing built on the vecindad model as"slums". Many better-off vecindades built in the earlytwentieth century and later still provide good housingconditions (Plates 14 and 15).
Cheap rented dwellings in vecindades continued tobe built throughout the century as the city grew,
15
UNDERSTANDING SLUMS: Case Stud ies fo r the G loba l Repor t on Human Set t lements 2003
Table 13. Metropolitan Mexico City 1990*: selected indicators of housing in colonias populares (irregular settlements)
No. inhabiteddwellings Vertical %
% dwellings
with"shanty"
roofing (e)
%dwellings
with only 1bedroom
%dwellingswithout
electricty
% dwellingswithoutmains
drainage
% dwellingswithoutmains
drainage
% dwellingswithoutmains
drainage
% owneroccupieddwellings
% renteddwellings
Total MetropolitanMexico City 3,119,779 100.0% 20.5% 35.6% 1.8% 17.6% 35.7% 69.2% 21.9%
Total ColoniasPopulares 1,888,170 60.5% 26.5% 43.0% 2.1% 21.1% 46.2% 66.5% 23.8%
low density/incipient (a) 193,184 6.2% 40.8% 45.8% 7.4% 55.1% 64.4% 79.0% 11.7%
medium density/consolidating (b) 684,945 22.0% 32.4% 43.5% 2.3% 31.2% 55.5% 73.0% 17.2%
high density/consolidated (c) 749,918 24.0% 23.1% 43.0% 1.0% 9.3% 42.9% 63.3% 26.8%
inner city coloniaspopulares (d) 260,123 8.3% 9.9% 39.4% 1.1% 3.2% 17.8% 49.5% 41.2%
* Metropolitan Mexico City was defined in this study as the Federal District plus 37 municipalities of Mexico State and one in Hidalgo State. (a) less than 100 hab./ ha. (b) between 101 and 250 hab./ha. (c) over 250 hab./ha. (d) 4 central delegations (e) asbestos, bituminous corrugatresdcardboard roofing or galvanised tin.Source: Centro de la Vivienda y Estudios Urbanos (1998) Escenarios demográficos y Urbanos de la Ciudad de México 1990-2010, Database.
16
Urban Slums Reports: The case of Mexico City, Mexico
although they ceased to provide the profit-motivebehind new urbanisation from the 1940’s onwards. Anumber of reason explain this change, including theintroduction of frozen rents in 1941, the tightening up ofbuilding regulations and the emergence of more lucra-tive investment opportunities in industry and commerce.Perhaps more importantly, a new form of urbanisationemerged as the dominant from housing provision foreverybody except the wealthy: the ever-increasingsupply of cheap unserviced lots in the colonias popu-lares for owner-occupied “self-built” (or “self-financed”)dwellings.
The appearance on a massive scale of irregularsettlements did not, however, mean the extinction of thevecindades. These continue to be built within the colo-nias populares themselves, especially as these consol-idate. In appearance, these vecindades are similar tothe traditional ones, except that grey cement blocks withconcrete slab or cardboard roofs have replaced adobeand traditional forms of techumbre13. According to the2000 population census, which for the first time includedthe house type in its questionnaire, there are 443 thou-sand dwellings in vecindades in Mexico City, 10 per centof the total. Table 14 gives some idea of the varied qual-ity of housing standards they provide.
As Map 19 shows, the major concentrations of vecin-dades are not in the inner city, but in the consolidatedirregular settlements, notoriously in CiudadNezahualcóytl and other colonias to the East of the city.A major difference distinguishes these peripheral vecin-dades from the inner city prototypes: unlike the land-lords of the latter, the owner and builders of the newgenerations of rented tenements tend to live in or nearthe property, often belonging to the same social class astheir tenants. Unless the property titles are in order andthe dwelling more or less complies with the buildingregulations, which is extremely rare in the coloniaspopulares, there can be no legal contract between land-lord and tenant; the agreement is usually verbal.Surprisingly few conflicts arise out if this situation(Coulomb and Sánchez 199114). Also surprising is thefact that the renters in consolidated colonias popularesare not necessarily any poorer than the homeowners,and many are certainly better off than the “homeowners” in new settlements in the far off periphery.Rented or other forms of non-ownership tenure in colo-nias populares do, however, show a higher proportion ofsubstandard indicators, such as lack of inside taps.Table 15 compares income and housing indicators ofrenters and owner-occupiers in Nezahualcóyotl, Vallede Chalco and Chimalhuacán, three municipalitieslargely comprised of colonias populares.
Not all rented housing in irregular settlements issubstandard and not all is in vecindades (in fact only 51percent of vecindades are rented in the three selectedmunicipalities). Clusters of rented single-family housingin one plot and apartments are also to found. Moreover,
Map 6: Metropolitan Mexico City: topographic map andpresent day built up area (urban census tracts)
Map 7: Metropolitan Mexico City: population densityby census tract 2000
Source: OCIM-SIG Project Universidad Autonoma MetropolitanaAzcapotzalco/CENVI; National Population Census (2000)
Source: OCIM-SIG Project Universidad Autonoma MetropolitanaAzcapotzalco/CENVI; National Population Census (2000)
UNDERSTANDING SLUMS: Case Stud ies fo r the G loba l Repor t on Human Set t lements 2003
Box 1: CIUDAD EZAHUALCÓYTL
Ciudad Nezahualcóyotli is a vast irregular settlement built onthe Texcoco lakebed. The lake was drained in 1900, leavingvast expanses of marshy salt flats in the rainy season, reducedto a dust bowl from October to May. As a lakebed, most of theland constitutionally belonged to federal Government, butduring the 1920's it was sold very cheaply and given away toinfluential politicians and generals. In 1935, all these transac-tion were cancelled by presidential decree, but as many of theowners won legal contestations (by the Mexican legal recourseof amparo), the property situation became extremely variedand ambiguous. The situation was complicated by the fact thatneighbouring communities of Chimalhuacán and Pantitlán alsopossessed historic titles to the land surrounding the Texcocolake, dating from the Colonial era and partially confirmedduring the nineteenth century. By the nineteen forties thearea's potential for the future expansion of Mexico City wasapparent, at least to the handful of speculators who, by variousmeans, gained de facto possession of the land. As the sale ofland was prohibited between 1945 and 1951, the first settle-ments were invasions actually promoted by the speculators,who then negotiated the sale of unserviced plots to the"invaders". During the subsequent decades, however, the saleof lots was legal, in the sense the developments were autho-rised by the State government; but at the same time they wereillegal, because they failed to comply with the State regula-tions, enacted in 1958, concerning provision urban servicessuch as paved roads, street lighting, water and sewage mains,areas for parks, schools and other public services. In allevents, during the 1950's and 1960's, the State governmentdid nothing to prevent the sale of hundreds of thousands ofunserviced plots, averaging 150 square meters, laid out in amonotonous rectangular grid on about 50 square kilometres ofland that turns into a sea of mud in summer and polluted dustin the spring. The plots were mostly sold on credit and cheaply;for instance, in 1959, the down payment was in the order of 15pesos (US $1.20) with subsequent monthly payments of about8 pesos (64 US cents) for ten years. By 1963 these alreadyhighly populated settlements merited the creation of a munici-pality, named Nezahualcóytl, after the poet-king of pre-Columbian Texcoco, constituted in 63.44 sq. km. taken fromsurrounding municipalities, mostly from Chimalhuacán.
Towards the end of the 1960's with a population wasapproaching 600,000; over half in colonias were without anyform of drainage or water supply. There were also severeconflicts arising out the irregular tenure, including multiplesales of the same plot of land. The colonos (settlers) thenorganised on a massive scale, forming what was one of thefirst urban movements, the Movimiento Restaurador deColonos, demanding incarceration of the land developers forfraud, expropriation of the land and regularisation of tenure,together with the introduction of services.
After a decisive rent (or rather, monthly payment) strike,Federal Government stepped in with a solution which wouldeventually meet the demands of the colonos: at a price. Someof the developers were jailed for fraud, but most of the collab-orated with the government putting their stake in the land, theirportfolio of credits, into a specially created trust (Fideicomisode Ciudad Nezahualcóyotl: FINEZA), set up in 1973, whichwould effectively regularised 43 of the 83 colonias in themunicipality. Initially the price the colonos was high, as 40% ofthe payments would cover reimbursement of the 623,607,249pesos (equivalent to 50 million dollars at that time) that thecolonos still owed to the developers, the remaining 60% goingtowards urbanisations costs. Some inhabitants then resoldtheir plots and moved out, but many just refused to pay. Someof the leaders were bought out, but most stoos firm.Negotiations continued until 1977 when the price of the landwas brought down to its original value of 10 or 20 years before.After that, the colonos lifted their payment strike and collabo-rated massively with the programme; a year later over 60,000properties had been regularised. In 1981, FINEZA as a federaltrust, was abolished, and the portfolio and functions were laterhanded over the State Government organisation, Comisiónpara la Regulación del Uso del Suelo del Estado de México(CRESEM). Under CRESEM, regularisation accelerated andby 1991, titles to a total of 159,000 lots had been issued. Bythe late 1990´s, only an estimated 12 per cent of the plots inNezahuahcóytl had irregular land titles.
Most of the colonias in the municipality had electricity by theearly 1970's. However, street lighting, paved roads, water anddrainage were only introduced after the regularisation processwas under way, starting with the main thoroughfares. By 1980,most of the streets were paved and supplied with main waterlines and drains. During this time, the population duplicated toover 1.3 million, due to the influx of families who could payhigher prices for serviced land, and also the proliferation ofrented housing of all categories. Since 1980, population hasstabilised, and in the last decade the population actually fell,Nezahualcóyotl being the principal exporter of population toother areas of Mexico City. The resident population is nowhighly mixed, as is the quality of housing: 63 percent ofdwellings have inside tap water, for instance, while 15 per centhave shanty roofing.
Consolidation did not only mean improvement, albeitunequal, in housing conditions and diversification of socialclass. Over the past two decades, trees, banks, shops, offices,libraries, schools, universities, cinemas and even McDonaldshave all sprouted on the main streets of Nezahualcóytl, whichalso has its own cathedral and Olympic sports stadium. Whatwas once considered a "slum dormitory" and described by avisiting journalist as an "enormous refugee camp", is now theplace of employment of 262 thousand people: over 4% of theMexico City's economically active population.
i Bibliographical note: texts in Spanish on Ciudad Nezahualcóyotl are plentiful, although many are based on the same basic sources. The jour-nalistic description of "Neza" by de la Rosa (1974) is one of them. Schteingart (1989) provides important insight into the land developmentprocess, based on her research on the fraccionadores. Haumán (1998) is a valuable source on the operations of FINEZ and other regularisingorganisms in Mexico State. In recent years, official monographic studies on this, and other, municipalities have appeared. Extremely useful isthe Atlas Mercadológico de Ciudad Nezahualcóytl, published in 1998. In English, the origins of Ciudad Nezahualcóytl are briefly described byCornelius (1975, 48-50), who selected one colonia in the municipality for his in-depth study of the local politics of the poor. In French, Bataillón(1971, ch. VII-II) includes a description of this massive urbanisation.
17
18
Urban Slums Reports: The case of Mexico City, Mexico
the distinction between vecindades and apartments isoften tenuous as it depends on two, not necessarilyrelated, criteria: the architectural model (apartmentsgenerally being considered to be arranged vertically)and the quality of the dwelling (apartments beingconsidered to have at least one bedroom, bathroomand kitchen). However, apartments are not per seexempted from being a slum, even the ones that dohave bedrooms, bathrooms and kitchens, especiallythose expressly built cheaply for poor people.
3. Other types of slums in Mexico CityCiudades perdidas
Fundamental research on Mexico City housingundertaken in the nineteen seventiesxviii identifiedother forms of “slum” housing in Mexico which, althoughnumerically less important than the vecindades or colo-nias populares are still in evidence around the city. Theworst housing conditions are still to be found in whatused to be called ciudades perdidas (“lost cities”): abroad concept referring to a wide variety of small-scalepockets of shanty housing occupying odd pieces ofpublicly owned land, such as alongside railway lines, inthe public thoroughfare and under pylons, or in plots ofland in otherwise built-up neighbourhoods. In the early1970’s it was estimated that between 100 to 150,000people lived in Ciudades Perdidas (COPEVI 1976,B.23), which even then was less than 1.5 percent ofMexico City’s population. Since then, most of theciudades perdidas have been eradicated, often to makeway for road works and other construction project, or forsafety reasons; in some cases the inhabitants werecompensated or offered cheap credits to buy alternativeaccommodation.
Cuartos de azoteaAnother form of slum identified in the 1970’s are the
cuartos de azotea or “rooftop homes”: mainly servantsquarters and makeshift housing on the flat roofs ofapartment buildings and early public housing projects.The 2000 census reported 17.5 thousand dwellings ofthis type in Metropolitan Mexico City, the majority ofwhich, 14.5 thousand are located within the FederalDistrict. The quality of this type of housing varies (Table16), but generally roofed-over spaces are small andservices are often shared. Against this, the cuartos deazotea are almost invariably well located in centralareas (Map 20). The inmates include a wide range ofpeople whose housing priority location, such asconcierges, students and domestic servants. (But live-in domestic workers who live in servants’ quarters onthe rooftops or elsewhere are generally registered inthe census as part of the household they work for.)
Social interest housing projects
Map 8: Metropolitan Mexico City: absolute and relativepopulation growth 1995-2000. Increase in populationand mean annual population growth by delegación andmunicipality, 1995-2000
Map 9: Metropolitan Mexico City: percentage of popu-lation under the age of 15, by census tract. 2000
Source: OCIM-SIG Project Universidad Autonoma MetropolitanaAzcapotzalco/CENVI; National Population Census (2000)
Source: OCIM-SIG Project Universidad Autonoma MetropolitanaAzcapotzalco/CENVI; National Population Census (2000)
19
UNDERSTANDING SLUMS: Case Stud ies fo r the G loba l Repor t on Human Set t lements 2003
Box 2 VALLE DE CHALCO SOLIDARIDAD
Valle de Chalco Solidaridad, like Nezahualcóytl, is a munic-ipality that was created in recent years following massive irreg-ular settlement: in this case in the agricultural municipality ofChalco, to the South East of Mexico City. Like Nezahualcóyotlalso, the area was originally under water but, unlike lakeTexcoco, Lake Chalco was a freshwater lake fed by its ownsprings, rather than by the drain-off from the entire MexicoValley. At the end of the nineteenth century a canal was builtto drain the area by Spanish entrepreneurs, the Iñigo brothers,who became the proprietors of the resulting rich agriculturalland, in detriment to the local fishing communities who previ-ously lived around the lake. After the Mexican Revolution, theIñigos' hacienda and other large agricultural properties wereexpropriated and distributed as ejidos or agrarian communalproperties to the local communities. The land on which theValle de Chalco settlements were established belonged to fourejidos in the State of Mexico and, to complicate the situationfurther, one ejido belonging to a village inside the FederalDistrict (Santa Catarina).
By the late 1970's, Mexico City's growth began to affect theChalco area. On one hand, the demographic growth of thelocal communities meant that agriculture was increasinglyunfeasible as a means of subsistence, on parcels of ejidal landaveraging 1.7 hectares per family. On the other, demand forhousing meant that the illegal sale of this land was an attrac-tive proposition. In the case of Chalco, before 1984, many ofthe transaction were not handled by the ejidatarios themselvesbut by professional intermediaries or developers, who boughtthe land off the individual ejidatarios, parcelled it out into lotsof mostly between 120 m2 and 250 sold them on credit. By thismeans the settlement process began between 1970 and 1980,when the population of the area now included in Valle deChalco Solidaridad almost doubled from 44,000 to 82,000,living in about 18 colonias.
In the following decade, it increased still more to about220,000 (Lindón 1999, 94) reaching over 323,000 in 2000.Settlement began in the North, in the area bordering the mainhighway out of Eastern Mexico City, and continued South,engulfing what used to be the hillside village of Xico, perchedon the side of an extinct volcano of the same name. Most ofthe inhabitants came from the Eastern areas of the FederalDistrict and metropolitan municipalities, especially CiudadNezahualcóyotl, where over a third of the settlers originatedaccording to one survey carried out in 1990-91 (Hiernaux andLindón 1998).
In 1984, further sales by the developers was prohibited,which had the effect of converting the ejidatarios themselvesinto the principal social agent responsible for selling the plotsof land. In the same survey, two-thirds of the families said theyhad bought land directly from the ejidatarios, a further 6 percent had bough from the ejido authorities (comisariado ejidal),22 per cent had bought from professional developers, while 4per cent had acquired their plot from a previous settler(Hiernaux and Lindón 1998, 256). Land prices in this period,coincident with hyper-inflation, high interest rates andprolonged economic crisis, were actually lower than in theearly 1980's (Castañeda 1988, Hiernaux and Lindón 1998,240-1), mostly below 100 old pesos a sq. m. at 1978 prices,(about $4 US dollars).
As the land was originally agrarian, except for a small areaof private property, the procedure for regularization implied thewholesale expropriation of the ejidos by presidential decreewith indemnification to the ejidatarios at agricultural prices,and the resale of lots to the settlers or colonos. In this case,the regularisation was handles by the State of MexicoDelegation of the Comisión Nacional para la Regularizaciónde la Tenencia de la Tierra (CoReTT). The first ejido wasexpropriated in 1978, followed by three more in 1985, 1986and 1988. In all the process takes about five years (Hiernauxand Lindón 1998. 248), except for the Ejidos belonging tovillages in the Federal District, which have taken longer. Thesettlers have had to pay from 1.6 to 2 pesos a m2 for regular-izing a plot of land for housing: up to 13.20 pesos for any landoccupied by commercial activities, plus 10% administrativecosts. This means that the cost of regularising a 120 m2 plotoccupied only by housing would have been around 215 pesosat 1992 prices, or around 80 dollars (Huamán 1998, 73). By1997, according to official figures, 14,750 plots on agrarianland had been regularized, and a further 4,917 on governmentor private property, in benefit of an estimated 110,000 people(Iracheta 2000). A survey in 1998 found that 90% of the plotsin Valle de Chalco had been regularized (Juárez 2000, 256-7).
The regularization process in this case dealt exclusively withproperty registration. But once this was underway, materialimprovements were largely financed by the new federalpoverty programme Solidaridad, which invested in 407.9million pesos (about US $160 million) in Valle de Chalcobetween 1989 and 1993 (Sobrino 1996). Federal interest inthe area was largely due to lack of support for the PRI regis-tered in the 1988 elections. As usual, the first step was elec-tricity and street lighting; this was introduced at record speedand inaugurated with great pomp and ceremony by presidentSalinas de Gortari himself in 1999. Water mains and schoolscame next, followed by more electrification, hospitals andpavements. Finally, main drainage was installed and somestreets were paved between 1992 and 1993. Drainage was,and is, a particular problem in this low-lying terrain. Floods area constant threat, turned into nightmare reality in summer1999, when large tracts of Valle de Chalco were under water,due to the overflowing of regional drainage channels.
During these years, Valle de Chalco was the centre of atten-tion of both federal and state governments. It also attractedacademic enquiry, cultural events, international architecturalcompetitions and a visit from the Pope in 1990. In 1994, thecolonias populares in the Valle de Chalco acquired a separateidentity in the form of a newly created municipality: Valle deChalco Solidaridad, with the status of a city centered aroundthe original village of Xico. The Municipality was created onland taken from five municipalities, mostly from Chalco.
Comprehensive regularization of tenure, millionaire publicworks and social investment programmes, influx of nationaland international NGOs and religious groups, not to mentionacademic concern with female-headed households, culturalidentities and perceptions, ethnicity, family roles and domesticdivisions of labour: none of this is reflected in the 2000 hous-ing indicators: 78 percent of the dwelling with no inside tap, 40percent with corrugated cardboard roofing and 20 percenthaving only one room. Valle de Chalco today still containssome of the worst housing conditions in Mexico City.
20
Urban Slums Reports: The case of Mexico City, Mexico
Slum accommodation in formally produced housingprojects is not limited to the cuartos de azotea. Many ofthe government-financed social housing projects, espe-cially those built since the 1970´s for the lower incomeworking class, are in danger of becoming slums, if theydo not already qualify as such. All public housing proj-ects are built for owner occupation and the previousgeneration of public rented housing was privatised inthe 1980’s. The self-administration of these housingprojects, some of which contain up to 6,000 apartments,is a key issue, leading to the following problems: lack ofmaintenance, invasion or deterioration of public spaces,structurally dangerous alterations (such as removal ofload bearing walls in ground floor flats or the erection ofcantilevered extensions), bad neighbourhood relations,the construction of caged-in parking lots, etc. Theseproblems are aggravated by the fact that these projectswere generally cheaply built, have minimum space stan-dards (between 40 and 65 m2) and, in general, are occu-pied by an increasingly impoverished working class,smitten by unemployment, alcohol and drug depend-ency, social violence and high crime rates. As a result,much of the housing that was conceived as viviendasdignas (decent homes) are deteriorating into slums.
Map 21 shows the location of 1990 census tractscontaining larger social interest housing projects. If thisis compared to Map 7, it can be seen that this type ofhousing, along with the highly consolidated coloniaspopulares and the remnants of the traditional inner cityvecindad area, contains the highest densities in the city:often reaching up to 400 persons per hectare.
The 2000 census did not include “public housing proj-ect” among its housing types, but alternative estimatesshow that as much as 15% of Mexico City’s populationlive in these projects, which occupy about 10% of resi-dential land (CENVI 1997). In the Federal District alone,750 projects of over 100 housing units have been iden-tified, amounting to 320 thousand dwellings: again 15%of the total (GDF 2002).
From Map 7, it can be seen that most of the socialinterest housing projects are located in certain munici-palities and delegaciones on the outskirts of MexicoCity, where land was cheaply available. Since then,drastic changes to the government housing financesystems have revolutionised low-cost housing produc-tion. Now in the hands of comprehensive developers,new housing is being built on a massive scale –up to sixthousand units at a time- mostly on the extreme periph-ery, for people with access to the credit systems: mainlythose who have young families and steady jobs in theprivate and public sectors. The houses and individualplots are miniscule: two storey houses on plots of 3.5 by7 or 8 metres, with the possibility of vertical extendingone more floor. In contrast, there is ample public openspace, especially roads, implying long distances to walkto the bakery or the nearest public transport. These newprojects provide basic services such as a bathroom,
Map 10: Metropolitan Mexico City: percentage of popu-lation over the age of 65, by census tract. 2000
Map 11: Metropolitan Mexico City: average years inschool, by census tract. 2000
Source: OCIM-SIG Project Universidad Autonoma MetropolitanaAzcapotzalco/CENVI; National Population Census (2000)
Source: OCIM-SIG Project Universidad Autonoma MetropolitanaAzcapotzalco/CENVI; National Population Census (2000)
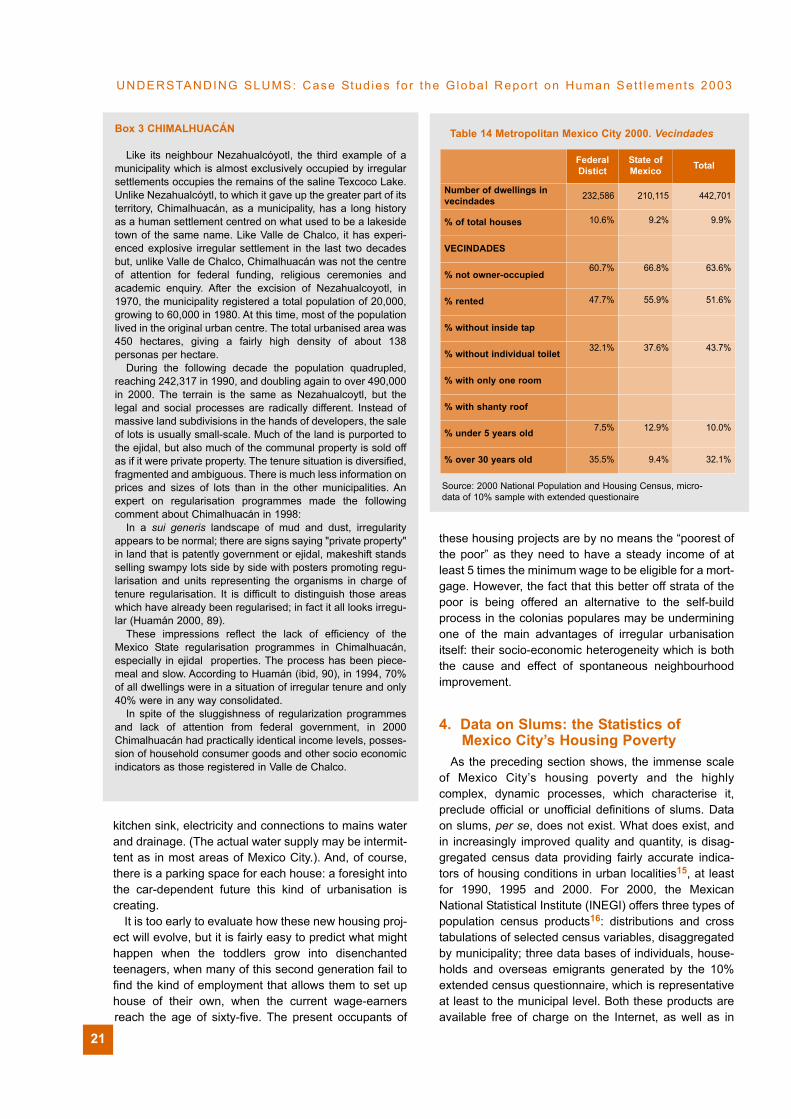
kitchen sink, electricity and connections to mains waterand drainage. (The actual water supply may be intermit-tent as in most areas of Mexico City.). And, of course,there is a parking space for each house: a foresight intothe car-dependent future this kind of urbanisation iscreating.
It is too early to evaluate how these new housing proj-ect will evolve, but it is fairly easy to predict what mighthappen when the toddlers grow into disenchantedteenagers, when many of this second generation fail tofind the kind of employment that allows them to set uphouse of their own, when the current wage-earnersreach the age of sixty-five. The present occupants of
these housing projects are by no means the “poorest ofthe poor” as they need to have a steady income of atleast 5 times the minimum wage to be eligible for a mort-gage. However, the fact that this better off strata of thepoor is being offered an alternative to the self-buildprocess in the colonias populares may be underminingone of the main advantages of irregular urbanisationitself: their socio-economic heterogeneity which is boththe cause and effect of spontaneous neighbourhoodimprovement.
4. Data on Slums: the Statistics of Mexico City’s Housing Poverty
As the preceding section shows, the immense scaleof Mexico City’s housing poverty and the highlycomplex, dynamic processes, which characterise it,preclude official or unofficial definitions of slums. Dataon slums, per se, does not exist. What does exist, andin increasingly improved quality and quantity, is disag-gregated census data providing fairly accurate indica-tors of housing conditions in urban localities15, at leastfor 1990, 1995 and 2000. For 2000, the MexicanNational Statistical Institute (INEGI) offers three types ofpopulation census products16: distributions and crosstabulations of selected census variables, disaggregatedby municipality; three data bases of individuals, house-holds and overseas emigrants generated by the 10%extended census questionnaire, which is representativeat least to the municipal level. Both these products areavailable free of charge on the Internet, as well as in
21
UNDERSTANDING SLUMS: Case Stud ies fo r the G loba l Repor t on Human Set t lements 2003
Box 3 CHIMALHUACÁN
Like its neighbour Nezahualcóyotl, the third example of amunicipality which is almost exclusively occupied by irregularsettlements occupies the remains of the saline Texcoco Lake.Unlike Nezahualcóytl, to which it gave up the greater part of itsterritory, Chimalhuacán, as a municipality, has a long historyas a human settlement centred on what used to be a lakesidetown of the same name. Like Valle de Chalco, it has experi-enced explosive irregular settlement in the last two decadesbut, unlike Valle de Chalco, Chimalhuacán was not the centreof attention for federal funding, religious ceremonies andacademic enquiry. After the excision of Nezahualcoyotl, in1970, the municipality registered a total population of 20,000,growing to 60,000 in 1980. At this time, most of the populationlived in the original urban centre. The total urbanised area was450 hectares, giving a fairly high density of about 138personas per hectare.
During the following decade the population quadrupled,reaching 242,317 in 1990, and doubling again to over 490,000in 2000. The terrain is the same as Nezahualcoytl, but thelegal and social processes are radically different. Instead ofmassive land subdivisions in the hands of developers, the saleof lots is usually small-scale. Much of the land is purported tothe ejidal, but also much of the communal property is sold offas if it were private property. The tenure situation is diversified,fragmented and ambiguous. There is much less information onprices and sizes of lots than in the other municipalities. Anexpert on regularisation programmes made the followingcomment about Chimalhuacán in 1998:
In a sui generis landscape of mud and dust, irregularityappears to be normal; there are signs saying "private property"in land that is patently government or ejidal, makeshift standsselling swampy lots side by side with posters promoting regu-larisation and units representing the organisms in charge oftenure regularisation. It is difficult to distinguish those areaswhich have already been regularised; in fact it all looks irregu-lar (Huamán 2000, 89).
These impressions reflect the lack of efficiency of theMexico State regularisation programmes in Chimalhuacán,especially in ejidal properties. The process has been piece-meal and slow. According to Huamán (ibid, 90), in 1994, 70%of all dwellings were in a situation of irregular tenure and only40% were in any way consolidated.
In spite of the sluggishness of regularization programmesand lack of attention from federal government, in 2000Chimalhuacán had practically identical income levels, posses-sion of household consumer goods and other socio economicindicators as those registered in Valle de Chalco.
Table 14 Metropolitan Mexico City 2000. Vecindades
FederalDistict
State ofMexico Total
Number of dwellings invecindades 232,586 210,115 442,701
% of total houses 10.6% 9.2% 9.9%
VECINDADES
% not owner-occupied60.7% 66.8% 63.6%
% rented 47.7% 55.9% 51.6%
% without inside tap
% without individual toilet 32.1% 37.6% 43.7%
% with only one room
% with shanty roof
% under 5 years old 7.5% 12.9% 10.0%
% over 30 years old 35.5% 9.4% 32.1%
Source: 2000 National Population and Housing Census, micro-data of 10% sample with extended questionaire
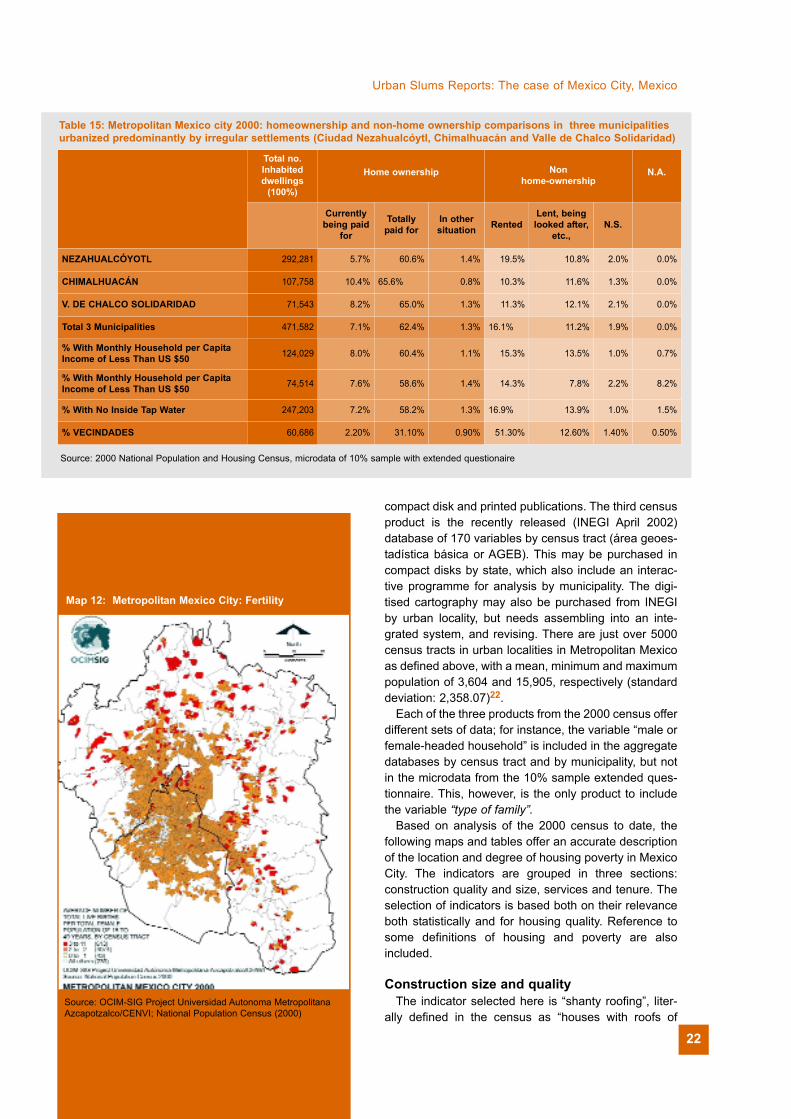
22
Urban Slums Reports: The case of Mexico City, Mexico
compact disk and printed publications. The third censusproduct is the recently released (INEGI April 2002)database of 170 variables by census tract (área geoes-tadística básica or AGEB). This may be purchased incompact disks by state, which also include an interac-tive programme for analysis by municipality. The digi-tised cartography may also be purchased from INEGIby urban locality, but needs assembling into an inte-grated system, and revising. There are just over 5000census tracts in urban localities in Metropolitan Mexicoas defined above, with a mean, minimum and maximumpopulation of 3,604 and 15,905, respectively (standarddeviation: 2,358.07)22.
Each of the three products from the 2000 census offerdifferent sets of data; for instance, the variable “male orfemale-headed household” is included in the aggregatedatabases by census tract and by municipality, but notin the microdata from the 10% sample extended ques-tionnaire. This, however, is the only product to includethe variable “type of family”.
Based on analysis of the 2000 census to date, thefollowing maps and tables offer an accurate descriptionof the location and degree of housing poverty in MexicoCity. The indicators are grouped in three sections:construction quality and size, services and tenure. Theselection of indicators is based both on their relevanceboth statistically and for housing quality. Reference tosome definitions of housing and poverty are alsoincluded.
Construction size and quality The indicator selected here is “shanty roofing”, liter-
ally defined in the census as “houses with roofs of
Table 15: Metropolitan Mexico city 2000: homeownership and non-home ownership comparisons in three municipalitiesurbanized predominantly by irregular settlements (Ciudad Nezahualcóytl, Chimalhuacán and Valle de Chalco Solidaridad)
Total no.Inhabiteddwellings
(100%)
Home ownership Non home-ownership
N.A.
Currentlybeing paid
for
Totallypaid for
In othersituation Rented
Lent, beinglooked after,
etc.,N.S.
NEZAHUALCÓYOTL 292,281 5.7% 60.6% 1.4% 19.5% 10.8% 2.0% 0.0%
CHIMALHUACÁN 107,758 10.4% 65.6% 0.8% 10.3% 11.6% 1.3% 0.0%
V. DE CHALCO SOLIDARIDAD 71,543 8.2% 65.0% 1.3% 11.3% 12.1% 2.1% 0.0%
Total 3 Municipalities 471,582 7.1% 62.4% 1.3% 16.1% 11.2% 1.9% 0.0%
% With Monthly Household per CapitaIncome of Less Than US $50 124,029 8.0% 60.4% 1.1% 15.3% 13.5% 1.0% 0.7%
% With Monthly Household per CapitaIncome of Less Than US $50 74,514 7.6% 58.6% 1.4% 14.3% 7.8% 2.2% 8.2%
% With No Inside Tap Water 247,203 7.2% 58.2% 1.3% 16.9% 13.9% 1.0% 1.5%
% VECINDADES 60,686 2.20% 31.10% 0.90% 51.30% 12.60% 1.40% 0.50%
Source: 2000 National Population and Housing Census, microdata of 10% sample with extended questionaire
Map 12: Metropolitan Mexico City: Fertility
Source: OCIM-SIG Project Universidad Autonoma MetropolitanaAzcapotzalco/CENVI; National Population Census (2000)
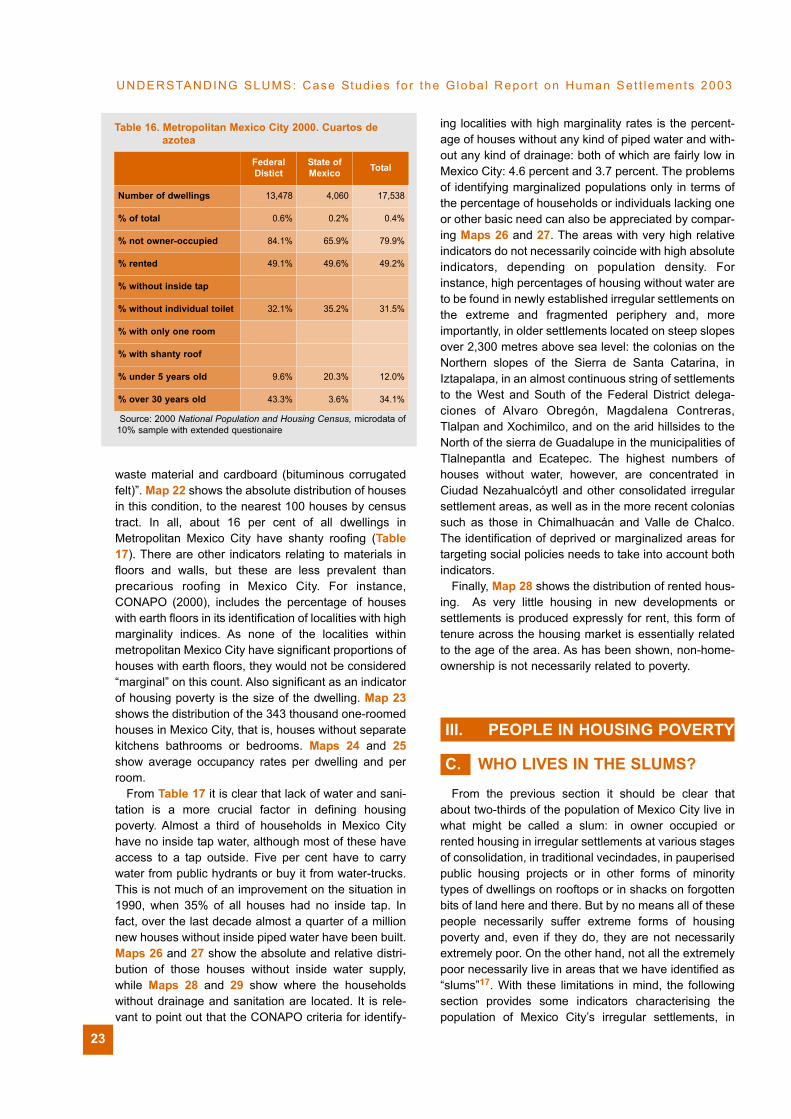
waste material and cardboard (bituminous corrugatedfelt)”. Map 22 shows the absolute distribution of housesin this condition, to the nearest 100 houses by censustract. In all, about 16 per cent of all dwellings inMetropolitan Mexico City have shanty roofing (Table17). There are other indicators relating to materials infloors and walls, but these are less prevalent thanprecarious roofing in Mexico City. For instance,CONAPO (2000), includes the percentage of houseswith earth floors in its identification of localities with highmarginality indices. As none of the localities withinmetropolitan Mexico City have significant proportions ofhouses with earth floors, they would not be considered“marginal” on this count. Also significant as an indicatorof housing poverty is the size of the dwelling. Map 23shows the distribution of the 343 thousand one-roomedhouses in Mexico City, that is, houses without separatekitchens bathrooms or bedrooms. Maps 24 and 25show average occupancy rates per dwelling and perroom.
From Table 17 it is clear that lack of water and sani-tation is a more crucial factor in defining housingpoverty. Almost a third of households in Mexico Cityhave no inside tap water, although most of these haveaccess to a tap outside. Five per cent have to carrywater from public hydrants or buy it from water-trucks.This is not much of an improvement on the situation in1990, when 35% of all houses had no inside tap. Infact, over the last decade almost a quarter of a millionnew houses without inside piped water have been built.Maps 26 and 27 show the absolute and relative distri-bution of those houses without inside water supply,while Maps 28 and 29 show where the householdswithout drainage and sanitation are located. It is rele-vant to point out that the CONAPO criteria for identify-
23
UNDERSTANDING SLUMS: Case Stud ies fo r the G loba l Repor t on Human Set t lements 2003
ing localities with high marginality rates is the percent-age of houses without any kind of piped water and with-out any kind of drainage: both of which are fairly low inMexico City: 4.6 percent and 3.7 percent. The problemsof identifying marginalized populations only in terms ofthe percentage of households or individuals lacking oneor other basic need can also be appreciated by compar-ing Maps 26 and 27. The areas with very high relativeindicators do not necessarily coincide with high absoluteindicators, depending on population density. Forinstance, high percentages of housing without water areto be found in newly established irregular settlements onthe extreme and fragmented periphery and, moreimportantly, in older settlements located on steep slopesover 2,300 metres above sea level: the colonias on theNorthern slopes of the Sierra de Santa Catarina, inIztapalapa, in an almost continuous string of settlementsto the West and South of the Federal District delega-ciones of Alvaro Obregón, Magdalena Contreras,Tlalpan and Xochimilco, and on the arid hillsides to theNorth of the sierra de Guadalupe in the municipalities ofTlalnepantla and Ecatepec. The highest numbers ofhouses without water, however, are concentrated inCiudad Nezahualcóytl and other consolidated irregularsettlement areas, as well as in the more recent coloniassuch as those in Chimalhuacán and Valle de Chalco.The identification of deprived or marginalized areas fortargeting social policies needs to take into account bothindicators.
Finally, Map 28 shows the distribution of rented hous-ing. As very little housing in new developments orsettlements is produced expressly for rent, this form oftenure across the housing market is essentially relatedto the age of the area. As has been shown, non-home-ownership is not necessarily related to poverty.
III. PEOPLE IN HOUSING POVERTY
C. WHO LIVES IN THE SLUMS?
From the previous section it should be clear thatabout two-thirds of the population of Mexico City live inwhat might be called a slum: in owner occupied orrented housing in irregular settlements at various stagesof consolidation, in traditional vecindades, in pauperisedpublic housing projects or in other forms of minoritytypes of dwellings on rooftops or in shacks on forgottenbits of land here and there. But by no means all of thesepeople necessarily suffer extreme forms of housingpoverty and, even if they do, they are not necessarilyextremely poor. On the other hand, not all the extremelypoor necessarily live in areas that we have identified as“slums”17. With these limitations in mind, the followingsection provides some indicators characterising thepopulation of Mexico City’s irregular settlements, in
Table 16. Metropolitan Mexico City 2000. Cuartos de azotea
FederalDistict
State ofMexico Total
Number of dwellings 13,478 4,060 17,538
% of total 0.6% 0.2% 0.4%
% not owner-occupied 84.1% 65.9% 79.9%
% rented 49.1% 49.6% 49.2%
% without inside tap
% without individual toilet 32.1% 35.2% 31.5%
% with only one room
% with shanty roof
% under 5 years old 9.6% 20.3% 12.0%
% over 30 years old 43.3% 3.6% 34.1%
Source: 2000 National Population and Housing Census, microdata of10% sample with extended questionaire
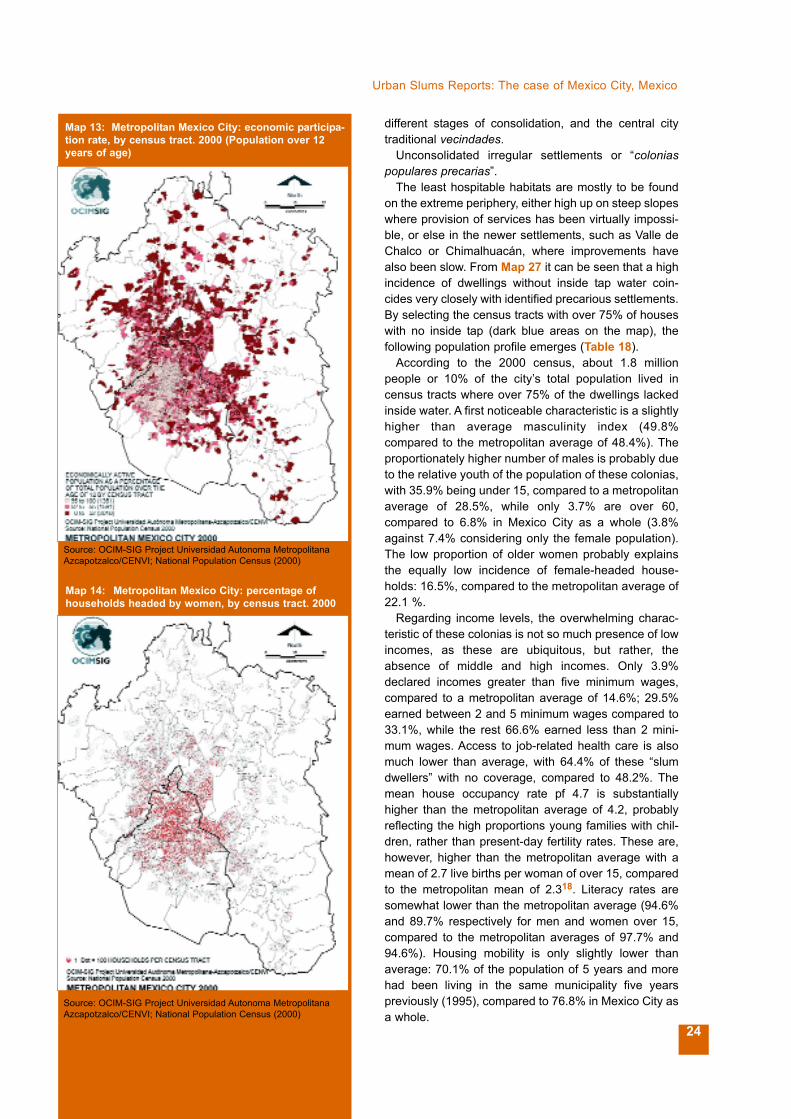
24
Urban Slums Reports: The case of Mexico City, Mexico
different stages of consolidation, and the central citytraditional vecindades.
Unconsolidated irregular settlements or “coloniaspopulares precarias”.
The least hospitable habitats are mostly to be foundon the extreme periphery, either high up on steep slopeswhere provision of services has been virtually impossi-ble, or else in the newer settlements, such as Valle deChalco or Chimalhuacán, where improvements havealso been slow. From Map 27 it can be seen that a highincidence of dwellings without inside tap water coin-cides very closely with identified precarious settlements.By selecting the census tracts with over 75% of houseswith no inside tap (dark blue areas on the map), thefollowing population profile emerges (Table 18).
According to the 2000 census, about 1.8 millionpeople or 10% of the city’s total population lived incensus tracts where over 75% of the dwellings lackedinside water. A first noticeable characteristic is a slightlyhigher than average masculinity index (49.8%compared to the metropolitan average of 48.4%). Theproportionately higher number of males is probably dueto the relative youth of the population of these colonias,with 35.9% being under 15, compared to a metropolitanaverage of 28.5%, while only 3.7% are over 60,compared to 6.8% in Mexico City as a whole (3.8%against 7.4% considering only the female population).The low proportion of older women probably explainsthe equally low incidence of female-headed house-holds: 16.5%, compared to the metropolitan average of22.1 %.
Regarding income levels, the overwhelming charac-teristic of these colonias is not so much presence of lowincomes, as these are ubiquitous, but rather, theabsence of middle and high incomes. Only 3.9%declared incomes greater than five minimum wages,compared to a metropolitan average of 14.6%; 29.5%earned between 2 and 5 minimum wages compared to33.1%, while the rest 66.6% earned less than 2 mini-mum wages. Access to job-related health care is alsomuch lower than average, with 64.4% of these “slumdwellers” with no coverage, compared to 48.2%. Themean house occupancy rate pf 4.7 is substantiallyhigher than the metropolitan average of 4.2, probablyreflecting the high proportions young families with chil-dren, rather than present-day fertility rates. These are,however, higher than the metropolitan average with amean of 2.7 live births per woman of over 15, comparedto the metropolitan mean of 2.318. Literacy rates aresomewhat lower than the metropolitan average (94.6%and 89.7% respectively for men and women over 15,compared to the metropolitan averages of 97.7% and94.6%). Housing mobility is only slightly lower thanaverage: 70.1% of the population of 5 years and morehad been living in the same municipality five yearspreviously (1995), compared to 76.8% in Mexico City asa whole.
Map 13: Metropolitan Mexico City: economic participa-tion rate, by census tract. 2000 (Population over 12years of age)
Source: OCIM-SIG Project Universidad Autonoma MetropolitanaAzcapotzalco/CENVI; National Population Census (2000)
Map 14: Metropolitan Mexico City: percentage ofhouseholds headed by women, by census tract. 2000
Source: OCIM-SIG Project Universidad Autonoma MetropolitanaAzcapotzalco/CENVI; National Population Census (2000)
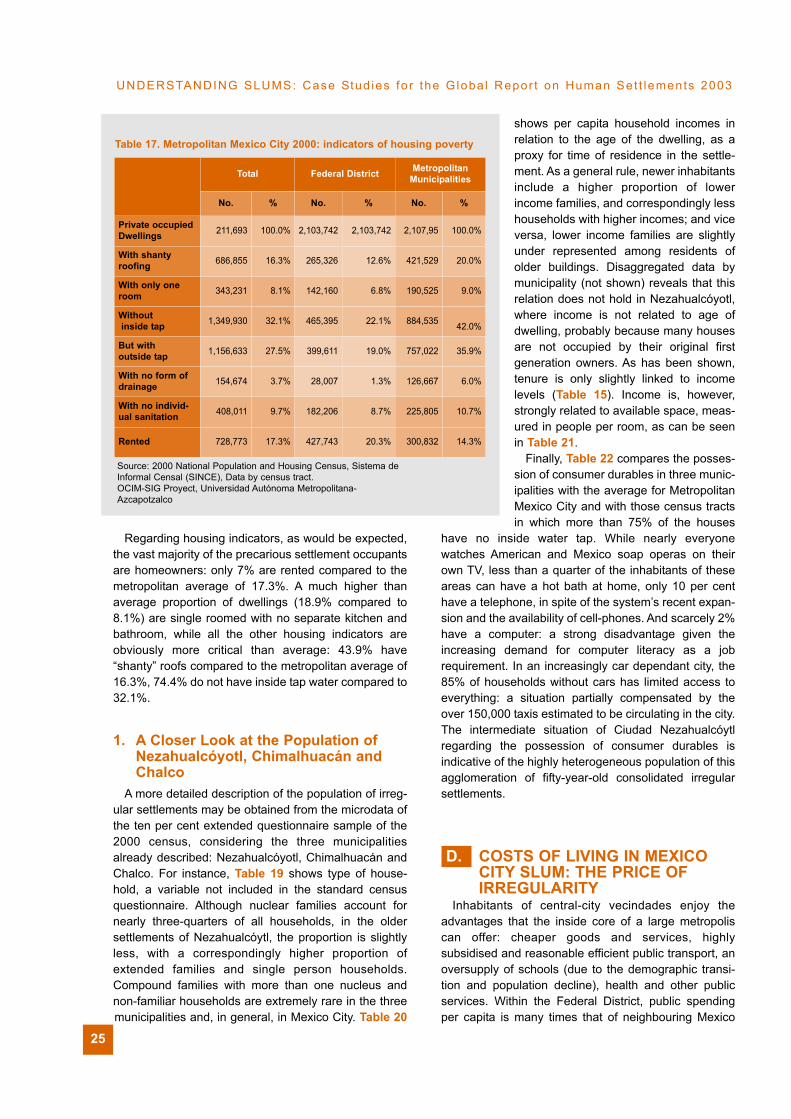
Regarding housing indicators, as would be expected,the vast majority of the precarious settlement occupantsare homeowners: only 7% are rented compared to themetropolitan average of 17.3%. A much higher thanaverage proportion of dwellings (18.9% compared to8.1%) are single roomed with no separate kitchen andbathroom, while all the other housing indicators areobviously more critical than average: 43.9% have“shanty” roofs compared to the metropolitan average of16.3%, 74.4% do not have inside tap water compared to32.1%.
1. A Closer Look at the Population of Nezahualcóyotl, Chimalhuacán and Chalco
A more detailed description of the population of irreg-ular settlements may be obtained from the microdata ofthe ten per cent extended questionnaire sample of the2000 census, considering the three municipalitiesalready described: Nezahualcóyotl, Chimalhuacán andChalco. For instance, Table 19 shows type of house-hold, a variable not included in the standard censusquestionnaire. Although nuclear families account fornearly three-quarters of all households, in the oldersettlements of Nezahualcóytl, the proportion is slightlyless, with a correspondingly higher proportion ofextended families and single person households.Compound families with more than one nucleus andnon-familiar households are extremely rare in the threemunicipalities and, in general, in Mexico City. Table 20
shows per capita household incomes inrelation to the age of the dwelling, as aproxy for time of residence in the settle-ment. As a general rule, newer inhabitantsinclude a higher proportion of lowerincome families, and correspondingly lesshouseholds with higher incomes; and viceversa, lower income families are slightlyunder represented among residents ofolder buildings. Disaggregated data bymunicipality (not shown) reveals that thisrelation does not hold in Nezahualcóyotl,where income is not related to age ofdwelling, probably because many housesare not occupied by their original firstgeneration owners. As has been shown,tenure is only slightly linked to incomelevels (Table 15). Income is, however,strongly related to available space, meas-ured in people per room, as can be seenin Table 21.
Finally, Table 22 compares the posses-sion of consumer durables in three munic-ipalities with the average for MetropolitanMexico City and with those census tractsin which more than 75% of the houses
have no inside water tap. While nearly everyonewatches American and Mexico soap operas on theirown TV, less than a quarter of the inhabitants of theseareas can have a hot bath at home, only 10 per centhave a telephone, in spite of the system’s recent expan-sion and the availability of cell-phones. And scarcely 2%have a computer: a strong disadvantage given theincreasing demand for computer literacy as a jobrequirement. In an increasingly car dependant city, the85% of households without cars has limited access toeverything: a situation partially compensated by theover 150,000 taxis estimated to be circulating in the city.The intermediate situation of Ciudad Nezahualcóytlregarding the possession of consumer durables isindicative of the highly heterogeneous population of thisagglomeration of fifty-year-old consolidated irregularsettlements.
D. COSTS OF LIVING IN MEXICO CITY SLUM: THE PRICE OF IRREGULARITY
Inhabitants of central-city vecindades enjoy theadvantages that the inside core of a large metropoliscan offer: cheaper goods and services, highlysubsidised and reasonable efficient public transport, anoversupply of schools (due to the demographic transi-tion and population decline), health and other publicservices. Within the Federal District, public spendingper capita is many times that of neighbouring Mexico
25
UNDERSTANDING SLUMS: Case Stud ies fo r the G loba l Repor t on Human Set t lements 2003
Table 17. Metropolitan Mexico City 2000: indicators of housing poverty
Total Federal District MetropolitanMunicipalities
No. % No. % No. %
Private occupiedDwellings 211,693 100.0% 2,103,742 2,103,742 2,107,95 100.0%
With shantyroofing 686,855 16.3% 265,326 12.6% 421,529 20.0%
With only oneroom 343,231 8.1% 142,160 6.8% 190,525 9.0%
Withoutinside tap 1,349,930 32.1% 465,395 22.1% 884,535 42.0%
But with outside tap 1,156,633 27.5% 399,611 19.0% 757,022 35.9%
With no form ofdrainage 154,674 3.7% 28,007 1.3% 126,667 6.0%
With no individ-ual sanitation 408,011 9.7% 182,206 8.7% 225,805 10.7%
Rented 728,773 17.3% 427,743 20.3% 300,832 14.3%
Source: 2000 National Population and Housing Census, Sistema deInformal Censal (SINCE), Data by census tract.OCIM-SIG Proyect, Universidad Autónoma Metropolitana-Azcapotzalco
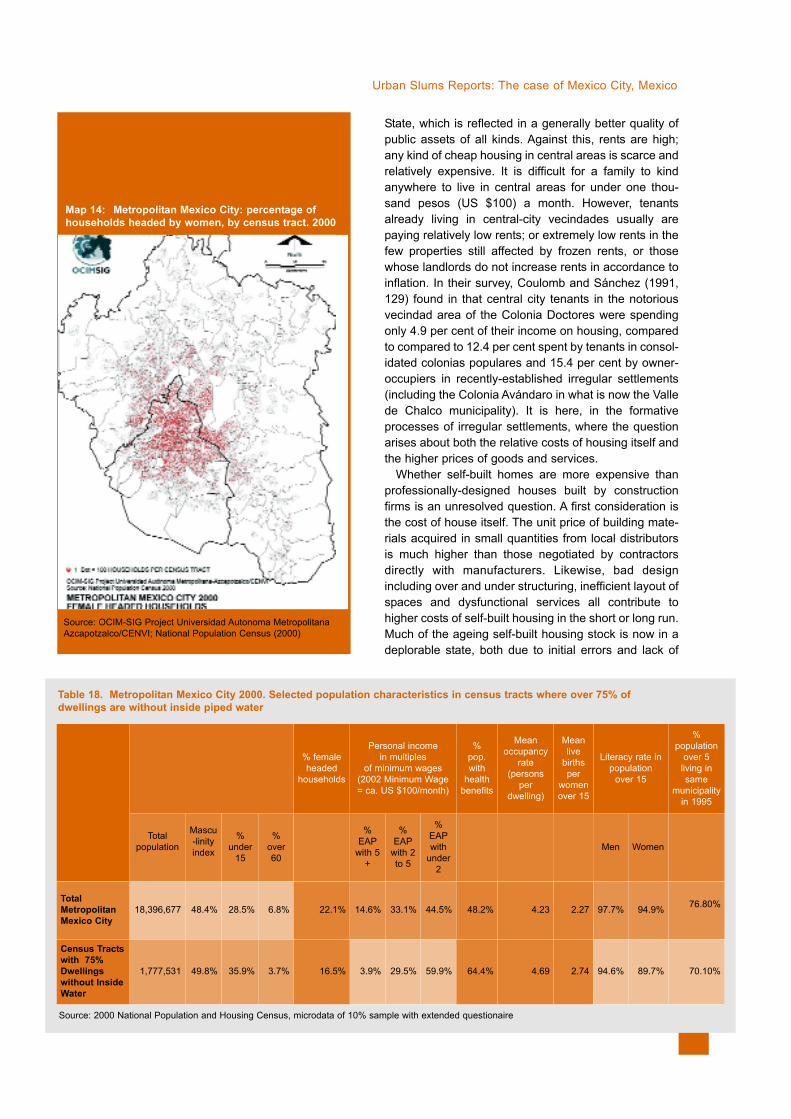
Urban Slums Reports: The case of Mexico City, Mexico
State, which is reflected in a generally better quality ofpublic assets of all kinds. Against this, rents are high;any kind of cheap housing in central areas is scarce andrelatively expensive. It is difficult for a family to kindanywhere to live in central areas for under one thou-sand pesos (US $100) a month. However, tenantsalready living in central-city vecindades usually arepaying relatively low rents; or extremely low rents in thefew properties still affected by frozen rents, or thosewhose landlords do not increase rents in accordance toinflation. In their survey, Coulomb and Sánchez (1991,129) found in that central city tenants in the notoriousvecindad area of the Colonia Doctores were spendingonly 4.9 per cent of their income on housing, comparedto compared to 12.4 per cent spent by tenants in consol-idated colonias populares and 15.4 per cent by owner-occupiers in recently-established irregular settlements(including the Colonia Avándaro in what is now the Vallede Chalco municipality). It is here, in the formativeprocesses of irregular settlements, where the questionarises about both the relative costs of housing itself andthe higher prices of goods and services.
Whether self-built homes are more expensive thanprofessionally-designed houses built by constructionfirms is an unresolved question. A first consideration isthe cost of house itself. The unit price of building mate-rials acquired in small quantities from local distributorsis much higher than those negotiated by contractorsdirectly with manufacturers. Likewise, bad designincluding over and under structuring, inefficient layout ofspaces and dysfunctional services all contribute tohigher costs of self-built housing in the short or long run.Much of the ageing self-built housing stock is now in adeplorable state, both due to initial errors and lack of
Map 14: Metropolitan Mexico City: percentage ofhouseholds headed by women, by census tract. 2000
Source: OCIM-SIG Project Universidad Autonoma MetropolitanaAzcapotzalco/CENVI; National Population Census (2000)
Table 18. Metropolitan Mexico City 2000. Selected population characteristics in census tracts where over 75% ofdwellings are without inside piped water
% femaleheaded
households
Personal income in multiples
of minimum wages (2002 Minimum Wage = ca. US $100/month)
% pop.with
healthbenefits
Mean occupancy
rate(persons
perdwelling)
Meanlive
birthsper
womenover 15
Literacy rate inpopulation
over 15
% population
over 5living insame
municipalityin 1995
Total population
Mascu-linityindex
%under
15
%over60
%EAP
with 5+
%EAP
with 2to 5
%EAPwith
under2
Men Women
TotalMetropolitanMexico City
18,396,677 48.4% 28.5% 6.8% 22.1% 14.6% 33.1% 44.5% 48.2% 4.23 2.27 97.7% 94.9% 76.80%
Census Tractswith 75%Dwellings without InsideWater
1,777,531 49.8% 35.9% 3.7% 16.5% 3.9% 29.5% 59.9% 64.4% 4.69 2.74 94.6% 89.7% 70.10%
Source: 2000 National Population and Housing Census, microdata of 10% sample with extended questionaire
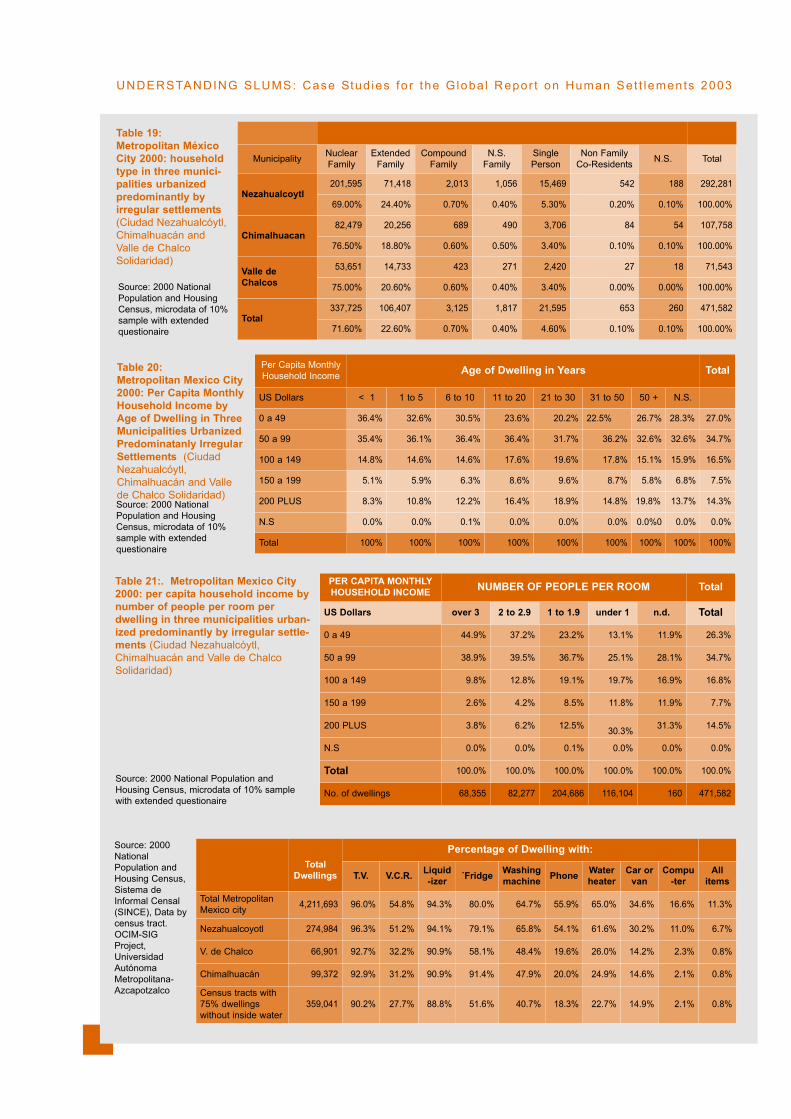
UNDERSTANDING SLUMS: Case Stud ies fo r the G loba l Repor t on Human Set t lements 2003
Table 19:Metropolitan MéxicoCity 2000: householdtype in three munici-palities urbanizedpredominantly byirregular settlements(Ciudad Nezahualcóytl,Chimalhuacán andValle de ChalcoSolidaridad)
Municipality NuclearFamily
ExtendedFamily
CompoundFamily
N.S.Family
SinglePerson
Non FamilyCo-Residents N.S. Total
Nezahualcoytl 201,595 71,418 2,013 1,056 15,469 542 188 292,281
69.00% 24.40% 0.70% 0.40% 5.30% 0.20% 0.10% 100.00%
Chimalhuacan 82,479 20,256 689 490 3,706 84 54 107,758
76.50% 18.80% 0.60% 0.50% 3.40% 0.10% 0.10% 100.00%
Valle de Chalcos
53,651 14,733 423 271 2,420 27 18 71,543
75.00% 20.60% 0.60% 0.40% 3.40% 0.00% 0.00% 100.00%
Total 337,725 106,407 3,125 1,817 21,595 653 260 471,582
71.60% 22.60% 0.70% 0.40% 4.60% 0.10% 0.10% 100.00%
Source: 2000 NationalPopulation and HousingCensus, microdata of 10%sample with extendedquestionaire
Table 20: Metropolitan Mexico City2000: Per Capita MonthlyHousehold Income byAge of Dwelling in ThreeMunicipalities UrbanizedPredominatanly IrregularSettlements (CiudadNezahualcóytl,Chimalhuacán and Vallede Chalco Solidaridad)
Per Capita MonthlyHousehold Income Age of Dwelling in Years Total
US Dollars < 1 1 to 5 6 to 10 11 to 20 21 to 30 31 to 50 50 + N.S.
0 a 49 36.4% 32.6% 30.5% 23.6% 20.2% 22.5% 26.7% 28.3% 27.0%
50 a 99 35.4% 36.1% 36.4% 36.4% 31.7% 36.2% 32.6% 32.6% 34.7%
100 a 149 14.8% 14.6% 14.6% 17.6% 19.6% 17.8% 15.1% 15.9% 16.5%
150 a 199 5.1% 5.9% 6.3% 8.6% 9.6% 8.7% 5.8% 6.8% 7.5%
200 PLUS 8.3% 10.8% 12.2% 16.4% 18.9% 14.8% 19.8% 13.7% 14.3%
N.S 0.0% 0.0% 0.1% 0.0% 0.0% 0.0% 0.0%0 0.0% 0.0%
Total 100% 100% 100% 100% 100% 100% 100% 100% 100%
Source: 2000 NationalPopulation and HousingCensus, microdata of 10%sample with extended questionaire
Source: 2000NationalPopulation andHousing Census,Sistema deInformal Censal(SINCE), Data bycensus tract.OCIM-SIGProject,UniversidadAutónomaMetropolitana-Azcapotzalco
Table 21:. Metropolitan Mexico City2000: per capita household income bynumber of people per room perdwelling in three municipalities urban-ized predominantly by irregular settle-ments (Ciudad Nezahualcóytl,Chimalhuacán and Valle de ChalcoSolidaridad)
Source: 2000 National Population andHousing Census, microdata of 10% samplewith extended questionaire
TotalDwellings
Percentage of Dwelling with:
T.V. V.C.R. Liquid-izer ´Fridge Washing
machine Phone Waterheater
Car orvan
Compu-ter
Allitems
Total MetropolitanMexico city 4,211,693 96.0% 54.8% 94.3% 80.0% 64.7% 55.9% 65.0% 34.6% 16.6% 11.3%
Nezahualcoyotl 274,984 96.3% 51.2% 94.1% 79.1% 65.8% 54.1% 61.6% 30.2% 11.0% 6.7%
V. de Chalco 66,901 92.7% 32.2% 90.9% 58.1% 48.4% 19.6% 26.0% 14.2% 2.3% 0.8%
Chimalhuacán 99,372 92.9% 31.2% 90.9% 91.4% 47.9% 20.0% 24.9% 14.6% 2.1% 0.8%
Census tracts with75% dwellings without inside water
359,041 90.2% 27.7% 88.8% 51.6% 40.7% 18.3% 22.7% 14.9% 2.1% 0.8%
PER CAPITA MONTHLYHOUSEHOLD INCOME NUMBER OF PEOPLE PER ROOM Total
US Dollars over 3 2 to 2.9 1 to 1.9 under 1 n.d. Total
0 a 49 44.9% 37.2% 23.2% 13.1% 11.9% 26.3%
50 a 99 38.9% 39.5% 36.7% 25.1% 28.1% 34.7%
100 a 149 9.8% 12.8% 19.1% 19.7% 16.9% 16.8%
150 a 199 2.6% 4.2% 8.5% 11.8% 11.9% 7.7%
200 PLUS 3.8% 6.2% 12.5% 30.3% 31.3% 14.5%
N.S 0.0% 0.0% 0.1% 0.0% 0.0% 0.0%
Total 100.0% 100.0% 100.0% 100.0% 100.0% 100.0%
No. of dwellings 68,355 82,277 204,686 116,104 160 471,582
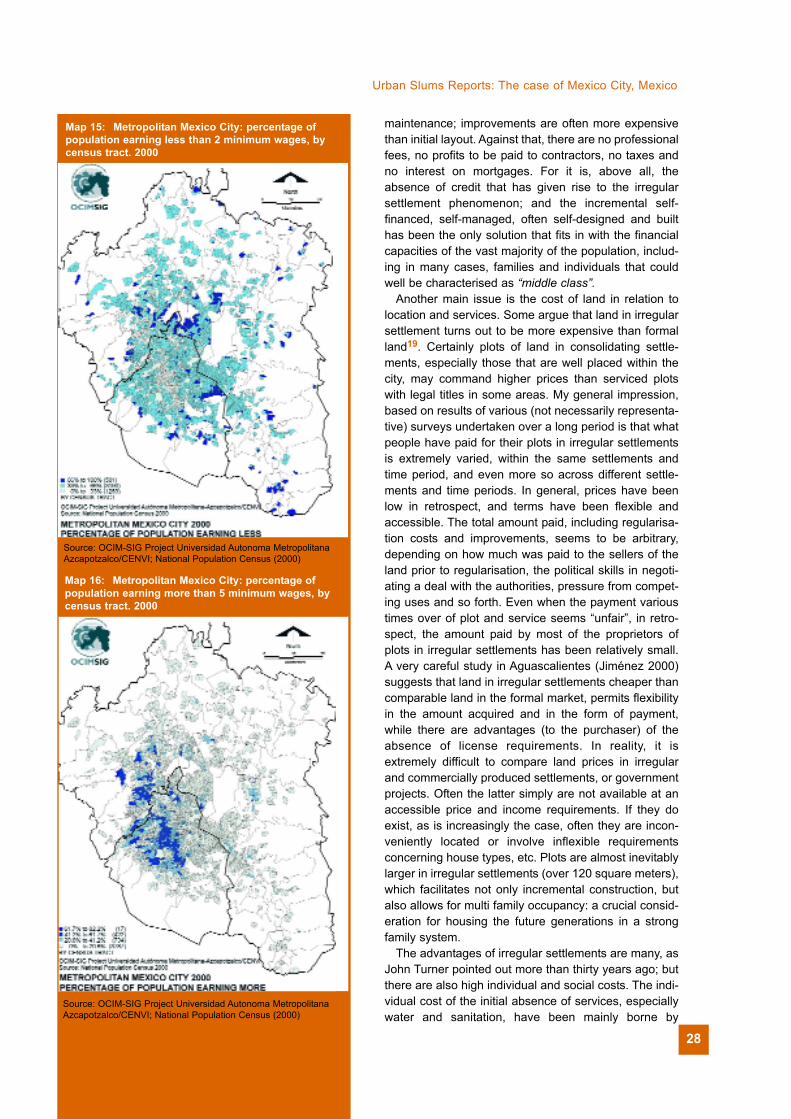
28
Urban Slums Reports: The case of Mexico City, Mexico
maintenance; improvements are often more expensivethan initial layout. Against that, there are no professionalfees, no profits to be paid to contractors, no taxes andno interest on mortgages. For it is, above all, theabsence of credit that has given rise to the irregularsettlement phenomenon; and the incremental self-financed, self-managed, often self-designed and builthas been the only solution that fits in with the financialcapacities of the vast majority of the population, includ-ing in many cases, families and individuals that couldwell be characterised as “middle class”.
Another main issue is the cost of land in relation tolocation and services. Some argue that land in irregularsettlement turns out to be more expensive than formalland19. Certainly plots of land in consolidating settle-ments, especially those that are well placed within thecity, may command higher prices than serviced plotswith legal titles in some areas. My general impression,based on results of various (not necessarily representa-tive) surveys undertaken over a long period is that whatpeople have paid for their plots in irregular settlementsis extremely varied, within the same settlements andtime period, and even more so across different settle-ments and time periods. In general, prices have beenlow in retrospect, and terms have been flexible andaccessible. The total amount paid, including regularisa-tion costs and improvements, seems to be arbitrary,depending on how much was paid to the sellers of theland prior to regularisation, the political skills in negoti-ating a deal with the authorities, pressure from compet-ing uses and so forth. Even when the payment varioustimes over of plot and service seems “unfair”, in retro-spect, the amount paid by most of the proprietors ofplots in irregular settlements has been relatively small.A very careful study in Aguascalientes (Jiménez 2000)suggests that land in irregular settlements cheaper thancomparable land in the formal market, permits flexibilityin the amount acquired and in the form of payment,while there are advantages (to the purchaser) of theabsence of license requirements. In reality, it isextremely difficult to compare land prices in irregularand commercially produced settlements, or governmentprojects. Often the latter simply are not available at anaccessible price and income requirements. If they doexist, as is increasingly the case, often they are incon-veniently located or involve inflexible requirementsconcerning house types, etc. Plots are almost inevitablylarger in irregular settlements (over 120 square meters),which facilitates not only incremental construction, butalso allows for multi family occupancy: a crucial consid-eration for housing the future generations in a strongfamily system.
The advantages of irregular settlements are many, asJohn Turner pointed out more than thirty years ago; butthere are also high individual and social costs. The indi-vidual cost of the initial absence of services, especiallywater and sanitation, have been mainly borne by
Map 15: Metropolitan Mexico City: percentage ofpopulation earning less than 2 minimum wages, bycensus tract. 2000
Source: OCIM-SIG Project Universidad Autonoma MetropolitanaAzcapotzalco/CENVI; National Population Census (2000)
Map 16: Metropolitan Mexico City: percentage ofpopulation earning more than 5 minimum wages, bycensus tract. 2000
Source: OCIM-SIG Project Universidad Autonoma MetropolitanaAzcapotzalco/CENVI; National Population Census (2000)
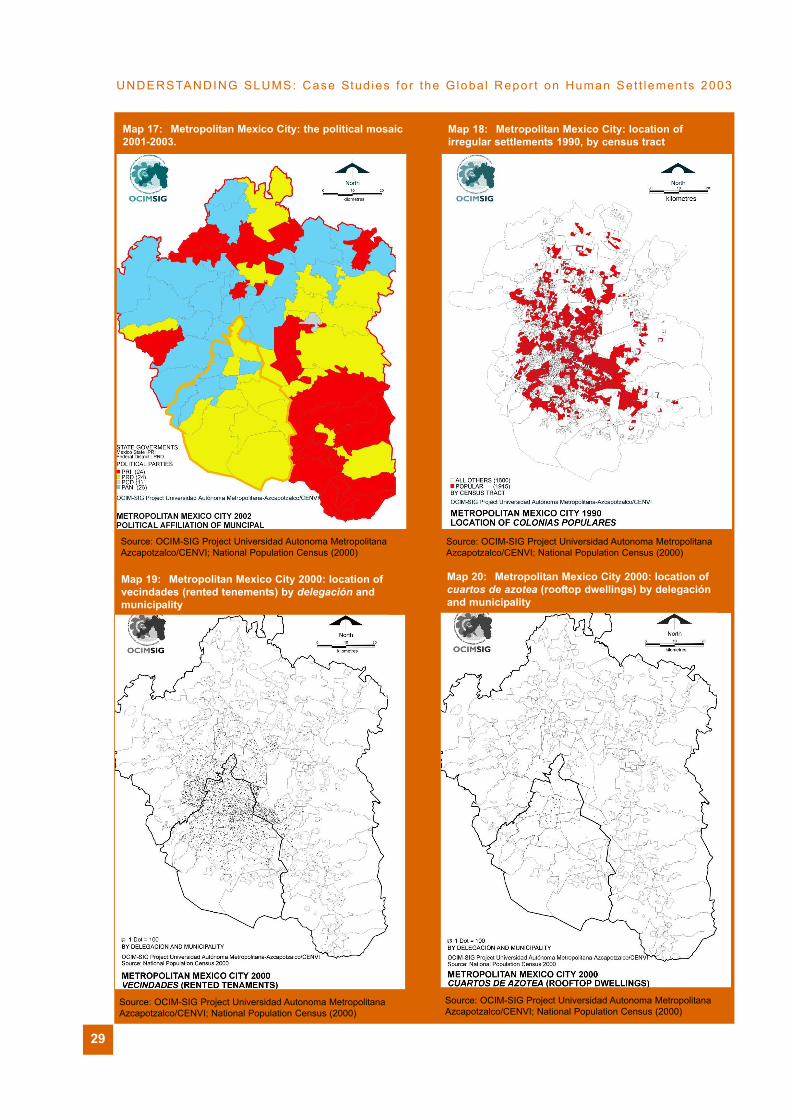
29
UNDERSTANDING SLUMS: Case Stud ies fo r the G loba l Repor t on Human Set t lements 2003
Map 17: Metropolitan Mexico City: the political mosaic2001-2003.
Source: OCIM-SIG Project Universidad Autonoma MetropolitanaAzcapotzalco/CENVI; National Population Census (2000)
Map 18: Metropolitan Mexico City: location of irregular settlements 1990, by census tract
Source: OCIM-SIG Project Universidad Autonoma MetropolitanaAzcapotzalco/CENVI; National Population Census (2000)
Map 19: Metropolitan Mexico City 2000: location ofvecindades (rented tenements) by delegación andmunicipality
Source: OCIM-SIG Project Universidad Autonoma MetropolitanaAzcapotzalco/CENVI; National Population Census (2000)
Map 20: Metropolitan Mexico City 2000: location ofcuartos de azotea (rooftop dwellings) by delegaciónand municipality
Source: OCIM-SIG Project Universidad Autonoma MetropolitanaAzcapotzalco/CENVI; National Population Census (2000)
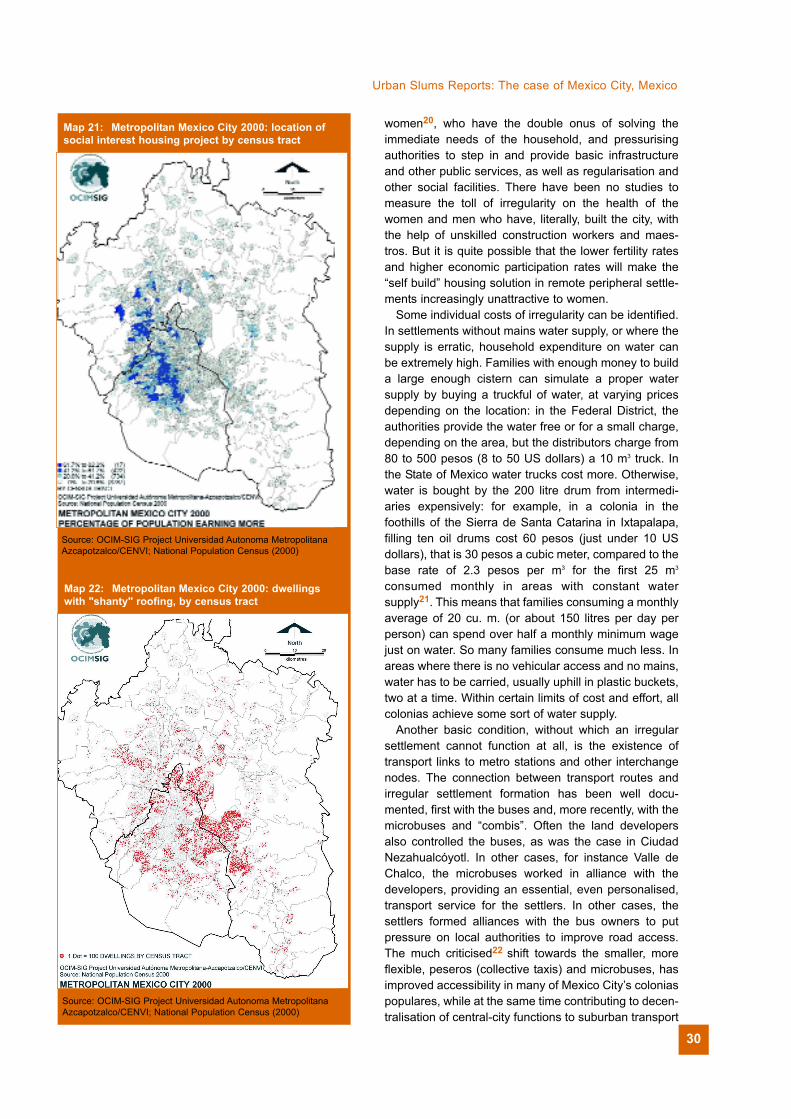
30
Urban Slums Reports: The case of Mexico City, Mexico
women20, who have the double onus of solving theimmediate needs of the household, and pressurisingauthorities to step in and provide basic infrastructureand other public services, as well as regularisation andother social facilities. There have been no studies tomeasure the toll of irregularity on the health of thewomen and men who have, literally, built the city, withthe help of unskilled construction workers and maes-tros. But it is quite possible that the lower fertility ratesand higher economic participation rates will make the“self build” housing solution in remote peripheral settle-ments increasingly unattractive to women.
Some individual costs of irregularity can be identified.In settlements without mains water supply, or where thesupply is erratic, household expenditure on water canbe extremely high. Families with enough money to builda large enough cistern can simulate a proper watersupply by buying a truckful of water, at varying pricesdepending on the location: in the Federal District, theauthorities provide the water free or for a small charge,depending on the area, but the distributors charge from80 to 500 pesos (8 to 50 US dollars) a 10 m3 truck. Inthe State of Mexico water trucks cost more. Otherwise,water is bought by the 200 litre drum from intermedi-aries expensively: for example, in a colonia in thefoothills of the Sierra de Santa Catarina in Ixtapalapa,filling ten oil drums cost 60 pesos (just under 10 USdollars), that is 30 pesos a cubic meter, compared to thebase rate of 2.3 pesos per m3 for the first 25 m3
consumed monthly in areas with constant watersupply21. This means that families consuming a monthlyaverage of 20 cu. m. (or about 150 litres per day perperson) can spend over half a monthly minimum wagejust on water. So many families consume much less. Inareas where there is no vehicular access and no mains,water has to be carried, usually uphill in plastic buckets,two at a time. Within certain limits of cost and effort, allcolonias achieve some sort of water supply.
Another basic condition, without which an irregularsettlement cannot function at all, is the existence oftransport links to metro stations and other interchangenodes. The connection between transport routes andirregular settlement formation has been well docu-mented, first with the buses and, more recently, with themicrobuses and “combis”. Often the land developersalso controlled the buses, as was the case in CiudadNezahualcóyotl. In other cases, for instance Valle deChalco, the microbuses worked in alliance with thedevelopers, providing an essential, even personalised,transport service for the settlers. In other cases, thesettlers formed alliances with the bus owners to putpressure on local authorities to improve road access.The much criticised22 shift towards the smaller, moreflexible, peseros (collective taxis) and microbuses, hasimproved accessibility in many of Mexico City’s coloniaspopulares, while at the same time contributing to decen-tralisation of central-city functions to suburban transport
Map 21: Metropolitan Mexico City 2000: location ofsocial interest housing project by census tract
Source: OCIM-SIG Project Universidad Autonoma MetropolitanaAzcapotzalco/CENVI; National Population Census (2000)
Map 22: Metropolitan Mexico City 2000: dwellingswith "shanty" roofing, by census tract
Source: OCIM-SIG Project Universidad Autonoma MetropolitanaAzcapotzalco/CENVI; National Population Census (2000)
hubs. Even so, the microbuses only transit along themain roads of a settlement. There may be a half hourwalk to nearest route, and then all the microbuses maybe full, especially in the morning rush hour, when it ispreferable to walk a longer distance to a main road(Salazar 1999, 129). Lack of vehicular access in themore remote irregular settlements, and those located onsteep hillsides, adds additional onus on alreadyextremely long travel times endured by all Mexico City’sinhabitants.
Up to date information on travel costs, times anddistance is unavailable, but the latest origin-destinysurvey carried out in 1994 suggests that average one-way travel time for the whole city is 46 minutes, or 50minutes for those travelling by public transport.According to the same data, over a third of the trips tookbetween one and two hours, while 5 per cent and 7.5per cent took over two hours in the Federal District andState of Mexico, respectively (Islas 2000, 85). To get towork or school at eight in the morning, many people willhave get up before five o’clock.
Transport is cheap in Mexico City, especially in theFederal District, where most people have to travel towork, even if they live in the metropolitan municipalities.A ride anywhere on the metro, trolleybus or bus coststwo pesos (July 2002: 20 US cents), while a microbusride costs between 2.50 and 5 pesos, depending ondistance covered. Fares are higher in the State ofMexico, especially for those who have to make longertrips in buses. In spite of the cheap fares, transportcosts can take up a large part of a low-income family’sbudget. The Coulomb and Sánchez (1991, 129) surveyrevealed owner occupiers in both incipient and consoli-dated settlements spent about 10% of their income intransport, while renters spent considerably less:presumably due to the flexibility of housing location thatrenting affords. As Salazar (1999, 127) has pointed out,the more heterogeneous the neighbourhood, and thenearer the poor live to the better off, the less need thereis to travel. In the same study, Salazar points out thatwomen in colonias populares, especially wives withyoung children, have very limited mobility compared tomen, although female heads of household and daugh-ters have a wider range of action within the city.However, a preliminary analysis of 2000 census microdata shows that women seem to travel further to workthan men. This is no doubt a result of the fact thatwomen are no longer predominantly “wives with youngchildren” but single parents, daughters, wives with olderor grown-up children, or older women who live on theirown. (Younger women who live on their own areunusual, even amongst the professional classes.)
31
UNDERSTANDING SLUMS: Case Stud ies fo r the G loba l Repor t on Human Set t lements 2003
Map 23: Metropolitan Mexico City 2000: dwellingswith only one room, by census tract
Source: OCIM-SIG Project Universidad Autonoma MetropolitanaAzcapotzalco/CENVI; National Population Census (2000)
Map 24: Metropolitan Mexico City 2000: averagehouse occupancy rate by census tract
Source: OCIM-SIG Project Universidad Autonoma MetropolitanaAzcapotzalco/CENVI; National Population Census (2000)
32
Urban Slums Reports: The case of Mexico City, Mexico
E. THE SOCIAL COSTS AND BENEFITS OF IRREGULAR
SETTLEMENTS Independently of the individual costs and benefits of
Mexico’s irregular settlements, an important considera-tion is the question of their socialised or collective costsand benefits: the social, political, economic and environ-mental impacts of uncontrolled urbanisation for the cityas whole, for the country and beyond, in the past, pres-ent and future. This is clearly not the place to explorethis issue fully, but Mexico City can provide some usefulillustrations of how the ways the poor are housed havewider implications, beyond the immediate conditions ofthe affected population. Of these wider implications,only two will be touched on here: the political effects ofirregularity and the environmental impacts.
Regarding the first issue, after a first wave of irregularsettlements in Mexico City, about 1970, there was ageneral consensus23 that irregular urbanisation (thenreferred to widely as marginality), far from providing ahotbed of social unrest and revolutionary struggles, inMexico provided a strong foothold for the ruling clien-tilistic one-party corporative State. In the absence ofclear-cut universally applied rules (such as thoseconcerning what you can build where), individual rights(such as security of tenure on an invaded or illegallyacquired plot of land) can depend largely on allegianceto leaders who are able to negotiate satisfactoryoutcomes with the authorities; the power of the leader,and thus of the official political party machine, in thiscase the PRI, is derived from the popular following sheor he can muster. For the system to work, some of thegoods, at least, have to be delivered. In the case ofMexico City, the most important good to be deliveredwas security of possession of land, which was occupiedillegally for one, or various of the reasons mentionedabove. In fact, although evictions of invaded private orpublic property have occurred, these have been theexception, rather than the rule, as the over ten millioninhabitants of what were originally irregular settlementstestify. However as the goods demanded by the popula-tion became more expensive and difficult to deliver,such as paved roads, cheap transport, water, drainageand schools, the leaders’ political power was weakened.Alternative popular organisations sprung up, whose firstaim was to eliminate corrupt leaders in order to obtainlegal recognition of tenure, basic infrastructure andservices; politicised collective action became an essen-tial part of settlement upgrading24.
It would be difficult to argue that the Popular UrbanMovement was decisive in achieving political reform inMexico; but it certainly was an active participant in theprocess. The fact that the PRI has lost its political basein most of Mexico City to the left-wing PRD (see Map17) is due largely to its failure to keep control over thecolonias populares. Many of the PRD elected represen-tatives in the Federal District and Municipal govern-
Map 25: Metropolitan Mexico City 2000: averageinhabitants per room
Source: OCIM-SIG Project Universidad Autonoma MetropolitanaAzcapotzalco/CENVI; National Population Census (2000)
Map 26: Metropolitan Mexico City 2000: percentagedwelling with no inside tap
Source: OCIM-SIG Project Universidad Autonoma MetropolitanaAzcapotzalco/CENVI; National Population Census (2000)
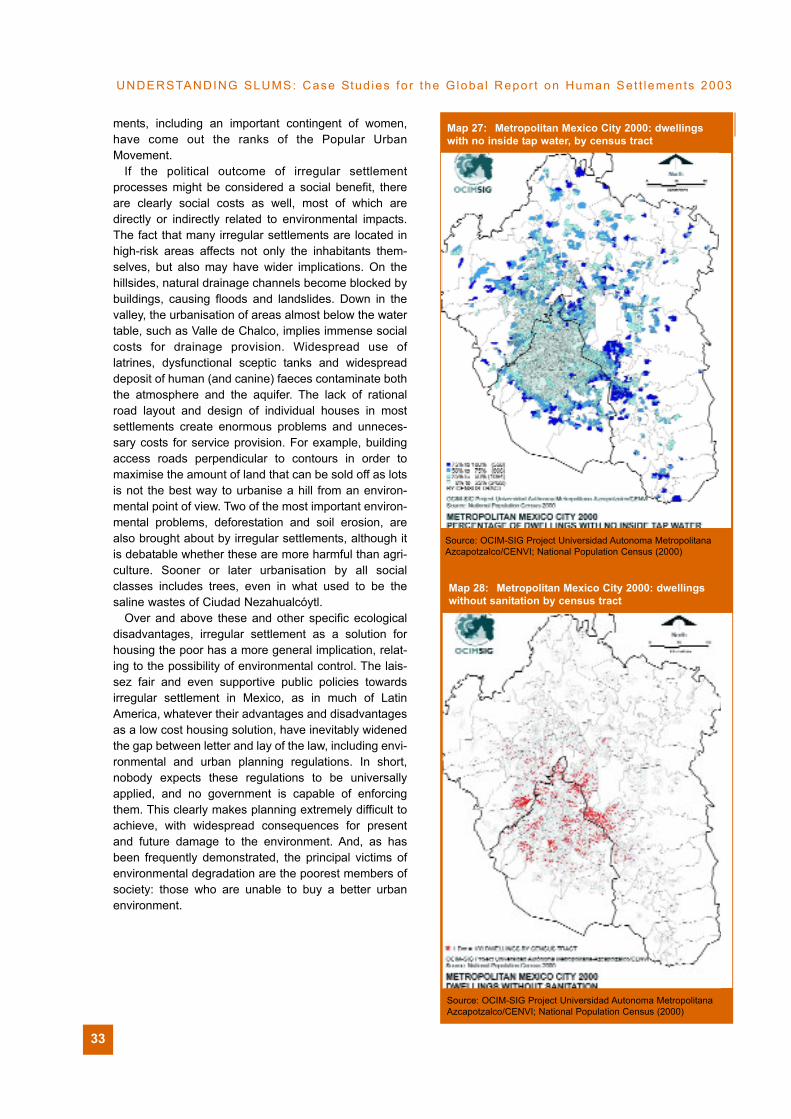
ments, including an important contingent of women,have come out the ranks of the Popular UrbanMovement.
If the political outcome of irregular settlementprocesses might be considered a social benefit, thereare clearly social costs as well, most of which aredirectly or indirectly related to environmental impacts.The fact that many irregular settlements are located inhigh-risk areas affects not only the inhabitants them-selves, but also may have wider implications. On thehillsides, natural drainage channels become blocked bybuildings, causing floods and landslides. Down in thevalley, the urbanisation of areas almost below the watertable, such as Valle de Chalco, implies immense socialcosts for drainage provision. Widespread use oflatrines, dysfunctional sceptic tanks and widespreaddeposit of human (and canine) faeces contaminate boththe atmosphere and the aquifer. The lack of rationalroad layout and design of individual houses in mostsettlements create enormous problems and unneces-sary costs for service provision. For example, buildingaccess roads perpendicular to contours in order tomaximise the amount of land that can be sold off as lotsis not the best way to urbanise a hill from an environ-mental point of view. Two of the most important environ-mental problems, deforestation and soil erosion, arealso brought about by irregular settlements, although itis debatable whether these are more harmful than agri-culture. Sooner or later urbanisation by all socialclasses includes trees, even in what used to be thesaline wastes of Ciudad Nezahualcóytl.
Over and above these and other specific ecologicaldisadvantages, irregular settlement as a solution forhousing the poor has a more general implication, relat-ing to the possibility of environmental control. The lais-sez fair and even supportive public policies towardsirregular settlement in Mexico, as in much of LatinAmerica, whatever their advantages and disadvantagesas a low cost housing solution, have inevitably widenedthe gap between letter and lay of the law, including envi-ronmental and urban planning regulations. In short,nobody expects these regulations to be universallyapplied, and no government is capable of enforcingthem. This clearly makes planning extremely difficult toachieve, with widespread consequences for presentand future damage to the environment. And, as hasbeen frequently demonstrated, the principal victims ofenvironmental degradation are the poorest members ofsociety: those who are unable to buy a better urbanenvironment.
33
UNDERSTANDING SLUMS: Case Stud ies fo r the G loba l Repor t on Human Set t lements 2003
Map 27: Metropolitan Mexico City 2000: dwellingswith no inside tap water, by census tract
Source: OCIM-SIG Project Universidad Autonoma MetropolitanaAzcapotzalco/CENVI; National Population Census (2000)
Map 28: Metropolitan Mexico City 2000: dwellingswithout sanitation by census tract
Source: OCIM-SIG Project Universidad Autonoma MetropolitanaAzcapotzalco/CENVI; National Population Census (2000)
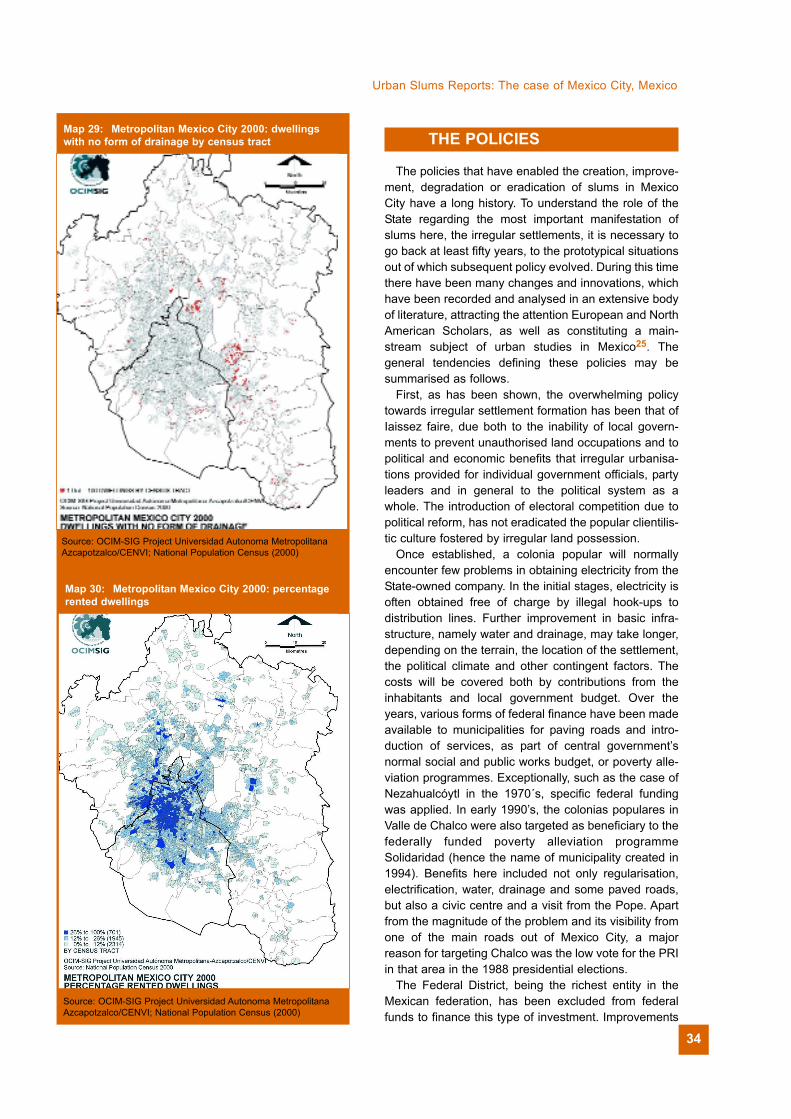
34
Urban Slums Reports: The case of Mexico City, Mexico
IV. SLUMS AND POVERTY:THE POLICIES
The policies that have enabled the creation, improve-ment, degradation or eradication of slums in MexicoCity have a long history. To understand the role of theState regarding the most important manifestation ofslums here, the irregular settlements, it is necessary togo back at least fifty years, to the prototypical situationsout of which subsequent policy evolved. During this timethere have been many changes and innovations, whichhave been recorded and analysed in an extensive bodyof literature, attracting the attention European and NorthAmerican Scholars, as well as constituting a main-stream subject of urban studies in Mexico25. Thegeneral tendencies defining these policies may besummarised as follows.
First, as has been shown, the overwhelming policytowards irregular settlement formation has been that ofIaissez faire, due both to the inability of local govern-ments to prevent unauthorised land occupations and topolitical and economic benefits that irregular urbanisa-tions provided for individual government officials, partyleaders and in general to the political system as awhole. The introduction of electoral competition due topolitical reform, has not eradicated the popular clientilis-tic culture fostered by irregular land possession.
Once established, a colonia popular will normallyencounter few problems in obtaining electricity from theState-owned company. In the initial stages, electricity isoften obtained free of charge by illegal hook-ups todistribution lines. Further improvement in basic infra-structure, namely water and drainage, may take longer,depending on the terrain, the location of the settlement,the political climate and other contingent factors. Thecosts will be covered both by contributions from theinhabitants and local government budget. Over theyears, various forms of federal finance have been madeavailable to municipalities for paving roads and intro-duction of services, as part of central government’snormal social and public works budget, or poverty alle-viation programmes. Exceptionally, such as the case ofNezahualcóytl in the 1970´s, specific federal fundingwas applied. In early 1990’s, the colonias populares inValle de Chalco were also targeted as beneficiary to thefederally funded poverty alleviation programmeSolidaridad (hence the name of municipality created in1994). Benefits here included not only regularisation,electrification, water, drainage and some paved roads,but also a civic centre and a visit from the Pope. Apartfrom the magnitude of the problem and its visibility fromone of the main roads out of Mexico City, a majorreason for targeting Chalco was the low vote for the PRIin that area in the 1988 presidential elections.
The Federal District, being the richest entity in theMexican federation, has been excluded from federalfunds to finance this type of investment. Improvements
Map 29: Metropolitan Mexico City 2000: dwellingswith no form of drainage by census tract
Source: OCIM-SIG Project Universidad Autonoma MetropolitanaAzcapotzalco/CENVI; National Population Census (2000)
Map 30: Metropolitan Mexico City 2000: percentagerented dwellings
Source: OCIM-SIG Project Universidad Autonoma MetropolitanaAzcapotzalco/CENVI; National Population Census (2000)
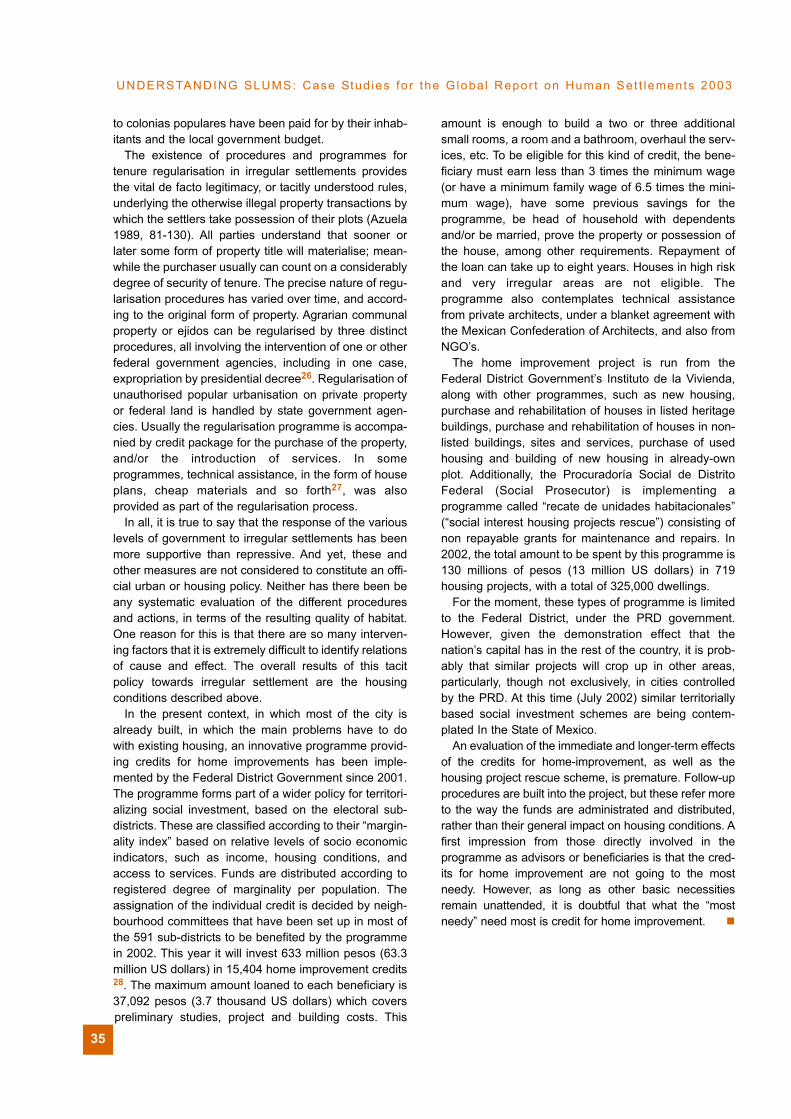
to colonias populares have been paid for by their inhab-itants and the local government budget.
The existence of procedures and programmes fortenure regularisation in irregular settlements providesthe vital de facto legitimacy, or tacitly understood rules,underlying the otherwise illegal property transactions bywhich the settlers take possession of their plots (Azuela1989, 81-130). All parties understand that sooner orlater some form of property title will materialise; mean-while the purchaser usually can count on a considerablydegree of security of tenure. The precise nature of regu-larisation procedures has varied over time, and accord-ing to the original form of property. Agrarian communalproperty or ejidos can be regularised by three distinctprocedures, all involving the intervention of one or otherfederal government agencies, including in one case,expropriation by presidential decree26. Regularisation ofunauthorised popular urbanisation on private propertyor federal land is handled by state government agen-cies. Usually the regularisation programme is accompa-nied by credit package for the purchase of the property,and/or the introduction of services. In someprogrammes, technical assistance, in the form of houseplans, cheap materials and so forth27, was alsoprovided as part of the regularisation process.
In all, it is true to say that the response of the variouslevels of government to irregular settlements has beenmore supportive than repressive. And yet, these andother measures are not considered to constitute an offi-cial urban or housing policy. Neither has there been beany systematic evaluation of the different proceduresand actions, in terms of the resulting quality of habitat.One reason for this is that there are so many interven-ing factors that it is extremely difficult to identify relationsof cause and effect. The overall results of this tacitpolicy towards irregular settlement are the housingconditions described above.
In the present context, in which most of the city isalready built, in which the main problems have to dowith existing housing, an innovative programme provid-ing credits for home improvements has been imple-mented by the Federal District Government since 2001.The programme forms part of a wider policy for territori-alizing social investment, based on the electoral sub-districts. These are classified according to their “margin-ality index” based on relative levels of socio economicindicators, such as income, housing conditions, andaccess to services. Funds are distributed according toregistered degree of marginality per population. Theassignation of the individual credit is decided by neigh-bourhood committees that have been set up in most ofthe 591 sub-districts to be benefited by the programmein 2002. This year it will invest 633 million pesos (63.3million US dollars) in 15,404 home improvement credits28. The maximum amount loaned to each beneficiary is37,092 pesos (3.7 thousand US dollars) which coverspreliminary studies, project and building costs. This
amount is enough to build a two or three additionalsmall rooms, a room and a bathroom, overhaul the serv-ices, etc. To be eligible for this kind of credit, the bene-ficiary must earn less than 3 times the minimum wage(or have a minimum family wage of 6.5 times the mini-mum wage), have some previous savings for theprogramme, be head of household with dependentsand/or be married, prove the property or possession ofthe house, among other requirements. Repayment ofthe loan can take up to eight years. Houses in high riskand very irregular areas are not eligible. Theprogramme also contemplates technical assistancefrom private architects, under a blanket agreement withthe Mexican Confederation of Architects, and also fromNGO’s.
The home improvement project is run from theFederal District Government’s Instituto de la Vivienda,along with other programmes, such as new housing,purchase and rehabilitation of houses in listed heritagebuildings, purchase and rehabilitation of houses in non-listed buildings, sites and services, purchase of usedhousing and building of new housing in already-ownplot. Additionally, the Procuradoría Social de DistritoFederal (Social Prosecutor) is implementing aprogramme called “recate de unidades habitacionales”(“social interest housing projects rescue”) consisting ofnon repayable grants for maintenance and repairs. In2002, the total amount to be spent by this programme is130 millions of pesos (13 million US dollars) in 719housing projects, with a total of 325,000 dwellings.
For the moment, these types of programme is limitedto the Federal District, under the PRD government.However, given the demonstration effect that thenation’s capital has in the rest of the country, it is prob-ably that similar projects will crop up in other areas,particularly, though not exclusively, in cities controlledby the PRD. At this time (July 2002) similar territoriallybased social investment schemes are being contem-plated In the State of Mexico.
An evaluation of the immediate and longer-term effectsof the credits for home-improvement, as well as thehousing project rescue scheme, is premature. Follow-upprocedures are built into the project, but these refer moreto the way the funds are administrated and distributed,rather than their general impact on housing conditions. Afirst impression from those directly involved in theprogramme as advisors or beneficiaries is that the cred-its for home improvement are not going to the mostneedy. However, as long as other basic necessitiesremain unattended, it is doubtful that what the “mostneedy” need most is credit for home improvement.
35
UNDERSTANDING SLUMS: Case Stud ies fo r the G loba l Repor t on Human Set t lements 2003
NOTES
Except where otherwise indicated, the statistical andcartographical information included in this chapter wasgenerated by the project SISTEMA DE INFORMACIÓNGEOGRÁFICA PARA LA INVESTIGACIÓN YPLANEACIÓN METROPOLITANA, currently inprogress at the UAM-A, coordinated by the author. Theproject benefits from the collaboration of the Centro dela Vivienda y Estudios Urbanos AC (CENVI) and isfinanced by the UAM-A and Mexico’s Consejo Nacionalpara la Ciencia y Tecnología (CONACyT). Specialthanks to Jesús Velázquez and his CENVI team for helpin preparing the maps presented here. Except for Map1, these were generated in MapInfo and fIinished inCorel Draw.
1 The Mexican National Population Council (CONAPO)calculated the marginality index for municipalities and localitiesin 1995, confirming that poverty indicators are inversely propor-tional to the size of the municipal population. In 1995, of the 9.2million people living in localities of less than 500, 8.5 millionregistered a medium, high or extremely high marginality index.CONAPO (2000, p36). 2 There are numerous contradictory estimates ofTenochitlán's population in 1520. The early C16 population ofthe whole Valle of Mexico, roughly corresponding to the siteand extension of present-day Mexico City, has been estimatedat as much as two million. 3 By Luis Unikel, who used physical contiguity as the maincriterion to define "metropolitan areas" and "administrativeboundaries containing urban areas directly related to thecentral city" to delimit "metropolitan zones" (Unikel, L. et al1976, pp 116, 118). 4 Nor is their much consensus on what to call Mexico City."Mexico Valley Metropolitan Zone" has tended to replace"Mexico City Metropolitan Area" and "Metropolitan Zone",reflecting the wider coverage of topographical criteria. TheGovernment of Mexico State tends to refer to its municipalitieswithin metropolitan Mexico City as the "Cuautitlán-TexcocoValley". 5 How the city is defined does, however, affect the measure-ment of poverty based on relative indicators, for example, thepercentage of population without access to clean water.Inevitably, the more sparsely populated semi-rural peripheralmunicipalities show up with higher incidence of poverty-relatedindicators.6 Out of a total of 1,144 million in 1980. These figures referto employees in industries registered in the industrial census of1980 and 1933, for the Federal District and 27 metropolitanmunicipalities. 7 As the word "slums" is not generally used, there are nomeaningful definitions, official or otherwise, beyond what thedictionary provides. 8 The lack of distinction between official and unofficial defini-tions also applies to the definition of "poverty". There are asmany "official" definitions of "poverty" as there are governmentdepartments. Non government (unofficial?) definitions, such asthose provided by the Economic Commission for Latin America(ECLA) or the wider definitions of the Mexican expert, JulioBoltvinik, are often used as yardsticks, but not necessarily
36
applied in policy definition and targeting. Furthermore, asacademics move in and out of government, taking with themtheir particular view of the world, the distinction between "offi-cial" and "unofficial" is temporary. What is relevant is theconceptualisation of poverty behind the major social policies. 9 Translation into English can be misleading. The Spanishword popular should be strictly translated as "of the people", ingeneral to denote the lower social classes (las clases popu-lares). These include a much wider segment of society thanthose who are strictly "below the poverty line" (howeverdefined). Popular is also used to denote a residual category(like marginal or informal), defined not for what it is, but what itis not (sector popular) ie. not legal, not public, not private, notwell-to-do. Because of the lack of clear translation, I shall usepopular in italics as a Spanish word. Colonia, has a much morespecific connotation than "neighbourhood", as it is usuallytranslated. The whole city is divided into colonias, and althoughthey have no official boundaries, their territorial identity isusually fairly clear cut.10 The word tugurio was possibly applied at that time becauseit was believed that the housing in those areas should be erad-icated and replaced by Le Corbusian-type unites (INV 1958b).Fortunately, this did not happen, except for the 11,000 high-riseflats in the Unidad Nonoalco-Tlatelolco, built in the early 1960s.11 In the city of Zacatecas, one infamous vecindad -theMesón de Jobito - is now a five-star hotel!12 See Thompson (1990) for an account of the appalling livingconditions of the poor in Porfirian Mexico City.13 The traditional roof and flooring techniques generallyconsists of closely spaced beams, covered various layers ofother materials. Towards the end of the C19 these werereplace by compressive structures, such as the bóveda cata-lana (a type of narrow vaulting).14 For an analysis in English of rented housing in irregularsettlements in Guadalajara and Puebla see Gilbert and Varley(1991)15 More than 2,500 inhabitants.16 For conceptual and methodological reasons, the figuresfrom each of the census products may not exactly coincide. 17 The financial crisis over the last two decades has createdmany extremely impoverished middle-class individuals andfamilies, whose housing conditions are better than theirincomes might suggest.18 This should not be interpreted as global fertility rate.19 For example Iracheta (2000a, pp18-19) refers to a studywhich found that unserviced land in irregular settlements inmetropolitan municipalities in Mexico State cost more, on aver-age, per m2 than plots of 120 m2 in a government financedsites and services project. 20 The role of women in settlement creation and improvementhas been widely emphasised. See for example the testimoniesin Massolo and Díaz (1990), Moctezuma (1999) and SánchezMejorada and Herrasti (1999). 21 Consumption over and above 50 cu. m. bi-monthly ischarged at the rate of 4.05 pesos (40 US cents) per cu. m.22 Mexico City's microbuses are criticised mainly for their highcontribution to air pollution, the bad, even dangerous quality ofthe service they offer and, in general, their apparently chaoticoccupation of road space in detriment to the need of the privatecar. Most inhabitants of Mexico City, including those who relyon public transport would not share Robert Cervero's enthusi-asm for its "paratransit" system. Cervero (1998, 394) is right,however, in pointing out that the minibuses and "peseros"
Urban Slums Reports: The case of Mexico city, Mexico
deliver "badly needed services and jobs in poor neighbour-hoods". 23 Two widely-cited texts in this vein are: Cornelius (1975)and Montaño (1976).24 There is a wealth of literature in Spanish on the emergenceand development of the Popular Urban Movement in Mexico'sirregular settlements during the 1970s and early 1980s,perhaps the most influential at the time being Navarro andMoctezuma (1981). 25 See Ward (1998) for comprehensive bibliographical refer-ences on the subject in English, and Duhau (1999) and Cruz(2001) for equally comprehensive accounts of the bibliographyin Spanish. 26 The first, original form of both legitimisation and, to somedegree, regularisation of urbanised agrarian land was theapplication of agrarian law allowing for the creation of urbanareas within the agrarian communities, as described in detailby Varley (1985). The second procedure, put into practice after1970, involves the expropriation of the ejido, indemnification ofthe original communal owners or ejidatarios and the resale tothe settlers. The third mechanism, created after constitutionalreforms in 1992 allowed for the dissolution and privatisation ofejidal lands, is by means of the direct sale of agrarian property,following a procedure certifying the property rights of theejidatarios. (See Jones and Ward 1998). 27This was the case of some colonias on the ejidal lands inNaucalpan municipality regularised by the State of Mexicoagency AURIS in the early 1970s.28 This programme also includes a range of other socialbenefits, with a total budget for the Territorial Social InvestmentProgramme for the Federal District in 2002 of 4,222,384,166pesos (422 million US dollars).
GLOSSARY
Asentamientos irregulares Irregular settlementsBarrio bajo Term for a slumCabildos Councils Ciudades perdidas "Lost cities" - pockets of shanty housing
within the cityColonia NeigbourhoodColonias populares Popular colonies (settlements)Colonos SettlersCuartos de azotea "Rooftop homes" - housing on the roofs of
apartment buildingsDelegación An administrative district of Mexico CityDelegados Heads of DelegacionesEjidatarios Commoners (with rights to use of common
land)Ejidos Communal agricultural lands, often
urbanised around citiesMexica The AztecsPeseros Collective taxisPresidentes municipales Elected mayorsTenochtitlan The city of the Mexica, the site of today's
Mexico CityTugurio Term for a slumVecindad Tenements, often with slum conditions
ACRONYMS
GDF Government of the Federal DistrictGDP Gross Domestic ProductNGO Non-Governmental OrganisationPAN National Action PartyPRD Revolutionary Democratic Party PRI Revolutionary Institutional Party
BIBLIOGRAPHY
Azuela, A (1989) La Ciudad, la Propiedad Privada y elDerecho. El Colegio de México, México DF
Castañeda, V (1988) “Mercado inmobiliario en la periferiametropolitana: los precios del suelo. Estudios de caso”, in O.Terrazas y E. Preciat (coords.) Estructura Territorial de laCiudad de México, Plaza y Valdez, México
Castells, M (1983) The City and the Grassroots. A Cross-Cultural Theory of Urban Social Movements, Edward Arnold,London
CENVI (1997) (coord. R. Coulomb) Escenarios demográficos yurbanos de la Zona Metropolitana de la Ciudad de México.Centro de la Vivienda y Estudios Urbanos (unpublished).Published in abbreviated version by CONAPO (1998)Escenarios Demográficos y Urbanos de la Zona Metropolitanade la Ciudad de México. 1990-2010. Consejo Nacional dePoblación, México DF
Cervero, R. (1998) The Transit Metropolis. A Global Enquiry.Island Press, Washington DC
CONAPO (2000) Índices de Marginación 1995, ConsejoNacional de Población, México DF
CONAPO (2001) La Población de México en el Nuevo Siglo.Consejo Nacional de Población, México DF
COPEVI (1976) La Producción de Vivienda en México. CentroOperacional de Vivienda y Poblamiento AC, México DF,(mimeo)
Cornelius, W (1975) Politics and the Migrant Poor in MexicoCity. Stanford University Press
Coulomb, R y C Sánchez Mejorada (1991) ¿TodosPropietarios? Vivienda de Alquiler y Sectores Populares en laCiudad e México. Centro de la Vivienda y Estudios Urbanos,México
Cruz, Ma. S (2001) Propiedad, Poblamiento y Periferia Ruralen la Zona Metroplitana de la Ciudad de México. Red Nacionalde Investigación Urbana/Universidad Autónoma Metropolitana,México DF
De la Rosa, M (1974) Netzahualcóyotl. Un Fenónemo. Fondode Cultura Económica, México DF
de Rojas J L (1986) México Tenochtitlan. Fondo de CulturaEconómica, México
Duhau, E (1999) Habitat Popular y Política Urbana. MiguelAngel Porrúa/Universidad Autónoma Metropolitana, México DF
Esquivel, Ma.T (2002) ‘Pobreza, género y familia: algo mássobre los hogares encabezados por mujeres’, in Trabajo yMigración. Red Nacional de Investigación Urbana, México
37
UNDERSTANDING SLUMS: Case Stud ies fo r the G loba l Repor t on Human Set t lements 2003
Garza (1985) El Proceso de Industrialización en la Ciudad deMéxico 1821-1970. El Colegio de México, México
Gilbert, A and A Varley (1991) Landlord and Tenant. Housingthe Poor in Urban Mexico. Routledge, London
Hiernaux, D and A Lindon (1998) “Proceso de ocupación delsuelo, mercado de tierra y agentes sociales. El Valle deChalco, Ciudad de México 1978-1991” in E Jiménez (comp.)Análisis del Suelo Urbano. Instituto Cultural de Aguascalientes,Aguascalientes
Huamán. E (1998) Políticas de Regularización y AccesoPopular al Suelo Urbano. El Colegio Mexiquense,Zinacantepec
Huamán, E (2000) “Dos supuestos acerca de la regularizaciónde la tenencia de la tierra: el caso de Chimalhuacán, México”,in A. Iracheta and M. Smolka (coords.) Los Pobres de laCiudad y La Tierra. El Colegio Mexiquense/Lincoln Institute ofLand Policy, Zinacantepec, México
INV (1958a) Herradura deTugurios. Instituto Nacional deVivienda, México
INV (1958b) Renovación Urbana. Instituto Nacional deVivienda, México
Iracheta, A (2000a) ‘Políticas e instrumentos de generación desuelo urbanizado para pobres por medio de la recuperación deplusvalías’ in A. Iracheta and M. Smolka (coords.) Los Pobresde la Ciudad y La Tierra. El Colegio Mexiquense/LincolnInstitute of Land Policy, Zinacantepec, México
Iracheta, A (2000) “La urbanización metropolitanadescapitalizada: el Valle de Chalco”, in D Hiernaux, A Lindonand J Noyola (coords.) La Construcción Social de un TerritorioEmergente. El Valle de Chalco. El Colegio Mexiquense,Zinacantepec
Islas, V (2000) Llegando Tarde al Compromiso. La Crisis delTransporte en la Ciudad de México. El Colegio de México,México DF
Jiménez, E (2000) El Principio de la Irregularidad. Mercado deSuelo para Vivenda en Aguascalientes, 1975-1998. JuanPablos Editor/Centro de Investigaciones y EstudiosMultidisciplinarios de Aguascalientes, México DF
Jones, G and P Ward (1998) ‘The privatization of thecommons: reforming the ejido and urban development inMexico’ International Journal of Urban and Regional Research,22: 3
Juárez, J M (2000) “Territorio e identidad social en el Valle deChalco”, in D Hiernaux, A Lindon and J Noyola (coords.) LaConstrucción Social de un Territorio Emergente. El Valle deChalco. El Colegio Mexiquense, Zinacantepec
Massolo, A. and Díaz, L (1990) ‘Doña Jovita. Una Mujer en elMovimiento Ubano Popular’, in Mujeres para el Diálogo.CENVI, México DF
Moctezuma, P (1999) Despertares. Comunidad y OrganizaciónPopular en México 1970-1994. UniversidadIberoamericana/Universidad Autónoma Metropolitana-Iztapalapa, México DF
Montaño, J (1976) Los Pobres de la Ciudad de México. SigloXXI, México DF
Navarro, B. and P Moctezuma (1981) ‘Clase obrera, ejércitoindustrial de reserva y movimientos sociales urbanos de lasclases dominadas en México’. Teoría y Política 2
Noyola J (2000) “Del páramo a la esperanza. De la aplicacióndel PRONASOL a la consolidación de la vida municIpal 1988-1999” in D Hiernaux, A Lindon and J Noyola (coords.) La
Construcción Social de un Territorio Emergente. El Valle deChalco. El Colegio Mexiquense, Zinacantepec
Salazar, C.E (1999) Espacio y Vida Cotidiana en la Ciudad deMéxico. El Colegio de México, México DF
Sánchez Mejorada, C and Ma. E Herrasti (1999) La Mujer y laCiudad hace el Año 2000. Centro de la Vivienda y EstudiosUrbanos, México DF
Schteingart, M (1989) Los Productores del Espacio Habitable.Estado, Empresa y Sociedad en la Ciudad de México. ElColegio de México, México DF
Sobrino, L J (1996) “Solidaridad en Chalco”, in R Hernández(comp.) Valle de Chalco Solidaridad. El Colegio Mexiquense,Toluca
Sudra, T. (1976) Low income housing systems in Mexico City,Unpublished PhD dissertation, M.I.T.
Thompson, L (1990) ‘Artisans, marginals and proletarians. Thehouseholds of the popular classes in Mexico City 1876-1945’,paper presented for the VIII Conference of Mexican and NorthAmerican Historians, San Diego, California, Oct. 18-20
Unikel, L. et al (1976) El Desarrollo Urbano de México:Diagnóstico e Implicaciones Futuras. Centro de EstudiosEconómicos y Demográficos, El Colegio de México, México DF
UTN (1998) Atlas Mercadológico de Nezahualcóytl. Gobiernodel Estado de México/Universidad Tecnológico deNezahualcóytl, México
Varley, A (1985) ‘Urbanisation and agrarian law: The case ofMexico City’ Bulletin of Latin America Research, 4 (1), pp. 1-16
Ward, P (1976) In search of a home: Social and economiccharacteristics of squatter settlements and the role of selfhousing in Mexico City. PhD Thesis, University of Liverpool
Ward, P (1982) ‘The practice and potential of self-help housingin Mexico City’. In: P. Ward (ed.) Self Help Housing. A Critique.Mansell, London
Ward, P. (1998) Mexico City. John Wiley (2nd. Edition revised),London
38
Urban Slums Reports: The case of Mexico city, Mexico