measuring the construction industry’s productivity
TRANSCRIPT

Measuring the Construction Industry’s ProductivityPerformance: Critique of International Productivity
Comparisons at Industry LevelBernard Vogl, Ph.D.1; and Mohamed Abdel-Wahab, Ph.D.2
Abstract: The authors review work on international comparisons of construction productivity performance by providing an in-depth critiqueof the existing literature and highlighting the existing methodological challenges. Using studies and data on the United Kingdom’s relativeconstruction productivity performance as an exemplar, it is suggested that any investigation of international productivity differences in con-struction at the industry level is highly problematic because these productivity estimates do not compare like for like. Data definitions andcoverage differ substantially across countries. In addition, deflators and exchange rates used to convert output into a common currency areunreliable. While the new standard industrial classifications 2007 could provide a better basis of cross-country productivity comparisons andfurther research on deflators, conversion rates, labor inputs, and capital stock estimates could improve the robustness of internationalcomparisons, there are conceptual limitations to an industry-level approach. This paper’s contribution is to discuss these methodologicalchallenges in detail and propose a research agenda for enhancing cross-country productivity comparisons for informing government policyintervention on productivity improvement. The authors argue that cross-country productivity at the project level can enable a more detailedanalysis of the tangible and intangible inputs to the construction process while accounting for the heterogeneous nature of the industry.However, the existing project-based productivity measures fall short of providing a common framework for systematically gathering com-parable cross-country productivity data that could enable robust benchmarking. The authors conclude by calling for the need of facilitating thecollection and analysis of robust project-level productivity data, e.g., through an international benchmarking club, in order to support effectivepolicy intervention for enhancing construction productivity performance. DOI: 10.1061/(ASCE)CO.1943-7862.0000944.© 2014 AmericanSociety of Civil Engineers.
Author keywords: Productivity; International benchmarking; Construction industry; National accounts data; Performance measurement;Labor and personnel issues.
Introduction
Productivity is a key driver for economic growth and prosperity inany country. Higher productivity translates into higher wages, prof-its, and tax revenue, cheaper and often better products, and servicesfor customers, and thus benefits the society as a whole.
An economy’s productivity performance can only be as goodas the performance of its constituent parts. The construction indus-try is a significant contributor to the economy in most countries.According to Arditi and Mochtar (2000), the construction industryaccounts for 6–8% of an economy’s gross domestic product (GDP).An improvement in construction productivity performance wouldnot only raise profits and earnings in the sector, but could providesubstantial cost savings. For example, an increase of 10% in theU.K. construction labor productivity is equivalent to a saving of
£1.5 billion to the industry’s clients; sufficient to procure perhapsan additional 30 hospitals or 30,000 houses per year (Horner andDuff 2001). Furthermore, the built environment is the nation’s larg-est asset. Built assets account for approximately 66–90% of allmanufactured wealth, and are thus an important input to the pro-duction processes of other sectors (Pearce 2003).
Improving the productivity of the construction industry hastherefore been at the heart of government’s and industry’s agendaleading to various policy initiatives. An example can be found in SirJohn Egan’s Construction Task Force, which delivered a report,Rethinking Construction, on the scope for improving the qualityand efficiency of U.K. construction [Department of the Environ-ment Transport and Regions (DETR) 1998]. Crucially, any suchpolicies should be driven by an analysis of the available evidenceon the industry’s performance. This evidence in turn should addressquestions like the following: How does the productivity perfor-mance of the sector compare internationally or to other sectorsin an economy? If there are productivity gaps, what explains them?Has productivity improved over time? What are the key industry-specific drivers of productivity on which policy initiatives shouldfocus? Have industry-specific policies been successful in enhanc-ing productivity?
The initial report of Sir John Egan’s Construction Task Forceacknowledged that solid data on performance in terms of efficiencyand quality are hard to come by and that the construction industrymust also put in place a means of measuring progress towards itsobjectives and targets.
1Professor, Hochschule Niederrhein, School of Business Administra-tion and Economics and Niederrhein, Institute for Regional and StructuralResearch (NIERS), Webschulstraße 41–43, 41065 Mönchengladbach,Germany.
2Royal Academy of Engineering, Centre of Excellence isSustainable Building Design, School of the Built Environment, Heriot-WattUniv., Edinburgh EH14 4AS, U.K. (corresponding author). E-mail: [email protected]
Note. This manuscript was submitted on February 24, 2014; approvedon September 29, 2014; published online on November 10, 2014. Discus-sion period open until April 10, 2015; separate discussions must be sub-mitted for individual papers. This paper is part of the Journal ofConstruction Engineering and Management, © ASCE, ISSN 0733-9364/04014085(10)/$25.00.
© ASCE 04014085-1 J. Constr. Eng. Manage.
J. Constr. Eng. Manage.
Dow
nloa
ded
from
asc
elib
rary
.org
by
Her
iot-
Wat
t Uni
vers
ity o
n 11
/12/
14. C
opyr
ight
ASC
E. F
or p
erso
nal u
se o
nly;
all
righ
ts r
eser
ved.

“The industry starts with a clean sheet in this respect. It hasa great opportunity to create an industry-wide performancemeasurement system” (DETR 1998, p. 18). While there have beensubstantial efforts on developing industrywide performancemeasures, they still provide poor policy and industry guidance.Recently, the Scottish Construction Industry Strategy (2013) hasacknowledged that “Robust baseline data from which we can mon-itor and track the performance of the Scottish Construction Industryis often unavailable.” Furthermore, it is argued that researchand development, benchmarking, and learning from other regionsand countries will be central to both the understanding and appli-cation of productivity improvements in the industry. Industrywidedatabases, such as the European Union (EU) KLEMS, providesoverall trends of cross-country productivity performance (Abdel-Wahab and Vogl 2011), but they are plagued with methodologicalchallenges. The authors argue that the existing body of knowledgeis deficient because it inhibits the development of robust construc-tion productivity policy interventions.
Therefore, the aim of this paper is to conduct an in-depth reviewon cross-country productivity comparisons and highlight suchmeth-odological problems that inhibit policy development. There is apaucity of papers that attempt to synthesize the existing literaturein productivity research. An example of such attempts is the recentwork of Yi andChan (2014), which identified the common themes inconstruction labor productivity (CLP) research, such as modelingand evaluation of CLP and trends and comparisons of CLP. Simi-larly, Dolage and Chan (2014) found that construction productivityresearch predominately focused on the “measurement of productiv-ity” and “examining the casual relationships with productivity.” Asimilar approach is also adopted by Panas and Pantouvakis (2011),but taking one step further by attempting to classify existing con-struction productivity research themes by the research method used,namely, qualitative, quantitative, and mixed method.
Overall, the few attempts of reviewing construction productivityresearch focuses on producing a broad thematic overview and itfalls short of providing an in-depth critique of the methodologicalchallenges associated with the research under each theme.
This paper therefore addresses this research gap by providing acritique and an in-depth analysis of the methodological problemsunderlying a specific theme of construction productivity research,cross-country comparisons. The authors also propose a researchagenda for advancing knowledge in cross-country productivityanalysis.
This paper is a review article based on an in-depth critique of theexisting literature. Mayer (2009) described the purpose of a reviewpaper as to organize, synthesize, and evaluate the literature to iden-tify patterns and trends, thereby identifying research gaps and rec-ommending new research areas. Review articles are virtual goldmines for identifying significant gaps in the research, current de-bates, and ideas of where research might go next (University ofTexas at Austin 2010). Therefore, review articles of good qualityare frequently needed in the presence of the growing numberof research papers and to examine the current state of existing pub-lications on a certain topic (Batovski 2008). The past decade haswitnessed the continuation of the same relentless research interestin productivity research (Yi and Chan 2014).
Concepts of Productivity Measurement
This section presents a review of productivity measurementconcepts, which helps to understand some of the arguments sub-sequently in the text. International productivity comparisons forthe industry differ in the level of aggregation in the data. The choice
of the boundary of the production system (sector, company, project,activity, task) and the associated data depend on the purpose of theinvestigation (Chau and Walker 1988). For example, project dataare most appropriate if the impact of design, procurement, or sitemanagement is the subject of the investigation. A lower level ofaggregation enables a better identification of the drivers of produc-tivity and permits the control of heterogeneity in construction out-put. A major drawback is a greater data collection requirement(Hwang and Soh 2013). It is therefore unsurprising that a lot ofexisting works rely on readily available official sectoral data.Before reviewing studies using aggregated sectoral data, it is im-portant to establish an understanding of productivity measures.
Productivity is a measure of the efficiency with which theeconomy turns inputs, such as labor and capital, into output.Single-factor productivity measures relate just to one input factor,often labor or capital to an output measure, whereas total (multi-factor) productivity measures take into account the combinedimpact of all inputs on output.
If the output of an industry is homogeneous, it could be mea-sured in physical units, e.g., cubic meters. However, the construc-tion industry’s output is heterogeneous given the diverse nature ofconstruction projects (such as housing, rail bridges, and refurbish-ing work), which makes it infeasible to aggregate the industry’soutput into one physical measurement unit. Therefore, market pri-ces are used as weights instead, and these weights should ideallyalso capture quality differences. As will be discussed subsequently,particularly the aggregation and the use of prices as weights leads toa couple of complications that limit the robustness of internationalproductivity comparisons at an industry level.
Average labor productivity (ALP) is a common measure thatrelates output to labor inputs. For example:• Output per worker, which is simple to measure, but comparisons
suffer from differences in the way labor is used across coun-tries; and
• Output per hour worked adjusts for labor intensity and is themost commonly used academic measure of productivity.These measures are commonly used and seem to be intuitive.
However, there are some drawbacks of the previous ALP measureof productivity. Its main limitation is that as a single-factor measureit is not well suited to the analysis of productivity, which involvesseparately identifying the contributions of the determinants of pro-ductivity performance. Disentangling the international differencesor increases in output per worker into its constituent componentswould provide valuable information on the underlying causes ofvariability in productivity performance. It is the latter that is of par-ticular value to policy makers and industry.
Such an approach would require relating construction output (Y)through a production function (f) to the tangible and intangibleinputs of the production process. For this exposition it is assumedthat there are three variable inputs, labor (L), capital (K), and ma-terials (M). Other influences are captured by the shift factor a
Y ¼ afðL;K;MÞ ð1Þ
Assuming the constant returns to scale this production functioncan be rearranged to
Y=L ¼ afð1;K=L;M=LÞ ð2Þ
i.e., Y=L or ALP depends on the capital and material intensitiesand on a. Productive efficiency is maximized by choosing the leveland quality of all inputs that maximizes output. As can be seen inEq. (2), a relatively high ALP could be achieved at the expense ofefficiency because ALP increases as capital or material is substi-tuted for labor. The industry with the higher capital and material
© ASCE 04014085-2 J. Constr. Eng. Manage.
J. Constr. Eng. Manage.
Dow
nloa
ded
from
asc
elib
rary
.org
by
Her
iot-
Wat
t Uni
vers
ity o
n 11
/12/
14. C
opyr
ight
ASC
E. F
or p
erso
nal u
se o
nly;
all
righ
ts r
eser
ved.

intensity would have a higher ALP irrespective of whether its inputmix was output maximizing (Lowe 1987).
The issue of materials intensity is addressed by correctingoutput measures for brought in materials and services, i.e., by usingvalue added as output measure. By doing this, however, informa-tion is lost because the impact of materials intensity on productivitycannot be assessed. There is another measure that is somewhatmore difficult to compute but addresses the weakness of ALPmeasures discussed previously, total factor productivity (TFP).
Using the previous production function, TFP can then beexpressed as
TFP ¼ Y=fðL;K;MÞ ð3ÞTFP measures how efficiently inputs such as capital, labor, and
materials are used together and can be interpreted as a range ofdifficult to measure factors such as technology, organization, man-agement, competition, and regulation. Essentially, TFP measuresthe increase in output that is not attributable to an increase in meas-urable tangible input such a labor, capital, and materials.
As can be seen in Eq. (2) there is a link between average laborproductivity and TFP, where the latter can be interpreted as a de-terminant of labor productivity (Crawford and Vogl 2006). Further,Eq. (2) can be used to calculate the contributions of TFP and themeasureable inputs to intercountry differences in labor productivityand to labor productivity growth.
In the following sections, the authors review work oninternational productivity comparisons of the construction industry.The reader, however, should not expect an international ranking ofconstruction industries. This can be found, for example, in theRoyal Commission into the Building and Construction Industry(2002) report. Nor should the reader expect revised industry levelproductivity estimates. Rather, the paper will give a very detailedand comprehensive account as to why any such productivity esti-mates or productivity rankings are unreliable and elaborates on theunderlying methodological problems. The problems are identifiedby a detailed critique of productivity studies commissioned bythe U.K. Department for Business Innovation and Skills (BIS),formerly the Department for Trade and Industry (DTI). These stud-ies were triggered by the government need to benchmark the U.K.construction productivity performance with a view of informingpolicy makers on the underlying root causes of internationalproductivity gaps. This in turn was supposed to help prioritize con-struction industry–specific interventions with the view to improvethe industry’s productivity performance.
Sectoral Productivity Studies Based on NationalAccounts
International organizations such as the Organization for EconomicCooperation and Development (OECD) and the EU and nationalgovernments have undertaken considerable efforts to develop sec-toral data sets that have been extensively used for productivityanalysis at an industry or sector level, e.g., EU KLEMS and OECDSTAN. While these data sets can provide interesting insights intocross-country productivity comparison and some of the underlyingcauses of cross-country differences in productivity for sectors suchas manufacturing, they still provide poor policy guidance for theconstruction industry (Sezer and Bröchner 2013).
The following discussion focuses on reviewing studies commis-sioned by the U.K. Department for BIS, formerly the DTI. The ob-jective of these studies was to establish how the United Kingdomranked in terms of productivity and to inform policy makers aboutsome of the underlying causes of differences in productivity
between countries. These studies were chosen because all the dataand the applied methodology are well documented and the lessonsthat can be learned from these studies have not been widely popu-lated in the literature. Further, the issues exemplified using thesestudies equally applies to other studies using industry-level datafor productivity comparisons and can provide good guidance forfurther research.
Evidence on the United Kingdom’s Relative AverageLabor Productivity Performance
Two reports commissioned by the Department of BIS investigatedthe relative position—in terms of ALP and TFP—of the U.K. con-struction industry compared with France, Germany, and the UnitedStates (Blake et al. 2004; Ive et al. 2004). BIS also funded the com-pilation of a comprehensive sectoral data set, which also incorpo-rated productivity estimates of the construction industry (Masonet al. 2008). In these studies construction is defined in accordancewith the Standard Industrial Classification (SIC) codes and includesgeneral construction and demolition work, civil engineering, newconstruction work, and repair and maintenance. This could be re-garded as a narrow definition of the construction industry (Pearce2003) as SIC 45 [Office for National Statistics (ONS) 2002] (in the2003 version of the U.K. SIC Codes) does not capture professionalconstruction services nor does it include the construction productsindustry (Briscoe 2006).
In Table 1 are some international ALP comparisons for the con-struction sector, which are calculated as value added per hourworked, where the United Kingdom is indexed as 100.
There seems to be consensus that the United States is doing bet-ter (in terms of ALP) than its European counterparts, although Iveet al. (2004) suggest that that there is little difference betweenFrance and the United States. Mason et al. (2008) put the UnitedKingdom somewhat ahead of Germany and France, whereas Blakeet al. (2004) and Ive et al. (2004) suggest that France and Germanyare ahead of the United Kingdom.
What may explain these differences and how robust are theserankings? Robust benchmarking would require that output figuresand labor inputs are internationally comparable. First of all, pointestimates of labor productivity do not take into account the cycli-cality of productivity (Abbott and Carson 2012). For example, theGerman construction output had been contracting for a prolongedperiod following the reunification boom in the early 1990s. Thishad most likely been a drag on German labor productivity andwould require some adjustments for the relative cyclical positionof the respective construction industries (Blake et al. 2004).
The use of market prices as weights requires the conversionof output figures into a common currency. For conversion of output
Table 1. Average Labor Productivity Comparison
CountryIve et al.(2004)
Blake et al.(2004)
Mason et al.(2008)
France 137 108 92Germany 121 109 91United Kingdom 100 100 100United States 139 132 124
Note: Value added per hour worked, United Kingdom = 100; the outputestimates in Blake et al. (2004) and Ive et al. (2004) were convertedby purchasing power parity rates to 1999 U.S. dollars and showproductivity figures for the years 2001 and 1999, respectively; theMason et al. (2008) estimates show labor productivity figures for 2004and output figures were converted to U.S. dollars by a 2002construction purchasing power parity rate.
© ASCE 04014085-3 J. Constr. Eng. Manage.
J. Constr. Eng. Manage.
Dow
nloa
ded
from
asc
elib
rary
.org
by
Her
iot-
Wat
t Uni
vers
ity o
n 11
/12/
14. C
opyr
ight
ASC
E. F
or p
erso
nal u
se o
nly;
all
righ
ts r
eser
ved.
(value added) to a common currency, the main source for intercoun-try price comparisons are the purchasing power parities (PPPs)produced by Eurostat and the OECD, and these were used forthe conversion into U.S. dollars by the previously cited studies.PPPs are exchange rates that equate the price of a homogeneousproduct across countries.
That adjustment is made because this paper is interested ininternational differences in resource inputs that are needed to pro-duce a homogenous product (output) and the relationship betweenoutput and input should only be affected by real factors and not bymovements in the exchange rates.
The difference between the Ive et al. (2004) and Blake et al.(2004) estimates can largely be explained by the use of differentexchange rates. Blake et al. (2004) used sector-specific PPPs,whereas Ive et al. (2004) used whole economy PPPs based on theGDP deflator. The effects of switching the exchange rate areparticularly pronounced for France. The subsequent example dem-onstrates the effect in more detail using the estimates by Masonet al. (2008).
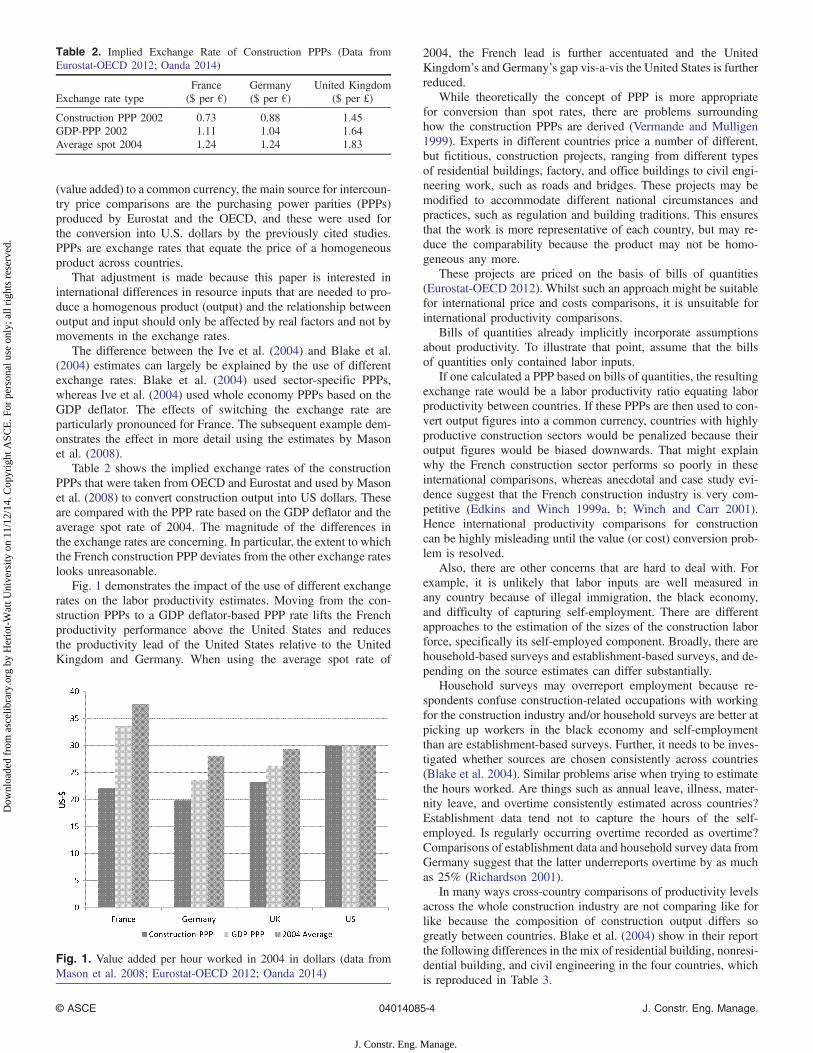
Table 2 shows the implied exchange rates of the constructionPPPs that were taken from OECD and Eurostat and used by Masonet al. (2008) to convert construction output into US dollars. Theseare compared with the PPP rate based on the GDP deflator and theaverage spot rate of 2004. The magnitude of the differences inthe exchange rates are concerning. In particular, the extent to whichthe French construction PPP deviates from the other exchange rateslooks unreasonable.
Fig. 1 demonstrates the impact of the use of different exchangerates on the labor productivity estimates. Moving from the con-struction PPPs to a GDP deflator-based PPP rate lifts the Frenchproductivity performance above the United States and reducesthe productivity lead of the United States relative to the UnitedKingdom and Germany. When using the average spot rate of
2004, the French lead is further accentuated and the UnitedKingdom’s and Germany’s gap vis-a-vis the United States is furtherreduced.
While theoretically the concept of PPP is more appropriatefor conversion than spot rates, there are problems surroundinghow the construction PPPs are derived (Vermande and Mulligen1999). Experts in different countries price a number of different,but fictitious, construction projects, ranging from different typesof residential buildings, factory, and office buildings to civil engi-neering work, such as roads and bridges. These projects may bemodified to accommodate different national circumstances andpractices, such as regulation and building traditions. This ensuresthat the work is more representative of each country, but may re-duce the comparability because the product may not be homo-geneous any more.
These projects are priced on the basis of bills of quantities(Eurostat-OECD 2012). Whilst such an approach might be suitablefor international price and costs comparisons, it is unsuitable forinternational productivity comparisons.
Bills of quantities already implicitly incorporate assumptionsabout productivity. To illustrate that point, assume that the billsof quantities only contained labor inputs.
If one calculated a PPP based on bills of quantities, the resultingexchange rate would be a labor productivity ratio equating laborproductivity between countries. If these PPPs are then used to con-vert output figures into a common currency, countries with highlyproductive construction sectors would be penalized because theiroutput figures would be biased downwards. That might explainwhy the French construction sector performs so poorly in theseinternational comparisons, whereas anecdotal and case study evi-dence suggest that the French construction industry is very com-petitive (Edkins and Winch 1999a, b; Winch and Carr 2001).Hence international productivity comparisons for constructioncan be highly misleading until the value (or cost) conversion prob-lem is resolved.
Also, there are other concerns that are hard to deal with. Forexample, it is unlikely that labor inputs are well measured inany country because of illegal immigration, the black economy,and difficulty of capturing self-employment. There are differentapproaches to the estimation of the sizes of the construction laborforce, specifically its self-employed component. Broadly, there arehousehold-based surveys and establishment-based surveys, and de-pending on the source estimates can differ substantially.
Household surveys may overreport employment because re-spondents confuse construction-related occupations with workingfor the construction industry and/or household surveys are better atpicking up workers in the black economy and self-employmentthan are establishment-based surveys. Further, it needs to be inves-tigated whether sources are chosen consistently across countries(Blake et al. 2004). Similar problems arise when trying to estimatethe hours worked. Are things such as annual leave, illness, mater-nity leave, and overtime consistently estimated across countries?Establishment data tend not to capture the hours of the self-employed. Is regularly occurring overtime recorded as overtime?Comparisons of establishment data and household survey data fromGermany suggest that the latter underreports overtime by as muchas 25% (Richardson 2001).
In many ways cross-country comparisons of productivity levelsacross the whole construction industry are not comparing like forlike because the composition of construction output differs sogreatly between countries. Blake et al. (2004) show in their reportthe following differences in the mix of residential building, nonresi-dential building, and civil engineering in the four countries, whichis reproduced in Table 3.
Table 2. Implied Exchange Rate of Construction PPPs (Data fromEurostat-OECD 2012; Oanda 2014)
Exchange rate typeFrance($ per €)
Germany($ per €)
United Kingdom($ per £)
Construction PPP 2002 0.73 0.88 1.45GDP-PPP 2002 1.11 1.04 1.64Average spot 2004 1.24 1.24 1.83
Fig. 1. Value added per hour worked in 2004 in dollars (data fromMason et al. 2008; Eurostat-OECD 2012; Oanda 2014)
© ASCE 04014085-4 J. Constr. Eng. Manage.
J. Constr. Eng. Manage.
Dow
nloa
ded
from
asc
elib
rary
.org
by
Her
iot-
Wat
t Uni
vers
ity o
n 11
/12/
14. C
opyr
ight
ASC
E. F
or p
erso
nal u
se o
nly;
all
righ
ts r
eser
ved.

Given the relatively older stock of the built environment inEngland and France, there is also a substantial difference in the splitbetween new build and repair and maintenance, as can be seen inTable 4.
Under a plausible assumption that productivity differs betweenthese activities, the composition of output matters and is likely toaffect the international comparison. A remedy to this problemwould be to do an international comparison by type of work.
Such a disaggregation could potentially reveal interestinginsights into the potential sources of productivity differences.Ive et al. (2004) provide productivity estimates at three-digit sub-sectors and for new construction and renovation and maintenancework. In the Eurostat data, construction output is divided into pro-duction, meaning new construction, and renovation and mainte-nance work. These are, however, measures of work done and notof value added. Using this measure it is suggested that labor pro-ductivity figures for new work are approximately 40% higher thanfor repair and maintenance work.
Ive et al. (2004) conclude that the data were too seriously flawedto be the basis for a subsectoral comparison of relative productivitylevels. Further, the organization of the data in the 2003 SIC codesinto 45 [Office for National Statistics (ONS) 2002]. 1 site prepa-ration, 45.2 building of complete structures or parts thereof, 45.3building installation, and 45.4 building completion was not seen asan useful starting point for an investigation of the differencebetween productivities in subsectors of construction, and the con-tribution these might make to overall levels of construction produc-tivity. In this regard the SIC 2007 codes [Office for NationalStatistics (ONS) 2006] provide a much better classification of con-struction activities. They distinguish between 41 construction ofbuildings, 42 civil engineering, and 42 specialized constructionactivities, and the subdivision of SIC 41, for example, into com-mercial and domestic building provides a much better basis for pro-ductivity studies.
For example, one would expect the United Kingdom to exhibita relatively high productivity in residential construction giventhe nature of the U.K. housing market and planning system. Inthe United Kingdom, house builders, the larger of which are alsodevelopers and land owners, will build the houses and then sellthem. This contrasts, for example, with Germany and Francewhere houses are more often built to demand. Thus, in the UnitedKingdom house building developments occur in much greater vol-ume, which should lead to economies of scale and higher produc-tivity (Barker 2004).This hypothesis could potentially be tested onthe new SIC 2007 data.
Evidence on the United Kingdom’s Relative TotalFactor Productivity Performance
The usefulness of any productivity measurement framework forpolicy makers and industry practitioners alike crucially dependson the extent to which it enables the identification of the underlyingdrivers of productivity. This requirement necessitates an approachthat involves formally describing the production process and ex-plaining as much as possible the construction output in terms ofthe quantity and quality of inputs that are used to generate it. Econ-omists tend to prefer estimating multifactor production functionsfor more in-depth productivity analysis.
Labor productivity is positively related to capital intensities andtotal factor productivity. This, however, increases data requirementsfurther and necessitates the estimation of the industry’s capitalstock. Capital stocks figures are usually calculated using the per-petual inventory methods. Estimating capital stocks requires a longtime series of investment plus assumptions on depreciation rates(Martin 2003). Depreciation rates should be industry specificand country specific, but it is often assumed that they are equalfor identical industries across countries (Mason et al. 2008). Thecapital stocks estimates in each country are then converted withPPPs for investment goods to a common currency. The resultantfigures provide estimates for the relative capital intensities ofthe production processes across countries. The capital stock esti-mates of Mason et al. (2008) in Fig. 2 suggest that constructionworkers in Germany, France, and the United States use more thantwo times more capital per hour worked than in the UnitedKingdom.
The magnitude of these country differences in capital inten-sities looks unreasonable and raises some concerns about the ro-bustness of these estimates. One suspicion is that contractors inthe United Kingdom make more use of rented construction andcivil engineering machinery and equipment than the industriesof the other countries. If that was the case capital services wouldbe underrecorded for the United Kingdom because these servicesare bought from a service sector outside construction (SIC 71.32)[Office for National Statistics (ONS) 2002], i.e., not all capitalservices are recorded in SIC 45 construction. Clearly, here isthe need to supplement the aggregate calculations with some moremicrolevel information about the industry (Baily and Solow2001). A way of addressing the issue of fixed capital inputs to
Table 3. Differences in the Mix of Residential Building, NonresidentialBuilding, and Civil Engineering (Data from Blake et al. 2004)
CountryResidential
(%)Nonresidential
(%)Civil
engineering (%)
United States 46 36 18United Kingdom 26 56 18France 35 29 36Germany 58 27 15
Table 4. New Build versus Repair and Maintenance (Data from Blakeet al. 2004)
Country New build (%) Repair and maintenance (%)
France 51 49Germany 65 35United Kingdom 52 48United States 65 35
Fig. 2. Relative physical capital per hour worked (data fromMason et al. 2008)
© ASCE 04014085-5 J. Constr. Eng. Manage.
J. Constr. Eng. Manage.
Dow
nloa
ded
from
asc
elib
rary
.org
by
Her
iot-
Wat
t Uni
vers
ity o
n 11
/12/
14. C
opyr
ight
ASC
E. F
or p
erso
nal u
se o
nly;
all
righ
ts r
eser
ved.
construction is by triangulation using a range of sources. Thesecould include:• Company accounts data on investment, depreciation, and hire
payments.• National account data SIC 45.5 “renting of construction or
demolition equipment with operator” and SIC 71.32 “rentingand operating leasing of construction and civil engineering ma-chinery and equipment without operator,” which also includes“renting of scaffolds and work platforms without erection anddismantling.” It is these capital services in SIC 71.32 that are notaccounted for in the previous capital stock estimates.
• A survey of firms to establish what asset lives they use for de-preciation provisions and what lives they actually experience.Capital inputs together with labor inputs, and in the study by
Mason et al. (2008) also labor quality, are used for estimating relativetotal factor productivity levels. In order to explore the impact of laborquality differences on relative productivity performance, estimates ofrelative skill levels have been derived on the basis of educational at-tainments and mean wage levels analyzed by qualifications category.With regard to comparisons of labor force skills, research tends todivide the labor force into three or four categories of formal quali-fications and then attempt to match those categories across countries[e.g., O’Mahony and de Boer (2002)]. This method is sensitive to theallocation of qualifications to the various categories. which is fraughtwith difficulty due to the differences in education and training insti-tutions and formal qualifications systems in each country.
Mason et al. (2008) used a different methodology. Benchmarkson the highest qualifications category, where comparability acrosscountries is suggested to be strongest, were established, and ratiosof mean wages in other qualification groups relative to mean gradu-ate wages within each country were calculated to derive a country-specific measure of labor quality.
There is a need for improved labor input measures. For example,labor quality (skills) will be dependent on a number of factors, suchas qualifications, year of experience, age, hours of working on con-struction projects (e.g., by project type). The literature predominantlyuses qualification levels as a proxy for skills, which is inaccuratebecause the skill level of the construction worker will be dependenton various factors as opposed to mere qualification attainmentthrough training. Research suggests that training incidence is notsynonymous with skills development and application. There is anissue of the transfer of learning to the workplace or project context,work organization, and leadership, which are all factors that influ-ence skills deployment or utilization but are difficult to measure.
Table 5 suggests that the United Kingdom is leading Germanyand France, but is somewhat behind the United States in termsof TFP.
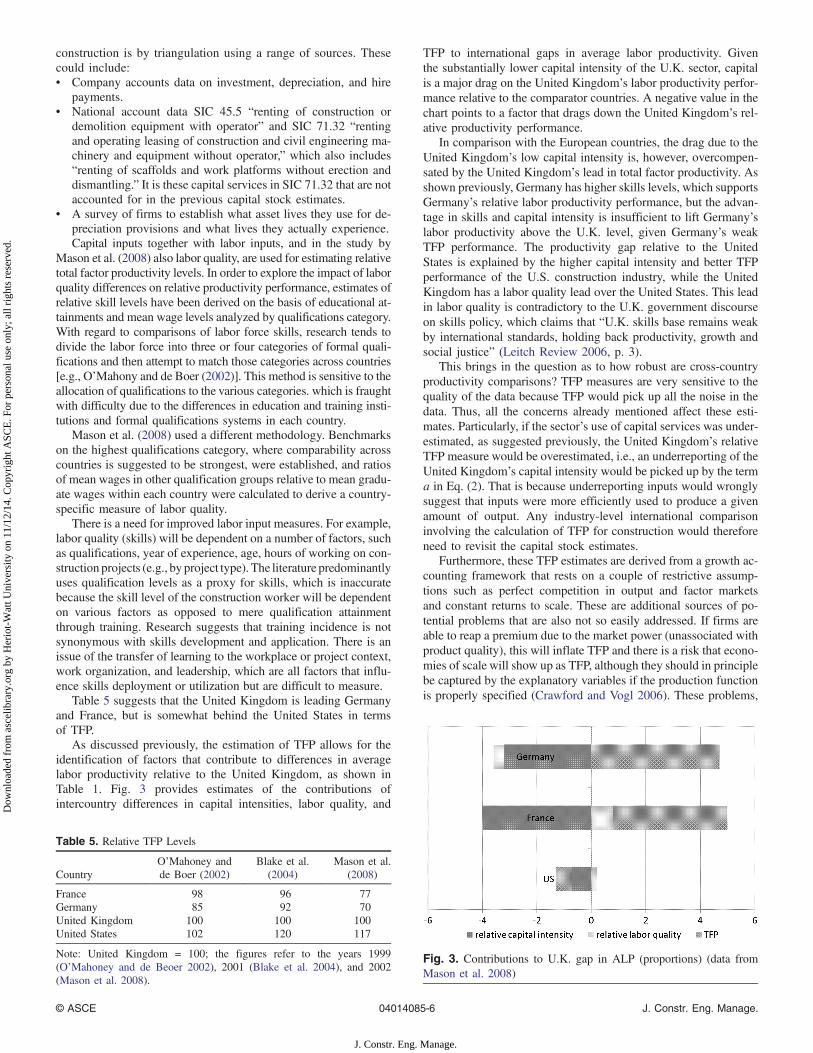
As discussed previously, the estimation of TFP allows for theidentification of factors that contribute to differences in averagelabor productivity relative to the United Kingdom, as shown inTable 1. Fig. 3 provides estimates of the contributions ofintercountry differences in capital intensities, labor quality, and
TFP to international gaps in average labor productivity. Giventhe substantially lower capital intensity of the U.K. sector, capitalis a major drag on the United Kingdom’s labor productivity perfor-mance relative to the comparator countries. A negative value in thechart points to a factor that drags down the United Kingdom’s rel-ative productivity performance.
In comparison with the European countries, the drag due to theUnited Kingdom’s low capital intensity is, however, overcompen-sated by the United Kingdom’s lead in total factor productivity. Asshown previously, Germany has higher skills levels, which supportsGermany’s relative labor productivity performance, but the advan-tage in skills and capital intensity is insufficient to lift Germany’slabor productivity above the U.K. level, given Germany’s weakTFP performance. The productivity gap relative to the UnitedStates is explained by the higher capital intensity and better TFPperformance of the U.S. construction industry, while the UnitedKingdom has a labor quality lead over the United States. This leadin labor quality is contradictory to the U.K. government discourseon skills policy, which claims that “U.K. skills base remains weakby international standards, holding back productivity, growth andsocial justice” (Leitch Review 2006, p. 3).
This brings in the question as to how robust are cross-countryproductivity comparisons? TFP measures are very sensitive to thequality of the data because TFP would pick up all the noise in thedata. Thus, all the concerns already mentioned affect these esti-mates. Particularly, if the sector’s use of capital services was under-estimated, as suggested previously, the United Kingdom’s relativeTFP measure would be overestimated, i.e., an underreporting of theUnited Kingdom’s capital intensity would be picked up by the terma in Eq. (2). That is because underreporting inputs would wronglysuggest that inputs were more efficiently used to produce a givenamount of output. Any industry-level international comparisoninvolving the calculation of TFP for construction would thereforeneed to revisit the capital stock estimates.
Furthermore, these TFP estimates are derived from a growth ac-counting framework that rests on a couple of restrictive assump-tions such as perfect competition in output and factor marketsand constant returns to scale. These are additional sources of po-tential problems that are also not so easily addressed. If firms areable to reap a premium due to the market power (unassociated withproduct quality), this will inflate TFP and there is a risk that econo-mies of scale will show up as TFP, although they should in principlebe captured by the explanatory variables if the production functionis properly specified (Crawford and Vogl 2006). These problems,
Table 5. Relative TFP Levels
CountryO’Mahoney andde Boer (2002)
Blake et al.(2004)
Mason et al.(2008)
France 98 96 77Germany 85 92 70United Kingdom 100 100 100United States 102 120 117
Note: United Kingdom = 100; the figures refer to the years 1999(O’Mahoney and de Beoer 2002), 2001 (Blake et al. 2004), and 2002(Mason et al. 2008).
Fig. 3. Contributions to U.K. gap in ALP (proportions) (data fromMason et al. 2008)
© ASCE 04014085-6 J. Constr. Eng. Manage.
J. Constr. Eng. Manage.
Dow
nloa
ded
from
asc
elib
rary
.org
by
Her
iot-
Wat
t Uni
vers
ity o
n 11
/12/
14. C
opyr
ight
ASC
E. F
or p
erso
nal u
se o
nly;
all
righ
ts r
eser
ved.

however, seem to be minor issues compared with the dataproblems.
Summing up the previous discussion, any productivity rankingof countries at the industry level is highly problematic becausethese estimates do not compare like for like, data definitions andcapture differ substantially across countries, and exchange ratesused to convert output into a common currency are subject to sub-stantial criticism. The identification of underlying productivitydrivers is very crude and as a result the studies offer little guidancefor industry and policy makers.
Comparisons of international differences in growth rates mightbe more robust because these are not affected by exchange rates andare less affected by differences in data definitions and capture.
Evidence on the Construction Industry’sProductivity Growth
Time series studies based on national accounts statistics suggestthat the industry’s productivity growth has decelerated in many ad-vanced economies and falls short of the productivity growth in theprivate sector. TFP growth has even become negative in some coun-tries (Abdel-Wahab and Vogl 2011). As mentioned previously, TFPis associated with technological progress and improvements inmanagement and organization. Has there been technologicalregress in construction? The puzzle of declining and even negativeproductivity and TFP growth is well documented in the literatureand has been largely debated in the context of declining laborproductivity in the North American construction industry [see,for example, Stokes (1981), Allen (1985), Rojas and Aramvareekul(2003), and Harper et al. (2010)].
Estimates of productivity growth are sensitive to the price in-dexes used for calculating a real output series. Calculating a realvalue-added time series requires double deflating. Gross outputneeds to be deflated by some output price and intermediate inputsneed to be deflated by some input price. However, construction de-flators are limited in scope and coverage (Ive et al. 2004). Thisproblem has been discussed for some time and is still unresolved(Kaplan 1959; Sezer and Bröchner 2013).
Aggregate output deflators are often a mix of output pricesand input cost indexes, with estimates based on bills of quantities[Office for National Statistics (ONS) 2012]. The use of input costs,however, may overstate the rise in construction output prices andhence understate real construction output and productivity. Assum-ing again that the bills of quantities would only include labor items,i.e., assuming that the output measure is based on labor costs only,an increase in labor costs would result in an equal rise in the outputdeflator. That would only be a fair assumption if labor productivitygrowth was zero (Harper et al. 2010). If, however, labor produc-tivity increases, output prices should rise by less than labor costs,and hence using a cost measure as deflator output price inflationwould be overstated and real output and productivity growth un-derstated. This may to a large extent explain relative weak construc-tion productivity growth (Allen 1985).
The composition of output may have changed across countries,e.g., towards more repair and maintenance as the age of the buildenvironment increases. If the compositions of output shifts tosectors or activities with lower than average productivity, aggregatelabor productivity will rise more slowly or could even becomenegative. Joregenson and Grilliches (1967) call this an error ofaggregation. By aggregating data to an industry level, valuableinformation on the within-industry heterogeneity of outputs islost. Again, a remedy to this problem would be to undertake aninternational comparison by type of work.
There is evidence in the literature that suggests there is a diver-gence in productivity trends between studies that work with aggre-gated data and those studies using activity-level data. For example,it was found for the United States (during the period 1976–1998)that an improvement in productivity performance at the activitylevel in the construction industry was not captured in the industry’soverall productivity performance (Allmon et al. 2000; Goodrumet al. 2002), which underlies the need to briefly review alternativemethodologies for cross-country productivity comparisons.
Alternative Methodologies of ComparingConstruction Productivity Internationally
As previously mentioned, it is unsurprising that most existingworks rely on readily available official industry data. While theuse of microdata seem to be more appropriate in a project-basedindustry like construction because it enables to better control forthe of heterogeneity in construction activity and to better identifyperformance drivers, data availability imposes a hurdle for suchmethodologies. The literature identifies four main types of pro-ductivity studies for cross-country comparative analysis, namely,(1) industry data from national accounts, i.e., the type of studiesdiscussed previously, (2) pricing studies based on the experienceof pricing experts, (3) case studies based on a small number ofconstruction projects, and (4) studies based on company accounts(Edkins and Winch 1999a, b).
Pricing Studies
This methodology is flexible with regard to research design. Pricingstudies base productivity estimates on quantitative and qualitativeinformation on performance measures and resource inputs such aslabor, material, and plant for projects based on specifications for abuilding, structure, activity, or task (Meikle 1990). This informa-tion is provided by experienced pricing professionals. Examples ofthis approach are the work by Xiao and Proverbs (2002a, b), whoused the specification for a six-story concrete framed office build-ing, and Proverbs et al. (1998a, b), who examined concrete place-ment operations.
The experts’ views on the resource requirements for a givenpiece of construction work are likely to be based on their previousexperience (Xiao and Proverbs 2002a) and/or pricing manuals thatcontain information on resource inputs and processes for specifictypes of construction work (Goodrum et al. 2002), which in turn arealso likely to reflect previous experience. Pricing studies typicallylook at labor productivity only, often defined as productivity (unit)rates. A notable exception is Goodrum et al. (2002) and Goodrumand Hass (2002), who estimate a multifactor production processcomprising labor and capital inputs and a measure for equipmenttechnology.
There is a substantial amount of judgment involved in such stud-ies, which makes it difficult to verify the robustness of their results.Christain and Hachey (1995) showed that this can result in substan-tial variation in productivity rates for well-specified tasks. To whatextent this variation is due to differing judgments, different infor-mation sources, or past experience cannot be easily assessed.International studies also face the problem of the interpretationand pricing (quantification) of inputs by experts in one countryunfamiliar with specifications from another country. Materials,methods of construction, and national standards and regulationscan differ substantially between countries. Some flexibility of in-terpretation has to therefore be allowed (Eurostat-OECD 2012).
© ASCE 04014085-7 J. Constr. Eng. Manage.
J. Constr. Eng. Manage.
Dow
nloa
ded
from
asc
elib
rary
.org
by
Her
iot-
Wat
t Uni
vers
ity o
n 11
/12/
14. C
opyr
ight
ASC
E. F
or p
erso
nal u
se o
nly;
all
righ
ts r
eser
ved.

Furthermore, if outputs are measured in monetary terms, thesestudies also face the problem of deflation (Allmon et al. 2000) orthe problem of converting output figures into a common currency[Bernard Williams Associates (BWA) 2006]. Pricing studies com-pare hypothetical buildings and thus may not give a complete pic-ture of the real building process. While they may provide some ideaon cost differences between countries, they are not well suited foridentifying the underlying causes of differences. Typically thesestudies are therefore accompanied by surveys that ask expertsfor their views on the underlying causes of differences. Survey re-turns are analyzed in combination with existing qualitative andquantitative evidence taken from the literature (BWA 2006).
Case Studies
Case studies collect and analyze comprehensive project informa-tion on the quantity and quality of resource inputs, such as labor,plant and tools, management, and organization. Case studies drawon data from project accounts, timesheets, or on-site observations.
Studies at activity or task level can enable standardizing outputacross countries and measuring output in physical units. Sometimesonly tasks common to projects are analyzed, such as the fitting ofcentral heating or air conditioning units (Hawkins 1997) or theerection of concrete structures (Carr and Winch 1999). It is, how-ever, somewhat problematic to infer from these observations anestimate for project or even industry performance.
Moreover, potentially important drivers of productivity such as(site) management and organization, design, procurement, and cli-ent expertise cannot be properly analyzed at such a highly disag-gregated level, but could be analyzed at the project level. The majorchallenge here is then to identify internationally comparable proj-ects. Examples for such studies are the Kodak polyethylene tereph-thalate (PET) plants built in the United Kingdom and the UnitedStates [National Economic Development Office (NEDO) 1990],the channel tunnel terminals in the United Kingdom and France(Edkins and Winch 1999a), and social housing projects in theUnited Kingdom and Germany (Clarke and Herrmann 2004).
While case studies enable researchers to make more informedhypotheses as to the determinants of labor productivity differences,testable cause and effect relationships are hard to establish, reflect-ing the considerable data requirements, and conclusions derived onthe basis of few projects may not be representative of the country’sindustry. There is nonetheless likely to be a wealth of informationin case studies that a systematic and comprehensive literaturereview could potentially reveal.
Company Accounts
Company accounts are another data source for internationalproductivity comparisons that have not yet been fully explored.Studies based on company data could enable to control for theheterogeneity of output. The use of company data to investigatethe productivity performance of the industry and its subsectorscould provide further insights into subsectors, main contractors,and specialist contractors’ relative productivity performance (Blakeet al. 2004). This, however, requires identifying the principle activ-ities of firms. Such studies would also face the deflation and cur-rency conversion problems. Recently, Horta et al. (2013) applied adata envelopment analysis (DEA) to an international comparisonbased on accounting data. As all the data is in U.S. dollars andbecause only financial variables are used it is suggested that thereis no need to deflate and to convert currencies. These financial input
and output variables are, however, only loosely related to the pro-ductivity measures discussed previously.
The analysis is restricted to listed companies only. Given thelarge number of small-sized and medium-sized companies in thesector, the resulting conclusions may not be representative, bearingalso in mind that these large contractors compete and act on aglobal scale. Unless company data are linked to data of potentialperformance drivers in construction, this approach will not identifythe root cause of differences in performance.
Conclusions and Recommendations for FurtherResearch
An improved understanding of the key drivers of the constructionindustry’s productivity performance would help policy makers andindustry to prioritize their policy and action. The recent efforts ofinternational organization, national governments, and statistics of-fices in compiling industry-level data sets from national accountsdata is to be applauded. However, data and methods well estab-lished for analyzing the performance of manufacturing sectorsdo not deliver robust evidence on construction performance.
A reason for the lack of robust evidence on construction produc-tivity performance is the added complexity of a very heterogeneousproject-based industry (Sezer and Bröchner 2013). While this papersuggests that new SIC codes and further construction-specificresearch efforts on deflators, conversion rates, labor inputs, andcapital stock estimates could to some extent improve the robustnessof international productivity comparisons, there are conceptuallimitations to such an approach based on such highly aggregateddata.
In order to analyze how construction output depends on its tan-gible and intangible inputs, the preferred scope is project level,which enables a more detailed comparison of support processes[e.g., management and organization, information technology (IT)systems, procurement, client involvement], auxiliary activities(e.g., innovation and design), inputs (hours worked and skills,material quality and prefabrication, capital equipment) and otherfactors such as climate and regulation.
In the national context, project-based performance indicatorsare collected and used for intracountry industry benchmarkingin counties such as Australia, Brazil, Chile, Denmark, the UnitedKingdom, and the United States (Bakens et al. 2005; Costa et al.2006). In the United Kingdom, key performance indicators (KPIs)were introduced in response to Egan’s demand for a better evidencebase for the improvement agenda. While most of the KPI measuresare project based, the productivity KPI is company accounts based.This measure would thus also suffer from the problems discussedpreviously if used for international comparisons. Further, theexisting KPIs are of limited use for establishing cause and effectrelationships.
First, the company accounts-based performance measures donot directly relate to the project-based KPIs. Second, most KPIsmeasure report performance results (such as productivity, clientand employee satisfaction, and defects) as opposed to providinginformation on the underlying drivers of performance. In orderto establish cause and effect relationships, more leading perfor-mance measures would be needed (Beatham et al. 2004). In theterminology used previously, leading indicators are tangible andintangible inputs to the production process. These input measurescan be used to predict performance and these offer industry andpolicymakers guidance on how to improve performance.
Other attempts for collecting project-based productivity datainclude the development of conceptual frameworks for productivity
© ASCE 04014085-8 J. Constr. Eng. Manage.
J. Constr. Eng. Manage.
Dow
nloa
ded
from
asc
elib
rary
.org
by
Her
iot-
Wat
t Uni
vers
ity o
n 11
/12/
14. C
opyr
ight
ASC
E. F
or p
erso
nal u
se o
nly;
all
righ
ts r
eser
ved.
measurement, such as Park (2006). However, Dolage and Chan(2014) found that there is an absence of follow-up studies to inves-tigate the validity of productivity measurement techniques andframeworks, and they argue that this is a striking feature of theexisting literature. This suggests that any attempt for project-basedproductivity measurement without the endorsement and active par-ticipation of industry is likely to be unsuccessful.
Nonetheless, international productivity comparisons could buildon the lessons learned from the various national initiatives world-wide. Ideally an international benchmarking club would facilitatethe development of a project-based productivity measurementframework and a cross-country learning process. It becomes no sur-prise that the Conseil International de Batiment pour la Recherche,l’Etude et la Documentation (CIB) have set up a working commis-sion (W117) entitled “Performance Measurement in Construction”with an overarching aim of disseminating research and practiceof performance metrics in construction worldwide. The commis-sion is going to achieve this through creating and disseminatinga knowledge base of performance metrics worldwide (CIB 2013).However, the commission objective does not include an explicitstatement for setting up a project-based common performancemetrics framework for the purpose of cross-country productivitybenchmarking.
The development of such a framework would first need toestablish how to measure the quality and quantity of constructionoutputs and inputs and to ascertain the potential for collecting themacross a number of projects and countries. In order to avoid anyvaluation problems and whenever feasible, measures should bein physical units. Data are likely to be spread across a range ofdiverse sources such as project managers, contractors, architects,clients, quantity surveyors, and company accounts. In addition,there should be considered within the context of the constructionproject life cycle (client brief, preconstruction, construction, andcommissioning).
It would therefore be important to ascertain the willingness ofthe industry and clients to support such a project and to establishagreement on measures with potential data providers. In order togive incentives, it would also be important to demonstrate that sucha measurement framework is beneficial to the industry and could bemigrated to a management performance system (Costa et al. 2006).Any proposed measures should be seen as relevant to managementin their daily work and as a means for continuous performance im-provement on projects. Chan and Kaka (2003), in a questionnairesurvey to 400 U.K. contractors, found that of the 77 respondentsmore than half do not monitor productivity levels at the projectlevel. Therefore, it is important to collect project data without cre-ating a burden on the data provider and requiring additional resour-ces (time and money). This could be achieved by simplifyingmeasurement methods, by only measuring important trades, andby standardizing the collection method (Hwang and Soh 2013).
In summary, the contribution of this paper has been to addressa knowledge gap (and that is the absence of any review papersthat discusses the methodological shortcomings of cross-countryconstruction productivity measurement). While highlighting theshortcomings of existing studies on cross-country productivitycomparisons, the adoption of a project-based approach for futurestudies is advocated. Developing a project-based international per-formance measurement framework is very ambitious, but the au-thors strongly believe that this should be the way forward inpartnership with industry—perhaps through the establishment ofan international benchmarking club.
The authors are finally proposing the following research agenda:review existing approaches for measuring productivity at theproject level and propose a commonly agreed measurement
framework in consultation with employers, which could be thenpiloted in actual projects and reviewed. Data can then be collected,evaluated, and the measurement framework reviewed where neces-sary. Any proposed project-level productivity measurement frame-work should (1) enable benchmarking the construction industry’sproductivity performance internationally, (2) enable the identifica-tion of the underlying drivers of productivity performance, and(3) provide guidance for industry and policy makers on how to im-prove performance.
References
Abbott, M., and Carson, C. (2012). “A review of productivity analysis ofthe New Zealand construction industry.” Aust. J. Constr. Econ. Build.,12(3), 1–15.
Abdel-Wahab, M. S., and Vogl, B. G. (2011). “Trends of productivitygrowth in the construction industry across Europe, USA and Japan.”Constr. Manage. Econ., 29(6), 635–644.
Allen, S. (1985). “Why construction industry productivity is declining.”Rev. Econ. Stat., 66, 661–669.
Allmon, E., Haas, C., Borcherding, J., and Goodrum, P. (2000). “U.S.construction labor productivity trends, 1970–1998.” J. Constr. Eng.Manage., 126(2), 97–104.
Arditi, D., and Mochtar, K. (2000). “Trends in productivity improvement inthe U.S. construction industry.” Constr. Manage. Econ., 18(1), 15–27.
Baily, M., and Solow, R. (2001). “International productivity comparisonsbuilt from the firm level.” J. Econ. Perspect., 15(3), 151–172.
Bakens, W., Vries, O., and Courtney, R. (2005). “International review ofbenchmarking in construction.” Final Rep., PSIBouw, Zoetermeer,Netherlands.
Barker, K. (2004). “Review of housing supply.” Final Rep.—Recommendations, Delivering Stability: Securing Our FutureHousing Needs, Her Majesty’s Stationery Office (HMSO),Norwich, U.K.
Batovski, B. D. (2008). “How to write a review article.” Assumption Univ.J. Technol., 11(4), 199–203.
Beatham, S., Anumba, C., Thorpe, T., and Hedges, I. (2004). “KPIs: Acritical appraisal of their use in construction.” Benchmarking Int. J.,11(1), 93–117.
Bernard Williams Associates (BWA). (2006). “Benchmarking of use ofconstruction (costs) resources in the member states (pilot study).” Euro-pean Commission, DG Enterprise and Industry, ⟨http://ec.europa.eu/enterprise/sectors/construction/studies/benchmarking_en.htm⟩ (Nov. 28,2013).
Blake, N., Croot, J., and Hastings, J. (2004). Measuring the com-petitiveness of the U.K. construction industry, Vol. 2, Industry Eco-nomics and Statistics, DTI, ⟨http://www.dti.gov.uk/construction/stats/productivityexperian.pdf⟩ (Oct. 8, 2013).
Briscoe, G. (2006). “How useful and reliable are construction statistics?”Build. Res. Inf., 34(3), 220–229.
Carr, B., and Winch, G. (1999). “Measuring on-site performance in Britainand France: A CALIBRE approach.” Bartlett Research Paper No. 9,Bartlett School of Graduate Studies, Univ. College of London, London.
Chan, P., and Kaka, A. (2003). “Construction labor productivity improve-ments.” Proc., 3rd Int. Postgraduate Research Conf., G. Aouad andL. Ruddock, eds., Escola Superior de Actividades Imobiliárias (ESAI),Lisbon, Portugal, 583–598.
Chau, K. W., and Walker, A. (1988). “The measurement of total factor pro-ductivity of the Hong Kong construction industry.” Constr. Manage.Econ., 6(3), 209–224.
Christian, J., and Hachey, D. (1995). “Effects of delay times on productionrates in construction.” J. Constr. Eng. Manage., 10.1061/(ASCE)0733-9364(1995)121:1(20), 20–26.
Clarke, L., and Herrmann, G. (2004). “Cost versus production: Disparitiesin social housing in Britain and Germany.” Constr. Manage. Econ.,22(5), 521–532.
Conseil International de Batiment pour la Recherche, l’Etude et laDocumentation (CIB). (2013). “Performance measurement in
© ASCE 04014085-9 J. Constr. Eng. Manage.
J. Constr. Eng. Manage.
Dow
nloa
ded
from
asc
elib
rary
.org
by
Her
iot-
Wat
t Uni
vers
ity o
n 11
/12/
14. C
opyr
ight
ASC
E. F
or p
erso
nal u
se o
nly;
all
righ
ts r
eser
ved.

construction.” Working Commission 117, ⟨http://cibw117.com/about/⟩(Oct. 20, 2014).
Costa, D., Formoso, C., Kagioglou, M., Alarcon, L., and Caldas, C. (2006).“Benchmarking Initiatives in the construction industry: Lessons learnedand improvement opportunities.” J. Constr. Eng. Manage., 22(4),158–167.
Crawford, P., and Vogl, B. (2006). “Measuring productivity in the construc-tion industry.” Build. Res. Inf., 34(3), 208–219.
Dept. of the Environment, Transport, and the Regions (DETR). (1998).Rethinking construction, Her Majesty’s Stationery Office (HMSO),Norwich, U.K.
Dolage, D. A. R., and Chan, P. (2014). “Productivity in construction—Acritical review of research.” J. Inst. Eng., 46(4), 31–42.
Edkins, A., and Winch, G. (1999a). “Project performance in Britain andFrance: The case of Euroscan.” Bartlett Research Paper No. 7, BartlettSchool of Graduate Studies, Univ. College of London, London.
Edkins, A., and Winch, G. (1999b). “The performance of the U.K.construction industry: An international perspective.” Bartlett ResearchPaper No. 4, Univ. College of London, London.
Eurostat–Organization for Economic Cooperation and Development(OECD). (2012). Methodological manual on purchasing power par-ities, Publications Office of the European Union, Luxembourg.
Goodrum, P. M., and Haas, C. T. (2002). “Partial factor productivity andequipment technology change at activity level in U.S. construction in-dustry.” J. Constr. Eng. Manage., 10.1061/(ASCE)0733-9364(2002)128:6(463), 463–472.
Goodrum, P. M., Haas, C. T., and Glover, R. W. (2002). “The divergence inaggregate and activity estimates of U.S. construction productivity.”Constr. Manage. Econ., 20(5), 415–423.
Hawkins, G. (1997). “Improving M&E site productivity.” Technical NoteTN14/97, Building Services Research and Information Association(BSRIA), Bracknell, U.K.
Harper, M., Khandrika, B., Kinoshita, R., and Rosenthal, S. (2010). “Non-manufacturing industry contributions to multifactor productivity.”1987-2006, Monthly Labor Review.
Horner, M., and Duff, R. (2001). More for less: A contractors’ guide toimproving productivity, Construction Industry Research and Informa-tion Association (CIRIA), London.
Horta, I. M., Camanho, A. S., Johnes, J., and Johnes, G. (2013). “Perfor-mance trends in the construction industry worldwide: An overview ofthe turn of the century.” J. Prod. Anal., 39(1), 89–99.
Hwang, B., and Soh, C. (2013). “Trade-level productivity measurement:Critical challenges and solutions.” J. Constr. Eng. Manage., 10.1061/(ASCE)CO.1943-7862.0000761, 04013013.
Ive, G., Gruneberg, S., Meikle, J., and Crosthwaite, D. (2004). “Measuringthe competitiveness of the U.K. construction industry.” Vol. 1, IndustryEconomics and Statistics, DTI, ⟨http://www.dti.gov.uk/construction/stats/productivityucl.pdf⟩ (Oct. 8, 2013).
Jorgenson, D. W., and Griliches, Z. (1967). “The explanation of produc-tivity change.” Rev. Econ. Stud., 34, 249–282.
Kaplan, N. M. (1959). “Some methodological notes on the deflation ofconstruction.” J. Am. Stat. Assoc., 54(287), 535–555.
Leitch Review. (2006). HM treasury, The Stationary Office, London.Lowe, J. (1987). “The measurement of productivity in the construction
industry.” Constr. Manage. Econ., 5(2), 101–113.Martin, R.. (2003). Building the capital stock, CeRiBA, London.Mason, J., O’Leary, B., O’Mahony, M., and Robinson, K. (2008). “Cross-
country productivity performance at sector level: The U.K. comparedwith the U.S., France, and Germany.” National Institute of Economicand Social Research, London.
Mayer, P. (2009). “Guidelines for writing a review article.” ⟨http://ueberfachliche-kompetenzen.ethz.ch/dopraedi/pdfs/Mayer/guidelines_review_article.pdf⟩ (May 21, 2014).
Meikle, J. L. (1990). “International comparisons of construction costs andprices.” Habitat, 14(2/3), 185–192.
National Economic Development Office (NEDO). (1990). “A comparativestudy of simultaneous construction of two Kodak PET plants built in theU.K. and U.S.” The Stationery Office, London.
Oanda. (2014). “Historische Wechselkurse.” ⟨http://www.oanda.com/lang/de/currency/historical-rates/⟩ (Jan. 4, 2014).
Office for National Statistics (ONS). (2002). “UK standard industrial clas-sification of economic activities 2003.” The Stationery Office, London.
Office for National Statistics (ONS). (2006). “UK Standard industrial clas-sification of economic activities 2007 (SIC 2007) structure and explana-tory notes.” Palgrave Macmillan, Basingstoke, U.K.
Office for National Statistics (ONS). (2012). “Quality and methodologyinformation.” Information paper, ⟨http://www.ons.gov.uk/ons/rel/construction/construction-statistics/no–14–2013-edition/art-construction-statistics-annual–2013.html#tab-background-notes⟩ (Dec. 3, 2013).
O’Mahony, M., and de Boer, W. (2002). “Britain’s relative productivityperformance: Updates to 1999.” National Institute of Economic andSocial Research (NIESR), ⟨http://www.niesr.ac.uk/research/BRPP02.pdf⟩.
Panas, A., and Pantouvakis, J. P. (2011). “Evaluating research methodologyin construction productivity studies.” Built Human Environ. Rev., 3(1),63–85.
Park, H. S. (2006). “Conceptual framework of construction productivityestimation.” KSCE J. Civ. Eng., 10(5), 311–317.
Pearce, D. (2003). “The social and economic value of construction.” ⟨http://www.crisp-uk.org.uk/reports/SocialandEconomicValue_FR03.pdf⟩(Oct. 4, 2013).
Proverbs, D. G., Holt, G. D., and Olomolaiye, P. O. (1998a). “A compar-ative evaluation of concrete placing productivity rates amongst French,German and U.K.” Constr. Contractors, Eng. Constr. Archit. Manage.,5(2), 174–181.
Proverbs, D. G., Holt, G. D., and Olomolaiye, P. O. (1998b). “A compar-ative evaluation of reinforcement fixing productivity rates amongstFrench, German and U.K.” Constr. Contractors, Eng. Constr. Archit.Manage., 5(4), 350–358.
Richardson, C. (2001). International comparisons of productivity, Officefor National Statistics, London.
Rojas, E., and Aramvareekul, P. (2003). “Is construction labor productivityreally declining?” J. Constr. Eng. Manage., 129(1), 41–46.
Royal Commission into the Building and Construction Industry. (2002).“Workplace regulation, reform and productivity in the internationalbuilding and construction industry.” Discussion Paper No. 15, ARep. Prepared on Behalf of Unisearch LTD, Univ. of New South Walesfor the Royal Commission into the Building and Construction Industry,Melbourne, Australia.
Scottish Construction Industry Strategy. (2013). “Building the future, Con-struction Scotland.” ⟨http://www.scottish-enterprise.com/microsites/construction-scotland.aspx⟩ (Oct. 20, 2014).
Sezer, A., and Bröchner, J. (2013). “The construction productivity debateand the measurement of service qualities.” Constr. Manage. Econ.,32(6), 565–574.
Stokes, K. (1981). “An examination of the productivity decline in the con-struction industry.” Rev. Econ. Stat., 63(4), 495–502.
University of Texas at Austin. (2010). “What’s a review article.” ⟨www.lib.utexas.edu/lsl/help/modules/review.html⟩ (May 21, 2014).
Vermande, H. M., and van Mulligen, P.-H. (1999). “Construction costsin the Netherlands in an international context.” Constr. Manage. Econ.,17(3), 269–283.
Winch, G., and Carr, B. (2001). “Benchmarking on-site productivity inFrance and the UK: A CALIBRE approach.” Constr. Manage. Econ.,19(6), 577–590.
Xiao, H., and Proverbs, D. (2002a). “The performances of contractors inJapan, the U.K. and the USA: A comparative evaluation of constructioncost.” Constr. Manage. Econ., 20(5), 425–435.
Xiao, H., and Proverbs, D. (2002b). “The performance of contractors inJapan, the U.K. and the USA: An evaluation of construction quality.”Int. J. Qual. Reliab. Manage., 19(6), 672–687.
Yi, W., and Chan, A. (2014). “Critical review of labor productivity researchin construction journals.” J. Manage. Eng., 10.1061/(ASCE)ME.1943-5479.0000194, 214–225.
© ASCE 04014085-10 J. Constr. Eng. Manage.
J. Constr. Eng. Manage.
Dow
nloa
ded
from
asc
elib
rary
.org
by
Her
iot-
Wat
t Uni
vers
ity o
n 11
/12/
14. C
opyr
ight
ASC
E. F
or p
erso
nal u
se o
nly;
all
righ
ts r
eser
ved.