measuring organisational productivity in the public
TRANSCRIPT

1
1. Introduction & Background
South Africa transformed from a race-based, closed and secretive apartheid state to a fully fledged democratic
state in April 1994 following the first national democratic election. Democracy in South Africa is premised on a
progressive and transformative Constitution enshrining a Bill of Rights with universal adult franchise. The very
process of Constitution making was consultative in the broadest possible sense involving the participation of
South Africans from every corner of the country.
The first twenty years of democratic transformation was characterised by legislative reforms and democratising
the State with an emphasis on increasing the capacity of the State to advance the objectives of reconstruction
and holistic human development. Significant progress was made during this period resulting in unifying and
rationalising the public service and setting in place a framework for new structures, systems and a democratic
ethos based on the constitutional values and principles governing public administration in the country.
For the period 2014-2030, South Africa’s focus is poised towards deepening economic transformation and the
implementation of Vision 2030, the country’s National Development Plan (NDP). Evolving from a consultative
process facilitated by a National Planning Commission, the NDP contains South Africa’s long-term vision
statement and national development plan for 2030 with an emphasis on the country’s desired destination and the
Summary
Given the importance of productivity to the success of public service organisations, the
Department of Public Service and Administration has developed a Public Service Productivity
(PSP) measurement instrument to assess the organisational productivity of public service
entities in terms of three core factors, namely: Labour, Operations, and Performance. The five
(5) case studies that follow represent the practical application of the generic PSP measurement
instrument. It is anticipated that these case studies will provide practical lessons that will lead to
the application of the PSP measurement instrument throughout the health, basic education,
human settlements, social development, and rural development & land reform sectors, as well
as the South African public sector at large.
Measuring Organisational Productivity in the Public
Service: Selected Case Studies
Directorate: Productivity & Efficiency Studies
Research and Policy Analysis Branch, Department of Public Service and Administration, Private Bag X916,
Pretoria, 0001
2
roles different sectors of society need to play in reaching that shared goal. In giving effect to its role in realising
the NDP, the South African government’s Medium Term Strategic Framework (MTSF) for the period 2014-2019
has identified “An efficient, effective and development-orientated public service” as one of fourteen key priority
outcomes for improving public service delivery and accelerating economic transformation.
Although significant progress has been made in making some public services more efficient and effective (e.g. in
revenue services and the processing of identity documents and birth certificates), a considerable number of
government departments have not been as successful as would have been desired. The Department of Public
Service and Administration (DPSA) is one of the government departments at the centre of government which is
responsible for leading the process of improving the efficiency, effectiveness and the development-orientation of
the public service as a whole. As part of its leading role in this important transformation process, the DPSA has –
through an extensive consultative process – developed the Public Service Productivity Management Framework
for measuring and managing organisational productivity in the public service. To test the relevance and
appropriateness of the productivity measurement instrument, the DPSA has conducted five (5) pilot studies in the
following departments:
Basic Education (Mpumalanga province)
Health (North West province)
Cooperative Governance, Human Settlements, and Traditional Affairs (Limpopo province)
Social Development (Limpopo province)
Rural Development and Land Reform (national)
These pilot studies were documented as case studies in order to facilitate learning and self-assessment by other
provincial departments within the above-mentioned sectors.
2. Conceptual framework guiding PSP measurement in South Africa
It is well established that the choice of a PSP productivity measurement instrument ultimately depends on (a) the
purpose of the measurement, and (b) the availability of data. In the case of South Africa, the stated purpose of
the productivity measurement is to improve the management of efficiency and effectiveness in service delivery
and enhance public accountability. The availability of quality, reliable data is a challenge in the South African
public service. For this reason, the primary source of data used in the productivity measurements of the five pilot
departments is data from their annual reports.
After testing a range of productivity measurement approaches in a public service context, the matrix or multi-
factor approach was identified as the most relevant, appropriate and easy to understand approach to PSP
measurement in South Africa. Generic factors impacting on the quality and quantity of public goods and services
were identified through a consultative process with 28 government departments, and these multiplicity of factors
were clustered into three core factors, namely Labour productivity, Operational productivity, and Performance
productivity. These three core factors and their measures (indicators) are described in Box 1.

3
Box 1: Core factors of the Matrix Approach to Measuring PSP
Box 1: Core factors of the matrix approach to PSP
Generic factors impacting on the quality and quantity dimensions of PSP
Core factor Description of Core factor Indicators (Required Data)
Service demand/need Resource availability (human and financial) Capacity of facility/current output quantity Employee competence, capability, and morale Physical working environment Operations Management Systems, Processes, and Procedures Citizen consultation Citizen expectations (quality, quantity, reliability, care & compassion, value for money) Objective service norms and standards
Labour (20%)
Labour is usually assumed to be the most important input for the delivery of public goods and services. Labour productivity have indicators which assess the cost of labour, working days of labour force, days lost due to a variety of reasons, and vacancy rates.
Score achieved for ratio of salary cost to total budget
Score achieved for number of days absent due to various reasons (Absenteeism rate)
Training of Staff (Skills Programmes)
Organisational vacancy rate
Operational (40%)
Operational productivity measures include established organisational decision-making and implementation structures (governance), systems, processes, and procedures. It also includes measures towards the optimisation of service delivery through critical path analysis (‘business process mapping”), availability of standard operating procedures for job tasks, enforcement of approved service delivery standards, citizen feedback on service delivery implementation, use of appropriate technology (including ICT), and implementation of behavioural change management programmes aimed at improving the service delivery experience like the “Batho Pele” programme
Score achieved in implementing sector-specific norms and standards
Score achieved in implementing Operations Management Framework building blocks: service delivery model, business process mapping, standard operating procedures, service standards and charter, service delivery improvement plans.
Score achieved for workspace design (ergonomics)
Score achieved for citizen feedback on service delivery performance
Score achieved on employee and citizen feedback on the implementation of the Batho Pele standards.
Performance (40%)
Performance productivity refers personnel performance in relation to set targets in a set time. It also includes measures that directly impacts on personnel performance like the leadership and management environment, and personnel morale that can be determined through regular organisational climate surveys. .
Total performance rewards to employees.
Number of employees that underwent counselling and support due to work-related stress.
Number of employees that were disciplined for various reasons
Score achieved for employee satisfaction survey (to include self-assessment on presenteeism).
4
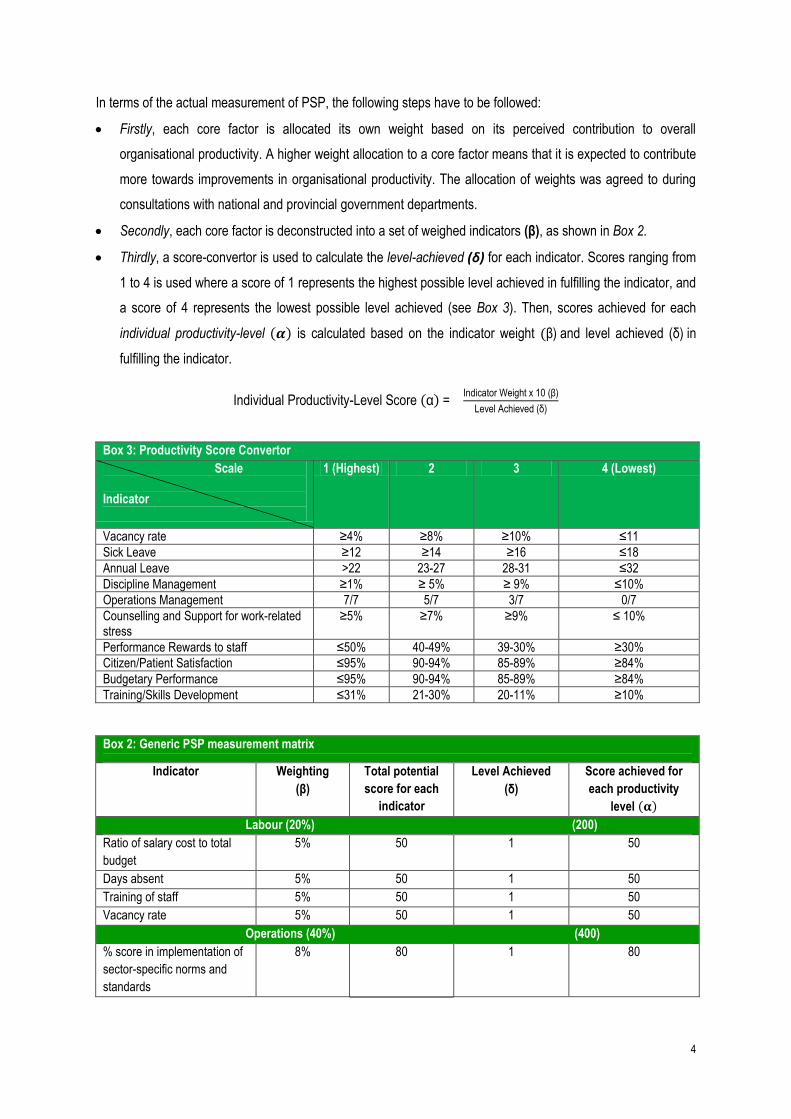
In terms of the actual measurement of PSP, the following steps have to be followed:
Firstly, each core factor is allocated its own weight based on its perceived contribution to overall
organisational productivity. A higher weight allocation to a core factor means that it is expected to contribute
more towards improvements in organisational productivity. The allocation of weights was agreed to during
consultations with national and provincial government departments.
Secondly, each core factor is deconstructed into a set of weighed indicators ( , as shown in Box 2.
Thirdly, a score-convertor is used to calculate the level-achieved for each indicator. Scores ranging from
1 to 4 is used where a score of 1 represents the highest possible level achieved in fulfilling the indicator, and
a score of 4 represents the lowest possible level achieved (see Box 3). Then, scores achieved for each
individual productivity-level is calculated based on the indicator weight ) and level achieved ( ) in
fulfilling the indicator.
Individual Productivity-Level Score = ndicator eight 0 ( )
evel Achieved ( )
Box 3: Productivity Score Convertor
Scale
Indicator
1 (Highest) 2 3 4 (Lowest)
Vacancy rate ≥4% ≥8% ≥ 0% ≤
Sick Leave ≥ 2 ≥ 4 ≥ 6 ≤ 8
Annual Leave >22 23-27 28-31 ≤32
Discipline Management ≥ % ≥ 5% ≥ 9% ≤ 0%
Operations Management 7/7 5/7 3/7 0/7
Counselling and Support for work-related stress
≥5% ≥7% ≥9% ≤ 10%
Performance Rewards to staff ≤50% 40-49% 39-30% ≥30%
Citizen/Patient Satisfaction ≤95% 90-94% 85-89% ≥84%
Budgetary Performance ≤95% 90-94% 85-89% ≥84%
Training/Skills Development ≤31% 21-30% 20-11% ≥10%
Box 2: Generic PSP measurement matrix
Indicator
Weighting
(
Total potential
score for each
indicator
Level Achieved
Score achieved for
each productivity
level
Labour (20%) (200)
Ratio of salary cost to total
budget
5% 50 1 50
Days absent 5% 50 1 50
Training of staff 5% 50 1 50
Vacancy rate 5% 50 1 50
Operations (40%) (400)
% score in implementation of
sector-specific norms and
standards
8% 80 1 80

5
% score in implementing
Operations Management
Framework
8% 80 1 80
Workplace design
(ergonomics and work flow)1
8% 80 1 80
% score in citizen feedback
on service delivery
performance
8% 80 1 80
% score in implementation of
Batho Pele standards
8% 80 1 80
Performance (40%) (400)
Performance rewards to
employees
20% 200 1 200
Number of employees on
counselling and support
5% 50 1 50
Number of employees that
were disciplined
5% 50 1 50
% score in employee
satisfaction survey
10% 100 1 100
Total 100% 1 000 1000
Fourthly, the Individual Productivity-Level Scores are added together to calculate the total productivity score of
the organisation. Using a simple 5-tier system, the total level of productivity achieved by the organisation is
defined based on the total productivity score achieved.
Level of Organisational Productivity Achieved
Range of Scores %
High Productivity 801 to 1 000 81-100%
Moderate Productivity 601 to 800 61-80%
Average Productivity 401 to 600 41-60%
Low Productivity 0 to 400 0-40%
3. Implementation of the Matrix Approach in Selected Government departments
The DPSA piloted the PSP measurement matrix in five (5) service delivery departments in order to test its
feasibility in a South African context. The pilot departments were: Basic Education (Mpumalanga province),
Health (North West province), Cooperative Governance, Human Settlements, and Traditional Affairs (Limpopo
province), Social Development (Limpopo province), Rural Development and Land Reform (national). The levels
of organisational productivity for each of the five departments were measured using their 2013/14 annual report
data as a primary source. The productivity assessments of the pilot departments are captured in sections 3.1 –
3.5.

6
3.1 Case Study – Department of Health, North West province
The North West Department of Health (NWDoH) is one of 10 provincial government departments situated in
South Africa’s North est province. The head office of the department is located in the town of Mafikeng, which
is also the seat of the provincial legislature and administration. All the health care facilities under the
management of the NWDoH are shown on Map 1.
The department delivers its health care services in terms of a mandate it has through the legislative and
regulatory frameworks of national Parliament and the North West provincial legislature. This legal mandate is
implemented through eight programmes, namely: (i) Administration (ii) District health services (iii) Emergency
Medical Services (EMS) (iv) Provincial Hospitals (v) Central and Tertiary Hospital (vi) Health Services Training
(vii) Health Care Support Services (viii) Health Facilities Management. The vision of the NWDoH is to promote
healthy, self-reliant communities in the province. The departmental mission is to render accessible, equitable and
integrated quality health to the population whilst observing the following values: Batho Pele principles, Patients’
rights charter, Victims’ rights charter, Children’ rights charter, Disability rights charter, Older persons pledge,
Accountability and transparency, Community participation, Excellence, Caring, Access human dignity and
respect.
Map 1: Location on NWDoH facilities in relation to population by municipal ward

7
3.1.1 Findings and analysis in the case of the NWDoH
Based on available data sets, the PSP measurement matrix below shows the total level of organisational
productivity achieved by the NWDoH for the 2014/15 financial year.
PSP Measurement Matrix: Scores achieved per productivity indicator and core factor
Indicator Weighting Total potential
score
for each indicator
Level
achieved
Score achieved for each
productivity level
Labour (20%) (104.16/200) = 0.52
Ratio of salary cost to total budget 5% 50 2 252
Days absent 5% 50 1 503
Vacancy rate 5% 50 4 12.54
Training of Staff 5% 50 3 16.665
Operational (32%) (133.33/320) = 0.42
% score in implementing National Core
Standards for Health Establishment6
8% 80 2 407
% score in implementing Operations
Management Framework
8% 80 2 408
% score in citizen feedback on service
delivery performance (Patient
Satisfaction)
16% 160 3 53.339
Performance (40%) (162.5/400) = 0.41
Total performance rewards to
employees
10% 200 4 5010
Number of employees on counselling
and support
5% 50 4 12.5 (No data)11
Number of employees disciplined 5% 50 1 5012
% score in employee satisfaction
survey
10% 100 4 25 (No data)13
Budgetary Performance 10% 100 4 2514
Total 100% 920* 399.99 (43.5%)
An organisational productivity level of 399.99 was achieved out of a possible 920, which translate into an
organisational productivity-level score of 43.5% (0.43) for the NWDoH, reflecting an “Average Level of
Productivity” for the department.
Level of Productivity Range of scores Percentage achieved(%)
High Productivity 691 to 920 70-100%
Moderate Productivity (Compliant) 461 to 690 47-69%
Average Productivity 231 to 460 24-46% 399.99 (43.5%)
Low Productivity 0 to 230 0-23%
Based on the organisational productivity assessment (2014/15), managerial interventions are recommended in
the following areas:
Training/skills development – skills development programme of the organisation has to be expanded.
Patient satisfaction – the survey methodology has to be revised.
Budgetary performance – overspending in 2014/15 financial year should not be repeated.
Data management – their need to be an overall improvement in data management in the department.

8
3.2 Case Study – Department of Basic Education, Mpumalanga province
The Mpumalanga Department of Basic Education (MDoBE) is located in the town of Mbombela (Nelspruit), which
is also the seat of the provincial legislature and administration. The department delivers its education services in
terms of a mandate given through the legislative and regulatory framework of national Parliament and the
Mpumalanga provincial legislature. The vision of the MDoBE is to accelerate excellence in education delivery.
The departmental mission is to provide excellence and quality education to the community through: working
together with stakeholders (participation), effective teaching and learning (effectiveness), responsive curriculum,
proactive communication, good governance and effective management (effectiveness), bridging the digital
divide, transformation, and human resource development. In rendering these services, the department
undertakes to observe specific values which include: accountability, transparency, consultation, accessibility,
innovation. The geographic locations of all the schools of the MDoBE are shown on the map below.
In the period assessed (2014/15), the general performance of the department reflects that it has spent 97.5% of
its total budget and increased the Grade 12 pass rate from 77.6% to 79%, which is higher than the national
average of 75.8%. Also worth noting is that a provincial moratorium was placed on the filling of posts in the last
quarter of the 2014/15 financial year, and this has resulted in the department not being able to fill posts including
those that were already advertised. A total of 40 complaints were reported against the department through the
Presidential hotline (30 resolved), and 12 through the departmental toll free number (11 resolved).

9
3.2.1 Findings and analysis in the case of the MDoBE
Based on available data sets, the PSP measurement matrix below shows the total level of organisational
productivity achieved by the MDoBE for the 2014/15 financial year.
PSP Measurement Matrix: Scores achieved per productivity indicator and core factor
Indicator Weighting Total potential score for each indicator
Level achieved
Score achieved for each productivity level
Labour (20%) (129.17/200)(0.64)
Ratio of salary cost to total budget 5% 50 1 5015
Days absent 5% 50 1 5016
Vacancy rate 5% 50 3 16.717
Training of Staff 5% 50 4 12.518
Operational (32%) (120/160) (0.75)
% Communication Systems available 8% 80 3 26.619
Implementation of the public service Operations Management Framework
8% 80 2 4020
Workplace design (ergonomics and work flow)
8%
Performance (40%) (250/400) (0.63)
Total performance rewards to
employees
10% 100 4 2521
Number of employees on counselling
and support
5% 50 1 50
Number of employees that were
disciplined
5% 50 1 5022
% score in employee satisfaction
survey
10% 100 4 25 (Data not available)
Budgetary Performance 10% 100 1 10023
Total 100% 760* 499.17 (65.88%)
An organisational productivity level of 499.17 was achieved out of a possible 760, which translate into an
organisational productivity-level score of 65.88% (0.65) for the MDoBE, reflecting a “Compliant Level of
Productivity” for the department.
LEVEL OF PRODUCTIVITY RANGE OF SCORES %
High Productivity 571 to 760 71-100%
Moderate Productivity (Compliant) 381 to 570 48-70% 499.17 (65.88%)
Average Productivity 191 to 380 24-47%
Low Productivity 0 to 190 0-23%
Based on the organisational productivity assessment (2014/15), managerial interventions are recommended in
the following areas:
Training/skills development – skills development programme of the organisation has to be expanded.
Vacancy rate – the rate in 2014/15 was beyond 8%.
Data management – their need to be an overall improvement in data management in the department.

10
3.3 Case Study – Department t of Cooperative Governance, Human Settlements and Traditional Affairs
(Coghsta), Limpopo Province
The Limpopo Department of Coghsta is located in the city of Polokwane, which is also the seat of the provincial
legislature and administration. The five municipal districts of the province are shown on the map below.
Limpopo Province and District Municipalities
The Limpopo Department of Coghsta delivers its services in terms of a mandate given through the legislative and
regulatory framework of national Parliament and the Limpopo provincial legislature. The department’s vision is
Integrated Sustainable Human Settlements. And the departmental mission is to be an effective agent of change
that delivers quality services to citizens of Limpopo through promoting developmental cooperative governance;
supporting municipalities and traditional leadership institutions; and delivering integrated and sustainable human
settlements. The values of the department are underpinned by the Batho Pele principles with an emphasis on
service excellence, innovation, integrity, prudence, transparency, fairness and consistency, and professionalism.
In the period assessed (2014/15), the general performance of the department reflects that it has spent 85.9% of
its total budget. The department has a staff compliment of 2271, provides support services to 1509 traditional
leaders, has created 21 000 job opportunities through the Community Works Programme, and has received over
40 awards in the period 2009 – 2015.

11
3.3.1 Findings and analysis in the case of Coghsta, Limpopo province
Based on available data sets, the PSP measurement matrix below shows the total level of organisational
productivity achieved by the Coghsta for the 2014/15 financial year.
PSP Measurement Matrix: Scores achieved per productivity indicator and core factor
Indicator Weighting Total potential score for each indicator
Level achieved
Score achieved for each productivity level
Labour (20%) (133.4/200) = 0.67
Ratio of salary cost to total budget 5% 50 1 5024
Days absent 5% 50 1 5025
Vacancy rate 5% 50 3 16.726
Training of Staff (Skills Programmes) 5% 50 3 16.727
Operational (30%) (130/300) = 0.43
Implementation of the public service Operations Management Framework
10% 100 1 8028
Workplace design (ergonomics and work flow)
10%
% Score in implementation of Batho Pele standards (Citizen feedback on service delivery performance )
20% 200 4 50 (Data not Available)29
Performance (40%) (233.3/400) = 0.583
Total performance rewards to employees 10% 100 1 10030
Number of employees on stress-related counselling and support
5% 50 1 5031
Number of employees disciplined 5% 50 3 16.6632
% score in employee satisfaction survey 10% 100 3 33.333
Budgetary Performance 10% 100 3 33.334
Total 100% 900* 496.7 = 0.55
An organisational productivity level of 496.7 was achieved out of a possible 900, which translate into an
organisational productivity-level score of 55.1% (0.55) for the Coghsta, reflecting a “Compliant Level of
Productivity” for the department.
LEVEL OF PRODUCTIVITY RANGE OF SCORES %
High Productivity
676 to 900 71-100%
Moderate Productivity (Compliant)
451 to 675 48-70% (496.7 = 0.55)
Average Productivity
226 to 450 24-47%
Low Productivity
0 to 225 0-23%
Based on the organisational productivity assessment (2014/15), managerial interventions are recommended in
the following areas:
Training/skills development – skills development programme of the organisation has to be expanded.
Discipline management and budgetary performance has to be improved.
Data management – their need to be an overall improvement in data management in the department.
Vacancy rate – the rate in 2014/15 was beyond 9%.

12
3.4 Case Study – Department of Social Development, Limpopo Province
The Limpopo Department of Social Development (LDSD) is located in the city of Polokwane, which is also the
seat of the provincial legislature and administration. The LDSD delivers its services in terms of a mandate given
through the legislative and regulatory framework of national Parliament and the Limpopo provincial legislature.
The core legislative mandates of the LDSD are outlined below:
Acts Mandate
Social Assistance Act (Act no 13 of 2004) Provides for the rendering of social assistance to persons, national councils and Development Organizations.
White Paper for Social Welfare (1997) It aims to transform social welfare services through developmental approach.
Social Service Professions Act (Act no. 110 of 1978)
It promotes and regulate the practice of social service practitioners for social service professions.
Child Care Act (Act no. 116 of 1991) It provides for the transformation of the child and youth care system.
Domestic Violence Act (Act no. 61 of 2003) It provides for the protection of the victims of domestic violence and the vulnerable members of the society.
The Child Justice Act (Act no.75 of 2008) It provides for the framework for dealing with children in conflict with the law.
Prevention of and Treatment for substance abuse Act (Act no.70 of 2008)
It provides for a comprehensive national response for the combating of substance abuse.
Older persons Act (Act no.13 of 2006) Provides a framework for the empowerment and protection of older persons.
Advisory Board on Social Development Act (Act no 3 of 2001)
Provides for a national advisory structure in the social development sector.
Non-profit Organisations Act, 1997 The act repealed the Fund-Raising Act, 1997. It established an administrative and regulatory framework within which non-profit organisations can conduct their affairs.
Children’s Amendment Act No. 38 of 2005 It provides the framework for the care and protection of children.
Sexual Offences Related Matters Amendment Act no 32 of 2007
It provides for the regulations of sexual offences against vulnerable groups.
The department’s vision is ‘Well cared for, socially developed, empowered and self-reliant people of Limpopo’.
And the departmental mission is to ensure “the provision of comprehensive integrated, sustainable and quality
social development services to the vulnerable individuals, households and communities in partnership with
relevant stakeholders”. The values of the department are to uphold the Constitution of South Africa through
responsiveness, professionalism, honesty and integrity, fairness and equity, respect and dignity, efficiency and
effectiveness, patriotism, openness and transparency, innovation, and quality. These values – especially those of
quality, efficiency and effectiveness – speak to the department’s commitment to organisational productivity.

13
3.4.1 Findings and analysis in the case of Social Development, Limpopo province
Based on available data sets, the PSP Measurement Matrix below shows the Individual Productivity-Level scores
achieved as well as the total productivity score achieved by the Limpopo Department of Social Development.
PSP Measurement Matrix: Scores achieved per productivity indicator and sub-factor
Indicator Weighting Total potential score for each indicator
Level achieved
Score achieved for each productivity level
Labour (20%) (162.5/200) [Labour Productivity = 0.81]
Ratio of salary cost to total budget 5% 50 1 5035
Days absent 5% 50 1 5036
Vacancy rate 5% 50 4 12.537
Training of Staff (Skills Programmes)
5% 50 1 5038
Operational (20%) (150/300) [Operational Productivity = 0.50]
% score in implementing Operations Management Framework
10% 100 1 10039
Workplace design (ergonomics and work flow)
10%
% score in citizen feedback on service delivery performance (Citizen Satisfaction)/ % score in implementation of Batho Pele Standards
20% 200 4 5040 (No data)
Performance (40%) (258.33/400) [Performance Productivity = 0.65]
Total performance rewards to employees
10% 100 3 33.3341
Number of employees on counselling and support due to work-related stress
5% 50 1 5042
Number of employees disciplined 5% 50 1 5043
% score in employee satisfaction survey
10% 100 4 2544 (No data)
Budgetary Performance 10% 100 1 10045
Total 100% 900* 570.83 = 63.42
An organisational productivity level of 570.83 was achieved out of a possible 900, which translate into an
organisational productivity-level score of 63.42% (0.6342) for LDSD, reflecting a “Compliant Level of Productivity”
for the department.
LEVEL OF PRODUCTIVITY RANGE OF SCORES %
High Productivity
678 to 900 70-100%
Moderate Productivity (Compliant)
452 to 677 47-69% 570.83 (63.42%)
Average Productivity
226 to 451 24-46%
Low Productivity
0 to 225 0-23%
Based on the organisational productivity assessment (2014/15), managerial interventions are recommended in
the following areas:
Data management – their need to be an overall improvement in data management in the department.
Vacancy rate – the rate in 2014/15 was beyond 40%.

14
3.5 Case Study – Department of Rural Development and Land Reform
The head office of the Department of Rural Development and Land Reform (DRDLR) is located in the capital city
of Tshwane and the department delivers its services through 23 district offices located across South Africa. The
DRDLR delivers its services in terms of a mandate given through the legislative and regulatory framework of
national Parliament. The core legislative mandates of the DRDLR are outlined below:
Act Mandate
Deed Registries Act, No. 47 of 1937 The Act makes provision for the administration of the land registration system and the registration of rights in land. It requires that deeds and documents be prepared and lodged in a Deeds Registry by a Conveyancer or Notary Public. These deeds and documents are subjected to three levels of examination by legally qualified personnel who scrutinise the contents for accuracy and compliance with common law, case law and statutory law.
State Land Disposal Act, No. 48 of 1961
The Act makes provision for the disposal of certain State land and to prohibit the acquisition of State land by prescription.
Sectional Titles Act, No. 95 of 1986 The Act makes provision for the division of buildings into sections and common property and for the acquisition of separate ownership in sections coupled with joint ownership in common property. It further regulates the transfer of ownership of sections and the registration of sectional mortgage bonds over, and real rights in, such sections. It also makes provision for the establishment of body corporates to control common property.
Upgrading of Land Tenure Rights Act,No. 112 of 1991
The Act makes provision for the upgrading and conversion into ownership of certain rights graded in respect of land, as well as for the transfer of tribal land into full ownership to a tribe.
Land Reform: Provision of Land and Assistance Act, No. 126 of 1993
This Act makes provision for the designation of certain land, the regulation of the subdivision of such land and the settlement of persons thereon. In addition, it provides for the acquisition, maintenance, planning development, improvement and disposal of property and the provision of financial assistance for land reform purposes.
Restitution of Land Rights Act, No. 22 of 1994
The Act makes provision for the restitution of rights in land to persons or communities dispossessed of such rights after 19 June 1913 as a result of past racially discriminatory laws or practices. To administer this task, the Act established a Commission on Restitution of Land Rights and a Land Claims Court. The Minister is authorised to purchase, acquire in any other manner or expropriate land or rights in land for the purpose of restitution awards.
Land Reform (Labour Tenants) Act, No. 3 of 1996
The Act makes provision for the security of tenure of labour tenants and those persons occupying or using land as a result of their association with labour tenants. It also makes provision for the acquisition of land and rights in land by labour tenants.
Communal Property Associations Act,No. 28 of 1996
The Act makes provision for communities to form juristic persons, to be known as communal property associations, in order to acquire, hold and manage property on a basis agreed to by members of a community. This has to be done in terms of a written constitution.
Land Survey Act, No. 8 of 1997 The Act makes provision for the regulation of the survey of land in South Africa.
Extension of Security of Tenure Act, No.62 of 1997
The Act makes provision for the facilitation of long-term security of land tenure, to regulate the conditions of residence on certain land and to regulate the conditions on and circumstances under which the right of persons to reside on land may be terminated.
Planning Profession Act, No. 36 of 2002
The South African Council for Planners is established under this Act. The Act makes provision for different categories of planners and the registration of planners and authorises the identification of areas of work for planners. The Act seeks to protect the public from unethical practices and to ensure a high standard of professional conduct and integrity.
Professional and Technical Surveyors Act, No. 40 of 1984
The Act makes provision for the establishment of a South African Council for Professional and Technical Surveyors, as well as the registration of professional surveyors, professional surveyors in training, surveyors, survey technicians and survey technicians in training.
Spatial Data Infrastructure Act, No. 54 of 2003
The Act makes provision for an electronic metadata catalogue and for the determination of standards and prescriptions with regard to the facilitation of the sharing of spatial information.
The DRD R’s vision is ‘Vibrant, equitable, and sustainable rural communities’. And the departmental mission is
to “initiate, facilitate, coordinate, catalyse and implement an integrated rural development programme”. The
values of the department are professionalism and people focus, honesty and integrity, diligence and diversity,
transparency and compassion, honesty and accountability.

15
3.5.1 Findings and analysis in the case of DRDLR
Based on available data sets, the PSP Measurement Matrix below shows the productivity-level scores achieved
for each productivity level as well as the overall productivity score achieved by the DRDLR.
PSP Measurement Matrix: Scores achieved per productivity indicator and sub-factor
Indicator Weighting Total potential score for each indicator
Level achieved
Score achieved for each
productivity level
Labour (20%) (129.17/200) = 0.65
Ratio of salary cost to total budget 5% 50 4 12.546
Days absent 5% 50 1 5047
Supervisor: Employee ratio
Vacancy rate 5% 50 3 16.6748
Training of Staff (Skills Programmes)
5% 50 1 5049
Operational (30%) (130/300) = 0.43
% score in implementing Operations Management Framework
10% 100 1 8050
Workplace design (ergonomics and work flow)
% score in citizen feedback on service delivery performance (Citizen Satisfaction)/ % score in implementation of Batho Pele Standards
20% 200 4 5051 (No data)
Performance (40%) (208.3/400) = 0.65
Total performance rewards to employees
10% 100 1 10052
Number of employees on counselling and support due to work-related stress
5% 50 4 12.553
Number of employees disciplined 5% 50 2 2554
% score in employee satisfaction survey
10% 100 4 2555 (No data)
Budgetary Performance 10% 100 1 10056
Total 100% 900* 467.47 = 0.52
An organisational productivity level of 467.47 was achieved out of a possible 900, which translate into an
organisational productivity-level score of 52% (0.52) for DRDLR, reflecting a “Moderate or Compliant Level of
Productivity” for the department.
LEVEL OF PRODUCTIVITY RANGE OF SCORES %
High Productivity
676 to 900 71-100%
Moderate Productivity (Compliant)
451 to 675 48-70% (467.47 or 52%)
Average Productivity
226 to 450 24-47%
Low Productivity
0 to 225 0-23%
Based on the organisational productivity assessment (2014/15), managerial interventions are recommended in
the following areas:
Data management – their need to be an overall improvement in data management in the department.
Reduction in expenditure on personnel costs.

16
4. Lessons learned
The following lessons emerged from implementing the five pilots and will serve to enrich the efforts of public
service departments to enhance their organisational productivity levels:
1. PSP is not an oxymoron: There is a minority view in the literature on productivity that PSP is an oxymoron,
i.e. a word with contradictory meaning. The view expressed is that the Public Service is – by design and
nature – a massive bureaucracy that moves slowly through various legislative and systemic process (‘red
tape’) to ensure that the best possible output is produced for the good of the public and that it is not in the
interest of the public – who deserve due process – to put too great an emphasis on the rate at which inputs
are converted to public service outputs.
Through the development and application of the PSP Measurement
instrument, we learned that PSP is not an oxymoron and that improved PSP
does not necessarily occur at the expense of legislative processes, but in
support thereof. The constitution, for instance, requires that Public
Administration in South Africa must be governed by the democratic values
and principles enshrined in the Constitution, including the principle that the
“efficient, economic and effective use of resources must be promoted”.
In support of this Constitutional principle, the PSP Management Framework actively promotes the efficient,
economic and effective use of public resources by advocating PSP improvements that would, cetris parabis,
serve the public interest.
2. Public service productivity is measurable and can be managed: The DPSA’s design and
implementation of a generic PSP measurement instrument through five pilot projects shows that the
organisational productivity of public service departments can be measured and thus managed.
In all five pilots – NWDoH, Coghsta, MDoBE, LDSD and DRDLR – the
measurement results were not contested by the Heads of Department (HOD)
or senior management because they understood why certain scores were
allocated for key productivity indicators. The instrument was therefore seen
as credible, which is critical for any measurement instrument. And in all five
pilots an undertaking was made by HODs and senior managers that – going
forward – they should do better in managing the work related to the areas for
which the productivity scores were low.
This shows that the objective measurement of organisational productivity is possible and that it can lead to
the improved management of identified productivity deficits.
3. A rose by any other name is no longer simply a rose: From a private sector manufacturing perspective,
productivity is usually defined as the ratio of output to input. However, from a public sector service delivery
Improved public
service productivity
does not necessarily
occur at the expense
of legislative
processes, but in
support thereof.
The objective
measurement of
organisational
productivity is not only
possible; it can also
lead to the improved
management of
identified productivity
deficits.

17
perspective, the productivity definition relates more specifically to the relationship of the quality and quantity
dimensions of service outputs (from a citizen perspective) to the quality and quantity of service inputs (as
managed by public officials). Put differently:
Public Service Productivity = Quality and Quantity of Output/Quality and Quantity of Input
Because of this difference in the definition of productivity in the private and public sectors, ‘a rose’ cannot
simply be ‘a rose’ – public service productivity (PSP) is totally different from the ‘traditional’ private sector
understanding of productivity. Hence, we learned that we have to clearly define PSP in all its dimensions as
to avoid confusion with prevailing understandings of productivity in the manufacturing industry.
4. Do not use bathroom scales to weigh an elephant: The public sector, inclusive of the public service, is
massive in that it is the largest single employer representing a significant contribution to the economy of the
country. It is, for all purposes, a big elephant. To weigh this elephant in order to determine the impact of its
presence, one must use an appropriate weighing and measurement instrument or instruments. A bathroom
scale will simply not do!
Similarly, when measuring the e tent to which ‘elephant sized’ public sector
organisations are productive, one has to use a measurement instrument that
is appreciative of the magnitude and complexity of the task at hand. It was
thus through trial-and-error or testing-and-retesting that the Directorate:
Productivity and Efficiency Studies developed the PSP measurement
instrument which, in our experience, is appreciative of the many factors that
impact on the productivity of public service organisations.
5. There is no single productivity ‘secret’: f there is a single ‘secret’ to improving the productivity of public
service organisations, we did not discover it during the past three financial years of designing and
implementing the public service productivity management framework.
But what we did learn is that there are many strategies that can be used to
better manage public resources as key inputs to the PSP equation.
Productivity is a holistic concept, characterised by a variety of interconnected
parts that have to be carefully identified and better understood. There are in
fact tens (if not hundreds) of factors that contribute to organisational
productivity, foremost of which is how well it manages its key inputs –
people, infrastructure, and financial resources.
In short: there exist not one ‘secret’ to improving organisational productivity in the public service – there are,
in fact, several interconnected ‘secrets’.
When measuring PSP,
one has to use a
measurement
instrument that is
appreciative of the
magnitude and
complexity of the task
at hand.
There exist not one
‘secret’ to improving
organisational
productivity in the
public service – there
are, in fact, several
interconnected
‘secrets’.
18
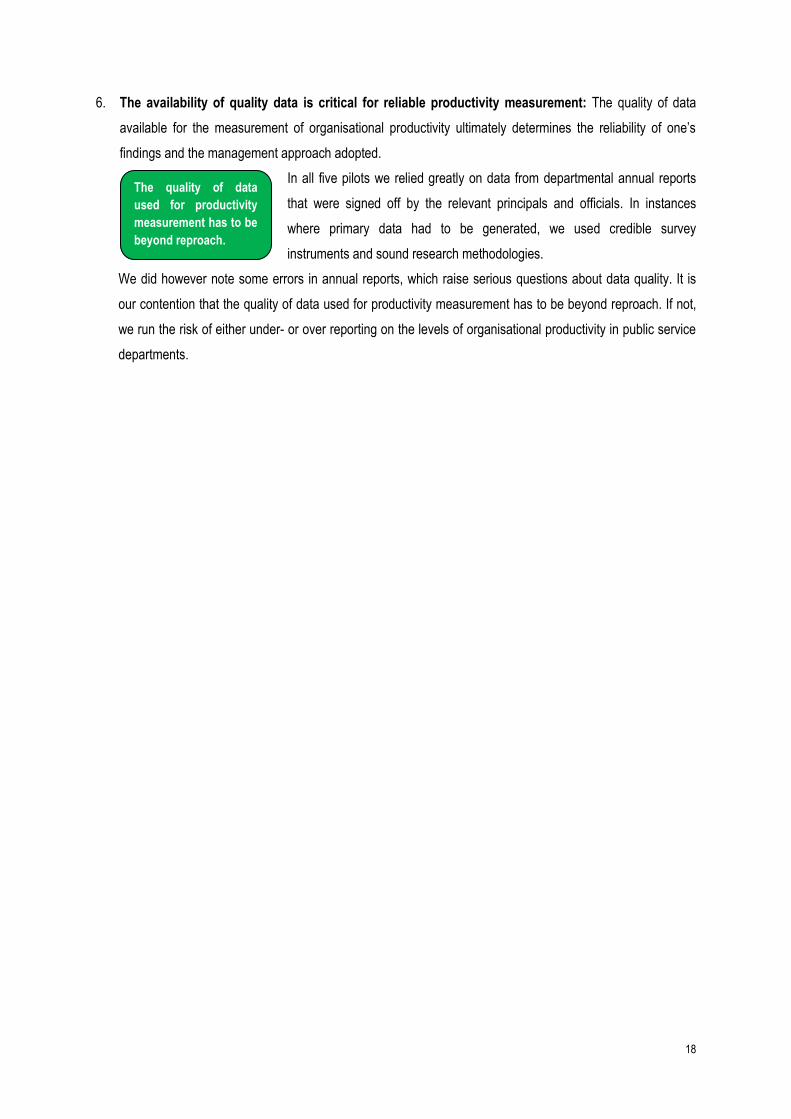
6. The availability of quality data is critical for reliable productivity measurement: The quality of data
available for the measurement of organisational productivity ultimately determines the reliability of one’s
findings and the management approach adopted.
In all five pilots we relied greatly on data from departmental annual reports
that were signed off by the relevant principals and officials. In instances
where primary data had to be generated, we used credible survey
instruments and sound research methodologies.
We did however note some errors in annual reports, which raise serious questions about data quality. It is
our contention that the quality of data used for productivity measurement has to be beyond reproach. If not,
we run the risk of either under- or over reporting on the levels of organisational productivity in public service
departments.
The quality of data
used for productivity
measurement has to be
beyond reproach.

19
Endnotes
1 Workplace design refers to the arrangement of workspace so that work can be performed in the most efficient way.
Workplace design incorporates both ergonomics and work flow, which examine the way in which work is performed in order
to optimise layout.
2 In the 2014/15 financial year, the ratio of Personnel to Total Expenditure was 64%/34%, i.e. above the 60/40 National Norm for the Health sector (Source, NWDOH Annual Report 2014/15, Pp. 133).
Ratio: Personnel to Total Expenditure ≥60/40 61-64 65-68 ≤69
Score 1 2 3 4
3 The average days absent (annual leave plus sick leave) per employee were 22 days (out of a potential high of 33 days) (Source, NWDOH Annual Report 2014/15).
Days absent ≥33 34-36 37-39 ≤40
Score 1 2 3 4
4 The vacancy rate in 2014/15 was 10.3% (Source, NWDOH Annual Report 2014/15, Pp.136). The highest vacancy rate was in Health Sciences and Training and lowest in Health Facilities Management
Vacancy rate ≥4% 5-7% 8-10% ≤
Score 1 2 3 4
5 Skills development opportunities were provided to 16% of employees in 2014/15 (Source, NWDOH Annual Report 2014/15, Pp.154).
Skills development (Training) ≤3 % 21-30% 20-11% ≥ 0%
Score 1 2 3 4
6 The National Core Standards for Health Establishments identifies six priority areas against which health institutions are
measured, namely availability of medicines and supplies, cleanliness, patient safety and security, positive and caring
attitudes, waiting times.
7 The NWDOH were given the following scores when assessed for implementation of the National Core Standards for Health Establishments. Availability of medicines and supplies (87.3%); Cleanliness (75%); Patient safety and security (77.6%); Positive and caring attitudes (82.9%); Waiting times (75.3%). Average score: 79.6% or 2
National Core Standards for Health Establishments ≤80% 60-79% 21-59% ≥20%
Score 1 2 3 4
8 Public Service departments are required to have in place the following six (6) Operations Management building blocks: (1)
Service Standards, (2) Service Charters, (3) Service Delivery Improvement Plans (SDIPs), (4) Mapping of Business Processes, (5) and (6) a Service Delivery Model. In the period 2014/15, the NWDOH had 4 of the six Operations Management building blocks in place (Evidence to be submitted).
Implementation of Operations Management Framework 6 Building Blocks
4-5 2-3 ≤
Score 1 2 3 4
9 In the period 2014/15, the NWDOH achieved a patient satisfaction rating of 89.5% (Source, NWDOH Annual Report
2014/15)
Patient Satisfaction ≤95% 90-94% 85-89% ≥84%
Score 1 2 3 4
20
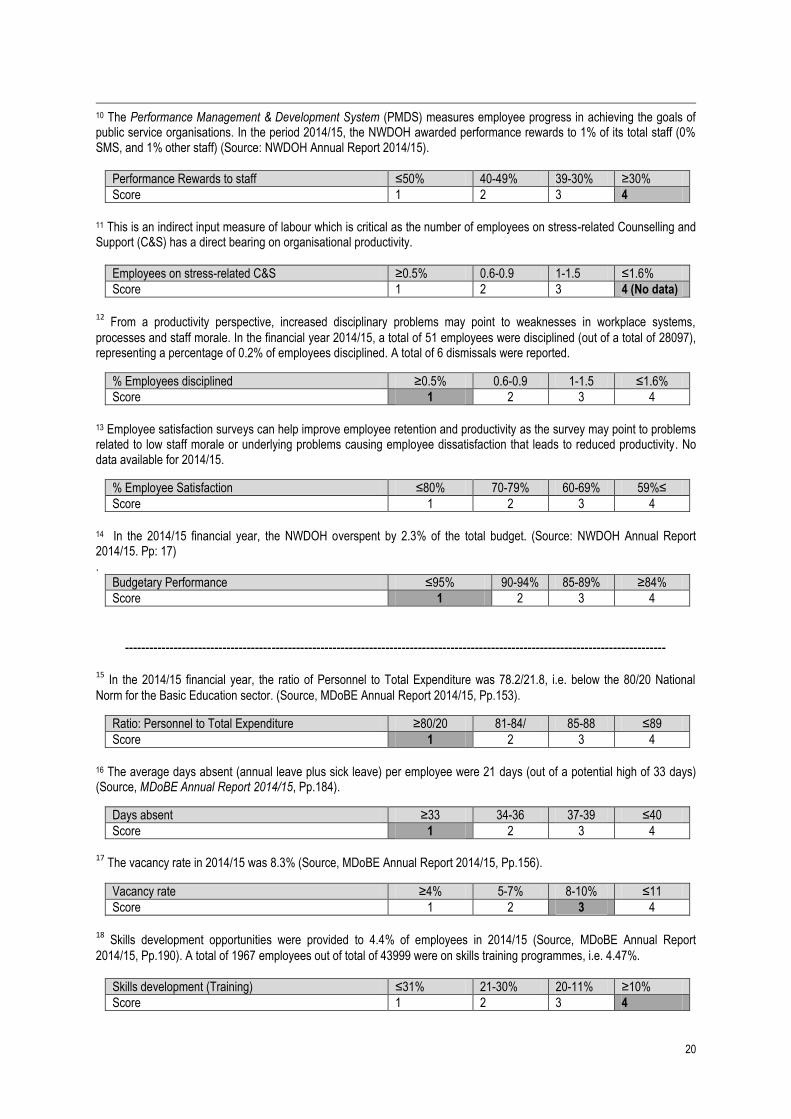
10 The Performance Management & Development System (PMDS) measures employee progress in achieving the goals of public service organisations. In the period 2014/15, the NWDOH awarded performance rewards to 1% of its total staff (0% SMS, and 1% other staff) (Source: NWDOH Annual Report 2014/15).
Performance Rewards to staff ≤50% 40-49% 39-30% ≥30%
Score 1 2 3 4
11 This is an indirect input measure of labour which is critical as the number of employees on stress-related Counselling and Support (C&S) has a direct bearing on organisational productivity.
Employees on stress-related C&S ≥0.5% 0.6-0.9 1-1.5 ≤ .6%
Score 1 2 3 4 (No data)
12
From a productivity perspective, increased disciplinary problems may point to weaknesses in workplace systems,
processes and staff morale. In the financial year 2014/15, a total of 51 employees were disciplined (out of a total of 28097), representing a percentage of 0.2% of employees disciplined. A total of 6 dismissals were reported.
% Employees disciplined ≥0.5% 0.6-0.9 1-1.5 ≤ .6%
Score 1 2 3 4
13 Employee satisfaction surveys can help improve employee retention and productivity as the survey may point to problems related to low staff morale or underlying problems causing employee dissatisfaction that leads to reduced productivity. No data available for 2014/15.
% Employee Satisfaction ≤80% 70-79% 60-69% 59%≤
Score 1 2 3 4
14 In the 2014/15 financial year, the NWDOH overspent by 2.3% of the total budget. (Source: NWDOH Annual Report 2014/15. Pp: 17) .
Budgetary Performance ≤95% 90-94% 85-89% ≥84%
Score 1 2 3 4
------------------------------------------------------------------------------------------------------------------------------------- 15
In the 2014/15 financial year, the ratio of Personnel to Total Expenditure was 78.2/21.8, i.e. below the 80/20 National
Norm for the Basic Education sector. (Source, MDoBE Annual Report 2014/15, Pp.153).
Ratio: Personnel to Total Expenditure ≥80/20 81-84/ 85-88 ≤89
Score 1 2 3 4
16 The average days absent (annual leave plus sick leave) per employee were 21 days (out of a potential high of 33 days) (Source, MDoBE Annual Report 2014/15, Pp.184).
Days absent ≥33 34-36 37-39 ≤40
Score 1 2 3 4
17
The vacancy rate in 2014/15 was 8.3% (Source, MDoBE Annual Report 2014/15, Pp.156).
Vacancy rate ≥4% 5-7% 8-10% ≤
Score 1 2 3 4
18
Skills development opportunities were provided to 4.4% of employees in 2014/15 (Source, MDoBE Annual Report
2014/15, Pp.190). A total of 1967 employees out of total of 43999 were on skills training programmes, i.e. 4.47%.
Skills development (Training) ≤3 % 21-30% 20-11% ≥ 0%
Score 1 2 3 4

21
19 The availability of communication facilities (landlines, fax, internet connectivity for teaching, learning, and administrative purposes, intercoms) are key measures of productivity in an education environment. In the period 2014/15 a total of 0.86% of schools in Mpumalanga were without communication facilities (Source, NEIMS, October 2014).
% schools without communication facilities ≥0 0.1-0.5 0.6-0.9 ≤
Score 1 2 3 4
20
Public Service departments are required to have in place the following six (6) Operations Management building blocks: (1)
Service Standards, (2) Service Charters, (3) Service Delivery Improvement Plans (SDIPs), (4) Mapping of Business Processes, (5) and (6) a Service Delivery Model. In the period 2014/15, the MDoBE had all six Operations Management building blocks in place (Evidence to be submitted).
Implementation of Operations Management Framework 6 Building Blocks
4-5 2-3 ≤
Score 1 2 3 4
21 The Performance Management & Development System (PMDS) measures employee progress in achieving the goals of public service organisations. In the period 2014/15, the MDoBE awarded performance rewards to 27% of its total staff (25% SMS, and 2% other staff) (Source: MDoBE Annual Report 2014/15, Pp: 180-182).
Performance Rewards to staff ≤50% 40-49% 39-30% ≥30%
Score 1 2 3 4
22 From a productivity perspective, increased disciplinary problems may point to weaknesses in workplace systems, processes and staff morale. In the financial year 2014/15, a total of 282 employees were disciplined (out of a total of 43999), representing a percentage of 0.64% of employees disciplined. A total of 13 dismissals were reported. (Source: MDoBE Annual Report 2014/15, Pp: 187).
% Employees disciplined ≥0.5% 0.6-0.9 1-1.5 ≤ .6%
Score 1 2 3 4
23 In the 2014/15 financial year, the MDoBE spent by 97.5% of the total budget. (Source: MDoBE Annual Report 2014/15. Pp: 10). .
Budgetary Performance ≤95% 90-94% 85-89% ≥84%
Score 1 2 3 4
----------------------------------------------------------------------------------------------------------------------------- ------------ 24
In the 2014/15 financial year, the ratio of Personnel to Total Expenditure was 53.1%/46.9%, which indicates that as little
as almost half the total expenditure was on personnel costs. (Source, CoGHSTA Annual Report 2014/15, Pp.71).
Ratio: Personnel to Total Expenditure ≥80/20 81-84/ 85-88 ≤89
Score 1 2 3 4
25 The average days absent (annual leave plus sick leave) per employee were 26 days (out of a potential high of 33 days) (Source, GoGHSTA Annual Report 2014/15, Pp.95).
Days absent ≥33 34-36 37-39 ≤40
Score 1 2 3 4
26
The vacancy rate in 2014/15 was 9.9% (Source, CoGHSTA Annual Report 2014/15, Pp.74).
Vacancy rate ≥4% 5-7% 8-10% ≤
Score 1 2 3 4

22
27
Skills development opportunities were provided to 10.26% of employees in 2014/15 (Source, Coghsta Annual Report
2014/15). A total of 233 employees out of total of 2271 were on skills training programmes, i.e. 1026%.
Skills development (Training) ≤3 % 21-30% 20-11% ≥ 0%
Score 1 2 3 4
28
Public Service departments are required to have in place the following six (6) Operations Management building blocks: (1)
Service Standards, (2) Service Charters, (3) Service Delivery Improvement Plans (SDIPs), (4) Mapping of Business Processes, (5) and (6) a Service Delivery Model. In the period 2014/15, CoGHSTA had all six Operations Management building blocks in place (Evidence to be submitted).
Implementation of Operations Management Framework 6 Building Blocks
4-5 2-3 ≤
Score 1 2 3 4
29 Citizen satisfaction is an outcome measure which ensures that what is measured within a department is what matters to the citizens. It is acknowledged that outcomes may be influenced by factors outside the control of governments or agencies delivering services. We use the score achieved in the implementation of Batho Pele standards as a proxy for citizen satisfaction. Batho Pele standards relates to the implementation of the principles of courtesy, consultation, redress, value for money, service standards, access, information, openness and transparency.
% Score in Implementation of Batho Pele Standards ≤80% 70-79% 60-69% 59%≤
Score 1 2 3 4 (No data)
30 The Performance Management & Development System (PMDS) measures employee progress in achieving the goals of public service organisations. In the period 2014/15, the Coghsta awarded performance rewards to 61.5% of its total staff (17% SMS, and 44.5% other staff) (Source: Goghsta Annual Report 2014/15, Pp: 180-182).
Performance Rewards to staff ≤50% 40-49% 39-30% ≥30%
Score 1 2 3 4
31 This is an indirect input measure of labour which is critical as the number of employees on stress-related Counselling and Support (C&S) has a direct bearing on organisational productivity (Source: Acting HOD supplied data).
Employees on stress-related C&S ≥0.5% 0.6-0.9 1-1.5 ≤ .6%
Score 1 2 3 4
32
From a productivity perspective, increased disciplinary problems may point to weaknesses in workplace systems,
processes and staff morale. In the financial year 2014/15, a total of 23 employees were disciplined (out of a total of 2271), representing a percentage of 1.01% of employees disciplined (Source: GoGHSTA Annual Report 2014/15, Pp. 88).
% Employees disciplined ≥0.5% 0.6-0.9 1-1.5 ≤ .6%
Score 1 2 3 4
33 Employee satisfaction surveys can help improve employee retention and productivity as the survey may point to problems related to low staff morale or underlying problems causing employee dissatisfaction that leads to reduced productivity. The GoGHSTA employee satisfaction survey for 2014/15 reflected an average level of 56.1% staff satisfaction (Source: Organisational Assessment Survey 2014/15).
% Employees satisfaction ≤7 % 61-70% 51-60% 50%≤
Score 1 2 3 4
34 In the 2014/15 financial year, the Coghsta spent by 85.9% of the total budget. (Source: Goghsta Annual Report 2014/15. Pp: 12). .
Budgetary Performance ≤95% 90-94% 85-89% ≥84%
Score 1 2 3 4

23
____________________________________________________________________________ 35
In the 2014/15 financial year, the ratio of Personnel to Total Expenditure was 56.6/43.4, i.e. below the assumed 60/40
National Norm for the Social Development sector. (Source, LDSD Annual Report 2014/15, Pp.124).
Ratio: Personnel to Total Expenditure ≥60/40 61-64/ 65-68 ≤69
Score 1 2 3 4
36 The average days absent (annual leave plus sick leave) per employee were 28 days (out of a potential high of 33 days) (Source, LDSD Annual Report 2014/15, Pp.154-156).
Days absent ≥33 34-36 37-39 ≤40
Score 1 2 3 4
37
The vacancy rate in 2014/15 was 40.4% (Source, LDSD Annual Report 2014/15, Pp.127). The highest rate of vacancies
was amongst Social Auxiliary Workers and the lowest amongst Social Workers.
Vacancy rate ≥4% 5-7% 8-10% ≤
Score 1 2 3 4
38 In 2014/15 a total of 1784 officials were trained through skills development programmes out of a total staff compliment of 2872, i.e. 62% of employees were on skills development programmes (Source, LDSD Annual Report 2014/15, Pp.166-167) .
Vacancy rate ≥4% 5-7% 8-10% ≤
Score 1 2 3 4
39
Public Service departments are required to have in place the following six (6) Operations Management building blocks: (1)
Service Standards, (2) Service Charters, (3) Service Delivery Improvement Plans (SDIPs), (4) Mapping of Business Processes, (5) and (6) a Service Delivery Model. In the period 2014/15, the LDSD had all six Operations Management building blocks in place (Evidence to be submitted).
Implementation of Operations Management Framework 6 Building Blocks 4-5 2-3 ≤
Score 1 2 3 4
40 Citizen satisfaction is an outcome measure which ensures that what is measured within a department is what matters to the citizens. It is acknowledged that outcomes may be influenced by factors outside the control of governments or agencies delivering services. We use the score achieved in the implementation of Batho Pele standards as a proxy for citizen satisfaction. Batho Pele standards relates to the implementation of the principles of courtesy, consultation, redress, value for money, service standards, access, information, openness and transparency.
% Score in Implementation of Batho Pele Standards ≤80% 70-79% 60-69% 59%≤
Score 1 2 3 4 (No data)
41 In the period 2014/15, the LDSD awarded 0% performance rewards to SMS staff and 36.9% to staff lower than SMS. Thus, 36.9% of total staff compliment was awarded performance rewards (Source: LDSD Annual Report 2014/15, Pp. 150-152).
Performance Rewards to staff ≤50% 40-49% 39-30% ≥30%
Score 1 2 3 4 (No data)
42 This is an indirect input measure of labour which is critical as the number of employees on stress-related Counselling and Support (C&S) has a direct bearing on organisational productivity. In the period assessed a total of 11 employees received counselling for stress/depression and work related problems (out of a total of 2872), i.e. 0.38% (Source: LDSD Annual Wellness Report 2014/15).
Employees on stress-related C&S ≥0.5% 0.6-0.9 1-1.5 ≤ .6%
Score 1 2 3 4
24
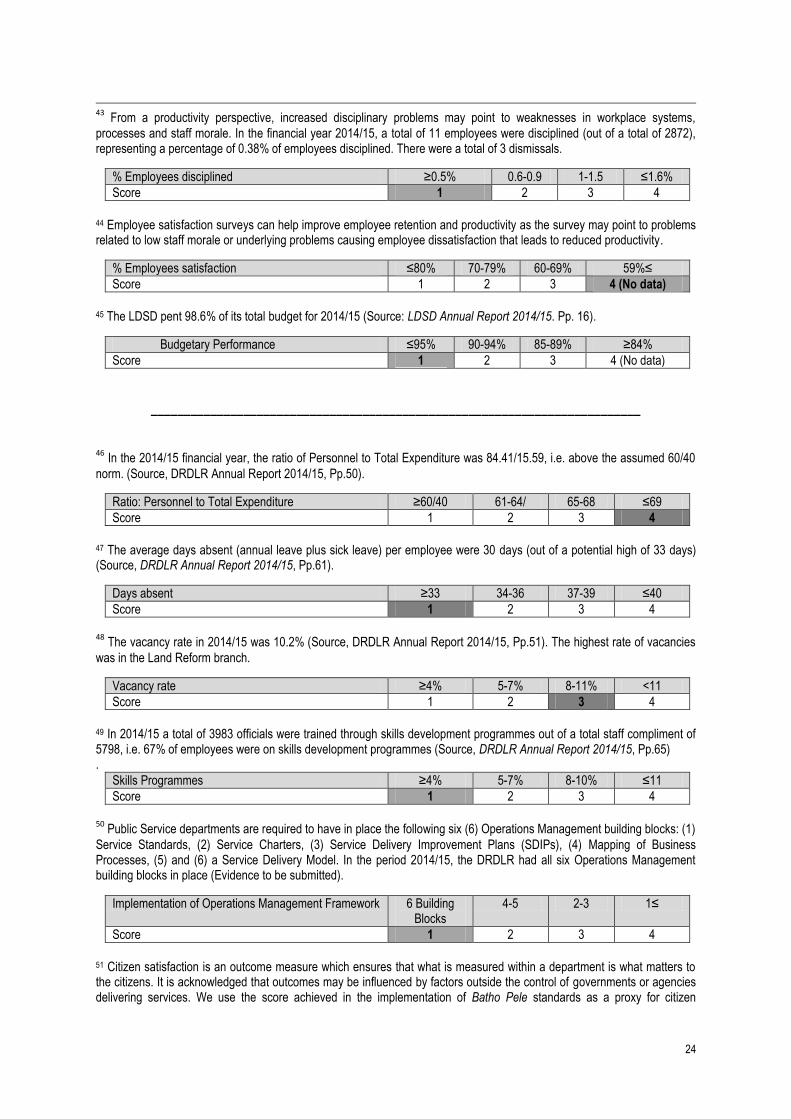
43
From a productivity perspective, increased disciplinary problems may point to weaknesses in workplace systems,
processes and staff morale. In the financial year 2014/15, a total of 11 employees were disciplined (out of a total of 2872), representing a percentage of 0.38% of employees disciplined. There were a total of 3 dismissals.
% Employees disciplined ≥0.5% 0.6-0.9 1-1.5 ≤ .6%
Score 1 2 3 4
44 Employee satisfaction surveys can help improve employee retention and productivity as the survey may point to problems related to low staff morale or underlying problems causing employee dissatisfaction that leads to reduced productivity.
% Employees satisfaction ≤80% 70-79% 60-69% 59%≤
Score 1 2 3 4 (No data)
45 The LDSD pent 98.6% of its total budget for 2014/15 (Source: LDSD Annual Report 2014/15. Pp. 16).
Budgetary Performance ≤95% 90-94% 85-89% ≥84%
Score 1 2 3 4 (No data)
__________________________________________________________________________ 46
In the 2014/15 financial year, the ratio of Personnel to Total Expenditure was 84.41/15.59, i.e. above the assumed 60/40
norm. (Source, DRDLR Annual Report 2014/15, Pp.50).
Ratio: Personnel to Total Expenditure ≥60/40 61-64/ 65-68 ≤69
Score 1 2 3 4
47 The average days absent (annual leave plus sick leave) per employee were 30 days (out of a potential high of 33 days) (Source, DRDLR Annual Report 2014/15, Pp.61).
Days absent ≥33 34-36 37-39 ≤40
Score 1 2 3 4
48
The vacancy rate in 2014/15 was 10.2% (Source, DRDLR Annual Report 2014/15, Pp.51). The highest rate of vacancies
was in the Land Reform branch.
Vacancy rate ≥4% 5-7% 8-11% <11
Score 1 2 3 4
49 In 2014/15 a total of 3983 officials were trained through skills development programmes out of a total staff compliment of 5798, i.e. 67% of employees were on skills development programmes (Source, DRDLR Annual Report 2014/15, Pp.65) .
Skills Programmes ≥4% 5-7% 8-10% ≤
Score 1 2 3 4
50
Public Service departments are required to have in place the following six (6) Operations Management building blocks: (1)
Service Standards, (2) Service Charters, (3) Service Delivery Improvement Plans (SDIPs), (4) Mapping of Business Processes, (5) and (6) a Service Delivery Model. In the period 2014/15, the DRDLR had all six Operations Management building blocks in place (Evidence to be submitted).
Implementation of Operations Management Framework 6 Building Blocks
4-5 2-3 ≤
Score 1 2 3 4
51 Citizen satisfaction is an outcome measure which ensures that what is measured within a department is what matters to the citizens. It is acknowledged that outcomes may be influenced by factors outside the control of governments or agencies delivering services. We use the score achieved in the implementation of Batho Pele standards as a proxy for citizen

25
satisfaction. Batho Pele standards relates to the implementation of the principles of courtesy, consultation, redress, value for money, service standards, access, information, openness and transparency.
% Score in Implementation of Batho Pele Standards ≤80% 70-79% 60-69% 59%≤
Score 1 2 3 4 (No data)
52 In the period 2014/15, the DRDLR awarded performance rewards to 29.35% of SMS staff and 29.93% to staff lower than SMS. Thus, 59.28% of total staff compliment was awarded performance rewards (Source: DRDLR Annual Report 2014/15, Pp. 59).
Performance Rewards to staff ≤50% 40-49% 39-30% ≥30%
Score 1 2 3 4 (No data)
53 This is an indirect input measure of labour which is critical as the number of employees on stress-related Counselling and Support (C&S) has a direct bearing on organisational productivity. No data was available for this indicator.
Employees on stress-related C&S ≥0.5% 0.6-0.9 1-1.5 ≤ .6%
Score 1 2 3 4
54 From a productivity perspective, increased disciplinary problems may point to weaknesses in workplace systems, processes and staff morale. In the financial year 2014/15, a total of 63 employees were disciplined (out of a total of 5798), representing a percentage of 1.09% of employees disciplined. There were a total of 6 dismissals (Source: DRDLR Annual Report 2014/15, Pp. 58).
% Employees disciplined ≥0.5% 0.6-0.9 1-1.5 ≤ .6%
Score 1 2 3 4
55 Employee satisfaction surveys can help improve employee retention and productivity as the survey may point to problems related to low staff morale or underlying problems causing employee dissatisfaction that leads to reduced productivity. No data was available for this indicator.
% Employee satisfaction ≤80% 70-79% 60-69% 59%≤
Score 1 2 3 4 (No data)
56 The DRDLR spent 99.4% of its total budget for 2014/15 (Source: DRDLR Annual Report 2014/15. Pp. 69).
Budgetary Performance ≤95% 90-94% 85-89% ≥84%
Score 1 2 3 4 (No data)