measure evaluation results template - civitas
TRANSCRIPT

Measure Evaluation Results Template
FUN 4.1 – Awareness Raising Campaign for Sustainable Mobility
Armando Ribeiro
Augusto Vieira
Lívia Silva
(Municipality of Funchal)
February 2013
Executive Summary
The Mobility Study carried out in the city of Funchal in 2007 revealed that the private car was
the main mode of transport used by citizens, followed by public transport and walking. The
measure ‘Awareness Raising Campaign for Sustainable Mobility’ aimed at encouraging
citizens to adopt a daily cleaner mode of transport by disseminating clear information on
mobility alternatives addressed to specific target groups. Moreover, according to surveys
conducted throughout MIMOSA activities, 68,6% (2010) and 50,9% (2011) of the
respondents were not aware of sustainable mobility which also highlighted the relevance of
organizing information campaigns in order to foster urban sustainable mobility among
citizens.
The measure was implemented in the four following activities fields, which allowed hundreds
of citizens of all generations to be reached:
Field 1: School Mobility Manager Campaign (2010 – 2012) The school mobility addressed
mainly students, since they were a target group that is more likely to change their habits.
Within this component, the Municipality developed a large range of activities such as
thematic conferences, playful activities, distribution of t-shirts and video competition. In total,
over 1000 students from seven schools took part in these activities.
Field 2: Pedestrian Circulation Campaigns (2009 – 2012) The pedestrian mobility
campaigns consisted of a ”City Treasure Hunt” in which the participants were invited to
(re)discover their city by walking in a playful way. In total eight events were conducted (2 per
year) and over 1500 citizens have participated.
Field 3: Public Transport Campaigns (2010 - 2011) The public transport campaigns sought
to promote among the population the environmental and economic advantages of using bus
on a regular basis. For that purpose, conferences were organised and three editions of the
“Get Around in Funchal by Bus” activities were carried out. 400 people participated in this
activity.
Field 4: Eco Driving Campaigns (2010 - 2012) Besides the training campaigns for both
Municipality fleet drivers and bus drivers (an activity described in detail in FUN 6.1) ,
workshops which addressed citizens were carried out, aiming to familiarize them with the
advantages of eco-driving as a driving practice that aims at reducing fuel consumption and
pollutants emissions.
During each of those several campaigns, handouts, leaflets, posters and several
merchandising items such as pens, pendrives and t-shirts were distributed. During the
diverse campaigns, the yearly European Mobility Week was promoted as well.
Due to the fact that the awareness campaigns mainly worked as a social driver, those
actions should be carried out regularly, even beyond MIMOSA life span and its impacts
should be measured continuously.
The evaluation was mostly focused on surveys to assess the various components of this
measure. The impact evaluation was based on indicators related with eco-driving, modal
split, pedestrian campaigns and mobility habits of students.
Measure title: Awareness Raising Campaign for Sustainable Mobility
City: Funchal Project: MIMOSA Measure number: 4.1
The key-results of the evaluation showed that the measure was successful since its main
goals were achieved. For instance, 1500 people participated in the eight events organized in
the frame of the pedestrian campaign. The eco-driving habits were improved, since
according to the surveys carried out during 2010 and 2011, the participants stated that they
would be familiar with eco-driving, perceiving eco-driving as a way of saving fuel (31,4% in
2010 and 31% in 2011) and saving CO2-emissions (46,8% in 2010 and 43,1% in 2011).
While all the components of the measure were innovative on the Island of Madeira, it was not
always easy to reach citizens, since one of the main barriers encountered was the lack of
tradition and some resistance of the residents to change their transport mode. Nevertheless,
as a main driver, most activities were innovative and attracted interest, through which
various target groups ranging from elderly people to youngsters/students could be reached.
One of the most significant successes of the measure was the campaign focused on public
transport acceptance "Get Around in Funchal by Bus". This campaign can be easily
replicated in other cities since it is simple to organize, it is innovative and affordable and it
creates a synergy among schools and environmental associations enabling a large audience
to be reached. In the frame of MIMOSA project, the campaign was already successfully
replicated in the city of Tallinn (see TAL 4.1 – ‘Mobility Management and Marketing Activities
Directed at Popularising Usage of Active Transport Modes’). This showed the importance of
sharing and exchanging ideas and experiences on methods to involve citizens and raise
awareness towards behaviour change.
Overall, most activities carried out revealed a high degree of satisfaction from participants
and showcased the importance of developing similar actions in the future. The school
mobility campaign, for instance, contributed largely to communicate sustainable mobility
issues to students. Both the pedestrian campaign and the public transport campaign played
a significant role in raising citizens’ awareness of sustainable mobility due to the innovative
and attractive approach applied. The high rate of participation highlighted the success of the
measure and convinced the Municipality to continue its efforts to encourage public
participation for a better urban mobility in Funchal.
A Introduction
A1 Objectives
The measure objectives are:
(A) High level / longer term:
• Increase the modal split towards more sustainable modes;
• Improvement of quality of life.
(B) Strategic level:
• The purpose of this measure is to disseminate among the population the
concept of sustainable mobility as a new perspective, and raise awareness of
the individual's role in contributing to a better environment.
(C) Measure level:
• To develop eco-driving skills among the general population;
• To advertise and promote the city areas dedicated and reserved for
pedestrians, i.e, the roads closed to car traffic and parks, through the
organisation of orienteering competitions, for all ages and physical conditions,
in the city centre;
• To promote sustainable mobility habits among students.
• Promote the advantages of using public transports.
A2 Description
The improvement of family income and the infrastructural development that occurred in the
last decade in Madeira´s Autonomous Region sharply changed mobility patterns, creating
new and complex mobility needs and putting strong pressure on the territory due to urban
expansion. Due to this fact, there was an increase in the number of cars and a rise in
pollutant emissions. Public transport has been suffering continuous losses of passengers
over the last few years, so in order to counter this trend, awareness campaigns were
developed among younger people.
In order to prevent a further increase of pollutant emissions and other environmental
consequences, the Municipality established this measure to reduce individual transport use.
It aims at raising awareness of the citizens of the importance of sustainable mobility through
various activities that include eco-driving campaigns, public transport campaigns, pedestrian
circulation campaigns and a mobility management project aimed at schools.
According to the Mobility Study for Funchal, 49.000 vehicles enter the city every day. Due to
this fact, it’s essential that the population is aware of the importance of adopting an
ecological driving style, in order to reduce emissions, improving, therefore the quality of life in
the city.

B Measure implementation
B1 Innovative aspects
While the measure does not feature any type of technological achievement, it was indeed
innovative in the definition of the campaigns. Prior to MIMOSA, specific campaigns on
sustainable mobility were nonexistent. One approach specifically targeted awareness of the
problems arising from the intensive use of the automobile. Additionally, the campaigns carried
out in schools were also innovative for Madeira.
• New conceptual approach (Regional and city level) – Development of
awareness campaigns that promote new perspectives to address mobility issues
with a focus on benefits for users to adopt more environmental and cheaper modes
of transport
• Targeting specific user groups (Regional and city level) – Development of
awareness campaigns among young people, appealing to their inherent desire for
environmental protection.
• New organisational arrangements or relationships (city level) – Establishment
of new relationships between organizations creating mechanisms aiming at the
same common goal.
B2 Research and Technology Development
The Mobility Study (2007) revealed that individualised transport is the most popular type of
transport among citizens, which outlines the necessity to develop campaigns in order to raise
awareness for public transport, walking and bicycle.
For this measure, the study indicated above served as a basis for the following studies to
outline all goals in a more specific way. Since youngsters were one of the main target group,
the first study that was carried out focused on the modal choices of students in the schools in
which the campaigns were developed. The Mobility Study revealed that home-school-home
travel appears as a second priority in daily commuting (11%), being one of the main traffic
generators. In particular, the first study to analyze the modal split conducted in schools,
revealed that 51% of students uses individual transport as opposed to 32.6% of students who
reported using public transportat.
The studies conducted also revealed that there are very deeply held beliefs in terms of
transport choices, such as owning a car provides the driver with a higher social status, while
using public transport is associated with much less favored social classes. For these reasons,
it is very common among young people to desire to own a car. In order to change the negative
perception of the bus by young people and adults a new concept of awareness campaign was
developed, namely the “Get Around in Funchal” activity. This campaign combined both
walking and bus.
In terms of individual transport, awareness campaigns to promote eco-driving were developed,
geared primarily for driving schools, Municipality drivers, public transport operators, taxi
drivers and trainers in driving schools. In order to further surpass the objectives outlined,
MIMOSA played an important role in the organization of the European Mobility Week in
Funchal, marking, in 2009, the first participation of the City in this event. This important
awareness campaign for sustainable mobility contributed for the development of various
activities that were important to promote these issues among the population.

B3 Situation before CIVITAS
According to the mobility study in Funchal, in 2007 only 16,5% of the trips made were done by
foot, while the trips made using Individual motorized Transport corresponds to 51,8%.
The following graph indicates the types of transports that are mostly used, according to the
mobility study. As for the Public Transport, 31% uses the Public Transport, while a small
percentage uses individual transport combined with public transport and other types of
transport.
Graph 1 –Modal split, according to the Mobility Study for Funchal (2007)
Due to this fact, traffic congestion is very prevalent in several parts of the City, namely in the
City Centre at several times of the day. In the morning, the main access roads exceed,
sometimes, their capacity, causing severe congestion that also affects PT efficiency. In the
whole city, there are more immobilized vehicles in the streets than authorized places for
vehicles. This situation leads to illegal parking both day and night. The dependence on the
automobile is well noticed especially if we look at graph 1. This fact shows a tendency that
continues to expand, in which the motorization rate increased until 2010. Due to the traffic
increase, it is important that habits and behaviour be changed, especially the importance of
increasing pedestrian circulation.
The Municipality of Funchal has developed a strategy of closing core streets to vehicle
circulation (see measure 3.1) and constructing and creating more leisure areas in the city,
which will support the promotion of pedestrian activity to be developed under this measure.
Orienteering was selected as it is considered a sport that is perfectly accessible to all,
independent of the age group or fitness level and can be practiced individually or in groups,
encouraging, therefore, both the exploration of the city and the promotion of pedestrian
circulation. As for mobility campaigns in schools, it will be the first time that a mobility
management project will be implemented in Funchal schools.
B4 Actual implementation of the measure
There are several different activities within this measure. Besides promoting pedestrian
mobility, this measure also highlights the benefits of public transportation use, eco-driving,
pedestrian circulation campaigns and mobility in schools. The Municipality of Funchal has
developed the following events:
1. School mobility manager campaign: Various activities were carried out throughout
2010-2011 and 2011-2012 school year;
2. Pedestrian circulation campaigns: 8 orienteering campaigns were carried out;
3. Public Transport Campaign: The Municipality carried out 3 events dealing with public
transport: “Get around in Funchal by bus”;
4. Eco Driving campaigns: Many activities were completed, such as an eco driving
16,5%
51,8%
31,0%
0,2% 0,4%
Foot IT
PT IT+PT
Other
training and awareness campaign, 7 eco-driving workshops and an eco driving race;
5. Other activities: oriented towards sustainable mobility, the activities include important
regional events, such as the participation intwo expo-madeira exhibitions, II,III and IV
expo-energy, and Mobility Week 2009, 2010, 2011 e 2012.
1. School mobility manager campaign
Stage 1: Campaign conceptional approach (October 2009 to March 2010) - The aim of this
campaign was to to integrate the sustainable mobility concept in some schools , in order to
make the youngsters aware of possibilities ofchanging their mobility habits and how to acquire
mobility skills. With this activity we expected to provide the students with all the information
and adequate plans regarding their daily travel needs (home-school-home), in order to
improve their mobility and road safety.
Stage 2: Preparation of the study of the campaigns to be carried out in schools
(September 2009 to January 2010, September 2011 to October 2012) - During this stage,
several data was collected in the city of Funchal, in which schools were selected for the
campaigns. The choice of the schools for the implementation of the project ranged from basic
school to highschool, including 5 public schools and 2 private schools strategicaly located in
the traffic area. Overall, 1.100 students participated in the project. To evaluate the students'
mobility patterns, a survey was conducted in these schools in order to further collect data,
regarding the student´s transport choices (home-school and school-home).The definition of
the school campaigns were in agreement with the Municipality´s policy of improving not only
the knowledge level regarding sustainable mobility, but also promoting sustainable mobility
habits among youngsters so that they can play a more active role in the community. Thus, the
project implementation includes various activities, such as the development of travel plans,
analysis of travel diaries and awareness activities. With these activities, it was expected to
reduce pollutant emissions and traffic circulation in the area and encourage modal shift, multi-
modal urban trips and the use of public transport among students. During this stage, a survey
was designed to gauge the modal split among students. The results can be seen at below in
Table C1.1: Indicators.
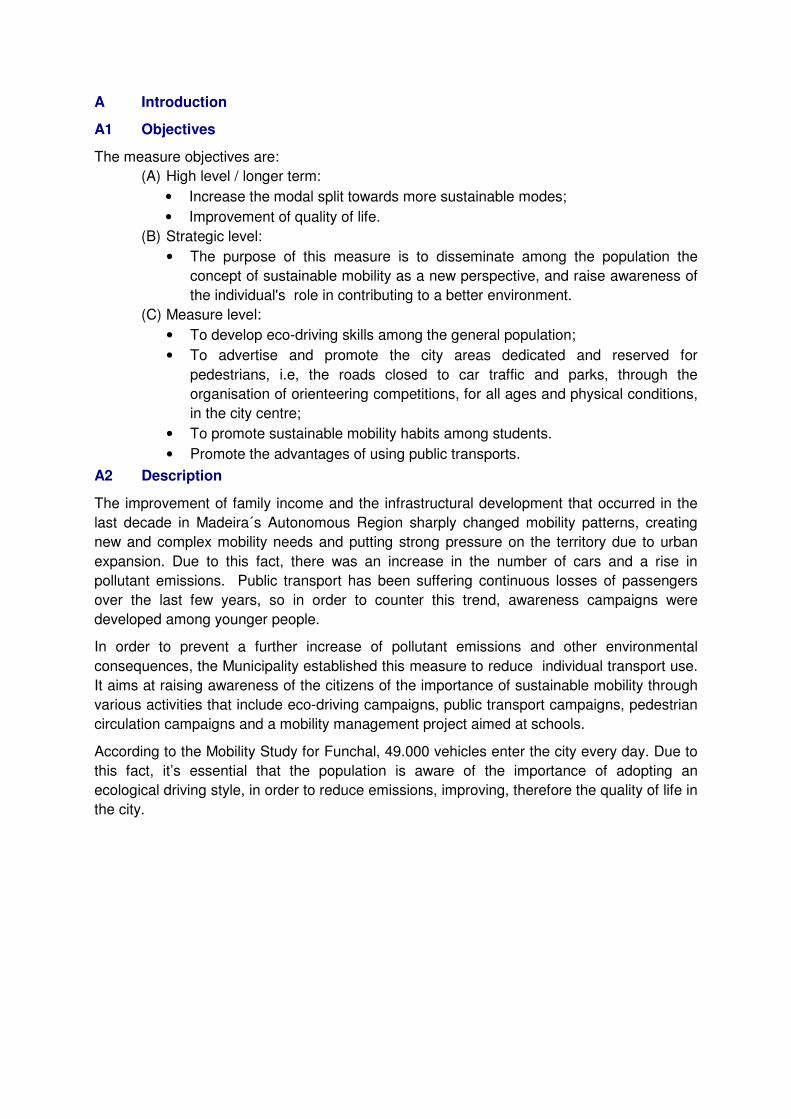
Stage 3: Development of materials to support school campaigns: (From September 2009
to March 2012): During this period, several items were produced such as pamphlets and
posters to spread information about the benefits of public transport among students.
Additionally, various merchandising items were produced such as keyrings, t-shirts and pens.
All the materials were handed out to students and teachers during the activities.
Figure 1: Some promotional materials for the school campaigns
Stage 4: Establishment of partnerships with schools (October 2009 to January 2010):
Meetings were established with schools to disseminate the project, which were supported by

the government department that is responsible for school management in the Region. These
meetings allowed both the school and the Municipality to agree the activities and actions to be
carried out in the schools. The function of the mobility manager is to promote sustainable
mobility, such as the use of public transport as well as meet with the heads of each school to
devise measures to improve school mobility. The role of the mobility manager is to promote
sustainable mobility, namely the use of public transport, and meet, on a regular basis, with all
schools in order to draw strategies to improve mobility in schools.
Stage 3: Effective implementation at schools (November 2010 to July 2012): The first step
in the project implementation consisted of a survey that was oriented towards all the students
that participated in the mobility project. The activities and awareness campaigns were
proposed to the seven schools included in the project through the teacher appointed as
mobility manager, where a set of activities and actions were presented, allowing them to
choose the ones that best suited their interests and student age ranges, all within an adequate
pedagogical slope.
Numerous activities were held in schools, namely lectures on the subject of sustainable
mobility, orienteering paper and contests for developing and creating a poster and a t-shirt for
sustainable mobility, among other activities. The lectures on sustainable mobility were held in
the schools, oriented towards students between the ages of 10 to 18, covering about 630
youngsters.
The presentation was followed by an interesting debate between the speakers and the young
audience, in the course of which numerous questions were raised on PT service and urban
spaces managed by Funchal´s Municipality, where students were made aware of the logistics
and dynamic of the entities involved. The close contact between the younger population and
the entities responsible for mobility in the city, allowed a greater awareness and a better
understanding of the more complex measures that require a acceptance by the public.
Another activity carried out was a lecture on the subject: “I use Public Transport, I am
Independent” given by Psychologists from the Youth Support Office of the Funchal Health
Center. It covered about 100 students between 10 and 16 years old. The aim of this activity
was to convey to the young audience and consequently to their parents, the idea that the use
of PT grants them a certain degree of independence, thus constituting a source of
accomplishment and pride.
Among the reasons pointed out by students for not using PT is the fact that parents do not
perceive PT as safe or do not trust children to travel independently. Youth autonomy must be
worked out between parents and children. Responsible behaviours and mature attitudes will
make parents more confident about granting their children more autonomy, while
simultaneously fostering a balanced growth. Around 150 students between the ages of 11
and 15 participated in the orienteering Paper, answering questions related to the subject of
Sustainable Mobility, thus acquiring knowledge while pedestrian movement and physical
exercise were stimulated.
In five schools competitions were promoted between students and/or classes, to create a
poster, a T-shirt and a video raising awareness towards Sustainable Mobility, in which a total
of 200 students participated. The best works were awarded with prizes and distinguished. The
aim of this activity is to raise student awareness of the issue of Sustainable Mobility through
creativity. Not only do young people get the message easily, but they also constitute efficient
message disseminators, which in the future may prove vital towards effective sustainable
mobility.

2. Pedestrian circulation campaigns
Stage 1: Development of the campaigns (January 2009) – In this stage, we defined the
main goals to be achieved with the implementation of the pedestrian campaigns and the
prefered target groups.
Since pedestrian mobility has the potential to reduce the use of individual transport, and
especially given that the centre of Funchal is easily traversed in 15 min by foot, the City has
been adopting a policy of encouraging walking, through the closure of streets since the 90´s
and creating sidewalks.
For this purpose, the development of these campaigns focused more on the orienteering
campaigns to achieve the proposed goals. The main objective of these campaigns is to show
the participants that it´s fun, quick and easy to walk in the city, while (re)discovering some of
the city´s heritage and natural landmarks. With these campaigns it was expected to show that
it is possible to raise pedestrian mobility, and reduce individual transport use.
In order to support the achievement of these events, the Municipality hired a team specialized
in organizing orienteering campaigns, that, along with the Municipality team, developed the
most suitable strategy. One of these strategies was, for example, the conduction of a CO2
emissions test that was carried out among the participants of one of the orienteering events.
This test was based on the participant´s travel diaryroutines (house-work/school-house), and
the type of vehicle used.
Stage 2: Elaboration, design and production of the supportive materials that were
handed out to participants (throughout MIMOSA lifespan) – For each of the orienteering
event, various materials were developed to raise awaress, including flyers, billboards,
postcards, and others.
Stage 3: Preparation of an evaluation survey campaign (June 2009) – a survey was
conducted to collect all the data necessary for evaluation of the measure, namely to assess
awareness of CIVITAS MIMOSA , sustainable mobility, pedestrian habits, modal split and
participant´s mobility.
Stage 4: Promotion of the orienteering campaigns (July 2009, December 2009, July 2010,
September 2010, July 2011, September 2011, June 2012 and September 2012) – The
campaigns were promoted through various ways, such as the Municipality´s website, local
press, posters, facebook and through e-mail.
Image 2 – Some promotional materials of the orienteering campaigns
Stage 5: Orienteering campaign (July 2009, December 2009, July 2010, September 2010,
July 2011, September 2011, June 2012 and September 2012) – Two orienteering

competitions were organised each year, giving a total of 8. The orienteering competitions are
activities in which the participants have to explore in the city, using maps to establish a quick
route.This type of event gathered people from all ages, mainly composed by families or large
groups of friends. The test to measure the CO2 levels proved to be an important awareness
tool for the participants, especially for the participants that use the car regularly. Furthermore,
they could find out how much CO2 emissions they would reduce if they use the bus more
often or shared their vehicles. Some of the events were supported by public exhibitions,
whose focus was to promote advantages of pedestrian mobility, bike use, public transport,
eco-driving. Furthermore, the MIMOSA Project was also a focus of these exhibitions, as well
as less pollutant vehicles that were publically displayed.
Apart from the above, leaflets and other merchandising items were given out among those
who participated in the events. In the eight events, 1500 people from all ages participated in
the orienteering campaigns, which showcase the success of these events. Also, at the end,
the best participants were awarded with trophies (according to their age and participation
level), and raffles were usually conducted among all participants, in which bikes, book
collections and other prizes were raffled.
Image 3 – Picture of one of the orienteering campaigns
Stage 6: Survey conduction (July 2009, December 2009, July 2010, September 2010, July
2011, September 2011, June 2012 and September 2012) - To gather a better insight of the
public attitude towards the transport system and sustainable mobility issues, a survey was
conducted among all participants in the first event and the seventh event, aiming to obtain
several indicators such as:
- level of knowledge about CIVITAS MIMOSA
- Sustainable Mobility knowledge
- Pedestrian circulation habits
- Types of transport most often used
- Participant’s mobility and its habits
3. Public Transport Campaign
Stage 1: Conception approach (January 2010 to June 2010): The main goal of this
campaign is to promote public transport use and raise awareness of its environmental, social
and economic advantages. For that, an innovative concept was created, entitled “Get Around
in Funchal by bus”, where the challenge was to complete, in the shortest possible time, a
previously defined route using only public transport and walking. This event is a way to
demonstrate citizens ability in using the public transport systemand to showcase public
transport as a friendly and convenient mode of transport.

Stage 2: Design of materials to support the campaign of public transport (April 2010 to
August 2010): Several materials were designed to support the public transport campaign,
such as posters, flyers. Besides the communication materials, the participants themselves
were given a map containing the location of the control points, a t-shirt, the bus timetables,
and a quiz focusing on sustainable mobility and MIMOSA in general.
Image 4 – Promotional material for the “Get Around in Funchal” event
Stage 3: Public transport promotion campaigns (September 2010, September 2011 and
September 2012) – The campaigns were promoted through various tools, such as media and
posters.
Stage 4: Implementation of “Get Around in Funchal by bus” (September 2010,
September 2011 and September 2012) – This initiative took place in Funchal, during
European mobility week (2010, 2011 and 2012) aiming to promote a more regular use of
public transport and to inform the participants of its environmental, social and economic
importance. The “Around in Funchal by bus” activity consisted in completing, in the shortest
time possible, a path, using as a mode of transport the bus or walking.
More than 500 citizens, especially youngsters, took to the streets of Funchal using public
transport. Citizens who use public transport often tend to stick to the same route or use it on
an infrequent basis. Participants were tested on new routes, giving them an insight into how
quick and useful public transport can be to travel to other parts of the city. Those who don’t
use public transport service, on the other hand, were challenged to just give public transport a
go. There were plenty of smiles on faces when the best navigators won a vast array of prizes:
free six month public transport passes, bicycles, local mobility books, DVD’s, and other prizes.
A pattern analysis was made, regarding the participants' choice of routes. The majority of
people opted to choose the most central areas, such as the main Hospital, and the shopping
centre located in the western side of the Municipality, which is also served by the new bus
lane “Green Line”, a CIVITAS MIMOSA measure demonstrating the high degree of knowledge
that people have regarding this bus lane.
Image 5 – Some pictures from left to right (analyzing maps, team photo, prizes)
4. Eco Driving campaigns

The development of eco-driving campaigns focused on 3 stages. In the first stage, the best
approach was studied to outline the objectives of the measure. After this stage we designed
all necessary materials to support the campaigns. The last stage consisted of the effective
implementation during the mobility weeks (2010 and 2011). The European Mobility Week was
used as the background to implement these campaigns, since it could reach a wider audience.
Stage 1: Design of eco-driving campaigns (October 2009 to November 2009) – With these
campaigns, the main target group was to reach students of driving schools and ordinary
citizens. Thus, the strategy that was chosen to publicize the benefits of eco-driving consisted
of workshops during Mobility Week (2010 and 2011).
Stage 2: Design, production and printing of materials to support campaigns (January
2010 to August 2010) – At this stage, a graphic layout was made for these marketing
campaigns, namely leaflets, posters, webpages and facebook page.
Stage 3: Implementation of eco-driving campaigns (September 2010 and September
2011) – 8 workshops were promoted about eco-driving, aiming to make citizens aware, that it
is important to adopt a more ecologic driving behaviour. While assisting these workshops, the
participants found out the level of their pollutant emissions, by filling a small survey. The
participants could also test their eco-driving knowledge in a simulator and obtain a score. This
event contributed to the diffusion among the population of a method of driving in a more
sustainable way. A survey was used to evaluate the eco-driving knowledge.
Besides the workshops and the exhibition of awareness videos, a race was organized. The
drivers that participated in the race were well known persons from our city. The participants
had to drive through several roads in Funchal in pairs. The main goal of this activity was to
promote eco-driving, using the media to disseminate its benefits among the population.
Aiming to understand the benefits of more ecological driving, the participants had to overcome
several obstacles, putting in practice the eco-driving rules, in order to reduce CO2 emissions
and fuel consumption. Besides participating in the race, all participants had to answer an eco-
driving quiz and perform an alcohol test.
5. Other campaigns
5.1 – European Mobility Week (September, 2009, 2010, 2011, 2012)
Since 2009, Funchal´s municipality organized Mobility Weeks which were the most important
events to promote Sustainable Mobility, through several activities that were developed.
Several activities were launched such as less pollutant vehicles exhibition (hybrid and
electric), conferences, street awareness campaigns, launch of the first bicycle track, among
other events, that caused a positive and important impact, regarding the sustainable mobility
issues.
5.2 – Expo-Energy Funchal (June of 2010, 2011 and 2012)
The expo-energy was yet another initiative organised by Funchal´s Municipality, that aimed at
promoting the latest technological innovations in terms of renewable energies (such as solar
powered ovens and other type of equipment). Also, several vehicles were displayed, such as
electric and hybrid automobiles, segways and electric scooters. The event also included
several environmental awareness activities, such as seminars, films and conferences.
MIMOSA was also a focus of these event, through conferences and exhibitions.
5.3 – Expomadeira Edition (July of 2010, 2011)

Expo Madeira, the main Economic Activities Exhibition of Madeira, takes place at Madeira
Tecnopolo in Funchal annually, from 9-18 July. With access to large numbers of the business
community and public all in one place, CIVITAS Mimosa Funchal took the opportunity to
promote itself with a stand in 2010 and 2011. The presence at the trade exhibition turned out
to be an important way to disseminate the project, since this event is the biggest regional
dissemination platform of products and services. According to the company that organized this
activity, more than 80.000 people/per year attend the event, from all over the island. The
overall aim was to make citizens and businesses aware of just how much atmospheric
pollution and overcrowding, caused by heavy traffic volumes in the city, can be easily
prevented with the help of the people, business and new measures being introduced in
Funchal. Visitors were able to see and hear for themselves about the negative effects on their
health and local environment along with the urgent need to put into practice more sustainable
mobility behaviour, thanks to the role played by the members of the CIVITAS Mimosa Funchal
Team who demonstrated how easy it is to create a better environment and increase one’s
quality of life, simply by using less pollutant transport.
Several merchandising items were given away such as pens, key chains, bike reflectors and
sunflower seeds. Also pamphlets were distributed to passers by about Eco Driving, Green
Tariffs and CIVITAS Mimosa. Participation in the Expo also proved to be a good way to
evaluate peoples’ knowledge about the CIVITAS MIMOSA project in Funchal. A survey was
used to check their perception of the overall project and the importance given to the projects’
measures. In order to draw people´s attention, several prizes were raffled, including
conventional bicycles and electric bicycles, in which surveys were also conducted among
attendants. Expo Madeira served as a great way to collect surveys, since it is one of the most
important events in Madeira, regarding the divulgation of new products and companies. The
questions used in the survey referred mainly to the respondent´s mobility patterns.
5.4 – Other campaigns carried on by local partner – transport operator Horários do
Funchal (September of 2010 and August of 2012)
In September of 2010, “Horários do Funchal” purchased professional photographs to enhance
specific campaigns so as to give a boost to public transport. In addition to this, the PT
Operator announced during Mobility Week a new fare menu, including an annual pass. This
campaign already included one of the new photographs. Also, during this month, “Horários do
Funchal” subcontracted an upgrade of the ticketing system to introduce a new ticket, the
annual pass. This activity intended to promote customer loyalty. In August of 2012, Horários
do Funchal launched a communication campaign dedicated to students, to promote the
purchase of the monthly pass during holiday time.
B5 – Inter-relationships with other measures
The measure is related to other measures as follows:
Measure 1.2 – Electric and hybrid vehicles: One main goal of this measure is to
raise public awareness regarding the benefits of electric vehicles. The awareness
campaigns conducted in this measure also aimed at promoting the benefits of less
pollutant vehicles.
Measure 2.1 – FUN Green PT Line: The Green Line is a public transport service of
high frequency that covers the western part of the city. One of the goals of FUN 4.1 is
to increase the use of public transport including the Green Line.
Measure 6.1 – Eco-Drive in large fleet: The Municipality and Horários do Funchal
(local partner) have been developing awareness campaigns on eco-driving, oriented
towards drivers, bus drivers, and citizens in general. Measure 6.1 is related to one of
this measure component´s (eco-driving). Nevertheless, the target groups are different.
Covenant of Mayors: The inclusion of Funchal in the Covenant of Mayors1 and its
subsequent SEAP (Sustainable Energy Action Plan) were an important step towards
sustainability. This action plan has the goal to reduce CO2 emissions by 20%, by 2020,
, integrating measures that promote eco-driving, increase the use of public
transportand pedestrian mobility, among other measures in the sustainable mobility
field.
Road prevention Project: Not directly related with CIVITAS, the Municipality of
Funchal is also promoting other activities, such as road accident prevention and
environmental campaigns that are developed by the Educational Department. Local
authorities are also responsible for the development of several actions, such as “safe-
school” project which is aimed towards all students.
European Project “Eco-Schools”: This project has also been successfully
implemented in several regional schools. This project, aimed towards environmental
education, has proved to be very efficient, since 21 regional schools have been
awarded for their good practices. Promoting public transport is also a goal.
C Impact Evaluation Findings
C1 Measurement methodology
C1.1 Impacts and Indicators
1 The ‘Covenant of Mayors’ is a European Commission (DG ENER) initiative to go beyond the EU 2020 energy targets. By signing the ‘Covenant’, mayors of
cities and local authorities commit themselves to developing a sustainable energy action plan which will set out the way to achieve their goals. These goals are to
decrease the CO² emissions by more than 20%, and to increase the use of renewable energy and energy efficiency, compared to a baseline emission inventory
scheme. In order to carry out the sustainable energy action plan the city can apply for funding and technical assistance.

Table C1.1: Indicators
No. Impact Indicator Data used Baseline data
1
Awareness
level
Sustainable mobility awareness
level (POINTER core indicator –
no. 13)
PT Operator and the Municipality have collected
this data through a survey carried out at Expo-
Madeira event.
No data collected before the implementation
2 Awareness of dissemination tools
(city specific indicator)
Information collected by the Municipality
This indicator refers to the number of articles
produced by local media, facebook statistics and
website articles
No data collected before the implementation
3 Modal split
Percentage of travellers using a
particular type of transportation (
POINTER core indicator – no. 26))
Data provided by the Municipality The baseline data available is from 2007, “mobility
study”.
4 Acceptance
Willingness of citizens to use
sustainable modes of transport in
future)
POINTER core indicator – no. 14)
Data collected through a survey carried out
during the Expo-Madeira event No baseline data
5
Transport
modes used by
students
Transport modes used by students
in school-home trips (city specific
indicator POINTER core indicator
– no. 28)
Information collected by the Municipality through a
survey carried on schools
Collected during the beginning of 2010-2011
school year (sample size of 1182 students).
6 Acceptance of
eco-driving
skills
Eco-driving usefulness level
(pointer no. 13) Information collected by the Municipality through a
survey carried out at expo-madeira event
Collected in July, 2010 with a sample size of 610.
The surveys were carried out using a random
process and mostly face-to-face. 7
Eco-driving golden rules
application
8 Acceptance
Usefulness of pedestrian
campaigns
(POINTER core indicator – no. 14)
Information collected by the Municipality through a
survey carried out at expo-madeira event and
during the 2012 European Mobility Week
Collected in July, 2010 with a sample size of 610.
The surveys were carried on using a random
process and mostly face-to-face.
Given the fact that this measure focuses on four major campaigns (Pedestrian, public
transport, eco-driving and school mobility management), it is necessary to describe in detail
each of the indicators and methodology for its collection. Between the two measurement
periods for each one of the indicators several campaigns to promote sustainable awareness
were developed.
• Indicator 1 - (Measure acceptance level) – Results were obtained through the Expo-
Madeira survey. The target groups were the visitors of the Expo-Madeira. The question
used to assess this is “are you aware of the term Sustainable Mobility? If yes, what
does the term mean to you”. Collected in July, 2010 and in July of 2011. In 2010 the
sample size was 679 people while in 2011, the sample size was 763. The surveys were
carried on using a random process and mostly face-to-face. The target group covered a
wide range of people, ranging from students to elderly people and company
representatives.
• Indicator 2 - (Awareness of dissemination tools) – This indicator was assessed by
counting the number of news items in regional press and number of hits in the mobility
and transports website.
• Indicator 3 - (Modal Split) - Percentage of citizens that uses the modes of transport
(private car, bus, bicycle, walk and motorcicyle) – This data was also collected at Expo-
Madeira. The methodology is based on specific surveys carried out by the municipality
(in 2010 and in 2011) during Expo Madeira, a regional exhibition fair. Collected in July,
2010 and in July of 2011. In 2010 the sample size was 679 while in 2011, itwas 763.
The surveys were carried out using a random process and mostly face-to-face. The
target group covered a wide range of people, ranging from students to elderly people
and company representatives (indicator is bundled with FUN 6.2, but was handled in a
different way, only referring to citizens that live and work in Funchal).
• Indicator 4 - (willingness to use the modes) – Percentage of citizens that are likely to
change their mobility habits in the future. This data was collected in Expo-Madeira in
2010 (July) and 2011 (July).
• Indicator 5 - (Transport modes used by students) – This indicator refers to the transport
modes used by students in school-home trips. It was collected in schools, in two
different school years (2010-2011 and 2011-2012).
• Indicator 6 - (eco-driving usefulness level) – This data was collected in Expo-Madeira
in two periods. The question used to assess this indicator was “how useful are eco-
driving campaigns for you?”.
• Indicator 7 - (eco-driving golden rules application) - This data was collected in Expo-
Madeira in two periods (2010 and 2011). The question used to assess this indicator was
“what does eco-driving mean to you?”.
• Indicator 8 (Pedestrian campaigns usefulness) – This data was collected in Expo-
Madeira in 2010 and during the European Mobility Week (2012). This indicator was
used to assess the level of usefulness perceived by the population regarding the
pedestrian campaigns that the Municipality carried on during MIMOSA.
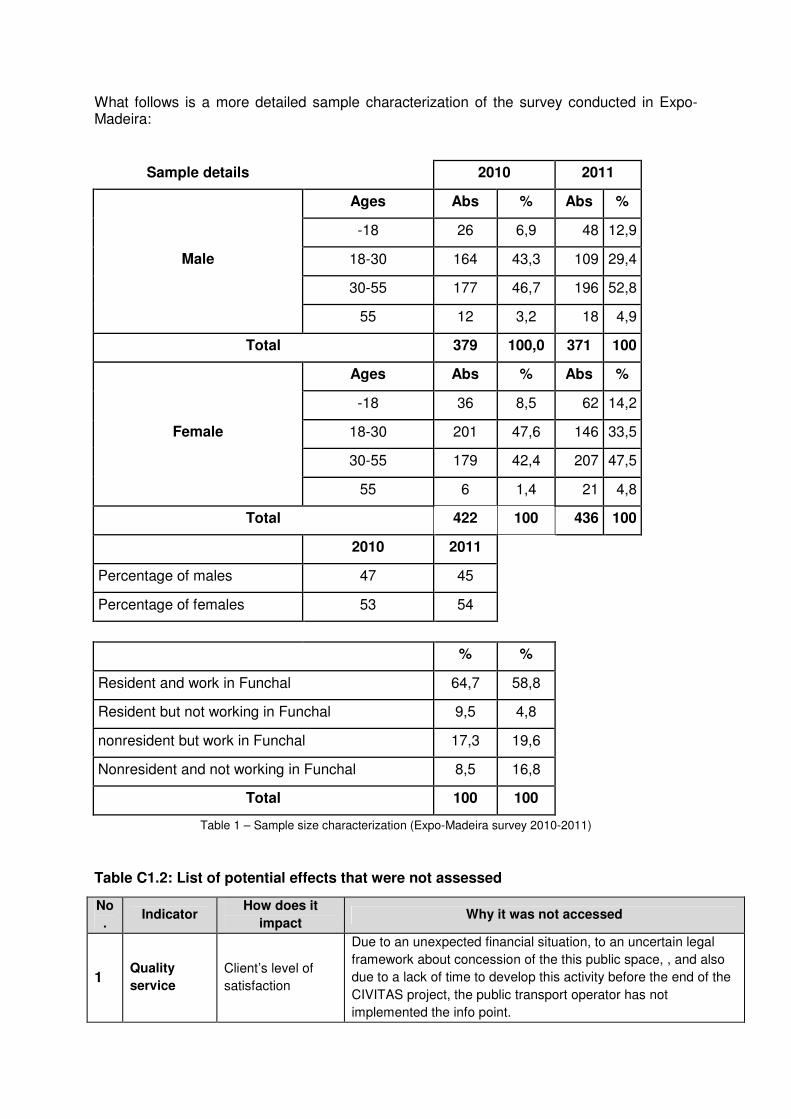
What follows is a more detailed sample characterization of the survey conducted in Expo-Madeira:
Sample details 2010 2011
Male
Ages Abs % Abs %
-18 26 6,9 48 12,9
18-30 164 43,3 109 29,4
30-55 177 46,7 196 52,8
55 12 3,2 18 4,9
Total 379 100,0 371 100
Female
Ages Abs % Abs %
-18 36 8,5 62 14,2
18-30 201 47,6 146 33,5
30-55 179 42,4 207 47,5
55 6 1,4 21 4,8
Total 422 100 436 100
2010 2011
Percentage of males 47 45
Percentage of females 53 54
% %
Resident and work in Funchal 64,7 58,8
Resident but not working in Funchal 9,5 4,8
nonresident but work in Funchal 17,3 19,6
Nonresident and not working in Funchal 8,5 16,8
Total 100 100
Table 1 – Sample size characterization (Expo-Madeira survey 2010-2011)
Table C1.2: List of potential effects that were not assessed
No
. Indicator
How does it
impact Why it was not accessed
1 Quality
service Client’s level of
satisfaction
Due to an unexpected financial situation, to an uncertain legal
framework about concession of the this public space, , and also
due to a lack of time to develop this activity before the end of the
CIVITAS project, the public transport operator has not
implemented the info point.

2
School
Mobilization
No. of students
and schools
involved in school
mobility manager
campaign
This indicator was not the best way to measure the campaign´s effectiveness. Therefore, it was removed and replaced by a different indicator related to the student´s modal split.
C1.3 Establishing a Baseline
C1.4 Building the Business-as-Usual scenario
Since the measure is innovative in every aspect, and works mainly on a social level, a BAU analysis is not appliable for all indicators.
Indicator BAU assumptions
No. Impact Indicator Baseline data
1 Awareness
level
Sustainable mobility
awareness level No baseline data for this indicator
2
Awareness of
dissemination tools No baseline data for this indicator
3 Modal split
Percentage of travellers
using a particular type of
transport
According to the Mobility Study in 2007, the modal split
for Funchal´s citizens are:
Foot = 16,5%
PT = 31%
IT = 51,8%
IT+PT = 0,2%
Other = 0,4%
4
Willingness
to use the
modes
Willingness of citizens to
use sustainable modes of
transport in future
No baseline for this indicator
The survey carried out during the begining of the school
year 2010-2011 revealed that of all 7 schools, only the
students of two schools uses public transport more. The
students of other schools uses mainly individual
transport.
5
Transport
modes used
by students
Transport modes used by
students in school-home
trips
6 Acceptance
of Eco-
driving
skills
Eco-Driving usefulness
level No baseline for this indicator
7 Eco-driving golden rules
application No baseline for this indicator
8
Acceptance
of
Pedestrian
campaigns
Pedestrian campaigns
acceptance No baseline for this indicator

Indicator BAU assumptions
Sustainable mobility
awareness level No baseline data prior to the implementation
Awareness of dissemination
tools
No baseline data prior to the implementation
Percentage of travellers using
a particular type of transport
Although it was collected in 2007, the information gathered is not
sufficient to perform a BAU analysis .
Our perception is that despite fact that the campaigns have
contributed to increasing the use of more sustainable modes of
transport, there are other factors that have contributed to a
reduction in individual transport (decrease of occupancy of public
car parks, reduction in the number of vehicles and reduction in fuel
sales).
Willingness of citizens to use
sustainable modes of
transport in the future
No baseline data prior to the implementation
Transport modes used by
students in school-home trips No baseline data prior to the implementation
Eco-Driving knowledge level No baseline data prior to the implementation
Eco-driving golden rules
application No baseline data prior to the implementation
Pedestrian campaigns
acceptance No baseline data prior to the implementation
C2 Measure results
Indicator 3 – Modal Split
The data for this indicator was collected during the Expo-Madeira event on two occasions:
July of 2010 and July of 2011. According to the graph below, despite the fact that the modal
share remained the same, there was a decrease in the percentage of people using their own
car (-6,4 p.p ), and an increase in PT use (from 18,4% to 20,3%). Also, both walking (16,5%
to 17,9%) and cycling (0,6% to 1,8%) have gained a slight increase, which prove that
respondents, despite keeping the individual transport as their main type of transport, are
gradually changing their mobility habits. This change is also in agreement with the
willingness level that is assessed in detail below. There is a change in behaviour between
2010 and 2011. This shift indicates a reduced use of the car itself, a greater use of bus and
foot. In parallel, there is also an increase in motorcycle and bicycle.

Graph 2 – Modal split of participants that answered the survey in Expo-Madeira (2010 and 2011)
We have 6 categories, so the number of degrees of freedom is 5. For the table, for a
significance level of 0.05, the critical value is: 11.1. Since 31.91> 11.1, then we can reject the
hypothesis. Therefore, there is no change in the modal split between 2010 and 2011.
Indicator 4 – Willingness to change the modes
The surveys conducted in Expo-Madeira also assessed the willingness of the participants to
change their type of transport. As for the car use in the future, there was some noticeable
changes in both years results. Despite the fact that most respondents stated that they will
use the car with the same frequency as today, in both years, in 2011, there was an increase
of 3,8 p.p in the percentage of people that will use the car less. Also, there was a decrease in
the percentage of people who say they will use it more frequently (14,2% to 12,3%). We
have 3 categories, then the number of degrees of freedom is 2. For the table, for a
significance level of 0.05, the critical value is: 5.99. Because 6.39> 5.99, therefore, there is
no difference in intention to change car use between 2010 and 2011.
Graph 3 – Willingness to use the private car (Expo-Madeira survey - 2010 and 2011)
As for the bus use in the future, the surveys also revealed a positive improvement between
the two periods. There was an increase of 2,8 p.p in the percentage of people that will use
the bus more often. Moreover, the survey also revealed that fewer people will use the bus
less (14,2% answered, in 2011 that they will use the bus less, which is an improvement over
the results obtained in 2010). We have 3 categories, then the number of degrees of freedom
is 2. For the table, for a significance level of 0.05, the critical value is: 5.99. Since 26.97>
5.99, then thehypothesis shows there is no difference in intention to change bus use
between 2010 and 2011.
15%
42%
20%
3%
2%
18%
14%
49%
18%
2%
1%
17%
0% 10% 20% 30% 40% 50% 60%
Car (company)
Car (owned)
Bus
Motorcycle
Bicycle
Foot
Modal Split (2010-2011)
2011
2010
40%45,90%
14,10%
43,80% 43,90%
12,30%
0%
20%
40%
60%
80%
100%
Will use with less frequency than nowadaysWill use with the same frequency as todayWill use it more frequently
Willingness to use the private car
(2010-2011)
2010
2011
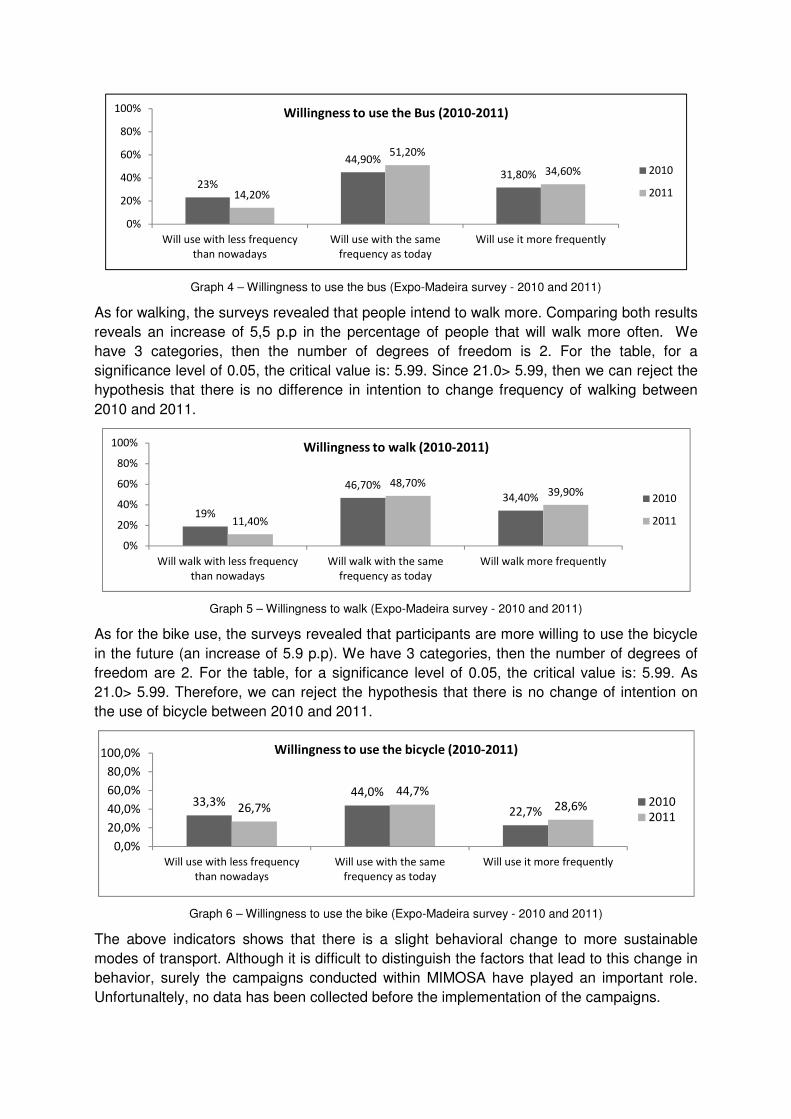
Graph 4 – Willingness to use the bus (Expo-Madeira survey - 2010 and 2011)
As for walking, the surveys revealed that people intend to walk more. Comparing both results
reveals an increase of 5,5 p.p in the percentage of people that will walk more often. We
have 3 categories, then the number of degrees of freedom is 2. For the table, for a
significance level of 0.05, the critical value is: 5.99. Since 21.0> 5.99, then we can reject the
hypothesis that there is no difference in intention to change frequency of walking between
2010 and 2011.
Graph 5 – Willingness to walk (Expo-Madeira survey - 2010 and 2011)
As for the bike use, the surveys revealed that participants are more willing to use the bicycle
in the future (an increase of 5.9 p.p). We have 3 categories, then the number of degrees of
freedom are 2. For the table, for a significance level of 0.05, the critical value is: 5.99. As
21.0> 5.99. Therefore, we can reject the hypothesis that there is no change of intention on
the use of bicycle between 2010 and 2011.
Graph 6 – Willingness to use the bike (Expo-Madeira survey - 2010 and 2011)
The above indicators shows that there is a slight behavioral change to more sustainable
modes of transport. Although it is difficult to distinguish the factors that lead to this change in
behavior, surely the campaigns conducted within MIMOSA have played an important role.
Unfortunaltely, no data has been collected before the implementation of the campaigns.
23%
44,90%
31,80%
14,20%
51,20%
34,60%
0%
20%
40%
60%
80%
100%
Will use with less frequency
than nowadays
Will use with the same
frequency as today
Will use it more frequently
Willingness to use the Bus (2010-2011)
2010
2011
19%
46,70%34,40%
11,40%
48,70%39,90%
0%
20%
40%
60%
80%
100%
Will walk with less frequency
than nowadays
Will walk with the same
frequency as today
Will walk more frequently
Willingness to walk (2010-2011)
2010
2011
33,3%44,0%
22,7%26,7%
44,7%
28,6%
0,0%
20,0%
40,0%
60,0%
80,0%
100,0%
Will use with less frequency
than nowadays
Will use with the same
frequency as today
Will use it more frequently
Willingness to use the bicycle (2010-2011)
2010
2011
While we know that behavior changes are not attributed to a single factor, we find that
campaigns for citizens play a role in changing behavior, though of course it is not the only
one. Another key factor is certainly the economic crisis and the increase of fuel prices.
Although no information has been collected, the perception that we have, is that in recent
months there has been a decrease in the use of individual transport. This trend is backed up
by a decrease in the number of vehicles circulating in the city, reduction in the fuel sales and
decrease in the occupation of parking lots.
Indicator 5 – Transport modes used by students
The survey consisted of only one question, specifically the type of transport used by students
to the following destinations: Home-School, and School-Home. The choices included
individual transport, bus, foot, motorcycle, bicycle, hitchhiking, or other.
The results are strongly influenced by many factors, such as the school's geographic
localization, the public transport regularity/offer, proximity to habitation areas, student’s age,
and others. The location of the school near a good public transport service are the most
important factors. Furthermore, the students that answered the survey were mostly
teenagers (16 years of age) being perfectly capable of using the BUS on their own. As
mentioned previously, the school campaigns were conducted in two school years. The
results are described for each year.
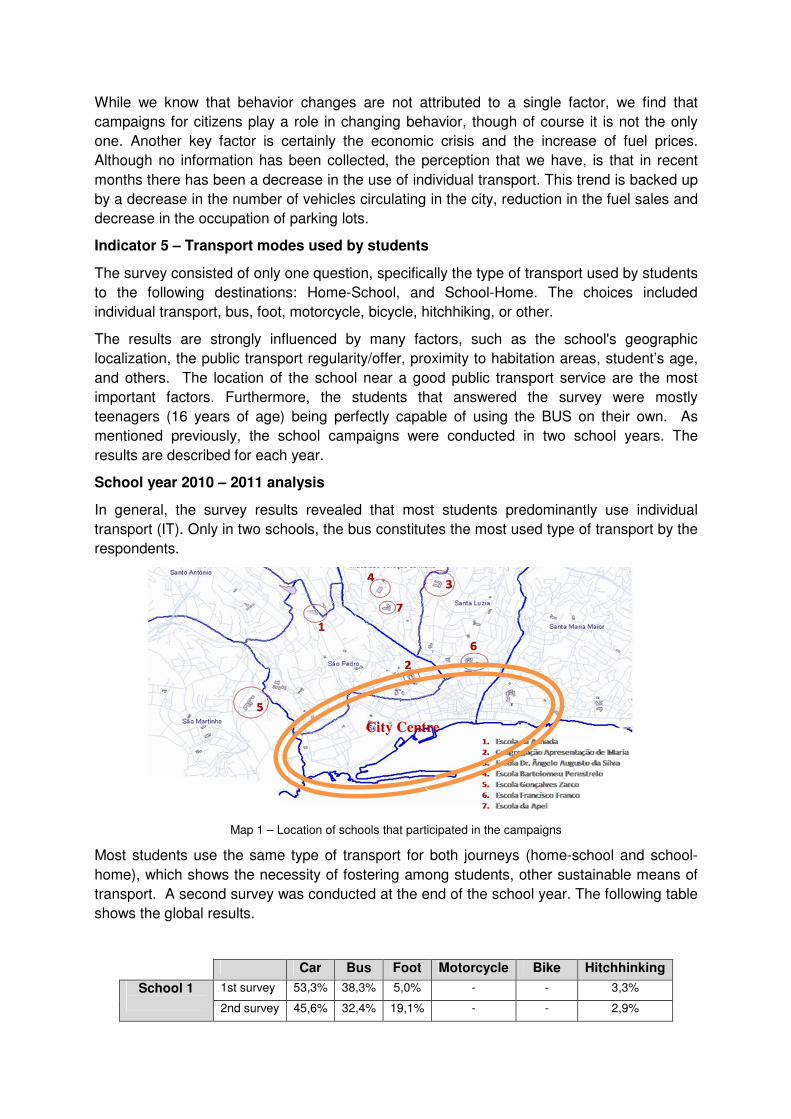
School year 2010 – 2011 analysis
In general, the survey results revealed that most students predominantly use individual
transport (IT). Only in two schools, the bus constitutes the most used type of transport by the
respondents.
Map 1 – Location of schools that participated in the campaigns
Most students use the same type of transport for both journeys (home-school and school-
home), which shows the necessity of fostering among students, other sustainable means of
transport. A second survey was conducted at the end of the school year. The following table
shows the global results.
Car Bus Foot Motorcycle Bike Hitchhinking
School 1
1st survey 53,3% 38,3% 5,0% - - 3,3%
2nd survey 45,6% 32,4% 19,1% - - 2,9%
City Centre

School 2 1st survey 74,5% 12,7% 9,9% - - 2,4%
2nd survey 76,4% 13,0% 9,6% - - 1,0%
School 3 1st survey 48,8% 16,7% 29,8% - - 4,8%
2nd survey 44,7% 18,4% 34,2% - - 2,6%
School 4 1st survey 64,3% 17,6% 16,2% 1,0% - 0,5%
2nd survey 62,7% 20,3% 17,1% - - -
School 5 1st survey 29,3% 53,3% 17,4% - - -
2nd survey 26,0% 43,3% 28,0% 2,7% - -
School 6 1st survey 27,5% 65,7% 6,4% - - 0,5%
2nd survey 29,3% 66,3% 3,3% - - 1,1%
School 7 1st survey 60,5% 24,1% 8,8% 2,2% 0,9% 3,5%
2nd survey 67,8% 19,7% 6,7% 3,8% - 1,0%
Table 2 – School results (school year 2010-2011)
We have 6 categories, so the number of degrees of freedom is 5. For the table, for a
significance level of 0.05, the critical value is: 11.1. Since 14.8> 11.1, then the hypothesis is
rejected since there are no changes in mobility behaviour between 2010 and 2011
(beginning and end of the school year).
The application of surveys to students in the end of the school year allowed a comparison of
results from the same survey conducted at the beginning of the school year.
In all schools the most widely used type of transport is IT, except for two schools (5 and 6) in
which the majority of the respondents uses public transport.
A comparison of the two years reveals that the results remained more or less the same.
Nevertheless, there was some increase in pedestrian circulation, namely in school 1, school
3 and school 5. There was also a slight increase in the percentage of students that started to
use the bus more often after the campaigns (schools 2, 3, 4 and 6).
School year 2011 – 2012 analysis
Due to the lack of human resources, the campaigns started in the middle of the school year.
Nevertheless 4 schools participated in the campaigns (schools 3, 4, 5, 6 and 7, according to
map 1). The surveys were conducted in the middle of the year and at the end.
The surveys were not conducted properly in 3 schools, due to the lack of availability from the
teacher and the lack of human resources that contributed to a late implementation of the
campaigns. The campaigns were also influenced by additional mobility activities
implemented as part of the overall project. This increased the difficulty of making
comparisons. Nevertheless, in 3 schools where the survey was conducted twice, there was a
positive improvement: in school 4 (decrease of car travel and increase in walking), school 6
(increase in walking) and school 7 in which most sustainable modes of transport increased (+
6.2 p.p in the use of bus and +12.6 p.p in walking). We have 6 categories, so the number of
degrees of freedom is 5. For the table, for a significance level of 0.05, the critical value is:
11.1. Since 31.2> 11.1, the change in mobility behavior of the students at the beginning and
end of the 2011-2012 school year is not significant.

2010-2011 | 2011-2012 Comparison
The following graph presents a comparision between both school year results.Despite
the fact that the private car remains the most used type of transport, there was a slight
decrease in 6 p.p. As for the bus use, it remained more or less the same. As for
walking, it suffered a slight increase of 6 p.p. The bike use also increased by 0.3 p.p.
Graph 7 – Students modal split (2010-2012)
We have 6 categories, so the number of degrees of freedom is 5. For the table, for a
significance level of 0.05, the critical value is: 11.1. Since 27.3> 11.1, there is not a
significant change in mobility behaviour between 2010 and 2011.
C2.5 Society
Indicator 1 – Measure acceptance level
The acceptance was assessed through surveys that were carried out in two years
during the expo-madeira event (in 2010 and 2011). In 2010, the majority of the
participants were unfamiliar with sustainable mobility (68,4%). The surveys conducted
in 2011 revealed that 49,2% of the population were familiar with sustainable mobility, a
significant increase on 2010 results (+ 17.8 p.p). Between the two periods in which the
surveys were conducted, several activities were developed, so its possible that these
campaigns have played an important role in promoting sustainable mobility. We have 2
categories, so the number of degrees of freedom is 1, for a significance level of 0.05,
the critical value is 3,84. Since 11,1>3,1, then we can reject the hypothesis that there is
no change in the level of familiarity regarding the concept of Sustainable Mobility
between both measurement periods.
Graph 8 – Are you familiar with the expression “Sustainable Mobility” (2010-2011)
52,0%
32,9%
12,5%
0,6% 0,2% 1,8%
46,0%
32,2%
18,8%
0,6% 0,5% 1,9%
0,0%
10,0%
20,0%
30,0%
40,0%
50,0%
60,0%
Car Bus Walk Motorcycle Bicycle Foot
Modal split comparision
(2010-2012)
2010
2012
68,6%
31,4%
50,9% 49,1%
0,0%
20,0%
40,0%
60,0%
80,0%
100,0%
No Yes
Are you familiar with the expression "Sustainable Mobility"?
(2010-2011)
2010
2011
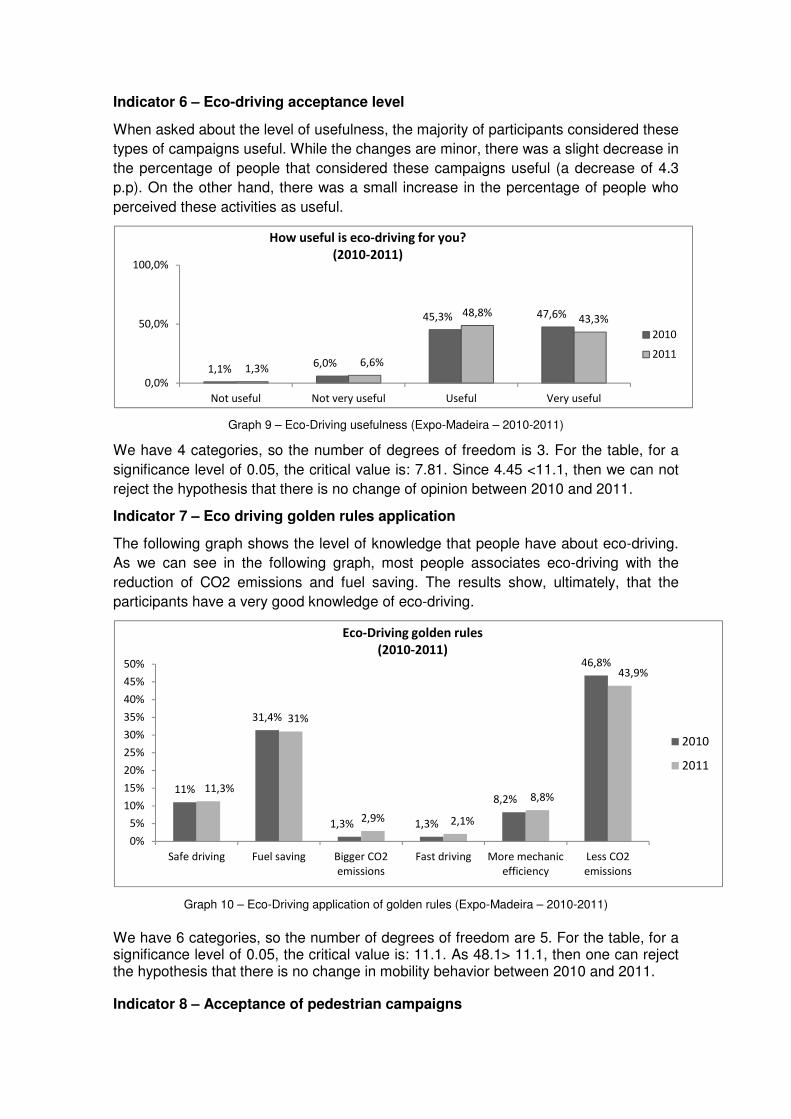
Indicator 6 – Eco-driving acceptance level
When asked about the level of usefulness, the majority of participants considered these
types of campaigns useful. While the changes are minor, there was a slight decrease in
the percentage of people that considered these campaigns useful (a decrease of 4.3
p.p). On the other hand, there was a small increase in the percentage of people who
perceived these activities as useful.
Graph 9 – Eco-Driving usefulness (Expo-Madeira – 2010-2011)
We have 4 categories, so the number of degrees of freedom is 3. For the table, for a
significance level of 0.05, the critical value is: 7.81. Since 4.45 <11.1, then we can not
reject the hypothesis that there is no change of opinion between 2010 and 2011.
Indicator 7 – Eco driving golden rules application
The following graph shows the level of knowledge that people have about eco-driving.
As we can see in the following graph, most people associates eco-driving with the
reduction of CO2 emissions and fuel saving. The results show, ultimately, that the
participants have a very good knowledge of eco-driving.
Graph 10 – Eco-Driving application of golden rules (Expo-Madeira – 2010-2011)
We have 6 categories, so the number of degrees of freedom are 5. For the table, for a significance level of 0.05, the critical value is: 11.1. As 48.1> 11.1, then one can reject the hypothesis that there is no change in mobility behavior between 2010 and 2011.
Indicator 8 – Acceptance of pedestrian campaigns
1,1%6,0%
45,3% 47,6%
1,3%6,6%
48,8%43,3%
0,0%
50,0%
100,0%
Not useful Not very useful Useful Very useful
How useful is eco-driving for you?
(2010-2011)
2010
2011
11%
31,4%
1,3% 1,3%
8,2%
46,8%
11,3%
31%
2,9% 2,1%
8,8%
43,9%
0%
5%
10%
15%
20%
25%
30%
35%
40%
45%
50%
Safe driving Fuel saving Bigger CO2
emissions
Fast driving More mechanic
efficiency
Less CO2
emissions
Eco-Driving golden rules
(2010-2011)
2010
2011
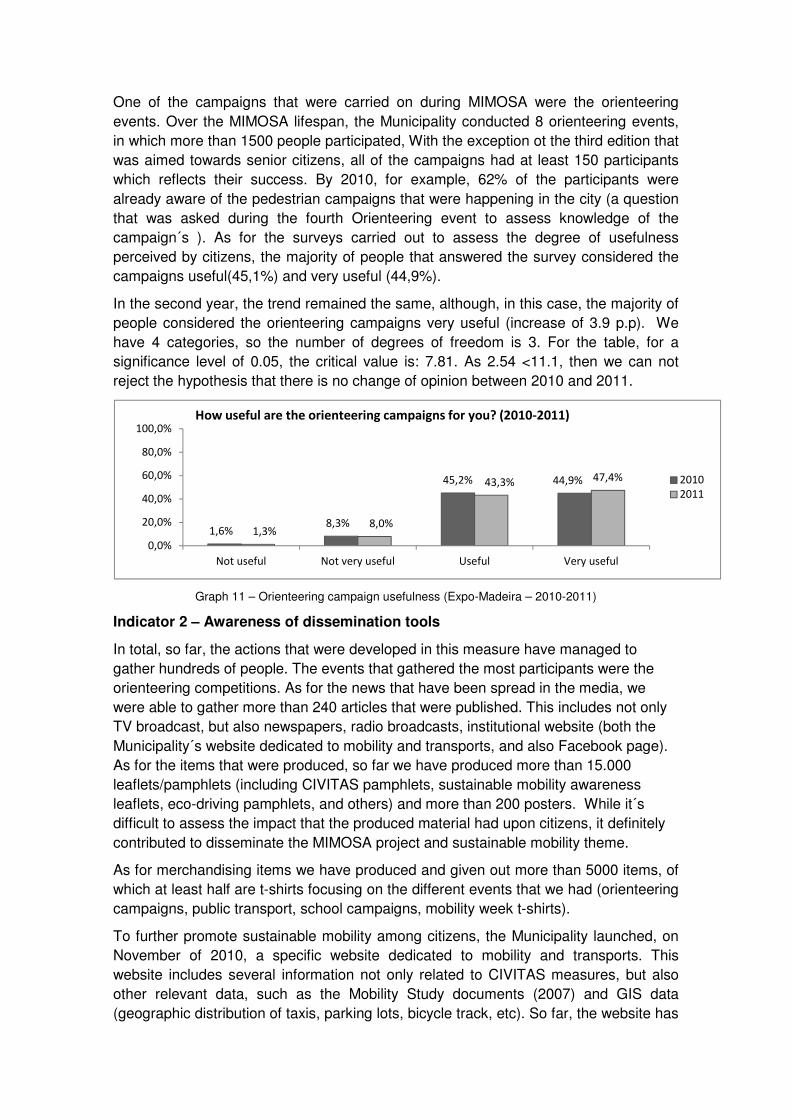
One of the campaigns that were carried on during MIMOSA were the orienteering
events. Over the MIMOSA lifespan, the Municipality conducted 8 orienteering events,
in which more than 1500 people participated, With the exception ot the third edition that
was aimed towards senior citizens, all of the campaigns had at least 150 participants
which reflects their success. By 2010, for example, 62% of the participants were
already aware of the pedestrian campaigns that were happening in the city (a question
that was asked during the fourth Orienteering event to assess knowledge of the
campaign´s ). As for the surveys carried out to assess the degree of usefulness
perceived by citizens, the majority of people that answered the survey considered the
campaigns useful(45,1%) and very useful (44,9%).
In the second year, the trend remained the same, although, in this case, the majority of
people considered the orienteering campaigns very useful (increase of 3.9 p.p). We
have 4 categories, so the number of degrees of freedom is 3. For the table, for a
significance level of 0.05, the critical value is: 7.81. As 2.54 <11.1, then we can not
reject the hypothesis that there is no change of opinion between 2010 and 2011.
Graph 11 – Orienteering campaign usefulness (Expo-Madeira – 2010-2011)
Indicator 2 – Awareness of dissemination tools
In total, so far, the actions that were developed in this measure have managed to
gather hundreds of people. The events that gathered the most participants were the
orienteering competitions. As for the news that have been spread in the media, we
were able to gather more than 240 articles that were published. This includes not only
TV broadcast, but also newspapers, radio broadcasts, institutional website (both the
Municipality´s website dedicated to mobility and transports, and also Facebook page).
As for the items that were produced, so far we have produced more than 15.000
leaflets/pamphlets (including CIVITAS pamphlets, sustainable mobility awareness
leaflets, eco-driving pamphlets, and others) and more than 200 posters. While it´s
difficult to assess the impact that the produced material had upon citizens, it definitely
contributed to disseminate the MIMOSA project and sustainable mobility theme.
As for merchandising items we have produced and given out more than 5000 items, of
which at least half are t-shirts focusing on the different events that we had (orienteering
campaigns, public transport, school campaigns, mobility week t-shirts).
To further promote sustainable mobility among citizens, the Municipality launched, on
November of 2010, a specific website dedicated to mobility and transports. This
website includes several information not only related to CIVITAS measures, but also
other relevant data, such as the Mobility Study documents (2007) and GIS data
(geographic distribution of taxis, parking lots, bicycle track, etc). So far, the website has
1,6%8,3%
45,2% 44,9%
1,3%8,0%
43,3% 47,4%
0,0%
20,0%
40,0%
60,0%
80,0%
100,0%
Not useful Not very useful Useful Very useful
How useful are the orienteering campaigns for you? (2010-2011)
2010
2011
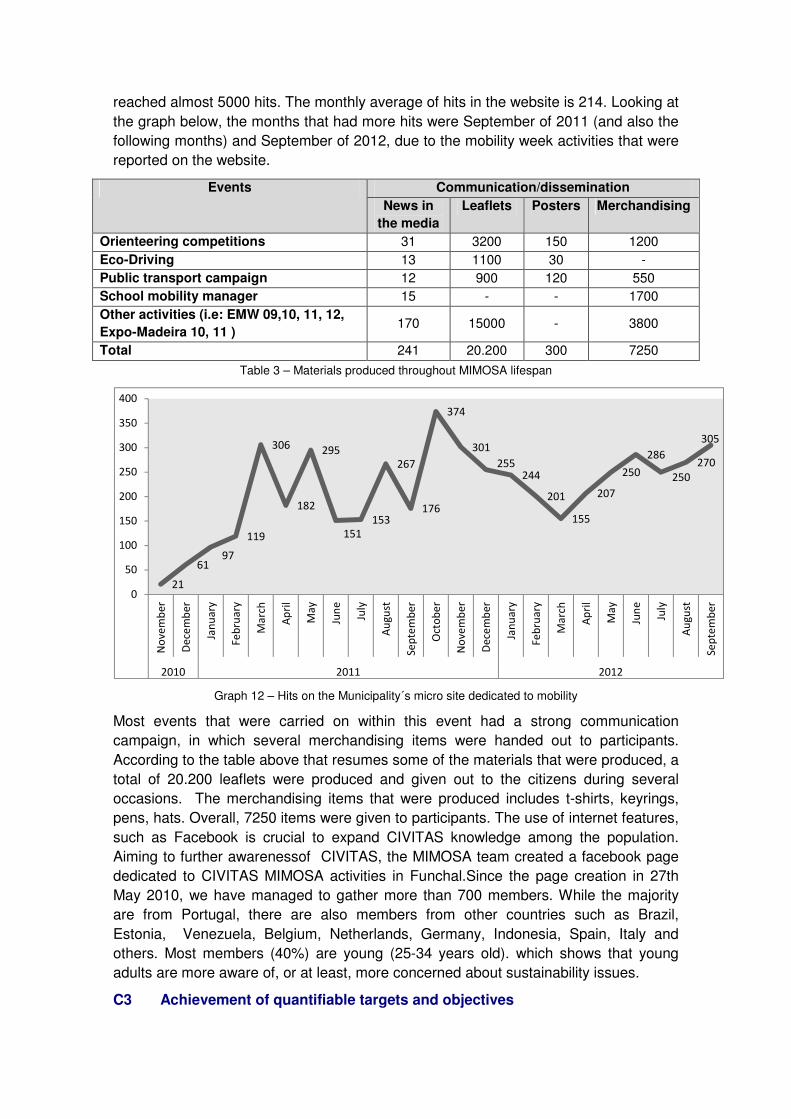
reached almost 5000 hits. The monthly average of hits in the website is 214. Looking at
the graph below, the months that had more hits were September of 2011 (and also the
following months) and September of 2012, due to the mobility week activities that were
reported on the website.
Events Communication/dissemination
News in
the media
Leaflets Posters Merchandising
Orienteering competitions 31 3200 150 1200
Eco-Driving 13 1100 30 -
Public transport campaign 12 900 120 550
School mobility manager 15 - - 1700
Other activities (i.e: EMW 09,10, 11, 12,
Expo-Madeira 10, 11 ) 170 15000 - 3800
Total 241 20.200 300 7250
Table 3 – Materials produced throughout MIMOSA lifespan
Graph 12 – Hits on the Municipality´s micro site dedicated to mobility
Most events that were carried on within this event had a strong communication
campaign, in which several merchandising items were handed out to participants.
According to the table above that resumes some of the materials that were produced, a
total of 20.200 leaflets were produced and given out to the citizens during several
occasions. The merchandising items that were produced includes t-shirts, keyrings,
pens, hats. Overall, 7250 items were given to participants. The use of internet features,
such as Facebook is crucial to expand CIVITAS knowledge among the population.
Aiming to further awarenessof CIVITAS, the MIMOSA team created a facebook page
dedicated to CIVITAS MIMOSA activities in Funchal.Since the page creation in 27th
May 2010, we have managed to gather more than 700 members. While the majority
are from Portugal, there are also members from other countries such as Brazil,
Estonia, Venezuela, Belgium, Netherlands, Germany, Indonesia, Spain, Italy and
others. Most members (40%) are young (25-34 years old). which shows that young
adults are more aware of, or at least, more concerned about sustainability issues.
C3 Achievement of quantifiable targets and objectives
21
6197
119
306
182
295
151
153
267
176
374
301
255244
201
155
207
250
286
250
270
305
0
50
100
150
200
250
300
350
400
No
ve
mb
er
De
cem
be
r
Jan
ua
ry
Fe
bru
ary
Ma
rch
Ap
ril
Ma
y
Jun
e
July
Au
gu
st
Se
pte
mb
er
Oct
ob
er
No
ve
mb
er
De
cem
be
r
Jan
ua
ry
Fe
bru
ary
Ma
rch
Ap
ril
Ma
y
Jun
e
July
Au
gu
st
Se
pte
mb
er
2010 2011 2012
No. Target Rating
1
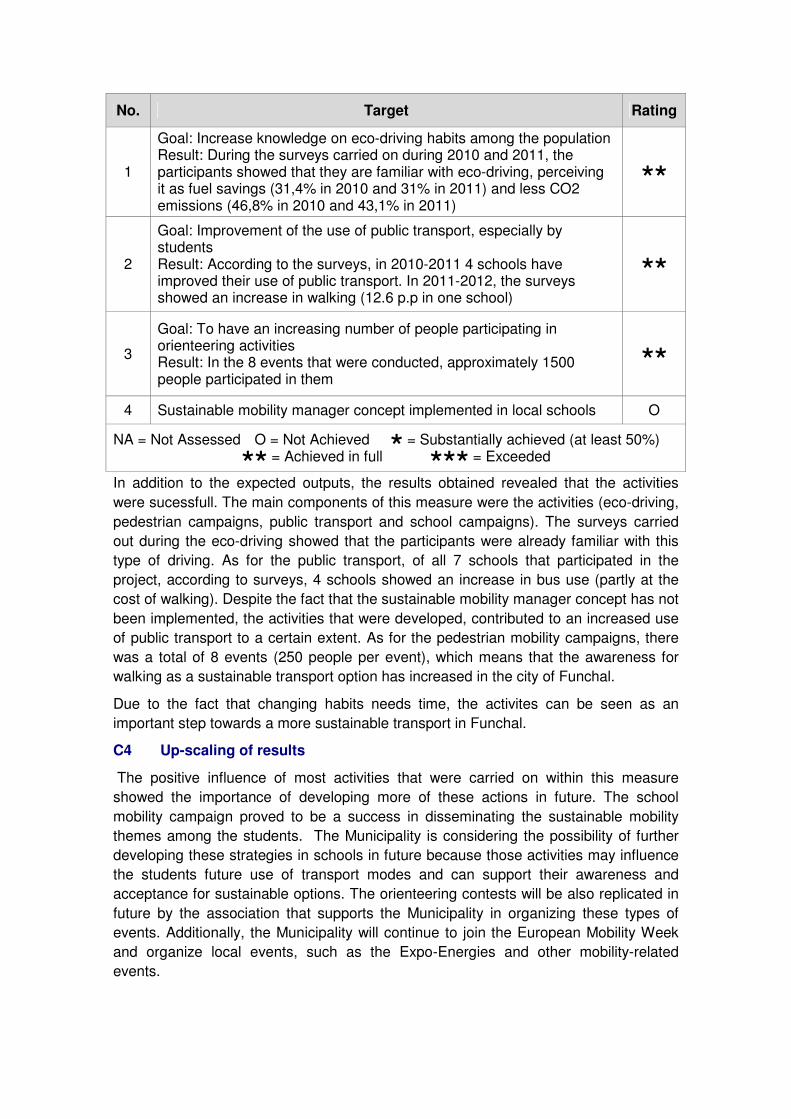
Goal: Increase knowledge on eco-driving habits among the population Result: During the surveys carried on during 2010 and 2011, the participants showed that they are familiar with eco-driving, perceiving it as fuel savings (31,4% in 2010 and 31% in 2011) and less CO2 emissions (46,8% in 2010 and 43,1% in 2011)
��
2
Goal: Improvement of the use of public transport, especially by students Result: According to the surveys, in 2010-2011 4 schools have improved their use of public transport. In 2011-2012, the surveys showed an increase in walking (12.6 p.p in one school)
��
3
Goal: To have an increasing number of people participating in orienteering activities Result: In the 8 events that were conducted, approximately 1500 people participated in them
��
4 Sustainable mobility manager concept implemented in local schools O
NA = Not Assessed O = Not Achieved � = Substantially achieved (at least 50%) �� = Achieved in full ��� = Exceeded
In addition to the expected outputs, the results obtained revealed that the activities
were sucessfull. The main components of this measure were the activities (eco-driving,
pedestrian campaigns, public transport and school campaigns). The surveys carried
out during the eco-driving showed that the participants were already familiar with this
type of driving. As for the public transport, of all 7 schools that participated in the
project, according to surveys, 4 schools showed an increase in bus use (partly at the
cost of walking). Despite the fact that the sustainable mobility manager concept has not
been implemented, the activities that were developed, contributed to an increased use
of public transport to a certain extent. As for the pedestrian mobility campaigns, there
was a total of 8 events (250 people per event), which means that the awareness for
walking as a sustainable transport option has increased in the city of Funchal.
Due to the fact that changing habits needs time, the activites can be seen as an
important step towards a more sustainable transport in Funchal.
C4 Up-scaling of results
The positive influence of most activities that were carried on within this measure
showed the importance of developing more of these actions in future. The school
mobility campaign proved to be a success in disseminating the sustainable mobility
themes among the students. The Municipality is considering the possibility of further
developing these strategies in schools in future because those activities may influence
the students future use of transport modes and can support their awareness and
acceptance for sustainable options. The orienteering contests will be also replicated in
future by the association that supports the Municipality in organizing these types of
events. Additionally, the Municipality will continue to join the European Mobility Week
and organize local events, such as the Expo-Energies and other mobility-related
events.

C5 Appraisal of evaluation approach
Promoting sustainable mobility is, more than ever, a challenge for cities. In cities like
Funchal, in which there is still a lack of tradition in using more sustainable vehicles, the
challenge to show significant changes is even bigger. The results of the evaluation
must be considered with care since we are dealing with behavioral changes. During the
evaluation process it became evident that it would be difficult to identify effective
results, given the nature of the measure, and the high cost of data collection.
Measuring eco-driving effectively would be very difficult, given the cost of collecting
information (namely citizen resistance due to the necessity of installing the
consumption meters in cars). As for the modal split, a proper evaluation would imply a
survey campaign with very high costs. Due to this, the evaluation of the measure was
more focused on awareness than assessing behaviour changes since significant
changes will become visible only in the long run (beyond MIMOSA’s lifetime).
For the schools activities that were carried on, it would have been more successful to
have other schools as a control site to compare the data and identify a clear impact of
the measure, but this was not possible possible because the activities were delayed
and so there was not enough time left to do further surveys.
Additionally - despite the interest showed by the Regional Government (who manages
the schools) during the school campaigns - this interest was not shared by many
schools, since they are more focused on teaching the students the curricular subjects,
than non curricular subjects. The interest decreased even more by the 2011-2012
school year, due do the financial constraints that led to a reduction of teaching
personnel. Therefore, the extracurricular subjects lost relevance and it was also not
possible to convince them to take part in a survey as a control site.
Nevertheless the events external to the measure (such as Mobility Week and/or Expo-
Energy) proved to be important in promoting both MIMOSA, its measures, and
sustainable mobility. Due to its innovative features, the activities carried on reached a
lot of citizens. The surveys revealed that the participants are willing to change their
mobility habits. Therefore the campaigns can be seen as a step towards a more
sustainable transport behavior.
C6 Summary of evaluation results
The key results are as follows:
• Increase knowledge and awareness on eco-driving habits among the
population – According to the Expo-Madeira surveys, the participants have
already showed that are they are acquainted with some eco-driving skills. The
workshops that were carried on during Mobility Week 2010 and 2011 have been
contributing to increase the eco-driving knowledge level. In addition, a significant
percentage of the participants that answered the surveys in Expo-Madeira
perceived these actions as very useful (47,6% 2010 and 43,3% in 2011).
• Increase the public transport rate among students – According to the
surveys conducted in schools, of the schools that participated in the mobility
campaign, 4 schools have shown an increase in the use of public transport (partly
to the detriment of walking however). The campaign “Get Around in Funchal by
Bus” has also contributed to foster the use of collective transport.To have an

increasing number of people participating in orienteering activities – In
total we have managed to gather at least 1500 participants. If we include the
public transport campaigns (Get Around in Funchal by Bus), the number of total
participants will reach 2000, which means more awareness of sustainable modes
of transport.
• Increase number of hits in key actor’s websites – The internet was used to
spread sustainable mobility. The strategy relied on creating a CIVITAS webpage
on a social network (facebook), and launching a webpage dedicated to mobility
in Funchal. Almost 5000 people has visited the Mobility Municipality website
(since its launch on September, 2010). Furthermore, the CIVITAS facebook
page has gathered at least 700 friends.
C7 Future activities relating to the measure
Throughout the new school year, the school mobility campaign will be carried on. It is
also expected that, after MIMOSA, the Municipality will continue to participate in the
European Mobility Week and organize other local events, such as Expo-Energies and
similar ones. Additionally, more orienteering events will be organized in which we
expect to reach an even larger number of participants and target groups.
D Process Evaluation Findings
D.1 Deviations from the original plan
The deviations from the original plan comprised:
• Subcontracting – Task 4.1.2 (in the DoW document) presupposes the
subcontracting of an external team regarding the conception of the awareness
campaigns. However, all the activities considered in this measure were developed
by the Municipality CIVITAS Team. Due to this fact, we have stated in the second
amendment that a great deal of work will be carried out by the Municipality itself.
Therefore, we have included in the second amendment a corrective action,
regarding the subcontracting, in which we stated that the activities developed will
be carried out by the municipality. Nevertheless, external teams were hired to
support the execution of activities.
• Infopoint – In the second amendment Horários do Funchal (the local public
transport operator and MIMOSA partner), planned to subcontract a new activity
and new equipment: Horários do Funchal added €156.000 (€78.000 of EC co-
funding) in the implementation in order to build a mobility info point, and €5.940
(€2.376,00 of EC co-funding) dedicated to purchase equipment for the mobility
info point. Due to an unexpected financial situation, an uncertain legal framework
about concession of this public space to HF and also due to a lack of time to
develop this activity before the end of the CIVITAS project, the InfoPoint was not
implemented.

D.2 Barriers and drivers
D.2.1 Barriers
Overall barriers
• 3 – Cultural Barrier
Social resistance – Since this measure deals with changing habits among
citizens, the main barrier detected was at a social level. Despite the numerous
awareness raising campaigns, the results showed, that despite the participants
likelihood to change their transport habits, there is still a strong resistance in
acquiring clean vehicles, and adopting sustainable mobility habits, because the
impact of such activties can be only shown in the long run.
Preparation phase
• 9 – Organizational Barrier
-Lack of human resources – Concerning the actions that were carried on in
schools, we came across some limitations, namely the lack of human resources,
which made it difficult to implement the actions.
Operation phase
• 9 – Organizational Barrier
Lack of data - The lack of data on mobility hampered the evaluation process,
and made it difficult to compare data. The implementation of the mobility
observatory (FUN 8.3) was crucial since it will enable the collection of data
related to mobility.
• 4 – Problem related Barrier
Subcontrator - The work undertaken by the subcontractor to carry out the
evaluation study on the environmental impacts arising from the implementation
of the Project CIVITAS MIMOSA in Funchal, did not correspond to the
expectations, given that this type of work is not common and there is no
experience in this field.
D.2.2 Drivers
Overall Drivers
• 1 – Political Driver
Political commitment – The political involvement proved to be instrumental in
promoting the events in this measure. The commitment shown meant that the
message reached a greater number of people, and contributed to increased
public discussion about the need to change our mobility habits.
Preparation phase
• 7 – Planning – The involvement of the regional secretary of education was crucial
in the implementation of the actions
• 7 – Planning
Innovation – Since most activities are innovative and attract interest, we were
able to reach various target groups ranging from elderly people to
youngsters/students.
D.2.3 Activities
Preparation phase
• 7 – Planning
Selection of target groups – Selection of target groups and places in which
the activities will be carried out.
Definition of aproach – Definition of methodology to conduct the activities.
D.3 Participation
D.3.1. Measure Partners
• Municipality of Funchal – Leader in the development of the measure and
primarily responsible for all activities of the measure.
• Horários do Funchal - The CIVITAS partner supported the Municipality in some
activities, namely the “Get Around in Funchal by Bus”, and in the school mobility
project.
• Madeira Tecnopolo – The CIVITAS partner supported the Municipality at the
Expo-Madeira exhibition.
D.3.2 Stakeholders
• Schools - The schools that welcomed the school mobility project supported the
Municipality in
developing some of the activities.
D.4 Recommendations
D.4.1 Recommendations: measure replication
The issues related to sustainable mobility plays an important role in cities. Taking in account that in the City of Funchal, public transport has been losing users over the years, and that citizens does not have sustainable mobility behavior, it is important to counter this behavior and its adverse effects on the quality of life in the city.
In the city of Funchal, there is a lack of knowledge regarding sustainable mobility. Indeed, given the cultural issues it is necessary to conduct several actions related to mobility.
To implement measures similar to those described in this document its important to engage and inform citizens. The communication process is critical in campaigns that attempt to change behavior, and should involve specific messages about what is desired, but to be effective they need to demonstrate that opting for less polluting
modes of transport is not only because of the need to do more for the city but essentially demonstrate that these options assume important gains, since they are cheaper, faster and healthier.
Given the various components of this measure, and taking in account that these work mainly on a behaviour level, these are easily transferible to any city, since no technological conditions are required.
D.4.2 Recommendations: process
The technical requirements consist of multidisciplinary technical teams involving people with a background in land planning, psychology, marketing and design, committed in raising awareness for behavior change. This is a difficult and time consuming process, since developing strategies that lead to behavior change requires a lot of persistence on the part of the teams involved.
To engage citizens in these different actions, its necessary to take in consideration the specificities of each activity.
The eco-driving, for instance, although is not listed in the curriculum, is an important theme to be taught to trainees. Only then, the driving schools will participate. In schools, the creation of contests and definition of prizes about sustainable mobility was important to involve the school boards and students.
As for the pedestrian campaigns, it is crucial to involve sports associations, and enjoy events such as the European Mobility Week, and other local events such as the expo-energy as a way to promote pedestrian mobility.
Involving media is an important part not only for the dissemination of these campaigns, but mainly to use this tool as a mean of public awareness of the social responsibility that we all have in order to have a better quality life.