math 140 introductory statisticssf70713/fall09/lecture 7.pdfmath 140 introductory statistics...
TRANSCRIPT

Math 140 Introductory Statistics
Professor Silvia Fernández
Lectures 7Based on the book Statistics in Action
by A. Watkins, R. Scheaffer, and G. Cobb.

The Two Main Problems in the Standard Normal Distribution.Unknown Percentage. (Given z, find P )
With Table A (end of the textbook)Use the units and the first decimal to locate the row and the closest hundredths digits to locate the column. The number found is the percentage of the number of values below z.
With CalculatorEnter normalcdf(-99999, z) to get the percentage of the number of values below z.

Example (given z find P)
CalculatorP = normalcdf(-99999,1.23)= .8906513833~ 89.07%
Table A Look for -row labeled 1.2-column labeled .03The intersection shows P =.8907 = 89.07%

The Two Main Problems in the Standard Normal Distribution.Unknown Value Problem. (Given P, find z )
With Table ALook for P in the body of the table. (or the number closest to it). Read back the row and column for that number. Use the row as the units and tenths of z, and the column as the hundredths digits of z. Note that Pmust be a percentage (written as a proportion, that is, a number between 0 and 1) of the number of values below a certain value z.
With CalculatorEnter invNorm(P) to get the value z such that Pequals the percentage of the number of values belowz.

Example (given P find z-score)
Calculatorz=invNorm(.75)= .6744897495~ .67
Table A The value closest to .75 in the body of table A is .7486, which is in row .6 and column .07.Then the z-score is .67

Value ↔ z-score (x ↔ z)
Standardizing (from x to z)
Unstandardizing (from z to x)
SD
xxz
−=
)(SDzxx +=

The two main problems (summary)
Unknown percentagegiven x, find Px to z to P
normalcdf(-99999, z)
Table: row and column
SD
xxz
−=
Unknown valuegiven P, find xP to z to x
invNorm(P)
Table: body
)(SDzxx +=

Example (p. 88 – given x find P)
Standardize (get z)
4444.17.2
1.707474
=−
=−
=
=
SDxxz
x
Percentage below 74 inP = normalcdf(-99999,1.4444)~ .9257 = 92.57%
Percentage above 74 in1-.9257 = .0743 = 7.43%

Example (p. 89 – given P find x)
Get z-score
z =invNorm(.75)= .6744897495~ .67
(given) 75.%75 ==P
Unstandardize (get x)
in 475.66)5.2(67.8.64)(
=+=+= SDzxx

Example (p. 91 – given P find x)
According to the table on page 87, the distribution of death rates from cancer per 100,000 residents by state is approximately normal*, with mean 196 and SD 31. The middle 90% of death rates are between what two numbers?
*Provided that Alaska and Utah, which are outliers because of their unusually young populations, are left out.

Example (p. 91 – given P find x) cont.
According to the table on page 87, the distribution of death rates from cancer per 100,000 residents by state is approximately normal*, with mean 196 and SD 31. The middle 90% of death rates are between what two numbers?Get z-scores (middle 90% is betwee 5% and 95%)5% =.05 corresponds to z = -1.64485
95%= .95 corresponds to z = 1.64485
Unstandardize
So the middle 90% of states have death rates between 145.009 and 246.99 deaths per 1000,000 residents.
00965.145)31)(64485.1(196)()( =−+=+=+= SDzmeanSDzxx
99035.246)31)(64485.1(196)()( =+=+=+= SDzmeanSDzxx
*Provided that Alaska and Utah, which are outliers because of their unusually young populations, are left out.
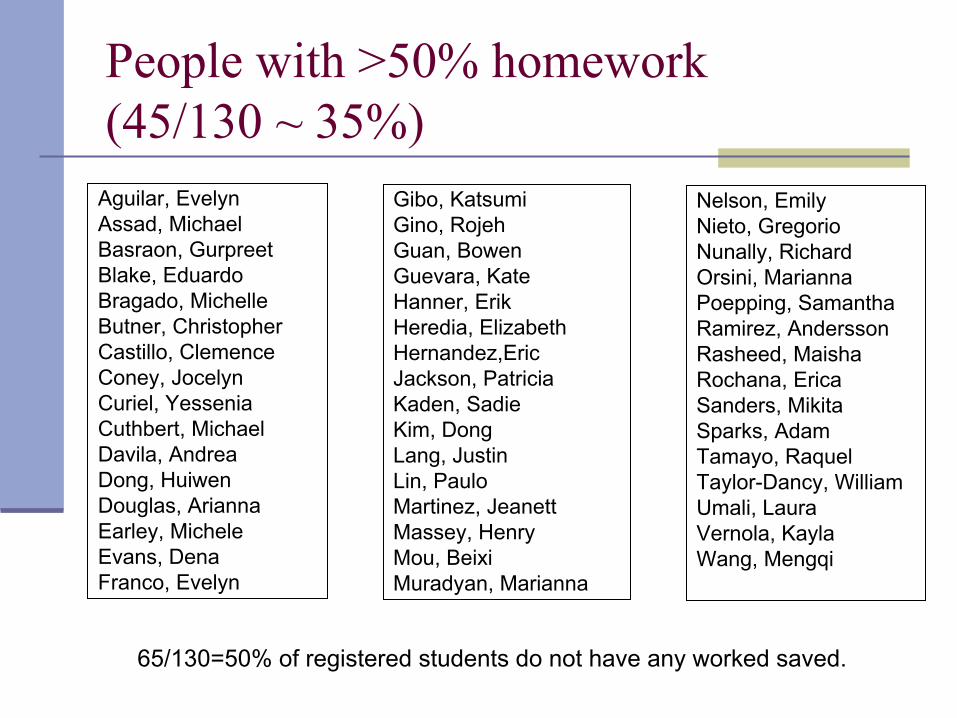
People with >50% homework (45/130 ~ 35%)
Aguilar, EvelynAssad, MichaelBasraon, GurpreetBlake, EduardoBragado, MichelleButner, ChristopherCastillo, ClemenceConey, JocelynCuriel, YesseniaCuthbert, MichaelDavila, AndreaDong, HuiwenDouglas, AriannaEarley, MicheleEvans, DenaFranco, Evelyn
Nelson, EmilyNieto, GregorioNunally, RichardOrsini, MariannaPoepping, SamanthaRamirez, AnderssonRasheed, MaishaRochana, EricaSanders, MikitaSparks, AdamTamayo, RaquelTaylor-Dancy, WilliamUmali, LauraVernola, KaylaWang, Mengqi
Gibo, KatsumiGino, RojehGuan, BowenGuevara, KateHanner, ErikHeredia, ElizabethHernandez,EricJackson, PatriciaKaden, SadieKim, DongLang, JustinLin, PauloMartinez, JeanettMassey, HenryMou, BeixiMuradyan, Marianna
65/130=50% of registered students do not have any worked saved.

Problem 19 – Homework 1Introduced in 2000, the Honda Insight was the first hybrid car sold in the U.S. The mean gas mileage for the model year 2006 Insight with an automatic transmission is 53 miles per gallon on the highway. Suppose the gasoline mileage of this automobile is approximately normally distributed with a standard deviation of 2.2 miles per gallon.
(a) What proportion of 2006 Honda Insights with automatic transmission gets 60 miles per gallon or less on the highway?
(b) What proportion of 2006 Honda Insights with automatic transmission gets between 58 and 62 miles per gallon on the highway?
Problem 16 – Homework 1The scores of students on an exam are normally distributed with a mean of 581 and a standard deviation of 46.
(a) What is the lower quartile score for this exam?
(b) What is the upper quartile score for this exam?

Problem 4 – Homework 1
Which of the following are true? A. At least three quarters of the data values represented in D1 are greater than the median value of D3 . B. The data represented in D2 is symmetric. C. The data for D1 has a greater median value than the data for D3 . D. The data represented in boxplot D3 is skewed to the right. E. All the data values for boxplot D1 are greater than the median value for D2 . F. At least one quarter of the data values for D3 are less than the median value for D2

Problem 17 – Homework 1IQ scores have a mean of 100 and a standard deviation of 15. Greg has an IQ of 127.
What is the difference between Greg's IQ and the mean?
Convert Greg's IQ score to a z score:
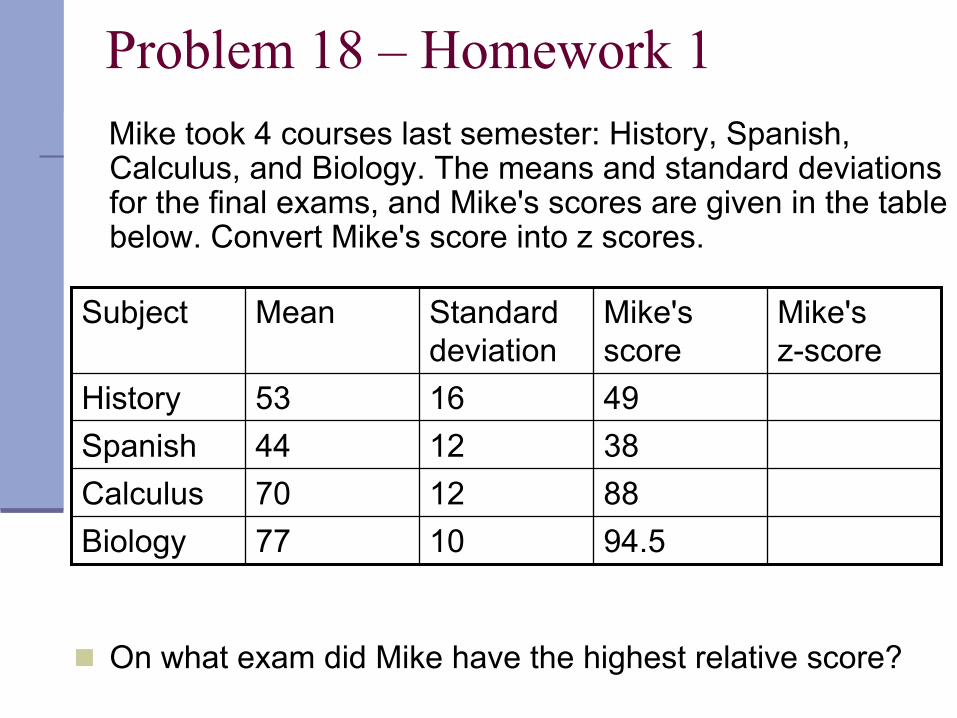
Problem 18 – Homework 1Mike took 4 courses last semester: History, Spanish, Calculus, and Biology. The means and standard deviations for the final exams, and Mike's scores are given in the table below. Convert Mike's score into z scores.
On what exam did Mike have the highest relative score?
94.51077Biology881270Calculus381244Spanish491653History
Mike's z-score
Mike's score
Standard deviation
MeanSubject

Problem 5 – Homework 1The boxplot below represents annual salaries of attorneys in thousands of dollars in Los Angeles. About what percentage of the attorneys have salaries between $186,000 and $288,000?
A. 20%B. 50%C. 25%D. None of the Above

Problem 8 – Homework 1Consider the following data set. Give the five number summary listing values in numerical order:
Data set: 27, 67, 26, 47, 78, 81, 73, 95, 88, 42, 96, 34, 82, 87, 37, 64, 56, 42, 100