recommendations introductory statistics textbooks and the
TRANSCRIPT
Full Terms & Conditions of access and use can be found athttp://www.tandfonline.com/action/journalInformation?journalCode=utas20
Download by: [Australian National University] Date: 10 July 2017, At: 20:01
The American Statistician
ISSN: 0003-1305 (Print) 1537-2731 (Online) Journal homepage: http://www.tandfonline.com/loi/utas20
Introductory Statistics Textbooks and the GAISERecommendations
Peter K. Dunn , Michael D. Carey , Michael B. Farrar , Alice M. Richardson &Christine McDonald
To cite this article: Peter K. Dunn , Michael D. Carey , Michael B. Farrar , Alice M. Richardson &Christine McDonald (2016): Introductory Statistics Textbooks and the GAISE Recommendations,The American Statistician, DOI: 10.1080/00031305.2016.1251972
To link to this article: http://dx.doi.org/10.1080/00031305.2016.1251972
View supplementary material
Accepted author version posted online: 28Oct 2016.
Submit your article to this journal
Article views: 101
View related articles
View Crossmark data
ACCEPTED MANUSCRIPT
ACCEPTED MANUSCRIPT 1
Introductory Statistics Textbooks and the GAISE Recommendations
Peter K. Dunn Associate Professor in Biostatistics1, Michael D. Carey Lecturer in Education
(TESOL)2, Michael B. Farrar Instructor (Tutor) in Statistics
3, Alice M. Richardson
Biostatistician4, and Christine McDonald Senior Lecturer in Statistics
5
1University of the Sunshine Coast, Sippy Downs, Queensland, Australia, 4558
2University of the Sunshine Coast, Sippy Downs, Queensland, Australia, 4558 (email:
3University of the Sunshine Coast, Sippy Downs, Queensland, Australia, 4558 (email:
4National Centre for Epidemiology & Population Health, The Australian National University,
Canberra, Australian Capital Territory, Australia, 2601 ([email protected])
University of Southern Queensland, Toowoomba, Queensland, Australia, 4350
([email protected]). This work was partially supported by USC Open Learning
and Teaching Grant (OLTGP2012/04). The authors thank Donna Shaw for contributing to the
evaluation.
Corresponding author (email: [email protected])
The six recommendations made by the Guidelines for Assessment and Instruction in Statistics
Education (GAISE) committee were first communicated in 2005 and more formally in 2010. In
this paper, 25 introductory statistics textbooks are examined to assess how well these textbooks
have incorporated the three GAISE recommendations most relevant to implementation in
textbooks (statistical literacy and thinking; use of real data; stress concepts over procedures).
The implementation of another recommendation (using technology) is described but not
ACCEPTED MANUSCRIPT
ACCEPTED MANUSCRIPT 2
assessed. In general, most textbooks appear to be adopting the GAISE recommendations
reasonably well in both exposition and exercises. The textbooks are particularly adept at using
real data, using real data well, and promoting statistical literacy. Textbooks are less adept—but
still rated reasonably well, in general—at explaining concepts over procedures and promoting
statistical thinking. In contrast, few textbooks have easy-usable glossaries of statistical terms to
assist with understanding of statistical language and literacy development.
KEYWORDS
Statistical literacy; statistical thinking; real data; statistical concepts; exercises
ACCEPTED MANUSCRIPT
ACCEPTED MANUSCRIPT 3
1. INTRODUCTION
The American Statistical Association‘s Guidelines for Assessment and Instruction in Statistics
Education (GAISE) committee made six recommendations (Aliaga et al. 2010) for teaching
introductory statistics:
1. Emphasise statistical literacy and develop statistical thinking;
2. Use real data;
3. Stress conceptual understanding, rather than mere knowledge of procedures;
4. Foster active learning in the classroom;
5. Use technology for developing conceptual understanding and analysing data; and
6. Use assessment to improve and evaluate student learning.
These recommendations evolved from suggestions made by Cobb (1992) and built on by Moore
(1997), and were originally communicated in the initial GAISE College Report in 2005
(http://it.stlawu.edu/~rlock/gaise/, accessed 27 August 2015). The GAISE recommendations are
currently under review (Everson 2015;
http://www.amstat.org/education/gaise/collegeupdate/GAISE2016_DRAFT.pdf), with the view
to incorporate recent advances in technology and developments in assessment and teaching (such
as online and blended learning) while retaining the general ideas of the original six
recommendations.
The aim of this paper is to establish how well introductory statistics textbooks have adopted the
GAISE recommendations. Some of these recommendations are less relevant for textbooks than
others. For instance, the sixth recommendation (assessment) is manifest at a course level, not at
a textbook level (though textbooks may be involved). The fourth recommendation (active
ACCEPTED MANUSCRIPT
ACCEPTED MANUSCRIPT 4
learning) is manifest in the classroom, and while the textbook may facilitate active learning, a
masterful instructor can adapt any classroom activity to incorporate active learning: ―Fostering
active learning is the business of the teacher‖ (Moore et al. 2013, p. ix).
The fifth GAISE recommendation concerns the use of technology. Technology can be used to
teach statistics in many different ways. Firstly, technology can develop concepts or demonstrate
theory through animations and simulations provided on websites (or CDs) associated with the
textbook, or as in-text links to webpages. Secondly, the textbook may discuss the use of
statistical software (including calculators) to replace hand calculations. Thirdly, textbooks may
use technology through resources attached to textbooks, via associated PowerPoint slides and
quiz test banks, for example. The use of technology is dependent on the institution, the
instructor, and the classroom, where interaction with technology occurs.
Technology changes rapidly, and any evaluations provided here would be out-of-date as soon as
published. In some cases, the technology no longer works or uses out-dated plug-ins and so
cannot be evaluated. Often the technology was difficult to access behind paywalls, or proof-of-
purchase of a textbook was necessary. Furthermore, technology has ―changed dramatically‖
(Everson 2015, p. 29) since the GAISE recommendations were established. For these reasons,
we discuss the fifth GAISE recommendation descriptively, without implication for how well the
textbooks adopt this recommendation.
As a result, GAISE recommendations 1, 2 and 3 are the main focus of this paper, with some
comments on the fourth and fifth recommendations. In this review of introductory statistics
textbooks, we reviewed 25 textbooks for how well they addressed these GAISE
recommendations (Agresti and Franklin 2009; Bock, Velleman and De Veaux 2010; Bennett,
ACCEPTED MANUSCRIPT
ACCEPTED MANUSCRIPT 5
Briggs and Triola 2008; Brase and Brase 2012; Dear 2014; Diez, Barr and Çetinkaya-Rundel
2012; Johnson and Kuby 2012; Johnson and Kuby 2012; Johnson and Bhattacharyya 2010; Lane
2013a; Lane 2013b; Larson and Farber 2012; MacGillivray, Utts and Heckard 2011;
MacGillivray, Utts and Heckard 2014; Mann 2010; Moore 2003; Moore, Norz and Fligner 2013;
Peck 2014; Utts 2005; Utts 2015; Utts and Heckard 2012; Watkins, Scheaffer and Cobb 2011;
Wild and Seber 2000; Zieffler and Catalysts for Change 2013). In the next section, some
background is provided, followed by the methods in Section 3. Results for the GAISE
recommendations are presented and discussed in Section 4. Implications of these results are
summarized in Section 5.
2. BACKGROUND
The relationship between a textbook and the course it supports is complex, and may take many
forms (Zieffler et al. 2013; West 2013). To assess a textbook for adoption of the GAISE
recommendations, the purpose of the textbook in the overall structure of an introductory course
in statistics should be considered. The textbook may:
● Serve as the main source of content information;
● Provide the foundation for in-class lessons;
● Provide the framework for organising course content;
● Influence which topics are taught, the sequence of topics, and how much time is devoted
to those topics;
● Introduce discipline-specific examples, language and data;
● Provide examples of how problems are solved;
● Allow students the opportunity to practise questions;
ACCEPTED MANUSCRIPT
ACCEPTED MANUSCRIPT 6
● Standardise the content (language, notation, etc.) when the course is taught by many
instructors or taken by students from many disciplines;
● Provide opportunities for online homework;
● Provide a model for the appropriate way to approach statistics; and/or
● Provide supplementary learning support or additional references.
Textbooks may also be the means through which instructors access associated electronic
resources (such as data sets, software, videos, animations, PowerPoint slides, images, test banks,
online resources, and so on). Utts (2013) observed that statistics textbooks may also serve a
purpose not common in other disciplines:
Many instructors who teach introductory statistics were not trained in statistics, and may
have little knowledge of the material or about what makes a good introductory course.
For those instructors, the textbook is often their major source for learning the material
they are teaching (p. 4).
In addition, textbooks may act as a conduit to updating knowledge and practice (―update the
curriculum‖ (West 2013)), as instructors often look to textbooks to see which ones implement
new advances in pedagogy or statistical techniques (the ―plus four‖ confidence intervals for
binomial proportions (Agresti and Coull (1998) exemplify this).
Given the variation in instructor approach, the relationship between instructors, students,
textbook and curricula is complex. Love and Pimm (1996) observed that:
The teacher normally acts as a mediator between the student and the text, and will often
provide an exposition of the text and explanations to students in difficulties. This

ACCEPTED MANUSCRIPT
ACCEPTED MANUSCRIPT 7
interpretation of the text will be based not only on her construction of the intentions of
the author, but on accumulated experience of teaching (p. 386)
Textbooks may influence what material is taught and how (Eisenmann and Even 2009; Ball and
Cohen 1996). As a result, textbook choice can be important in teaching introductory statistics,
and requires instructors to balance a number of criteria. Crucially, textbook objectives must be
consistent with those of the course (Zieffler et al. 2013) considering (for example) the diversity
of students, the mathematical ability of students, the purpose of the course, and disciplines of
students. The selection may also depend on cost of the texbook, the choice of topics, the
sequencing of topics or the presentation of the topics (Zieffler et al. 2013), or the format
(traditional or electronic; see Utts (2013) and West (2013)).
For all these above reasons, textbooks can be integral to the teaching of introductory statistics,
and so it is important that they reflect the GAISE recommendations. This, therefore, is the
purpose of the current paper.
3. METHODS
The criteria used to select the textbooks and evaluate the textbooks for adoption of the GAISE
recommendations are presented in Sections 3.1 and 3.2 respectively. This is followed by a
description of how the general criteria are operationalised for each of the key GAISE
recommendations 1, 2 and 3 (Sections 3.3 to 3.5). Criteria used to describe how textbooks adopt
GAISE recommendation 5 (technology) are defined (Section 3.6). The process of allocating the
ratings on the textbooks‘ adoption of the GAISE recommendations is described (Section 3.7). It
is acknowledged that review exercises are an instrumental component of most textbooks and as

ACCEPTED MANUSCRIPT
ACCEPTED MANUSCRIPT 8
such it was deemed necessary to also rate the textbooks on how well their exercises adopted the
GAISE recommendations (Section 3.8).
3.1 Selection of textbooks
Many introductory statistics textbooks exist, so the number of textbooks in the evaluation needed
to be restricted. Our focus is introductory textbooks, but we explicitly excluded populist books
such as Freakonomics (Levitt and Dubner 2010) and Statistics for Dummies (Rumsey 2011), and
software-specific textbooks such as Field (2013). We omitted textbooks whose titles were
explicitly discipline-specific (such as Gravetter and Wallnau 2013) and focussed on general
textbooks. In the end, the choice is not a random sample but includes a cross-section of popular
textbooks. Most of the textbooks were available on the bookshelf of at least one of the authors
or were freely available online.
The textbooks evaluated are flagged in the References. All textbooks were published in 2000 or
later apart from Moore and McCabe (1993), and most (72%) were published in 2010 or later
(Figure 1). The textbook codes used in Figure 1, and elsewhere, are explained in the References.
3.2. Development of criteria
As others have noted, ―despite the prominence of evaluations of statistics texts, there is
surprisingly little literature on how such evaluations should be conducted‖ (Harwell et al. 1996,
p. 4; also see Chervany et al. 1977). Harwell et al. (1996) provided three instruments for such an
evaluation, for use by students, instructors, and ―expert evaluators‖. However, many of the
instruments do not suit our purposes (and are not GAISE-focussed), and the focus was on
statistics textbooks in psychology, education and social science.

ACCEPTED MANUSCRIPT
ACCEPTED MANUSCRIPT 9
Cobb (1987) evaluated 16 statistics textbooks on four criteria (technical level, quality of the
exercises, topics, and quality of explanations), and described an evaluation framework. Huberty
and Barton (1990) evaluated multivariate statistics textbooks using four criteria: coverage,
procedures, readability and the exercises. Schacht (1990) evaluated 12 textbooks using a simple
checklist (topic covered or not) plus supporting data (average number of exercises per chapter).
He concluded by developing the Statistics Textbook Anxiety Rating Test to quantify the
textbooks in terms of a student-anxiety perspective (though no student input was used to
construct the rating). Chervany et al. (1977) discussed a framework, but did not evaluate any
textbooks. Herrick and Gold (1994) discussed selecting statistics textbooks for social science
students; they noted that in the selection of a statistics textbook for students from non-statistical
disciplines that ―presentation… becomes much more important in order to compensate for a lack
of background in the student‖ (p. 1). They proposed that introductory statistics textbooks be
evaluated using five instruments, drawing from students, instructors, experts and objective
measures (such as readability measures).
Our focus specifically involves the GAISE recommendations, so while some overlap with these
previous studies will be apparent, this study has a different focus. No studies to our knowledge
have examined how well the GAISE recommendations have been adopted in textbooks.
However, Bargagliotti (2012) examined how well National Science Foundation-funded
mathematics courses follow the pre-K to 12 GAISE recommendations (Franklin et al. 2007) but
made little reference to textbooks.
In the absence of guidance from the literature, the research team discussed which features of the
textbooks should be evaluated for how well they adopt the GAISE recommendations, and how
ACCEPTED MANUSCRIPT
ACCEPTED MANUSCRIPT 10
they should be evaluated. The criteria were framed as statements to identify the extent to which
the GAISE recommendations were expressed in the textbooks and are explored in the sections
below. Most statements were evaluated on a five-point ordinal scale (from ―Strongly Disagree‖
to ―Strongly Agree‖).
3.3 GAISE recommendation 1: Statistical literacy and statistical thinking
Statistical literacy is defined in the GAISE recommendations as ―understanding the basic
language of statistics… and fundamental ideas of statistics‖ (Aliaga et al. 2010, p. 14). Notation
and symbols are part of the ―basic language‖ (Dunn et al. 2016). The GAISE recommendations
define statistical thinking as ―the type of thinking that statisticians use when approaching or
solving statistical problems‖ (Aliaga et al. 2010, p. 14), which includes ―understanding the need
for data, the importance of data production, the omnipresence of variability, and the
quantification and explanation of variability‖ (Cobb 1992). Each textbook was evaluated
regarding statistical literacy and statistical thinking by rating the two statements: ―Statistical
literacy is emphasised‖ and ―Statistical thinking is emphasised.‖
Statistical literacy was assessed by how well the textbook emphasised the use and understanding
of the language, symbols and communication of statistics rather than focussing on mathematical
processes. We imagined asking the students to explain their understanding of statistical concepts
to their peers, and then evaluated how well the textbook‘s exposition enabled the students to
articulate such an explanation. In line with Bloom‘s Taxonomy (Bloom et al. 1956), for both
criteria, the textbook was deemed effective if it enabled a student to critically evaluate and
synthesise statistical information rather than simply report output or a result without question.
ACCEPTED MANUSCRIPT
ACCEPTED MANUSCRIPT 11
Evaluation of textbooks for statistical thinking involved assessing them for how well students
were guided towards thinking about statistics in a situational context as part of a process or study
design rather than purely as a mathematical activity. The books were also assessed for how well
they encouraged students to think about statistical concepts to answer questions, choose
terminology, apply techniques and articulate results. To obtain a ―Strongly Agree‖ rating, the
textbook needed to describe research and statistics as an integrated process; some textbooks did
not embed statistics in this process.
It can prove difficult for students to understand the language and symbols used in statistics
(Dunn et al. 2016), so a glossary may be a useful feature. For this reason, we noted the type of
glossary, list of key terms, or similar (referred to here as a ―glossary‖). The type of glossary was
recorded as ―single‖ or ―multiple‖. A ―single glossary‖ is a glossary accessible from anywhere
in the textbook, typically at the end of the textbook, including hyperlinked glossaries found in
electronic textbooks. Multiple glossaries are typically glossaries or key terms listed at the end of
each chapter. We believe that a single glossary is preferable to multiple glossaries (though both
can be used successfully in the same textbook). End-of-chapter glossaries, usually presented as
summaries, are helpful, but without a single collection of easily-accessible definitions, students
are forced to search through a textbook to find clear definitions. For example, a student who
wishes to find the definition of a word from earlier in the textbook would need to know in which
chapter the word is defined and then turn to that end-of-chapter glossary, or use the index. In
either case, the disruption is significant. While evaluating the quality of the glossary would also
be beneficial, the task is considered outside the scope of the current study.
ACCEPTED MANUSCRIPT
ACCEPTED MANUSCRIPT 12
3.4 GAISE recommendation 2: Using real data
The second GAISE recommendation emphasises the use of real data, because
It is important to use real data in teaching statistics to be authentic to consider issues
related to how and why the data were produced or collected, and to relate the analysis to
the problem context. Using real data sets of interest to students is also a good way to
engage them in thinking about the data and relevant statistical concepts (Aliaga et al.
2010, p. 16)
In other words, ―if you only have pretend data, you can only pretend to analyze it‖ (Watkins et al.
2011, p. xiv).
As a result, each textbook was evaluated on whether real data were used throughout. However,
using real data does not necessarily mean that the data are used well; consequently, each
textbook was also evaluated on whether real data are used effectively. Hence, two statements
were evaluated: ―Real data are used often throughout the text‖ and ―Real data are used
effectively.‖ As an aside, the GAISE report acknowledges that ―sometimes, hypothetical data
sets may be used to illustrate a particular point‖ (Aliaga et al. 2010, p. 16), as the famous
Anscombe (1973) data sets demonstrates.
In evaluating the first criterion (the use of real data), we noted how often real data were used, as
evidenced by references to data sets, links to journal articles, newspaper articles, and examples,
or to student projects. In evaluating the second criterion (how effectively the real data were
used), we considered whether data came from accessible scenarios that students could readily
―walk into‖, rather than having to comprehend substantial pre-requisite background knowledge to
understand the data and hence the analysis. Of course, this must be balanced against the desire to
ACCEPTED MANUSCRIPT
ACCEPTED MANUSCRIPT 13
present statistics as useful in important real-world scenarios. In some cases, the data come from
studies that students can replicate. In addition, we determined whether using the data was helpful
for understanding the concept being discussed based on teaching experience.
3.5 GAISE recommendation 3: Stress concepts over procedures
The third GAISE recommendation emphasises teaching concepts over procedures. The GAISE
recommendations state that:
…if students don‘t understand the important concepts, there‘s little value in knowing a
set of procedures. If they understand the concepts well, then particular procedures will be
easy to learn (Aliaga et al. 2010, p. 17).
Each textbook was evaluated by rating the statement ―Conceptual understanding is stressed,
rather than mere knowledge of procedures.‖
We identified if the textbook outlined steps to complete a test or produced a result
mathematically without also offering an explanation of the concept and purpose. A textbook was
rated highly if the conceptual explanation made a significant contribution to enabling students to
communicate the results of their analysis, explain why the results are important, report the
results, and explain why their choice of technique is sound. This is in contrast to (for example)
simply stating an outcome from a hypothesis test.
3.6 GAISE recommendation 5: Use technology
Textbooks may provide instructions on the use of statistical software explicitly, or provide
software output to be interpreted; some textbooks tightly integrate a statistical software package,
some textbooks briefly mention how to use a small number of packages, while others make no
specific mention of any software package and leave it to instructors to adopt (and teach) their
ACCEPTED MANUSCRIPT
ACCEPTED MANUSCRIPT 14
software of choice. For these reasons, we only refer to the use of statistical software
descriptively without evaluating how these interpret the GAISE recommendations. A research
assistant (RA) examined each textbook in terms of how it outlined a method for analysing data
using a calculator or computer software. Some textbooks include step-by-step instructions and
screenshots to help guide users. Two statements were evaluated on the five-point ordinal scale
for each textbook: ―The software is integrated with the text‖ and ―Technology is used for
developing conceptual understanding.‖ Using software to develop concepts was rated as
―Crucial‖ if teaching concepts from the textbook would be extremely difficult without using the
software; as ―Reasonably‖ if teaching concepts without the software was possible but required a
significant investment by the instructor; ―Moderately‖ if teaching concepts without the software
required a substantial number of minor changes; and ―Somewhat‖ if the necessary changes were
easily made; and ―Not at all‖ if the concepts could be taught without any modifications. The
software used in the textbook was also noted. The use of other technology—such as animations
and electronic supporting resources—are not evaluated for reasons explained earlier.
It may be useful to consider the relationship between GAISE 5 and GAISE 3 (stressing concepts
over procedures). While technology such as applets can be used to stress some concepts over
some procedures, we also recognise that some technology is used in a very procedural way, e.g.
to generate random data for drill-type testing of knowledge. For this reason we have kept GAISE
3 and GAISE 5 separate in our considerations.
3.7 Allocating the ratings
The RA answered the questions posed in Sections 3.3–3.6 to form subjective assessments of the
textbooks. The RA is an Honours graduate, who has been involved in tertiary-level introductory
ACCEPTED MANUSCRIPT
ACCEPTED MANUSCRIPT 15
statistics courses over 35 separate offerings, including coordinating, lecturing and teaching (in
addition to teaching other courses at university level over many years), and has taught using
many different introductory statistics textbooks.
Each textbook was evaluated as follows. Firstly, an overview of the textbook was obtained, by
reading the Table of Contents, reading the Preface, identifying the meaning of marginal icons,
and skimming the appendices. This was expanded by checking the general appearance (density
of text, proportion of diagrams, etc.), the audience for the textbook, and the overall approach
taken by the authors. Secondly, each individual criterion was evaluated for each textbook, one
criterion at a time.
After assessing six textbooks, the RA and the first author met to moderate those evaluations to
ensure validity of the ratings. After discussing and clarifying any ambiguities, the RA continued
to evaluate the remaining textbooks. At various points during the process, the RA and the first
author met regularly for further clarification to ensure consistency. At the conclusion of the
process, four textbooks that were examined earlier were re-examined and the ratings were
compared to those previously given to ensure no time-drift in the ratings.
Some readers may not agree with the evaluations we present, as the evaluations are necessarily
subjective. Thus, we present the results only as an impression of how well textbooks have
embraced the recommendations across a cross-section of textbooks.
3.8 Rating the exercises
Cobb (1987) notes that:

ACCEPTED MANUSCRIPT
ACCEPTED MANUSCRIPT 16
the quality of a book‘s exercises is the one [criterion] that I regard as most important,
because I believe that a student‘s experience with a statistics course is shaped far more by
doing homework than by attending lectures and reading chapters (p. 321).
In other words, one way to evaluate the features that a textbook author considers important is to
evaluate the exercises in the textbook.
To this end, the RA and the first author examined each textbook and evaluated the exercises for
how the exercises helped instructors to adopt the GAISE recommendations. With exercises,
unlike the exposition in the text itself, instructors have greater freedom to select exercises to
meet the needs of their students. Consider a textbook with many excellent exercises developing
statistical literacy, but also many poor exercises developing statistical literacy. The instructor
can select the excellent questions and omit the poor questions. This means that what is important
is that excellent exercises exist from which to choose, even if poor ones co-exist; these can
simply be ignored by the instructor. For this reason, the ratings concentrate on the presence of
effective exercises, but place less emphasis on the presence of poor exercises.
Exercises were rated by first reading the preface (or equivalent), where many textbooks explain
the textbook‘s rationale in the provision of exercises. Of course, the raters did not take the
authors‘ word on this, but spent considerable time evaluating the exercises that actually appeared
in the textbook. After reading the preface, the raters then examined the exercises from the initial
chapters, the chapters/sections on graphs and numerical summaries, and the chapters where
inference, confidence intervals and hypothesis testing were introduced.
Exercises were rated against similar statements to the ones used to rate each textbook overall by
rating each of the following statements on a three-point scale: Rarely or never, Sometimes, and
ACCEPTED MANUSCRIPT
ACCEPTED MANUSCRIPT 17
Often. We include the fourth GAISE recommendation (active learning) here for information
only, to see which textbooks explicitly provide active-learning exercises. As stated earlier,
instructors can use active learning in many exercises.
● GAISE 1: Two statements were considered: ―The textbook exercises provide
opportunities for students to develop statistical literacy‖ and ―The textbook exercises
provide opportunities for students to develop statistical thinking.‖
● GAISE 2: Two statements were considered: ―The textbook exercises provide
opportunities for students to use real data‖ and ―When real data are used, the textbook
exercises effectively use that real data.‖
● GAISE 3: One statement was considered: ―The textbook exercises provide opportunities
for students to develop conceptual understanding (rather than mere knowledge of
procedures).‖ Note that exercises asking students to engage in drill-type exercises and
knowledge of procedures may also be present in the exercises, but (as stated earlier) the
emphasis was on having opportunities for instructors to select exercises to develop
concepts.
● GAISE 4: One statement was considered: ―The textbook exercises provide opportunities
for students to engage in active learning.‖
The fifth GAISE recommendation was not considered because textbooks may use technology in
very different ways. For example, some textbooks may just give a large data set and ask students
to analyse it, without explicitly directing them to use software although software use is implicit.
In addition, some exercises can be completed with or without technology, depending on the
instructor, and different textbooks take different approaches to technology.
ACCEPTED MANUSCRIPT
ACCEPTED MANUSCRIPT 18
4. RESULTS AND DISCUSSION
In the 25 textbooks studied, seven mentioned the GAISE recommendations explicitly in the
Preface or equivalent, claiming to have adopted the GAISE recommendations. Mann (2010),
Peck (2014) and Moore et al. (2013) even outline how the GAISE recommendations are
integrated. The remaining 17 do not explicitly mention the GAISE recommendations, but may
of course be attempting to adopt these recommendations anyway.
Following evaluation of the GAISE recommendations, a mean score for each component over all
of the textbooks was computed (Table 1), offering a rudimentary and notional indication of how
well the textbooks performed overall on each recommendation. Since all the means exceed 3,
the textbooks generally perform well with adhering to the GAISE recommendations.
Furthermore, the majority of textbooks were rated as adhering to the recommendations. In many
cases, a rating of ―Strongly Agree‖ was difficult to attain, and for some criteria a small number
of textbooks were awarded poor ratings which influenced the mean scores.
We now address each of the GAISE recommendations, consider the results of the rating process
and discuss each one in turn. We also report on textbook exercises.
4.1 GAISE recommendation 1: Statistical literacy and statistical thinking
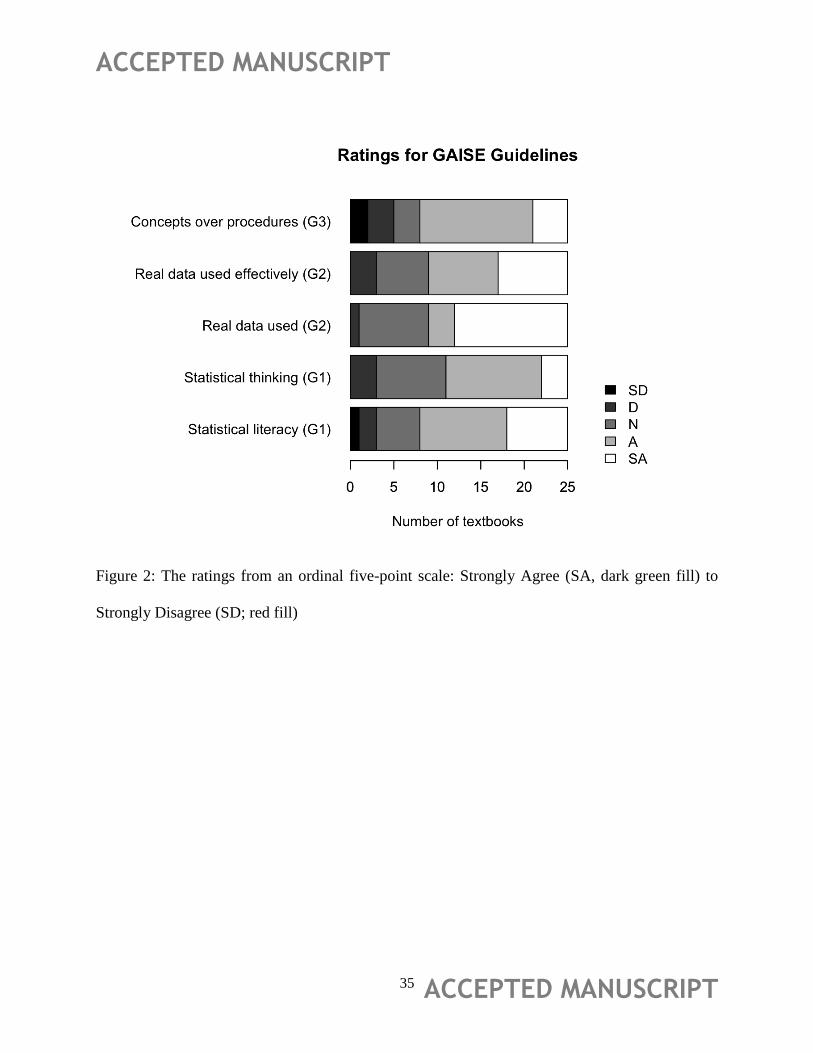
Our analysis suggests that many (but not all) textbooks emphasised statistical literacy, but fewer
emphasised statistical thinking (Figure 2). For the statistical literacy criterion, only one textbook
was rated as ―Strongly Disagree‖ (Dear 2014) and seven as ―Strongly Agree‖. Only three
textbooks were rated as strongly emphasising statistical thinking: Diez et al. (2012), Moore et al.
(2013) and MacGillivray et al. (2014). None were rated as ―Strongly Disagree‖, but three as
―Disagree‖.
ACCEPTED MANUSCRIPT
ACCEPTED MANUSCRIPT 19
As an example, Johnson and Bhattacharyya (2010) was rated as ―Disagree‖ for statistical
literacy, and statistical thinking. The textbook includes a section entitled Using statistics wisely
at the end of each chapter, but these sections do not always explain concepts in terms of
understanding (statistical literacy), meaning and purpose (statistical thinking). Moore et al.
(2013; rated as ―Agree‖ for statistical literacy and ―Strongly Agree‖ for statistical thinking)
includes a preface for students called Statistical Thinking to encourage students to think in this
manner. (In all cases, ratings were applied according to the content, not by section titles that
appear.)
These two features of the textbooks are, unsurprisingly, related: the Spearman correlation
between the two ratings is 0.41 (p = 0.04 in this non-random sample). In other words, textbooks
that tend to emphasise statistical literacy well also tend to emphasise statistical thinking well.
While many textbooks rated well for statistical literacy, few included a clear and comprehensive
glossary, though most included definitions scattered throughout the text. Single glossaries were
unexpectedly rare: only one hardcopy textbook had an end-of-textbook glossary (Watkins et al.
2011), while the three electronic textbooks (Lane 2013a; Lane 2013b; Dear 2014) all used a
single glossary accessible via hyperlinks. Five textbooks had a glossary at the end of each
chapter, while 16 textbooks had no glossary or list of key terms anywhere.
The glossaries in the electronic textbooks were the easiest to use: clicking on a hyperlinked term
immediately reveals the word‘s definition. Given the significant number of linguistic challenges
associated with the language used in statistics (Dunn et al. 2016), the dearth of glossaries is
surprising.
ACCEPTED MANUSCRIPT
ACCEPTED MANUSCRIPT 20
4.2 GAISE recommendation 2: Using real data
The results (Figure 2) show that real data are featured prominently except for one textbook (Lane
2013b), but not always effectively. Some textbooks use real data to present the use of statistics
in the real world, but sometimes the data may not be accessible or require prior knowledge for
students to understand sufficiently. For example, Johnson and Kuby (2012, p. 220; rated as
―Neither‖ for using real data and ―Disagree‖ for effective use of real data) use an example on
polishing a microchip that requires substantial reading and is somewhat technical, but
nonetheless shows the power of statistics. Many of the real data sets used in MacGillivray et al.
(2014; rated as ―Strongly Agree‖ on both criteria) come from student projects, which probably
ensures the data are accessible to students. Utts (2015; rated as ―Strongly Agree‖ for using real
data, and ―Agree‖ for effective use of real data) draws many examples from newspaper and
current affairs reports with a focus on interpretation.
These two features (use of real data; effective use of data) of the textbooks are, unsurprisingly,
related: the Spearman correlation between the two ratings is 0.45 (p = 0.026 in this non-random
sample). In other words, textbooks that tend to use real data more often also tend to use that real
data effectively more often.
4.3 GAISE recommendation 3: Stress concepts over procedures
Most of the textbooks in our study emphasise concepts over procedures (Figure 2). For example,
Lane‘s (2013b; rated as ―Agree‖) introduces hypothesis testing before any mathematics to stress
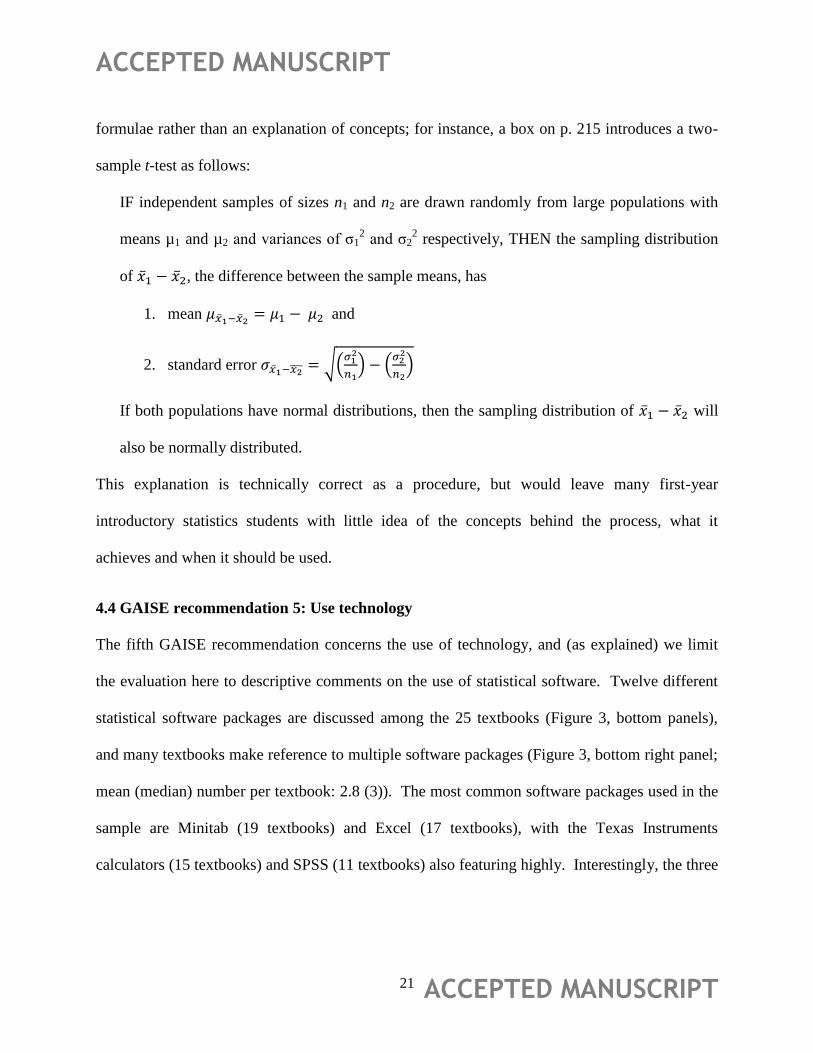
the concepts without the distraction of computation. However, Johnson and Kuby (2012, rated
as ―Strongly Disagree‖) provide examples of hypothesis testing that emphasise procedures and
ACCEPTED MANUSCRIPT
ACCEPTED MANUSCRIPT 21
formulae rather than an explanation of concepts; for instance, a box on p. 215 introduces a two-
sample t-test as follows:
IF independent samples of sizes n1 and n2 are drawn randomly from large populations with
means µ1 and µ2 and variances of σ12 and σ2
2 respectively, THEN the sampling distribution
of ̅ ̅ , the difference between the sample means, has
1. mean ̅ ̅ and
2. standard error ̅ ̅̅̅̅ √(
) (
)
If both populations have normal distributions, then the sampling distribution of ̅ ̅ will
also be normally distributed.
This explanation is technically correct as a procedure, but would leave many first-year
introductory statistics students with little idea of the concepts behind the process, what it
achieves and when it should be used.
4.4 GAISE recommendation 5: Use technology
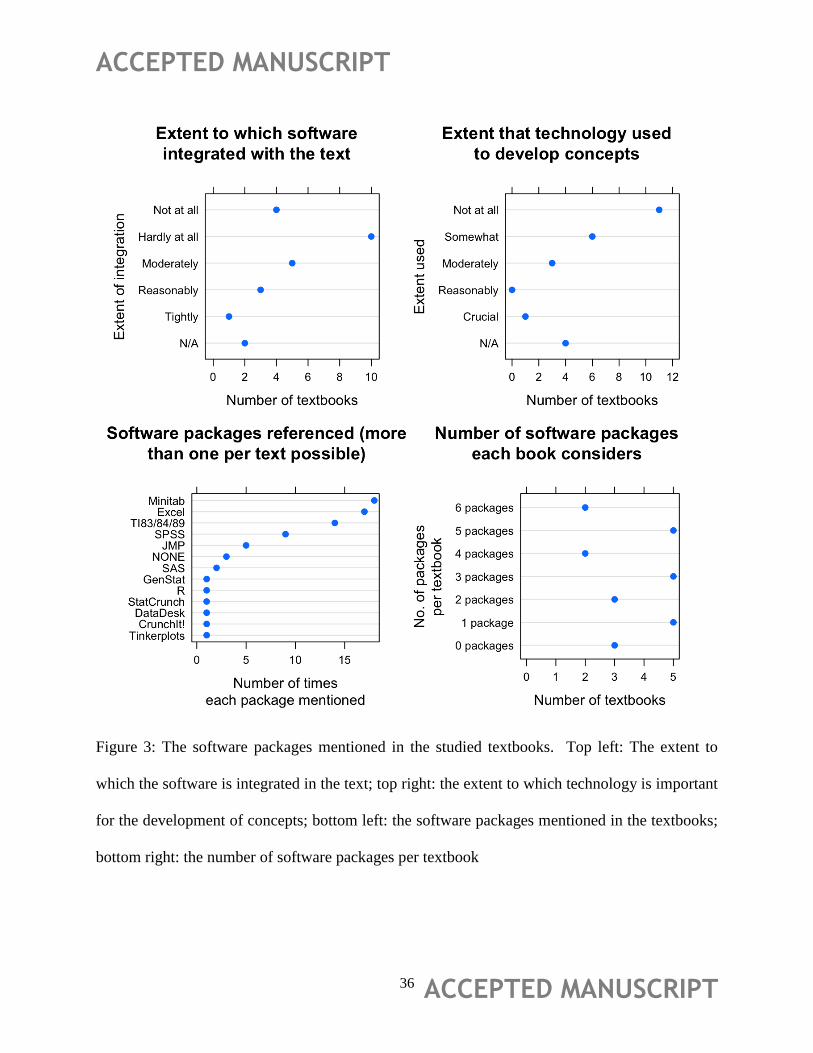
The fifth GAISE recommendation concerns the use of technology, and (as explained) we limit
the evaluation here to descriptive comments on the use of statistical software. Twelve different
statistical software packages are discussed among the 25 textbooks (Figure 3, bottom panels),
and many textbooks make reference to multiple software packages (Figure 3, bottom right panel;
mean (median) number per textbook: 2.8 (3)). The most common software packages used in the
sample are Minitab (19 textbooks) and Excel (17 textbooks), with the Texas Instruments
calculators (15 textbooks) and SPSS (11 textbooks) also featuring highly. Interestingly, the three

ACCEPTED MANUSCRIPT
ACCEPTED MANUSCRIPT 22
textbooks that do not feature software are online and electronic textbooks: Diez et al. (2012),
Lane (2013a) and Lane (2013b). These textbooks do not refer to any particular technology.
Despite software featuring in almost every textbook, textbooks take different approaches to using
software (Figure 3, top panels). For example, Bock et al. (2010) collate short instructions for
implementing techniques in six different software packages (including Texas Instruments
calculators), usually at the end of each chapter. Agresti and Franklin (2009) show Minitab, SPSS
and Excel output in many problems, and ask for interpretation, but the textbook itself does not
include instructions for using software (though supplements are available to do so). Watkins et
al. (2011) sometimes show computer output, but the image is clearly manipulated and the source
is unstated. Many texts include electronic data files either with the textbook or on associated
web pages. Moore et al. (2013) often suggest different approaches to analysis depending on
whether the data set and technology is available.
The way in which the software was used to develop the concepts was also considered (Figure 3,
top right panel), though this may be more the domain of the classroom where interaction with the
software is possible.
4.5 Textbook exercises
As explained in Section 3.8, the quality of the exercises provided in a textbook may be
associated with how well students learn (though, as others have observed (for example, Zieffler
et al. 2013), evaluations are far more complex than this). The content of the exercises may also
reveal what the authors deem as important activities for the students. In these ratings, one
textbook (Zieffler et al. 2013) has been omitted (hence n = 24 for this section only) since the
ACCEPTED MANUSCRIPT
ACCEPTED MANUSCRIPT 23
textbook‘s structure is very different from the other (traditional) textbooks: students are
participating throughout the exposition and a traditional set of exercises is not present.
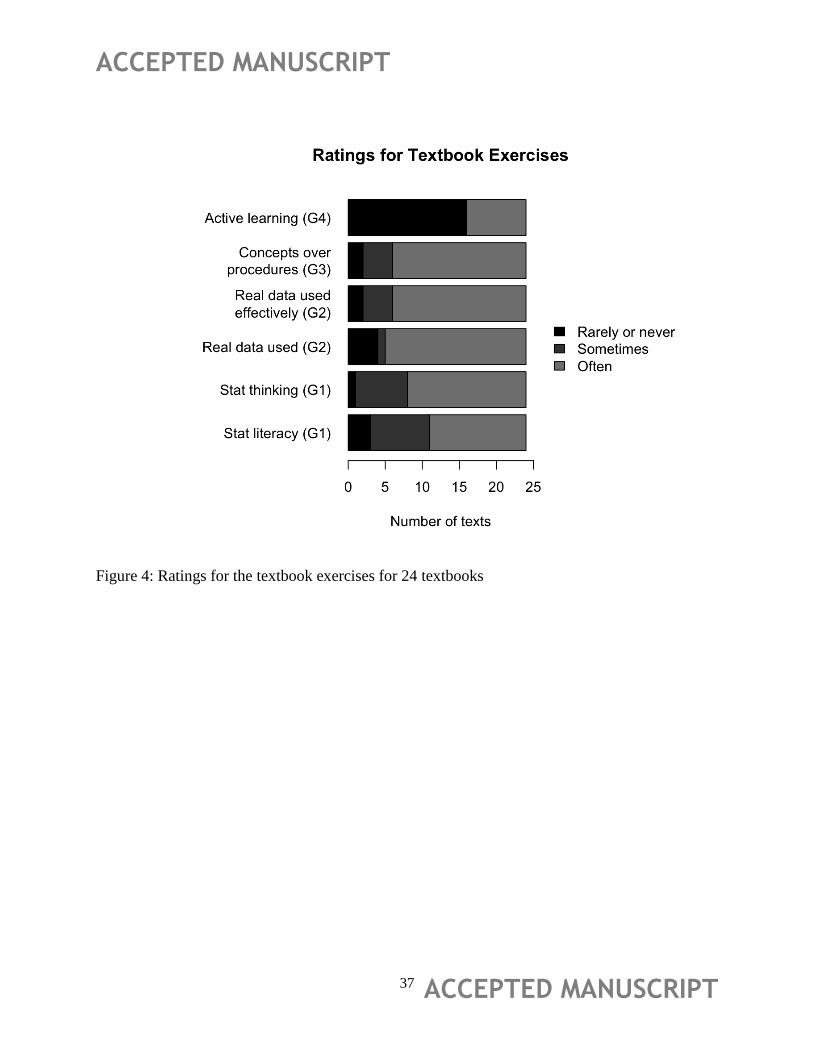
The ratings (Figure 4) show that active learning exercises rarely appear. For one textbook (Utts
and Heckard 2012), the rating applied was ―Rarely or never‖ as activity-based exercises were not
included in the textbook; however, an optional Activities Manual was available online (Utts and
Heckard 2012) to support the textbook. Hence, for this textbook, the ratings reflect the exercises
that appear in the textbook, which is the scope of this study, but the supporting resources actually
offer numerous opportunities for active learning. Furthermore, active learning ―speaks more to
pedagogy and classroom practice‖ (Peck et al. 2006, p. xv), and so the absence of these types of
exercises should not necessarily be considered as negative.
In other categories of exercises, most textbooks provided a sufficient number of good exercises.
Nine textbooks were rated as ―Often‖ for five of the criteria (excluding the active learning
criterion): .Wild and Seber 2000; Utts 2005; Agresti and Franklin 2009; Watkins, Scheaffer and
Cobb 2011; Johnson and Kuby 2012; Larson and Farber 2012; Moore, Notz and Fligner 2013;
Peck 2014; and Utts 2015. Interestingly, exercises for statistical literacy are the least common of
these.
In contrast, Brase and Brase (2012; rated as ―Agree‖ for statistical literacy and ―Neither‖ for
statistical thinking) label some end-of-section exercises as Statistical Literacy exercises which
indeed are focussed on statistical literacy. MacGillivray et al. (2014; rated as ―Strongly Agree‖
on both criteria) emphasise graphical representation and interpretation, and begin the textbook
with a chapter called ―Statistical thinking‖ which encourages students to think statistically about
a problem.
ACCEPTED MANUSCRIPT
ACCEPTED MANUSCRIPT 24
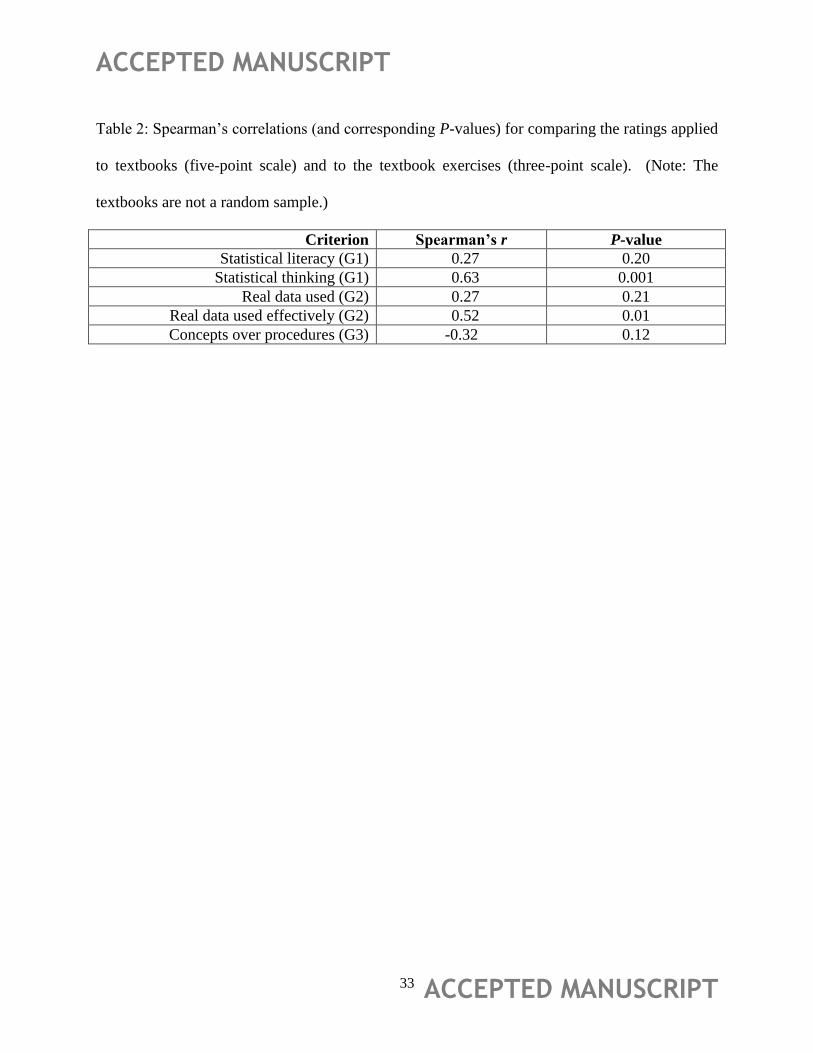
Of interest is how the ratings applied to the textbook exposition compared to the ratings applied
to the textbook exercises (Table 2). Evidence of a relationship between the exposition and the
exercises exists for statistical thinking and using real data effectively, but not for the other
criteria. This perhaps suggests that some authors are more intentional at incorporating statistical
thinking and effective use of real data throughout their textbooks.
5. CONCLUSION
The GAISE recommendations comprise six recommendations for the teaching of introductory
statistics courses. The recommendations are to be updated soon. This paper has identified how a
sample of introductory statistics textbooks have adopted the three recommendations most
relevant to textbooks, as well as making some comments on the other recommendations.
In collating this information, the authors recognise many factors that influence the choice of
textbook at a particular place and time, not just the GAISE recommendations, and so we have
refrained from offering a ―league table‖ of textbooks. The relative value of each criterion may
depend on the course in which the textbook is being used; indeed, as stated earlier, an
introductory statistics course may be excellent because of, or in spite of, the textbook adopted for
that course. That is, the textbook is part of the teaching and learning experience, and a masterful
instructor can produce an excellent course regardless of the textbook. Furthermore, in
interpreting the ratings applied in this paper, the reader must be aware that the ratings are
subjective.
In general, the textbooks appear to be adopting the GAISE recommendations reasonably well. In
particular, the textbooks were adept at using real data, using real data well, and promoting
statistical literacy. However, while the textbooks performed reasonably well at promoting
ACCEPTED MANUSCRIPT
ACCEPTED MANUSCRIPT 25
statistical thinking and emphasising concepts over procedures, many textbooks have room for
improvement given that these two aspects are crucial to statistics education. Similarly, textbooks
typically included fewer exercises on statistical literacy than other types of exercises. A notable
deficit appears to be glossaries that assist students to understand statistical terminology and
concepts.
In summary, the textbooks examined perform reasonably well in adopting the GAISE
recommendations. While many textbooks perform well, nonetheless we make three general
recommendations for textbook authors:
● That textbooks include more exercises explicitly integrating statistical literacy;
● That textbooks include enhanced expositions of statistical thinking while emphasising
concepts over procedures;
● That textbooks include single glossaries to assist students with understanding the
language of statistics.
Finally, while this paper has examined the textbooks‘ approaches to adopting the GAISE
recommendations, this is not the only consideration. Instructors must balance other criteria
before choosing a textbook for their course, such as content coverage, general approach,
supplementary material that is available, and organisation of topics.
ACCEPTED MANUSCRIPT
ACCEPTED MANUSCRIPT 26
REFERENCES
Reference preceded by * are the textbooks evaluated in this paper, and are followed by the code
used in the paper.
Agresti, A., and Coull, B. A. (1998), ―Approximate is Better than ―Exact‖ for Interval
Estimation of Binomial Proportions,‖ The American Statistician, 52, 119–126.
*Agresti, A., and Franklin, C. A. (2009), Statistics: The Art and Science of Learning from Data,
Upper Saddle River, NJ: Pearson Prentice Hall. [AF2009]
Aliaga, M., Cobb, G., Cuff, C., Garfield, J., Gould, R., Lock, R., Moore, T., Rossman, A.,
Stephenson, B., Utts, J., Velleman, P., and Witmer, J. (2010), Guidelines for Assessment and
Instruction in Statistics Education: College Report. Technical report, American Statistical
Association.
Anscombe, F. (1973), ―Graphs in Statistical Analysis,‖ The American Statistician, 27, 17–21.
Ball, D. L., and Cohen, D. K. (1996), ―Reform by the Book: What is—or might be—the Role of
Curriculum Materials in Teacher Learning and Instructional Reform?,‖ Educational
Researcher, 25, 6–8.
Bargagliotti, A. E. (2012), ―How well do the NSF Funded Elementary Mathematics Curricula
Align with the GAISE Report Recommendations?‖, Journal of Statistics Education, 20.
Bloom, B. S., Engelhart, M. D., Furst, E. J., Hill, W. H., Krathwohl, D. R. (1956), Taxonomy of
Educational Objectives: The Classification of Educational Goals. Handbook I: Cognitive
Domain. New York: David McKay Company.
*Bock, D. E., Velleman, P. F., and De Veaux, R. D. (2010), Stats: Modeling the World (3rd ed.),
Boston, MA: Addison-Wesley. [BVD2010]
ACCEPTED MANUSCRIPT
ACCEPTED MANUSCRIPT 27
*Bennett, J. O., Briggs, W. L., and Triola, M. F. (2008), Statistical Reasoning for Everyday Life
(3rd ed.), Boston, MA: Pearson Addison-Wesley. [BBT2008]
*Brase, C. H., and Brase, C. P. (2012), Understandable Statistics: Concepts and Methods (10th
ed.), Stamford CT: Cengage Learning. [BB2012]
Chervany, N. L., Collier Jr., R. O., Fienberg, S. E., Johnson, P. E., and Neter, J. (1977), ―A
Framework for the Development of Measurement Instruments for Evaluating the
Introductory Statistics Course,‖ The American Statistician, 31(1), 17–23.
Cobb, G. W. (1987), ―Introductory Textbooks: A Framework for Evaluation,‖ Journal of the
American Statistical Association, 82(397), 321–339.
Cobb, G. (1992), Heeding the Call for Change: Suggestions for Curricular Action, Chapter 1:
Teaching Statistics, pages 3–43, The Mathematical Association of America.
*Dear, K. (2014), SurfStat Australia: An Online Text in Introductory Statistics. Available at
https://surfstat.anu.edu.au/surfstat-home/surfstat.html. [Dear2014]
*Diez, D. M., Barr, C. D., and Çetinkaya-Rundel, M. (2012), OpenIntro Statistics, (2nd ed.).
Available at https://www.openintro.org/stat/textbook.php. [DBC2012]
Dunn, P. K., Carey, M. C., Richardson, A. M., and McDonald, C. (2016), ―Learning the
Language of Statistics: Challenges and Teaching Approaches,‖ Statistical Education
Research Journal, 15(1).
Eisenmann, T., and Even, R. (2009), ―Similarities and Differences in the Types of Algebraic
Activities in Two Classes Taught by the Same Teacher‖. In J. T. Remillard, B. A. Herbel-
Eisenmann and G. M. Lloyd (eds). Mathematics Teachers at Work: Connecting Curriculum
ACCEPTED MANUSCRIPT
ACCEPTED MANUSCRIPT 28
Materials and Classroom instruction (pp. 231–245). Dordrecht: Kluwer Academic
Publishers.
Everson, M. (2015), ―GAISE 2015: New Report for a New Era,‖ AMSTAT News, 456, 29.
Field, A (2013), Discovering Statistics using IBM SPSS Statistics (4th ed.). London, UK: Sage
Publications.
Franklin, C., Kader, G., Mewborn, D., Moreno, J., Peck, R., Perry, M., and Scheaffer, R. (2007),
Guidelines for Assessment and Instruction in Statistics Education (GAISE) Report: A Pre-K–
12 Curriculum Framework. Technical report, American Statistical Association.
Gravetter, F. J., and Wallnau, L. B. (2013), Essential Statistics for the Behavioral Sciences (8th
ed.), Stamford CT: Cengage Learning.
Harwell, M. R., Herrick, M. L., Curtis, D., Mundfrom, D., and Gold, K. (1996), ―Evaluating
Statistics Texts used in Education,‖ Journal of Educational and Behavioral Statistics, 21(1),
3–34.
Herrick, M. L., and Gold, K. (1994), ―Establishing Objective Criteria for Evaluating Statistics
Texts‖. Paper presented at the Annual Meeting of the American Educational Research
Association, New Orleans, LA, April 4–8.
Huberty, C. J., and Barton, R. M. (1990), ―A review of ―Applied Multivariate Statistics
textbooks‖,‖ Applied Psychological Measurement, 14(1), 95–101.
*Johnson, R. R., and Kuby, P. (2000), Elementary Statistics (8th ed.), Pacific Grove, CA:
Duxbury. [JK2000]
*Johnson, R. and Kuby, P. (2012), STAT 2 (2nd ed.), Boston, MA: Cengage Learning. [JK2012]
ACCEPTED MANUSCRIPT
ACCEPTED MANUSCRIPT 29
*Johnson, R. A., and Bhattacharyya, G. K. (2010), Statistics: Principles and Methods (6th ed.),
Hoboken, NY: John Wiley & Sons. [JB2010]
*Lane, D. M. (2013a), Introduction to Statistics: An Interactive e-Book, David M. Lane. [iPad e-
book, downloaded from iTunes] [Lane2013a]
*—(2013b), HyperStat. Available at http://davidmlane.com/hyperstat/. [Lane2013b]
*Larson, R., and Farber, B. (2012), Elementary Statistics: Picturing the World (5th ed.), Boston,
MA: Addison-Wesley. [LF2012]
Levitt, S. D., and Dubner, S. J. (2010), Freakonomics: A Rogue Economist Explores the Hidden
Side of Everything, New York: HarperCollins.
Love, E., and Pimm, D. (1996). ―‗This is so‘: A Text on Texts‖. In A. J. Bishop, K. Clements, C.
Keitel, J. Kilpatrick & C. Laborde (Eds.), International Handbook of Mathematics Education
(Vol. 1, pp. 371–409). Dordrecht, The Netherlands: Kluwer Academic Publishers.
*MacGillivray, H., Utts, J., and Heckard, R. F. (2011), Mind on Statistics (1st ed.), Melbourne,
Australia: Cengage Learning Australia. [MUH2011]
*MacGillivray, H., Utts, J., and Heckard, R. F. (2014), Mind on Statistics (2nd ed.), Melbourne,
Australia: Cengage Learning Australia. [MUH2014]
*Mann, P. S. (2010), Introductory Statistics (7th ed.), New York: John Wiley & Sons.
[Mann2010]
Moore, D. S. (1997), ―New Pedagogy and New Content: The Case of Statistics,‖ International
Statistical Review, 2, 123–165.
*——(2003), The Basic Practice of Statistics (3rd ed.), New York: W. H. Freeman and
Company. [M2003]
ACCEPTED MANUSCRIPT
ACCEPTED MANUSCRIPT 30
*Moore, D. S., and McCabe, G. P. (1993), Introduction to the Practice of Statistics (2nd ed.),
New York: W. H. Freeman and Company. [MM1993]
*Moore, D. S., Notz, W. I., and Fligner, M. A. (2013), The Basic Practice of Statistics (6th ed.),
New York: W. H. Freeman and Company. [MNF2013]
*Peck, R. (2014), Statistics: Learning from Data, Stamford, CT: Cengage Learning. [Peck2014]
Peck, R., Casella, G., Cobb, G., Hoerl, R., Nolan, D., Starbuck, R., and Stern, H. (2006),
Statistics: A Guide to the Unknown (4th ed.), Belmont, CA: Thomson Brooks/Cole.
Rumsey, D. J. (2011), Statistics for Dummies (2nd ed.), For Dummies.
Schacht, S. P. (1990), ―Statistics Textbooks: Pedagogical Tools or Impediments to Learning?‖
Teaching Sociology, 18(3), 390–396.
*Utts, J. (2005), Seeing through Statistics (3rd ed.), Belmont, CA: Thomson Brooks/Cole.
[Utts2005]
—— (2013), ―Comment: The Future of the Textbook,‖ Technology Innovations in Statistics
Education, 7(3). Available at http://escholarship.org/uc/item/95x7k28h.
*—— (2015), Seeing Through Statistics (4th ed.), Stamford, CT: Cengage Learning. [Utts2015]
*Utts, J., and Heckard, R. F. (2012), Mind on Statistics (4th ed.), Boston, MA: Brooks/Cole
Cengage Learning. [UttsH2012]
*Watkins, A. E., Scheaffer, R. L., and Cobb, G. W. (2011), Statistics: From Data to Decision,
New York: John Wiley & Sons. [WSC2011]
West, W. (2013), ―Textbooks 2.0,‖ Technology Innovations in Statistics Education, 7(3).
Available at http://escholarship.org/uc/item/8mv5b3zt
ACCEPTED MANUSCRIPT
ACCEPTED MANUSCRIPT 31
*Wild, C. J., and Seber, G. A. F. (2000), Chance Encounters: A First Course in Data Analysis
and Inference, New York: John Wiley & Sons. [WS2000]
Woodard, R., and McGowan, H. (2012), ―Redesigning a Large Introductory Course to
Incorporate the GAISE Guidelines,‖ Journal of Statistics Education, 20(3). Available at
http://www.amstat.org/publications/jse/v20n3/woodard.pdf.
Zieffler, A., Isaak, R., and Garfield, J. (2013), ―The Course as Textbook: A Symbiotic
Relationship in the Introductory Statistics Class,‖ Technology Innovations in Statistics
Education, 7(3). Available at http://escholarship.org/uc/item/12q2z58x.
*Zieffler, A., and Catalysts for Change (2013), Statistical Thinking: A Simulation Approach to
Uncertainty (2nd ed.), Minneapolis, MN: Catalyst Press. [Z2013]
ACCEPTED MANUSCRIPT
ACCEPTED MANUSCRIPT 32
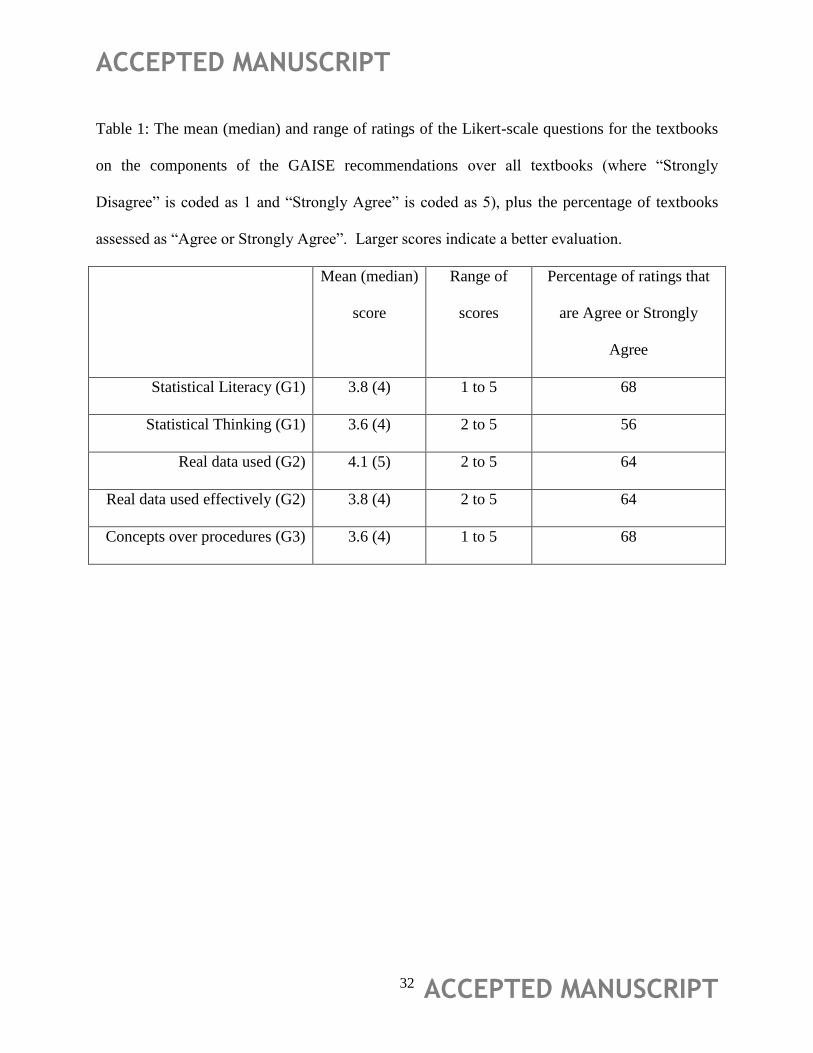
Table 1: The mean (median) and range of ratings of the Likert-scale questions for the textbooks
on the components of the GAISE recommendations over all textbooks (where ―Strongly
Disagree‖ is coded as 1 and ―Strongly Agree‖ is coded as 5), plus the percentage of textbooks
assessed as ―Agree or Strongly Agree‖. Larger scores indicate a better evaluation.
Mean (median)
score
Range of
scores
Percentage of ratings that
are Agree or Strongly
Agree
Statistical Literacy (G1) 3.8 (4) 1 to 5 68
Statistical Thinking (G1) 3.6 (4) 2 to 5 56
Real data used (G2) 4.1 (5) 2 to 5 64
Real data used effectively (G2) 3.8 (4) 2 to 5 64
Concepts over procedures (G3) 3.6 (4) 1 to 5 68
ACCEPTED MANUSCRIPT
ACCEPTED MANUSCRIPT 33
Table 2: Spearman‘s correlations (and corresponding P-values) for comparing the ratings applied
to textbooks (five-point scale) and to the textbook exercises (three-point scale). (Note: The
textbooks are not a random sample.)
Criterion Spearman’s r P-value
Statistical literacy (G1) 0.27 0.20
Statistical thinking (G1) 0.63 0.001
Real data used (G2) 0.27 0.21
Real data used effectively (G2) 0.52 0.01
Concepts over procedures (G3) -0.32 0.12

ACCEPTED MANUSCRIPT
ACCEPTED MANUSCRIPT 34
Figure 1: The years of publication for the 25 textbooks in the study. The vertical dashed line
corresponds to the release of the formal GAISE report (Aliaga et al. 2010), while the vertical
dotted line corresponds to the release of the initial GAISE report in 2005.
ACCEPTED MANUSCRIPT
ACCEPTED MANUSCRIPT 35
Figure 2: The ratings from an ordinal five-point scale: Strongly Agree (SA, dark green fill) to
Strongly Disagree (SD; red fill)
ACCEPTED MANUSCRIPT
ACCEPTED MANUSCRIPT 36
Figure 3: The software packages mentioned in the studied textbooks. Top left: The extent to
which the software is integrated in the text; top right: the extent to which technology is important
for the development of concepts; bottom left: the software packages mentioned in the textbooks;
bottom right: the number of software packages per textbook
ACCEPTED MANUSCRIPT
ACCEPTED MANUSCRIPT 37
Figure 4: Ratings for the textbook exercises for 24 textbooks