matera vlbi station report on the operational and performance
TRANSCRIPT

180.010180.010180.010180.010----CSMCSMCSMCSM----YRRYRRYRRYRR----2000200020002000----VLBIVLBIVLBIVLBI Date: 02/18/01 Pag.1 of 31
MATERA VLBI STATION REPORT ON THE OPERATIONAL AND
PERFORMANCE EVALUATION ACTIVITIES FROM JANUARY TO DECEMBER 2000
Document Nr.:180.010-CSM-YRR-2000-VLBI
Date: February '01
Name Date Signature
Authors:
E.LUNALBI
Reviewed :
L. GARRAMONE D. DEL ROSSO G. COLUCCI
Authorized :
M. MARIANI

180.010180.010180.010180.010----CSMCSMCSMCSM----YRRYRRYRRYRR----2000200020002000----VLBIVLBIVLBIVLBI Date: 02/18/01 Pag.2 of 31
For further information, contact Centro di Geodesia Spaziale "G. Colombo" Ctr.da Terlecchia P.O. Box 155 75100 Matera - Italy Tel. 39-835-377207 Fax 39-835-334951 E-Mail [email protected]

180.010180.010180.010180.010----CSMCSMCSMCSM----YRRYRRYRRYRR----2000200020002000----VLBIVLBIVLBIVLBI Date: 02/18/01 Pag.3 of 31
SUMMARY
SUMMARY .................................................................................................................................... 3 INTRODUCTION........................................................................................................................... 4 PART -A- OPERATIONAL ACTIVITY ........................................................................................ 5
1. DATA ACQUISITION ACTIVITY................................................................................... 6 1.1. VLBI CAMPAIGNS.......................................................................................... 6
2. MAINTENANCE AND UPGRADES ACTIVITY............................................................. 8 2.1. UPGRADES.................................................................................................... 8 2.2. PROGRAMMED MAINTENANCE .................................................................. 9 2.3. NON PROGRAMMED MAINTENANCE......................................................... 9
3. RADIO FREQUENCY INTERFERENCIES MEASUREMENTS................................. 10 PART -B- PERFORMANCE EVALUATION ............................................................................. 11
1. THE MATERA VLBI SYSTEM .................................................................................... 12 2. ANTENNA................................................................................................................... 13
2.1. ANTENNA MAIN CHARACTERISTICS........................................................ 13 2.2. ANTENNA PERFORMANCE........................................................................ 16
3. TIME AND FREQUENCY SYSTEM ........................................................................... 20 3.1. GENERAL CONFIGURATION ..................................................................... 20 3.2. PERFORMANCE.......................................................................................... 22 3.3. THE FREQUENCY STANDARDS ROOM.................................................... 24
4. MARK-IV DATA ACQUISITION TERMINAL............................................................... 26 4.1. MARK-IV D.A.T. DESCRIPTION.................................................................. 26 4.2. PRE-ESPERIMENT CHECK-OUT ............................................................... 27
5. COMPUTER SYSTEM ............................................................................................... 28 5.1. ARCHITECTURE.......................................................................................... 28 5.2. ANTENNA CONTROL SOFTWARE ............................................................ 28
APPENDIX................................................................................................................................... 30 REFERENCES ............................................................................................................................ 31

180.010180.010180.010180.010----CSMCSMCSMCSM----YRRYRRYRRYRR----2000200020002000----VLBIVLBIVLBIVLBI Date: 02/18/01 Pag.4 of 31
INTRODUCTION
The Matera VLBI System, installed under contracts between AGENZIA SPAZIALE ITALIANA and SELENIA SPAZIO (design and construction of the 20 meter antenna) and between AGENZIA SPAZIALE ITALIANA and TELESPAZIO (procurement and integration of the MARK-III Data Acquisition Terminal), became operational in MAY 1990, with a 6 hours experiment involving 4 European VLBI stations. Since then, the VLBI system has been operated by TELESPAZIO under a contract with ASI, performing 427 experiments up to December 2000. Fig. 1 shows the summary, in terms of hours of acquisition, from May 1990 up to December 2000. This report describes the tests and data analysis carried-out to evaluate the performance of the VLBI system and the operational activities from January to December 2000. The performance evaluation and the operational report have been made by E. Lunalbi and G. Colucci with the support, on the field, of the Matera operational team.
Fig. 1 Summary of acquisition from May 1990 to December 2000
Year Hours 1990 126,0 1991 549,0 1992 873,0 1993 829,5 1994 928,0 1995 238,5 1996 334,4 1997 763,3 1998 1066,3 1999 735,2 2000 874,0
7317,2
Total hours
0.0200.0
400.0600.0
800.01000.0
1200.0
1990 1991 1992 1993 1994 1995 1996 1997 1998 1999 2000
Years
Hou
rs

180.010180.010180.010180.010----CSMCSMCSMCSM----YRRYRRYRRYRR----2000200020002000----VLBIVLBIVLBIVLBI Date: 02/18/01 Pag.5 of 31
PART -A- OPERATIONAL ACTIVITY
180.010180.010180.010180.010----CSMCSMCSMCSM----YRRYRRYRRYRR----2000200020002000----VLBIVLBIVLBIVLBI Date: 02/18/01 Pag.6 of 31
1. DATA ACQUISITION ACTIVITY
1.1. VLBI CAMPAIGNS
The summary of the VLBI campaigns made from January to December '00, is reported in Tab. 1. During the 2000, Matera participated to 37 VLBI campaigns for a total of 874 hours of acquisitions. In particular Matera was involved in: • 19 CORE-A experiments coordinated by National Aeronautic and
Space Administration (NASA) • 6 EUROPE experiments coordinated by Max Plank Institut Fuer
Radioastronomie (MPIFR) • 5 NEOS-A experiments coordinated by United States Naval
Observatory (USNO) • 6 RDV experiments coordinated by National Aeronautic and Space
Administration (NASA) • 1 ESO experiment coordinated by National Council of Researches
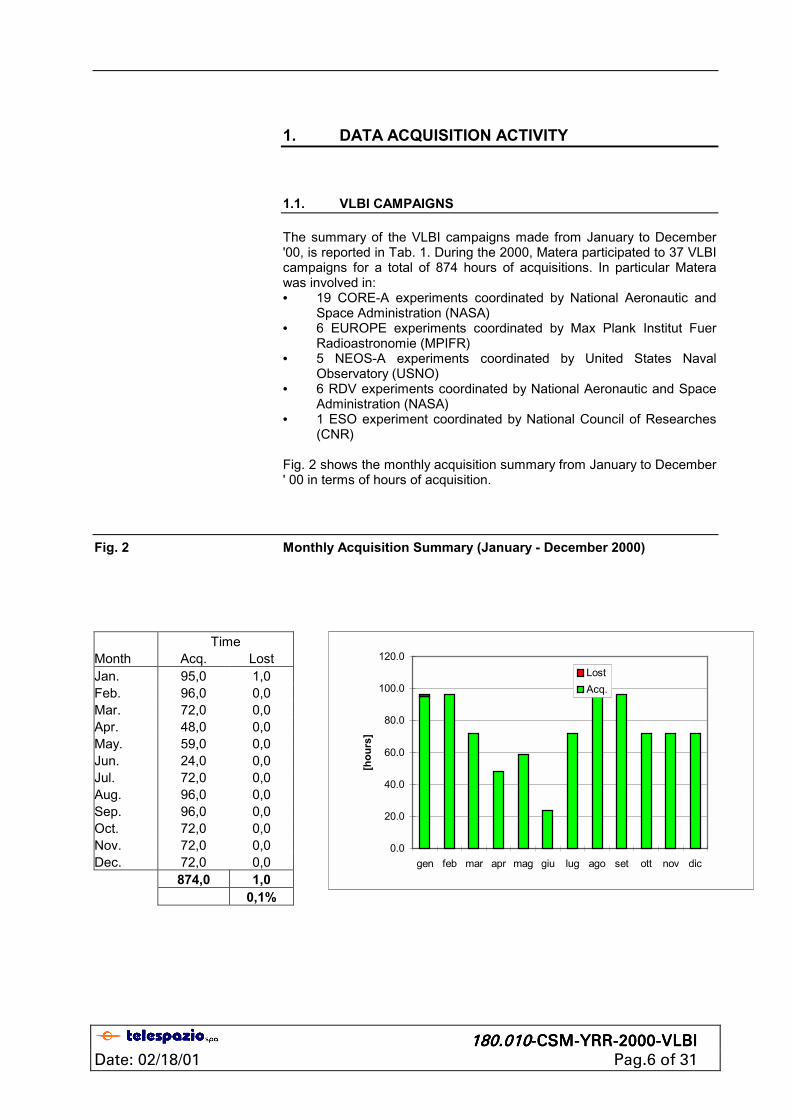
(CNR) Fig. 2 shows the monthly acquisition summary from January to December ' 00 in terms of hours of acquisition.
Fig. 2 Monthly Acquisition Summary (January - December 2000)
Time Month Acq. Lost Jan. 95,0 1,0 Feb. 96,0 0,0 Mar. 72,0 0,0 Apr. 48,0 0,0 May. 59,0 0,0 Jun. 24,0 0,0 Jul. 72,0 0,0 Aug. 96,0 0,0 Sep. 96,0 0,0 Oct. 72,0 0,0 Nov. 72,0 0,0 Dec. 72,0 0,0 874,0 1,0 0,1%
0.0
20.0
40.0
60.0
80.0
100.0
120.0
gen feb mar apr mag giu lug ago set ott nov dic
[hou
rs]
Lost
Acq.

180.010180.010180.010180.010----CSMCSMCSMCSM----YRRYRRYRRYRR----2000200020002000----VLBIVLBIVLBIVLBI Date: 02/18/01 Pag.7 of 31
Session CORE-A EUROPE NEOS RDV ESO
JANUARY N.Sessions 2 1 1 Duration (h) 48 24 24 Time Lost (h) 1
FEBRUARY N.Sessions 1 1 1 1 Duration (h) 24 24 24 24 Time Lost (h)
MARCH N.Sessions 1 1 1 Duration (h) 24 24 24 Time Lost (h)
APRIL N.Sessions 1 1 Duration (h) 24 24 Time Lost (h)
MAY N.Sessions 1 1 1 Duration (h) 24 24 11 Time Lost (h)
JUNE N.Sessions 1 Duration (h) 24 Time Lost (h)
JULY N.Sessions 2 1 Duration (h) 48 24 Time Lost (h)
AUGUST N.Sessions 2 1 1 Duration (h) 48 24 24 Time Lost (h) SEPTEMBER N.Sessions 3 1
Duration (h) 72 24 Time Lost (h)
OCTOBER N.Sessions 2 1 Duration (h) 48 24 Time Lost (h)
NOVEMBER N.Sessions 2 1 Duration (h) 48 24 Time Lost (h)
DECEMBER N.Sessions 2 1 Duration (h) 48 24 Time Lost (h)
Tab.1:Summary of the VLBI campaigns
180.010180.010180.010180.010----CSMCSMCSMCSM----YRRYRRYRRYRR----2000200020002000----VLBIVLBIVLBIVLBI Date: 02/18/01 Pag.8 of 31
2. MAINTENANCE AND UPGRADES ACTIVITY
2.1. UPGRADES
In December 1998 the installation of a new Pentium PC to control VLBI system was started. The new PC was bought from a NASA suggested vendor (SWT) and tested at GSFC by Ed Himnwich before arriving at Matera. On this new PC the Matera station software was ported by Telespazio personnel during the first months of 1999.The final test was performed in April 1999.See [1] for complete description of the porting process. The new PC is a Pentium 233 MHz based machine configured as suggested by NASA and bought from NASA suggested vendor SWT (http://www.swt.com). The PC is running Linux Kernel 2.0.30 Debian 1.3.1.r3 operating system and FS 9.3.23. In October 1999 also the Data Acquisition Terminal (DAT) was upgraded from Mark III to Mark IV standard [2].The upgrade was done by MIT -HAYSTACK observatory. The first session with the MarkIV D.A.T. was performed in October 1999.More details on the main characteristics of the new equipment are given in chapter 4 of the part B. In October 2000 the Cryogenic System was upgraded and subsitued with a new equipment. The upgrade was done by Rial Vacuum.

180.010180.010180.010180.010----CSMCSMCSMCSM----YRRYRRYRRYRR----2000200020002000----VLBIVLBIVLBIVLBI Date: 02/18/01 Pag.9 of 31
2.2. PROGRAMMED MAINTENANCE
The antenna subsystem requires the major effort in maintenance. In particular the maintenance of the mechanical parts of the antenna is very important. In this section some of the most significant tests and calibrations performed during the period in object are summarized. SYSTEM CALIBRATIONS AND TESTS. • MARK-IV D.A.T. CHECK. (Every experiment) • CABLE MEASUREMENT. (Every experiment) • ANTENNA POINTING TEST. (Every experiment) • SYSTEM TEMPERATURE MEASUREMENT. (Every experiment) • SOURCE EQUIVALENT FLUX DENSITY MEASUREMENT. (Every
experiment) The calibration and testing activities are made off-line before the VLBI experiments. Detailed description of the results is reported in the second part of this report (performance evaluation). The H-MASER maintenance is performed directly by Observatoire of Neuchatel (Switzerland) which built the equipment.
2.3. NON PROGRAMMED MAINTENANCE
Tab. 3 shows the summary of the most significant system failures for the various subsystems.
Tab. 3 Most Significant Maintenance and Failures.
ANTENNA January Replaced a spare cable on the antenna VLBI. February Replaced a servo antenna board of the azimuth n°1 motor with a
spare one. June Mechanical maintenance on the antenna. July Replaced the light on the AZIMUTH Encoder electronics evaluation. August Maintenance on the antenna motors. October Upgraded Cryogenic System. December Replaced a LAB4 RK pressurize with a spare one. D.A.T. January Communication problems between antenna and PC-FS.System
rebooted.Lost 1 hour of session core-80. February Installed and tested a new Mark-IV Formatter . March Upgraded antenna control software.Implemented Stow Command. June Installed and tested a new Mark-IV Decoder Display. July Upgraded F.S. to 9.4.13 version. August SSB Mixer failure on the VC S/N 297. Replaced by spare V.C.

180.010180.010180.010180.010----CSMCSMCSMCSM----YRRYRRYRRYRR----2000200020002000----VLBIVLBIVLBIVLBI Date: 02/18/01 Pag.10 of 31
3. RADIO FREQUENCY INTERFERENCIES MEASUREMENTS
In December '89, during the installation of the VLBI equipment, a complete monitoring of both the S and X bands was performed at the Matera Center. The measurements showed significant RF interference in the S-band mainly due broadcast TV-RELAYS. Point-to-point audio-signals and radio-relays signals are also present. Recent measurements confirmed this situation. These interferences are visible at least on 4 of the 6-video converters used for geodetique VLBI experiments in S-band. The X-band is not affected by R.F.I. A detailed description of the R.F.I. measurements is reported in [3]. Starting from June 97 a new wide-band SX sequence was used for all the CORE experiments in order to minimize the RFI effects. The new sequence was chosen by Dave Shaffer. Starting from October 97, also for Europe experiments new S-band frequencies (by Axel Nothnagel) were used.

180.010180.010180.010180.010----CSMCSMCSMCSM----YRRYRRYRRYRR----2000200020002000----VLBIVLBIVLBIVLBI Date: 02/18/01 Pag.11 of 31
PART -B- PERFORMANCE EVALUATION
180.010180.010180.010180.010----CSMCSMCSMCSM----YRRYRRYRRYRR----2000200020002000----VLBIVLBIVLBIVLBI Date: 02/18/01 Pag.12 of 31
1. THE MATERA VLBI SYSTEM
A standard VLBI system is composed by the antenna, the MARK-III Data Acquisition Terminal (D.A.T.), the Time and Frequency system and the Control System. A complete description of a standard geodetic VLBI system is in [4]. The Matera VLBI system includes a 20 meter diameter antenna, designed and built in Italy by Selenia Spazio (now Alenia Spazio), a Mark IV D.A.T., built by Signatron Inc. (USA) and upgrade by MIT Haystack observatory, and a Time and Frequency system integrated by Politecnico di Torino (under contract with Telespazio). Telespazio integrated the VLBI system developing also the interface software between the control system and the Antenna Control Unit. In the next chapters a more detailed description of the Matera VLBI subsystems is given.
180.010180.010180.010180.010----CSMCSMCSMCSM----YRRYRRYRRYRR----2000200020002000----VLBIVLBIVLBIVLBI Date: 02/18/01 Pag.13 of 31
2. ANTENNA
In December 1996, in order to upgrade the system to the NASA Wide Band Standard, a new receiver front end was installed. The new LNAs were installed into the old Dewar (in the U.S.A.) and the old Cryogenic System was started up again. New Down Converter replaced the original (Selenia) one, and a new Control Unit was installed. All the work (integration and on site installation)) was performed by ATSC personnel. In July in order to minimize the cross talk between X and S bands, the old (Selenia )D/C was installed again and it is used now only for the S band.
2.1. ANTENNA MAIN CHARACTERISTICS
The Matera VLBI antenna has been designed by Selenia Spazio (now Alenia Spazio) under a contract with "Piano Spaziale Nazionale" of "Consiglio Nazionale delle Ricerche" (now A.S.I.). A detailed description of the mechanical characteristics and of the driving system is reported in the Antenna Technical Manuals provided by Selenia Spazio (available on site). The radioelectric Antenna block diagram is shown in Fig. 3. The antenna feed receives the signals in S-BAND (2210÷÷÷÷2450 MHz) and in X-BAND (8180÷÷÷÷8980 MHz). Both the X and the S bands are amplified by means of two cooled low-noise amplifiers. Finally, the X and the S bands are down converted to IF BANDS. The down-conversions are made with an etherodyne system. In order to generate the 8080 MHz and the 2020 MHz tones, a 5 MHz from the H-MASER is used. After the down conversions two IF BANDS are available: •••• IF1 (100÷÷÷÷900 MHz) that is the result of the X-BAND conversion; •••• IF2 (100÷÷÷÷430 MHz) that is the result of the S-BAND conversion. The IF1 and the IF2 are the inputs of the MARK-III D.A.T. The calibration system injects both a calibrate noise signal, necessary for the system temperature measurement, and a train of short pulses (30 ps of duration), at a rate of 1 pulse/µs, necessary for the receiver delay measurement [4]. Tab. 4 shows technical characteristics of the MATERA VLBI antenna.

180.010180.010180.010180.010----CSMCSMCSMCSM----YRRYRRYRRYRR----2000200020002000----VLBIVLBIVLBIVLBI Date: 02/18/01 Pag.14 of 31
Tab. 4 Matera VLBI Antenna Technical Specifications
Input frequencies S-band 2210 MHz to 2450 MHz X-band 8180 MHz to 8980 MHz Noise Temperature S-band < 20 K @ Dewar flange X-band < 20 K IF Output Frequencies S-band 190 MHz to 430 MHz X-band 100 MHz to 900 MHz IF Output Power with 300 K S-band 0.0 dBm to +8.0 dBm @ The input flange X-band 0.0 dBm to +8.0 dBm Gain Compression S-band <1dB@ +8dBm output level X-band <1dB@ +8dBm output level Image rejection S-band >45 dB within the IF passband X-band >45 dB within the IF passband Inter modulation Products S-band At least 30 dB below each of 2 carriers at an IF output level of 0 dBm per carrier X-band At least 30 dB below each of 2 carriers at an IF output level of 0 dBm per carrier PARAMETERS MEAS.
UNIT S - BAND X - BAND
External temperature limit °C -10÷+40 -10÷+40Wind velocity limit Km/h 36÷50 36÷50Differential thermal head in the structure lower than:
°C 5 5
Performance: system sensibility cooperating with 15÷30 m partners antennas, with a total error lower than 2 cm
JY 1 1
Circular polarization Right RightSystem noise temperature °K 140 140

180.010180.010180.010180.010----CSMCSMCSMCSM----YRRYRRYRRYRR----2000200020002000----VLBIVLBIVLBIVLBI Date: 02/18/01 Pag.15 of 31
Fig. 3 VLBI System: Radioelectric Block Diagram
DUAL BAND S/XFEED
8180-8980 MHz
2210-2450 MHz
CALIBRATIONSYSTEM
CALIBRATIONSYSTEM(MARK-III)
S
X
LOW NOISE
AMPLIFIERS
DOW NCONVERTER
DOW NCONVERTER
BAND PASSFILTER
BAND PASSFILTER
190-430 MHz
100-900 MHz
2020 MHz
8080 MHz
LOCALOSCILLATOR
TEMPERATUREAND PRESSURECONTROL
MONITORSYSTEM
5 MHz (MASER)
(ANTENNA)
ANTENNA
NASA
180.010180.010180.010180.010----CSMCSMCSMCSM----YRRYRRYRRYRR----2000200020002000----VLBIVLBIVLBIVLBI Date: 02/18/01 Pag.16 of 31
2.2. ANTENNA PERFORMANCE
2.2.1. POINTING
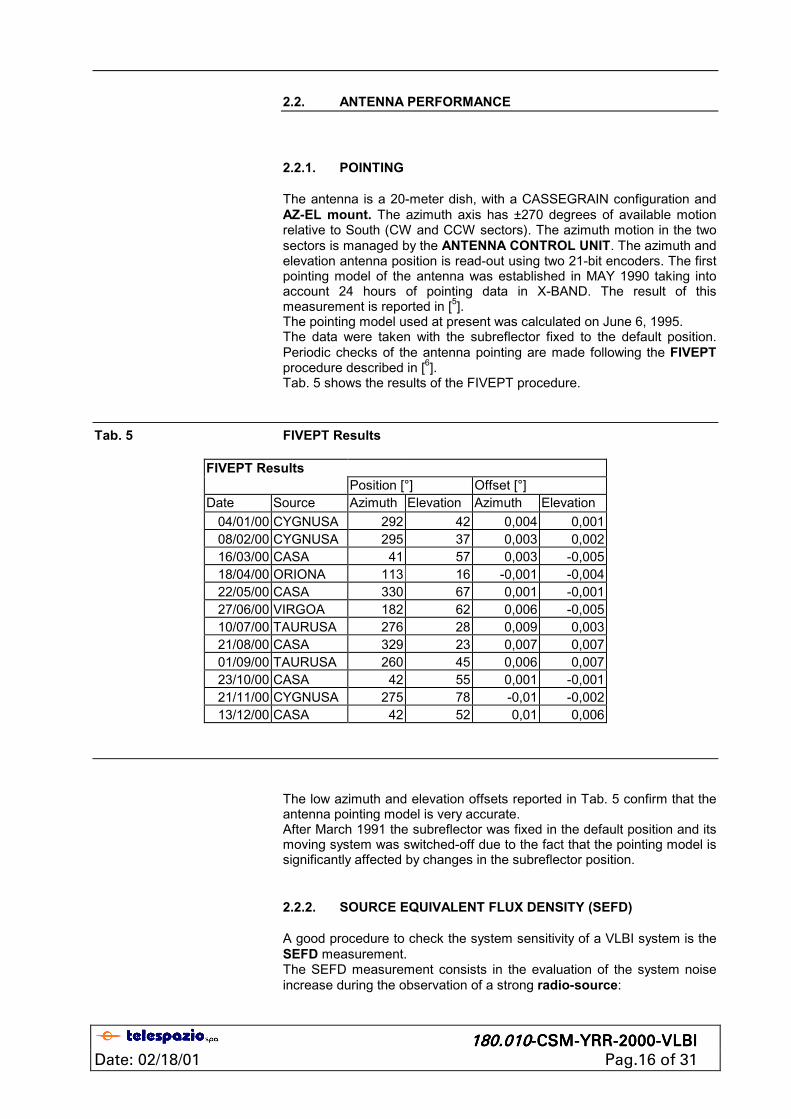
The antenna is a 20-meter dish, with a CASSEGRAIN configuration and AZ-EL mount. The azimuth axis has ±270 degrees of available motion relative to South (CW and CCW sectors). The azimuth motion in the two sectors is managed by the ANTENNA CONTROL UNIT. The azimuth and elevation antenna position is read-out using two 21-bit encoders. The first pointing model of the antenna was established in MAY 1990 taking into account 24 hours of pointing data in X-BAND. The result of this measurement is reported in [5]. The pointing model used at present was calculated on June 6, 1995. The data were taken with the subreflector fixed to the default position. Periodic checks of the antenna pointing are made following the FIVEPT procedure described in [6]. Tab. 5 shows the results of the FIVEPT procedure.
Tab. 5 FIVEPT Results
FIVEPT Results Position [°] Offset [°]
Date Source Azimuth Elevation Azimuth Elevation
04/01/00 CYGNUSA 292 42 0,004 0,001 08/02/00 CYGNUSA 295 37 0,003 0,002 16/03/00 CASA 41 57 0,003 -0,005 18/04/00 ORIONA 113 16 -0,001 -0,004 22/05/00 CASA 330 67 0,001 -0,001 27/06/00 VIRGOA 182 62 0,006 -0,005 10/07/00 TAURUSA 276 28 0,009 0,003 21/08/00 CASA 329 23 0,007 0,007 01/09/00 TAURUSA 260 45 0,006 0,007 23/10/00 CASA 42 55 0,001 -0,001 21/11/00 CYGNUSA 275 78 -0,01 -0,002 13/12/00 CASA 42 52 0,01 0,006
The low azimuth and elevation offsets reported in Tab. 5 confirm that the antenna pointing model is very accurate. After March 1991 the subreflector was fixed in the default position and its moving system was switched-off due to the fact that the pointing model is significantly affected by changes in the subreflector position.
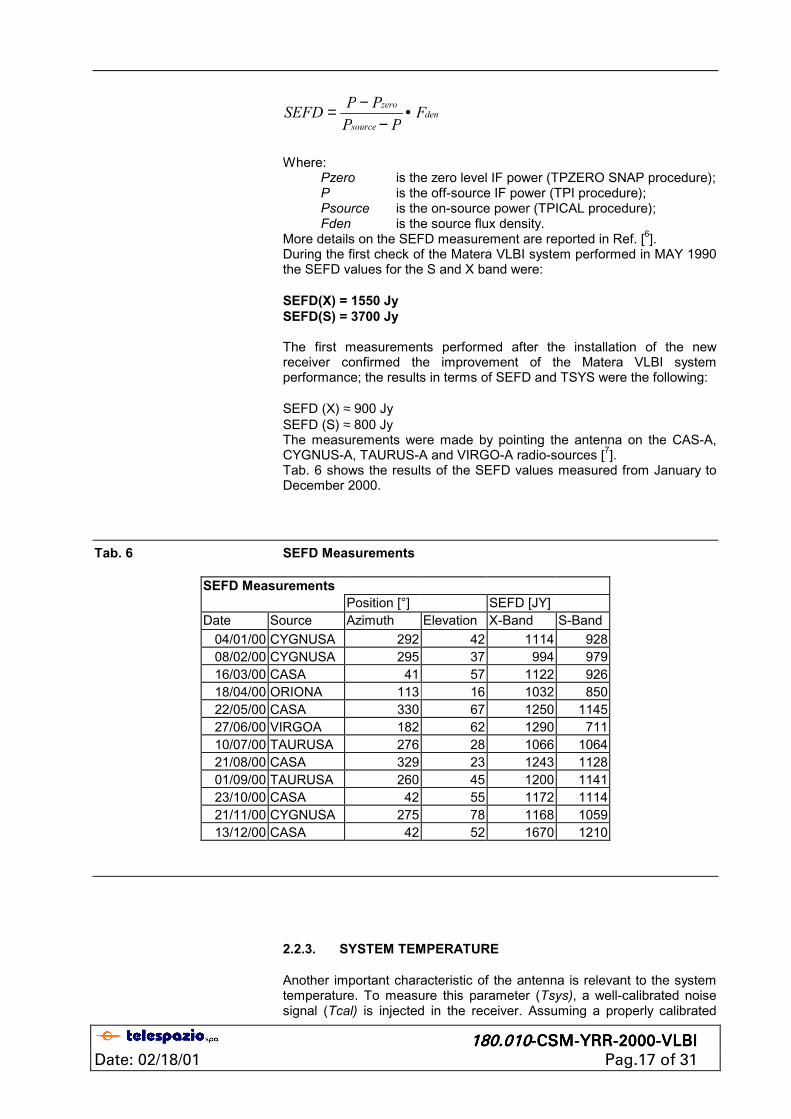
2.2.2. SOURCE EQUIVALENT FLUX DENSITY (SEFD)
A good procedure to check the system sensitivity of a VLBI system is the SEFD measurement. The SEFD measurement consists in the evaluation of the system noise increase during the observation of a strong radio-source:
180.010180.010180.010180.010----CSMCSMCSMCSM----YRRYRRYRRYRR----2000200020002000----VLBIVLBIVLBIVLBI Date: 02/18/01 Pag.17 of 31
SEFDP P
P PF
zero
sourceden= −
−•
Where: Pzero is the zero level IF power (TPZERO SNAP procedure); P is the off-source IF power (TPI procedure); Psource is the on-source power (TPICAL procedure); Fden is the source flux density. More details on the SEFD measurement are reported in Ref. [6]. During the first check of the Matera VLBI system performed in MAY 1990 the SEFD values for the S and X band were: SEFD(X) = 1550 Jy SEFD(S) = 3700 Jy The first measurements performed after the installation of the new receiver confirmed the improvement of the Matera VLBI system performance; the results in terms of SEFD and TSYS were the following: SEFD (X) ≈ 900 Jy SEFD (S) ≈ 800 Jy The measurements were made by pointing the antenna on the CAS-A, CYGNUS-A, TAURUS-A and VIRGO-A radio-sources [7].
Tab. 6 shows the results of the SEFD values measured from January to December 2000.
Tab. 6 SEFD Measurements
SEFD Measurements Position [°] SEFD [JY]
Date Source Azimuth Elevation X-Band S-Band
04/01/00 CYGNUSA 292 42 1114 928 08/02/00 CYGNUSA 295 37 994 979 16/03/00 CASA 41 57 1122 926 18/04/00 ORIONA 113 16 1032 850 22/05/00 CASA 330 67 1250 1145 27/06/00 VIRGOA 182 62 1290 711 10/07/00 TAURUSA 276 28 1066 1064 21/08/00 CASA 329 23 1243 1128 01/09/00 TAURUSA 260 45 1200 1141 23/10/00 CASA 42 55 1172 1114 21/11/00 CYGNUSA 275 78 1168 1059 13/12/00 CASA 42 52 1670 1210
2.2.3. SYSTEM TEMPERATURE
Another important characteristic of the antenna is relevant to the system temperature. To measure this parameter (Tsys), a well-calibrated noise signal (Tcal) is injected in the receiver. Assuming a properly calibrated

180.010180.010180.010180.010----CSMCSMCSMCSM----YRRYRRYRRYRR----2000200020002000----VLBIVLBIVLBIVLBI Date: 02/18/01 Pag.18 of 31
detector system, the ratio of outputs for the calibrated noise "ON" and "OFF" conditions is: T T
T
V V
V V
sys cal
sys
on o
off o
+ = −−
Where: Von is the output voltage for the ON condition; Voff is the output voltage for the OFF condition; Vo is the output bias.
If
RV
V
on
off=
then
TT V
VR
sys
cal ooh=
• −
−
( )1
1
More details on the Tsys measurement, both in S and in X band, using the SNAP commands, are reported in Ref. [6]. During the first check of the Matera VLBI station, performed in May 1990 (Ref.[7]), the measured system temperature values were: Tsys [S]= 55 °K Tsys [X]= 65 °K In February 1997 a 24 hours Tsys measurements were performed. Fig. 4 shows the Tsys measured (X and S band) at different elevations. Fig. 4 The first measurements performed after the installation of the new receiver confirmed the improvement of the Matera VLBI system performance; the results in terms of SEFD and TSYS were the following: TSYS (X) ≈ 45 °K TSYS (S) ≈ 60 °K Tab. 7 shows the results of the system temperature measurements performed from January to December 2000.
Wide Band Upgraded receiver
0
50
100
150
200
250
0 20 40 60 80
Elevation
Tsys
[°K
]
Tsys-XTsys-S

180.010180.010180.010180.010----CSMCSMCSMCSM----YRRYRRYRRYRR----2000200020002000----VLBIVLBIVLBIVLBI Date: 02/18/01 Pag.19 of 31
Tab. 7 Tsys Measurements
Tsys MeasurementsTSYS [°K]
Date X-Band S-Band
04/01/00 54 6608/02/00 49 6316/03/00 50 6518/04/00 56 7422/05/00 55 6827/06/00 50 6310/07/00 54 7321/08/00 55 7801/09/00 61 7223/10/00 53 6921/11/00 58 7213/12/00 73 81

180.010180.010180.010180.010----CSMCSMCSMCSM----YRRYRRYRRYRR----2000200020002000----VLBIVLBIVLBIVLBI Date: 02/18/01 Pag.20 of 31
3. TIME AND FREQUENCY SYSTEM
3.1. GENERAL CONFIGURATION
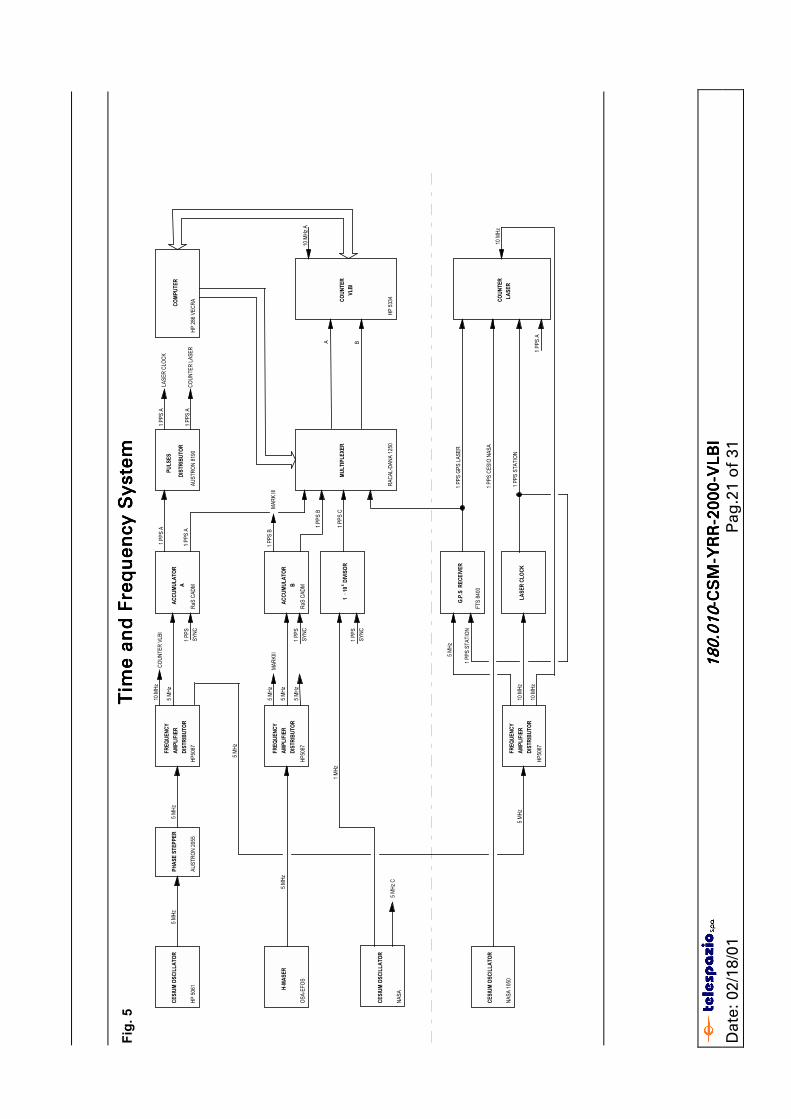
The Time and Frequency System at Matera was designed in order to meet the requirements for both SLR and VLBI systems [8]. In a VLBI system an high short-term frequency stability is requested (∆f/f<1E-14; t≅ 1000 s) for the frequency synthesis and for the phase delay calibration. In a SLR system a high long-term frequency stability is requested to generate the time scale for the datation of the measurements. The short-term frequency stability is achievable by means of the H-MASER frequency standard. The long-term frequency stability is achievable by means of the CESIUM beam frequency standard.
Tab. 9 Time and Frequency System: Characteristics
GENERAL CHARACTERISTICS. • One H-MASER frequency standard; • Two CESIUM beam frequency standards; • One GPS time receiver; • Three independent time-scales; • Automated monitor and control system; • Absolute continuity of operations; • Environment-controlled room to host the frequency standards. THECNICAL CHARACTERISTICS. • frequency stability (∆f/f; t=1000 s) < 2E-15 (H-MASER) • spectral purity > 110 dB (1 Hz) • time stability (∆t/t; t>1 day) < 5E-13 (CESIUM) • synchronization (UTC) < 100 ns (GPS)
The Matera Time and Frequency system is composed of three frequency sources (two CESIUM beam a one H-MASER standards) and three independent clock chains. The EFOS-8 H-MASER from Oscilloquartz is used as frequency source for VLBI. This system, shows excellent performance in terms of stability (∆f/f<2E-15; 1000<t<10000 s), spectral purity (>110 dB; 1 Hz) and temperature sensitivity (2E-14/°C). The prime time scale is generated by a HP 5061B Cesium standard (a second Cesium standard is intended as back-up). Synchronization to UTC is guaranteed by the use of a GPS receiver (FTS 8400). Absolute continuity of operations is guaranteed by the main power inverter. An additional battery back up is dedicated to the frequency standards and other critical equipment. The overall block diagram of this system is shown in Fig. 5, while its main characteristics are summarized Tab. 9.
18
0.01
018
0.01
018
0.01
018
0.01
0- ---C
SM
CS
MC
SM
CS
M- ---Y
RR
YR
RY
RR
YR
R- ---2
000
2000
2000
2000
- ---VLB
IV
LBI
VLB
IV
LBI
Dat
e: 0
2/18
/01
Pag
.21
of
31
Fig.
5
Tim
e an
d F
req
uen
cy S
yste
mT
ime
and
Fre
qu
ency
Sys
tem
Tim
e an
d F
req
uen
cy S
yste
mT
ime
and
Fre
qu
ency
Sys
tem
PHA
SE S
TEPP
ERC
ESIU
M O
SCIL
LATO
R
H-M
ASE
R
FREQ
UEN
CY
AM
PLIF
IER
DIS
TRIB
UTO
R
FREQ
UEN
CY
AM
PLIF
IER
DIS
TRIB
UTO
R
CES
IUM
OSC
ILLA
TOR
AC
CU
MU
LATO
R
B
AC
CU
MU
LATO
R
A
1 ·
10
DIV
ISO
R6
PULS
ES
DIS
TRIB
UTO
RC
OM
PUTE
R
MU
LTIP
LEXE
RC
OU
NTE
R
5 M
Hz
5 M
Hz
C
1 M
Hz
5 M
Hz
HP
5061
OSA
-EFO
S
NAS
A
AUST
RO
N 2
055
HP5
087
HP5
087
RaS
CAD
M
RaS
CAD
M
AUST
RO
N 8
190
RAC
AL-D
ANA
1250
HP
286
VEC
RA
HP
5334
VLB
I
5 M
Hz
5 M
Hz
5 M
Hz
5 M
Hz
5 M
Hz
5 M
Hz
MAR
KIII
1 PP
S C
1 PP
S B
MAR
K III
1 PP
S B
1 PP
S
SYN
C
1 PP
S A
A B1
PPS
SYN
C
1 PP
S A
LASE
R C
LOC
K
1 PP
S A
1 PP
S A
CO
UN
TER
LAS
ER
CO
UN
TER
LASE
R
10 M
Hz
A
CES
IUM
OSC
ILLA
TOR
NAS
A 10
50
LASE
R C
LOC
K1
PPS
STAT
ION
G.P
.S R
ECEI
VER
1 PP
S G
PS L
ASER
SYN
C
1 PP
S
FREQ
UEN
CY
AM
PLIF
IER
DIS
TRIB
UTO
R
HP5
087
10 M
Hz
10 M
Hz
5 M
Hz
5 M
Hz
1 PP
S C
ESIO
NAS
A
1 PP
S A
1 PP
S ST
ATIO
N
10 M
Hz
10 M
Hz
CO
UN
TER
VLB
I
FTS
8400
180.010180.010180.010180.010----CSMCSMCSMCSM----YRRYRRYRRYRR----2000200020002000----VLBIVLBIVLBIVLBI Date: 02/18/01 Pag.22 of 31
3.2. PERFORMANCE
The control of the time scales is managed by a dedicate DOS PC-286. The time scale control software was developed by TELESPAZIO (R. Faccia). Every hour a comparison between the various 1PPS signals (A, B, GPS, and 2nd CESIUM) is automatically done. The results of one of these comparisons are written in a monthly file. Fig. 6 shows the results of the comparisons between the 1 PPS generated by the H-Maser Frequency Standard and the 1 PPS (UTC) generated by the FTS 8400 GPS receiver. Fig. 7 shows the results of the comparison between the 1 PPS generated by Cesium Frequency and the 1 PPS generated by the FTS 8400 GPS receiver. The jumps on the Maser measurements (November) and on the Cesium measurements (July) are due to execution of synchronization procedures.

180.010180.010180.010180.010----CSMCSMCSMCSM----YRRYRRYRRYRR----2000200020002000----VLBIVLBIVLBIVLBI Date: 02/18/01 Pag.23 of 31
Fig. 6 MASER - UTC (FTS 8400 GPS) Time Differences
Fig. 7 Cesium - UTC (GPS)
MASER- UTC (GPS) 2000
-80,00
-70,00
-60,00
-50,00
-40,00
-30,00
-20,00
-10,00
0,001/1 20/2 10/4 30/5 19/7 7/9 27/10 16/12
Month
Mic
rose
cond
MASER-GPS
CESIO-UTC (GPS) 2000
0,50
1,00
1,50
2,00
2,50
1/1 20/2 10/4 30/5 19/7 7/9 27/10 16/12Month
Mic
rose
cond
CESIO-GPS

180.010180.010180.010180.010----CSMCSMCSMCSM----YRRYRRYRRYRR----2000200020002000----VLBIVLBIVLBIVLBI Date: 02/18/01 Pag.24 of 31
3.3. THE FREQUENCY STANDARDS ROOM
A special underground room has been built into the rock to host the frequency standards (see Fig. 8). It consists of a 4x4x3 meter (LxWxH) "box" located 5 meter below the equipment room. Particular criteria were adopted in the construction of this room, following the suggestions of Prof. S. Leschiutta.
Fig. 8 Frequency Standards Room
A 1-meter air space (aisle) around the room and above the ceiling, with double access door, has been designed to improve the thermal insulation. The installation of the H-MASER was facilitated by the use of a double 1.3x1.3 meter porthole in the ceiling (the room is also reachable by stairway in the aisle for maintenance). A 2x2x0.4 meter (LxWxH) concrete pedestal on the floor, insulated from the rest of the building to reduce vibration, hosts the standards, allowing also easy maintenance. With no active air conditioning neither in the room nor in the aisle, temperature variations less than 1 °C/month has been measured (see Fig. 9). Diurnal temperature variations are very well absorbed at a negligible level, not measurable with the instrument used (0.1 °C resolution).

180.010180.010180.010180.010----CSMCSMCSMCSM----YRRYRRYRRYRR----2000200020002000----VLBIVLBIVLBIVLBI Date: 02/18/01 Pag.25 of 31
Fig. 9 Temperature Variations in the Frequency Standards Room
The temperatures measured between mid 1996 and mid 2000 are higher than the others (about 1 degree C) probably because in this period a new cesium oscillator placed in the frequency room, was switched on.
19.0
20.0
21.0
22.0
23.0
24.0
25.0
Jan
'91
Jan
'92
Jan
'93
Jan
'94
Jan
'95
Jan
'96
Jan
'97
Jan
'98
Jan
'99
Jan
'00
[°C
]

180.010180.010180.010180.010----CSMCSMCSMCSM----YRRYRRYRRYRR----2000200020002000----VLBIVLBIVLBIVLBI Date: 02/18/01 Pag.26 of 31
4. MARK-IV DATA ACQUISITION TERMINAL
4.1. MARK-IV D.A.T. DESCRIPTION
The MARK-IV Data Acquisition Terminal (D.A.T.) is defined as the integrated computer-controlled electronics/recording system which takes a broadband analog I.F. signal, converts selected frequency windows to video (baseband), separately clips, samples and formats each video signal, and records the resulting time-tagged MARK-IV serial data stream in parallel on magnetic tape. The D.A.T. includes the control computer and necessary communication system for complete computer control. Phase and cable calibration, decoding, data storage, and reference frequency distribution facilities are included in the D.A.T. In December 1996 a Standard IF3 module (supplied by MIT Haystack) was installed in order to complete the Wide band upgrade. In October 1999 both D.A.T. and recorder were upgraded by MIT Haystack to new MARK-IV standard. Table 10 summarizes the major characteristics of the Matera MARK-IV D.A.T, the VLBA 4 Recorder and Computer System.
Tab. 10 Mark-IV D.A.T. System Characteristics
RECORDER TYPE VLBI 4 Thin Tape
NUMBER OF TRACKS 64 Tracks at 16 Mb/sec/t
HEADSTACK GROUP 2
DATA RATE 1024 Mbit/sec.
FORMATTER Mark IV
N°14 VIDEO CONVERTERS 2,4,8,16 Mhz
N° SAMPLE LEVELS 2-4 (1o 2 bit)

180.010180.010180.010180.010----CSMCSMCSMCSM----YRRYRRYRRYRR----2000200020002000----VLBIVLBIVLBIVLBI Date: 02/18/01 Pag.27 of 31
Tab. 9 Mark-IV D.A.T. System Characteristics (cont.)
CONTROL COMPUTER Hardware:
CPU INTEL P 233 MHz MMX-512K Pipelined burst mode
cache, 6NS.
• TWO 6.4 GB ULTRA scsi drives (5400 RPM, 10 ms)
• 96 MB SDRAM, 10 ns, 2 DIMMs
• 24X ATAPI (IDE) CD ROM drive
• ATI 3D expression + w/4MB SGRAM
• View Sonic G 771 monitor
• Full tower case
• Key tronic 2000 104-key Keybord
• 3COM Ether Link XL PCI (3C900) Combo
• Logitech Mouse Man Serial, 3 buttons configured
properly for X
• National Instruments GPIB-232 CT-A RS232-IEEE488
Contoller
• ASUS TX97-E Motherboard Intel 82430 TX Chipset
• NCR53c8xx SCSI, PCI Controller card
• Vikom Pro 8 ports board with 16550A UARTS
Software
• Linux Kerned 2.0.30 Debian 1.3.1.r3 Operating
System
• F2c Fortran/C translator
• GNU C Compiler
4.2. PRE-ESPERIMENT CHECK-OUT
In order to verify the status of the MARK-IV D.A.T., immediately before a VLBI experiment, a set of measurements are necessary, including a check of all the single modules (V.C., TAPE RECORDER, DECODER DISPLAY, IF DISTRIBUTOR) and also the verifications of major system performances (pointing and SEFD measurements). Details on the MARK-IV modules performances verification are in [9].
180.010180.010180.010180.010----CSMCSMCSMCSM----YRRYRRYRRYRR----2000200020002000----VLBIVLBIVLBIVLBI Date: 02/18/01 Pag.28 of 31
5. COMPUTER SYSTEM
5.1. ARCHITECTURE
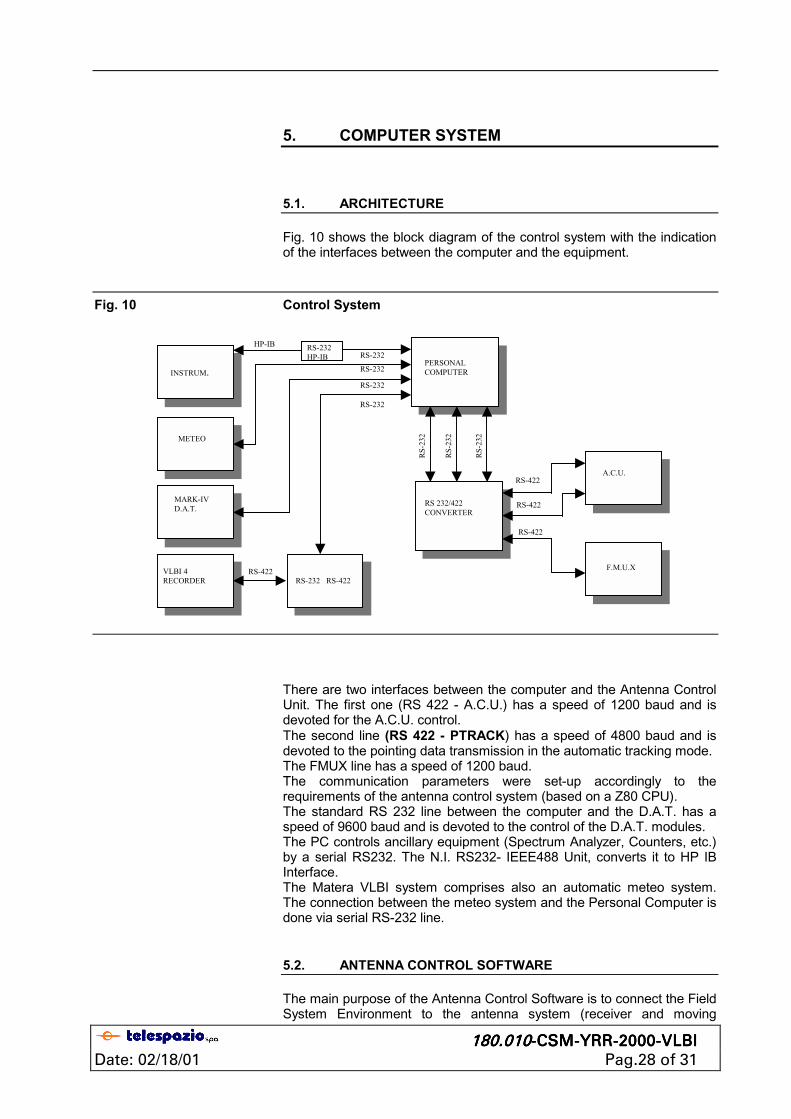
Fig. 10 shows the block diagram of the control system with the indication of the interfaces between the computer and the equipment.
Fig. 10 Control System
There are two interfaces between the computer and the Antenna Control Unit. The first one (RS 422 - A.C.U.) has a speed of 1200 baud and is devoted for the A.C.U. control. The second line (RS 422 - PTRACK) has a speed of 4800 baud and is devoted to the pointing data transmission in the automatic tracking mode. The FMUX line has a speed of 1200 baud. The communication parameters were set-up accordingly to the requirements of the antenna control system (based on a Z80 CPU). The standard RS 232 line between the computer and the D.A.T. has a speed of 9600 baud and is devoted to the control of the D.A.T. modules. The PC controls ancillary equipment (Spectrum Analyzer, Counters, etc.) by a serial RS232. The N.I. RS232- IEEE488 Unit, converts it to HP IB Interface. The Matera VLBI system comprises also an automatic meteo system. The connection between the meteo system and the Personal Computer is done via serial RS-232 line.
5.2. ANTENNA CONTROL SOFTWARE
The main purpose of the Antenna Control Software is to connect the Field System Environment to the antenna system (receiver and moving
RS-232
RS-232
RS-422
RS-422
INSTRUM.
RS-232
RS-232
METEO
RS 232/422 CONVERTER
MARK-IV D.A.T.
VLBI 4 RECORDER
RS-232 RS-422
A.C.U.
PERSONAL COMPUTER
F.M.U.X
RS-422
HP-IB RS-232 HP-IB
RS
-232
RS
-232
RS
-232
RS-422
180.010180.010180.010180.010----CSMCSMCSMCSM----YRRYRRYRRYRR----2000200020002000----VLBIVLBIVLBIVLBI Date: 02/18/01 Pag.29 of 31
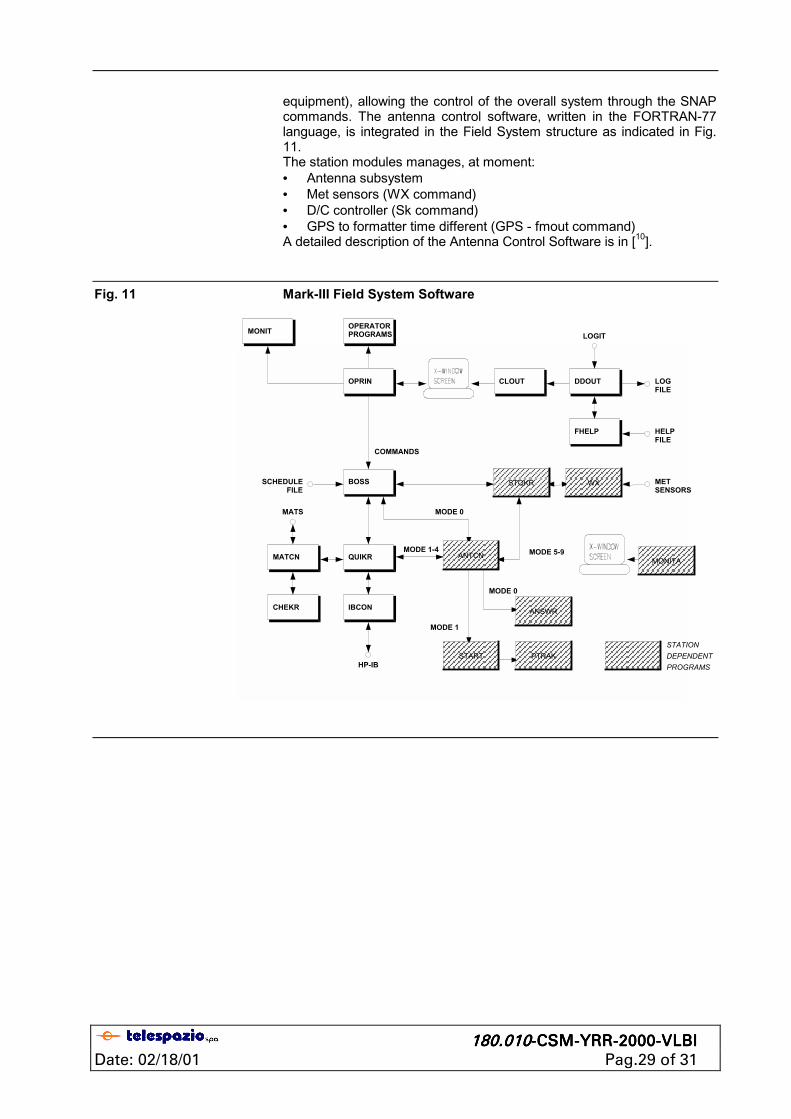
equipment), allowing the control of the overall system through the SNAP commands. The antenna control software, written in the FORTRAN-77 language, is integrated in the Field System structure as indicated in Fig. 11. The station modules manages, at moment: • Antenna subsystem • Met sensors (WX command) • D/C controller (Sk command) • GPS to formatter time different (GPS - fmout command) A detailed description of the Antenna Control Software is in [10].
Fig. 11 Mark-III Field System Software
MONIT OPERATORPROGRAMS
OPRIN
BOSS
QUIKRMATCN
CHEKR IBCON
CLOUT DDOUT
FHELP
LOGIT
HELPFILE
LOGFILE
METSENSORS
HP-IB
MATS
SCHEDULEFILE
COMMANDS
MODE 0
MODE 0
MODE 1
MODE 5-9MODE 1-4
STQKR WX
ANTCN
ANSWR
START PTRAK
MONITA
STATION
DEPENDENT
PROGRAMS

180.010180.010180.010180.010----CSMCSMCSMCSM----YRRYRRYRRYRR----2000200020002000----VLBIVLBIVLBIVLBI Date: 02/18/01 Pag.30 of 31
APPENDIX

180.010180.010180.010180.010----CSMCSMCSMCSM----YRRYRRYRRYRR----2000200020002000----VLBIVLBIVLBIVLBI Date: 02/18/01 Pag.31 of 31
REFERENCES
1 G.Colucci
IMPLEMENTAZIONE DEL NUOVO SISTEMA DI CONTROLLO APPARATI VLBI BASATO SU PC-LINUX. TELESPAZIO, APRIL 1999 Doc. Code 180010_20-CSM-NOT-001
2 E.Lunalbi
UPGRADE DEL SISTEMA MARK IV E RECORDER THIN TAPE. TELESPAZIO, NOVEMBER 1999 Doc. Code 180010-CSM-REL-00899
3 Telespazio
RAPPORTO SULLE MISURE DI INTERFERENZA RADIOELETTRICA IN BANDA S ED IN BANDA X. MATERA, DECEMBER 12-13 1989.
4 T.A. Clark all others
PRECISION GEODESY USING THE MARK-III VERY LONG BASELINE INTERFEROMETRY SYSTEM. IEEE TRANSACTION ON GEOSCIENCE JUNE 1985.
5 Ed Himwich
REPORT FOR MATERA TRIP, MAY 1990. INTERFEROMETRICS/GSFC � SEPTEMBER 21, 1990
6 D. Shaffer, N. Vandenberg
VLBI SYSTEM DOCUMENTATION � FIELD SYSTEM VERSION 7.0 � ANTENNA PERFORMANCE. NASA GSFC_CRUSTAL DYNAMICS PROJECT � JULY 1, 1989.
7 D. Shaffer
MATERA REPORT. JULY 11, 1990
8 A. Cenci, L. Garramone, G. Bianco, B. Pernice, G. Sylos Labini
THE TIME AND FREQUENCY SYSTEM AT THE MATERA SPACE GEODESY CENTER. PRESENTED AT 4TH EUROPEAN FREQUENCY AND TIME FORUM NEUCHATEL (SWITZERLAND) � 13-15 MARCH 1990.
9 A. Cenci, L. Garramone
CONTRATTO ASI N° 83/G/88 PER IL SISTEMA DI ACQUISIZIONE DATI VLBI E PER IL SISTEMA DI TEMPO E FREQUENZA. PROCEDURE DI PROVA. TELESPAZIO, JULY 1990.
10 A. Cenci, G. Colucci, G. Vicomanni
INTERFACCIA FIELD SYSTEM �A.C.U. TELESPAZIO, JULY 1990