master limited partnership primer - mlp protocol · 2013. 3. 11. · master limited partnerships,...
TRANSCRIPT

Master LimitedPartnership PrimerUnderstanding an Emerging Asset Class
Nothing in this document should be considered a solicitation to buy or an offer to sell shares of any Oppenheimer SteelPath fund. This report does not represent a recommendation to undertake transactions in MLPs, and is provided for informational purposes only, and may not be reproduced or redistributed. There is no representation that the information is accurate, complete or current, or that it reflects the current opinion or all information known to Oppenheimer SteelPath, its principals, or affiliates. Past performance is no guarantee of future results.
Copyright; No Unauthorized Redistribution
This report was prepared by SteelPath in 2011 and is under protection of the copyright laws. Neither the whole nor any part of this material may be duplicated in any form or by any means. This material may not be redistributed or disclosed to anyone without the prior written consent of OppenheimerFunds, Inc..

2Master Limited Partnership Primer
Table of ContentsExecutive Summary.................................................................................................................................................................................................................................
Why own Master Limited Partnerships?.............................................................................................................................................................................................. Thematic Investment in US Energy Infrastructure Growth............................................................................................................................................. Hard Asset Play Provides Tangible Value in a Potentially Inflationary Environment................................................................................................... Better Business Models........................................................................................................................................................................................................ MLPs Exhibit Insignificant Correlation with the Broader Equities Market...................................................................................................................
An Emerging Asset Class........................................................................................................................................................................................................................ Substantial Investment Required to Meet US Infrastructure Demands........................................................................................................................ The Future of MLPs.............................................................................................................................................................................................................. Structural Valuation Issues Create Substantial Long-Term Upside............................................................................................................................... Flying Under the Radar – Limited Institutional Ownership of MLPs........................................................................................................................... What is a Midstream Asset?................................................................................................................................................................................................................. Crude Oil/Refined Products Transportation.................................................................................................................................................................... Crude Oil/Refined Products Terminals............................................................................................................................................................................ Midstream Natural Gas Industry...................................................................................................................................................................................... Transportation.................................................................................................................................................................................................................... Gathering............................................................................................................................................................................................................................. Dehydration......................................................................................................................................................................................................................... Treating................................................................................................................................................................................................................................ Processing............................................................................................................................................................................................................................ Fractionation....................................................................................................................................................................................................................... Storage.................................................................................................................................................................................................................................. LNG Transportation............................................................................................................................................................................................................
Valuing Midstream Energy Businesses............................................................................................................................................................................................... Stable, Growing Distributions – The Defining Characteristic of the MLP Model........................................................................................................ Net Asset Value.................................................................................................................................................................................................................... Cost of Capital Can Vary with Business Risk.................................................................................................................................................................... Popular Misconceptions: Relative Yield........................................................................................................................................................................... Other Relative Price Metrics.............................................................................................................................................................................................. Determining Accretion.......................................................................................................................................................................................................
Fundamental Risks................................................................................................................................................................................................................................ Tax Law Changes.................................................................................................................................................................................................................. Regulatory Risk................................................................................................................................................................................................................... Demand-Side Throughput Risks........................................................................................................................................................................................ Supply Asset-Specific Risks................................................................................................................................................................................................ Macro Supply Disruptions.................................................................................................................................................................................................. Environmental Accidents................................................................................................................................................................................................... Terrorism............................................................................................................................................................................................................................. Financial Risks....................................................................................................................................................................................................................................... Interest Rates....................................................................................................................................................................................................................... Equity Volatility and Correlation...................................................................................................................................................................................... Equity Crises........................................................................................................................................................................................................................
Appendix................................................................................................................................................................................................................................................ A History of the Creation of MLPs..................................................................................................................................................................................... General/Limited Partner Structure.................................................................................................................................................................................. Income Tax Treatment........................................................................................................................................................................................................
Disclaimers.............................................................................................................................................................................................................................................
3
4 5 6 6 7
7 8 9 ..9 10 .11 11.12 13 13 13 14 14 14 14 15 15 16 16 17.17 17 17 18 18 18.18.18.19 19 19 19 20 20 20 21
22 22 22 24
25
www.steelpath.com

3
Executive SummaryMaster Limited Partnerships, or MLPs, are engaged in the transportation, storage, processing, refining, marketing, exploration, production, and mining of minerals or natural resources. By confining their operations to these specific activities, their interests, or units, are able to trade on public securities exchanges exactly like the shares of a corporation, without entity level taxation. Of the 80 partnerships that the Oppenheimer SteelPath team follows closely, two-thirds trade on the New York Stock Exchange with nearly all of those remaining on the NASDAQ. MLPs must make public filings with the Securities and Exchange Commission and must file 10-Ks, 10-Qs, and notices of material changes like any publicly traded corporation. MLPs are subject to the record keeping and disclosure requirements of the Sarbanes-Oxley Act.
Since 1996, the Alerian MLP Index* (NYSE: AMZ) has generated compound annual total returns of approximately 17%, under the radar of a large part of the professional investment community. These strong returns were generated through a combination of current yield and consistent distribution growth driven by the uniquely attractive business models afforded by these companies’ regional franchise monopolies.
Many of these partnerships have historically generated predictable and growing cash flows (and therefore distributions) predicated on the following:• Long-lived, high-value physical assets• Producer Price Index (PPI) revenue indexing, which
provides predictable growth and a built-in inflation hedge for portfolios
• Substantial barriers to entry, which generate attractive organic investment opportunities
• Strong operating leverage through hard assets that magnify inelastic demand
The energy infrastructure MLP sector, which includes companies that own and operate long-lived, high-value physical assets that engage in the transportation and storage of natural resources such as refined petroleum products and natural gas, today represents $160 billion of public market capitalization out of a total $220 billion in MLP market capitalization. MLPs have traditionally been owned by United States retail investors (institutional MLP ownership approximately 25%). The market capitalization of the MLP
sector has grown exponentially over the last decade, driven by asset rationalization into MLPs, which have the operating expertise and the organizational structure to optimize their use, and by demand for new energy infrastructure. In 2000, the sector market capitalization was a mere $20 billion; this figure doubled by 2003 to $40 billion and doubled yet again by 2006 to $80 billion. We expect MLP market capitalization to continue to grow from the current $220 billion level as the demand for new energy infrastructure continues to drive investment.
Thematically, an investment in a midstream energy infrastructure MLP is an investment in the build-out of US energy infrastructure over the next decade. Unlike US or Canadian royalty trusts, which own depleting resource pools, these are toll-road business models on long-life assets. Modern pipelines benefit from rust coatings and cathodic protection that will allow these pipelines to operate without major maintenance for 100 years or more. In fact, there are pipelines that were put in the ground prior to World War II which had no rust coating of any kind that are still in use today. There is much speculation today about the future trajectory of oil prices, the appropriate levels of storage, and the outlook for the US refining industry. However, one thing that most “experts” agree on, regardless of whether they are predicting $50, $75, or $150 per barrel of oil, is predictable energy demand growth in the US over the next several decades, in spite of the current economic situation. Demographic shifts and population growth trends increase the demand for energy goods. As a result, long-haul pipeline MLPs are mostly agnostic to these commodity price forecasts, and benefit from simple throughput gains in a fixed-cost pipeline system.
Industry estimates indicate that the US will require investment exceeding $250 billion in new energy infrastructure over the next 25 years in the form of natural gas, crude oil and refined petroleum products processing, storage, and transportation infrastructure. Additionally, there is more than $200 billion of US midstream assets currently owned in both private and public corporate structures that are being rationalized into the asset class through acquisition and the creation of new MLPs. The MLP structure is also ripe for billions more in infrastructure once these assets are built and generating cash, including liquefied natural gas (LNG) terminals, gas-to-liquids technology, and
Master Limited Partnership Primer
*Index performance is not indicative of the performance of the Oppenheimer SteelPath Funds. The Oppenheimer SteelPath MLP Alpha, MLP Income and MLP Select 40 Funds were incepted on March 31, 2010, the Oppenheimer SteelPath MLP Alpha Plus and Oppenheimer SteelPath MLP and Infrastructure Debt Fund were incepted on January 3, 2012, and as a result have a more limited performance history than the index quoted. See performance insert for Fund performance information.

4
coal gasification. We believe that this emerging asset class represents an attractive value proposition given the low-risk business profiles of most MLPs.
MLPs are attractive, not only because of their tax treatment or structure, but also because of the type of assets that have migrated into the asset class over the last decade. Energy infrastructure is an attractive business model – regional monopolies with transparent federal regulation that transport commodities with largely inelastic demand. An investment manager cannot take this type of pure-play exposure into his or her portfolio through any other form of public equities.
Many will note, however, that the asset class is not what it used to be, and is moving away from the type of assets we have described above. This is partly true. With a surge in initial public offerings, many new types of assets have entered the structure, and many of them do not have the same monopoly footprints or supply diversity as their predecessors. There has been a trend closer to the wellhead as commodity-price-sensitive businesses dominated the IPO space over the 2006 and 2007 period and continue to come to market. Earnings volatility is not synonymous with lower quality but financial leverage, distribution levels, and hedging strategies must be appropriately conservative given such volatility. Investors must also be cognizant of such risks in deciding the appropriate equity price.
The Oppenheimer SteelPath team’s core thesis which was founded on in 2004 and maintains today is that MLPs are on a trajectory very similar to that experienced by the Real Estate Investment Trusts (REITs) in the late 1980s. On average, in a normalized market environment, the firm expects 5-10 initial public offerings each year for the foreseeable future. High-returning organic investment projects and acquisitions will continue to create tremendous value and demand for additional capital inflows. However, the MLP asset class is not widely covered by analysts and has exhibited a high dispersion of returns. This presents opportunities for active management to capitalize on these inefficiencies. Liquidity and market capitalizations have reached the point where MLPs are compromising a permanent allocation of large institutional portfolios. As the sector continues to provide superior distribution yield and growth versus other yielding equities, growth will likely continue to occur for retail and institutional investors. This participation will cause the sector to experience a substantial revaluation. However, in the meantime, we believe the sector simply offers a very attractive risk/return profile.
In this uncertain environment, the fundamentals are genuinely in place for MLPs to generate attractive risk-adjusted returns, without a broader market recovery.
Why own Master Limited Partnerships?Over the past 15 years, MLPs have outperformed the S&P 500 with a cumulative gain of over 938%, a compound annual return of 17%, versus 157% for the broader market, a compound annual return of less than 7%. Many investors look at the historical returns wistfully believing they have missed out and that it must be too late. Or, they look at the 2008 decline in MLP prices and wonder if the story really remains the same. The fundamental and structural underpinnings that led to decades of outperformance remain solidly in place. Valuation remains structurally inexpensive relative to other yield-oriented equity classes. Demand for investment in new energy infrastructure has never been greater.
There has only been one period in which MLP performance significantly lagged the S&P 500. This occurred during the tech boom of 1998-99, when investors became excited about growth and were willing to pay extraordinary multiples for high-growth companies.
The tech boom and enthusiasm for “asset light” energy companies, exemplified by Enron, caused other low-risk, cash flow-focused sectors, such as REITs and utilities to underperform during this period as well. Ironically, the ultimate collapse of many of these asset-light companies proved to be a boon to a number of MLPs. MLP initially sold off in sympathy with the asset-light energy companies as investors worried some of the MLPs may have had exposure to entities such as Enron but as it became clear little exposure actually existed the unit prices rebounded. Further, many of these struggling companies were forced to divest assets in an effort to de-lever their balance sheets. A number of the MLPs took advantage of these forced divestitures to purchase premium assets at attractive prices.
Master Limited Partnership Primer

5
Thematic Investment in U.S. Energy Infrastructure Growth There are many perspectives on the future direction of commodity prices. Every CEO, commodities analyst, and portfolio manager has his or her two cents on where he or she thinks oil and natural gas prices will trend over the next decade. Some believe that we have entered a repricing of the planet, a new paradigm, and that as India and China continue to consume greater amounts of fuel, commodity prices will continue to rise. There are others that are more
sanguine on supply and point toward record storage levels and new technologies that will unlock the vast undiscovered oil fields around the globe that were previously uneconomic. Regardless of which side of the debate they lean toward, there’s something that just about every opinionated oil executive, analyst, and portfolio manager can agree on – domestic energy demand should continue to increase over the next decade, just as it has for the previous two.
We believe it is this trend that has driven the strong returns of the last two decades in MLPs. In today’s volatile commodity world, what gives The Oppenheimer SteelPath
Master Limited Partnership Primer
-
200
400
600
800
1,000
1,200
1,40019
96
1997
1998
1999
2000
2001
2002
2003
2004
2005
2006
2007
2008
2009
2010
2011
Inde
x Le
vel (
Bas
e =
100)
AMZ SPX
Exhibit 2: AMZ vs S&P 500(total returns, dividends reinvested, 1996 - 2011)
Source: Alerian, Bloomberg. Past performance does not guarantee future results.Index performance is shown for illustrative purposes and does not predict or depict performance of the Oppenheimer SteelPath Funds. Indices are unmanaged and cannot be purchased directly by investors.
Exhibit 1: Midstream Energy Businesses’ Superior Historical Returns1
Source: Alerian, FactSet, Past performance is not a guarantee of future returns.
Yield, performance, and fund flows information discussed in this commentary are historical and relate to MLPs and the S&P 500 generally. Such yield and performance information does not represent the performance ofthe Oppenheimer SteelPath MLP Funds. Performance information provided for the Alerian MLP Index is not indicative of the performance of the Oppenheimer SteelPath Funds. The Oppenheimer SteelPath Funds were each incepted on March 31, 2010 or later, and as a result have a more limited performance history than the Alerian MLP Index.
June 1996 - June 2011
Annualized Current Correlation2 Value Sharpe Standard
Return Yield to MLPs of $1,000 Ratio3 Deviation4
MLPs1 16.9% 6.2% 1.00 $10,375 0.82 15.9%
REITS1 10.8% 3.6% 0.33 $4,656 0.41 21.8%
Utilities1 8.0% 4.0% 0.40 $3,163 0.35 14.0%
Russell 2000 7.4% 0.7% 0.37 $2,905 0.25 21.1%
Fixed Income 6.3% 1.9% 0.04 $2,507 0.66 3.6%
Dow Jones 7.7% 1.9% 0.33 $3,046 0.30 16.0%
NASDAQ 6.3% 0.7% 0.30 $2,487 0.20 26.4%
Indices do not include fees or operating expenses and are not available for actual investment. Indices presented are representative of various broad base asset classes. They are unmanaged and shown for illustrative purposes only. MLPs are represented by the total return of NYSE: AMZ, a composite index of the 50 most prominent energy master limited partnerships. Risks associated with investment in MLPs include cash flow risks, tax risks and deferred tax risks. MLPs may also be adversely affected by changes in the regulatory environment and investments concentrated in one economic sector, such as energy, experience greater volatility than more broadly based investments. Real Estate Investment Trusts (REITs) are represented by the FTSE NAREIT Equity REIT Index and are securities that sell like a stock on the major exchanges and invest directly in real estate. Risks of investing in REITs include, but are not limited to: legal, political, liquidity, interest rate risks, a decline in the value of real estate, risks related to economic conditions, changes in the value of the underlying property owned by the trust and defaults by borrowers. Utilities are represented by the Dow Jones Utilities Index. The prices of the securities of Utilities Companies may fluctuate widely due to government regulation; the effect of interest rates on capital financing; competitive pressures due to deregulation in the utilities industry; supply and demand for services; increased sensitivity to the cost of natural resources required for energy production; and environmental factors such as conservation of natural resources or pollution control. Fixed Income is represented by Barclays Aggregate Bond Index. Investing in debt securities involves risks including interest rate risk, credit risk and duration risk. The Russell 2000 Index, which is constructed to provide a comprehensive and unbiased small-cap barometer; The NASDAQ (National Association of Securities Dealers Automated Quotation System) Composite Index, which measures over 3,000 stocks listed on the NASDAQ Stock Market; and The Dow Jones Industrial Average, which is a price-weighted index comprised of 30 leading companies indicating the general state of the stock market. Investments in equities will fluctuate, sometimes rapidly and unpredictably. An investor cannot invest directly in an index. Past performance is not indicative of future results. See insert for Fund performance information.

6
team the confidence that this trend will continue? What of conservation and demand destruction? There are several key points to make. One is regarding our certainty level and the potential magnitude of error in our estimate. How likely is our 1.00% energy demand growth estimate to be correct? Could it be 2%? Could it be negative? We believe that given current demographic population growth trends, even with significant advances in the fuel efficiency of a vehicle fleet with a 14-year turnover, it is highly unlikely that petroleum products demand would not remain at least flat with today, five years, ten years, or twenty years hence. Negative growth is certainly possible for a period, perhaps for a few quarters or years, but over the longer term, as the US population continues to grow, spreads south and west, and the suburban sprawl continues to increase the number of drivers traveling longer distances to reach their places of work, the firm believes there is a very strong floor under today’s demand levels. We believe that as population growth and immigration continue, overall demand will continue to grow, even if per capita growth is more muted. It is this creeping growth and the shifting of North America’s traditional supply sources that necessitates new investment in energy infrastructure.
The sources of North America’s energy commodities have changed drastically over the past several years. Natural gas, once predicted to be in short supply, is now overflowing from burgeoning shale plays across the country. Similarly, crude oil and natural gas liquids (NGLs) are being found in new shale developments as well as old producing fields thanks to new technologies such as horizontal drilling and hydraulic fracturing. Canadian oil sand crude production is also on the rise. As transportation dynamics change and these trends continue to play out over the next decade, hundreds of
billions of dollars of greenfield investment will be required. MLPs have been and will continue to be at the forefront of this value creation, and the need for investment in US energy infrastructure has never been greater, in our opinion.
Midstream MLPs are typically toll-road business models. They (1) receive a specified tariff for hauling a product over a certain distance; (2) do not take title to the commodity; (3) do not have balance sheet exposure; (4) are largely agnostic to the level of commodity prices because these prices do not directly enter the revenue equation; and (5) do not have significant credit risk as commodity prices balloon. As the energy and investment communities continue to argue over whether oil will trade at $50 per barrel or $150 per barrel in the coming years, the more certain bet is on the growth trajectory of US energy production and the high-return capital spending projects that will have to take place to support it.
Hard Asset Play Provides Tangible Value in a Potentially Inflationary Environment
After we have exhausted this planet’s supply of gaseous and liquid hydrocarbon energy resources, these conduits could be converted to alternative fuels such as hydrogen and ethanol. For the intervening generations, however, we believe these pipeline and other midstream assets will provide real, long-term, and growing cash flows. Further, many of the interstate petroleum pipelines have annual rate adjustments are equal to the PPI for finished goods plus 2.65%, which provides a direct and timely cash flow adjustment to changes in the inflationary environment.
Master Limited Partnership Primer
17
18
18
19
19
20
20
21
21
22
22
23
2009 2014 2019 2024 2029 2034
mill
ions
of b
arre
ls p
er d
ay
Est 0.6% CAGR 2009 through 2035*
Exhibit 3: Petroleum Products Consumption Trend
20
21
22
23
24
25
26
27
2009 2014 2019 2024 2029 2034
trill
ions
of c
ubic
feet
Est 0.6% CAGR 2009 through 2035*
Exhibit 4: U.S. Natural Gas Consumption Trend
Source: Energy Information Administration
Source: Energy Information Administration

7
Better Business Models
MLPs generated 17% annualized returns over the past fifteen years, not because of any one-time event or change in relative valuation, but by consistently growing their cash distributions over that period by approximately 7% per annum. Their ability to continue to do this rests with their unique business models. Midstream assets are typically entrenched regional franchises that, in turn, support consistent growth. These dominant and, in some instances, monopoly franchises possess innate competitive advantages aided by regulation. Most MLP pipeline assets are governed by a federal agency that serves to protects their rights of way and has helped to provide for attractive rates of return to investors, however, past performance does not guarantee future results. Initial tariffs are generally predicated on a cost basis and then indexed to a measure of inflation, providing a built-in inflation hedge. Volumes have historically been fairly predictable due to long-term contracts.
MLPs own assets with useful lives of 30-40 years or longer that provide consistent cash flows without the need for substantial maintenance capital expenditures. Consistency is aided by fairly inelastic demand as residential and commercial consumers heat and cool their homes and businesses, and commuters drive to work even in the worst of times. Industrial customers can only take advantage of fuel-switching alternatives and capabilities to a certain extent, and product throughput has risen over the past decade despite the fallout from September 11th and the ensuing 2002, and more recently, the credit crisis. High barriers to entry exist because initial capital costs are prohibitive and the ability to create new rights of way is very limited.
In summary, midstream MLPs have the potential to continue to generate strong returns for years to come, driven by the following factors embedded in their business model that have contributed to their returns in the past:
• Top-line growth driven by energy demand and production growth
• Mid-single digit cash flow growth as these fixed-cost business models allow much of this predictable revenue growth to reach the bottom line
• Attractive organic investment opportunities resulting from their franchise-protected footprint, generating additional and often near-term accretion to the distribution
• Opportunities for additional asset acquisitions driven by the macro trends described in detail below, creating additional immediate accretion to the distribution.
Importantly, these are the same factors that have allowed these businesses to perform well in the past and nothing has changed in the macro environment that would suggest that these same factors will not drive returns in the future.
MLPs Exhibit Insignificant Correlation with the Broader Equities Market
The majority of equity asset classes and sectors tend to be strongly positively correlated with the broader market. MLP returns have exhibited statistically insignificant correlation with the market over nearly two decades (see Exhibit 1). This makes fundamental sense given that the demand for petroleum products and natural gas is highly inelastic in the near term and is largely unaffected by the vicissitudes of the economy.
For example, during 2002, one of the sharpest recessions in US history, petroleum products consumption remained flat. During the recent financial crisis, when crude oil dropped from $140 per barrel to $40, domestic petroleum demand dropped a mere 8% and is already on track to return to pre-crisis levels next year. Swings in economic indicators and interest rates, which can roil the broader markets because they can both significantly and rapidly affect corporate America’s cash flows, do not materially impact the demographic trends underpinning the long-term cash flow trajectory of MLPs.
Without physical product shortages, such as those experienced in the 1970s, there will be very little consumption impact even over a period of years during times of highly elevated prices. Therefore, regardless of the direction of performance of the broader equity markets and the cyclical state of the economy, our research indicates that MLP cash flows are likely to remain consistent and potentially provide for strong equity performance that is relatively independent of these broader indicators. This means adding an MLP allocation can help reduce portfolio beta5 to the broader market.
An Emerging Asset ClassMLPs in their current form were created by Congress in 1986. Structured as partnerships, all income, losses, gains, and deductions are passed on to limited partners and are only taxed at that level (i.e. no entity-level taxation), meaning that investors in MLPs avoid the double taxation of investing in corporations. Congress created this structure
Master Limited Partnership Primer

8
to encourage investment in US natural resources and energy infrastructure. Since then, as the MLP structure has gained more widespread adoption, there has been a gradual yet quickly accelerating transition of MLP-qualifying assets from corporations to MLPs given the effective tax arbitrage of holding these assets in the partnership structure and the value that highly specialized management teams can provide.
Energy infrastructure assets held by oil majors, refiners, and utilities are often underutilized because they are not run for profit. In some cases, direct competitors would prefer not to risk divulging competitive information. Exxon’s investors measure the company’s performance on exploratory success, production growth, reserve replacement, and other ratios that do not reward the company’s stock price for maintaining pipeline assets. The potential pipeline earnings of such companies are dwarfed by their exploration and production (E&P) cash flows. Consequently, larger energy companies continue to ignore their midstream assets and many remain undermanaged and underutilized. MLPs that hold these assets have the incentive, expertise and freedom to maximize use and profitability.
Corporations with MLP-qualifying assets will often create MLPs in which they retain general partner (GP) ownership interests thus allowing these assets to be dropped down into a more tax-efficient structure where stable cash flows will be far more highly valued outside of the volatility of the parent company’s earnings stream. It makes little sense for highly cyclical, low-P/E6 energy corporations to hold these high-multiple assets on their balance sheets. E&P companies in particular are motivated to sell these businesses given the premium that is placed by their investors on making commodity price-sensitive investments that involve both greater risk and greater potential reward.
We estimate that there are over $200 billion of such assets currently held in structures subject to entity-level taxation, much of which may ultimately be rationalized into the MLP structure. Additionally, there are many groups of assets – including refineries, oil/gas wells, coal gasification, and LNG liquefaction/regasification facilities – that have begun to be included in this structure, potentially adding tens of billions of dollars to sector growth.
As these assets migrate to the MLP structure, partnerships use the equity and debt capital markets to fund acquisitions. In 2005, $5 billion of equity and $5 billion of debt was issued as companies aggressively financed growth projects and investments. In 2006, more than $10 billion of equity issuance was spurred by 18 initial public offerings. In 2007, equity issuance reached $15 billion. Though the rate of equity issuance abated somewhat in 2008 and 2009 due to the disruptions in the broader economy and capital markets, MLPs were still able to raise nearly $15 billion in equity and over $20 billion in debt. The ability of the MLPs to access capital over this period is a testament to the stability of their underlying businesses and the value that investors place on their stable and growing distributions. Equity and debt issuance sky-rocketed to $15 billion and $20 billion, respectively, in 2010 as the need for new energy infrastructure to serve new shale plays accelerated. We are half-way through 2011 and on pace to surpass 2010 levels. This reliance on capital markets to finance growth projects and acquisitions (MLPs pay out the majority of their cash flow as distributions to investors) has instilled a tremendous capital discipline in the sector. Unlike other sectors of the economy where a CEO can plough hundreds of millions of dollars into a pet project or self-serving initiative, MLP management teams must have the vote of confidence from the public markets before they proceed.
Further, due to the sector’s focus on distributions and cash flows per unit, projects or acquisitions that are cash flow dilutive or only minimally accretive are quickly exposed. There is no incentive for management teams to pursue questionable transactions to simply boost GAAP earnings.
We believe that this is the reason cash returns on cash invested in the MLP sector have dwarfed those of its energy peers including E&P, refining, gas utilities, and electric utilities over the past two decades. The typical investment pursued by a midstream MLP has historically provided a 12-15% internal rate of return (IRR)7, typically carries relatively low risk and may potentially provide substantial cash flow accretion to unitholders.
Master Limited Partnership Primer
Exhibit 5: MLP Market Capitalization
Source: Alerian, Oppenheimer SteelPath estimates
$0
$50
$100
$150
$200
$250
1995 2000 2005 2010
(bill
ions
)

9
Substantial Investment Required to Meet U.S. Infrastructure Demands
Demand for energy infrastructure continues to rise as natural gas and crude oil production estimates continue to be revised upward. Analysts* estimate that US onshore crude oil production growth will exceed 67% and US onshore natural gas production growth will approximate 32% between 2010 and 2016.
The Interstate Natural Gas Association of America (INGAA) recently released a report** calling for over $250 billion dollars in infrastructure investment over the next 25 years to support the growing supply of crude, oil, natural gas, and NGLs from emerging shale plays. According to INGAA the majority of this investment will be spent on natural gas infrastructure as they project a 1.6% increase per year in North American demand for gas, primarily through power generation as utilities switch from coal to natural gas. The majority of this shale gas production is located away from consuming regions and will therefore require infrastructure build out to link supply and demand.
Perhaps more pressing in the near-term, the lack of sufficient crude oil infrastructure to meet production volumes is causing bottlenecks across the country. The most obvious example is the price spread between West Texas Intermediate (WTI) and Brent crude. Normally trading at a premium to Brent, WTI today is trading at a discount to the international benchmark due to a supply glut at WTI’s pricing point in Cushing, OK. Accelerating production of Canadian oil-sands, as well as growing Bakken supply, has created a supply glut at Cushing and depressed the price.
This disparity has spurred midstream companies to address the issue in several ways, from reversing and retrofitting existing pipelines to proposing several major projects that will take crude volumes from Cushing to the US Gulf Coast. Similar bottlenecks are happening in other regions and producers are actively consulting with midstream operators to satisfy the demand for energy infrastructure.
The opportunity set for high-returning, stable cash-flow generating energy infrastructure investments continues to grow.
The Future of MLPs
Due to the attractive valuations assigned to MLPs by investors, the types of midstream logistics assets in the MLP asset class are only going to continue to expand. We believe that in addition to the $200 billion-plus stable of midstream assets currently housed in public corporate structures and $250 billion of “traditional” midstream new build necessary to meet energy infrastructure demand in the United States over the next several decades, alternative energy sources such as LNG, coal gasification, and gas-to-liquids technology, are very real and represent hundreds of billions of dollars more in potential fixed cost, hard asset, long-term contract energy logistics opportunity.
As domestic natural gas production continues to rise, several groups have applied for LNG export permits, including one MLP, Cheniere Energy (NYSE: LNG). LNG tankers, acting as floating pipelines, have also joined the MLP stable of assets.
Looking down the road, other potential assets include biofuel logistics and transportation facilities as federal mandates for consumption increase demand.
Structural Valuation Issues Create Substantial Long-Term Upside
We believe the lack of wholesale institutional participation in the asset class has resulted in a structural under pricing of MLPs relative to other asset classes. Institutional participation is limited due to some significant barriers to entry, including restrictions on mutual fund ownership and Unrelated Business Taxable Income (UBTI). Under the UBTI rules, tax-exempt institutions and retirement accounts must pay tax on income from a business that is not related to their exempt purpose. Because of the pass-through nature of
Master Limited Partnership Primer
Exhibit 6: Number of Publicly Traded MLPs
Source: SEC, Oppenheimer SteelPath estimates
0
10
20
30
40
50
60
70
80
90
1995 2000 2005 2010
*Bentek Energy, Barclays Capital Estimates**North American Midstream Infrastructure Through 2035

10
an MLP, or any partnership, unit holders are treated by the tax code as if they are directly earning the MLP’s income. Therefore, the tax is owed on the retirement account’s share of the MLP’s taxable business income as reported on the K-1. Though there is a deduction that covers the first $1,000 of unrelated business income from all sources; after that, the retirement account will owe tax.
The current growth trajectory of MLPs appears to strongly resemble that of REITs during the 1990s. Similar to MLPs, REITs were created as a tax-advantaged structure to encourage investment in that particular sector. We strongly believe there is a similar parallel between the emergence of REITs as a distinct asset class and the growth that we have seen – and expect to continue to see – in MLPs. In 1985, there were approximately 30 equity REITs with a combined market capitalization of $30 billion. Today, there are approximately 300 equity REITs representing $400 billion in market capitalization (excluding hybrid and mortgage REITs). MLPs, while still in the early stages of development, have started to emerge.
During the first 20 years of their existence after Congress created the structure in 1960, REITs traded at an average 250 basis-point8 premium to the 10-year Treasury. Following the REIT IPO boom of the late 1980s and early 1990s and the migration of institutional real estate allocation dollars from the private to public markets, REITs have traded on average at par with the 10-year Treasury as investors have been willing to trade off the business risk for the inflationary growth component of REIT rents.
Over the past 10 years, MLPs have traded at an normalized average 277 basis point spread to the 10-year Treasury. Given the substantially similar asset risk profiles of REITS and MLPs (we would argue MLPs have a substantially lower business risk profile given their lower cash flow volatility, high degree of financial transparency given real time federal reporting requirements, and a constructive federal regulatory scheme), there is no compelling reason for this spread to exist. We believe the disparity has been a function of the restrictions that have been placed on institutional ownership of MLPs, and that as more sophisticated investors enter the space, this disparity will disappear. In the meantime, we believe this mispricing creates a very attractive relative risk/reward value proposition.
Flying Under the Radar – Limited Institutional Ownership of MLPs
Given the attractive performance track record in the MLP sector, many investors wonder: How is it that there is so little institutional participation? What am I missing? Isn’t this too good to be true if it hasn’t caught on?
To begin with, hindsight is always 20/20. “Well of course REITs make sense!” (Not a phrase that was said very often in the mid-1980s when there were 30 publicly traded vehicles with an unimpressive $30 billion of market capitalization.) Now considered by many a staple of institutional or individual investor’s well-diversified portfolio, REITs were not on the institutional radar screen until the early 1990s. REITs were created in 1960, but it took some time before they were accepted.
In this case, however, there are very particular structural reasons why MLPs have not become more popular with the institutional investor set. MLP distributions and income allocations have historically been considered non-qualifying sources of income, which impedes regulated investment companies (RICs) such as mutual funds from investing. If Fidelity and Putnam cannot invest, then Goldman Sachs or Morgan Stanley can not earn a commission and, therefore, there is no incentive for one of their salespeople to educate or pitch the investor on the asset class. In other words, Wall Street has never championed MLPs as an attractive investment to their institutional customers because many of these customers were restricted from purchasing. For this
Master Limited Partnership Primer
Exhibit 7: MLP Median Daily Dollar Trading Volume
Source: Bloomberg, Oppenheimer SteelPath
0
100
200
300
400
500
600
700
800
1996 1998 2000 2002 2004 2006 2008 2010
dolla
r tra
ding
vol
ume
($ m
illio
ns)

11
same reason, the universe of expert analysts and portfolio managers who understand the many nuances of the MLP space is also limited. This product has always been sold directly to retail through the private wealth management offices of the bulge-bracket investment banking firms.
Pursuant to Section 331 of the American Jobs Creation Act of 2004, MLP distributions and income allocations are now considered qualifying sources as it relates to the special tax status of RICs. However, at least 75% of a RIC’s assets must be invested in investment vehicles that are not MLPs, and a RIC may not own more than 10% of any single MLP. Mutual funds, and not their investors, will continue to receive K-1s, and will be required to file tax returns in the states in which the MLP operates.
As well meaning in spirit as the Jobs Act was, there are still substantial practical hurdles to full-scale mutual fund investment in MLPs. First, the timing discrepancy between the calculation of the RICs distributions and their 1099s (typically November through January) and the issuance of K-1s by MLPs (March) creates an administrative burden for RICs, which are forced to estimate their investors’ share of MLP income, losses, credits, and deductions.
Another administrative burden relates to state filing requirements. With some MLPs operating in multiple states, the mutual fund itself may consequently have to file tax returns in each of those states. Furthermore, not all states (e.g. Massachusetts) recognize federal statutes concerning qualifying income, further complicating the problem.
Another concern in the institutional investing community is that the sector does not possess sufficient liquidity for investment. However, this continues to improve. The median market capitalization in the space is now greater than $1.8 billion. Nonetheless, compared to gas utilities, which attract substantial institutional attention, MLPs have virtually zero traditional mutual fund ownership. For example, Washington Gas and Light (NYSE: WGL), a $2.0 billion gas utility, counts BlackRock, American Century, Vanguard, and State Street among others in its top 10 holders list. None of these names are present in the MLP space, which has companies with significantly larger market capitalization and greater economic importance. Because institutional investors are familiar with gas utilities’ historical correlations, earnings trends, price behavior, and utilities are eligible for inclusion in mutual fund and tax-exempt portfolios, these institutions continue to devote substantial resources and capital investment toward the gas utility sector while generally ignoring MLPs. However,
as trading liquidity continues to increase and distribution levels and growth continue to outpace other dividend equities, we believe that institutional interest will continue to grow.
What is a Midstream Asset?Traditional MLP operations can be broadly grouped into four categories – pipelines, terminals/storage, marine transportation and midstream services. These categories can further be subdivided by product types, including ammonia, bulk products, carbon dioxide, coal, crude oil, heating oil, refined petroleum products, natural gas and natural gas liquids, and propane.
Crude Oil/Refined Products Transportation
Crude oil and refined petroleum products are transported by pipelines, marine transportation, railroads and trucks. Pipelines are the most efficient mode of transportation for long-haul movement, followed by tankers/barges. Rail and truck usage is cost-effective only over short distances and, therefore, accounts for only a small percentage of petroleum transportation.
The US crude oil and petroleum products transportation system links oil wells and import terminals to refineries, which in turn are linked to end users of petroleum products. This system is comprised of networks of pipelines, terminals, storage facilities, tankers, barges, rail cars, and trucks. Throughout the distribution system, terminals exist to provide storage, distribution, blending, and other ancillary services. Crude oil that is pumped to the surface from reservoir deposits is collected on gathering pipelines and brought to longer-haul trunk pipelines to be transported to refineries, which then separate the feedstock into products. Product then originates on pipeline systems from direct connections with refineries and interconnections with other interstate pipelines for transportation and ultimate distribution.
Petroleum products transported, stored, and distributed through petroleum products pipelines and terminals include:
• refined petroleum products, which are the output from refineries and are primarily used as fuels by consumers (gasoline, diesel, jet fuel, kerosene, and heating oil)
• liquefied petroleum gases (LPGs), which are produced as by-products of crude oil refining and as part of natural gas production (these include butane and propane)
Master Limited Partnership Primer

12
• blendstocks, which are blended with petroleum products to enhance various specifications, such as raising a gasoline’s octane or oxygen content
• heavy oils and feedstock for further processing by refineries and petrochemical facilities
• crude oil and condensate, which are used as feedstock by refineries
Fungible products shipped on such systems are typically generic products. These products meet published standard specifications; shippers will receive equivalent product but may not get back the actual product shipped. Segregated products are branded products or specific blendstock materials. On segregated shipments, shippers will receive the same product that they had injected into the system.
With pipeline transportation, crude oil and refined petroleum products travel at roughly three to five miles per hour in long-haul trunkline pipelines. The greater the volume being transported on a given day, the faster the product generally moves. It can take anywhere from two to three weeks for a batch of petroleum products to move from a refinery tailgate in Houston, Texas, to the New York harbor.
Interstate pipelines carry crude oil and refined products across state boundaries and are subject to Federal Energy Regulatory Commission (FERC) regulation on the rates charged for their services, on the terms and conditions of the services they offer, and on the location, construction, and abandonment of their facilities. Intrastate pipelines transport within a particular state and are not subject to regulation by the FERC, but rather individual state agencies responsible for such oversight.
Interstate petroleum pipelines benefit from a benign over arching federal regulatory framework, which provides management teams with a strong incentive to innovate and cut costs. Unlike traditional cost-of-service, authorized rate-of-return utility rate-making, petroleum products pipelines do not have to share cost improvements with their customers. After an initial rate is set, as per the 1992 Congressional Energy Policy Act, the tariff rate structure on the pipeline is increased by the prior year’s change in the PPI for Finished Goods plus a 2.65% margin every July 1st.
Transportation tariffs vary depending on where the product originates, where ultimate delivery occurs, and any applicable discounts. All interstate transportation rates and discounts are in published tariffs filed with the FERC. Tariffs are designed to ensure appropriate rates of return for pipeline owners, with annual tariff increases of PPI + 2.65%
functioning as an embedded cost recovery mechanism – thus providing a built-in inflation hedge for partnerships that own crude oil and refined product interstate pipelines. Published tariffs serve as contracts, and shippers nominate the volume to be shipped up to a month in advance. In addition, supplemental agreements are entered into with shippers that typically result in volume and/or term commitments by shippers in exchange for reduced tariff rates. These agreements have terms of one to 10 years. Product services such as ethanol loading, additive injection, and custom blending are performed as needed under monthly or long-term agreements. Pipeline operators generally do not take title to the product they are shipping, leaving little direct commodity exposure (inelastic demand characteristics for refined petroleum products further supports this).
Competition with other pipeline systems is based mainly on transportation charges, quality of customer service, proximity to end users, and history of individual customer relationships. However, given the different supply sources on each pipeline, pricing at either the origin or terminal point on a pipeline may outweigh transportation costs when customers choose which line to use.
Crude Oil/Refined Products Terminals
Terminals are large storage and distribution facilities that handle crude oil and refined petroleum products. Terminals are typically located in close proximity to refineries and can be classified as either inland or marine. Inland terminals generally consist of multiple storage tanks that are connected to a pipeline system. Products are loaded and unloaded from the common carrier pipeline to storage tanks and directly from storage tanks to a truck or rail car loading rack. Marine terminals primarily receive petroleum products by ship and barge, short-haul pipeline connections from neighboring refineries, and common carrier pipelines.
Terminals generate fees primarily by providing short- and long-term storage of crude oil and refined petroleum products, as well as ancillary services. Revenue is generated by charging customers a fee based on the amount of product that is delivered through terminals. In addition to throughput fees, revenue is generated by charging customers a fee for providing services such as blending and additive injection. Terminals are unregulated and rates are market-based as a result. Terminal contracts, which typically provide for storage for anywhere from a few days to several months, generally last for one year with annual renewal provisions. Most of these contracts contain a minimum throughput provision that obligates the customer to move a
Master Limited Partnership Primer
13
minimum amount of product through a terminal or pay for terminal capacity reserved but not used. In general, similar to pipeline operators, terminal operators do not take title to the products that are stored in or distributed from their terminals.
Terminal demand is greatest in a contango market, in which future petroleum prices represented by the forward curve are higher than prevailing spot prices. In these circumstances, customers tend to store more product to arbitrage the higher prices expected in the future. When backwardation (the opposite of contango, i.e. future prices are lower than spot prices) exists, customers tend to transport more product to end markets to take advantage of current higher prices in lieu of storing product.
Refiners and chemical companies will use third-party terminals when their facilities are insufficient due to size constraints, specialized product handling requirements, or geographic considerations.
Midstream Natural Gas Industry
Natural gas is rapidly growing as a global energy source, accounting for approximately 25% of world energy consumption today. This growth has been driven by plentiful reserves, the environmental benefits of its clean-burning nature, and the broad range of its applications.
Once natural gas is produced from wells in areas such as the Gulf of Mexico, producers then seek to deliver the natural gas and its components to final markets. The midstream natural gas industry is the link between upstream E&P and downstream end markets. The midstream natural gas industry generally consists of natural gas gathering, transportation, storage, and processing/fractionation activities. The midstream gathering segment typically involves local competition based on the proximity of gathering systems and processing plants to natural gas-producing wells.
Transportation
The US natural gas pipeline system transports natural gas from producing regions to customers such as local distribution companies (LDCs), industrial users, and electric generation facilities. Similar to crude oil and refined product pipelines, interstate pipelines carry natural gas across state boundaries and are subject to FERC regulation on the rates charged for their services, terms and conditions of the services they offer, and location, construction, and abandonment of their facilities. Intrastate pipelines, likewise, provide transportation within a particular state and are not subject to FERC regulation, but rather governance at the state agency level.
Gathering
The natural gas-gathering process involves the connection of producing wells to pipelines, called gathering systems, which provide short-haul takeaway capacity. Gathering systems generally consist of a network of small-diameter pipelines that collect natural gas from producing wells and transport it to trunkline pipelines for further transmission. Gathering systems operate at design pressures that maximize the throughput from all connected wells. Some systems are supported by a reserve dedication, which commits the producer to utilize the midstream service provider’s system for all current and future production for a specified period, often for the life of the producer’s reservoir lease.
Master Limited Partnership Primer
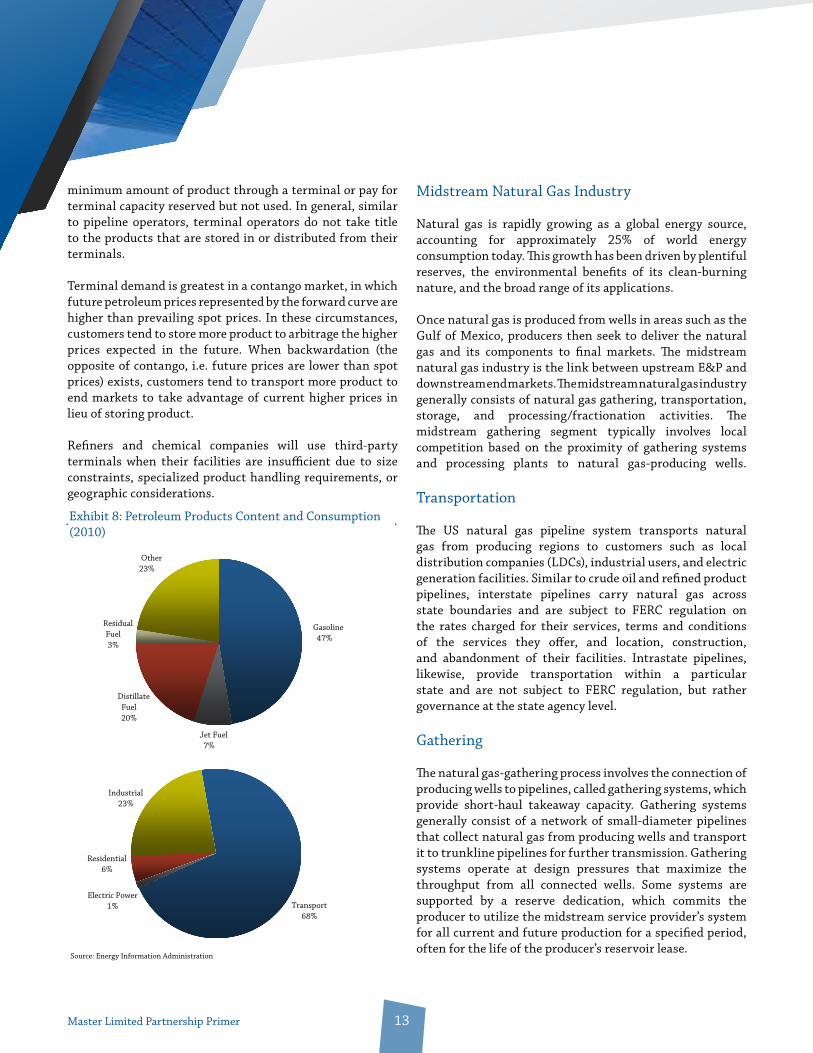
Exhibit 8: Petroleum Products Content and Consumption(2010)
Source: Energy Information Administration
Industrial23%
Residential 6%
Electric Power1% Transport
68%
Gasoline47%
Jet Fuel 7%
Distillate Fuel20%
Residual Fuel3%
Other23%

14
Since wells produce at progressively lower field pressures as they age, it becomes increasingly difficult to deliver the remaining production in the ground against a higher pressure that exists in the connecting gathering system. Natural gas compression is a process in which a volume of gas at an existing pressure is compressed to a desired higher pressure, allowing gas that no longer naturally flows into a higher-pressure downstream pipeline to be brought to market. Field compression is typically used to allow a gathering system to operate at a lower pressure or provide sufficient pressure to deliver gas into a higher-pressure downstream pipeline. If field compression is not installed, then the remaining natural gas in the ground will not be produced because it cannot overcome the higher gathering system pressure. In contrast, if field compression is installed, a well can continue delivering natural gas that otherwise would likely not be produced.
Dehydration
Natural gas collected at the wellhead has a variety of components that typically render it unsuitable for long-haul pipeline transportation. Produced natural gas can be saturated with water, which must be extracted given that natural gas and water can combine to form ice that can block parts of the pipeline gathering and transportation system. Water can also cause corrosion when combined with carbon dioxide (CO2) or hydrogen sulfide (H2S) in natural gas. In addition, condensed water in a pipeline can raise pipeline pressure. To meet downstream pipeline and end-user gas quality standards, natural gas is dehydrated to remove the saturated water.
Treating
In addition to water, natural gas collected through a gathering system may also contain impurities such as carbon dioxide and hydrogen sulfide, depending on the reservoir from which it is derived. Natural gas with elevated amounts of carbon dioxide or hydrogen sulfide can be damaging to pipelines and fail to meet end-user specifications. As a result, gas with impurities higher than what is permitted by pipeline quality standards is treated with liquid chemicals called amines at a separate plant prior to processing. The treating process involves a continuous circulation of amine, which has a chemical affinity for carbon dioxide and hydrogen sulfide that allows it to absorb the impurities from the gas. After mixing, gas and amine are separated and the impurities are removed from the amine by heating. Further, to alleviate the potentially adverse effects of these contaminants, many
pipelines regularly inject corrosion inhibitors into the gas stream.
Processing
Once water and other impurities are removed from natural gas, the gas must then be separated into its components. Natural gas processing involves the separation of natural gas into pipeline quality natural gas and a mixed stream of natural gas liquids (NGLs). The primary component of natural gas is methane (CH4), but most gas also contains varying degrees of liquids including ethane (C2H6), propane (C3H8), normal butane (C4H10), isobutane (C4H10), and natural gasoline. NGLs are used as heating fuels and as feedstock in the petrochemical and oil refining industries.
Natural gas pipelines have specifications as to the maximum NGL content of the gas to be shipped. In order to meet quality standards for pipelines, natural gas that does not meet these specifications must be processed to separate liquids that can have higher values as distinct NGLs than they would by being kept in the natural gas stream. NGLs are typically recovered by cooling the natural gas until the mixed NGLs separate through condensation. Cryogenic recovery methods are processes where this is accomplished at very low temperatures and provide higher NGL recovery yields. After being extracted from natural gas, the mixed NGLs are typically transported to a fractionator for separation of the NGLs into their component parts.
Processing contracts can take on a number of forms including: (1) fee-based arrangements; (2) percentage of liquids/proceeds contracts, which effectively give the processor long exposure to natural gas and/or NGL prices; (3) percentage of index contracts, which effectively lock in a margin for the processor; and (4) keep-whole contracts, which effectively creates a long NGL / short natural gas position for the processor and exposes the processor to what is referred to as the fractionation spread (the processor retains ownership of the NGLs and is required to reimburse the producer for the value of the lost heat content from the NGLs having been stripped out, creating the short gas position).
Fractionation
Fractionation is the method by which NGLs are further separated into individual components. NGL fractionation facilities separate mixed NGL streams into discrete NGL products. Ethane is primarily used in the petrochemical industry to produce ethylene, a key building block for a
Master Limited Partnership Primer

15
wide range of plastics and other chemical products. Propane is used in the production of ethylene and propylene and as a heating fuel, an engine fuel, and an industrial fuel. Isobutane is commonly used to enhance the octane content of motor gasoline. Normal butane is used in the production of ethylene, butadiene (an important component of synthetic rubber), motor gasoline, and isobutane. Natural gasoline, a mixture of pentanes and heavier hydrocarbons, is used primarily to produce motor gasoline and petrochemicals. In the US, NGLs are produced primarily by gas processing plants but also by crude oil refineries.
Fractionation isolates the component NGL’s by using their boiling points. NGLs are fractionated by heating mixed NGL streams and sending them through a series of distillation towers. As the temperature of the NGL stream is increased, the lightest (lowest boiling point) NGL product boils off the top of the tower, where it is condensed and moved to storage. The remaining stream is then sent to the next tower, where the process is repeated and a different NGL product is separated and stored. This process continues until the NGL stream has been separated into its components.
Natural gas processing facilities have some flexibility in the extent to which they separate NGLs from natural gas. The actual volume of NGLs produced is often determined by the degree to which NGL prices exceed natural gas prices and the cost of separating the mixed NGLs from the natural gas stream. When the value of extracting discrete NGL products is less than what would be achieved by allowing them to remain in the natural gas stream, the recovery levels of certain NGL products, particularly ethane, can in some instances be reduced. Ethane rejection and similar processes to reduce NGL recovery are still limited by pipeline and end-user specifications, although blending with low NGL content natural gas (referred to as dry gas as opposed to NGL-rich wet gas) can sometimes be used as an alternative to processing.
After NGLs are fractionated, the fractionated products are transported to customers or stored for future delivery. NGL products must be pressurized or cooled to a liquid state for storage or transportation. The mixed NGLs delivered to fractionation facilities from domestic gas processing plants and crude oil refineries are typically transported by NGL pipelines and, to a lesser extent, by rail car and truck. Both producers and end users will look to store NGLs to ensure an adequate supply for their respective customers over the course of the year and, in particular, periods of heightened demand.
MLPs that own or operate natural gas processing and fractionation plants must manage a unique set of complex risks associated with the basis between natural gas and various NGL products. With the benefit of developing hedging markets, most MLPs have become quite sophisticated in their management of these risks, ensuring the ability to continue providing their unitholders with dependable distributions.
Storage
Natural gas storage facilities are used by natural gas end users such as LDCs to ensure a reliable supply for their customers and their marketing and trading businesses as part of a purchase and sale strategy. Natural gas is typically stored in underground facilities such as salt dome caverns and depleted reservoirs. Natural gas demand is usually greater during the winter because it is mainly used for heating by residential and commercial customers. Typically, excess natural gas delivered during summer months is stored to meet the increased demand during winter months. However, as natural gas-fired electric generation continues as an emerging theme, demand for natural gas during the summer months to meet cooling needs should rise accordingly.
Natural gas is typically stored underground in salt formations and depleted reservoirs because above-ground storage tends to be uneconomical. Salt formations are not altered by the stored products and can contain large quantities of natural gas safely and in a cost-effective manner. A salt cavern is formed by drilling and dissolving an underground cavern in a naturally existing salt formation and installing related surface facilities. Water mixed with salt, or brine, is used to displace the stored products and to maintain pressure in the well as product volumes change.
LNG Transportation
As the use of natural gas continues to rise internationally, the gap between the expected demand by consuming nations and their production levels is also increasing, requiring the shortfall to be met with imports. A majority of the global supply of natural gas has traditionally been stranded given the dislocation in producing regions and end markets and the difficulty in transporting gas between the two. Pipeline transportation is generally the most cost-effective means of transporting natural gas, although such transportation is naturally limited by distance and terrain. When pipeline transportation is not possible or natural gas demand
Master Limited Partnership Primer

16
sufficiently exceeds available supply, LNG provides a way to import natural gas.
LNG provides an economical way to transport natural gas via ship by cooling it to a liquid form. This significantly reduces the volume, enabling storage and transportation by ship over long distances, thereby helping regions with inadequate reserves or limited access to long-distance transmission pipelines to meet their natural gas demand. LNG is transported overseas in specially built tanks on double-hulled ships to terminals where it is offloaded and stored in insulated tanks. The LNG is regasified and then shipped by pipeline for distribution to natural gas customers. LNG carriers are usually enlisted to carry LNG on time charters, where a vessel is hired for a fixed period of time, typically around 25 years. LNG shipping historically has been predicated on long-term, fixed-rate time charter contracts owing to how expensive LNG carriers are to build, as well as the need for natural gas customers to maintain a reliable supply of natural gas.
The two primary groups of LNG vessel operators are nationalized energy and utility companies and independent ship owners. Given the complex, long-term nature of LNG projects, major energy companies historically have transported LNG through their captive fleets. However, independent ship owners are starting to gain a greater share of LNG ship charters. Similar to other tanker and barge operations, the increasing ownership of the world LNG fleet by independent owners is mainly attributable to: (1) the desire of some major energy companies to reduce their commitment in the transportation business, which is non-core to their operations; (2) the cost of financing new LNG carriers; and (3) in the case of LNG, the high construction costs of liquefaction and regasification facilities.
The volume of LNG shipped internationally is increasing quickly as a result of recent improvements in liquefaction and regasification technologies, decreases in LNG shipping costs, and increases in demand from consuming regions located far from natural gas reserves. Historically, Indonesia, Malaysia, and Algeria have been the major LNG exporters, with the Middle East, Africa, and Russia expected to become large exporters over time. The largest importers of LNG have traditionally been Japan, South Korea, and Taiwan, with Europe emerging as major importer as well. It is likely that there will be a significant increase in the amount of LNG shipped from major gas-producing areas to regions with insufficient gas production in order to meet expected increases in global natural gas demand.
Valuing Midstream Energy BusinessesAt the most basic level, the valuation of an MLP is no different than the valuation of any publicly traded corporate entity or private enterprise. Today’s fair value should reflect the expected future cash flow stream to the investor, appropriately discounted for the risk associated with the stream of payments and the time value of money. Investors often look at current yield, the most recent annualized distribution over the current unit price, as the primary measure of value when comparing MLPs. We believe, however, that a longer-term outlook on cash flow generation is needed and a bottoms-up calculation of the discounted cash flows using an appropriate required rate of return is a superior approach to MLP valuation.
Master Limited Partnership Primer
Natural GasEnd Users
NGLEnd Users
Wellhead Gathering Dehydration, Treating,
Processing
Fractionation
NGL Transportation & Storage
Natural Gas Transportation & StorageExhibit 9: Natural Gas Chain
Source: Oppenheimer SteelPath

17
The Defining Characteristic of the MLP Model – Aiming to Provide Stable, Growing Distributions
We believe it is important to analyze “distributable” cash flow (after maintenance capital expenditures) to recognize the unique characteristics of these attractive business models. While there is no legal requirement regarding the level of unitholder cash distributions, a precedent has largely been set that investor interest in any given partnership is predicated on safe cash distributions that are consistently paid out just as a corporate board sets a dividend policy. Distributable cash flow is generally calculated as earnings before interest, taxes, depreciation and amortization (EBITDA) plus non-cash losses, minus interest expense, maintenance capital expenditures, and non-cash gains.Depending on the relative stability of cash flows, partnerships have historically maintained 1.05-1.20x cash coverage of their distribution. A distribution cut or even heightened concern over distribution stability would have a significantly adverse impact on a partnership’s unit price, as was realized in ‘08-09, creating a self-regulating mechanism that in this case forces management teams to be prudent with their distributable cash coverage.
Net Asset Value
In attempt to purchase securities that offer the best long-term value proposition and whose value is not inappropriately dependent on changes in a volatile market, we subject each potential portfolio holding to both a sum-of-the-parts net asset value (NAV) analysis and a sensitivity analysis.
Our NAVs are derived from a bottoms-up model of each of the business segments owned by the MLP. The cost of capital applied to each segment is carefully determined to reflect the risk, cash flow profile and outlook for that particular segment. Securities we believe offer a compelling investment opportunity based on our NAV analysis are further subjected to a sensitivity analysis to determine if the partnership’s leverage, debt covenants, and distribution levels are appropriately balanced to the partnership’s exposure to market volatility.
Many investors that focus on the MLP space base their valuations on either a target distribution yield or a distribution discount approach. The Oppenheimer SteelPath team believes both of these approaches can lead to inappropriate valuations due to the fact that: 1) neither approach allows for a comprehensive analysis of the risk associated with each of the underlying businesses, and 2)
both approaches place higher values on partnerships that are paying out the largest share of cash flows generated regardless of whether such payout ratios are appropriate.
Cost of Capital Can Vary with Business Risk
We believe that an MLP’s cost of capital is a function of its business risk profile. As such, there are two main components to consider -- cash flow volatility and cash flow sustainability. Volatility refers to the quarterly fluctuation in operating cash flow. For example, the propane and heating oil businesses are seasonal, and thus exhibit significantly higher quarterly cash flow volatility than refined products transportation. Sustainability of cash flows takes into consideration the regulatory environment in which the MLP operates and whether or not its asset base is depleting in nature. If an interstate pipeline generates stable cash flows, but is at risk to have its tariff arrangements completely restructured by the FERC, its business risk profile is adversely affected. Depleting assets increase the business risk profile as well because they force the company to make acquisitions to maintain its cash flow stream. Examples of depleting asset businesses include E&P, gathering and processing, and mining.
Popular Misconception: Relative Yield
Historically, MLPs have largely been thought of as fixed-income substitutes with a focus on the yield component, despite the lack of a strong correlation between yield indices and MLP unit prices. However, many MLPs are truly growth vehicles and given an approximate 7% annualized distribution growth rate over the last decade as an asset class, with top performers substantially above this mean, we believe capital gains and distribution growth will be a much larger part of total returns for top performers. Consequently, yield dispersion metrics (relative to historical levels, the MLP group, relevant individual MLPs, Treasuries, and other yield-oriented investments) are increasingly sub-optimal in valuing these yield-growth hybrid instruments.
Other Relative Price Metrics
Aside from relative yield, Enterprise Value/EBITDA (EV/EBITDA)9 and Price/Distributable Cash Flow (P/DCF)10
metrics, among others, are also helpful in gauging what near-term market expectations are being reflected in an MLP’s unit price. However, these metrics also fail where relative yield does, in that they are static and do not fully incorporate future growth potential nor appropriately
Master Limited Partnership Primer

18
discount for the associated risk of current cash flows. Further, EV/EBITDA can provide very misleading results if not adjusted to account for the impact of the general partner and the IDR cash flows. Much of the analysis provided by Wall Street fails to make these adjustments and as a result some MLPs appear to be trading at very attractive EV/EBITDA multiples when in fact they are trading at very high multiples versus their peers after that ratio is adjusted appropriately. Although near-term pricing inefficiencies exist due to limited institutional participation, we believe that the most compelling investment theme in this space is to select partnerships with strong management teams and assets that are poised to grow significantly, and to hold these investments as the growth story plays out over the long term.
Determining Accretion
The majority of the investment community calculates economic benefits by taking the spread between the security’s current yield and the return earned on the asset. A company’s cost of equity capital does not necessarily bear any relation to its current yield (Microsoft does not have a 2.9% cost of equity capital by virtue of its yield, and neither does a low-yielding, “high-growth” MLP), yet the investment community’s acquisition analysis continues to reflect these numbers. Furthermore, we believe that the acquirer’s true long-term economic benefits must take into account the acquired asset’s risk profile and the commensurate required rate of return. If a low-risk, interstate transportation company purchases riskier, commodity price-sensitive gas-gathering assets, one cannot use the predecessor company’s cost of capital. However, we continue to see the investment community conduct economic analysis on this basis. Using an artificially low and theoretically incorrect cost of equity capital leads to exorbitantly “accretive” transactions that offer no true economic benefit to the unitholder over the long term.
Fundamental RisksAlthough we firmly believe in the long-term growth trajectory of MLP cash flows and the overall asset class, investing in these vehicles is not without risks. Fundamental risks for MLPs include environmental incidents, terrorist attacks, regulatory changes, tax status changes, demand destruction from high commodity prices, proliferation of alternative energy sources, inadequate supply of external
capital to fund organic growth projects and acquisitions, and conflicts of interest with the general partner.
Tax Law Changes
There is a risk that there could be legislative changes to the 1986 Tax Act that would alter the MLP structure and eliminate the ability to pass through tax liabilities. There are several reasons that we view this as an unlikely event. Just as REITs became a tax-advantaged institutional product (very few would argue that the US needs tax incentives for real estate investment today) and it would prove disastrous to a substantial portion of equity holders’ portfolio value if tax laws changed, MLPs are similarly becoming institutionalized and it would be very difficult to push through such legislation. Also, a tax law change would not result in a windfall for Treasury revenues, as MLP investors pay taxes to the US government based on the income that the partnership produces. We would also view it as very difficult for Congress to knowingly increase the cost of capital to US energy infrastructure investment at a time when such investment is of crucial necessity to alleviate the commodity price pressures.
Regulatory Risk
Despite being one of the smallest risks from a probability perspective, the far-reaching effects of a change in regulation makes it one of our most closely followed concerns.
The majority of the assets in the sector are regulated by the FERC. This is a highly politicized organization, and it would be very difficult for this body to take action that would increase the cost of capital to investment in energy infrastructure. From the 1992 Energy Policy Act through March 2006, there have been only two substantive changes to the pipeline inflation indexing methodology, and these have both been positive for the pipeline owners. Previously, every July 1, pipeline tariffs had been increased by the change in PPI minus 1%; beginning in 2003 this became solely the change in PPI. On July 1, 2011, the new adjustment rate of the change in PPI + 2.65% was put into place for the next five years. This methodology allows a partnership’s unitholders to benefit from technology and efficiency gains and the associated cost cutting that improves returns, unlike a traditional utility, where returns from such improvements would likely be shared with customers in the next rate case.
Because of the positive effects of the current regulatory environment, we believe this is the single most significant
Master Limited Partnership Primer

19
risk to the sector’s ongoing long-term cash flow growth trajectory. That being said, we view the likelihood of such a change as inordinately small.
Demand-Side Throughput Risks
Since the oil crises of the 1970s, refined petroleum products and natural gas demand have risen at a predictable 1.5% average annual rate. Leveraging this modest “sales growth” with inflationary pricing power through a fixed-cost asset is all that an MLP needs to steadily increase its cash flows at mid-single-digit rates over time. Stagnation in energy demand could curtail a pipeline’s ability to increase its cash flows over time. There are several potential risks to energy demand continuing to grow at its forecasted rate over the next two decades, including customer conservation from rising commodity prices and emissions concerns, as well as demand reduction during a macroeconomic slowdown. Almost 70% of petroleum products are consumed by the transport sector, i.e. people commuting to work, and parents driving their children to school and to soccer practice. The demand for such uses is highly inelastic. Even for significantly longer trips (e.g. driving the family to Disney World), a doubling or tripling of current gasoline prices does not create competition between driving and taking the train or flying. However, at some marginal point, this could result in certain families not taking such vacations and a corresponding drop in consumption. Demographics are a very powerful force however, and the number of Americans living in the suburbs and commuting to the workplace continues to expand. As the population continues to expand southward and westward, this will put a substantial number of new drivers on the road. As a result of these demographic trends, we believe that a sustained period of minimum $150 per barrel oil would be needed to push demand sideways permanently, with new families and drivers and their necessary driving needs offsetting the losses of more superfluous driving habits.
Although hybrids are available for purchase today, and other alternative energy vehicles are currently being developed, there will be a substantial period of time before the cost of such vehicles allows them to be sold as an economical investment to the average consumer. Also, we would note that we fully expect certain pipelines that are currently in service for petroleum products or natural gas to be converted to hydrogen and other alternative energy sources. Just as decades ago many of today’s interstate and intrastate natural gas lines were previously in crude oil service, we expect both petroleum products and natural gas lines to be converted to other types of service over time, and believe
that competition from alternative fuels will not necessarily be detrimental to MLP cash flows.
Supply Asset-Specific Risks
Although concerns typically focus on the demand side of the throughput equation, without adequate product supplies there will be no pipeline shipments. The majority of refined product pipeline flows are highly diversified as supplies are aggregated from several refinery complexes. There are certain partnerships that are dependent on specific refineries for product flows, but generally speaking those refineries have access to a diverse group of domestic and international sources, whether they are by pipeline import from the Canadian oil sands or by tanker at the Louisiana Offshore Oil Port. The more diverse the refinery sources and the greater the variety of imported crude oils, the lower the supply side risk.
For natural gas and crude pipelines, the closer that the wellhead is to the transportation system, the greater the throughput risks. Typically, large interstate pipelines have such a diversity of supply sources across regions, e.g. onshore Texas, Louisiana, and the Gulf of Mexico, that there is high visibility to long-term supply availability. Gas-gathering systems and intrastate pipelines have significantly greater reservoir risk; if the geology of a particular field does not live up to expectations, volumes may suffer.
Macro Supply Disruptions
The US imports over half of its end-use consumption via crude oil and refined petroleum products. Because throughput is one of the primary determinants to MLP cash flows regardless of the demand situation, if there is not sufficient product to place in a pipeline, MLPs will be unable to collect their toll-road revenues for transportation. A substantial reduction in Middle Eastern oil supply, whether voluntarily or due to unforeseen circumstances such as a terrorist attack, would have the potential to harm cash flows for an extended period depending on the extent of the damage or length of voluntary production suspension.
Environmental Accidents
Nearly all MLPs carry comprehensive environmental insurance coverage with relatively low deductibles to cover any product spills that may occur. Because they specialize in optimizing midstream assets and understand the importance of proper maintenance capital expenditures to
Master Limited Partnership Primer

20
asset and resulting cash flow longevity, MLPs have strong safety and operating track records, and there have not been any material environmental accidents that have impacted the cash flow and distribution-paying ability of any partnership.
Terrorism
Material terrorist disruption of US midstream energy infrastructure would be difficult. We make the analogy of a terrorist threat to destroy a US highway: there are so many millions of miles of road, the probability of a threat is minimal and the likely impact to the overall transportation system is muted. Also, it is a relatively simple task to replace a pipeline segment that has been damaged by an explosion or otherwise. This can typically be accomplished in a period of days. If, for example, in the case of a natural gas pipeline explosion there were deaths involved, or in the case of a petroleum products line a natural disaster such as a flood was involved, the restart time may stretch to a full week, but would still have minimal cash flow impact to a company. Some MLPs carry terrorism insurance on certain key assets, but most MLPs do not carry any form of terrorism insurance, and we believe that this is a prudent course of action given repair costs and turnaround time relative to premiums.
We believe a more likely and detrimental terrorist threat would actually be on downstream infrastructure, such as a refinery complex that supplies a given pipeline. However, all MLPs carry business interruption insurance (typically effective after 30 days), and because the terrorist attack would not be on the MLP’s asset base, this disruption in product flows would be covered by business interruption insurance, just as disruption of product flows for a natural disaster such as a hurricane would be similarly covered.
Financial RisksAmong the financial risks are a sharp increase in interest rates (the yield-oriented nature of MLPs effectively creates “duration” risk), near-term correlations with fixed-income substitutes, energy equities, and/or commodities, and broader risks associated with investing in equities, particularly during sharp market sell-offs such as those seen in September 2001 or the second half of 2008.
Interest Rates
The current distribution yield for the sector is around 6.5%. In practical terms, this means that a 100 basis point shift to a 7.5% yield would result in an 13.0% price decline in the group, assuming yield spreads hold constant. We have seen several instances of interest rate increases (1994, 1999, and most recently, in April 2004) that have led to poor near-term asset class performance. April 2004 is the most striking example. The 10-year Treasury moved from 3.60% to 4.60% in approximately 20 trading days, sending all yield-sensitive equities, including REITs, utilities, and naturally, MLPs, down 14-18% in the same period.
Many investors tend to incorrectly ascribe MLPs’ spectacular outperformance over the last two decades to the interest rate environment. Although MLPs have benefited from a three-decade-long trend of declining interest rates, so have most other asset classes, from real estate to technology stocks. One cannot view MLPs in a vacuum. These gains are a function of MLPs’ ability to grow cash flows, not the current yield component of their returns.Because of the ability to grow their cash flow base, MLPs relatively outperform in a rising interest rate environment. However, just like other classes of yield-sensitive equities, the short-term price path can be impacted by rapidly rising or declining interest rates.
Master Limited Partnership Primer
Exhibit 10: MLP Yield and Spread to Treasurys
Source: FactSet. Past performance does not guarantee future results. Index performance is shown for illustrative purposes and does not predict or depict performance of the Oppenheimer SteelPath Funds. Indices are unmanaged and cannot be purchased directly by investors.
0%
2%
4%
6%
8%
10%
12%
14%
2000 2001 2002 2003 2004 2005 2006 2007 2008 2009 2010 2011
AMZ AMZ to 10 yr. 10 Yr.

21
Equity Volatility and Correlation
Despite the tendency of MLPs to trade with bonds during periods of drastic interest rate movements, the correlation between bond prices and MLP prices is very low over the long-term (around 0.04, see Exhibit 1). Broadly speaking, over longer periods of time, there is not a significant correlation with the broader equities market either. Over the past fifteen years, MLPs have exhibited a 0.35 price correlation with the S&P 500 Index, because their cash flows are not sensitive to the vicissitudes of the general economy and the news that moves the broader markets. What are MLPs correlated with on a short-term basis then?
The most indicative measure is the hopes and fears of the retail equity investor. The retail investor is likely to grasp passing themes in the marketplace and use these as the trigger to increase or decrease their marginal MLP exposure. For example, in August 2004, equities markets hit their bottom of the year and investors were concerned that growth had slowed and that the economy was rolling over. During that month, there was a 0.90 correlation between MLPs and the S&P 500. During the financial crisis, and more recently the eurozone crisis, MLPs became highly correlated
with oil and gas securities even though their cash flows generally have limited direct exposure to commodity prices. Since November 2004, we have periodically witnessed a higher correlation between MLPs and energy stocks. On a day-to-day basis, this funds flow activity has been driving MLP prices. Over the long-term, this day-to-day volatility will not affect the cash flows and long-term price path of MLP investments, but it can cause significant week-to-week and month-to-month volatility that will necessarily be incongruous with the group’s fundamentals.
Equity Crises
During times of severe equity stress (October 1987, September 2001, October 2008-March 2009), MLPs historically suffered similar shocks despite generating cash flows that are unlikely to be affected by the perceived stress that has been placed on the economy that caused the shock. Despite having solid distributions and yields that will be moving toward increasingly large spreads to Treasuries (that typically rally during periods of equity crisis) MLPs languish for periods of time following substantial fallout in the broader equities market.
Master Limited Partnership Primer

22
Appendix
A History of the Creation of MLPs
Limited partnerships (LPs), the closest predecessors to MLPs, rose to prominence following the passage of the Economic Tax Recovery Act of 1981, which established a very generous 15-year cost recovery period for all real estate assets. The new tax code provisions marked the beginning of a period of rapid growth in the number of real estate LPs designed as tax shelters. These partnerships purchased real estate properties on significant leverage and depreciated their properties using the newly established accelerated cost recovery system (ACRS), leading to substantial tax write-offs. Although these partnerships were marketed as conservative, capital-appreciating investment vehicles, their eventual fallout suggests that very few were run with long-term economic profitability as a motive.
High net worth individuals purchased interests in these private or non-publicly traded LPs to offset taxable income generated by other sources such as salaries, dividends, interest, and investment income. These limited partners were considered passive investors, because they were not involved in the day-to-day active management of the partnership and assumed no personal liability beyond their original investment.
During the same period, there were a number of E&P partnerships with rapidly depleting asset bases that were marketed to high net-worth individuals who did not realize both the commodity price dependence nor the depleting nature of the underlying resource. Many of these E&P companies went bankrupt as a result of a turn in commodity prices and the lack of a productive resource base. These early oil and gas partnerships left a bad taste in many investors’ mouths and prejudiced them against the structure for years to come, as they lumped any energy-focused partnership in the same group with these failed enterprises. Today’s MLP is very different from these failed commodity price-dependent, depleting reservoir partnerships of the early 1980s that hurt so many investors.
Five years later, President Ronald Reagan signed into law the Tax Reform Act of 1986 (TRA), which cracked down on the proliferation of real estate tax shelters and established the foundation for the modern MLP. The modified accelerated cost recovery system replaced the ACRS, and the cost
recovery period was extended to 27.5 years for residential real estate and 31.5 years for nonresidential property. TRA eliminated the preferential tax rate on capital gains and lowered overall marginal tax rates, reducing the value of the deductions taken through tax shelters.
TRA Section 465 extended the capital-at-risk limitations of the tax code to real estate tax shelters, preventing limited partners from increasing their cost basis for their share of the partnership’s debt unless they were personally liable for repayment. Since limited partners generally provided non-recourse financing and were only liable for their invested capital, they were no longer able to record tax losses and deductions on their personal tax returns that significantly exceeded their investment, as had been done for the past several years.
But what really led to the demise of the tax shelters was TRA Section 469, which prohibited passive investors from using partnership losses to offset taxable income from other sources, i.e. the very thing that the real estate tax shelters were created to do for their high net worth investors. The only partnerships that would survive under the new law were those with mature assets that actually generated passive income.
While TRA established the structural boundaries for LPs, the Revenue Act of 1987 created the business or operating boundaries, eliminating the special tax status for all except those engaged in natural resource activities. In addition, TRA specified that publicly traded partnerships engaged in the exploration, marketing, mining, processing, production, refining, storage, or transportation of any mineral or natural resource would not pay federal taxes in order to encourage investment in US energy infrastructure. General/Limited Partner Structure
MLPs have two classes of ownership – GPs and LPs. GPs manage the partnership’s operations, receive incentive distribution rights (IDRs), and generally maintain a 2% economic stake in the partnership. LPs are not involved in the operations of the partnership and have limited liability, much like the shareholder of a publicly traded corporation.
IDRs provide GPs with the necessary incentive to grow their MLPs’ distributions and consequently raise their own quarterly cash distributions. The partnership agreement entitles GPs to receive a higher percentage of incremental
Master Limited Partnership Primer

23
cash distributions when the distribution to LP unitholders reaches certain tiers. The last tier for most MLPs is the 50/50 splits, which means that the GP receives 50% of each incremental dollar paid out above that level. Consequently, the GP would receive a dollar for each dollar paid to LP unitholders above the distribution level specified as the 50/50 splits.
The table below depicts how the IDR structure affects distributions for a hypothetical MLP that is currently paying a $0.50 quarterly LP unit distribution, has 100 million LP units outstanding, and has distribution tiers at $0.0625, $0.1250, and $0.25 per LP unit.
Some GPs have chosen to modify their split structure, either by capping their highest split level at a level less than 50/50, or willingly foregoing a certain percentage of cash flow associated with a specific transaction. Doing so effectively lowers a partnership’s cost of capital, because the cash outflow to the GP represents a tax on the partnership. This “tax” makes it more difficult for the MLP to bid competitively on acquisitions or spend growth capital on organic projects that meet the partnership’s rising hurdle rate. These MLPs are consequently able to pay incrementally more, or bid more effectively, for a set of assets and reap the same amount of accretion, or are able to earn more from a set of assets by paying the same amount compared to being in the 50/50 splits.
As an MLP approaches the high splits their GP is faced with the decision of whether or not to cap their splits. Capping the splits can be considered long-term greedy, as it expands the pool of assets that the MLP can look to acquire in an accretive manner. Further, most GPs own a significant share of LP units, and over the long run, the cash flow not received from being in the 50/50 splits may be more than offset by continuous growth in the LP unit distributions. However, being “long-term greedy” requires a short-term sacrifice of significant cash flow, because partnerships that have reached the high splits are likely generating enormous amounts of cash for their GPs. Further, for publicly traded GPs, management has a fiduciary responsibility to the shareholders of the GP, who may not be willing to sacrifice the 50/50 splits, especially if they do not own LP units.
Several MLPs made the decision to buyout their GPs and/or IDRs in 2010, likely anticipating a more competitive acquisition market and taking steps to reduce their cost of capital. These buyouts are often near-term dilutive but should prove advantageous in the long-run. Running somewhat counter to this trend, we saw a private equity firm IPO a GP in early 2011, adding to a dwindling field of publicly traded GPs.
We believe that over time as the market place becomes more sophisticated, investors will demand that all initial public offerings be structured with modified, or more likely, no incentive distribution rights. We view this as unlikely to happen until more widespread mutual fund participation occurs, as these investment managers will demand to know why they are giving up such a significant portion of the future cash flows, and price IPOs accordingly.
Master Limited Partnership Primer
Exhibit 1A: How the IDR Structure Affects Distributions for a Hypothetical MLP
Source: Oppenheimer SteelPath
Declared Distribution Rate and Units Outstanding
Distribution per Unit 2.00$
# of Shares (in millions) 100
Distribution Rate for Each Distribution Tier
1st 0.25$
2nd 0.50$
3rd 1.00$
Tier % or 'Splits' (reflects allocation of cash distributed)
Initial 1st Tier 2nd Tier 3rd Tier
2% 15% 25% 50%
98% 85% 75% 50%
Per Unit Allocation by Tier
Initial ($0.25 - $0.00) 0.250$
1st ($0.50 - $0.25) 0.250$
2nd ($1.00 - $0.50) 0.500$
3rd ($2.00 - $1.00) 1.000$
Total LP Distribution Allocation by Tier
Initial ($0.25 x 100) 25.0$
1st ($0.25 x 100) 25.0
2nd ($0.50 x 100) 50.0
3rd ($1.00 x 100) 100.0
Total (in millions) 200.0$
Total GP and Incentive Distribution Allocation by Tier
Initial ($25.5 - $25.0) 0.5$
1st ($29.4 - $25.0) 4.4
2nd ($66.7 - $50.0) 16.7
3rd ($200.0 - $100.0) 100.0
Total (in millions) 121.6$
Total Distribution Allocation by Tier
Initial ($25.0 / 98%) 25.5$
1st ($25.0 / 85%) 29.4
2nd ($50.0 / 75%) 66.7
3rd ($100.0 / 50%) 200.0
Total (in millions) 321.6$
Allocation of Total Cash Distributed
in millions %
LP Unit Holders 200.00$ 62%
GP and Incentive Holder 121.59$ 38%
Total 321.59$ 100%

24
Income Tax Treatment
Given the stable cash generation of most MLP business models, these partnerships are able to return a majority of their excess cash flow back to unitholders. This return of capital has become the cornerstone of MLPs, as investors have come to expect stable cash flows and dependable yields. In addition to stable, cash-generating assets, MLPs do not pay corporate taxes and, consequently, are able to pass on a greater portion of earnings to their limited partner unitholders. Unlike the dividends paid by corporations, MLP distributions are considered 100% return of capital, and therefore are not taxable, and remain so until either: (1) the investor sells his units, or (2) his adjusted basis in the units reaches zero. Any capital appreciation will be taxed at the capital gains rate (assuming the units are held for more than one year), but the portion resulting from downward basis adjustments (e.g. depreciation) will be recaptured as ordinary income.
Instead of paying tax on the cash distributions received, the investor pays tax on his share of the partnership’s taxable income, which is a combination of revenue earned, operating costs, and various deductions such as depreciation that significantly reduce his tax burden. In the initial years of ownership, because of the 754 election that allows partnerships to adjust their inside basis for new partners, a partnership will typically generate close to zero taxable income for new investors. For several years, allocated taxable income will typically equal 10-20% of the cash distributions received. This income allocation cannot be used to offset passive losses from other investments, but other investment expenses can be deducted from it if the same MLP’s passive income and loss result in a net positive, called portfolio income. Net losses from an MLP are considered passive losses and cannot be deducted from taxable income, but can be carried forward into future tax years to reduce an investor’s share of taxable income from the same MLP. Any losses remaining after the sale by an investor of his MLP units can be used to offset other income in that tax year. When an investor files his taxes, he will receive a Schedule K-1 from the MLP, which will identify his share of the partnership’s income and losses. Distributions that exceed an investor’s outside basis will be taxed at the capital gains rate as return of capital. The investor’s allocated income will vary depending on the partnership’s operating earnings, deductions, and credits, and generally in practice he will continue to receive a modest “shield” relative to his distribution.
Every time that an MLP makes an acquisition or an investment, the investor is allocated additional depreciation on that investment, which creates a tax shield that will continue as long as the MLP continues to invest new money. The depreciation shield has two components, the underlying basis of the assets, and the depreciation of the investor’s basis in the stock, so typically the partner will continue to receive depreciation to the extent that the partnership has income.
US tax-exempt investors, including pension funds and IRAs, generally cannot own MLPs as they will generate UBTI for the investor. Foreign investors generally do not own MLPs because they are subject to FIRPTA (Foreign Investment in Real Property Tax Act), which requires them to file a US tax return and pay income taxes on capital gains of securities bought and sold on US securities exchanges (unlike for example, buying and selling Microsoft, which would only be taxed in the investor’s country of origin). Through corporate blocker structures (e.g. a C-Corporation taxable structure) and other more tax-efficient offshore vehicles, both U.S. tax exempts and foreign capital can enter the MLP market place.
Master Limited Partnership Primer

25
DisclaimersOn December 3, 2012, OppenheimerFunds, Inc. acquired the assets of SteelPath Capital Management, LLC and SteelPath Fund Advisors, LLC. As of that date, OppenheimerFunds Distributor, Inc. became the general distributor and principal underwriter for each series of The SteelPath MLP Funds Trust.1 The Alerian MLP Index is a composite of the 50 most prominent energy Master Limited Partnerships that provides investors with an unbiased, comprehensive benchmark for this emerging asset class. The index, which is calculated using a float-adjusted, capitalization-weighted methodology, is disseminated real-time on a price-return basis (NYSE: AMZ). It is not possible to invest directly in an index. Real Estate Investment Trusts (REITs) are publicly traded companies that own a pool of real estate properties. REITs receive special tax considerations and typically offer investors dividends and a liquid method of investing in real estate. Risks of investing in REITs include, but are not limited to: legal, political, liquidity, interest rate risks, a decline in the value of real estate, risks related to economic conditions, changes in the value of the underlying property owned by the trust and defaults by borrowers. Utilities provide fundamental needs for homes and businesses such as water, communication services, electricity and natural gas. Investors receive income in the form of dividends. The prices of the securities of Utilities Companies may fluctuate widely due to government regulation; the effect of interest rates on capital financing; competitive pressures due to deregulation in the utilities industry; supply and demand for services; increased sensitivity to the cost of natural resources required for energy production; and environmental factors such as conservation of natural resources or pollution control. 2 Correlation-statistical measure of how two securities move in relation to each other.3 Sharpe ratio-used to measure risk-adjusted performance. The Sharpe ratio is calculated by subtracting the risk-free rate from the rate of return for a portfolio and dividing the result by the standard deviation of the portfolio returns.4 Standard deviation-measure of the dispersion of a set of data from its mean.5 Beta of a stock or portfolio is a number describing the relation of its returns with those of the financial market as a whole.6 Price-Earnings Ratio-a valuation ratio of a company’s current share price compared to its per-share earnings.7 Internal Rate of Return (IRR) -a rate of return used in capital budgeting to measure and compare the profitability of investments.8 Basis Point-a unit that is equal to 1/100th of 1%, and is used to denote the change in a financial instrument.9 Enterprise Value/EBITDA-valuation multiple used in finance and investment to measure the value of a company.10 Price/Distributable Cash Flow-measure of cash available to distribute to unitholders or fund growth.The S&P 500 Index is an unmanaged capitalization-weighted index (weighted by the market value of the companies) of 500 stocks listed on various exchanges.The Russell 2000 Index measures the performance of the small-cap segment of the U.S. equity universe.The NASDAQ-100 Index includes 100 of the largest domestic and international non-financial securities listed on The Nasdaq Stock Market based on market capitalization.The Dow Jones Industrial Average is an average-weighted index of the top 30 industrial stocks in the US.MLP performance is not indicative of Fund performance. Past performance is no guarantee of future results.Investors should not construe the performance of any past investment or past returns as providing any assurances regarding the future performance of the energy MLP sector.This report was prepared by SteelPath and is under protection of the copyright laws. Neither the whole nor any part of this material may be duplicated in any form or by any means. This material may not be redistributed or disclosed to anyone without the prior written consent of OppenheimerFunds, Inc.Stated figures are third party reported statistics for certain indices and are not directly related to the Fund. It is not possible to invest directly in an index. MLPs yields are represented by the published yield of the Alerian MLP Index, REIT yields by the published yield of the Dow Jones U.S. Real Estate Index, Utility yields by the published yield of the Utilities Select Sector of the S&P 500 Index, Municipal Bonds by the published yield-to-worst of the Barclays Municipal Bonds Index, and Fixed
Master Limited Partnership Primer

26
Income yields by the Barclays Aggregate Bond Index. Yield is no assurance the MLPs will deliver a higher total return than REITS, Utilities, or Municipal Bonds.Companies mentioned in this report were not held in any of the Oppenheimer SteelPath Funds as of 12/30/2011.Risks of Investing: Investing in MLPs involves additional risks as compared to the risks of investing in common stock, including risks related to cash flow, dilution and voting rights. Each Fund’s investments are concentrated in the energy infrastructure industry with an emphasis on securities issued by MLPs, which may increase price fluctuation. Energy infrastructure companies are subject to risks specific to the industry such as fluctuations in commodity prices, reduced volumes of natural gas or other energy commodities, environmental hazards, changes in the macroeconomic or the regulatory environment or extreme weather. MLPs may trade less frequently than larger companies due to their smaller capitalizations which may result in erratic price movement or difficulty in buying or selling. MLPs are subject to significant regulation and may be adversely affected by changes in the regulatory environment including the risk that an MLP could lose its tax status as a partnership.Some Oppenheimer SteelPath Funds will be subject to certain MLP tax risks and risks associated with accounting for its deferred tax liability which could materially reduce the net asset value. Some Oppenheimer SteelPath Funds are organized as a Subchapter “C” Corporation which means that they will pay federal, state and local income taxes at a corporate rate (currently as high as 35%) based on their taxable income. The potential benefit of investing in MLPs generally is the treatment of them as partnerships for federal income purposes. The Fund’s invests in MLPs, however, since the Funds are corporations, they will be taxed at the Fund level which in turn will reduce the amount of cash available for distribution which would result in the reduction of the Funds’ net asset value.To the extent that a Fund obtains leverage through borrowings, there will be the potential for greater gains and the risk of magnified losses. Investing in debt securities involves additional risks including interest rate risk, credit risk and duration risk. High yield securities involve more risks than investment grade securities and tend to be more sensitive to economic conditions. Private equity investments may be subject to greater risks than investments in publicly traded companies due to limited public information and lack of regulatory oversight.You should consider the Funds’ investment objectives, risks, charges and expenses carefully before investing. For a prospectus, or summary prospectus, that contains this and other information about the Funds, call 800-255-2770 or visit the Fund’s website at www.steelpath.com. If you are a direct investor and would like to speak with a representative about your account, please call 888-614-6614. Please read the prospectus, or summary prospectus, carefully before investing.Shares of Oppenheimer funds are not deposits or obligations of any bank, are not guaranteed by any bank, are not insured by the FDIC or any other agency, and involve investment risks, including the possible loss of the principal amount invested.Oppenheimer SteelPath funds are distributed by OppenheimerFunds Distributor, Inc.OSP0000.003.1112
Master Limited Partnership Primer www.steelpath.com