us midstream and mlps
TRANSCRIPT

US Midstream and MLPs Raising Commodity Price Forecast
Master Limited Partnerships | Increase Target Price
Lifting NGL Price Forecast: We lift our ’21 NGL price forecast to $0.94/gal from
$0.84/gal to reflect the higher than expected 3Q21 M2M, higher natural gas prices, and
the tight NGL supply/demand balance entering the winter season. Absent more aggressive
drilling plans from producers, we believe NGL inventories are at risk of further depletion.
Accordingly, we increase our ’22 and ’23 NGL price forecast 15% and 11% to $0.99/gal
and $0.88/gal. We lifted our ’22 and ’23 ethane price by 26% and 7% to reflect the
higher natural gas price environment supporting elevated ethane prices. Our ’22 and ’23
propane prices increase 8% and 3% to $1.15/gal and $1.03/gal due to risk of stock
depletion as we enter the winter heating season. Notably, weekly US propane inventories
are trending roughly 27 mmbbls (-27%) below average early October levels the past two
years.
Lifting Natural Gas Price Forecast: On October 4th, the CS US E&P team lifted its
4Q21 Henry Hub natural gas price forecasts to $5.75/mmbtu (from $3.50/mmbtu) on
tight supply/demand balances due to below average storage levels entering the withdrawal
season, global pricing incentivizing LNG exports, limits to gas-to-coal fuel switching, and
muted domestic supply growth. ’22 and ’23 price forecasts also increased to $4.00 and
$3.25/mmbtu from $3.00 and $2.75/mmbtu respectively due to recent strength in the
futures curve and an undersupplied US gas market in ’22 and ’23 (Please refer to the US
E&Ps note for more detail).
Target Price Changes: We are raising our target prices for eight stocks: LNG, CQP,
DCP, MPLX, NFE, OKE, TRGP, and WMB.
13 October 2021
Equity Research
Americas | United States
DISCLOSURE APPENDIX AT THE BACK OF THIS REPORT CONTAINS IMPORTANT DISCLOSURES, ANALYST CERTIFICATIONS,
LEGAL ENTITY DISCLOSURE AND THE STATUS OF NON-US ANALYSTS. US Disclosure: Credit Suisse does and seeks to do business with companies covered in its research reports. As a result, investors should be aware that the Firm may have a conflict of interest that could
affect the objectivity of this report. Investors should consider this report as only a single factor in making their investment decision.
Research Analysts
Spiro Dounis
212 325 3463
Douglas Irwin
212 325 6850
Charles Bryant
212 325 4938

13 October 2021
US Midstream and MLPs 2
Click here to enter text.
Altus Midstream Company Maintain Underperform and $45 TP
ALTM
Target price (12M, US$) 45.00
Underperform[V]
Master Limited Partnerships
Maintain Underperform and $45 TP: We maintain Underperform. Our $45 TP is based
on our dividend discount methodology. Our DDM imputes a 12% discount rate on
dividends.
Adjusting Estimates: We raise ‘21e EBITDA <1% to reflect higher G&P volumes.
Our ’22e and ’23e EBITDA increases slightly to reflect the flow-through impacts of higher
G&P volumes.
Risks: Upside risks include greater Alpine High production activity by APA, more
constructive preferred redemption and higher earnings from JV pipelines.
Price (12 Oct 21, US$) 84.20
52-week price range 84.20 - 9.55
Enterprise value (US$ m) 2,646
Adjusted EV -
[V] = Stock Considered Volatile (see Disclosure Appendix)
Research Analysts
Spiro Dounis
212 325 3463
Douglas Irwin
212 325 6850
Charles Bryant
212 325 4938
Financial and valuation metrics
Year 12/20A 12/21E 12/22E 12/23E Adjusted EBITDA (US$ m) 191 269 256 251 Prev Adjusted EBITDA (US$ m) - 267 255 250 Distribution/Unit (US$ m) 0.00 6.00 6.00 6.00 Distribution Coverage (x) 0.00 2.06 2.23 2.19 Earnings/Unit - EPU (US$) 2.57 2.04 7.87 7.65 EV / Adj. EBITDA (x) 35.03 10.89 10.65 10.45 Price/DCF to LPs (x) 6.33 6.55 6.06 6.17
DPU (US$) 6.00 Distribution Yield (%) 7.41 Units Outstanding (m) 16 GP Take (%) - Net Debt Current (US$ m) 558 Net Debt/EBITDA (x) 5.33
Source: Company data, Refinitiv, Credit Suisse estimates
Share price performance
On 12-Oct-2021 the S&P 500 INDEX closed at 4361.19Daily Oct12, 2020 - Oct12, 2021, 10/12/20 = US$10.31
Adj. EBITDA Q1 Q2 Q3 Q4 2020A 47 44 53 48 2021E 65 69 68 66 2022E 63 64 65 64

13 October 2021
US Midstream and MLPs 3
Altus Midstream Company (ALTM) Analyst: Spiro Dounis Price (12 Oct 2021): US$84.2 Target Price: 45.00 Rating: Underperform [V] Distributable Cash Flow (DCF) 12/20A 12/21E 12/22E 12/23E
Adjusted EBITDA 191 269 256 251 Prev. Adj. EBITDA - 267 255 250 (-) Maintenance Capex - - - - (-) Cash Interest Expense 10 13 20 18 (+/-) Other Adjustments - - - - (-) General Partner Take - - - - (-) Preferred Dividends 46 37 0 0 Adj. DCF Available to LPs 122 201 217 213
DCF Per LP Unit / Common Share 7.50 12.36 13.36 13.13 Distribution Per Unit / Share .00 6.00 6.00 6.00 Distribution Coverage (x) .00 2.06 2.23 2.19
Adj. EBITDA Q1 Q2 Q3 Q4 2020A 47 44 53 48 2021E 65 69 68 66 2022E 63 64 65 64
Key Valuation Metrics 12/20A 12/21E 12/22E 12/23E
Dividend / Distribution Yield (%) 0.00 7.41 7.41 7.41 Dividend / Distribution Growth (%, YoY) 0.00 0.00 0.00 0.00 DCF Yield (%) 15.80 15.27 16.51 16.22 EV / EBITDA (x) 35.03 10.89 10.65 10.45
Leverage Ratios 12/20A 12/21E 12/22E 12/23E
Net Debt / EBITDA (x) 7.48 5.33 5.10 4.76 Net Debt / Total Capital (%) 39.03 78.00 73.07 68.07
Income Statement 12/20A 12/21E 12/22E 12/23E
Revenue (US$ m) 148 136 113 99
CoGS and OpEx 38 29 27 23 SGA 13 14 15 14 (+) Other EBITDA - - - - DD&A 16 16 15 15 Other 17 10 25 25 Operating Income 64 67 29 21
Interest 2 13 20 18 Equity Income (Loss) 59 121 157 161 Other Income (Loss) 0 0 0 0 Earnings Before Tax 120 174 167 164
Taxes (1) 0 0 0 Net Income to LPs / Company 42 35 138 136
Earning Per Share / Unit 2.57 2.04 7.87 7.65 Avg. Diluted Shares / Units Outstanding 16 17 18 18
Cash Flow 12/20A 12/21E 12/22E 12/23E
Net Income 80 188 167 164 DD&A 16 16 15 15 Others 84 34 50 49 Cash Flow from Operations 164 221 217 213
Acquisitions 10 2 0 0 Total Capex (340) (17) (8) (8) Expansion Capex - - - - Maintenance Capex - - - - Others (9) 0 0 0 Cash Flow from Investments (338) (15) (8) (8)
Equity Issuance (Repurchase) 0 0 0 0 Debt Issued 228 760 (195) (110) Dividends / Distributions Paid (23) (145) (97) (97) Others (13) (739) 0 0 Cash Flow from Financing 192 (124) (292) (207)
Balance Sheet (US$) 12/20A 12/21E 12/22E 12/23E
Cash & Cash Equivalents 24 106 23 21 Other Current Assets 19 23 23 23 Net PPE 196 187 179 172 Other Long-Term Assets 1,561 1,544 1,509 1,474 Total Assets 1,800 1,860 1,734 1,691
Short-Term Debt 0 0 0 0 Other Short Term Liabilities 30 25 25 25 Long-Term Debt 624 1,384 1,189 1,079 Other Long-Term Liabilities 209 90 90 90 Total Liabilities 863 1,499 1,304 1,194
GP Equity - - - - LP Equity - - - - Non-Controlling Interests & Other - - - - Total Liabilities and Equity 1,800 1,860 1,734 1,691
Company Background
Altus Midstream is a pure-play, Permian midstream C-corp, anchored by
Apache Corporation’s gathering, processing and transportation assets at
Alpine High. Altus also owns options in five gas, NGL, and crude oil
pipeline projects from the Permian Basin.
Blue/Grey Sky Scenario
Our Blue Sky Scenario (US$) (from 50.00) 85.00
Our blue sky scenario of $85 is based on a 5% dividend growth per
annum at a 9% discount rate - 3% lower than base assumptions.
Our Grey Sky Scenario (US$) 32.00
Our grey sky scenario of $32 is based on additional equity issuance in the
future driving declining dividends and discounted back at 15% - 3%
higher than base assumptions.
Share price performance
On 12-Oct-2021 the S&P 500 INDEX closed at 4361.19
Daily Oct12, 2020 - Oct12, 2021, 10/12/20 = US$10.31
Source: FTI, Company data, Refinitiv, Credit Suisse Securities (EUROPE) LTD. Estimates

13 October 2021
US Midstream and MLPs 4
Cheniere Energy Reiterate Outperform; Increase TP to $116
LNG
Target price (12M, US$) 116.00
Outperform
Master Limited Partnerships
Lifting Estimates on Commodity Tailwinds: We increase our ‘21e EBITDA by ~3%,
driven by macro tailwinds which have resulted in record high LNG prices (JKM and NBP
each breaking >$30/mmbtu in recent months). With LNG margins up ~$7/mmbtu QoQ,
we estimate a ~$140mm 2H21 tailwind to LNG (assuming 20Tbtu of open capacity). We
now expect 2021 EBITDA to come in above Cheniere’s $4.6-$4.9bln guidance range
(most recent guidance points to the high end of the range). Looking to next year, we see
substantial upside into ‘22 with strong LNG margins likely to persist and an estimated
>100TBtu of potential open capacity as SPL T6 comes online. Accordingly, we increase
our ‘22e EBITDA ~5%.
Now Incorporating Stage 3 Into Our Model: We now assume that CCL Stage 3
reaches FID in 2022. We estimate a completion date ~5 years after FID, in-line with
Cheniere guidance, but likely a conservative timeline, in our view. We assume ~$6bln of
capex (50% debt financed) through 2026 and ~$1bln of Stage 3 EBITDA with a 1Q27
ISD, bringing our ‘27e EBITDA to ~$6.9bln, the high end of Cheniere’s run-rate guidance.
Reiterate Outperform; Increase TP to $116 (from $105): We reiterate Outperform and
increase our target price to $116 (from $105). Macro tailwinds and LNG pricing strength
primarily drive the increase; Stage 3 moving forward also contributes. An NPV analysis
drives our $116 TP and implies a 10.65x multiple on our FY22e EBITDA. The current
share price implies an ~11% DCF yield on a 9-train run rate in 2024.
Risks: Downside risks include lower global LNG prices, execution risk and higher US
natural gas pricing.
Previous target price (12M, US$) 105.00
Price (11 Oct 21, US$) 101.63
52-week price range 102.30 - 47.05
Enterprise value (US$ m) 53,298
Adjusted EV -
Research Analysts
Spiro Dounis
212 325 3463
Douglas Irwin
212 325 6850
Charles Bryant
212 325 4938
Financial and valuation metrics
Year 12/20A 12/21E 12/22E 12/23E Adjusted EBITDA (US$ m) 3,961 5,000 5,450 5,500 Prev Adjusted EBITDA (US$ m) - 4,850 5,168 5,410 Distribution/Unit (US$ m) 0.00 0.66 1.34 1.41 Distribution Coverage (x) 0.00 13.19 7.14 7.04 Earnings/Unit - EPU (US$) 3.04 6.81 8.40 9.05 EV / Adj. EBITDA (x) 11.83 11.15 9.91 9.61 Price/DCF to LPs (x) 11.82 11.52 10.16 9.84
DPU (US$) 1.32 Distribution Yield (%) 0.66 Units Outstanding (m) 254 GP Take (%) - Net Debt Current (US$ m) 27,875 Net Debt/EBITDA (x) 5.58
Source: Company data, Refinitiv, Credit Suisse estimates
Share price performance
On 11-Oct-2021 the S&P 500 INDEX closed at 4361.19Daily Oct12, 2020 - Oct11, 2021, 10/12/20 = US$49.03
Adj. EBITDA Q1 Q2 Q3 Q4 2020A 1,039 1,393 477 1,052 2021E 1,452 1,023 1,123 1,402 2022E 1,116 1,493 1,455 1,386

13 October 2021
US Midstream and MLPs 5
Cheniere Energy (LNG) Analyst: Spiro Dounis Price (11 Oct 2021): US$101.63 Target Price: (from 105.00) 116.00 Rating: Outperform Distributable Cash Flow (DCF) 12/20A 12/21E 12/22E 12/23E
Adjusted EBITDA 3,961 5,000 5,450 5,500 Prev. Adj. EBITDA - 4,850 5,168 5,410 (-) Maintenance Capex 0 0 0 0 (-) Cash Interest Expense (570) (677) (801) (942) (+/-) Other Adjustments (3,189) (3,473) (3,833) (3,976) (-) General Partner Take - - - - (-) Preferred Dividends - - - - Adj. DCF Available to LPs 1,342 2,205 2,417 2,467
DCF Per LP Unit / Common Share 5.08 8.65 9.61 9.93 Distribution Per Unit / Share .00 .66 1.34 1.41 Distribution Coverage (x) .00 13.19 7.14 7.04
Adj. EBITDA Q1 Q2 Q3 Q4 2020A 1,039 1,393 477 1,052 2021E 1,452 1,023 1,123 1,402 2022E 1,116 1,493 1,455 1,386
Key Valuation Metrics 12/20A 12/21E 12/22E 12/23E
Dividend / Distribution Yield (%) 0.00 0.66 1.38 1.44 Dividend / Distribution Growth (%, YoY) DCF Yield (%) 0.00 0.66 1.38 1.44 EV / EBITDA (x) 11.83 11.15 9.91 9.61
Leverage Ratios 12/20A 12/21E 12/22E 12/23E
Net Debt / EBITDA (x) 7.21 5.58 4.87 4.68 Net Debt / Total Capital (%) 92.94 89.93 85.20 80.94
Income Statement 12/20A 12/21E 12/22E 12/23E
Revenue (US$ m) 9,358 9,656 7,389 7,499
CoGS and OpEx 3,946 2,829 0 0 SGA 302 328 345 360 (+) Other EBITDA - - - - DD&A 932 979 971 989 Other 1,257 1,621 1,709 1,756 Operating Income 2,921 3,899 4,363 4,395
Interest 1,525 1,457 1,456 1,422 Equity Income (Loss) - - - - Other Income (Loss) 0 0 0 0 Earnings Before Tax 1,396 2,442 2,908 2,973
Taxes 43 58 145 149 Net Income to LPs / Company 767 1,726 2,112 2,249
Earning Per Share / Unit 3.04 6.81 8.40 9.05 Avg. Diluted Shares / Units Outstanding 252 253 252 248
Cash Flow 12/20A 12/21E 12/22E 12/23E
Net Income 501 1,624 2,762 2,824 DD&A 932 979 971 989 Others (499) (340) 0 0 Cash Flow from Operations 1,265 3,042 3,733 3,813
Acquisitions 0 68 0 0 Total Capex (1,839) (1,130) (1,060) (1,840) Expansion Capex (1,839) (1,130) (1,060) (1,840) Maintenance Capex 0 0 0 0 Others (108) (11) 0 0 Cash Flow from Investments (1,947) (1,073) (1,060) (1,840)
Equity Issuance (Repurchase) (155) (50) (300) (300) Debt Issued 883 (374) (560) (560) Dividends / Distributions Paid 0 (84) (337) (346) Others (963) (742) (666) (708) Cash Flow from Financing (235) (1,249) (1,863) (1,914)
Balance Sheet (US$) 12/20A 12/21E 12/22E 12/23E
Cash & Cash Equivalents 1,628 2,797 3,607 3,665 Other Current Assets 1,092 1,435 1,435 1,435 Net PPE 30,421 30,493 30,582 31,433 Other Long-Term Assets 2,107 2,799 2,799 2,799 Total Assets 35,697 37,523 38,422 39,332
Short-Term Debt 372 949 949 949 Other Short Term Liabilities 1,824 2,577 2,577 2,577 Long-Term Debt 30,471 29,372 28,812 28,252 Other Long-Term Liabilities 812 1,542 1,542 1,542 Total Liabilities 33,479 34,440 33,880 33,320
GP Equity - - - - LP Equity - - - - Non-Controlling Interests & Other 2,409 2,421 2,405 2,272 Total Liabilities and Equity 35,697 37,523 38,422 39,332
Company Background
Cheniere is a general partner holding company, primarily engaged in
LNG-related businesses, that owns 100% of the general partner interest
in Chenier Partners and a majority stake in Cheniere Holdings.
Blue/Grey Sky Scenario
Our Blue Sky Scenario (US$) (from 115.00) 127.00
Our Blue Sky scenario of $127 assumes 10% higher margins on CMI,
which would be driven by better global LNG spot pricing and/or better
short/medium-term contract rates, as well as 10% better margins on
sourcing, which would reflect better natural gas differentials capture. We
also assume a 0.25x improvement in its EV/EBITDA multiple to reflect for
the better macro environment.
Our Grey Sky Scenario (US$) (from 72.00) 81.00
Our Grey Sky scenario of $81 assumes 25% lower margins on CMI,
which would be driven by lower global LNG spot pricing and/or weaker
short/medium-term contract rates, as well as 25% worse margins on
sourcing, which would reflect more difficult natural gas differentials
capture. We also assume a 1.0x degradation in its EV/EBITDA multiple
to reflect for the tougher macro environment.
Share price performance
On 11-Oct-2021 the S&P 500 INDEX closed at 4361.19
Daily Oct12, 2020 - Oct11, 2021, 10/12/20 = US$49.03
Source: FTI, Company data, Refinitiv, Credit Suisse Securities (EUROPE) LTD. Estimates

13 October 2021
US Midstream and MLPs 6
Cheniere Energy Partners LP Maintain Underperform; Increase TP to $39
CQP
Target price (12M, US$) 39.00
Underperform
Master Limited Partnerships
Lifting Estimates on Commodity Tailwinds and T6 Timing: We increase our ‘21e and
22e EBITDA by ~1% and ~5%, respectively. Increased commodity prices and an ahead of
schedule SPL Train 6 ISD are the main drivers of our increased estimates. With LNG
margins up ~$7/mmbtu QoQ, we expect CQP to benefit from strong marketing margin.
That said, the bigger driver for CQP EBITDA growth is an earlier than initially anticipated in-
service date for Sabine Pass Train 6.
Maintain Underperform; Increase TP to $39: We maintain our Underperform rating and
increase our target price to $39 (from $35) on increased EBITDA estimates. Our valuation
is based on NPV analysis and implies a 12.20x multiple on our FY22 EBITDA estimate.
Risks: Upside risks to our CQP Underperform rating include a premium takeout by LNG.
Previous target price (12M, US$) 35.00
Price (11 Oct 21, US$) 42.33
52-week price range 45.50 - 33.04
Enterprise value (US$ m) 39,694
Adjusted EV -
Research Analysts
Spiro Dounis
212 325 3463
Douglas Irwin
212 325 6850
Charles Bryant
212 325 4938
Financial and valuation metrics
Year 12/20A 12/21E 12/22E 12/23E Adjusted EBITDA (US$ m) 2,762 2,894 3,090 3,115 Prev Adjusted EBITDA (US$ m) - 2,863 2,929 3,034 Distribution/Unit (US$ m) 2.59 2.67 2.75 2.98 Distribution Coverage (x) 1.38 1.46 1.54 1.38 Earnings/Unit - EPU (US$) 2.14 2.44 2.85 2.99 EV / Adj. EBITDA (x) 12.73 13.06 12.31 12.48 Price/DCF to LPs (x) 10.14 10.30 9.76 11.21
DPU (US$) 2.68 Distribution Yield (%) 6.64 Units Outstanding (m) 484 GP Take (%) 11.01 Net Debt Current (US$ m) 16,568 Net Debt/EBITDA (x) 5.67
Source: Company data, Refinitiv, Credit Suisse estimates
Share price performance
On 11-Oct-2021 the S&P 500 INDEX closed at 4361.19Daily Oct12, 2020 - Oct11, 2021, 10/12/20 = US$35.5
Adj. EBITDA Q1 Q2 Q3 Q4 2020A 792 846 352 772 2021E 779 690 711 714 2022E 688 795 795 811

13 October 2021
US Midstream and MLPs 7
Cheniere Energy Partners LP (CQP) Analyst: Spiro Dounis Price (11 Oct 2021): US$42.33 Target Price: (from 35.00) 39.00 Rating: Underperform Distributable Cash Flow (DCF) 12/20A 12/21E 12/22E 12/23E
Adjusted EBITDA 2,762 2,894 3,090 3,115 Prev. Adj. EBITDA - 2,863 2,929 3,034 (-) Maintenance Capex 0 0 0 0 (-) Cash Interest Expense (909) (844) (837) (812) (+/-) Other Adjustments 0 0 0 0 (-) General Partner Take 121 160 199 310 (-) Preferred Dividends - - - - Adj. DCF Available to LPs 1,732 1,890 2,055 1,994
DCF Per LP Unit / Common Share 3.58 3.90 4.24 4.12 Distribution Per Unit / Share 2.59 2.67 2.75 2.98 Distribution Coverage (x) 1.38 1.46 1.54 1.38
Adj. EBITDA Q1 Q2 Q3 Q4 2020A 792 846 352 772 2021E 779 690 711 714 2022E 688 795 795 811
Key Valuation Metrics 12/20A 12/21E 12/22E 12/23E
Dividend / Distribution Yield (%) 7.14 6.64 6.64 6.45 Dividend / Distribution Growth (%, YoY) DCF Yield (%) 9.86 9.78 10.63 10.32 EV / EBITDA (x) 12.73 13.06 12.31 12.48
Leverage Ratios 12/20A 12/21E 12/22E 12/23E
Net Debt / EBITDA (x) 5.81 5.67 5.27 5.04 Net Debt / Total Capital (%) 96.81 96.75 95.75 95.29
Income Statement 12/20A 12/21E 12/22E 12/23E
Revenue (US$ m) 6,167 5,755 3,989 4,052
CoGS and OpEx 2,537 1,927 0 0 SGA 110 84 63 57 (+) Other EBITDA - - - - DD&A 551 557 563 549 Other 759 851 836 879 Operating Income 2,210 2,337 2,527 2,566
Interest 909 844 837 812 Equity Income (Loss) - - - - Other Income (Loss) 7 0 0 0 Earnings Before Tax 1,308 1,492 1,690 1,755
Taxes 0 0 0 0 Net Income to LPs / Company 998 1,182 1,380 1,445
Earning Per Share / Unit 2.14 2.44 2.85 2.99 Avg. Diluted Shares / Units Outstanding 467 484 484 484
Cash Flow 12/20A 12/21E 12/22E 12/23E
Net Income 1,183 1,468 1,690 1,755 DD&A 551 557 563 549 Others 17 56 0 0 Cash Flow from Operations 1,751 2,082 2,253 2,304
Acquisitions 0 0 0 0 Total Capex (972) (906) (140) (120) Expansion Capex (972) (906) (140) (120) Maintenance Capex 0 0 0 0 Others 0 0 0 0 Cash Flow from Investments (972) (906) (140) (120)
Equity Issuance (Repurchase) 0 0 0 0 Debt Issued (5) 12 24 (576) Dividends / Distributions Paid (1,359) (1,436) (1,510) (1,675) Others (70) (64) (24) (24) Cash Flow from Financing (1,434) (1,488) (1,510) (2,275)
Balance Sheet (US$) 12/20A 12/21E 12/22E 12/23E
Cash & Cash Equivalents 1,210 930 1,533 1,442 Other Current Assets 828 741 741 741 Net PPE 16,723 17,099 16,675 16,246 Other Long-Term Assets 287 289 289 289 Total Assets 19,145 19,123 19,303 18,783
Short-Term Debt 0 654 654 654 Other Short Term Liabilities 883 852 852 852 Long-Term Debt 17,580 16,947 16,971 16,395 Other Long-Term Liabilities 143 111 111 111 Total Liabilities 18,606 18,564 18,588 18,012
GP Equity - - - - LP Equity - - - - Non-Controlling Interests & Other 0 0 0 0 Total Liabilities and Equity 19,145 19,123 19,303 18,783
Company Background
Cheniere Energy Partners is anMLP which owns and operates the Sabine
Pass LNG terminal through its wholly owned subsidiary, SPLNG.
Blue/Grey Sky Scenario
Our Blue Sky Scenario (US$) (from 45.00) 50.00
Our Blue Sky of $50 scenario assumes 20% higher margin to SPL from
CMI, which would be driven by better pricing at CMI (when netbacks are
below $3/mmbtu) or higher volumes at CMI / outperformance on SPL
utilization above SPA volumes, as well as 20% better margins on
sourcing, which would reflect better natural gas differentials capture. We
also assume a 1.25x improvement in its EV/EBITDA multiple to reflect for
the better macro environment.
Our Grey Sky Scenario (US$) (from 28.00) 32.00
Our Grey Sky scenario of $32 assumes 50% lower margins to SPL from
CMI, which would be driven by weaker pricing at CMI or lower excess
production at SPL beyond SPA volumes, as well as 50% worse margins
on sourcing, which would reflect worse natural gas differentials capture.
We also assume a 0.2x degradation in its EV/EBITDA.
Share price performance
On 11-Oct-2021 the S&P 500 INDEX closed at 4361.19
Daily Oct12, 2020 - Oct11, 2021, 10/12/20 = US$35.5
Source: FTI, Company data, Refinitiv, Credit Suisse Securities (EUROPE) LTD. Estimates

13 October 2021
US Midstream and MLPs 8
DCP Midstream LP Maintain Neutral; Increase TP to $34
DCP
Target price (12M, US$) 34.00
Neutral[V]
Master Limited Partnerships
Commodity Strength Drives Higher Estimates: We increase our ‘21e and ‘22e
EBITDA by ~3%/4% to reflect a stronger than expected commodity environment. As a
result, we continue to view the high-end of DCP’s $1.12-$1.26bln ‘21 EBITDA guidance
as very achievable. Based on guided sensitivities, we estimate an >$60mm 2H21 tailwind,
which would likely push EBITDA above the high-end of the range on commodity strength
alone. We also see continued upside on elevated producer activity.
Capital Return Options Materializing: We expect DCP to move below 4.0x leverage in
3Q21 and below the long-term 3.5x target by 3Q22. We view leverage as the primary
hurdle to establish a capital return framework that should result in more capital being
returned to equity holders. With an improved line of sight toward this goal in the current
commodity environment, we wouldn’t be surprised if management begins to outline a
possible framework with 4Q earnings in February, which is when DCP typically provides
full-year guidance. As far as what this framework could look like, we estimate ~$350mm
of 2H22 FCF (post-distribution) that could be allocated toward further debt reduction,
buybacks, or increased distributions once leverage targets are reached.
Maintain Neutral; Increase TP to $34: We increase our TP to $34 (from $30) to reflect
increased EBITDA estimates in an improved commodity environment. Our TP is NPV-
derived, implying a multiple of 8.5x on ‘22 EBITDA. We maintain our Neutral rating.
Catalysts & Risks: Sustained NGL price strength is the main catalyst given DCP’s
commodity exposure and capacity to recover additional ethane volumes across the NGL
footprint. Downside risks include weaker commodity pricing and a slower than expected
uptick in producer activity.
Previous target price (12M, US$) 30.00
Price (11 Oct 21, US$) 30.83
52-week price range 31.69 - 12.10
Enterprise value (US$ m) 11,845
Adjusted EV -
[V] = Stock Considered Volatile (see Disclosure Appendix)
Research Analysts
Spiro Dounis
212 325 3463
Douglas Irwin
212 325 6850
Charles Bryant
212 325 4938
Financial and valuation metrics
Year 12/20A 12/21E 12/22E 12/23E Adjusted EBITDA (US$ m) 1,252 1,349 1,464 1,427 Prev Adjusted EBITDA (US$ m) - 1,310 1,410 1,398 Distribution/Unit (US$ m) 1.56 1.56 1.56 1.56 Distribution Coverage (x) 2.62 2.84 3.27 3.28 Earnings/Unit - EPU (US$) 1.88 2.46 3.22 3.13 EV / Adj. EBITDA (x) 8.17 9.36 8.16 7.89 Price/DCF to LPs (x) 4.55 6.95 6.02 6.01
DPU (US$) 1.56 Distribution Yield (%) 5.07 Units Outstanding (m) 208 GP Take (%) 0.00 Net Debt Current (US$ m) 5,590 Net Debt/EBITDA (x) 4.02
Source: Company data, Refinitiv, Credit Suisse estimates
Share price performance
On 11-Oct-2021 the S&P 500 INDEX closed at 4361.19Daily Oct12, 2020 - Oct11, 2021, 10/12/20 = US$12.47
Adj. EBITDA Q1 Q2 Q3 Q4 2020A 321 311 331 289 2021E 275 333 359 382 2022E 363 357 364 380

13 October 2021
US Midstream and MLPs 9
DCP Midstream LP (DCP) Analyst: Spiro Dounis Price (11 Oct 2021): US$30.83 Target Price: (from 30.00) 34.00 Rating: Neutral [V] Distributable Cash Flow (DCF) 12/20A 12/21E 12/22E 12/23E
Adjusted EBITDA 1,252 1,349 1,464 1,427 Prev. Adj. EBITDA - 1,310 1,410 1,398 (-) Maintenance Capex (45) (67) (69) (67) (-) Cash Interest Expense - - - - (+/-) Other Adjustments - - - - (-) General Partner Take - - - - (-) Preferred Dividends 59 59 60 60 Adj. DCF Available to LPs 850 922 1,064 1,066
DCF Per LP Unit / Common Share 4.07 4.42 5.11 5.12 Distribution Per Unit / Share 1.56 1.56 1.56 1.56 Distribution Coverage (x) 2.62 2.84 3.27 3.28
Adj. EBITDA Q1 Q2 Q3 Q4 2020A 321 311 331 289 2021E 275 333 359 382 2022E 363 357 364 380
Key Valuation Metrics 12/20A 12/21E 12/22E 12/23E
Dividend / Distribution Yield (%) 8.42 5.07 5.07 5.07 Dividend / Distribution Growth (%, YoY) (50.00) 0.00 0.00 0.00 DCF Yield (%) 22.00 14.38 16.60 16.64 EV / EBITDA (x) 8.17 9.36 8.16 7.89
Leverage Ratios 12/20A 12/21E 12/22E 12/23E
Net Debt / EBITDA (x) 4.45 4.02 3.24 2.83 Net Debt / Total Capital (%) 48.72 48.11 43.33 38.25
Income Statement 12/20A 12/21E 12/22E 12/23E
Revenue (US$ m) 6,359 4,539 0 0
CoGS and OpEx 5,461 4,475 643 625 SGA 253 219 235 201 (+) Other EBITDA - - - - DD&A 376 368 360 349 Other 19 0 0 0 Operating Income 250 334 413 350
Interest 302 303 271 234 Equity Income (Loss) 508 545 594 599 Other Income (Loss) 0 0 0 0 Earnings Before Tax 456 577 735 716
Taxes 0 0 0 0 Net Income to LPs / Company 393 514 671 652
Earning Per Share / Unit 1.88 2.46 3.22 3.13 Avg. Diluted Shares / Units Outstanding 209 208 208 208
Cash Flow 12/20A 12/21E 12/22E 12/23E
Net Income (302) 577 735 716 DD&A 376 368 360 349 Others 1,401 295 462 481 Cash Flow from Operations 1,099 872 1,197 1,197
Acquisitions 2 0 0 0 Total Capex (267) (127) (129) (117) Expansion Capex (222) (60) (60) (50) Maintenance Capex (45) (67) (69) (67) Others 6 0 0 0 Cash Flow from Investments (259) (127) (129) (117)
Equity Issuance (Repurchase) 0 0 0 0 Debt Issued (306) (120) (739) (670) Dividends / Distributions Paid (470) (386) (385) (385) Others (9) 0 0 0 Cash Flow from Financing (785) (506) (1,124) (1,055)
Balance Sheet (US$) 12/20A 12/21E 12/22E 12/23E
Cash & Cash Equivalents 56 85 29 54 Other Current Assets 952 1,516 1,516 1,516 Net PPE 7,993 7,739 7,509 7,277 Other Long-Term Assets 3,956 3,874 3,772 3,639 Total Assets 12,957 13,214 12,825 12,486
Short-Term Debt 505 354 354 354 Other Short Term Liabilities 1,116 1,454 1,454 1,454 Long-Term Debt 5,119 5,152 4,413 3,743 Other Long-Term Liabilities 356 407 407 407 Total Liabilities 7,096 7,367 6,628 5,958
GP Equity - - - - LP Equity - - - - Non-Controlling Interests & Other 778 781 785 789 Total Liabilities and Equity 12,957 13,214 12,825 12,486
Company Background
DCP Midstream is a diversified master limited partnership with natural gas
gathering and processing assets covering the Mid-Con, DJ Basin,
Permian, and East Texas, as well as integrated NGL pipelines and
fractionation.
Blue/Grey Sky Scenario
Our Blue Sky Scenario (US$) (from 35.00) 39.00
Our blue sky price of $39 is based on 3.0% higher EBITDA and a 0.5x
higher EV multiple on our FY22 estimates vs. our base case on stronger
than anticipated commodity prices and improved producer activity.
Our Grey Sky Scenario (US$) (from 21.00) 24.00
Our grey sky price of $24 is based on 5% lower EBITDA and a 1.25x
lower EV multiple on our FY22 estimates vs. our base case on a weaker
commodity environment, and E&P counterparty risk.
Share price performance
On 11-Oct-2021 the S&P 500 INDEX closed at 4361.19
Daily Oct12, 2020 - Oct11, 2021, 10/12/20 = US$12.47
Source: FTI, Company data, Refinitiv, Credit Suisse Securities (EUROPE) LTD. Estimates
13 October 2021
US Midstream and MLPs 10
MPLX LP Maintain Outperform; Increase TP to $34
MPLX
Target price (12M, US$) 35.00
Outperform
Master Limited Partnerships
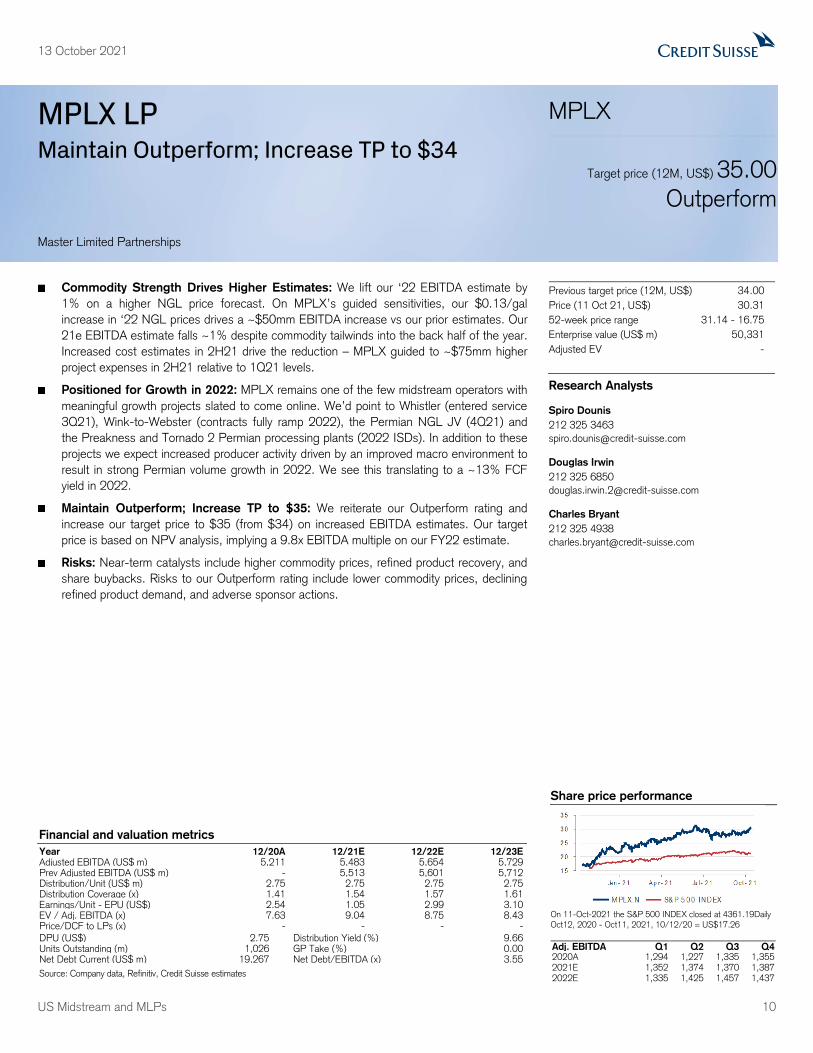
Commodity Strength Drives Higher Estimates: We lift our ‘22 EBITDA estimate by
1% on a higher NGL price forecast. On MPLX’s guided sensitivities, our $0.13/gal
increase in ‘22 NGL prices drives a ~$50mm EBITDA increase vs our prior estimates. Our
21e EBITDA estimate falls ~1% despite commodity tailwinds into the back half of the year.
Increased cost estimates in 2H21 drive the reduction – MPLX guided to ~$75mm higher
project expenses in 2H21 relative to 1Q21 levels.
Positioned for Growth in 2022: MPLX remains one of the few midstream operators with
meaningful growth projects slated to come online. We’d point to Whistler (entered service
3Q21), Wink-to-Webster (contracts fully ramp 2022), the Permian NGL JV (4Q21) and
the Preakness and Tornado 2 Permian processing plants (2022 ISDs). In addition to these
projects we expect increased producer activity driven by an improved macro environment to
result in strong Permian volume growth in 2022. We see this translating to a ~13% FCF
yield in 2022.
Maintain Outperform; Increase TP to $35: We reiterate our Outperform rating and
increase our target price to $35 (from $34) on increased EBITDA estimates. Our target
price is based on NPV analysis, implying a 9.8x EBITDA multiple on our FY22 estimate.
Risks: Near-term catalysts include higher commodity prices, refined product recovery, and
share buybacks. Risks to our Outperform rating include lower commodity prices, declining
refined product demand, and adverse sponsor actions.
Previous target price (12M, US$) 34.00
Price (11 Oct 21, US$) 30.31
52-week price range 31.14 - 16.75
Enterprise value (US$ m) 50,331
Adjusted EV -
Research Analysts
Spiro Dounis
212 325 3463
Douglas Irwin
212 325 6850
Charles Bryant
212 325 4938
Financial and valuation metrics
Year 12/20A 12/21E 12/22E 12/23E Adjusted EBITDA (US$ m) 5,211 5,483 5,654 5,729 Prev Adjusted EBITDA (US$ m) - 5,513 5,601 5,712 Distribution/Unit (US$ m) 2.75 2.75 2.75 2.75 Distribution Coverage (x) 1.41 1.54 1.57 1.61 Earnings/Unit - EPU (US$) 2.54 1.05 2.99 3.10 EV / Adj. EBITDA (x) 7.63 9.04 8.75 8.43 Price/DCF to LPs (x) - - - -
DPU (US$) 2.75 Distribution Yield (%) 9.66 Units Outstanding (m) 1,026 GP Take (%) 0.00 Net Debt Current (US$ m) 19,267 Net Debt/EBITDA (x) 3.55
Source: Company data, Refinitiv, Credit Suisse estimates
Share price performance
On 11-Oct-2021 the S&P 500 INDEX closed at 4361.19Daily Oct12, 2020 - Oct11, 2021, 10/12/20 = US$17.26
Adj. EBITDA Q1 Q2 Q3 Q4 2020A 1,294 1,227 1,335 1,355 2021E 1,352 1,374 1,370 1,387 2022E 1,335 1,425 1,457 1,437

13 October 2021
US Midstream and MLPs 11
MPLX LP (MPLX) Analyst: Spiro Dounis Price (11 Oct 2021): US$30.31 Target Price: (from 34.00) 35.00 Rating: Outperform Distributable Cash Flow (DCF) 12/20A 12/21E 12/22E 12/23E
Adjusted EBITDA 5,211 5,483 5,654 5,729 Prev. Adj. EBITDA - 5,513 5,601 5,712 (-) Maintenance Capex (147) (156) (165) (160) (-) Cash Interest Expense (854) (854) (851) (796) (+/-) Other Adjustments (10) (16) (124) (124) (-) General Partner Take 0 0 0 0 (-) Preferred Dividends 122 124 124 124 Adj. DCF Available to LPs 4,200 4,457 4,514 4,649
DCF Per LP Unit / Common Share 4.00 4.34 4.43 4.56 Distribution Per Unit / Share 2.75 2.75 2.75 2.75 Distribution Coverage (x) 1.41 1.54 1.57 1.61
Adj. EBITDA Q1 Q2 Q3 Q4 2020A 1,294 1,227 1,335 1,355 2021E 1,352 1,374 1,370 1,387 2022E 1,335 1,425 1,457 1,437
Key Valuation Metrics 12/20A 12/21E 12/22E 12/23E
Dividend / Distribution Yield (%) 13.94 9.66 9.66 9.66 Dividend / Distribution Growth (%, YoY) 2.23 0.00 0.00 0.00 DCF Yield (%) EV / EBITDA (x) 7.63 9.04 8.75 8.43
Leverage Ratios 12/20A 12/21E 12/22E 12/23E
Net Debt / EBITDA (x) 3.85 3.55 3.30 3.04 Net Debt / Total Capital (%) 58.06 58.55 56.68 54.13
Income Statement 12/20A 12/21E 12/22E 12/23E
Revenue (US$ m) 5,560 5,753 5,940 6,041
CoGS and OpEx 0 1,862 0 0 SGA 363 339 382 386 (+) Other EBITDA 134 202 231 210 DD&A 1,377 1,318 1,354 1,394 Other 121 132 136 136 Operating Income 3,699 2,101 4,068 4,125
Interest 867 854 851 796 Equity Income (Loss) - - - - Other Income (Loss) (1) 0 0 0 Earnings Before Tax 2,831 1,247 3,217 3,329
Taxes 2 3 5 5 Net Income to LPs / Company 2,674 1,083 3,048 3,157
Earning Per Share / Unit 2.54 1.05 2.99 3.10 Avg. Diluted Shares / Units Outstanding 1,051 1,028 1,020 1,020
Cash Flow 12/20A 12/21E 12/22E 12/23E
Net Income 1,478 2,995 3,213 3,324 DD&A 1,377 1,318 1,354 1,394 Others 3,043 1,667 1,586 1,604 Cash Flow from Operations 4,521 2,800 4,798 4,928
Acquisitions 56 74 0 0 Total Capex (1,326) (841) (821) (682) Expansion Capex (1,179) (685) (656) (522) Maintenance Capex (147) (156) (165) (160) Others 8 0 0 0 Cash Flow from Investments (1,262) (767) (821) (682)
Equity Issuance (Repurchase) (33) (509) 0 0 Debt Issued (198) (401) (1,030) (1,281) Dividends / Distributions Paid (3,006) (2,974) (2,929) (2,929) Others (22) 15 0 0 Cash Flow from Financing (3,259) (3,869) (3,959) (4,210)
Balance Sheet (US$) 12/20A 12/21E 12/22E 12/23E
Cash & Cash Equivalents 15 41 59 96 Other Current Assets 1,500 1,469 1,469 1,469 Net PPE 21,218 20,203 19,670 18,957 Other Long-Term Assets 13,681 13,973 13,742 13,532 Total Assets 36,414 35,687 34,940 34,055
Short-Term Debt 0 0 0 0 Other Short Term Liabilities 2,086 1,727 1,727 1,727 Long-Term Debt 19,375 19,286 18,256 16,975 Other Long-Term Liabilities 968 1,049 1,049 1,049 Total Liabilities 22,429 22,062 21,032 19,751
GP Equity 0 0 0 0 LP Equity 12,161 11,803 12,086 12,481 Non-Controlling Interests & Other 1,824 1,822 1,822 1,822 Total Liabilities and Equity 36,414 35,687 34,940 34,055
Company Background
MPLX is a sponsored master limited partnership under Marathon
Petroleum, a US independent refiner. MPLX owns gathering, processing,
and fractionation assets across the Northeast and Southwest, as well as
pipelines and terminals serving MPC.
Blue/Grey Sky Scenario
Our Blue Sky Scenario (US$) (from 39.00) 40.00
Our blue sky price of $40 is based on 4.0% higher EBITDA and a 0.50x
higher EV multiple on our FY22 estimates vs. our base case, assuming
stronger than anticipated ethane prices and increased producer activity.
Our Grey Sky Scenario (US$) 19.00
Our grey sky price of $19 is based on 5.0% lower EBITDA and a 2.5x
lower EV multiple on our FY22 estimates vs. our base case on
persistently lower gas and NGL prices.
Share price performance
On 11-Oct-2021 the S&P 500 INDEX closed at 4361.19
Daily Oct12, 2020 - Oct11, 2021, 10/12/20 = US$17.26
Source: FTI, Company data, Refinitiv, Credit Suisse Securities (EUROPE) LTD. Estimates

13 October 2021
US Midstream and MLPs 12
New Fortress Energy Reiterate Outperform; Raise TP to $38
NFE
Target price (12M, US$) 38.00
Outperform[V]
Infrastructure
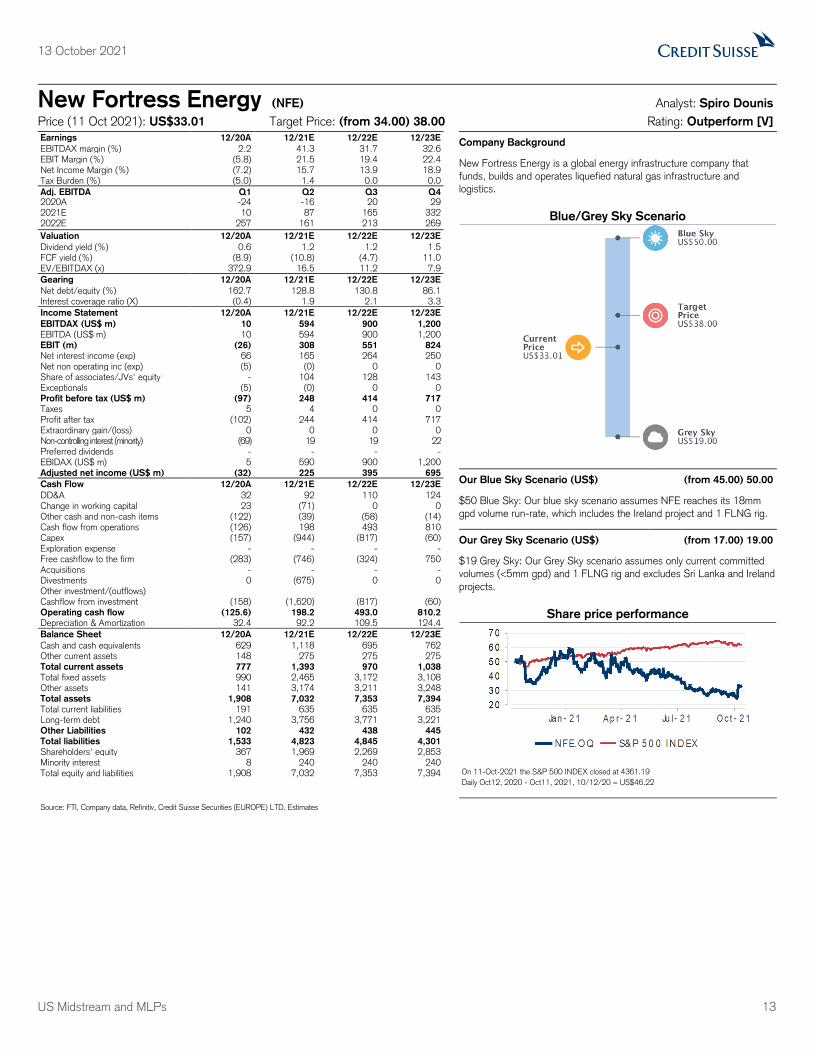
Lifting TP to $38 from $34: We lift our TP to $38 from $34 to reflect higher ’21 and ’22
revenues from selling LNG cargoes in the tight international market (+$2/share). The
stronger cash position and alleviation of capex financing pressure also drives +$2/share.
Net Long LNG Position Strengthens Cash Flows: NFE addressed a central near-term
investor concern: potentially being short LNG in a record high price environment. Through a
combination of actions, NFE is now net long LNG in 2021 and 2022, generating a cash
windfall (+$300mm) into next year. While the cash flows are non-recurring, NFE was able
to de-risk the near-term while also providing funding for its $1.6bln growth capital backlog.
Fast LNG Still The Long-Term Solution: Fast LNG remains NFE’s primary solution to
address its short LNG position starting in 2023. Management expects to finalize a
commercial agreement with an upstream counterparty before year-end and reiterated YE22
in-service timing. We believe the market continues to heavily discount this supply option
and its viability given perceived complications in securing a fixed price supply structure. That
said, we see a term LNG deal as an ongoing viable back up option that largely preserves
NFE’s margin and returns.
Adjusting Estimates: We raise our ’21 EBITDA by 52% to reflect NFE’s updated outlook.
Our ’22 EBITDA increases 12% to reflect NFE’s net long cargo position and +$100mm
outlook revision.
Risks: Downside risks include slow commercial progress, equity raises, demand
destruction and large secondary offerings from GLNG/Stonepeak.
Valuation: We reiterate Outperform and lift our TP to $38 from $34 based on our NPV
methodology. Our NPV imputes a 3% long term growth rate, 1% terminal growth rate, a
3x return multiple long term, and a 10% discount rate.
Previous target price (12M, US$) 34.00
Price (11 Oct 21, US$) 33.01
52-week price range 59.18 - 24.60
Enterprise value (US$ m) 9,666
[V] = Stock Considered Volatile (see Disclosure Appendix)
Research Analysts
Spiro Dounis
212 325 3463
Douglas Irwin
212 325 6850
Charles Bryant
212 325 4938
Financial and valuation metrics
Year 12/20A 12/21E 12/22E 12/23E Adjusted EBITDA (US$ m) 10 594 900 1,200 Prev Adjusted EBITDA (US$ m) - 392 803 1,166 Distribution/Unit (US$ m) 0.20 0.40 0.40 0.48 Distribution Coverage (x) - - - - Earnings/Unit - EPU (US$) -0.55 1.07 1.91 3.36 EV / Adj. EBITDA (x) 9,92.83 16.65 11.55 8.15 Price/DCF to LPs (x) .00 .00 .00 .00
Dividend (current, US$) .4 Dividend yield (%) 1.2 Net debt (current, US$) 3,401.0 Net debt/tot eq (Next Qtr., %) 167.6 BV/share (Next Qtr., US$) 8.7 GIC (12/21E, US$ m) 5,051.4 EV qtr/GIC (x) 2.8 Current WACC (%) - Free float (%) 372.5 Number of shares (m) 206.7
Source: Company data, Refinitiv, Credit Suisse estimates
Share price performance
On 11-Oct-2021 the S&P 500 INDEX closed at 4361.19Daily Oct12, 2020 - Oct11, 2021, 10/12/20 = US$46.22
Adj. EBITDA Q1 Q2 Q3 Q4 2020A -24 -16 20 29 2021E 10 87 165 332 2022E 257 161 213 269
13 October 2021
US Midstream and MLPs 13
New Fortress Energy (NFE) Analyst: Spiro Dounis Price (11 Oct 2021): US$33.01 Target Price: (from 34.00) 38.00 Rating: Outperform [V] Earnings 12/20A 12/21E 12/22E 12/23E
EBITDAX margin (%) 2.2 41.3 31.7 32.6 EBIT Margin (%) (5.8) 21.5 19.4 22.4 Net Income Margin (%) (7.2) 15.7 13.9 18.9 Tax Burden (%) (5.0) 1.4 0.0 0.0
Adj. EBITDA Q1 Q2 Q3 Q4 2020A -24 -16 20 29 2021E 10 87 165 332 2022E 257 161 213 269
Valuation 12/20A 12/21E 12/22E 12/23E
Dividend yield (%) 0.6 1.2 1.2 1.5 FCF yield (%) (8.9) (10.8) (4.7) 11.0 EV/EBITDAX (x) 372.9 16.5 11.2 7.9
Gearing 12/20A 12/21E 12/22E 12/23E
Net debt/equity (%) 162.7 128.8 130.8 86.1 Interest coverage ratio (X) (0.4) 1.9 2.1 3.3
Income Statement 12/20A 12/21E 12/22E 12/23E
EBITDAX (US$ m) 10 594 900 1,200
EBITDA (US$ m) 10 594 900 1,200 EBIT (m) (26) 308 551 824
Net interest income (exp) 66 165 264 250 Net non operating inc (exp) (5) (0) 0 0 Share of associates/JVs' equity - 104 128 143 Exceptionals (5) (0) 0 0 Profit before tax (US$ m) (97) 248 414 717
Taxes 5 4 0 0 Profit after tax (102) 244 414 717 Extraordinary gain/(loss) 0 0 0 0 Non-controlling interest (minority) (69) 19 19 22 Preferred dividends - - - - EBIDAX (US$ m) 5 590 900 1,200 Adjusted net income (US$ m) (32) 225 395 695
Cash Flow 12/20A 12/21E 12/22E 12/23E
DD&A 32 92 110 124 Change in working capital 23 (71) 0 0 Other cash and non-cash items (122) (39) (58) (14) Cash flow from operations (126) 198 493 810 Capex (157) (944) (817) (60) Exploration expense - - - - Free cashflow to the firm (283) (746) (324) 750 Acquisitions - - - - Divestments 0 (675) 0 0 Other investment/(outflows) Cashflow from investment (158) (1,620) (817) (60) Operating cash flow (125.6) 198.2 493.0 810.2
Depreciation & Amortization 32.4 92.2 109.5 124.4
Balance Sheet 12/20A 12/21E 12/22E 12/23E
Cash and cash equivalents 629 1,118 695 762 Other current assets 148 275 275 275 Total current assets 777 1,393 970 1,038
Total fixed assets 990 2,465 3,172 3,108 Other assets 141 3,174 3,211 3,248 Total assets 1,908 7,032 7,353 7,394
Total current liabilities 191 635 635 635 Long-term debt 1,240 3,756 3,771 3,221 Other Liabilities 102 432 438 445
Total liabilities 1,533 4,823 4,845 4,301
Shareholders' equity 367 1,969 2,269 2,853 Minority interest 8 240 240 240 Total equity and liabilities 1,908 7,032 7,353 7,394
Company Background
New Fortress Energy is a global energy infrastructure company that
funds, builds and operates liquefied natural gas infrastructure and
logistics.
Blue/Grey Sky Scenario
Our Blue Sky Scenario (US$) (from 45.00) 50.00
$50 Blue Sky: Our blue sky scenario assumes NFE reaches its 18mm
gpd volume run-rate, which includes the Ireland project and 1 FLNG rig.
Our Grey Sky Scenario (US$) (from 17.00) 19.00
$19 Grey Sky: Our Grey Sky scenario assumes only current committed
volumes (<5mm gpd) and 1 FLNG rig and excludes Sri Lanka and Ireland
projects.
Share price performance
On 11-Oct-2021 the S&P 500 INDEX closed at 4361.19
Daily Oct12, 2020 - Oct11, 2021, 10/12/20 = US$46.22
Source: FTI, Company data, Refinitiv, Credit Suisse Securities (EUROPE) LTD. Estimates
13 October 2021
US Midstream and MLPs 14
ONEOK Inc Maintain Neutral; Increase TP to $62
OKE
Target price (12M, US$) 62.00
Neutral
Master Limited Partnerships
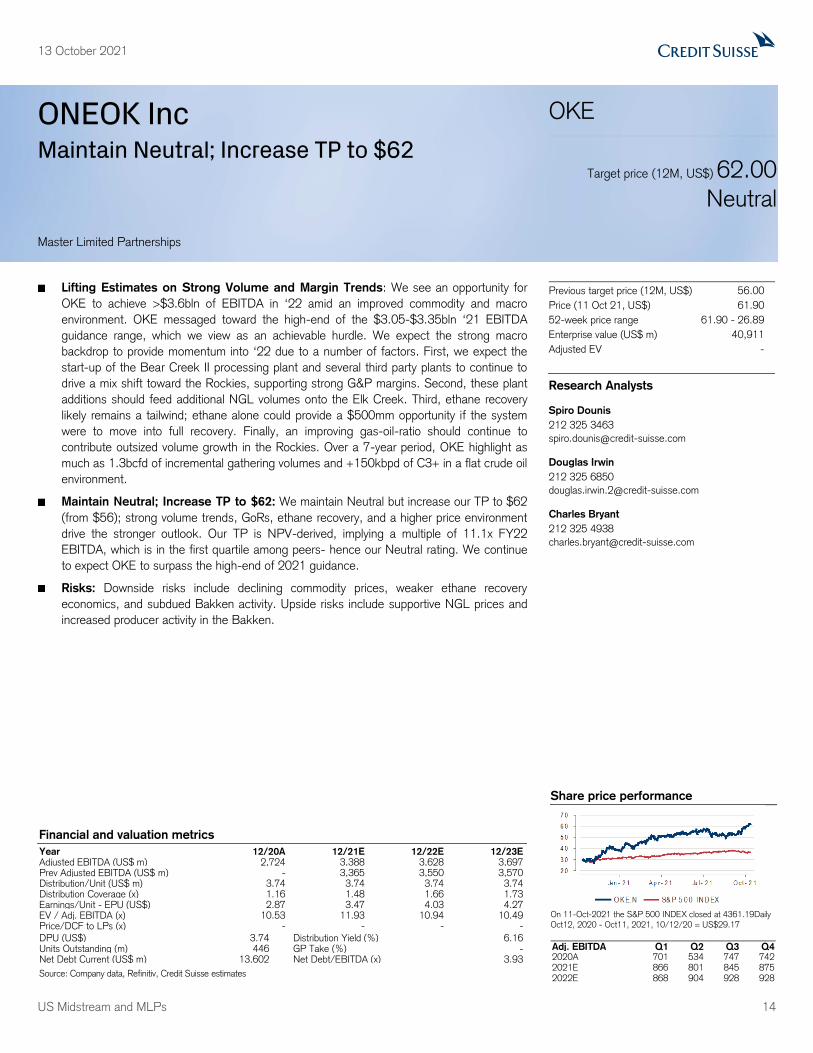
Lifting Estimates on Strong Volume and Margin Trends: We see an opportunity for
OKE to achieve >$3.6bln of EBITDA in ‘22 amid an improved commodity and macro
environment. OKE messaged toward the high-end of the $3.05-$3.35bln ‘21 EBITDA
guidance range, which we view as an achievable hurdle. We expect the strong macro
backdrop to provide momentum into ‘22 due to a number of factors. First, we expect the
start-up of the Bear Creek II processing plant and several third party plants to continue to
drive a mix shift toward the Rockies, supporting strong G&P margins. Second, these plant
additions should feed additional NGL volumes onto the Elk Creek. Third, ethane recovery
likely remains a tailwind; ethane alone could provide a $500mm opportunity if the system
were to move into full recovery. Finally, an improving gas-oil-ratio should continue to
contribute outsized volume growth in the Rockies. Over a 7-year period, OKE highlight as
much as 1.3bcfd of incremental gathering volumes and +150kbpd of C3+ in a flat crude oil
environment.
Maintain Neutral; Increase TP to $62: We maintain Neutral but increase our TP to $62
(from $56); strong volume trends, GoRs, ethane recovery, and a higher price environment
drive the stronger outlook. Our TP is NPV-derived, implying a multiple of 11.1x FY22
EBITDA, which is in the first quartile among peers- hence our Neutral rating. We continue
to expect OKE to surpass the high-end of 2021 guidance.
Risks: Downside risks include declining commodity prices, weaker ethane recovery
economics, and subdued Bakken activity. Upside risks include supportive NGL prices and
increased producer activity in the Bakken.
Previous target price (12M, US$) 56.00
Price (11 Oct 21, US$) 61.90
52-week price range 61.90 - 26.89
Enterprise value (US$ m) 40,911
Adjusted EV -
Research Analysts
Spiro Dounis
212 325 3463
Douglas Irwin
212 325 6850
Charles Bryant
212 325 4938
Financial and valuation metrics
Year 12/20A 12/21E 12/22E 12/23E Adjusted EBITDA (US$ m) 2,724 3,388 3,628 3,697 Prev Adjusted EBITDA (US$ m) - 3,365 3,550 3,570 Distribution/Unit (US$ m) 3.74 3.74 3.74 3.74 Distribution Coverage (x) 1.16 1.48 1.66 1.73 Earnings/Unit - EPU (US$) 2.87 3.47 4.03 4.27 EV / Adj. EBITDA (x) 10.53 11.93 10.94 10.49 Price/DCF to LPs (x) - - - -
DPU (US$) 3.74 Distribution Yield (%) 6.16 Units Outstanding (m) 446 GP Take (%) - Net Debt Current (US$ m) 13,602 Net Debt/EBITDA (x) 3.93
Source: Company data, Refinitiv, Credit Suisse estimates
Share price performance
On 11-Oct-2021 the S&P 500 INDEX closed at 4361.19Daily Oct12, 2020 - Oct11, 2021, 10/12/20 = US$29.17
Adj. EBITDA Q1 Q2 Q3 Q4 2020A 701 534 747 742 2021E 866 801 845 875 2022E 868 904 928 928

13 October 2021
US Midstream and MLPs 15
ONEOK Inc (OKE) Analyst: Spiro Dounis Price (11 Oct 2021): US$61.9 Target Price: (from 56.00) 62.00 Rating: Neutral Distributable Cash Flow (DCF) 12/20A 12/21E 12/22E 12/23E
Adjusted EBITDA 2,724 3,388 3,628 3,697 Prev. Adj. EBITDA - 3,365 3,550 3,570 (-) Maintenance Capex (137) (189) (188) (187) (-) Cash Interest Expense - - - - (+/-) Other Adjustments - - - - (-) General Partner Take - - - - (-) Preferred Dividends - - - - Adj. DCF Available to LPs 1,881 2,476 2,753 2,827
DCF Per LP Unit / Common Share 4.35 5.55 6.22 6.48 Distribution Per Unit / Share 3.74 3.74 3.74 3.74 Distribution Coverage (x) 1.16 1.48 1.66 1.73
Adj. EBITDA Q1 Q2 Q3 Q4 2020A 701 534 747 742 2021E 866 801 845 875 2022E 868 904 928 928
Key Valuation Metrics 12/20A 12/21E 12/22E 12/23E
Dividend / Distribution Yield (%) 11.12 6.16 6.16 6.16 Dividend / Distribution Growth (%, YoY) 5.95 0.00 0.00 0.00 DCF Yield (%) 12.95 9.14 10.24 10.67 EV / EBITDA (x) 10.53 11.93 10.94 10.49
Leverage Ratios 12/20A 12/21E 12/22E 12/23E
Net Debt / EBITDA (x) 5.03 3.93 3.58 3.38 Net Debt / Total Capital (%) 69.41 69.40 69.85 69.63
Income Statement 12/20A 12/21E 12/22E 12/23E
Revenue (US$ m) 3,432 4,249 4,542 4,638
CoGS and OpEx 0 0 0 0 SGA - - - - (+) Other EBITDA - - - - DD&A 579 633 635 632 Other 876 973 1,034 1,060 Operating Income 1,977 2,644 2,872 2,946
Interest 713 735 674 640 Equity Income (Loss) 143 125 132 131 Other Income (Loss) 25 (14) (12) (12) Earnings Before Tax 1,432 2,021 2,319 2,425
Taxes 190 471 533 558 Net Income to LPs / Company 1,242 1,549 1,785 1,866
Earning Per Share / Unit 2.87 3.47 4.03 4.27 Avg. Diluted Shares / Units Outstanding 432 447 443 437
Cash Flow 12/20A 12/21E 12/22E 12/23E
Net Income - - - - DD&A 579 633 635 632 Others - - - - Cash Flow from Operations 1,899 2,676 2,952 3,025
Acquisitions 0 0 0 0 Total Capex (2,195) (614) (558) (488) Expansion Capex (2,058) (425) (370) (301) Maintenance Capex (137) (189) (188) (187) Others (75) (0) 0 0 Cash Flow from Investments (2,271) (614) (558) (488)
Equity Issuance (Repurchase) 970 16 (400) (400) Debt Issued 1,568 (358) (575) (800) Dividends / Distributions Paid (1,605) (1,667) (1,655) (1,630) Others (57) (18) 0 0 Cash Flow from Financing 875 (2,027) (2,630) (2,830)
Balance Sheet (US$) 12/20A 12/21E 12/22E 12/23E
Cash & Cash Equivalents 524 560 323 30 Other Current Assets 1,345 1,631 1,631 1,631 Net PPE 19,155 19,152 19,075 18,931 Other Long-Term Assets 2,054 2,009 1,985 1,961 Total Assets 23,079 23,352 23,014 22,553
Short-Term Debt 8 536 536 536 Other Short Term Liabilities 1,337 1,858 1,858 1,858 Long-Term Debt 14,228 13,348 12,773 11,973 Other Long-Term Liabilities 1,463 1,733 2,240 2,742 Total Liabilities 17,036 17,476 17,408 17,110
GP Equity - - - - LP Equity - - - - Non-Controlling Interests & Other 0 0 0 0 Total Liabilities and Equity - - - -
Company Background
ONEOK is a diversified midstream C-corp with gathering, processing,
fractionation, and pipeline assets covering the Bakken, Mid-Con,
Permian, and Gulf Coast.
Blue/Grey Sky Scenario
Our Blue Sky Scenario (US$) (from 66.00) 73.00
Our blue sky price of $73 is based on 3% higher EBITDA and a 1.0x
higher EV multiple on our FY22 estimates vs. our base case, which would
be driven by a higher than expected utilization, faster ramp on projects
and a better than expected ethane recovery.
Our Grey Sky Scenario (US$) (from 35.00) 41.00
Our grey sky price of $41 is based on 5% lower EBITDA and a 2.0x
lower EV multiple on our FY22 estimates vs. our base case driven by
delays in projects, lower than expected utilization and increased ethane
rejection.
Share price performance
On 11-Oct-2021 the S&P 500 INDEX closed at 4361.19
Daily Oct12, 2020 - Oct11, 2021, 10/12/20 = US$29.17
Source: FTI, Company data, Refinitiv, Credit Suisse Securities (EUROPE) LTD. Estimates

13 October 2021
US Midstream and MLPs 16
Targa Resources Corp Reiterate Outperform; Increase TP to $60
TRGP
Target price (12M, US$) 60.00
Outperform[V]
Master Limited Partnerships
Commodity Strength Drives Higher Estimates: We increase our ‘21e and ‘22e
EBITDA estimates by ~2.5% and ~9%, respectively, driven by a higher commodity price
forecast and improved G&P margin estimates. Based on TRGP’s guided sensitivities, we
estimate an >$50mm ‘22 EBITDA uplift vs our prior model based on commodity prices
alone. We see several positive tailwinds benefitting TRGP in addition to a strong commodity
environment. First, producer activity has continued to improve, which we expect to translate
into volume growth in ‘22, particularly in the Permian. Second, with the relocated Heim
plant entering service in 3Q21, we’d expect to see the G&P system run at more optimal
levels, resulting in margin uplift as well as increased NGL volumes downstream to Grand
Prix. Altogether, we view TRGP as well on pace to reach the high end of the $1.9-$2.0bln
2021 EBITDA guidance with a strong set-up for continued EBITDA growth in 2022.
DevCo Repurchase Approaching: We believe TRGP remains on track for a 1Q22
announcement – possibly ahead of the 4Q earnings release in February, which could also
include a capital allocation announcement. We continue to expect an all of the above
approach to capital allocation, which could include buybacks, dividend growth, and a ratable
buyback of the preferreds. After repurchasing the DevCo and paying dividends, we
estimate >$450mm of FCF that could be directed toward additional capital returns or
further strengthening of the balance sheet in 2022.
Maintain Outperform; Increase TP to $60: We reiterate Outperform and increase our
TP to $60 (from $52), primarily driven by increased EBITDA estimates amid a strong
commodity environment and positive volume trends. Our valuation is NPV-derived with a
9% discount rate, implying an FY22 EBITDA multiple of ~9.3x.
Risks: Key risks include lower commodity prices and a slower return of E&P producer
activity. Catalysts include the DevCo interest purchase, share repurchases, and higher
commodity prices.
Previous target price (12M, US$) 52.00
Price (11 Oct 21, US$) 53.02
52-week price range 53.02 - 15.76
Enterprise value (US$ m) 18,484
Adjusted EV -
[V] = Stock Considered Volatile (see Disclosure Appendix)
Research Analysts
Spiro Dounis
212 325 3463
Douglas Irwin
212 325 6850
Charles Bryant
212 325 4938
Financial and valuation metrics
Year 12/20A 12/21E 12/22E 12/23E Adjusted EBITDA (US$ m) 1,637 2,000 2,290 2,300 Prev Adjusted EBITDA (US$ m) - 1,950 2,096 2,122 Distribution/Unit (US$ m) 0.40 0.40 0.40 0.40 Distribution Coverage (x) 11.51 14.51 18.38 19.20 Earnings/Unit - EPU (US$) 0.36 1.97 3.14 3.50 EV / Adj. EBITDA (x) 9.39 10.38 10.11 9.64 Price/DCF to LPs (x) 3.33 7.29 7.06 6.76
DPU (US$) 0.40 Distribution Yield (%) 0.77 Units Outstanding (m) 229 GP Take (%) - Net Debt Current (US$ m) 6,579 Net Debt/EBITDA (x) 3.35
Source: Company data, Refinitiv, Credit Suisse estimates
Share price performance
On 11-Oct-2021 the S&P 500 INDEX closed at 4361.19Daily Oct12, 2020 - Oct11, 2021, 10/12/20 = US$16.8
Adj. EBITDA Q1 Q2 Q3 Q4 2020A 428 351 419 438 2021E 516 460 499 526 2022E 555 567 578 590

13 October 2021
US Midstream and MLPs 17
Targa Resources Corp (TRGP) Analyst: Spiro Dounis Price (11 Oct 2021): US$53.02 Target Price: (from 52.00) 60.00 Rating: Outperform [V] Distributable Cash Flow (DCF) 12/20A 12/21E 12/22E 12/23E
Adjusted EBITDA 1,637 2,000 2,290 2,300 Prev. Adj. EBITDA - 1,950 2,096 2,122 (-) Maintenance Capex (123) (120) (124) (122) (-) Cash Interest Expense 389 384 365 292 (+/-) Other Adjustments - - - - (-) General Partner Take - - - - (-) Preferred Dividends - - - - Adj. DCF Available to LPs 1,073 1,405 1,709 1,795
DCF Per LP Unit / Common Share 4.60 5.80 7.35 7.68 Distribution Per Unit / Share .40 .40 .40 .40 Distribution Coverage (x) 11.51 14.51 18.38 19.20
Adj. EBITDA Q1 Q2 Q3 Q4 2020A 428 351 419 438 2021E 516 460 499 526 2022E 555 567 578 590
Key Valuation Metrics 12/20A 12/21E 12/22E 12/23E
Dividend / Distribution Yield (%) 1.88 0.77 0.77 0.77 Dividend / Distribution Growth (%, YoY) (89.01) 0.00 0.00 0.00 DCF Yield (%) 21.63 11.19 14.17 14.80 EV / EBITDA (x) 9.39 10.38 10.11 9.64
Leverage Ratios 12/20A 12/21E 12/22E 12/23E
Net Debt / EBITDA (x) 4.64 3.35 2.86 2.27 Net Debt / Total Capital (%) 54.77 49.78 46.03 37.12
Income Statement 12/20A 12/21E 12/22E 12/23E
Revenue (US$ m) 2,857 3,270 3,521 3,527
CoGS and OpEx 6,107 6,222 836 854 SGA 255 253 286 285 (+) Other EBITDA - - - - DD&A 865 849 874 859 Other 0 0 0 0 Operating Income 1,032 1,421 1,525 1,551
Interest 391 381 362 289 Equity Income (Loss) 73 50 51 51 Other Income (Loss) 3 (1) 0 0 Earnings Before Tax 716 1,090 1,214 1,312
Taxes 47 75 109 118 Net Income to LPs / Company 85 477 731 818
Earning Per Share / Unit 0.36 1.97 3.14 3.50 Avg. Diluted Shares / Units Outstanding 233 242 233 234
Cash Flow 12/20A 12/21E 12/22E 12/23E
Net Income (1,325) 926 1,104 1,194 DD&A 865 849 874 859 Others 3,070 1,376 939 925 Cash Flow from Operations 1,745 2,301 2,044 2,120
Acquisitions 199 2 (925) 0 Total Capex (952) (520) (474) (350) Expansion Capex (829) (400) (350) (228) Maintenance Capex (123) (120) (124) (122) Others 15 12 0 0 Cash Flow from Investments (738) (506) (1,399) (350)
Equity Issuance (Repurchase) (97) (9) 0 0 Debt Issued (23) (867) (750) (1,356) Dividends / Distributions Paid (396) (185) (185) (185) Others (578) (443) (192) (192) Cash Flow from Financing (1,095) (1,504) (1,126) (1,733)
Balance Sheet (US$) 12/20A 12/21E 12/22E 12/23E
Cash & Cash Equivalents 243 535 53 90 Other Current Assets 1,218 1,109 1,109 1,109 Net PPE 12,174 11,896 12,421 11,911 Other Long-Term Assets 2,242 2,063 1,998 1,932 Total Assets 15,876 15,602 15,580 15,041
Short-Term Debt 369 372 372 372 Other Short Term Liabilities 1,411 1,730 1,730 1,730 Long-Term Debt 7,387 6,524 5,774 4,418 Other Long-Term Liabilities 505 560 560 560 Total Liabilities 9,671 9,185 8,435 7,080
GP Equity - - - - LP Equity - - - - Non-Controlling Interests & Other 3,551 4,205 4,490 4,777 Total Liabilities and Equity 15,876 15,602 15,580 15,041
Company Background
Targa Resources is a midstream C-corp that owns and operates an
integrated asset base from gathering and processing assets across the
Permian, Mid-Con, Bakken, and Eagle Ford to NGL fractionation and
export assets on the Gulf Coast.
Blue/Grey Sky Scenario
Our Blue Sky Scenario (US$) (from 61.00) 70.00
Our blue sky price of $70 is based on 5.0% higher EBITDA and a 0.50x
higher EV multiple on our FY22 estimates vs. our base case on a
stronger commodity environment and increased Permian production.
Our Grey Sky Scenario (US$) (from 31.00) 37.00
Our grey sky price of $37 is based on 10% lower EBITDA and a 1.5x
lower EV multiple on our FY22 estimates vs. our base case on steeper
legacy asset declines and weaker commodity environment.
Share price performance
On 11-Oct-2021 the S&P 500 INDEX closed at 4361.19
Daily Oct12, 2020 - Oct11, 2021, 10/12/20 = US$16.8
Source: FTI, Company data, Refinitiv, Credit Suisse Securities (EUROPE) LTD. Estimates

13 October 2021
US Midstream and MLPs 18
Williams Companies Inc Reiterate Outperform; Raise TP to $30
WMB
Target price (12M, US$) 30.00
Outperform
Master Limited Partnerships
Lifting TP to $30: We reiterate Outperform and raise our TP to $30 from $29 based on
our NPV methodology. Higher revenues from natural gas directed E&P assets drives the
TP increase given the strong natural gas price environment. While WMB takes on more
direct commodity exposure, its risk profile remains in-tact as E&P operations represent well
under 5% of EBITDA in ’22 and ’23 in the elevated natural gas environment.
Adjusting Estimates: We raise ‘21e EBITDA by ~1% to reflect higher E&P revenues
from the elevated natural gas price environment in 2H21. Our ’22 EBITDA increases by
~2% due to a full year impact of the elevated natural gas prices.
Risks: Downside risks include weaker than expected re-contracting on legacy assets,
lower than expected production in the Appalachia, DJ, and Haynesville, and regulatory
delays on Transco expansions.
Previous target price (12M, US$) 29.00
Price (11 Oct 21, US$) 28.63
52-week price range 28.63 - 18.26
Enterprise value (US$ m) 56,907
Adjusted EV -
Research Analysts
Spiro Dounis
212 325 3463
Douglas Irwin
212 325 6850
Charles Bryant
212 325 4938
Financial and valuation metrics
Year 12/20A 12/21E 12/22E 12/23E Adjusted EBITDA (US$ m) 5,105 5,450 5,644 5,796 Prev Adjusted EBITDA (US$ m) - 5,405 5,545 5,718 Distribution/Unit (US$ m) 1.60 1.64 1.68 1.72 Distribution Coverage (x) 1.73 1.81 1.89 1.93 Earnings/Unit - EPU (US$) 1.10 1.16 1.22 1.36 EV / Adj. EBITDA (x) 9.23 10.36 10.27 9.88 Price/DCF to LPs (x) 7.26 9.30 8.94 8.75
DPU (US$) 1.64 Distribution Yield (%) 5.93 Units Outstanding (m) 1,215 GP Take (%) - Net Debt Current (US$ m) 22,195 Net Debt/EBITDA (x) 4.06
Source: Company data, Refinitiv, Credit Suisse estimates
Share price performance
On 11-Oct-2021 the S&P 500 INDEX closed at 4361.19Daily Oct12, 2020 - Oct11, 2021, 10/12/20 = US$19.45
Adj. EBITDA Q1 Q2 Q3 Q4 2020A 1,262 1,240 1,267 1,336 2021E 1,415 1,317 1,350 1,368 2022E 1,385 1,397 1,419 1,444

13 October 2021
US Midstream and MLPs 19
Williams Companies Inc (WMB) Analyst: Spiro Dounis Price (11 Oct 2021): US$28.63 Target Price: (from 29.00) 30.00 Rating: Outperform Distributable Cash Flow (DCF) 12/20A 12/21E 12/22E 12/23E
Adjusted EBITDA 5,105 5,450 5,644 5,796 Prev. Adj. EBITDA - 5,405 5,545 5,718 (-) Maintenance Capex (393) (428) (434) (437) (-) Cash Interest Expense - - - - (+/-) Other Adjustments - - - - (-) General Partner Take - - - - (-) Preferred Dividends - - - - Adj. DCF Available to LPs 3,356 3,620 3,857 4,035
DCF Per LP Unit / Common Share 2.76 2.97 3.17 3.31 Distribution Per Unit / Share 1.60 1.64 1.68 1.72 Distribution Coverage (x) 1.73 1.81 1.89 1.93
Adj. EBITDA Q1 Q2 Q3 Q4 2020A 1,262 1,240 1,267 1,336 2021E 1,415 1,317 1,350 1,368 2022E 1,385 1,397 1,419 1,444
Key Valuation Metrics 12/20A 12/21E 12/22E 12/23E
Dividend / Distribution Yield (%) 7.98 5.93 5.93 5.93 Dividend / Distribution Growth (%, YoY) 5.26 2.50 2.44 2.38 DCF Yield (%) 13.77 10.76 11.19 11.43 EV / EBITDA (x) 9.23 10.36 10.27 9.88
Leverage Ratios 12/20A 12/21E 12/22E 12/23E
Net Debt / EBITDA (x) 4.33 4.06 3.86 3.66 Net Debt / Total Capital (%) 60.36 60.96 60.46 59.44
Income Statement 12/20A 12/21E 12/22E 12/23E
Revenue (US$ m) 7,719 9,576 9,144 8,963
CoGS and OpEx 1,613 3,284 2,922 2,615 SGA 497 445 415 424 (+) Other EBITDA - - - - DD&A 1,721 1,827 1,840 1,822 Other 1,311 1,405 1,328 1,358 Operating Income 2,577 2,616 2,687 2,891
Interest 1,172 1,178 1,130 1,101 Equity Income (Loss) - - - - Other Income (Loss) (5) 0 0 0 Earnings Before Tax 1,848 1,979 2,122 2,355
Taxes 454 500 548 608 Net Income to LPs / Company 1,342 1,416 1,491 1,655
Earning Per Share / Unit 1.10 1.16 1.22 1.36 Avg. Diluted Shares / Units Outstanding 1,215 1,217 1,217 1,217
Cash Flow 12/20A 12/21E 12/22E 12/23E
Net Income - - - - DD&A 1,721 1,827 1,840 1,822 Others - - - - Cash Flow from Operations 3,496 4,023 4,215 4,404
Acquisitions (361) (182) 0 0 Total Capex (1,239) (1,603) (1,508) (1,449) Expansion Capex (846) (1,175) (1,074) (1,012) Maintenance Capex (393) (428) (434) (437) Others 42 33 0 0 Cash Flow from Investments (1,558) (1,752) (1,508) (1,449)
Equity Issuance (Repurchase) 9 3 0 0 Debt Issued 58 (51) (584) (652) Dividends / Distributions Paid (1,941) (1,994) (2,045) (2,094) Others (211) (198) (191) (191) Cash Flow from Financing (2,085) (2,240) (2,821) (2,937)
Balance Sheet (US$) 12/20A 12/21E 12/22E 12/23E
Cash & Cash Equivalents 142 173 59 77 Other Current Assets 1,287 1,358 1,358 1,358 Net PPE 28,929 29,425 29,093 28,719 Other Long-Term Assets 13,807 13,514 13,373 13,232 Total Assets 44,165 44,469 43,882 43,386
Short-Term Debt 893 2,143 2,143 2,143 Other Short Term Liabilities 1,426 1,616 1,616 1,616 Long-Term Debt 21,451 20,153 19,569 18,917 Other Long-Term Liabilities 5,812 6,392 6,392 6,392 Total Liabilities 29,582 30,304 29,720 29,068
GP Equity - - - - LP Equity - - - - Non-Controlling Interests & Other 2,814 2,662 2,471 2,280 Total Liabilities and Equity - - - -
Company Background
WMB is a midstream c-corp with one reportable segment, Williams
Partners, which owns gathering, processing, and transmission assets
across the Eastern US, Gulf Coast, and Rockies.
Blue/Grey Sky Scenario
Our Blue Sky Scenario (US$) (from 34.00) 35.00
Our blue sky price of $35 is based on 5.0% higher EBITDA and a 0.5x
higher EV multiple on our FY22 estimates vs. our base case on higher
than expected utilization on Transco and additional projects receiving FID.
Our Grey Sky Scenario (US$) 23.00
Our grey sky price of $23 is based on 4.0% lower EBITDA and a 1.0x
lower EV multiple on our FY22 estimates vs. our base case driven by
legacy asset declines and delays in projects.
Share price performance
On 11-Oct-2021 the S&P 500 INDEX closed at 4361.19
Daily Oct12, 2020 - Oct11, 2021, 10/12/20 = US$19.45
Source: FTI, Company data, Refinitiv, Credit Suisse Securities (EUROPE) LTD. Estimates

13 October 2021
US Midstream and MLPs 20
Valuation Methodology and Risks
Target Price and Rating Valuation Methodology and Risks: (12 months) for Altus Midstream Company (ALTM.OQ)
Method: Our $45 TP is based on a dividend discount methodology, discounted back at 12%. Our Underperform rating is due to our expectations that ALTM will perform worse than peers.
Risk: Upside risks to our $45 TP and Underperform rating include better Alpine High execution at APA and higher earnings from the JV pipes.
Target Price and Rating Valuation Methodology and Risks: (12 months) for Cheniere Energy (LNG.A)
Method: Our Outperform rating and $116 target price for LNG are based on NPV analysis, implying a 10.65x EV/EBITDA multiple on our FY22 EBITDA estimate. We rate LNG Outperform as we expect it to appreciate more than its peers.
Risk: Downside risks to our Outperform rating and $116 target price for LNG are execution, global LNG oversupply, lower global LNG prices, higher US HH natural gas prices.
Target Price and Rating Valuation Methodology and Risks: (12 months) for Cheniere Energy Partners LP (CQP.A)
Method: Our Underperform rating and $39 target price for CQP are based on a 12.2x EV/EBITDA multiple on our FY22 EBITDA estimates. We rate CQP Underperform as we expect its total return to be below its peers.
Risk: Risks to our Underperform rating and $39 TP include: upside - better SPL-CMI SPA terms, a high-multiple buyout by LNG; downside - lower global LNG (liquefied natural gas) demand and prices, higher US HH (Henry Hub) natural gas prices, and a low-multiple buyout by LNG.
Target Price and Rating Valuation Methodology and Risks: (12 months) for DCP Midstream LP (DCP.N)
Method: Our Neutral rating and target price of $34 is NPV based, implying an 8.5x EV multiple on our FY22 EBITDA.
Risk: Risks to our $34 PT and Neutral rating include: Downside risks include lower NGL prices / demand, lower DJ production, ENB divestiture, and long-term Colorado legislation risk. The key upside risk is a stronger than expected recovery in commodity prices.
Target Price and Rating Valuation Methodology and Risks: (12 months) for MPLX LP (MPLX.N)
Method: Our Outperform rating and $35 target price for MPLX are based on 9.8x our FY22 EBITDA estimate. We rate MPLX Outperform as we expect its total return to exceed its peers.
Risk: Risks to our Outperform rating and $35 target price for MPLX include macro headwinds and potentially dilutive actions from the sponsor.
Target Price and Rating Valuation Methodology and Risks: (12 months) for New Fortress Energy (NFE.OQ)
Method: Our Outperform Rating and $38 TP is based on an NPV methodology. Our TP is based on ~10% discount rate and a return multiple of 3.0x long term.
Risk: Downside risks to our Outperform Rating and $38 TP include project delays, demand destruction, and slower commercial success.
Target Price and Rating Valuation Methodology and Risks: (12 months) for ONEOK Inc (OKE.N)
Method: Our Neutral rating and target price of $62 are based on an NPV analysis, implying a 11.1x EV multiple on our FY22 EBITDA estimate.
Risk: Risks to our $62 PT and Neutral rating include: Downside - lower NGL prices/demand and increased ethane rejection. Upside - a faster than anticipated return to growth in the Bakken.
Target Price and Rating Valuation Methodology and Risks: (12 months) for Targa Resources Corp (TRGP.N)
Method: We rate TRGP Outperform. Our $60 TP is based on an NPV analysis and implies a 9.3x EV multiple on our FY22 EBITDA estimate.
13 October 2021
US Midstream and MLPs 21
Risk: Risks to our $60 TP and Outperform rating include slower than expected Permian growth, greater than expected funding needs, lower NGL prices / demand, growing competition from private equity.
Target Price and Rating Valuation Methodology and Risks: (12 months) for Williams Companies Inc (WMB.N)
Method: Our Outperform rating and target price of $30 are based on our NPV methodology. Our NPV imputes a 9% discount rate.
Risk: Risks to our $30 TP and Outperform rating include: weaker-than-expected re-contracting on legacy assets, lower-than-expected production in the Appalachia and DJ, regulatory delays on Transco expansions, and expensive M&A.

13 October 2021
US Midstream and MLPs 22
Companies Mentioned (Price as of 12-Oct-2021) Altus Midstream Company (ALTM.OQ, $84.2, UNDERPERFORM[V], TP $45.0) Cheniere Energy (LNG.A, $102.52, OUTPERFORM, TP $116.0) Cheniere Energy Partners LP (CQP.A, $41.99, UNDERPERFORM, TP $39.0) DCP Midstream LP (DCP.N, $31.48, NEUTRAL[V], TP $34.0) MPLX LP (MPLX.N, $30.13, OUTPERFORM, TP $35.0) New Fortress Energy (NFE.OQ, $33.67, OUTPERFORM[V], TP $38.0) ONEOK Inc (OKE.N, $62.95, NEUTRAL, TP $62.0) Targa Resources Corp (TRGP.N, $53.77, OUTPERFORM[V], TP $60.0) Williams Companies Inc (WMB.N, $28.93, OUTPERFORM, TP $30.0)
Disclosure Appendix
Analyst Certification
I, Spiro Dounis, certify that (1) the views expressed in this report accurately reflect my personal views about all of the subject companies and securities and (2) no part of my compensation was, is or will be directly or indirectly related to the specific recommendations or views expressed in this report.
3-Year Price and Rating History for Altus Midstream Company (ALTM.OQ)
ALTM.OQ Closing Price Target Price
Date (US$) (US$) Rating
04-Jan-19 162.20 220.00 O *
28-Feb-19 122.40 180.00
17-Apr-19 108.40 160.00
19-Aug-19 51.60 80.00
16-Oct-19 45.80 70.00
31-Oct-19 44.00 50.00 N
11-Mar-20 20.40 30.00
01-Apr-20 13.35 10.00 U
11-Dec-20 45.99 45.00
* Asterisk signifies initiation or assumption of coverage.
O U T PERFO RM
N EU T RA L
U N D ERPERFO RM
3-Year Price and Rating History for Cheniere Energy (LNG.A)
LNG.A Closing Price Target Price
Date (US$) (US$) Rating
12-Nov-18 61.69 89.00 O
18-Dec-18 58.43 85.00
15-Jan-19 64.89 84.00
29-May-19 63.95 81.00
09-Sep-19 62.45 R
11-Sep-19 63.71 81.00 O
25-Nov-19 61.35 79.00
11-Mar-20 39.34 58.00
19-Nov-20 55.27 69.00
08-Mar-21 73.20 86.00
07-May-21 82.65 103.00
20-Jul-21 83.60 105.00
* Asterisk signifies initiation or assumption of coverage.
O U T PERFO RM
REST RICT ED

13 October 2021
US Midstream and MLPs 23
3-Year Price and Rating History for Cheniere Energy Partners LP (CQP.A)
CQP.A Closing Price Target Price
Date (US$) (US$) Rating
12-Nov-18 34.94 35.00 U
18-Dec-18 36.58 34.00
12-Mar-19 43.88 39.00
09-Sep-19 44.41 R
11-Sep-19 44.72 39.00 U
25-Nov-19 39.63 38.00
11-Mar-20 28.55 31.00 N
19-Nov-20 38.50 32.00 U
07-May-21 41.31 35.00
* Asterisk signifies initiation or assumption of coverage.
U N D ERPERFO RM
REST RICT ED
N EU T RA L
3-Year Price and Rating History for DCP Midstream LP (DCP.N)
DCP.N Closing Price Target Price
Date (US$) (US$) Rating
19-Nov-18 36.59 50.00 O
18-Dec-18 30.00 43.00
21-Feb-19 32.28 40.00
09-Jul-19 30.58 39.00
14-Aug-19 24.57 32.00
03-Oct-19 26.11 31.00
11-Nov-19 23.17 28.00
18-Feb-20 19.86 26.00
11-Mar-20 6.92 13.00
23-Mar-20 4.20 10.00
01-Apr-20 3.89 7.00 N
12-May-20 8.10 9.00
01-Jul-20 10.93 12.00
13-Aug-20 14.57 16.00
17-Dec-20 19.29 21.00
17-Feb-21 22.15 24.00
13-May-21 24.91 27.00
20-Jul-21 27.73 28.00
11-Aug-21 27.09 30.00
* Asterisk signifies initiation or assumption of coverage.
O U T PERFO RM
N EU T RA L
3-Year Price and Rating History for MPLX LP (MPLX.N)
MPLX.N Closing Price Target Price
Date (US$) (US$) Rating
26-Nov-18 32.78 45.00 O
15-Jan-19 33.20 44.00
12-Mar-19 33.67 39.00
09-Jul-19 31.89 38.00
12-Aug-19 26.97 33.00
19-Nov-19 22.63 29.00
10-Feb-20 22.39 25.00 N
11-Mar-20 15.41 21.00
01-Apr-20 11.40 18.00 O
13-May-20 17.34 22.00
17-Dec-20 22.98 28.00
27-May-21 28.74 34.00
* Asterisk signifies initiation or assumption of coverage.
O U T PERFO RM
N EU T RA L

13 October 2021
US Midstream and MLPs 24
3-Year Price and Rating History for New Fortress Energy (NFE.OQ)
NFE.OQ Closing Price Target Price
Date (US$) (US$) Rating
25-Feb-19 14.00 17.00 N *
28-May-19 12.91 16.00
18-Nov-19 15.36 17.00
11-Mar-20 11.02 16.00
08-Sep-20 31.89 28.00
10-Nov-20 35.04 37.00
26-Jan-21 44.84 50.00
24-Mar-21 48.11 52.00
02-Jun-21 41.92 50.00
19-Aug-21 27.64 34.00 O
* Asterisk signifies initiation or assumption of coverage.
N EU T RA L
O U T PERFO RM
3-Year Price and Rating History for ONEOK Inc (OKE.N)
OKE.N Closing Price Target Price
Date (US$) (US$) Rating
07-Nov-18 64.07 74.00 N
18-Dec-18 56.47 72.00
13-Mar-19 67.31 70.00
07-Aug-19 66.76 72.00
14-Jan-20 75.97 79.00
11-Mar-20 35.94 50.00 O
01-Apr-20 19.20 30.00
05-May-20 29.93 30.00 N
11-Jun-20 35.33 R
12-Jun-20 35.33 30.00 N
01-Jul-20 32.18 33.00
24-Jul-20 28.72 R
27-Jul-20 28.02 33.00 N
30-Oct-20 29.00 34.00
17-Dec-20 40.73 44.00
03-Mar-21 47.77 49.00
11-May-21 53.27 53.00
20-Jul-21 52.38 54.00
09-Aug-21 51.75 56.00
* Asterisk signifies initiation or assumption of coverage.
N EU T RA L
O U T PERFO RM
REST RICT ED

13 October 2021
US Midstream and MLPs 25
3-Year Price and Rating History for Targa Resources Corp (TRGP.N)
TRGP.N Closing Price Target Price
Date (US$) (US$) Rating
18-Dec-18 39.07 60.00 N
09-Jan-19 43.79 60.00 O
13-Mar-19 40.78 52.00
04-Apr-19 40.26 50.00
09-Jul-19 40.52 49.00
15-Aug-19 33.08 44.00
14-Jan-20 40.89 47.00
11-Mar-20 14.45 27.00
18-Mar-20 4.73 21.00
01-Apr-20 5.89 13.00 N
12-May-20 14.42 16.00
01-Jul-20 19.19 19.00
11-Aug-20 19.61 22.00
16-Nov-20 21.58 25.00 O
17-Dec-20 27.75 34.00
04-Mar-21 33.40 40.00
13-May-21 37.48 43.00
20-Jul-21 41.47 46.00
10-Aug-21 44.40 52.00
* Asterisk signifies initiation or assumption of coverage.
N EU T RA L
O U T PERFO RM
3-Year Price and Rating History for Williams Companies Inc (WMB.N)
WMB.N Closing Price Target Price
Date (US$) (US$) Rating
13-Nov-18 24.32 35.00 O
25-Feb-19 27.35 33.00
08-Aug-19 24.03 30.00
16-Oct-19 22.81 29.00
08-Nov-19 22.09 25.00
14-Jan-20 23.84 26.00
11-Mar-20 16.02 20.00
12-May-20 19.08 20.00 N
12-Aug-20 21.61 22.00
17-Dec-20 21.80 27.00 O
05-Mar-21 24.26 28.00
18-May-21 26.33 29.00
* Asterisk signifies initiation or assumption of coverage.
O U T PERFO RM
N EU T RA L
As of December 10, 2012 Analysts’ stock rating are defined as follows:
Outperform (O) : The stock’s total return is expected to outperform the relevant benchmark* over the next 12 months. Neutral (N) : The stock’s total return is expected to be in line with the relevant benchmark* over the next 12 months. Underperform (U) : The stock’s total return is expected to underperform the relevant benchmark* over the next 12 months. *Relevant benchmark by region: As of 10th December 2012, Japanese ratings are based on a stock’s total return relative to the analyst's coverage universe which consists of all companies covered by the analyst within the relevant sector, with Outperforms representing the most attractive, Neutrals the less at tractive, and Underperforms the least attractive investment opportunities. As of 2nd October 2012, U.S. and Canadian as well as Eur opean (excluding Turkey) ratings are based on a stock’s total return relative to the analyst's coverage universe which consists of all companies covered by the an alyst within the relevant sector, with Outperforms representing the most attractive, Neutrals the less attractive, and Underperforms the least attractive investment opportunities. For Latin America, Turkey and Asia (excluding Japan and Australia), stock ratings are based on a stock’s total return relative to the average to tal return of the relevant country or regional benchmark (India - S&P BSE Sensex Index); prior to 2nd October 2012 U.S. and Canadian ratings were based on (1) a stock’s absolute total return potential to its current share price and (2) the relative attractiveness of a stock’s total return potential within an analyst’s coverage universe. For Australian and New Zealand stocks, the expected total return (ETR) calculation includes 12-month rolling dividend yield. An Outperform rating is assigned where an ETR is greater than or equal to 7.5%; Underperform where an ETR less than or equal to 5%. A Neutral may be assigned where the ETR is between -5% and 15%. The overlapping rating range allows analysts to assign a rating that puts ETR in the context of associated risks. Prior to 18 May 2015, ETR ranges for Outperform and Underperform ratings did not overlap with Neutral thresholds between 15% and 7.5%, which was in operation from 7 July 2011.

13 October 2021
US Midstream and MLPs 26
Restricted (R) : In certain circumstances, Credit Suisse policy and/or applicable law and regulations preclude certain types of communications, including an investment recommendation, during the course of Credit Suisse's engagement in an investment banking transaction and in certain other circumstances. Not Rated (NR) : Credit Suisse Equity Research does not have an investment rating or view on the stock or any other securities related to the company at this time. Not Covered (NC) : Credit Suisse Equity Research does not provide ongoing coverage of the company or offer an investment rating or investment view on the equity security of the company or related products.
Volatility Indicator [V] : A stock is defined as volatile if the stock price has moved up or down by 20% or more in a month in at least 8 of the past 24 months or the analyst expects significant volatility going forward.
Analysts’ sector weightings are distinct from analysts’ stock ratings and are based on the analyst’s expectations for the fundamentals and/or valuation of the sector* relative to the group’s historic fundamentals and/or valuation: Overweight : The analyst’s expectation for the sector’s fundamentals and/or valuation is favorable over the next 12 months. Market Weight : The analyst’s expectation for the sector’s fundamentals and/or valuation is neutral over the next 12 months. Underweight : The analyst’s expectation for the sector’s fundamentals and/or valuation is cautious over the next 12 months. *An analyst’s coverage sector consists of all companies covered by the analyst within the relevant sector. An analyst may cov er multiple sectors.
Credit Suisse's distribution of stock ratings (and banking clients) is:
Global Ratings Distribution
Rating Versus universe (%) Of which banking clients (%) Outperform/Buy* 55% (32% banking clients)
Neutral/Hold* 34% (22% banking clients)
Underperform/Sell* 10% (20% banking clients)
Restricted 2%
Please click here to view the MAR quarterly recommendations and investment services report for fundamental research recommendations. *For purposes of the NYSE and FINRA ratings distribution disclosure requirements, our stock ratings of Outperform, Neutral, a nd Underperform most closely correspond to Buy, Hold, and Sell, respectively; however, the meanings are not the same, as our stock ratings are determined on a relative basis. (Please refer to definitions above.) An investor's decision to buy or sell a security should be based on investment objectives, current holdin gs, and other individual factors.
Important Global Disclosures
Credit Suisse’s research reports are made available to clients through our proprietary research portal on CS PLUS. Credit Suisse research products may also be made available through third-party vendors or alternate electronic means as a convenience. Certain research products are only made available through CS PLUS. The services provided by Credit Suisse’s analysts to clients may depend on a specific client’s preferences regarding the frequency and manner of receiving communications, the client’s risk profile and investment, the size and scope of the overall client relationship with the Firm, as well as legal and regulatory constraints. To access all of Credit Suisse’s research that you are entitled to receive in the most timely manner, please contact your sales representative or go to https://plus.credit-suisse.com . Credit Suisse’s policy is to update research reports as it deems appropriate, based on developments with the subject company, the sector or the market that may have a material impact on the research views or opinions stated herein. Credit Suisse's policy is only to publish investment research that is impartial, independent, clear, fair and not misleading. For more detail please refer to Credit Suisse's Policies for Managing Conflicts of Interest in connection with Investment Research: https://www.credit-suisse.com/sites/disclaimers-ib/en/managing-conflicts.html . Any information relating to the tax status of financial instruments discussed herein is not intended to provide tax advice or to be used by anyone to provide tax advice. Investors are urged to seek tax advice based on their particular circumstances from an independent tax professional. Credit Suisse has decided not to enter into business relationships with companies that Credit Suisse has determined to be involved in the development, manufacture, or acquisition of anti-personnel mines and cluster munitions. For Credit Suisse's position on the issue, please see https://www.credit-suisse.com/media/assets/corporate/docs/about-us/responsibility/banking/policy-summaries-en.pdf . The analyst(s) responsible for preparing this research report received compensation that is based upon various factors including Credit Suisse's total revenues, a portion of which are generated by Credit Suisse's investment banking activities
Please refer to the firm's disclosure website at https://rave.credit-suisse.com/disclosures/view/selectArchive for the definitions of abbreviations typically used in the target price method and risk sections.
See the Companies Mentioned section for full company names
Credit Suisse currently has, or had within the past 12 months, the following as investment banking client(s): WMB.N, CQP.A, ALTM.OQ, OKE.N, NFE.OQ, LNG.A Credit Suisse provided investment banking services to the subject company (WMB.N, CQP.A, ALTM.OQ, OKE.N, NFE.OQ, LNG.A) within the past 12 months. Within the last 12 months, Credit Suisse has received compensation for non-investment banking services or products from the following issuer(s): CQP.A, ALTM.OQ, NFE.OQ, LNG.A Credit Suisse has managed or co-managed a public offering of securities for the subject company (WMB.N, CQP.A, NFE.OQ, LNG.A) within the past 12 months. Within the past 12 months, Credit Suisse has received compensation for investment banking services from the following issuer(s): WMB.N, CQP.A, ALTM.OQ, NFE.OQ, LNG.A

13 October 2021
US Midstream and MLPs 27
Credit Suisse expects to receive or intends to seek investment banking related compensation from the subject company (WMB.N, CQP.A, ALTM.OQ, OKE.N, NFE.OQ, LNG.A, MPLX.N) within the next 3 months. Credit Suisse currently has, or had within the past 12 months, the following issuer(s) as client(s), and the services provided were non-investment-banking, securities-related: CQP.A, NFE.OQ, LNG.A Credit Suisse currently has, or had within the past 12 months, the following issuer(s) as client(s), and the services provided were non-investment-banking, non securities-related: CQP.A, ALTM.OQ, NFE.OQ, LNG.A Credit Suisse or a member of the Credit Suisse Group is a market maker or liquidity provider in the securities of the following subject issuer(s): ALTM.OQ, LNG.A, CQP.A, DCP.N, MPLX.N, NFE.OQ, OKE.N, TRGP.N, WMB.N A member of the Credit Suisse Group is party to an agreement with, or may have provided services set out in sections A and B of Annex I of Directive 2014/65/EU of the European Parliament and Council ("MiFID Services") to, the subject issuer (WMB.N, CQP.A, ALTM.OQ, OKE.N, NFE.OQ, LNG.A) within the past 12 months.
For date and time of production, dissemination and history of recommendation for the subject company(ies) featured in this report, disseminated within the past 12 months, please refer to the link: https://rave.credit-suisse.com/disclosures/view/report?i=655058&v=-2iky2xeprh2aes5c2cymcg163 .
Important Regional Disclosures
Credit Suisse Securities (China) Limited has obtained the qualification for securities investment consultancy business from China Securities Regulatory Commission. Singapore recipients should contact Credit Suisse AG, Singapore Branch for any matters arising from, or in connection with, this research report. Analysts who conduct site visits of covered issuers are not permitted to accept payment or reimbursement for travel expenses from the issuer for the site visit. For Credit Suisse Securities (Canada), Inc.'s policies and procedures regarding the dissemination of equity research, please visit https://www.credit-suisse.com/sites/disclaimers-ib/en/canada-research-policy.html. Investors should note that income from such securities and other financial instruments, if any, may fluctuate and that price or value of such securities and instruments may rise or fall and, in some cases, investors may lose their entire principal investment. To the extent any Credit Suisse equity research analyst employed by Credit Suisse International (a "UK Analyst") has interactions with a Spanish domiciled client of Credit Suisse AG or its affiliates, such UK Analyst will be acting for and on behalf of Credit Suisse Bank (Europe), S.A., with respect only to the provision of equity research services to Spanish domiciled clients of Credit Suisse AG or its affiliates. Pursuant to CVM Resolution No. 20/2021, of February 25, 2021, the author(s) of the report hereby certify(ies) that the views expressed in this report solely and exclusively reflect the personal opinions of the author(s) and have been prepared independently, including with respect to Credit Suisse. Part of the author(s)´s compensation is based on various factors, including the total revenues of Credit Suisse, but no part of the compensation has been, is, or will be related to the specific recommendations or views expressed in this report. In addition, Credit Suisse declares that: Credit Suisse has provided, and/or may in the future provide investment banking, brokerage, asset management, commercial banking and other financial services to the subject company/companies or its affiliates, for which they have received or may receive customary fees and commissions, and which constituted or may constitute relevant financial or commercial interests in relation to the subject company/companies or the subject securities. This research report is authored by: Credit Suisse Securities (USA) LLC ................................................................... Spiro Dounis ; Douglas Irwin ; Charles Bryant
Important disclosures regarding companies that are the subject of this report are available by calling +1 (877) 291-2683. The same important disclosures, with the exception of valuation methodology and risk discussions, are also available on Credit Suisse’s disclosure website at https://rave.credit-suisse.com/disclosures . For valuation methodology and risks associated with any recommendation, price target, or rating referenced in this report, please refer to the disclosures section of the most recent report regarding the subject company.

13 October 2021
US Midstream and MLPs 28
This report is produced by subsidiaries and affiliates of Credit Suisse operating under its Sustainability, Research & Investment Solutions Division. For more information on our structure, please use the following link: https://www.credit-suisse.com/who-we-are This report may contain material that is not directed to, or intended for distribution to or use by, any person or entity who is a citizen or resident of or located in any locality, state, country or other jurisdiction where such distribution, publication, availability or use would be contrary to law or regulation or which would subject Credit Suisse or its affiliates ("CS") to any registration or licensing requirement within such jurisdiction. All material presented in this report, unless specifically indicated otherwise, is under copyright to CS. None of the material, nor its content, nor any copy of it, may be altered in any way, transmitted to, copied or distributed to any other party, without the prior express written permission of CS. All trademarks, service marks and logos used in this report are trademarks or service marks or registered trademarks or service marks of CS or its affiliates.The information, tools and material presented in this report are provided to you for information purposes only and are not to be used or considered as an offer or the solicitation of an offer to sell or to buy or subscribe for securities or other financial instruments. CS may not have taken any steps to ensure that the securities referred to in this report are suitable for any particular investor. CS will not treat recipients of this report as its customers by virtue of their receiving this report. The investments and services contained or referred to in this report may not be suitable for you and it is recommended that you consult an independent investment advisor if you are in doubt about such investments or investment services. Nothing in this report constitutes investment, legal, accounting or tax advice, or a representation that any investment or strategy is suitable or appropriate to your individual circumstances, or otherwise constitutes a personal recommendation to you. Please note in particular that the bases and levels of taxation may change. Information and opinions presented in this report have been obtained or derived from sources believed by CS to be reliable, but CS makes no representation as to their accuracy or completeness. CS accepts no liability for loss arising from the use of the material presented in this report, except that this exclusion of liability does not apply to the extent that such liability arises under specific statutes or regulations applicable to CS. This report is not to be relied upon in substitution for the exercise of independent judgment. CS may have issued, and may in the future issue, other communications that are inconsistent with, and reach different conclusions from, the information presented in this report. Those communications reflect the different assumptions, views and analytical methods of the analysts who prepared them and CS is under no obligation to ensure that such other communications are brought to the attention of any recipient of this report. Some investments referred to in this report will be offered solely by a single entity and in the case of some investments solely by CS, or an associate of CS or CS may be the only market maker in such investments. Past performance should not be taken as an indication or guarantee of future performance, and no representation or warranty, express or implied, is made regarding future performance. Information, opinions and estimates contained in this report reflect a judgment at its original date of publication by CS and are subject to change without notice. The price, value of and income from any of the securities or financial instruments mentioned in this report can fall as well as rise. The value of securities and financial instruments is subject to exchange rate fluctuation that may have a positive or adverse effect on the price or income of such securities or financial instruments. Investors in securities such as ADR's, the values of which are influenced by currency volatility, effectively assume this risk. Structured securities are complex instruments, typically involve a high degree of risk and are intended for sale only to sophisticated investors who are capable of understanding and assuming the risks involved. The market value of any structured security may be affected by changes in economic, financial and political factors (including, but not limited to, spot and forward interest and exchange rates), time to maturity, market conditions and volatility, and the credit quality of any issuer or reference issuer. Any investor interested in purchasing a structured product should conduct their own investigation and analysis of the product and consult with their own professional advisers as to the risks involved in making such a purchase. Some investments discussed in this report may have a high level of volatility. High volatility investments may experience sudden and large falls in their value causing losses when that investment is realised. Those losses may equal your original investment. Indeed, in the case of some investments the potential losses may exceed the amount of initial investment and, in such circumstances, you may be required to pay more money to support those losses. Income yields from investments may fluctuate and, in consequence, initial capital paid to make the investment may be used as part of that income yield. Some investments may not be readily realisable and it may be difficult to sell or realise those investments, similarly it may prove difficult for you to obtain reliable information about the value, or risks, to which such an investment is exposed. This report may provide the addresses of, or contain hyperlinks to, websites. Except to the extent to which the report refers to website material of CS, CS has not reviewed any such site and takes no responsibility for the content contained therein. Such address or hyperlink (including addresses or hyperlinks to CS's own website material) is provided solely for your convenience and information and the content of any such website does not in any way form part of this document. Accessing such website or following such link through this report or CS's website shall be at your own risk.
This report is issued and distributed in European Union (except Germany and Spain): by Credit Suisse Securities (Europe) Limited, One Cabot Square, London E14 4QJ, England, which is authorised by the Prudential Regulation Authority and regulated by the Financial Conduct Authority and the Prudential Regulation Authority; Spain: Credit Suisse Bank (Europe), S.A. regulated by the Comision Nacional del Mercado de Valores; Germany: Credit Suisse (Deutschland) Aktiengesellschaft regulated by the Bundesanstalt fuer Finanzdienstleistungsaufsicht ("BaFin"). United States: Credit Suisse Securities (USA) LLC; Canada: Credit Suisse Securities (Canada), Inc.; Switzerland:
Credit Suisse AG; Brazil: Credit Suisse (Brasil) S.A. Corretora de Títulos e Valores Mobiliários or its affiliates; Mexico: Banco Credit Suisse (México), S.A., Institución de Banca Múltiple, Grupo Financiero Credit Suisse (México) and Casa de Bolsa Credit Suisse (México), S.A. de C.V., Grupo Financiero Credit Suisse (México) ("Credit Suisse Mexico"). This document has been prepared for information purposes only and is exclusively distributed in Mexico to Institutional Investors. Credit Suisse Mexico is not responsible for any onward distribution of this report to non-institutional investors by any third party. The authors of this report have not received payment or compensation from any entity or company other than from the relevant Credit Suisse Group company employing them; Japan: by Credit Suisse Securities (Japan) Limited, Financial Instruments Firm, Director-General of Kanto Local Finance Bureau ( Kinsho) No. 66, a member of Japan Securities Dealers Association, The Financial Futures Association of Japan, Japan Investment Advisers Association, Type II Financial Instruments Firms Association. This report has been prepared and issued for distribution in Japan to Credit Suisse’s clients, including institutional investors; People's Republic of China (for the purpose of this report only, except Hong Kong, Macau and Taiwan): Credit Suisse Securities (China) Limited, regulated by the China Securities Regulatory Commission; Hong Kong SAR: Credit Suisse (Hong Kong) Limited; Australia: Credit Suisse Equities (Australia) Limited; Thailand: Credit Suisse Securities (Thailand) Limited, regulated by the Office of the Securities and Exchange Commission, Thailand, having registered address at 990 Abdulrahim Place, 27th Floor, Unit 2701, Rama IV Road, Silom, Bangrak, Bangkok10500, Thailand, Tel. +66 2614 6000; Malaysia: Credit Suisse Securities (Malaysia) Sdn Bhd; Singapore: Credit Suisse AG, Singapore Branch; India: Credit Suisse Securities (India) Private Limited (CIN no.U67120MH1996PTC104392) regulated by the Securities and Exchange Board of India as Research Analyst (registration no. INH 000001030) and as Stock Broker (registration no. INZ000248233), having registered address at 9th Floor, Ceejay House, Dr.A.B. Road, Worli,
Mumbai - 18, India, T- +91-22 6777 3777; South Korea: Credit Suisse Securities (Europe) Limited, Seoul Branch; Taiwan (Chinese Taipei): Credit Suisse AG Taipei Securities Branch; Indonesia: PT Credit Suisse Sekuritas Indonesia; Philippines:Credit Suisse Securities (Philippines ) Inc., and elsewhere in the world by the relevant authorised affiliate of the above. Additional Regional Disclaimers Australia: Credit Suisse Securities (Europe) Limited ("CSSEL") and Credit Suisse International ("CSI") are authorised by the Prudential Regulation Authority and regulated by the Financial Conduct Authority ("FCA") and the Prudential Regulation Authority under UK laws, which differ from Australian Laws. CSSEL and CSI do not hold an Australian Financial Services Licence ("AFSL") and are exempt from the requirement to hold an AFSL under the Corporations Act (Cth) 2001 ("Corporations Act") in respect of the financial services provided to Australian wholesale clients (within the meaning of section 761G of the Corporations Act) (hereinafter referred to as “Financial Services”). This material is not for distribution to retail clients and is directed exclusively at Credit Suisse's professional clients and eligible counterparties as defined by the FCA, and wholesale clients as defined under section 761G of the Corporations Act. Credit Suisse (Hong Kong) Limited ("CSHK") is licensed and regulated by the Securities and Futures Commission of Hong Kong under the laws of Hong Kong SAR, which differ from Australian laws. CSHKL does not hold an AFSL and is exempt from the requirement to hold an AFSL under the Corporations Act in respect of providing Financial Services. Investment banking services in the United States are provided by Credit Suisse Securities (USA) LLC, an affiliate of Credit Suisse Group. CSSU is regulated by the United States Securities and Exchange Commission under United States laws, which differ from Australian laws. CSSU does not hold an AFSL and is exempt from the requirement to hold an AFSL under the Corporations Act in respect of providing Financial Services. Credit Suisse Asset Management LLC (CSAM) is authorised by the Securities and Exchange Commission under US laws, which differ from Australian laws. CSAM does not hold an AFSL and is exempt from the requirement to hold an AFSL under the Corporations Act in respect of providing Financial Services. This material is provided solely to Institutional Accounts (as defined in the FINRA rules) who are Eligible Contract Participants (as defined in the US Commodity Exchange Act). Credit Suisse Equities (Australia) Limited (ABN 35 068 232 708) ("CSEAL") is an AFSL holder in Australia (AFSL 237237). Malaysia: Research provided to residents of Malaysia is authorised by the Head of Research for Credit Suisse Securities (Malaysia) Sdn Bhd, to whom they should direct any queries on +603 2723 2020. Singapore: This report has been prepared and issued for distribution in Singapore to institutional investors, accredited investors and expert investors (each as defined under the Financial Advisers Regulations) only, and is also distributed by Credit Suisse AG, Singapore Branch to overseas investors (as defined under the Financial Advisers Regulations). Credit Suisse AG, Singapore Branch may distribute reports produced by its foreign entities or affiliates pursuant to an arrangement under Regulation 32C of the Financial Advisers Regulations. Singapore recipients should contact Credit Suisse AG, Singapore Branch at +65-6212-2000 for matters arising from, or in connection with, this report. By virtue of your status as an institutional investor, accredited investor, expert investor or overseas investor, Credit Suisse AG, Singapore Branch is exempted from complying with certain compliance requirements under the Financial Advisers Act, Chapter 110 of Singapore (the “FAA”), the Financial Advisers Regulations and the relevant Notices and Guidelines issued thereunder, in respect of any financial advisory service which Credit Suisse AG, Singapore Branch may provide to you. EU: This report has been produced by subsidiaries and affiliates of Credit Suisse operating under its Sustainability, Research & Investment Solutions Division. In jurisdictions where CS is not already registered or licensed to trade in securities, transactions will only be effected in accordance with applicable securities legislation, which will vary from jurisdiction to jurisdiction and may require that the trade be made in accordance with applicable exemptions from registration or licensing requirements. This material is issued and distributed in the U.S. by CSSU, a member of NYSE, FINRA, SIPC and the NFA, and CSSU accepts responsibility for its contents. Clients should contact analysts and execute transactions through a Credit Suisse subsidiary or affiliate in their home jurisdiction unless governing law permits otherwise. CS may provide various services to US municipal entities or obligated persons ("municipalities"), including suggesting individual transactions or trades and entering into such transactions. Any services CS provides to municipalities are not viewed as "advice" within the meaning of Section 975 of the Dodd-Frank Wall Street Reform and Consumer Protection Act. CS is providing any such services and related information solely on an arm's length basis and not as an advisor or fiduciary to the municipality. In connection with the provision of the any such services, there is no agreement, direct or indirect, between any municipality (including the officials,management, employees or agents thereof) and CS for CS to provide advice to the municipality. Municipalities should consult with their financial, accounting and legal advisors regarding any such services provided by CS. In addition, CS is not acting for direct or indirect compensation to solicit the municipality on behalf of an unaffiliated broker, dealer, municipal securities dealer, municipal advisor, or investment adviser for the purpose of obtaining or retaining an engagement by the municipality for or in connection with Municipal Financial Products, the issuance of municipal securities, or of an investment adviser to provide investment advisory services to or on behalf of the municipality. If this report is being distributed by a financial institution other than Credit Suisse AG, or its affiliates, that financial institution is solely responsible for distribution. Clients of that institution should contact that institution to effect a transaction in the securities mentioned in this report or require further information. This report does not constitute investment advice by Credit Suisse to the clients of the distributing financial institution, and neither Credit Suisse AG, its affiliates, and their respective officers, directors and employees accept any liability whatsoever for any direct or consequential loss arising from their use of this report or its content. No information or communication provided herein or otherwise is intended to be, or should be construed as, a recommendation within the meaning of the US Department of Labor’s final regulation defining "investment advice" for purposes of the Employee Retirement Income Security Act of 1974, as amended and Section 4975 of the Internal Revenue Code of 1986, as amended, and the information provided herein is intended to be general information, and should not be construed as, providing investment advice (impartial or otherwise). Copyright © 2021 CREDIT SUISSE AG and/or its affiliates. All rights reserved. When you purchase non-listed Japanese fixed income securities (Japanese government bonds, Japanese municipal bonds, Japanese government guaranteed bonds, Japanese corporate bonds) from CS as a seller, you will be requested to pay the purchase price only.