march 22, 2015 with charts
TRANSCRIPT

Jeanette Schwarz Young, CFP®, CMT, M.S.
Jordan Young, CMT
83 Highwood Terrace
Weehawken, New Jersey 07086
www.OptnQueen.com
March 22, 2015
The Option Queen Letter
By the Option Royal
The Federal Reserve has signaled that for now, rate increases are on hold. More over the Federal
Reserve is signaling to us that it is too transparent and that it might just revert to fewer sound-
bites in the future. Why? Well maybe because these scholars have discovered that their policies
are not working and that perhaps they need to rethink their plan. Naturally, they cannot publicly
say that they need to rethink the policy.
Remember that when the Federal Reserve ended its asset purchases it put a floor under the US
Dollar and by its actions, announcing a possible interest rate increase, caused a massive rally in
the US Dollar. Lest we forget the Federal Reserve has also drained bonds from the market which
has caused less supply and higher prices… Now, this august group is back peddling, removing a
word here and there and showing concern about slowing growth. Duh, a higher US Dollar
caused our multinationals a major problem on exports. And we wonder why we are getting all
those earnings warnings? With the Federal Reserve’s current action, they apparently tried to
chop the legs off from under the US Dollar’s rally.
Is there nobody on the Federal Reserve Board that sees that flushing the market with cheap
money only helps those with money? The average worker is paying more for food and housing
and making less money, when including inflation, than the average worker made in 1970…..Oh
well! Meantime retirees are scrambling to find investments with enough yield to support their
needs. Certainly one can’t get enough safe secure yield to provide enough income on which to
survive with rates near zero. As the investors go further out on the yield curve their risk
increases and that is why most retirees will keep the barbell portfolio of bonds short. This causes
them to look at high yielding securities as a substitute for the bonds, or a purchase of debt
instruments that have greater risk. Here is where further higher risk enters the picture. These
same yield seeking retirees cannot afford to lose value on their investments because they simply
might not have enough time left on earth to recoup those losses.
Speaking of the strong US Dollar, one might believe that now is the time to go to Europe on
vacation. After all, oil prices are seeking a bottom and the US Dollar is soaring like bird so thing
should be a bargain. Think again. The airlines are jacking up their fares, when compared to last
year’s fairs and hotel costs? It might be cheaper to get a room in New York City than in Paris
and New York City is anything but cheap. What happened here? Are the airlines brining all the
extra cash to their bottom lines? Cheaper fuel costs and strong US Dollar should reduce ticket
costs on US carriers not increase them…..did we miss something here?

In case anybody has forgotten, last week was a quadruple witch expiration. We generally see
gyrations above normal on these quarterly expirations, last week did not disappoint.
The S&P 500 gained 0.88% in the Friday session adding 18.25 handles (points) finishing the day
near the highs of February. The action this past week was clearly to the upside with some jagged
action in between the up days. All the indicators that we follow herein continue to point higher
and do have room to the upside. The volume did recede in the Friday session but was about
average. We are above the Ichimoku Clouds for all time-frames. The 5-period exponential
moving average is 2088.27. The top of the Bollinger Band, which is flattening out, is 2133.29
and the bottom edge is seen at 2041.60. The upward trending channel lines are 2118.75 and
2067.50. The most frequently traded price was 2100 which accounted for 15.2% of the day’s
volume. The Market Profile chart shows us that 2083.75 traded in more brackets but with
minuscule volume and only in the overnight session. The daily 1% by 3-box point and figure
chart has an upside target of 2371.33. This chart remains positive with no current downtrend
lines. The 60 minute 0.1% by 3-box chart is also positive. We continue to suggest that you
employ tight trailing stops on your positions.


The NASDAQ 100 rallied in the Friday session, thank you Biogen Idec for that extra boost. This
stock gained 9.76% and offered a spillover effect to other biotech companies. This index gained

0.62% on the day and tacking on 27.50 handles (price). We came very close to the March 2nd
highs. All the indicators that we follow herein continue to point high with some room to the
upside. The 5-period exponential moving average is 4417.80. The top of the Bollinger Band is
4517.61 and the lower edge is seen at 4306.15. The upward pointing channel lines are 4476.00
and 4371.68. The most frequently traded prices were 4422, which accounted for 28.2% of the
day’s volume and 4419, which accounted for 28% of the day’s volume. The daily 1% by 3-box
point and figure chart has a recent activated downside target of 3978.36. We see no recent
downtrend lines. The 60 minute 0.1% by 3-box chart tells us a different story. This chart is very
positive and has an upside target of 4632.17. We continue to suggest a trailing stop for all long
positions in this index.


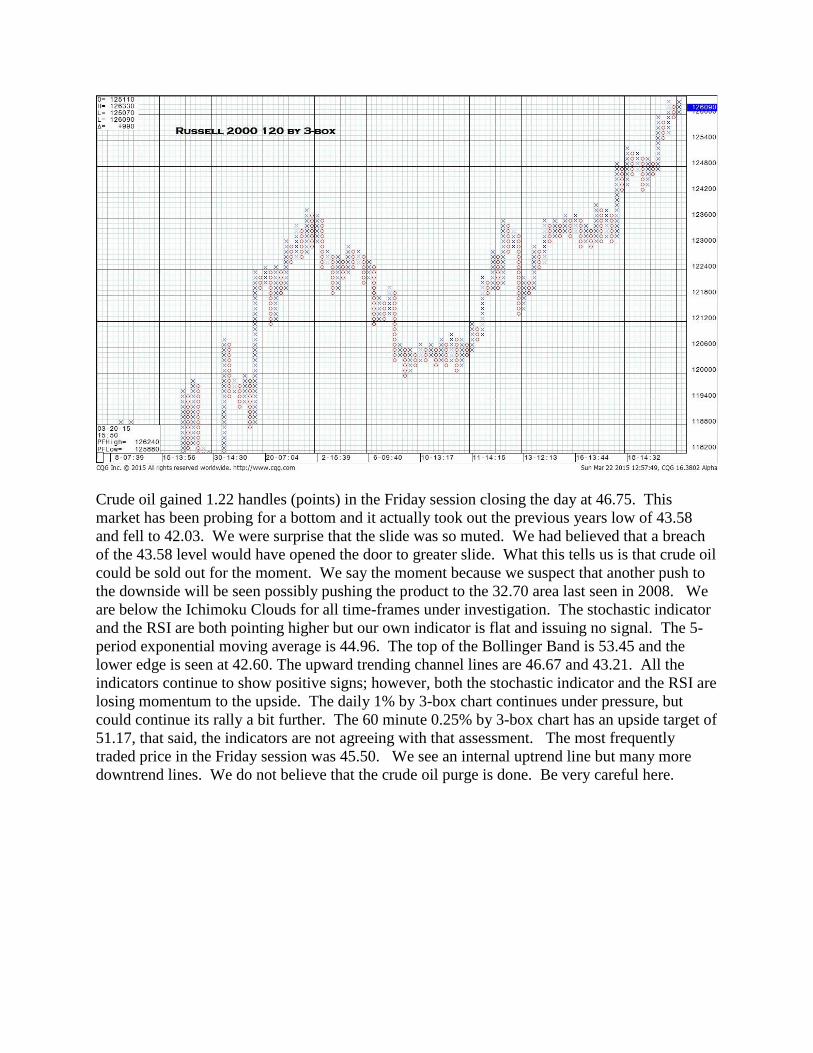
The Russell 2000 rallied for the entire expiration week. The market gained 10 handles (points),
printing a new life-of-contract high. Unfortunately, the volume declined for three of the last
session. The 5-period exponential moving average is 1250.88. The top of the Bollinger Band is
1258.72 and the lower edge is seen at 1210.26. The upward trending channel lines are 1276.56
and 1247.03. We are above the Ichimoku Clouds for all time-frames. The most frequently
traded price was 1261, which accounted for 22.2% of the day’s volume. The point and figure
120 by 3-box chart is very bullish. As to the indicators, both the stochastic indicator and our
own indicator are curling over but have not issued a sell-signal. The RSI continues to power
higher. It is exceedingly likely that this index will retreat to 1243.60 and1239.10 level and test
for support at these levels. We would proceed with extreme caution in this index.


Crude oil gained 1.22 handles (points) in the Friday session closing the day at 46.75. This
market has been probing for a bottom and it actually took out the previous years low of 43.58
and fell to 42.03. We were surprise that the slide was so muted. We had believed that a breach
of the 43.58 level would have opened the door to greater slide. What this tells us is that crude oil
could be sold out for the moment. We say the moment because we suspect that another push to
the downside will be seen possibly pushing the product to the 32.70 area last seen in 2008. We
are below the Ichimoku Clouds for all time-frames under investigation. The stochastic indicator
and the RSI are both pointing higher but our own indicator is flat and issuing no signal. The 5-
period exponential moving average is 44.96. The top of the Bollinger Band is 53.45 and the
lower edge is seen at 42.60. The upward trending channel lines are 46.67 and 43.21. All the
indicators continue to show positive signs; however, both the stochastic indicator and the RSI are
losing momentum to the upside. The daily 1% by 3-box chart continues under pressure, but
could continue its rally a bit further. The 60 minute 0.25% by 3-box chart has an upside target of
51.17, that said, the indicators are not agreeing with that assessment. The most frequently
traded price in the Friday session was 45.50. We see an internal uptrend line but many more
downtrend lines. We do not believe that the crude oil purge is done. Be very careful here.


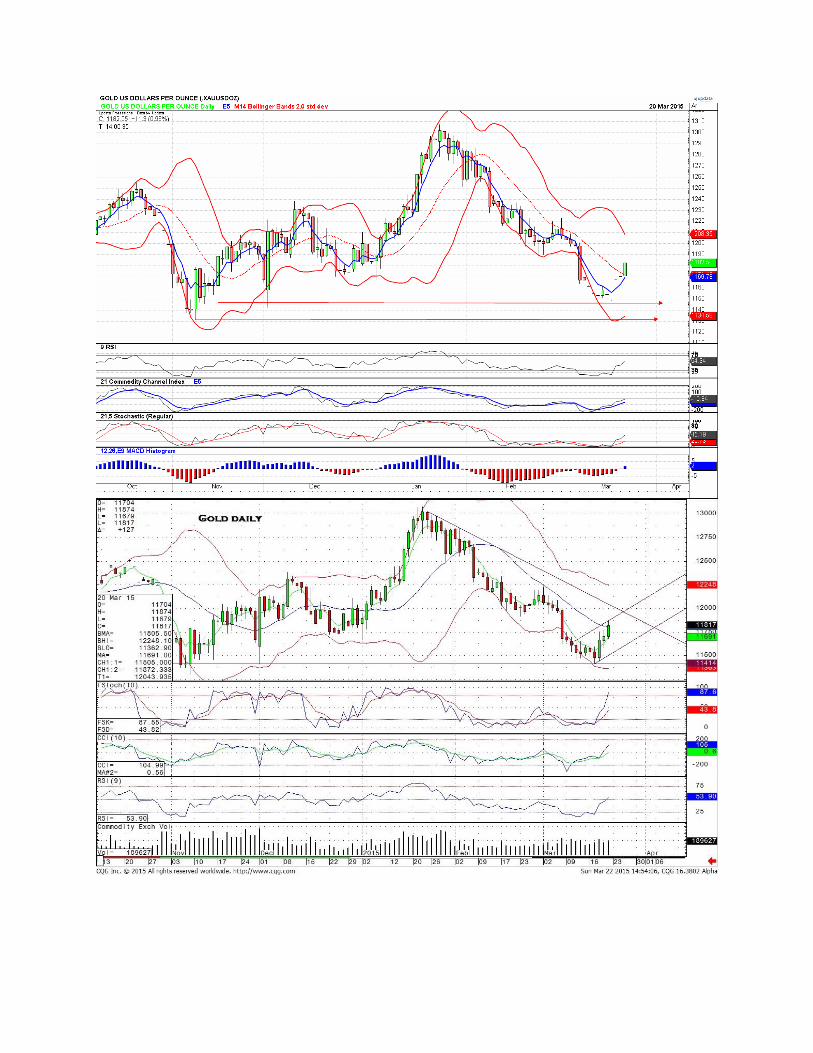
Gold rallied in the Friday session adding 12.70 handles (points). The 5-period exponential
moving average is 1169.10. The top of the Bollinger Band is 1224.81 and the lower edge is seen
at 1136.29. The downtrend line is 1204.39. Until or unless this downtrend line is removed, the
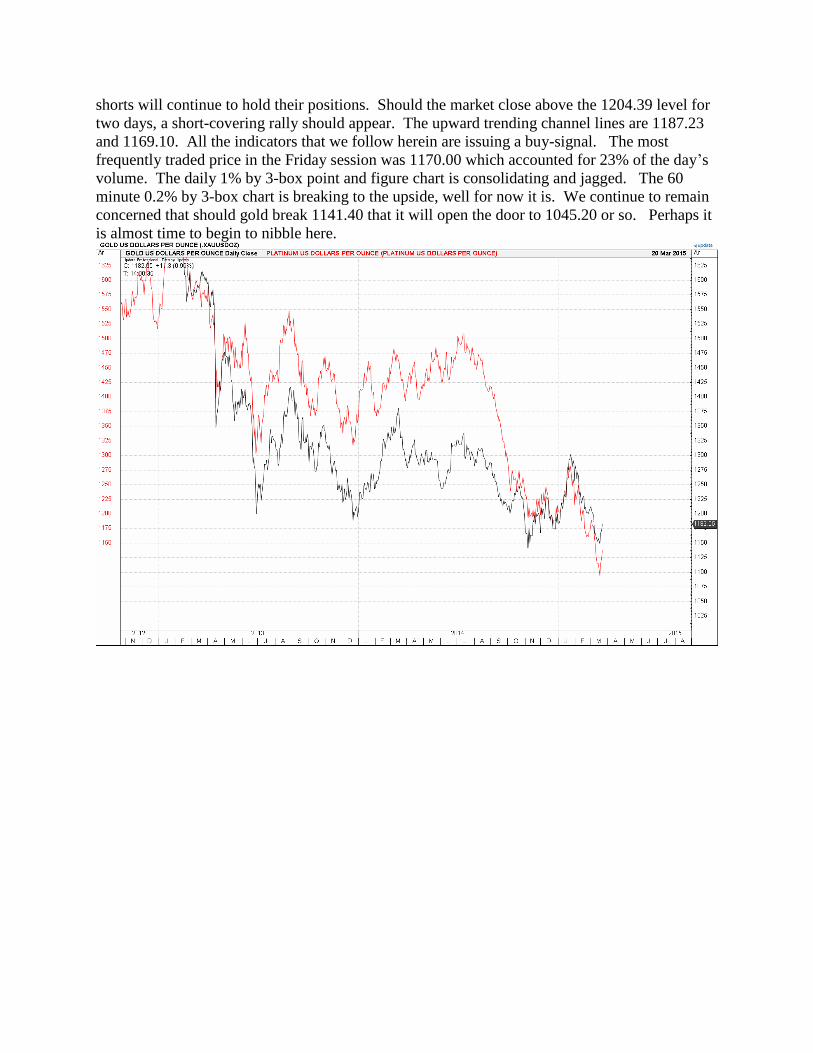
shorts will continue to hold their positions. Should the market close above the 1204.39 level for
two days, a short-covering rally should appear. The upward trending channel lines are 1187.23
and 1169.10. All the indicators that we follow herein are issuing a buy-signal. The most
frequently traded price in the Friday session was 1170.00 which accounted for 23% of the day’s
volume. The daily 1% by 3-box point and figure chart is consolidating and jagged. The 60
minute 0.2% by 3-box chart is breaking to the upside, well for now it is. We continue to remain
concerned that should gold break 1141.40 that it will open the door to 1045.20 or so. Perhaps it
is almost time to begin to nibble here.

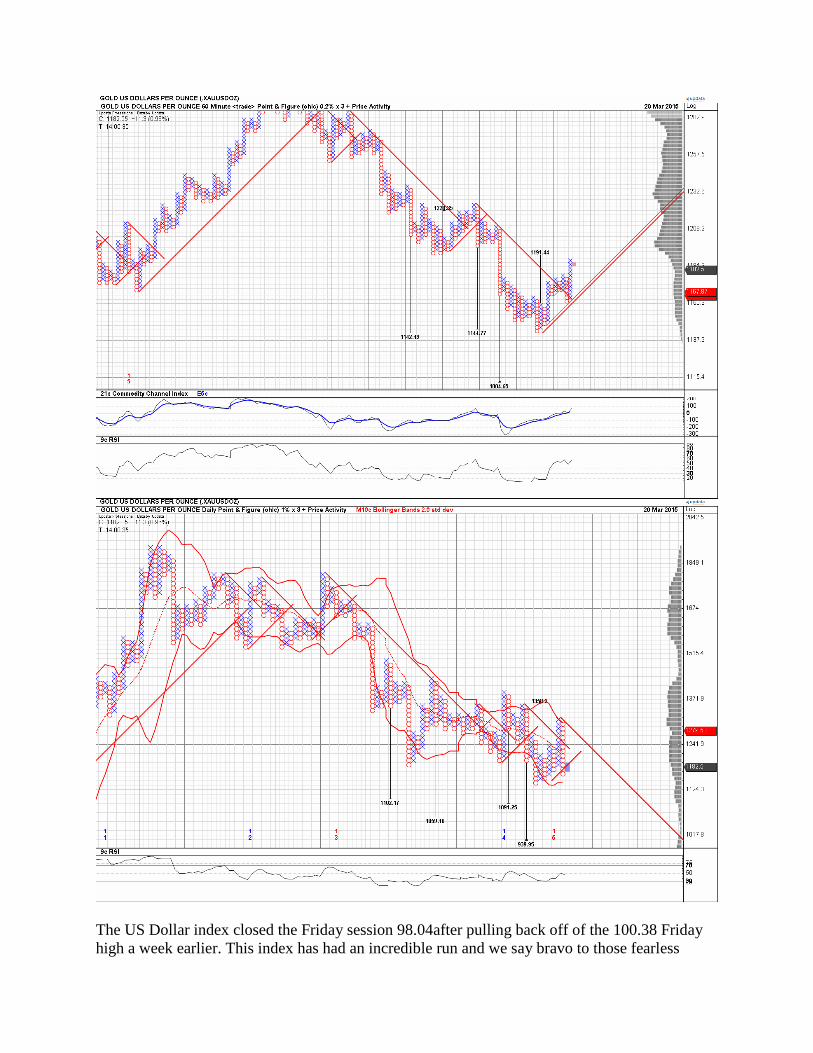
The US Dollar index closed the Friday session 98.04after pulling back off of the 100.38 Friday
high a week earlier. This index has had an incredible run and we say bravo to those fearless

traders who went long near 20 points ago. The upper Bollinger band is 101.20, the lower band is
93.31 and the bands are contracting. The 5-period exponential moving average is 98.72 which
the index is currently below, and the 20-period simple moving average is 97.25, which the index
is currently above. The RSI is point lower and our own indicator is point up but has not issued a
buy signal as of yet.
On the daily chart we see resistance above at 99.72 followed by 101.92. Below, support is all the
way back at 95.85 and below that at 93.65. The 30 minute .05 x 3 point and figure chart shows
this index is still in an uptrend although counter trend internal trend-lines have formed. There is
an activated upside target at 100.90, and activated downside targets at 95 even and 95.20. This
index will pull back, likely to at least 95.85, although we would expect the index to pull into the
93.65-95.85 channel. Remember, nothing goes straight up or straight down.
Risk Trading Futures, Options on Futures, and retail off-exchange foreign currency transactions
involves substantial risk of loss and is not suitable for all investors. You should carefully
consider whether trading is suitable for you in light of your circumstances, knowledge, and
financial resources. You may lose all or more of your initial investment