march 15, 2015 with charts
TRANSCRIPT

Jeanette Schwarz Young, CFP®, CMT, M.S.
Jordan Young, CMT
83 Highwood Terrace
Weehawken, New Jersey 07086
www.OptnQueen.com
March 15, 2015
The Option Queen Letter
By the Option Royals
It feels as though spring is in the air. Allergy season is upon us and although we sniff and sneeze
a lot more, we are really happy to see the snow melt away. The green shoots on Wall Street,
which generally accompany the beginning of spring, seem to be having some trouble this year.
Perhaps Wall Street needs more time to thaw.
The front month for the financial indices is now June. The talk of the FOMC raising rates in
June is illogical. The US Dollar has been in rally mode in anticipation of a rate rise. This strong
US Dollar is putting a lot of pressure on many multi-nationals as they fight for export market
share. On the other hand, our strong dollar makes imports cheaper to us and, along with cheaper
fuel costs, is aiding the average struggling wage earner. That said, the stuff that is going up in
price such as food, taxes, utilities, education, funerals etc. is never calculated by the government
in their inflation studies. These increased costs have hampered that average wage earner, a fact
that can be seen in recent retail sales figures.
There is a striking difference between the action in the S&P 500 futures contract and the Russell
2000 futures contract. The S&P 500 has retraced 38% of the gain seen since February 2, 2015
while the Russell 2000 is positioning itself to challenge the recent life of contract high seen on
March 2, 2015. The Russell 2000 lost 2.5 handles (points) in the Friday session while the S&P
500 lost 13.25. Are these differences reflecting the fact that Russell 2000 companies do not rely
as heavily on exports as do companies in the S&P 500? The strength in the US currency should
motivate foreign money to our shores for not only our higher interest rates payout but also our
equity markets.
The S&P 500 lost 13.265 points in the Friday session printing a lower low and a lower high. The
downtrend line is 2056.45 and a longer term line at 2084.16. The 5-period exponential moving
average is 2058.95. The top of the Bollinger Band is 2135.51 and the lower edge is seen at
2044.45. The 50 day-moving average 2054.52 and we closed below that level. If we do not see
a bounce here, then the door will be open to lower levels and perhaps, some of the player will
become concerned. Right now, even though we have had some hefty down days the
complacency level is very high. The buy-the-dips crowd has learned that most of the market

downside fits are followed by rallies and even new highs.
Well, that has worked in the past but there is no guarantee that it will work tomorrow and, it
certainly will not work forever. In the spirit of that thought we suggest that stops be tight. We
are above the Ichimoku Clouds for all time-frames. The stochastic indicator is issuing a fresh
sell-signal at oversold levels, our own indicator will issue a signal in a day or two if, we stay on
this path. The RSI is pointing lower. The only good news for this market is, that the volume in
the Friday session declined. The downward trending channel lines are 2075.90 and 2024.92.
The daily 1% by 3-box point and figure chart remains positive. The 60 minute 0.1% by 3-box
chart has a downside target of 1968.86 and an upside target of 2057.38. This chart is not very
positive. The 30 minute Market Profile chart is bimodal. The most frequently traded price was
2058. About 80% of the day’s trades were to the downside with the volume trailing off as the
market recovered from the lows.


The NASDAQ 100 retreated 19.25 handles (points) in the Friday session expanding the upside
just a tad and expanding the downside, in other words the range of the Friday session was greater
than that of the Thursday session. The volume did fall off in the Friday session. The 5-period
exponential moving average is 4341.51. The top of the Bollinger Band is 4511.73 and the lower
edge is seen at 4308.13. The Bollinger Bands seem to be beginning to expand again. The
stochastic indicator has just issued a sell-signal and the RSI is pointing lower. The low of the
day touched the 50% retracement level then closed at the 38% retracement level by the end of
the day. The NASDAQ 100 did close below the 50-day moving average. We are above the
Ichimoku Clouds for all time-frames. The most frequently traded price in the Friday session was
4329. The down trending channel lines are 4423 and 4291.75. The daily 1% by 3-box point and
figure chart remains bullish with an upside target of 4711.59. The 60 minute 0.1% by 3-box
point and figure chart has a downside target of 4187.38. We will likely see some increased
volatility as the March futures and options expire this week. Fasten your seat belts for this one.


The Russell 2000 presented a very strong chart in the Friday session clearly rejecting the low
print, which was higher than the Thursday low, and closing with a very modest loss of 2.50. The
volume was robust for the last three days of the week either reflecting the roll from the March to

the June futures or interest in this small capitalization index. The most frequently traded price in
the Friday session was 1234. The highest volume was seen at 1227, which accounted for 12.9%
of the day’s volume. The 5-period exponential moving average was 1228.41. The top of the
Bollinger Band was 1243.08 and the lower edge was seen at 1213.61. The Bollinger Bands are
contracting slightly and flattening. We are above the Ichimoku Clouds for all time-frames.

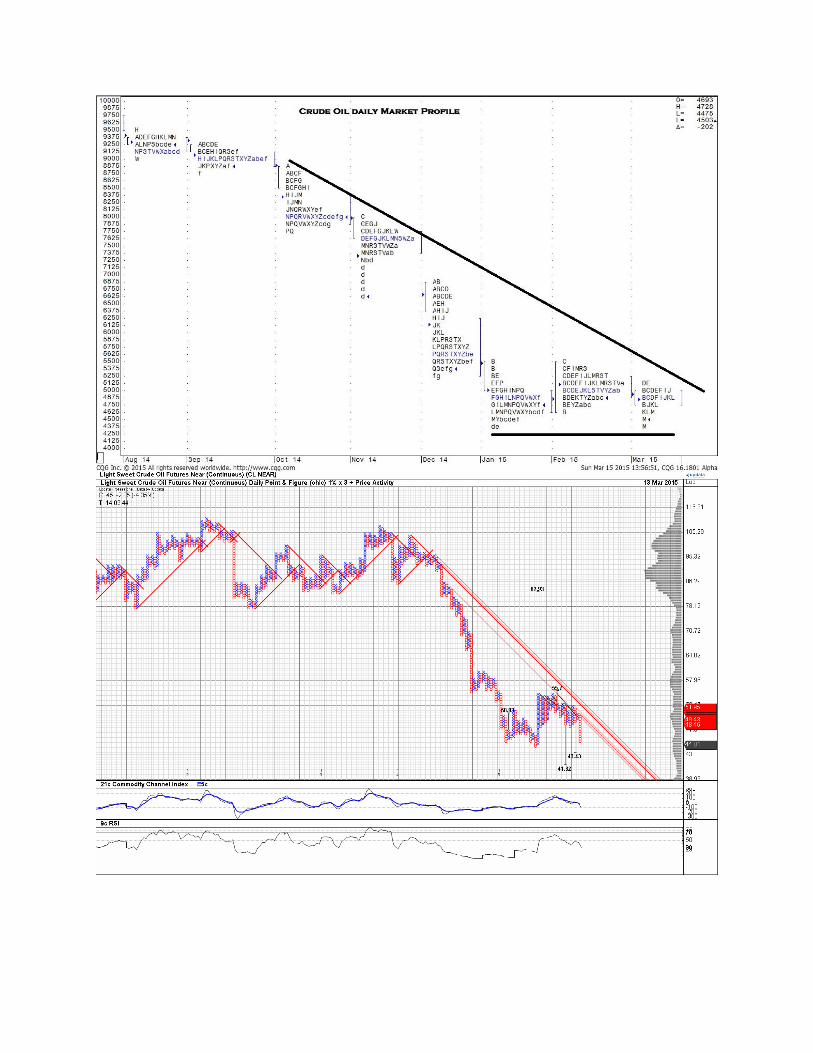
Crude Oil retreated 2.05 handles (points) in the Friday session losing more than 4% on the day.
The low of 43.58 printed on January 29, 2015 is just one sell program away and beneath that
level, 33.55 and 32.70. The 5-period exponential moving average is 47.34. The top of the
Bollinger Band is 53.51 and the lower edge is seen at 46.25. We closed below the lower edge of
the Bollinger band and, what is worse, this market closed almost at the low of the day. The
volume has been steady and strong. All the indicators that we follow herein continue to point
lower albeit at oversold levels. The daily 1% by 3-box point and figure chart has a downside
target of 43.43 and an old target of 41.32. In sum and substance, this chart looks lousy. The 60
minute 0.1% by 3-box point and figure chart has an upside target of 45.43 and a bunch of
internal downtrend lines. The most frequently traded price in the Friday session was 47.00. We
will stand aside and wait to see if the recent 43.58 low holds.


Gold closed higher in the narrowly traded Friday session. The 5-period exponential moving
average is 1161.32. The top of the Bollinger Band is 1236.50 and the lower edge is seen at
1147.52. The downward trending channel lines are 1203.10 and 1140.82. The volume receded
in this session. All the indicators that we follow herein are issuing a buy-signal from oversold
levels. Just as a side note, when we say that the indicators are issuing a buy-signal, it does not
mean that you should run out and buy gold. It is a warning shot across the bow for the shorts to
heed. It is telling you that something appears to be changing and that you should pay attention to
the trade. At the moment, the trend is down although we are close to the bottom of the channel
line. Generally this would indicate to us that we might just bounce a bit here. We have
horizontal support at 1141.70 and then at 1130.40. The 60 minute 0.2% by 3-box point and
figure chart has an upside target of 1184.32. We do have downtrend line on this chart indicating
to us, that the action needs to be watched. The daily 1% by 3-box point and figure chart looks
as though this market is trying to consolidate. The most frequently traded price in the Friday
session was 1152.50. Just a word about platinum, as you know, platinum historically during
economic expansion cycles trades at a premium to gold. During periods of economic contraction
or collapses in the crude market platinum can and does trade below the price of gold. As we
have been pointing this out to you for a short while, the action is noteworthy. It is not yet clear if
this behavior of platinum is all crude related or perhaps is warning us that we could be in for a
ruff spot in our economy. This hasn’t become clear yet but should be watched.


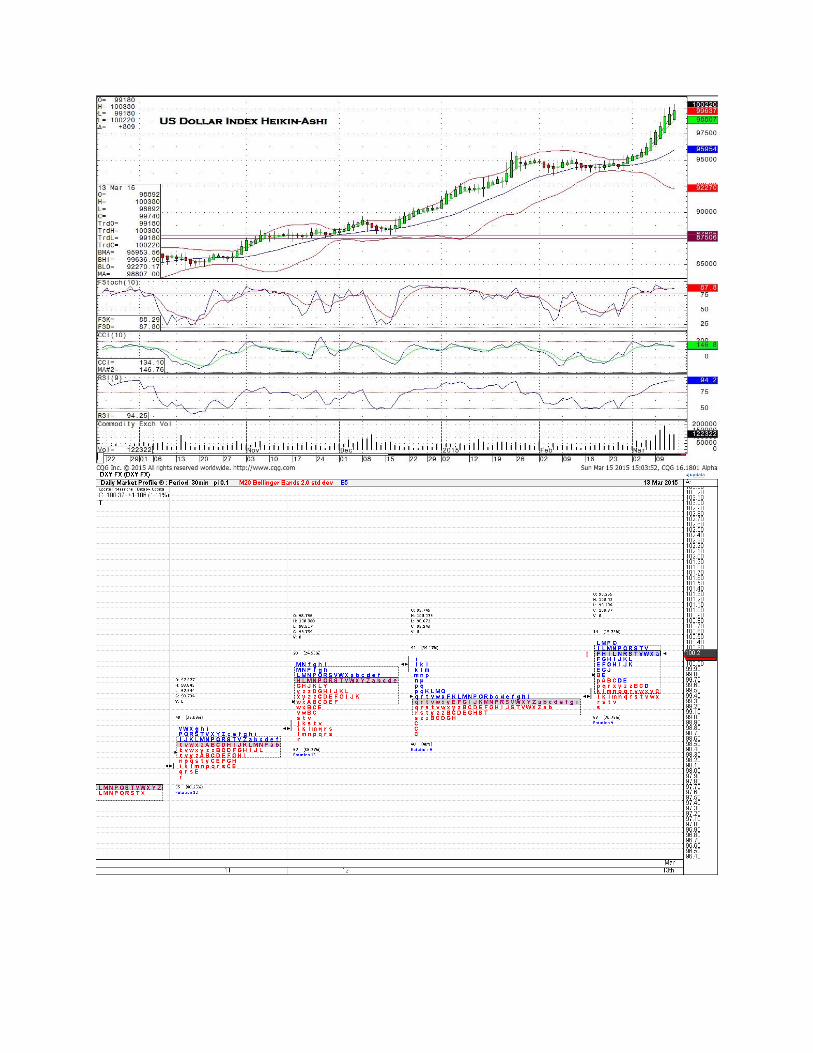
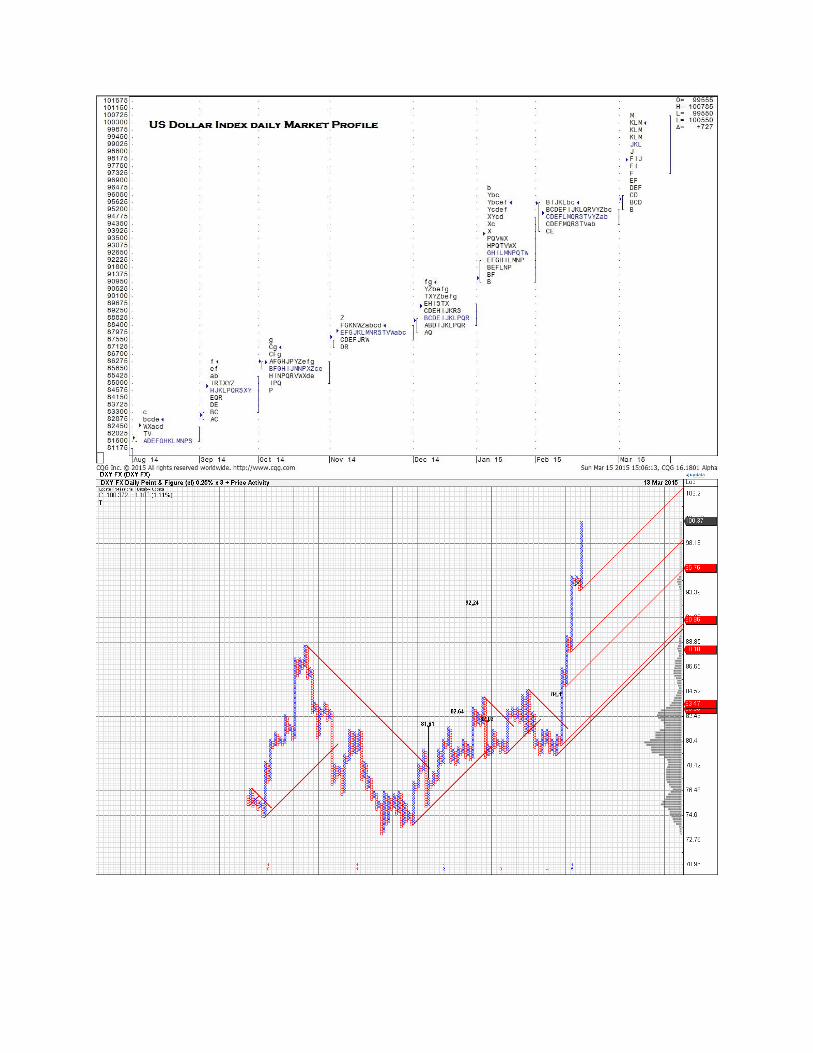
The US Dollar Index close up .809 in the Friday session. We are overbought and both the RSI
and the stochastic indicators are pointing higher. We have been overbought since the end of
February and as you know, we can remain overbought for longer than you might expect. The 5-
period exponential moving average is 99.083. The top of the Bollinger Band is 100.020 and the
lower edge is seen at 92.194. We closed above the upper Bollinger Band. The market moved
higher on good volume. Unfortunately, there are too many bulls in this market and eventually
the market will spill. The most frequently traded price was 99.750. The daily 0.25% by 3-box
point and figure chart is extremely bullish and has an upside target of 112.63. The 60 minute
0.25% by 3-box point and figure chart also has an upside target of 112.63. The heaviest volume,
15.5% of the day’s volume, was seen at 99.525. We sure would not be short this index but we
are a bit concerned that it is becoming a bit frothy. Trade with caution.


Risk Trading Futures, Options on Futures, and retail off-exchange foreign currency transactions
involves substantial risk of loss and is not suitable for all investors. You should carefully
consider whether trading is suitable for you in light of your circumstances, knowledge, and
financial resources. You may lose all or more of your initial investment