march 27, 2016.docx with charts
TRANSCRIPT

Option Queen Letter By the Option Royals
Jeanette Young, CFP®, CMT, M.S. and Jordan Young, CMT
4305 Pointe Gate Drive
Livingston, New Jersey 07039
www.OptnQueen.com
March 27, 2016
There will be no Option Queen Letter next week.
The thrust of the excuses for the market's current behavior is that it is all the fault of crude
oil!!!!! Nice try, but what the pundits are forgetting is that the strong US Dollar puts significant
pressure on the price of crude oil. Crude oil does not trade in isolation and affects other
industries including the transportation index. What is forgotten is that for every reaction there
are multiple other reactions. No product trades in isolation. Yes, a strong US Dollar causes
earnings declines…..but who is saying that? When the Federal Reserve’s governors are dovish,
the US Dollar declines and when they are hawkish the US Dollar rallies. Crude oil is traded in
US Dollars and thus its price declines on a strong dollar and rallies on a weak one. Further, the
cost of the debt associated with some of the oil company bonds moves with interest rates. The
rails, which transport much of our petroleum products, are also impacted as there is less to
transport when petroleum production declines.
As to the violence around the globe, the sad fact is that we seem to be getting used to these
occurrences. We can see that when we are totally surprised our reactions, in the market, are
fierce and violent. As these occurrence continue, we have become hardened to the terror and do
not react as violently. It is the decay of the arc in real time. Sad but true, we are getting used to
violent acts.
The S&P 500 managed to add 1.50 handles (points) in the pre-holiday Thursday session. The
volume has been declining, in this product, since March 10th. Both the stochastic indicator and
our own indicator continue to issue a sell-signal with plenty of room to the downside. The RSI is
at 63.11 and is bending to the upside. We have a horizontal support line at 2007.75. The
overhead resistance line is at 2050.50 a level which, if removed, will indicate that the bull is back
in charge of this market. So far, we have seen a mixed market with a rounding, topping
behavior. The most frequently traded price was 2021 but the highest volume was seen at 2018.
The 60 minute 0.2% by 3-box point and figure chart has an upside target of 2109.8. The market
is clearly above all uptrend lines. The daily 1% by 3-box point and figure chart has a downside
target of 1530.57, confused yet? This chart does look as though the market is losing momentum

to the upside and seems to be rolling over.


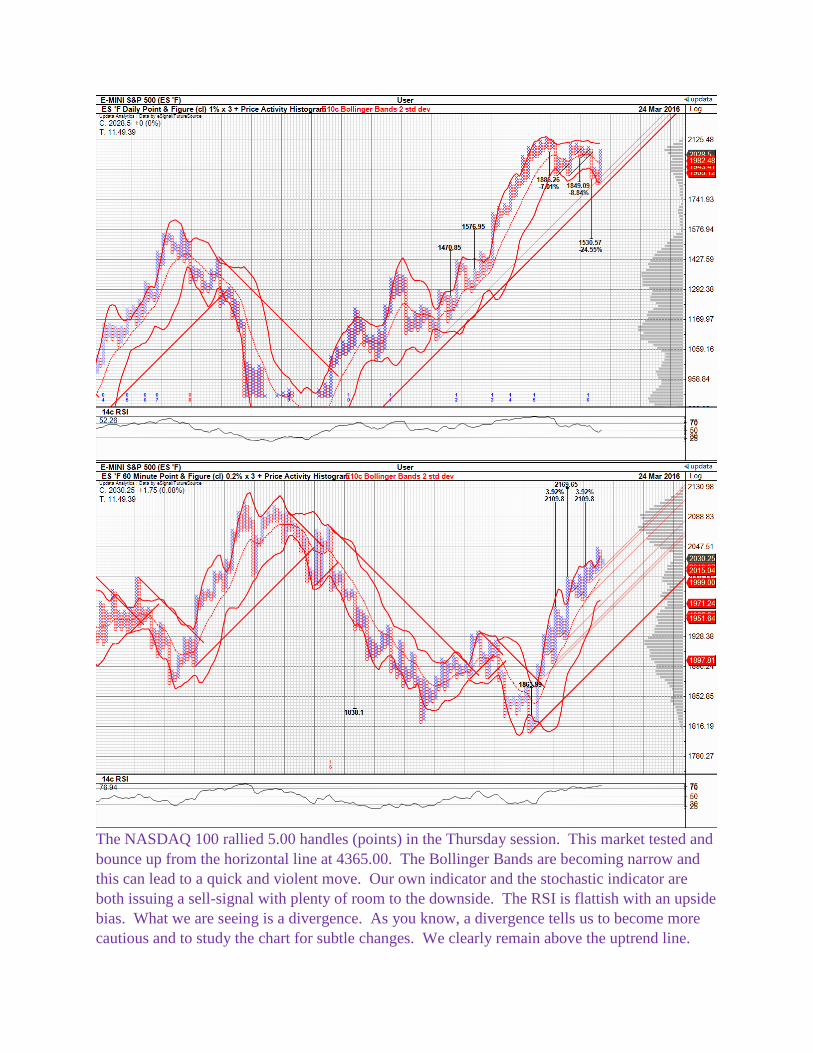
The NASDAQ 100 rallied 5.00 handles (points) in the Thursday session. This market tested and
bounce up from the horizontal line at 4365.00. The Bollinger Bands are becoming narrow and
this can lead to a quick and violent move. Our own indicator and the stochastic indicator are
both issuing a sell-signal with plenty of room to the downside. The RSI is flattish with an upside
bias. What we are seeing is a divergence. As you know, a divergence tells us to become more
cautious and to study the chart for subtle changes. We clearly remain above the uptrend line.

The most frequently traded price was 4390.00 and the greatest volume was seen at 4380. The
daily 1% by 3-box point and figure chart has an upside target of 4951.93. The 60 minute 0.2%
by 3-box point and figure chart has a downside target of 4228.71.


The Russell 2000 gained 4 handles (points) in the Thursday session. Both the stochastic
indicator and our won indicator are issuing a sell-signal. The RSI is pointing up on the positive
side of neutral. The fall-off in volume can be attributed to pre-holiday get-away week. The
current market is trading between 1095.30, with a venture to 1099.5 on March 21st, which failed
and support at 1052.10. The Bollinger Bands are becoming narrow which should alert you to a

possible change or violent reaction in the not too distant future. Should we see this market
violate the 1052.10 level, we will see a quick trip to 1035 or so. On the other side of the trade a
close above 1095.30 and 1099.50 will inspire a rally to 1107 and 1114. The most frequently
traded price was 1069.5 but the highest volume was seen at 1068 where 8.2% of the day’s
volume was traded. The monthly chart shows that there is some weakness in this index but also
clearly shows the trading range.


The US Dollar Index rallied in the Thursday session completing a string of five days moving to
the upside. The rally began on March 18th and is has exhibited low volume. All the indicators
that we follow herein continue to point higher with plenty of room to the upside. The very
narrow up trending channel lines are 95.84 and 96.547. The Bollinger Bands have expanded and
could now begin to narrow, but we are not sure of that at the moment. When we look at the
Heikin-Ashi chart of the US Dollar index we find a wider channel with the upper line at 96.369
and the lower line at 95.578. 15.6% of the Thursday’s volume traded at 96.25 while the most
frequently traded price was 96.175. When looking at the weekly chart of the US Dollar index we
clearly see that it has been in a trading range since early in March. The conservative range is
93.285 to 100.29. That said, there were two decent pokes above and below that range which, if
used, would increase the range to 92.52 - 100.60. Our self-imposed rules dictate that the poke, or
violation of that horizontal line must last for at least two trading days. Neither of the violations
has lasted for more than one day.


Crude oil retreated 20 cents in the Thursday session leaving a long tailed candlestick on the chart
that looks like a hangman. The resistance for crude oil is 41.90, above that level, the shorts will
scramble to cover their positions. The support area is at 34.82 and 33.60 below which the shorts
will press their bets. Until or unless we mover above or below these areas, we will likely trade in
the range marked off by those areas. All the indicators that we follow herein continue to issue a

sell signal. The most frequently traded price was 39.50. The high volume price was 40.97. The
daily 1.8% by 3-box chart is a bit whippy, but does show a possible bottom with a rally from that
point. The 60 minute 1% by 3-box point and figure chart has an upside target of 54.06 and an
internal downtrend line. These charts support confusion and a possible retest of the recent lows.
We believe that crude oil will retreat from here.


Gold retreated 7.3 handles (points) in the Thursday session. We find resistance at 1287.80 and
support at 1193.6, in other words, we are in a trading range. The downward trending channel
lines are 1254.20 and 1201.22. All the indicators that we follow herein continue to issue sell-
signals. The Bollinger Bands are beginning to expand and thus we can expect to see some
volatility in the coming sessions. The most frequently traded price was 1217.50. At this time, it
looks as though gold is going to, at the very least, back and fill.


Risk
Trading futures, options on futures and retail off-exchange foreign currency transactions involves
substantial risk of loss and is not suitable for all investors.
Past performance is not necessarily indicative of future results.
Copywrite 2016 The Option Royals