march 2013 special supplement on demographic trends
TRANSCRIPT

March 2013
Special Supplement on Demographic Trends
copy European Union
Social Europe EU Employment and Social Situation I Quarterly Review
Special Supplement on Demographic Trends
March 2013 I 2
Neither the European Commission nor any person acting on behalf of the Commission may be held
responsible for the use that may be made of the information contained in this publication
Europe Direct is a service to help you find answers
to your questions about the European Union
Freephone number ()
00 800 6 7 8 9 10 11
() Certain mobile telephone operators do not allow access to 00 800 numbers
or these calls may be billed
More information on the European Union is available on the Internet (httpeuropaeu)
Cataloguing data as well as an abstract can be found at the end of this publication
Luxembourg Publications Office of the European Union 2013
ISBN 978-92-79-29383-2
ISSN 1977-8317
doi 10276741278
copy European Union 2013
Reproduction is authorised provided the source is acknowledged
Authors
Silvia Andueza Robustillo Veronica Corsini Monica Marcu Katya Vasileva DG ESTAT
Ettore Marchetti DG EMPL
Data extracted from Eurostat online database
February 2013 (unless otherwise noted)
Social Europe EU Employment and Social Situation I Quarterly Review
Special Supplement on Demographic Trends
March 2013 I 3
Table of Contents
Introduction 4 Population change and age structure 4
Over half a billion inhabitants in the EU on 1 January 2012 and still growing 4 Net migration as the main driver of population growth in the EU-27 5 Population increased in 19 EU Member States 6 Population ageing continues in the EU-27 7
Fertility 10 Just below 16 live births per woman in the EU-27 11 Mean age at childbirth and at first child are increasing 12
Mortality 13 Life expectancy is increasing 13 Falling infant mortality 16
Migration and migrant population 17 Immigration to the EU-27 at 17 million 17 Foreign population at 207 million and foreign-born population at 330 million in
EU-27 19 Acquisition of citizenship down by 35 in 2011 21
Marriages and divorces 23 Fewer marriages more divorces 23 A rise in births outside marriage 24
Population development and employment growth 26 Scenarios for the EU-27 26 Differences among Member States 28
Social Europe EU Employment and Social Situation I Quarterly Review
Special Supplement on Demographic Trends
March 2013 I 4
Introduction
This Eurostat1 report presents an overview of recent demographic trends in the European Union2 and in Croatia based on data available at Eurostat
Eurostat compiles monitors and analyses a wide range of demographic data including statistics
on populations at national and regional level and on various demographic factors (births deaths marriages and divorces immigration and emigration) influencing the size structure and specific characteristics of these populations
Population change and the structure of the population are gaining importance in the political economic social and cultural spheres Demographic trends in population growth fertility mortality and migration are closely followed by policy-makers
Population change3 and age structure
The current demographic situation in the EU-27 is characterised by continuing population growth However while the population of the EU-27 as a whole still increased in 2012 the
population in eight EU-27 Member States declined
Over half a billion inhabitants in the EU on 1 January 2012 and still growing
On 1 January 20124 the population of the EU-27 was estimated at 5037 million this was 13
million people more than the year before and continuing a pattern of uninterrupted EU-27 population growth since 1960 The number of inhabitants in the EU-27 grew from 4026 million in 1960 by more than 100 million persons up to 2012 However the rate of population growth
has been gradually slowing down in recent decades In the period 1992-2011 the EU-27 population increased on average by about 15 million persons per year compared to an annual average of around 33 million persons per year in the 1960s
Chart 1 Population on 1 January EU-27 1960-2012
Source Eurostat (online data code demo_gind) Note Excluding French overseas departments up to and including 1997 See also footnote 4
1 Eurostat is the statistical office of the European Union (httpeceuropaeueurostat) 2 The European Union refers to the 27 Member States at 1 January 2013 (EU-27) In view of Croatiarsquos accession to European Union on 1 July 2013 the available data for Croatia are enclosed in the report but not aggregated in the EU level
3 Population change or population growth in a given year is the difference between the population size on 1 January of the given year and on 1 January of the following year It consists of two components natural change (the difference between the number of live births and the number of deaths) and net migration (the difference between the number of immigrants and the number of emigrants) For the lsquopopulation changersquo statistics Eurostat produces net migration figures by taking the difference between total population change and natural change this concept is referred to in this chapter as rsquonet migration plus statistical adjustmentrsquo The statistical adjustments corresponds to all changes in the population that cannot be classified as births deaths immigration or emigration and may sometimes overcome the net migration 4 A population and housing census was conducted in all EU Member States and in the EU acceding and candidate countries in 2011 It is usual practice for countries to revise their annual population estimates once the results of the population and housing census are available The following countries have already transmitted data to Eurostat based on the results of their 2011 censuses Bulgaria the Czech Republic Ireland Latvia Lithuania Malta Poland Portugal and Slovakia for the population on 1 January 2011 and 2012 Cyprus 1 January 2010 2011 and 2012 Luxembourg 1 January 2012 Population estimates based on the results of the census may introduce breaks in series for the size and structure of populations with an impact on the demographic indicators
Social Europe EU Employment and Social Situation I Quarterly Review
Special Supplement on Demographic Trends
March 2013 I 5
Net migration as the main driver of population growth in the EU-27
In 2011 natural increase (the positive difference between live births and deaths) contributed 31 (04 million) to population growth in the EU-27 Some 69 of the growth thus came from
net migration plus statistical adjustment which continued to be the main determinant of
population growth accounting for 09 million in 2011
Compared to 2010 both components of population growth natural change and net migration decreased in 2011 In terms of crude rates the population growth of 29 per 1000 persons in 2010 was due to a natural increase of 10 and net migration of 19 In 2011 within the total population growth of 26 per 1000 persons natural increase accounted for 08 and net
migration for 18
The contribution of net migration including statistical adjustment to total population growth has exceeded the share of natural increase since 1992 (see Chart 2) peaking in 2003 (95 of the
total population growth) Since then it has decreased somewhat Conversely the share of natural change in total population growth rose up to 2009 (38 ) but has declined again in
recent years (from 2010 onwards)
Chart 2 Population change by component (annual crude rates) EU-27 1960-2011
Source Eurostat (online data code demo_gind) Note Excluding French overseas departments up to and including 1997 See also footnote 4
The relatively low contribution of natural increase to total population growth is the result of two
factors firstly net migration in the EU-27 has increased considerably since the mid-1980s secondly the number of births has fallen while the number of deaths has increased The gap between live births and deaths (see Chart 3) has considerably narrowed since 1960 Since the
number of deaths is expected to increase as the baby-boom generation ages and assuming that fertility remains at a relatively low level a negative natural change (more deaths than births) cannot be excluded in the future In this case the extent of population decline or growth
will thus depend on the contribution made by migration
Chart 3 Live births and deaths EU-27 1961-2011
Source Eurostat (online data code demo_gind) Note Excluding French overseas departments up to and including 1997
Social Europe EU Employment and Social Situation I Quarterly Review
Special Supplement on Demographic Trends
March 2013 I 6
Population increased in 19 EU Member States
The number of inhabitants in individual EU Member States on 1 January 2012 ranged from 818 million in Germany to 04 million in Malta Germany together with France the United Kingdom and Italy comprised more than half (54 ) of the total EU-27 population on 1 January 2012
Although the population of the EU-27 as a whole increased during 2011 population growth was
unevenly distributed across the Member States A total of 19 EU Member States saw an increase in their populations while the number of inhabitants fell in eight Member States and in Croatia (see Table 1) Cyprus Luxembourg Belgium United Kingdom Sweden and France recorded the highest population growth rates in 2011 (more than 5 per 1000 persons) which was more than
twice the EU-27 average of 26 per 1000 persons The largest relative decreases in population were reported by Latvia (-160 per 1000 persons) and Lithuania (-148 per 1000 persons)
Table 1 Demographic balance 2011 (thousand persons)
Source Eurostat (online data code demo_gind) Note Estonia the population estimates do not include information on net migration See also footnote 4
Analysing the two components of population change at national level eight types of population change can be distinguished by growth or decline and the relative weights of natural change
and net migration mdash see Table 2 for the full typology In 2011 the highest rates for natural increase were registered in Ireland (100 per 1000 persons) followed at some distance by Cyprus (48) France (43) and the United Kingdom (41) while the largest negative natural changes occurred in Bulgaria (-51 per 1000 persons) Latvia (-47) and Hungary (-41) In
relative terms Cyprus (213 per 1000 persons) and Luxembourg (212) had the largest positive net migration rates in 2011 while Lithuania (-126 per 1000 persons) and Latvia (-112) recorded the highest negative net migration rates
Table 2 Contribution of natural change and net migration (and statistical adjustment) to
population change 2011
Source Eurostat (online data code demo_gind)
Social Europe EU Employment and Social Situation I Quarterly Review
Special Supplement on Demographic Trends
March 2013 I 7
Of the 19 EU Member States where the population increased in 2011 14 saw both natural increase and net migration contributing to population growth In Ireland Spain and Poland natural increase was the driver of population growth while net migration was negative Conversely population growth was due solely to migration in Germany and Italy while their
natural change was negative
Table 3 Crude rates of population change 2009-2011 (change per 1000 persons)
Source Eurostat (online data code demo_gind) Note Estonia the population estimates do not include information on net migration See also footnote 4
Eight EU Member States and Croatia reported a negative total population change in 2011 In
most cases this was mainly due to negative net migration (Greece Latvia Lithuania and Portugal) supplemented by negative natural change Conversely the population decrease was
mostly driven by negative natural change in Bulgaria Romania and Croatia supplemented by negative net migration In Estonia and Hungary the population decline was due solely to negative natural change which offset positive net migration
Population ageing continues in the EU-27
The age structure of the population in the EU-27 is becoming older due to increasing life expectancy and consistently low levels of fertility over the past decades Population ageing is a
general process across the EU Member States and is expected to continue in the coming decades
Population age structure on 1 January 2012
Table 4 shows the distribution of population by major age groups in the EU-27 On 1 January 2012 the young population (0-14 years old) accounted for 156 the population aged 15-64 (considered to be the working age population for the purpose of this publication) for 666 and
the population aged 65 and above for 178
Across the Member States the young population (0-14 years old) was largest in Ireland (216 ) and smallest in Germany (132 ) The reverse was observed for older persons in the total population where Germany and Italy recorded the highest proportion (both 206 ) and
Ireland had the lowest share (119 )
The median age of the EU-27 population on 1 January 2012 was 415 years This means that half of the EU-27 population today is 415 years old or more while half is younger The median age of the population in the Member States ranges from 350 years in Ireland to 450 years in
Germany (see Table 5) confirming the relatively young and relatively old population structures in these two countries
Age dependency ratios are used as indicators of the potential support needed by young people (aged 0-14 years) andor older people (aged 65 years or over) from the working-age
population The ratios are expressed in terms of the relative size of the young andor older population compared with the working-age population
Social Europe EU Employment and Social Situation I Quarterly Review
Special Supplement on Demographic Trends
March 2013 I 8
Table 4 Population age structure by major age groups 1 January 2012
Source Eurostat (online data code demo_pjan) Note EU-27 excludes French overseas departments in 1992 The population of unknown age is redistributed for calculating the proportion of the age groups See also footnote 4
In 2012 the old-age dependency ratio (population aged 65 or over in relation to the population aged 15-64) in the EU-27 was 268 This means that the EU had almost 4 persons of working
age for every person aged 65 years or over The old-age dependency ratio in the Member States ranged from 178 in Slovakia to 316 in Italy
Further the total age dependency ratio (calculated as the ratio of children aged 14 and below and older persons aged 65 and above to the population aged 15-64) was 502 in the EU-27
equivalent to about two working-age people for each dependent person In 2012 the lowest total age dependency ratio was in Slovakia (392 ) and the highest in France (555 )
The population pyramids presented in Chart 5 show the structure of the population by sex and
by five-year age groups Each bar corresponds to the share of the given sex and age group in the total population (men and women combined)
The EU-27 population pyramid in 2012 is narrow at the bottom and is becoming more like a
rhomboid due to the baby boomer cohorts resulting from the high fertility rates in several European countries in the mid-1960s (known as the lsquobaby boomrsquo) The baby boomers continue to represent a major part of the working-age population The first of these large cohorts born
over a period of 20-30 years are now reaching retirement age as illustrated by the comparison with the 1992 population pyramid The baby boom bulge is moving up the population pyramid leaving the middle (working-age population aged 15-64) and the base (aged 0-14) narrower
Past and current population ageing trends in the EU-27
Population ageing is a long-term trend that began several decades ago in the EU-27 It is visible in the development of the age structure of the EU population and is reflected by an increasing share of older persons coupled with a declining share of working-age persons in the total
population To illustrate this trend the evolution of the population structure between 1992 and 2012 is analysed below
Between 1992 and 2012 the proportion of working-age population (15-64 years) in the EU-27
increased by 05 percentage points while the proportion of older population (aged 65 and
above) increased by 37 percentage points (see Chart 4) This increase came at the expense of a decrease of 35 percentage points in the proportion of younger people (0-14 years)
Social Europe EU Employment and Social Situation I Quarterly Review
Special Supplement on Demographic Trends
March 2013 I 9
Table 5 Population age structure indicators 1992 and 2012
Source Eurostat (online data code demo_pjanind) Note EU-27 excludes French overseas departments in 1992 See also footnote 4
Chart 4 Population aged 65 years or over ( of the total population)
Source Eurostat (online data code demo_pjanind) Note EU27 excludes French overseas departments in 1992 See also footnote 4
Chart 5 Population pyramids EU-27 1992 and 2012 ( of the total population)
Source Eurostat (online data code demo_pjan) Note EU-27 excludes French overseas departments in 1992 See also footnote 4
Social Europe EU Employment and Social Situation I Quarterly Review
Special Supplement on Demographic Trends
March 2013 I 10
Since the proportion of older people increased between 1992 and 2012 the top of the 2012 age pyramid is larger This relative growth is due primarily to the gains in longevity and is known as lsquoageing at the toprsquo of the population pyramid as a consequence of the significant increase in life expectancy at birth recorded in all EU-27 Member States over the past decades
The consistently low levels of fertility over the decades have contributed to population ageing with fewer births leading to a decline in the proportion of young people in the total population This process is known as lsquoageing at the bottomrsquo of the population pyramid and can be observed
in the narrowing base of the population pyramids between 1992 and 2012 (see Chart 5)
Chart 6 Median age of population EU-27 1992-2012
Source Eurostat (online data code demo_pjanind) Note EU27 excludes French overseas departments in 1992 See also footnote 4
The development in the median age of the EU-27 population also provides an illustration of population ageing In the EU-27 the median age of the total population rose continuously from 357 years in 1992 to 415 in 2012 as shown in Chart 6 It increased in all Member States over that period (Chart 7)
Chart 7 Median age of population
Source Eurostat (online data code demo_pjanind) Note EU27 excludes French overseas departments in 1992 See also footnote 4
Fertility
Fertility steadily declined from the mid-1960s to the turn of the century in the EU countries At the beginning of the last decade however the total fertility rate in the EU-27 has shown some signs of rising again
In 2011 52 million children were born in the EU-27 corresponding to a crude birth rate (the number of live births per 1000 persons) of 104 The highest annual total for the EU-27 was recorded in 1964 with 77 million live births From the 1960s up to the beginning of the 21st century the number of live births in the EU-27 declined sharply from 75 million to a low of 50
million in 2002 (see Chart 3) This was followed by a modest rebound in the number of live births with 54 million children born in the EU-27 in 2008 in turn followed by further annual reductions during the period 2009-2011
Social Europe EU Employment and Social Situation I Quarterly Review
Special Supplement on Demographic Trends
March 2013 I 11
Just below 16 live births per woman in the EU-27
In recent decades Europeans have generally been having fewer children which partly explains the slowdown in the EU-27s population growth The main indicator of fertility is the Total
Fertility Rate (TFR) this is the mean number of children that would be born alive to a woman
during her lifetime if she were to conform to the age-specific fertility rates for a given year throughout her childbearing years A total fertility rate of around 21 live births per woman is
considered to be the replacement level in other words the average number of live births per woman required to keep the population size constant in the absence of inward or outward migration A TFR below 13 live births per woman is described as lowest-low fertility TFR is used as an indicator for the fertility level and is comparable across countries since it takes into
account changes in the size and structure of the population
Table 6 Total fertility rates and mean age of women at childbirth EU-27 2002-2011
Source Eurostat (online data code demo_find) Note See footnote 4
The total fertility rate in the EU-27 has declined to well below the replacement level in recent decades As shown in Table 6 the total fertility rate was 146 live births per woman in the EU-27 in 2002 the first year in which information is available for all 27 Member States A slight
recovery was subsequently observed in most EU Member States with the EU-27 average increasing to 160 live births per woman up to 2010 but then decreasing to 157 in 2011
Table 7 shows the TFR in the EU countries and Croatia for selected years The indicator declined steeply between 1980 and 2000-2002 in many countries to far below the replacement level in
2000 values had fallen below 13 in Bulgaria the Czech Republic Greece Spain Italy Slovenia and Slovakia After bottoming out between 2000 and 2002 the TFR has increased again in most Member States in the nine years to 2011 with all EU countries seeing rates above 13 with the
exception of Hungary Poland and Romania
Table 7 Total fertility rates selected years
Source Eurostat (online data code demo_find) Note See footnote 4
In the past 50 years total fertility rates in the Member States have in general been converging in 1960 and in 1980 the disparity between the highest (Ireland) and the lowest (Hungary in
Social Europe EU Employment and Social Situation I Quarterly Review
Special Supplement on Demographic Trends
March 2013 I 12
1960 Luxembourg in 1980) was 17 while in 1970 it was around 20 By 1990 this difference had decreased to 11 (between Cyprus and Italy) Since 2000 it has fallen to around 08 Ireland and Hungary representing the two extremes in 2011 Ireland and France continued to report the highest fertility rates for the most recent period available (2011) with just over 20
live births per woman In contrast the lowest fertility rates in 2011 were recorded in Hungary
(12 live births per woman) and in Poland and Romania (13 live births per woman) Among the countries for which 1990 data are available nine Member States (Belgium Denmark Greece
France Italy the Netherlands Slovenia Finland and United Kingdom) had a 2011 TFR equal to or higher than their 1990 TFR On the other hand the TFR fell by more than 30 between 1990 and 2011 in Cyprus Hungary Poland Romania and Slovakia In absolute terms the decline in the total fertility rate was largest in Cyprus from 241 in 1990 to 135 in 2011
Mean age at childbirth and at first child are increasing
Another reason that partly explains the downward trend in fertility rates within the EU is the
decision of many parents to delay starting a family While only a relatively short time series is available for the EU-27 as a whole Table 6 shows that the mean age of women at childbirth continued to rise between 2002 and 2011 when it stood at 300 years On the other hand the
slight increase in the total fertility rate observed in recent years may in part be attributed to a catching-up process following this postponing of the decision to have children When women give birth later in life the total fertility rate tends to decrease at first before subsequently recovering A more precise indicator for the postponement of births is the mean age of mothers
at the birth of the first child This indicator is not available for all Member States so it is not available for the EU-27
Chart 8 Mean age of women at first child and total fertility rate 2011
Source Eurostat (online data code demo_find) Note EU-27 BE DK FR IT and UK mean age at first child is not available See also footnote 4
Chart 8 shows that many of the countries with the highest total fertility rate also show high mean age for women at the birth of the first child Four different groups of countries can be
broadly identified based on their average value of the TFR (roughly equal to 16) and on their average value of the mean age at first child (roughly equal to 28) one group is composed of Ireland the Netherlands Finland and Sweden where both the TFR and the mean age at first child are above that average In the opposite quadrant are most of the countries that joined the
EU after 2004 plus Croatia in these countries both the TFR and the mean age of mothers at first child are below the average values The third group of countries have mothers with a higher age at first childbirth and a lower TFR compared to the average this is the case in
Germany Greece Spain Cyprus Luxembourg Austria Portugal and Slovenia The fourth and last group contains just Lithuania where the TFR is higher than the average but mothers are
younger at first child
Chart 9 illustrates the increase in the mean age at first child between 2002 and 2011 for the countries where the information is available for both years The increase was higher than 2 years in the Czech Republic Lithuania Hungary and Slovakia but around 05 years in Luxembourg and in the Netherlands
Social Europe EU Employment and Social Situation I Quarterly Review
Special Supplement on Demographic Trends
March 2013 I 13
Chart 9 Change in mean age of women at first child between 2002 and 2011
Source Eurostat (online data code demo_find) Note See footnote 4
Mortality
Over past years the annual number of deaths in the EU-27 has remained fairly stable at around 49 million In 2011 some 48 million persons died in the EU-27 mdash this was broadly in line with the annual number of deaths recorded over the previous four decades A peak was reached in 1993 and in 1995 with about 5 million deaths The crude death rate which is the number of
deaths per 1000 persons was 96 in the EU-27 in 2011 (see Chart 3)
The most commonly used indicator for analysing mortality is life expectancy at birth this is the mean number of years that a person can expect to live at birth if subjected to current mortality
conditions throughout the rest of his or her life It is a simple but very powerful way of illustrating the trend in mortality The total number of deaths depends on the size of the cohorts reaching the end of their life cycle and on mortality rates Economic development and the
improvement in environmental conditions improved lifestyles advances in healthcare and
medicine including reduced infant mortality have resulted in a continuous and rapid increase in life expectancy at birth across Europe during the last century This process has been going on for longer in Europe than in most other countries of the world making the EU-27 a world leader
for life expectancy Over the past 50 years life expectancy at birth has increased by about 10 years for both men and women in the EU-27 Further gains will be achieved mostly from the reduction in mortality at older ages Besides the reduction in fertility the gradual reduction in
mortality is the main factor contributing to the ageing of the population in the EU-27 While life expectancy is rising in all Members States major differences still exist between and within countries (for example by sex)
Life expectancy is increasing
Life expectancy in the EU-27 is generally higher than in most other regions of the world Life expectancy at birth in the EU-27 was estimated at 804 years in 2011 mdash 832 years for women
and 774 years for men This indicator is only available from 2002 to 2011 for the EU-27 as a whole but even this relatively short period of 10 years saw an increase in life expectancy of 23 years for women and 29 years for men (see Table 8)
Table 8 Life expectancy at birth EU-27 2002-2011
Source Eurostat (online data code demo_mlexpec) Note 2011 estimated See also footnote 4
Significant differences in life expectancy at birth are nevertheless observed between the EU
Member States as shown in Chart 10
For men the lowest life expectancy in 2011 was recorded in Lithuania (681 years) and the highest in Italy (801 years) For women the range was narrower from a low of 778 years in Bulgaria to a high of 857 years in France To compare in 2002 the lowest and highest life
expectancies were recorded in Latvia (647 years) and Sweden (777) for men and in Romania (747 years) and Spain (833) for women In the 10 years between 2002 and 2011 the rise in
Social Europe EU Employment and Social Situation I Quarterly Review
Special Supplement on Demographic Trends
March 2013 I 14
life expectancy at birth for men in the EU Member States ranged from a minimum of 19 years (in Bulgaria and Lithuania) to a maximum of 60 years (in Estonia) For women the increase ranged from 16 years (in Sweden) to 43 years (in Estonia) In 2002 the differences between the highest and lowest life expectancies among EU Member States amounted to 131 years for
men and 86 for women In 2011 the differences were 120 years for men and 79 years for
women Thus while life expectancy has been increasing in all countries it has increased slightly more in some of the countries where it was lower However this catching-up has been slow in
two of the low-life-expectancy countries Bulgaria and Romania
Chart 10 Life expectancy at birth men and women 2002 and 2011
Source Eurostat (online data code demo_mlexpec) Note EU-27 BE and IT 2011 estimated See also footnote 4
In 2011 the gender gap at birth was 58 years of life expectancy (see Chart 11) with women live longer than men in all EU countries However the gap varied substantially between EU Member States In 2011 the largest difference between the sexes was found in Lithuania (112 years) and the smallest in Cyprus and the Netherlands (both 38 years) In the Baltic States
women can expect to live more than 10 years longer than men Conversely the gender gap is less than 5 years in nine Member States In the 10 years up to 2011 the gender gap decreased with the exception of Bulgaria where it increased by 03 years and Poland where it remained
constant The reduction in the gender gap at birth was largest in absolute terms in Luxembourg (from 69 years in 2002 to 51 years in 2011) and Estonia (from 118 years in 2002 to 101 years in 2011) In the EU-27 the gender gap at birth decreased from 64 years in 2002 to 58
in 2011
Chart 11 The gender gap (women ndash men) in life expectancy at birth 2002 and 2011
Source Eurostat (online data code demo_mlexpec)
Social Europe EU Employment and Social Situation I Quarterly Review
Special Supplement on Demographic Trends
March 2013 I 15
Note EU-27 BE and IT 2011 estimated See also footnote 4
As people live longer interest has shifted to the older generations Table 9 shows life
expectancy at age 65 by sex for the EU-27 from 2002 to 2011 these are the only years for which information is available for all 27 Member States As can be seen the increase in life
expectancy for men and women at age 65 was 19 and 20 years respectively The gender gap at age 65 decreased slightly to 35 years in 2011 down from 36 years in 2002
Table 9 Life expectancy at age 65 EU-27 2002-2011
Source Eurostat (online data code demo_mlexpec) Note 2011 estimated See also footnote 4
Chart 12 shows life expectancy at age 65 by country and by sex In 2011 upon reaching the
age of 65 the average man could expect to live additional 134 (in Latvia) to 193 years (in France) The life expectancy of women at age 65 was higher ranging in 2011 from 173 years in Bulgaria to 238 years in France
Chart 12 Life expectancy at age 65 men and women 2002 and 2011
Source Eurostat (online data code demo_mlexpec) Note EU-27 BE and IT 2011 estimated See also footnote 4
Chart 13 shows the changes in the gender gap in life expectancy at age 65 between 2002 and
2011 by country due to the faster increase in life expectancy for women at older ages the gender gaps at age 65 increased in more than half the countries over that period The largest increase was in Estonia and Latvia +08 years between 2002 and 2011The gender gap decreased in the other Member States by more than half a year in Ireland Cyprus Malta and
the Netherlands In 2011 the largest gender gaps were in the Baltic States where women could expect to live more than 5 years longer than men At the other end of the scale the smallest gap 21 years was in Greece and Cyprus
Social Europe EU Employment and Social Situation I Quarterly Review
Special Supplement on Demographic Trends
March 2013 I 16
Chart 13 The gender gap (women ndash men) in life expectancy at age 65 2002 and 2011
Source Eurostat (online data code demo_mlexpec) Note EU-27 BE and IT 2011 estimated See also footnote 4
Falling infant mortality
Life expectancy at birth is improved by the reduced probability of dying One of the most significant changes in recent decades has been the reduction in infant mortality rates Around 20 thousand children died before reaching one year of age in the EU-27 in 2011 the most
recent year for which data are available this figure was almost 37 thousand in 1996 which is the first year for which information is available for all Member States and Croatia
Chart 14 Infant mortality rate 1996 and 2011
Source Eurostat (online data code demo_minfind)
The infant mortality rate almost halved in the EU-27 during the 15 years from 1996 to 2011 from 72 to 39 deaths per 1000 live births (see Chart 14) The biggest reductions were
generally recorded in those EU Member States with higher than average levels of infant mortality in 1996 The decrease in the central and eastern Member States is greater than in the other Member States Despite this progression some Member States still had relatively high
infant mortality rates in 2011 eg Romania (94 deaths per 1000 live births) and Bulgaria (85permil) In 2011 the lowest infant mortality rates in the EU-27 were in Sweden (21 deaths per 1000 live births) Finland (24permil) and Estonia (25permil) about one-fourth of the rates recorded in Romania and Bulgaria
Social Europe EU Employment and Social Situation I Quarterly Review
Special Supplement on Demographic Trends
March 2013 I 17
Migration and migrant population
Immigration to the EU-27 at 17 million
During 2011 there were an estimated 17 million immigrants to the EU-27 from a country
outside the EU-27 In addition 13 million people previously residing in an EU-27 Member State migrated to another Member State
Table 10 Immigration 2009-2011 (in absolute numbers and as a percentage of total
immigration)
Source Eurostat (online data code migr_imm5prv migr_imm1ctz) Note The individual values do not add up to the total due to rounding and to exclusion of the lsquounknownrsquo citizenship group from the table (p) provisional data (b) break in series (s) estimated
Thus about 32 million people immigrated5 to one of the EU-27
6 Member States while at least
23 million emigrants were reported to have left an EU-27 Member State It should be noted that these figures do not represent the migration flows tofrom the EU as a whole since they also include flows between different EU Member States
The United Kingdom reported the largest number of immigrants (566044) in 2011 followed by Germany (489422) Spain (457649) and Italy (385793) These four Member States together accounted for 603 of all immigrants to EU-27 Member States
Spain reported the highest number of emigrants in 2011 (507742) followed by the United
Kingdom (350703) Germany (249045) and France (213367) 16 of the EU-27 Member States reported more immigration than emigration in 2011 but in Bulgaria the Czech Republic Ireland Greece Spain Poland Romania and the three Baltic Member States emigrants
outnumbered immigrants
Relative to the size of the resident population Luxembourg recorded the highest number of immigrants in 2011 (38 immigrants per 1000 persons) followed by Cyprus (26) and Malta (13)
The highest rates of emigration in 2011 were reported for Ireland (19 emigrants per 1 000 persons) and Lithuania (18 emigrants per 1000 persons)
5 A person is considered to have immigrated if he or she establishes his or her usual residence in a Member State for at least twelve months having previously been usually resident in another Member State or a third country as set out in Article 2 of Regulation (EC) 8622007
Social Europe EU Employment and Social Situation I Quarterly Review
Special Supplement on Demographic Trends
March 2013 I 18
Chart 15 Immigrants 2011 (per 1 000 persons)
Source Eurostat (online data code migr_imm1ctz and migr_pop1ctz) Note Data on the number of persons refer to 1 January 2012 for HR
Citizens of non-EU countries can be categorised according to the level of development of their country of citizenship based on the Human Development Index (HDI) calculated by the United
Nations By this measure the largest share (524 of all immigrants to the EU are from medium HDI countries and 346 are from high HDI (but non-EU) countries By contrast low HDI countries (63) EFTA countries (36) and Candidate countries (31) accounted for
relatively low shares of total immigration to the EU-27 in 2011
Chart 16 Share of immigrants by citizenship group EU-27 2011 ()
Source Eurostat (online data code migr_imm5prv) Note Candidate countries as of 1 January 2011 Montenegro Croatia former Yugoslav Republic of Macedonia and Turkey
In 2011 the relative share of returning nationals within the total number of immigrants was highest in Lithuania (893 of all immigrants) Portugal (636) Croatia (553) Estonia (548) and Greece (545) These were the only EU Member States to report return migration higher than 50 By contrast Luxembourg Austria Italy Cyprus and Spain reported
relatively low shares as return migration in 2011 accounted for less than 10 of immigrants
Chart 17 Share of return migrants EU-27 2011 ()
Source Eurostat (online data code migr_imm1ctz)
Regarding the gender distribution of immigrants in 2011 there were slightly more men than women as a whole (521 compared to 479) The country reporting the highest share of male immigrants was Slovakia (624) by contrast the highest share of female immigrants
was reported in Cyprus (552)
Social Europe EU Employment and Social Situation I Quarterly Review
Special Supplement on Demographic Trends
March 2013 I 19
Foreign population at 207 million and foreign-born population at 330 million in EU-27
The EU-27 foreign population (people residing in an EU-27 Member State with citizenship of a non EU-27 Member State) on 1 January 2012 was 207 million representing 41 of the EU-27
population In addition there were 136 million persons living in an EU-27 Member State with
citizenship of another EU-27 Member State on 1 January 2012
Due to better data availability information on citizenship has often been used to study populations with a foreign background However since citizenship can change over time it is also useful to present information by country of birth
There were 330 million people born outside a country of the EU-27 on 1 January 2012 and there were 172 million persons who were born in a different EU-27 Member State from the country of residence Only in Luxembourg Ireland Hungary Cyprus and Malta did foreign-born
persons from other EU-27 countries outnumber those born outside the EU-27 People born abroad outnumbered foreign citizens in all Member States except Luxembourg Latvia and the Czech Republic
Table 11 Foreign and foreign-born population by group of citizenship and country of birth 1
January 2012 (in absolute numbers and as a percentage of the total foreignforeign-born
population)
Source Eurostat (online data code migr_pop1ctz) Note The individual values do not add up to the total due to rounding and to exclusion of the lsquounknownrsquo citizenship group from the table Population data for HR comes from 2011 Census as on 31 March 2011 (p) provisional data (s) estimated
In absolute terms the largest numbers of foreigners living in the EU on 1 January 2012 were
found in Germany (74 million) Spain (55 million) Italy (48 million) the United Kingdom (48 million) and France (38 million) Non-nationals in these five Member States collectively represented 771 of the total number of non-nationals living in the EU-27 while the same five Member States had a 629 share of the EUrsquos population In relative terms the EU-27 Member
State with the highest share of non-nationals was Luxembourg where they accounted for 438 of the total population The vast majority (864) of non-nationals living in Luxembourg were citizens of other EU Member States As at 1 January 2012 a high proportion of non-
nationals (10 or more of the resident population) was also observed in Cyprus Latvia
Estonia Spain Austria and Belgium
In most EU Member States the majority of non-nationals are citizens of non-EU countries At the
beginning of 2012 citizens of other EU-27 Member States represented the majority of non-nationals living in Luxembourg Ireland Belgium Slovakia Cyprus and Hungary In Latvia and Estonia the proportion of citizens from non-EU countries is particularly large due to the high
Social Europe EU Employment and Social Situation I Quarterly Review
Special Supplement on Demographic Trends
March 2013 I 20
number of recognised non-citizens (mainly former Soviet Union citizens who are permanently resident in these countries but have not acquired citizenship)
Chart 18 Share of foreigners in the resident population EU-27 1 January 2012 ()
Source Eurostat (online data code migr_pop1ctz)
Looking at the distribution by continent of citizens of non-EU countries living in the EU the largest proportion (385) were citizens of a European country outside the EU-27 A total of 79
million citizens from European countries outside the EU-27 were residing in the EU at the start of 2012 among these more than half were citizens of Turkey Albania or Ukraine The next biggest group was from Africa (245) followed by Asia (220) the Americas (142) and Oceania (08) More than half the African citizens living in the EU were from North Africa
often from Morocco or Algeria Many Asian citizens living in the EU came from southern or eastern Asia in particular from India or China Citizens of Ecuador and the United States made up the largest share of non-nationals from the Americas living in the EU
Chart 19 Citizens of non-EU countries
resident in the EU-27 by continent of origin
1 January 2012 ()
Chart 20 Non-EU citizens resident in the
EU-27 by level of human development index
(HDI) of country of citizenship 1 January
2012 ()
Source Eurostat
Among the non-EU citizens living in the EU-27 in 2012 some 442 were citizens of a high HDI country (with Turkey Albania and Russia accounting for almost half) while a slightly higher share (483) came from medium HDI countries (one fifth from Morocco followed by China and Ukraine) the remaining 76 were from low HDI countries (30 with Nigerian or Iraqi
citizenship)
The citizenship structure of the population of non-nationals living in the EU varies greatly between Member States It is influenced by factors such as labour migration historical links
between countries of origin and destination and established networks in destination countries Romanians (living in another EU Member State) and Turkish citizens were the biggest groups of non-nationals living in the EU-27 in 2012 There were 23 million citizens from each of these
countries each group accounting for 70 of all non-nationals living in the EU-27 in 2012 The third largest group was Moroccans (19 million people or 56 of all non-nationals) The group of non-nationals living in the EU with the most significant increase over the period from 2001 to
Social Europe EU Employment and Social Situation I Quarterly Review
Special Supplement on Demographic Trends
March 2013 I 21
2012 was Romanians (living in another EU Member State) their numbers increasing almost eight-fold from 03 million in 2001 to 24 million by 2012
Chart 21 Main countries of origin of non-nationals EU-27 1 January 2012 (million)
Note 1 Estimates Eurostat
An analysis of the age structure of the population shows that for the EU-27 as a whole the foreign population was younger than the national population The distribution by age of
foreigners shows compared to nationals a greater proportion of relatively young working age adults In 2012 the median age of the national population in the EU-27 was 419 years while the median age of foreigners living in the EU was 347 years
Chart 22 Age structure of the national and foreign population EU-27 1 January 2012 ()
Source Eurostat (online data code migr_pop2ctz)
Acquisition of citizenship down by 35 in 2011
The number of people acquiring the citizenship of an EU-27 Member State in 2011 was 782200
corresponding to a 35 decrease with respect to 2010 2010 saw the greatest number of people acquiring the citizenship of an EU Member State since 2001 and the first time that the total number rose above 08 million
The United Kingdom had the highest number of persons acquiring citizenship in 2011 at 177
600 (or 227 of the EU-27 total) The next highest numbers were in France (114584) Spain (114599) and Germany (109594) none of the remaining Member States granted citizenship to more than 100000 people in 2011
Social Europe EU Employment and Social Situation I Quarterly Review
Special Supplement on Demographic Trends
March 2013 I 22
Table 12 Number of persons having acquired the citizenship of the reporting country 2001-2011
(thousand)
Source Eurostat (online data code migr_acq)
In absolute terms the highest decreases were observed in France (28691 fewer persons were
granted French citizenship compared to 2010) followed by the United Kingdom (17277) Italy (9785) and Spain (9122) The highest decreases in relative terms were recorded in Latvia (326 fewer persons acquired citizenship in 2011) and Bulgaria (312)
One indicator commonly used to measure the effect of national policies on citizenship is the lsquonaturalisation ratersquo or the ratio between the total number of citizenships granted and the stock of foreign residents in a country at the beginning of the year The country with the highest naturalisation rate in 2011 was Hungary (98 acquisitions per 100 foreign residents) followed
by Poland (67) and Sweden (58) while Malta Portugal and the United Kingdom all reported rates between 4 and 5 acquisitions per 100 foreign residents
Chart 23 Naturalisation rate 2011 (per 100 foreign residents)
Source Eurostat (online data code migr_acq and migr_pop1ctz)
About 867 of those who acquired citizenship of an EU-27 Member State in 2011 were
previously citizens of a non-EU country This was the case in nearly all of the Member States These new EU-27 citizens came mainly from Africa (262 of the total) Asia (226) non-
EU27 Europe (189) and North and South America (169) EU-27 citizens who acquired citizenship of another Member State amounted to 82 263 persons accounting for 105 of the
total In absolute terms the main groups of EU citizens acquiring citizenship of another EU Member State were Romanians becoming citizens of Hungary (15658 persons) and Italy (3921 persons) Poles becoming citizens of Germany (4344 persons) and Portuguese becoming citizens
of France (3805 persons)
Social Europe EU Employment and Social Situation I Quarterly Review
Special Supplement on Demographic Trends
March 2013 I 23
In Luxembourg and Hungary the majority of new citizenships granted were to citizens of another EU Member State In the case of Luxembourg Portuguese citizens accounted for the largest share while in the case of Hungary those acquiring citizenship were almost exclusively Romanians
As in previous years the largest groups of new citizens in the EU Member States in 2011 were citizens of Morocco (64200 corresponding to 82 of all citizenships granted) and Turkey (48800 or 62) Compared with 2010 the number of Moroccan citizens acquiring citizenship
of an EU Member State decreased by 44 while the figure for Turkish citizens fell by 20 The largest share of Moroccans acquired their new citizenship in France (326) Spain (224) and Italy (167) while the highest proportion of Turkish nationals acquired their new citizenship in Germany (575) and France (129)
Marriages and divorces
The number of marriages is decreasing and the number of divorces is increasing although the trend in marriages may be due in part to ageing of the population In addition more and more
children are being born to un-married women and the countries with the highest extramarital birth rates are often also those with the highest fertility rates
Marriage as recognised by the law in each country has long been considered to indicate family
formation However the analysis of trends in family formation and dissolution based on just marriage and divorce data might not offer a full picture Legal alternatives to marriage like registered partnership have become more widespread and national legislation has evolved to confer more rights on unmarried couples Alongside these new legal forms other forms of non-
marital relationships have appeared making it more difficult for statisticians to collect data that can be compared across countries
Due to differences in the timing and formal recognition of changing patterns of family formation
and dissolution these concepts have become more difficult to operationalise
Fewer marriages more divorces
22 million marriages took place in the EU-27 in 2010 and 10 million divorces occurred in the
EU-27 in 2009 according to the most recent available aggregated data These figures may be expressed as 44 marriages for every 1000 persons (ie the crude marriage rate) and 19 divorces for every 1000 persons (ie the crude divorce rate)
Since 1965 the crude marriage rate in the EU-27 has declined by some 43 in relative terms
(from 77 per 1000 persons in 1965 to 44 in 2010)
Chart 24 Crude marriage and divorce rates EU-27
Source Eurostat (online data codes demo_nind and demo_ndivind) Note The series of divorce rate in EU-27 is discontinued due to unavailability of data by Member States to be aggregated
At the same time marriages have become less stable in the EU-27 as indicated by the increase in the crude divorce rate from 08 per 1000 persons in 1965 to 21 in 2007 Part of this increase
is due to the fact that in several countries divorce was legalised during the period Over 2008 and 2009 however the annual number of divorces decreased slightly to 19 per 1000 persons in 2009
Table 13 shows that in 2011 the crude marriage rate among the EU-27 Member States was highest in Cyprus (73 per 1000 persons) Lithuania (63) and Malta (61) At the other end of
Social Europe EU Employment and Social Situation I Quarterly Review
Special Supplement on Demographic Trends
March 2013 I 24
the scale the lowest crude marriage rates were reported by Bulgaria (29 per 1000 persons) Slovenia (32) and Luxembourg (33)
Table 13 Crude marriage rate (marriages per 1000 persons)
Source Eurostat (online data code demo_nind) Note EU-27 excludes French overseas departments for 1960 to 1990 CY Up to and including 2000 data refer to total marriages contracted in the country including marriages between non-residents 2009-2011 data refer to marriages where at least one spouse was resident in the country
As regards divorce Ireland (07 per 1000 persons) and several southern European Member
States including Italy (09) Slovenia (11) and Greece (12) have significantly lower crude divorce rates than Latvia (40 per 1000 persons) Lithuania (34) and Belgium (29) Divorce
became legal in Malta in 2011 so the first data available in 2011 show only 01 divorces per 1000 persons
Table 14 Crude divorce rate (divorces per 1000 persons)
Source Eurostat (online data code demo_ndivind) Note EU-27 excludes French overseas departments for 1960 to 1990 Divorce was not possible by law in Italy until 1970 in Spain until 1981 in Ireland until 1995 and in Malta until 2011
A rise in births outside marriage
The proportion of births outside marriage in the EU-27 in 2011 was 395 It continues to
increase signalling new patterns of family formation alongside the more traditional pattern
where children are born within marriage Extramarital births occur in non-marital relationships among cohabiting couples and to lone parents
Social Europe EU Employment and Social Situation I Quarterly Review
Special Supplement on Demographic Trends
March 2013 I 25
Table 15 Live births outside marriage ( share of total live births)
Source Eurostat (online data code demo_find) Note EU-27 excludes French overseas departments for 1960 to 1990 and excludes Romania for 1990
Extra-marital births increased in almost every country in the EU-27 during 2011 with the exception of Ireland Malta and Sweden In six Member States the majority of live births are
now outside marriage Estonia (597) Slovenia (568) Bulgaria (561) France (558) Sweden (543) and Belgium (500) Mediterranean countries like Greece Croatia Cyprus Italy and Malta along with Poland Lithuania and Romania are at the other end of the scale
with a large proportion over 70 of births occurring within marriage
Chart 25 Proportion of live births outside marriage and total fertility rate 2011
Source Eurostat (online data code demo_find)
Countries with higher proportions of births outside marriage often have higher fertility rates In France Sweden Belgium Denmark the United Kingdom and Netherlands high rates of live births outside marriage (above 45 of total live births) are associated with total fertility rates
above the EU-27 average (157 live births per woman in 2011) (Chart 25)
Social Europe EU Employment and Social Situation I Quarterly Review
Special Supplement on Demographic Trends
March 2013 I 26
Population development and employment growth
A what-if analysis can be instructive and tell how far employment growth can be sustained under current demographic trends The analysis below is based on the 2010 Eurostat demographic projections The scenarios are exclusively on the supply side and do not take into
account projections of labour demand
Europe 2020 targets promote lower school drop-out rates higher rates of tertiary education and higher employment In the past school drop-out rates have been decreasing though not as fast
as targeted earlier tertiary education has been increasing steadily employment grew until 2008 then decreased especially for young adults and migrants
In 2010 14 of EU residents aged 18-24 were not in education or training and did not have an upper secondary school diploma They are called lsquoearly leaversrsquo and the aim is to bring this
figure down to 10 by 2020 Even though more young adults complete secondary education and more are motivated to continue with education or training if current trends continue the outcome is likely to fall short of the objective
On the other hand the education levels of todayrsquos 20-24 year-olds is higher than it was 10 years ago As a result at current growth rates in 2020 40 of 30-34 year-olds are likely to have a tertiary degree thereby achieving the tertiary education target
Scenarios for the EU-27
The estimates in the text above and those in Chart 26 and Table 16 are based on Eurostatrsquos Population projections (Europop 2010) and annual Labour Force Survey employment and
education attainment rates as well as assumptions based on the Europe 2020 targets on education and employment
Chart 26 Population by sex age group an employment EU-27 2010 and 2030 (million)
2010 age 2030
90
80
70
60
50
40
30
20
10
0
Source Eurostat (online data codes proj_10c lfsa_ergan lfsa_ergaed lfsa_pgaed) and DG EMPL computations
In Chart 26 the 2030 employment counts were computed by assuming that employment rates remain constant across ages sex origin and education level whereas educational attainment rates follow observed trends This means that the education levels of each 5-year cohort (for instance those aged 20-24 in 2010) will change over time according to changes observed in the
period 2006-2011 as a result during the following five projection years some of its ISCED7 0-2 people will graduate to ISCED 3-4 and some of its (and newly graduated) ISCED 3-4 will graduate to ISCED 5-6 These graduation rates are assumed to depend on age and to remain
constant in the future
Education trends consist of two components The first is the educational level of young adults (aged 15-19) The ISCED 3-4 attainment of this group has been increasing and this trend is
assumed to continue tapering to a maximum of 25 in the long run Transitions between
7 International Standard Classification of Education see httpwwwuisunescoorgEducationPagesinternational-standard-classification-of-educationaspx
20 10 10 20 20 10 10 20
Social Europe EU Employment and Social Situation I Quarterly Review
Special Supplement on Demographic Trends
March 2013 I 27
education levels at successive ages are assumed to be constant It must be considered that as education levels continue rising they continue to raise employment rates In present scenarios as better-educated cohorts replace less-well educated ones the global employment rate rises and so does overall employment
The observed overall increase so far is largely the net effect of composition change where the positive impact of the increase in educational attainment more than offsets the negative impact of our active-age population becoming increasingly older or of migrant origin (non-EU-27)
Under these assumptions Chart 26 shows total employment declining by 5 million that is 25 from 2010 to 2030 the employment rate of those aged 20-64 in 2020 would be 685 a slight increase and far below the Europe 2020 target The reason for this change would be the rise in education levels mitigated by an ageing population and a growing proportion of
migrants Economic dependency8 would rise from 132 in 2010 to 147 in 2030 In Table 16 this is the lsquotrend education with constant employment ratesrsquo scenario
The Social Investment Package9 calls for measures that increase labour participation
employability and productivity It is important to analyse the feasibility and consequences of raising education levels and labour participation to assess the suitability of the measures envisaged
For instance focusing on opportunities for disadvantaged workers may bring in more people with lower skills and the changing skills composition would affect productivity10 In addition it pays to understand the impact of current population trends in education
Table 16 summarises employment in 2020 and 2030 under several scenarios Its purpose is to
analyse the difficulty and impact in 2030 of reaching the Europe 2020 employment objectives
The first scenario includes demographic change but no rise in educational attainment It is purely mechanical and its only purpose is to assess the impact of skills renewal due to cohort
turnover as older less-well-educated worker cohorts leave the labour market younger better-educated cohorts join it Although skills renewal is now slower than it was in the past 2-3 decades because of demographic changes the impact remains high
The second scenario allows for education to continue progressing as it did in the past thereby shifting overall employment Without an effort to attain the Europe 2020 employment objectives the EU-27 workforce will become older but also better educated As a result employment will be stable until 2020 but will decrease by 2-3 by 2030 feeling the impact of
demographics The declining population of working age will increasingly consist of older workers
The third scenario assumes that the Europe 2020 targets on education will be attained and the
trend towards a better-educated work force will continue after 2020 Here we should underline that
under the assumption that current education transitions continue the tertiary education
target would also be attained
Europe 2020 education targets will have a small impact on employment in 2030 This is because the targeted increase in tertiary attainment and the reduction in early leavers will affect only the very young cohorts of workers so that the effect will not materialise
by 2030 however the impact will be far larger after 2030
The fourth scenario assumes that in addition to the Europe 2020 target for education the target on employment will also be attained As regards those aged 65 and above this scenario
envisages the same rates of increase for employment as for people aged 55-64 Employment rate increases from 2010 to 2020 then assumed go on till 2030
But attaining the Europe 2020 employment target would require tapping into a potential labour
force consisting largely of older people and so-far inactive migrants These cohorts tend to be less educated than the rest of the labour force This means that not only will activating them be
harder but also that they will contribute to the less-skilled workforce whereas there is strong
8 Economic dependency is the ratio between the number of people not in employment and those who are 9 See COM(2013) 83 10 See Employment and Social Developments in Europe Chapter 4 p 279
Social Europe EU Employment and Social Situation I Quarterly Review
Special Supplement on Demographic Trends
March 2013 I 28
evidence suggesting that demand in future decades will concentrate on high-skilled rather than low-skilled workers11
Table 16 Work force scenarios under Europe 2020 assumptions EU-27 2020 and 2030
Source Eurostat (online data codes proj_10c lfsa_ergan lfsa_ergaed lfsa_pgaed) and DG EMPL computations Note (1) only EU citizens
Employment gains among women and young people who tend to be better educated may be easier to achieve and yield higher productivity gains however they alone will not mean the Europe 2020 employment target is met Up skilling via continuing education and training is
another way to motivate and nurture a productive workforce12
Differences among Member States
Population developments in the various Member States differ as the rate of ageing varies and
these find themselves in different phases For instance eastern States have relatively young and slowly-ageing populations now but face the prospect of very rapid ageing from 2025 onwards13 In addition some Member States already make better use of their potential work
forces with higher education and employment rates than others
In the past two decades employment and productivity growth fuelled economic growth in roughly equal measure The observed pre-crisis 1 employment growth ended in 2008 When
the crisis abates employment can resume growth but this will be limited in future
Demographic ageing and workforce decline will create bottlenecks to the available labour force in the medium term even though at present countries still have un-deployed human resources which could potentially yield further employment growth
Chart 27 outlines the Member Statesrsquo different potentials for continuing employment growth Assuming that the EUrsquos economic and social system will need 1 employment growth Member States differ as to when such a lsquosustainablersquo growth path will have to come to an end simply
because human resources become scarce
Two scenarios are presented14
Under the first scenario there will be no further progress in activation its growth-end
year is the upper end of the blue bar in Chart 27
Under the second scenario each country exploits the maximum activation potential of women older people and educational progress its growth-end year is the upper end of the yellow bar in Chart 27 Four Member States can continue growing beyond 2040
11 See for instance httpwwwcedefopeuropaeuENpublications20633aspx
12 Source httpeceuropaeusocialmainjsplangId=enampcatId=113ampnewsId=1774ampfurtherNews=yes chapter 69 13 See the 2010 Demography Report (chapter I5)
14 See draft paper of C Fotakis J Peschner (2013) lsquo Growth potential of EU human resources and policy implications for future economic growthrsquo not yet published
Social Europe EU Employment and Social Situation I Quarterly Review
Special Supplement on Demographic Trends
March 2013 I 29
The Member States with the longer bars whose maximum potential for growth reaches further into the future are of two types Some have strong population growth and slow ageing such as Ireland others have large unused capacity to tap by increasing participation in (education and) labour
More critically the EU-27 is projected to have a large shortfall of well-educated (ISCED 5-6) workers Although their number will grow by virtue of rising education levels in the population this projected growth is slower than the increase in demand
Chart 27 Year in which a continued 1 employment growth from 2011 is projected to stop by
country
Source FotakisPeschner (2013)6 based on Eurostat LFS
In addition the untapped potential consists mainly of less-well educated people for two
reasons First the better educated are already well involved in the labour market Secondly the most promising sources of additional labour ie older people and migrants tend to be less well educated than prime-age EU nationals
Thus as regards high-skilled workers the time-window for growth is more limited Even the best activation policies can only palliate and delay the onset of shortages for just a few years
Social Europe EU Employment and Social Situation I Quarterly Review
Special Supplement on Demographic Trends
March 2013 I 30
European Commission
EU Employment and Social Situation Quarterly Review March 2013 ndash Special
Supplement on Demographic Trends
Luxembourg Publications Office of the European Union
2013 mdash 30 pp mdash 21 times 297 cm
ISBN 978-92-79-29383-2
ISSN 1977-8317 doi 10276741278
This publication is available in electronic format in English
KE-BH-13-0S2-EN-N
- Table of Contents
- Introduction
- Population change and age structure
- Fertility
- Mortality
- Migration and migrant population
- Marriages and divorces
- Population development and employment growth
-

Social Europe EU Employment and Social Situation I Quarterly Review
Special Supplement on Demographic Trends
March 2013 I 6
Population increased in 19 EU Member States
The number of inhabitants in individual EU Member States on 1 January 2012 ranged from 818 million in Germany to 04 million in Malta Germany together with France the United Kingdom and Italy comprised more than half (54 ) of the total EU-27 population on 1 January 2012
Although the population of the EU-27 as a whole increased during 2011 population growth was
unevenly distributed across the Member States A total of 19 EU Member States saw an increase in their populations while the number of inhabitants fell in eight Member States and in Croatia (see Table 1) Cyprus Luxembourg Belgium United Kingdom Sweden and France recorded the highest population growth rates in 2011 (more than 5 per 1000 persons) which was more than
twice the EU-27 average of 26 per 1000 persons The largest relative decreases in population were reported by Latvia (-160 per 1000 persons) and Lithuania (-148 per 1000 persons)
Table 1 Demographic balance 2011 (thousand persons)
Source Eurostat (online data code demo_gind) Note Estonia the population estimates do not include information on net migration See also footnote 4
Analysing the two components of population change at national level eight types of population change can be distinguished by growth or decline and the relative weights of natural change
and net migration mdash see Table 2 for the full typology In 2011 the highest rates for natural increase were registered in Ireland (100 per 1000 persons) followed at some distance by Cyprus (48) France (43) and the United Kingdom (41) while the largest negative natural changes occurred in Bulgaria (-51 per 1000 persons) Latvia (-47) and Hungary (-41) In
relative terms Cyprus (213 per 1000 persons) and Luxembourg (212) had the largest positive net migration rates in 2011 while Lithuania (-126 per 1000 persons) and Latvia (-112) recorded the highest negative net migration rates
Table 2 Contribution of natural change and net migration (and statistical adjustment) to
population change 2011
Source Eurostat (online data code demo_gind)
Social Europe EU Employment and Social Situation I Quarterly Review
Special Supplement on Demographic Trends
March 2013 I 7
Of the 19 EU Member States where the population increased in 2011 14 saw both natural increase and net migration contributing to population growth In Ireland Spain and Poland natural increase was the driver of population growth while net migration was negative Conversely population growth was due solely to migration in Germany and Italy while their
natural change was negative
Table 3 Crude rates of population change 2009-2011 (change per 1000 persons)
Source Eurostat (online data code demo_gind) Note Estonia the population estimates do not include information on net migration See also footnote 4
Eight EU Member States and Croatia reported a negative total population change in 2011 In
most cases this was mainly due to negative net migration (Greece Latvia Lithuania and Portugal) supplemented by negative natural change Conversely the population decrease was
mostly driven by negative natural change in Bulgaria Romania and Croatia supplemented by negative net migration In Estonia and Hungary the population decline was due solely to negative natural change which offset positive net migration
Population ageing continues in the EU-27
The age structure of the population in the EU-27 is becoming older due to increasing life expectancy and consistently low levels of fertility over the past decades Population ageing is a
general process across the EU Member States and is expected to continue in the coming decades
Population age structure on 1 January 2012
Table 4 shows the distribution of population by major age groups in the EU-27 On 1 January 2012 the young population (0-14 years old) accounted for 156 the population aged 15-64 (considered to be the working age population for the purpose of this publication) for 666 and
the population aged 65 and above for 178
Across the Member States the young population (0-14 years old) was largest in Ireland (216 ) and smallest in Germany (132 ) The reverse was observed for older persons in the total population where Germany and Italy recorded the highest proportion (both 206 ) and
Ireland had the lowest share (119 )
The median age of the EU-27 population on 1 January 2012 was 415 years This means that half of the EU-27 population today is 415 years old or more while half is younger The median age of the population in the Member States ranges from 350 years in Ireland to 450 years in
Germany (see Table 5) confirming the relatively young and relatively old population structures in these two countries
Age dependency ratios are used as indicators of the potential support needed by young people (aged 0-14 years) andor older people (aged 65 years or over) from the working-age
population The ratios are expressed in terms of the relative size of the young andor older population compared with the working-age population
Social Europe EU Employment and Social Situation I Quarterly Review
Special Supplement on Demographic Trends
March 2013 I 8
Table 4 Population age structure by major age groups 1 January 2012
Source Eurostat (online data code demo_pjan) Note EU-27 excludes French overseas departments in 1992 The population of unknown age is redistributed for calculating the proportion of the age groups See also footnote 4
In 2012 the old-age dependency ratio (population aged 65 or over in relation to the population aged 15-64) in the EU-27 was 268 This means that the EU had almost 4 persons of working
age for every person aged 65 years or over The old-age dependency ratio in the Member States ranged from 178 in Slovakia to 316 in Italy
Further the total age dependency ratio (calculated as the ratio of children aged 14 and below and older persons aged 65 and above to the population aged 15-64) was 502 in the EU-27
equivalent to about two working-age people for each dependent person In 2012 the lowest total age dependency ratio was in Slovakia (392 ) and the highest in France (555 )
The population pyramids presented in Chart 5 show the structure of the population by sex and
by five-year age groups Each bar corresponds to the share of the given sex and age group in the total population (men and women combined)
The EU-27 population pyramid in 2012 is narrow at the bottom and is becoming more like a
rhomboid due to the baby boomer cohorts resulting from the high fertility rates in several European countries in the mid-1960s (known as the lsquobaby boomrsquo) The baby boomers continue to represent a major part of the working-age population The first of these large cohorts born
over a period of 20-30 years are now reaching retirement age as illustrated by the comparison with the 1992 population pyramid The baby boom bulge is moving up the population pyramid leaving the middle (working-age population aged 15-64) and the base (aged 0-14) narrower
Past and current population ageing trends in the EU-27
Population ageing is a long-term trend that began several decades ago in the EU-27 It is visible in the development of the age structure of the EU population and is reflected by an increasing share of older persons coupled with a declining share of working-age persons in the total
population To illustrate this trend the evolution of the population structure between 1992 and 2012 is analysed below
Between 1992 and 2012 the proportion of working-age population (15-64 years) in the EU-27
increased by 05 percentage points while the proportion of older population (aged 65 and
above) increased by 37 percentage points (see Chart 4) This increase came at the expense of a decrease of 35 percentage points in the proportion of younger people (0-14 years)
Social Europe EU Employment and Social Situation I Quarterly Review
Special Supplement on Demographic Trends
March 2013 I 9
Table 5 Population age structure indicators 1992 and 2012
Source Eurostat (online data code demo_pjanind) Note EU-27 excludes French overseas departments in 1992 See also footnote 4
Chart 4 Population aged 65 years or over ( of the total population)
Source Eurostat (online data code demo_pjanind) Note EU27 excludes French overseas departments in 1992 See also footnote 4
Chart 5 Population pyramids EU-27 1992 and 2012 ( of the total population)
Source Eurostat (online data code demo_pjan) Note EU-27 excludes French overseas departments in 1992 See also footnote 4
Social Europe EU Employment and Social Situation I Quarterly Review
Special Supplement on Demographic Trends
March 2013 I 10
Since the proportion of older people increased between 1992 and 2012 the top of the 2012 age pyramid is larger This relative growth is due primarily to the gains in longevity and is known as lsquoageing at the toprsquo of the population pyramid as a consequence of the significant increase in life expectancy at birth recorded in all EU-27 Member States over the past decades
The consistently low levels of fertility over the decades have contributed to population ageing with fewer births leading to a decline in the proportion of young people in the total population This process is known as lsquoageing at the bottomrsquo of the population pyramid and can be observed
in the narrowing base of the population pyramids between 1992 and 2012 (see Chart 5)
Chart 6 Median age of population EU-27 1992-2012
Source Eurostat (online data code demo_pjanind) Note EU27 excludes French overseas departments in 1992 See also footnote 4
The development in the median age of the EU-27 population also provides an illustration of population ageing In the EU-27 the median age of the total population rose continuously from 357 years in 1992 to 415 in 2012 as shown in Chart 6 It increased in all Member States over that period (Chart 7)
Chart 7 Median age of population
Source Eurostat (online data code demo_pjanind) Note EU27 excludes French overseas departments in 1992 See also footnote 4
Fertility
Fertility steadily declined from the mid-1960s to the turn of the century in the EU countries At the beginning of the last decade however the total fertility rate in the EU-27 has shown some signs of rising again
In 2011 52 million children were born in the EU-27 corresponding to a crude birth rate (the number of live births per 1000 persons) of 104 The highest annual total for the EU-27 was recorded in 1964 with 77 million live births From the 1960s up to the beginning of the 21st century the number of live births in the EU-27 declined sharply from 75 million to a low of 50
million in 2002 (see Chart 3) This was followed by a modest rebound in the number of live births with 54 million children born in the EU-27 in 2008 in turn followed by further annual reductions during the period 2009-2011
Social Europe EU Employment and Social Situation I Quarterly Review
Special Supplement on Demographic Trends
March 2013 I 11
Just below 16 live births per woman in the EU-27
In recent decades Europeans have generally been having fewer children which partly explains the slowdown in the EU-27s population growth The main indicator of fertility is the Total
Fertility Rate (TFR) this is the mean number of children that would be born alive to a woman
during her lifetime if she were to conform to the age-specific fertility rates for a given year throughout her childbearing years A total fertility rate of around 21 live births per woman is
considered to be the replacement level in other words the average number of live births per woman required to keep the population size constant in the absence of inward or outward migration A TFR below 13 live births per woman is described as lowest-low fertility TFR is used as an indicator for the fertility level and is comparable across countries since it takes into
account changes in the size and structure of the population
Table 6 Total fertility rates and mean age of women at childbirth EU-27 2002-2011
Source Eurostat (online data code demo_find) Note See footnote 4
The total fertility rate in the EU-27 has declined to well below the replacement level in recent decades As shown in Table 6 the total fertility rate was 146 live births per woman in the EU-27 in 2002 the first year in which information is available for all 27 Member States A slight
recovery was subsequently observed in most EU Member States with the EU-27 average increasing to 160 live births per woman up to 2010 but then decreasing to 157 in 2011
Table 7 shows the TFR in the EU countries and Croatia for selected years The indicator declined steeply between 1980 and 2000-2002 in many countries to far below the replacement level in
2000 values had fallen below 13 in Bulgaria the Czech Republic Greece Spain Italy Slovenia and Slovakia After bottoming out between 2000 and 2002 the TFR has increased again in most Member States in the nine years to 2011 with all EU countries seeing rates above 13 with the
exception of Hungary Poland and Romania
Table 7 Total fertility rates selected years
Source Eurostat (online data code demo_find) Note See footnote 4
In the past 50 years total fertility rates in the Member States have in general been converging in 1960 and in 1980 the disparity between the highest (Ireland) and the lowest (Hungary in
Social Europe EU Employment and Social Situation I Quarterly Review
Special Supplement on Demographic Trends
March 2013 I 12
1960 Luxembourg in 1980) was 17 while in 1970 it was around 20 By 1990 this difference had decreased to 11 (between Cyprus and Italy) Since 2000 it has fallen to around 08 Ireland and Hungary representing the two extremes in 2011 Ireland and France continued to report the highest fertility rates for the most recent period available (2011) with just over 20
live births per woman In contrast the lowest fertility rates in 2011 were recorded in Hungary
(12 live births per woman) and in Poland and Romania (13 live births per woman) Among the countries for which 1990 data are available nine Member States (Belgium Denmark Greece
France Italy the Netherlands Slovenia Finland and United Kingdom) had a 2011 TFR equal to or higher than their 1990 TFR On the other hand the TFR fell by more than 30 between 1990 and 2011 in Cyprus Hungary Poland Romania and Slovakia In absolute terms the decline in the total fertility rate was largest in Cyprus from 241 in 1990 to 135 in 2011
Mean age at childbirth and at first child are increasing
Another reason that partly explains the downward trend in fertility rates within the EU is the
decision of many parents to delay starting a family While only a relatively short time series is available for the EU-27 as a whole Table 6 shows that the mean age of women at childbirth continued to rise between 2002 and 2011 when it stood at 300 years On the other hand the
slight increase in the total fertility rate observed in recent years may in part be attributed to a catching-up process following this postponing of the decision to have children When women give birth later in life the total fertility rate tends to decrease at first before subsequently recovering A more precise indicator for the postponement of births is the mean age of mothers
at the birth of the first child This indicator is not available for all Member States so it is not available for the EU-27
Chart 8 Mean age of women at first child and total fertility rate 2011
Source Eurostat (online data code demo_find) Note EU-27 BE DK FR IT and UK mean age at first child is not available See also footnote 4
Chart 8 shows that many of the countries with the highest total fertility rate also show high mean age for women at the birth of the first child Four different groups of countries can be
broadly identified based on their average value of the TFR (roughly equal to 16) and on their average value of the mean age at first child (roughly equal to 28) one group is composed of Ireland the Netherlands Finland and Sweden where both the TFR and the mean age at first child are above that average In the opposite quadrant are most of the countries that joined the
EU after 2004 plus Croatia in these countries both the TFR and the mean age of mothers at first child are below the average values The third group of countries have mothers with a higher age at first childbirth and a lower TFR compared to the average this is the case in
Germany Greece Spain Cyprus Luxembourg Austria Portugal and Slovenia The fourth and last group contains just Lithuania where the TFR is higher than the average but mothers are
younger at first child
Chart 9 illustrates the increase in the mean age at first child between 2002 and 2011 for the countries where the information is available for both years The increase was higher than 2 years in the Czech Republic Lithuania Hungary and Slovakia but around 05 years in Luxembourg and in the Netherlands
Social Europe EU Employment and Social Situation I Quarterly Review
Special Supplement on Demographic Trends
March 2013 I 13
Chart 9 Change in mean age of women at first child between 2002 and 2011
Source Eurostat (online data code demo_find) Note See footnote 4
Mortality
Over past years the annual number of deaths in the EU-27 has remained fairly stable at around 49 million In 2011 some 48 million persons died in the EU-27 mdash this was broadly in line with the annual number of deaths recorded over the previous four decades A peak was reached in 1993 and in 1995 with about 5 million deaths The crude death rate which is the number of
deaths per 1000 persons was 96 in the EU-27 in 2011 (see Chart 3)
The most commonly used indicator for analysing mortality is life expectancy at birth this is the mean number of years that a person can expect to live at birth if subjected to current mortality
conditions throughout the rest of his or her life It is a simple but very powerful way of illustrating the trend in mortality The total number of deaths depends on the size of the cohorts reaching the end of their life cycle and on mortality rates Economic development and the
improvement in environmental conditions improved lifestyles advances in healthcare and
medicine including reduced infant mortality have resulted in a continuous and rapid increase in life expectancy at birth across Europe during the last century This process has been going on for longer in Europe than in most other countries of the world making the EU-27 a world leader
for life expectancy Over the past 50 years life expectancy at birth has increased by about 10 years for both men and women in the EU-27 Further gains will be achieved mostly from the reduction in mortality at older ages Besides the reduction in fertility the gradual reduction in
mortality is the main factor contributing to the ageing of the population in the EU-27 While life expectancy is rising in all Members States major differences still exist between and within countries (for example by sex)
Life expectancy is increasing
Life expectancy in the EU-27 is generally higher than in most other regions of the world Life expectancy at birth in the EU-27 was estimated at 804 years in 2011 mdash 832 years for women
and 774 years for men This indicator is only available from 2002 to 2011 for the EU-27 as a whole but even this relatively short period of 10 years saw an increase in life expectancy of 23 years for women and 29 years for men (see Table 8)
Table 8 Life expectancy at birth EU-27 2002-2011
Source Eurostat (online data code demo_mlexpec) Note 2011 estimated See also footnote 4
Significant differences in life expectancy at birth are nevertheless observed between the EU
Member States as shown in Chart 10
For men the lowest life expectancy in 2011 was recorded in Lithuania (681 years) and the highest in Italy (801 years) For women the range was narrower from a low of 778 years in Bulgaria to a high of 857 years in France To compare in 2002 the lowest and highest life
expectancies were recorded in Latvia (647 years) and Sweden (777) for men and in Romania (747 years) and Spain (833) for women In the 10 years between 2002 and 2011 the rise in
Social Europe EU Employment and Social Situation I Quarterly Review
Special Supplement on Demographic Trends
March 2013 I 14
life expectancy at birth for men in the EU Member States ranged from a minimum of 19 years (in Bulgaria and Lithuania) to a maximum of 60 years (in Estonia) For women the increase ranged from 16 years (in Sweden) to 43 years (in Estonia) In 2002 the differences between the highest and lowest life expectancies among EU Member States amounted to 131 years for
men and 86 for women In 2011 the differences were 120 years for men and 79 years for
women Thus while life expectancy has been increasing in all countries it has increased slightly more in some of the countries where it was lower However this catching-up has been slow in
two of the low-life-expectancy countries Bulgaria and Romania
Chart 10 Life expectancy at birth men and women 2002 and 2011
Source Eurostat (online data code demo_mlexpec) Note EU-27 BE and IT 2011 estimated See also footnote 4
In 2011 the gender gap at birth was 58 years of life expectancy (see Chart 11) with women live longer than men in all EU countries However the gap varied substantially between EU Member States In 2011 the largest difference between the sexes was found in Lithuania (112 years) and the smallest in Cyprus and the Netherlands (both 38 years) In the Baltic States
women can expect to live more than 10 years longer than men Conversely the gender gap is less than 5 years in nine Member States In the 10 years up to 2011 the gender gap decreased with the exception of Bulgaria where it increased by 03 years and Poland where it remained
constant The reduction in the gender gap at birth was largest in absolute terms in Luxembourg (from 69 years in 2002 to 51 years in 2011) and Estonia (from 118 years in 2002 to 101 years in 2011) In the EU-27 the gender gap at birth decreased from 64 years in 2002 to 58
in 2011
Chart 11 The gender gap (women ndash men) in life expectancy at birth 2002 and 2011
Source Eurostat (online data code demo_mlexpec)
Social Europe EU Employment and Social Situation I Quarterly Review
Special Supplement on Demographic Trends
March 2013 I 15
Note EU-27 BE and IT 2011 estimated See also footnote 4
As people live longer interest has shifted to the older generations Table 9 shows life
expectancy at age 65 by sex for the EU-27 from 2002 to 2011 these are the only years for which information is available for all 27 Member States As can be seen the increase in life
expectancy for men and women at age 65 was 19 and 20 years respectively The gender gap at age 65 decreased slightly to 35 years in 2011 down from 36 years in 2002
Table 9 Life expectancy at age 65 EU-27 2002-2011
Source Eurostat (online data code demo_mlexpec) Note 2011 estimated See also footnote 4
Chart 12 shows life expectancy at age 65 by country and by sex In 2011 upon reaching the
age of 65 the average man could expect to live additional 134 (in Latvia) to 193 years (in France) The life expectancy of women at age 65 was higher ranging in 2011 from 173 years in Bulgaria to 238 years in France
Chart 12 Life expectancy at age 65 men and women 2002 and 2011
Source Eurostat (online data code demo_mlexpec) Note EU-27 BE and IT 2011 estimated See also footnote 4
Chart 13 shows the changes in the gender gap in life expectancy at age 65 between 2002 and
2011 by country due to the faster increase in life expectancy for women at older ages the gender gaps at age 65 increased in more than half the countries over that period The largest increase was in Estonia and Latvia +08 years between 2002 and 2011The gender gap decreased in the other Member States by more than half a year in Ireland Cyprus Malta and
the Netherlands In 2011 the largest gender gaps were in the Baltic States where women could expect to live more than 5 years longer than men At the other end of the scale the smallest gap 21 years was in Greece and Cyprus
Social Europe EU Employment and Social Situation I Quarterly Review
Special Supplement on Demographic Trends
March 2013 I 16
Chart 13 The gender gap (women ndash men) in life expectancy at age 65 2002 and 2011
Source Eurostat (online data code demo_mlexpec) Note EU-27 BE and IT 2011 estimated See also footnote 4
Falling infant mortality
Life expectancy at birth is improved by the reduced probability of dying One of the most significant changes in recent decades has been the reduction in infant mortality rates Around 20 thousand children died before reaching one year of age in the EU-27 in 2011 the most
recent year for which data are available this figure was almost 37 thousand in 1996 which is the first year for which information is available for all Member States and Croatia
Chart 14 Infant mortality rate 1996 and 2011
Source Eurostat (online data code demo_minfind)
The infant mortality rate almost halved in the EU-27 during the 15 years from 1996 to 2011 from 72 to 39 deaths per 1000 live births (see Chart 14) The biggest reductions were
generally recorded in those EU Member States with higher than average levels of infant mortality in 1996 The decrease in the central and eastern Member States is greater than in the other Member States Despite this progression some Member States still had relatively high
infant mortality rates in 2011 eg Romania (94 deaths per 1000 live births) and Bulgaria (85permil) In 2011 the lowest infant mortality rates in the EU-27 were in Sweden (21 deaths per 1000 live births) Finland (24permil) and Estonia (25permil) about one-fourth of the rates recorded in Romania and Bulgaria
Social Europe EU Employment and Social Situation I Quarterly Review
Special Supplement on Demographic Trends
March 2013 I 17
Migration and migrant population
Immigration to the EU-27 at 17 million
During 2011 there were an estimated 17 million immigrants to the EU-27 from a country
outside the EU-27 In addition 13 million people previously residing in an EU-27 Member State migrated to another Member State
Table 10 Immigration 2009-2011 (in absolute numbers and as a percentage of total
immigration)
Source Eurostat (online data code migr_imm5prv migr_imm1ctz) Note The individual values do not add up to the total due to rounding and to exclusion of the lsquounknownrsquo citizenship group from the table (p) provisional data (b) break in series (s) estimated
Thus about 32 million people immigrated5 to one of the EU-27
6 Member States while at least
23 million emigrants were reported to have left an EU-27 Member State It should be noted that these figures do not represent the migration flows tofrom the EU as a whole since they also include flows between different EU Member States
The United Kingdom reported the largest number of immigrants (566044) in 2011 followed by Germany (489422) Spain (457649) and Italy (385793) These four Member States together accounted for 603 of all immigrants to EU-27 Member States
Spain reported the highest number of emigrants in 2011 (507742) followed by the United
Kingdom (350703) Germany (249045) and France (213367) 16 of the EU-27 Member States reported more immigration than emigration in 2011 but in Bulgaria the Czech Republic Ireland Greece Spain Poland Romania and the three Baltic Member States emigrants
outnumbered immigrants
Relative to the size of the resident population Luxembourg recorded the highest number of immigrants in 2011 (38 immigrants per 1000 persons) followed by Cyprus (26) and Malta (13)
The highest rates of emigration in 2011 were reported for Ireland (19 emigrants per 1 000 persons) and Lithuania (18 emigrants per 1000 persons)
5 A person is considered to have immigrated if he or she establishes his or her usual residence in a Member State for at least twelve months having previously been usually resident in another Member State or a third country as set out in Article 2 of Regulation (EC) 8622007
Social Europe EU Employment and Social Situation I Quarterly Review
Special Supplement on Demographic Trends
March 2013 I 18
Chart 15 Immigrants 2011 (per 1 000 persons)
Source Eurostat (online data code migr_imm1ctz and migr_pop1ctz) Note Data on the number of persons refer to 1 January 2012 for HR
Citizens of non-EU countries can be categorised according to the level of development of their country of citizenship based on the Human Development Index (HDI) calculated by the United
Nations By this measure the largest share (524 of all immigrants to the EU are from medium HDI countries and 346 are from high HDI (but non-EU) countries By contrast low HDI countries (63) EFTA countries (36) and Candidate countries (31) accounted for
relatively low shares of total immigration to the EU-27 in 2011
Chart 16 Share of immigrants by citizenship group EU-27 2011 ()
Source Eurostat (online data code migr_imm5prv) Note Candidate countries as of 1 January 2011 Montenegro Croatia former Yugoslav Republic of Macedonia and Turkey
In 2011 the relative share of returning nationals within the total number of immigrants was highest in Lithuania (893 of all immigrants) Portugal (636) Croatia (553) Estonia (548) and Greece (545) These were the only EU Member States to report return migration higher than 50 By contrast Luxembourg Austria Italy Cyprus and Spain reported
relatively low shares as return migration in 2011 accounted for less than 10 of immigrants
Chart 17 Share of return migrants EU-27 2011 ()
Source Eurostat (online data code migr_imm1ctz)
Regarding the gender distribution of immigrants in 2011 there were slightly more men than women as a whole (521 compared to 479) The country reporting the highest share of male immigrants was Slovakia (624) by contrast the highest share of female immigrants
was reported in Cyprus (552)
Social Europe EU Employment and Social Situation I Quarterly Review
Special Supplement on Demographic Trends
March 2013 I 19
Foreign population at 207 million and foreign-born population at 330 million in EU-27
The EU-27 foreign population (people residing in an EU-27 Member State with citizenship of a non EU-27 Member State) on 1 January 2012 was 207 million representing 41 of the EU-27
population In addition there were 136 million persons living in an EU-27 Member State with
citizenship of another EU-27 Member State on 1 January 2012
Due to better data availability information on citizenship has often been used to study populations with a foreign background However since citizenship can change over time it is also useful to present information by country of birth
There were 330 million people born outside a country of the EU-27 on 1 January 2012 and there were 172 million persons who were born in a different EU-27 Member State from the country of residence Only in Luxembourg Ireland Hungary Cyprus and Malta did foreign-born
persons from other EU-27 countries outnumber those born outside the EU-27 People born abroad outnumbered foreign citizens in all Member States except Luxembourg Latvia and the Czech Republic
Table 11 Foreign and foreign-born population by group of citizenship and country of birth 1
January 2012 (in absolute numbers and as a percentage of the total foreignforeign-born
population)
Source Eurostat (online data code migr_pop1ctz) Note The individual values do not add up to the total due to rounding and to exclusion of the lsquounknownrsquo citizenship group from the table Population data for HR comes from 2011 Census as on 31 March 2011 (p) provisional data (s) estimated
In absolute terms the largest numbers of foreigners living in the EU on 1 January 2012 were
found in Germany (74 million) Spain (55 million) Italy (48 million) the United Kingdom (48 million) and France (38 million) Non-nationals in these five Member States collectively represented 771 of the total number of non-nationals living in the EU-27 while the same five Member States had a 629 share of the EUrsquos population In relative terms the EU-27 Member
State with the highest share of non-nationals was Luxembourg where they accounted for 438 of the total population The vast majority (864) of non-nationals living in Luxembourg were citizens of other EU Member States As at 1 January 2012 a high proportion of non-
nationals (10 or more of the resident population) was also observed in Cyprus Latvia
Estonia Spain Austria and Belgium
In most EU Member States the majority of non-nationals are citizens of non-EU countries At the
beginning of 2012 citizens of other EU-27 Member States represented the majority of non-nationals living in Luxembourg Ireland Belgium Slovakia Cyprus and Hungary In Latvia and Estonia the proportion of citizens from non-EU countries is particularly large due to the high
Social Europe EU Employment and Social Situation I Quarterly Review
Special Supplement on Demographic Trends
March 2013 I 20
number of recognised non-citizens (mainly former Soviet Union citizens who are permanently resident in these countries but have not acquired citizenship)
Chart 18 Share of foreigners in the resident population EU-27 1 January 2012 ()
Source Eurostat (online data code migr_pop1ctz)
Looking at the distribution by continent of citizens of non-EU countries living in the EU the largest proportion (385) were citizens of a European country outside the EU-27 A total of 79
million citizens from European countries outside the EU-27 were residing in the EU at the start of 2012 among these more than half were citizens of Turkey Albania or Ukraine The next biggest group was from Africa (245) followed by Asia (220) the Americas (142) and Oceania (08) More than half the African citizens living in the EU were from North Africa
often from Morocco or Algeria Many Asian citizens living in the EU came from southern or eastern Asia in particular from India or China Citizens of Ecuador and the United States made up the largest share of non-nationals from the Americas living in the EU
Chart 19 Citizens of non-EU countries
resident in the EU-27 by continent of origin
1 January 2012 ()
Chart 20 Non-EU citizens resident in the
EU-27 by level of human development index
(HDI) of country of citizenship 1 January
2012 ()
Source Eurostat
Among the non-EU citizens living in the EU-27 in 2012 some 442 were citizens of a high HDI country (with Turkey Albania and Russia accounting for almost half) while a slightly higher share (483) came from medium HDI countries (one fifth from Morocco followed by China and Ukraine) the remaining 76 were from low HDI countries (30 with Nigerian or Iraqi
citizenship)
The citizenship structure of the population of non-nationals living in the EU varies greatly between Member States It is influenced by factors such as labour migration historical links
between countries of origin and destination and established networks in destination countries Romanians (living in another EU Member State) and Turkish citizens were the biggest groups of non-nationals living in the EU-27 in 2012 There were 23 million citizens from each of these
countries each group accounting for 70 of all non-nationals living in the EU-27 in 2012 The third largest group was Moroccans (19 million people or 56 of all non-nationals) The group of non-nationals living in the EU with the most significant increase over the period from 2001 to
Social Europe EU Employment and Social Situation I Quarterly Review
Special Supplement on Demographic Trends
March 2013 I 21
2012 was Romanians (living in another EU Member State) their numbers increasing almost eight-fold from 03 million in 2001 to 24 million by 2012
Chart 21 Main countries of origin of non-nationals EU-27 1 January 2012 (million)
Note 1 Estimates Eurostat
An analysis of the age structure of the population shows that for the EU-27 as a whole the foreign population was younger than the national population The distribution by age of
foreigners shows compared to nationals a greater proportion of relatively young working age adults In 2012 the median age of the national population in the EU-27 was 419 years while the median age of foreigners living in the EU was 347 years
Chart 22 Age structure of the national and foreign population EU-27 1 January 2012 ()
Source Eurostat (online data code migr_pop2ctz)
Acquisition of citizenship down by 35 in 2011
The number of people acquiring the citizenship of an EU-27 Member State in 2011 was 782200
corresponding to a 35 decrease with respect to 2010 2010 saw the greatest number of people acquiring the citizenship of an EU Member State since 2001 and the first time that the total number rose above 08 million
The United Kingdom had the highest number of persons acquiring citizenship in 2011 at 177
600 (or 227 of the EU-27 total) The next highest numbers were in France (114584) Spain (114599) and Germany (109594) none of the remaining Member States granted citizenship to more than 100000 people in 2011
Social Europe EU Employment and Social Situation I Quarterly Review
Special Supplement on Demographic Trends
March 2013 I 22
Table 12 Number of persons having acquired the citizenship of the reporting country 2001-2011
(thousand)
Source Eurostat (online data code migr_acq)
In absolute terms the highest decreases were observed in France (28691 fewer persons were
granted French citizenship compared to 2010) followed by the United Kingdom (17277) Italy (9785) and Spain (9122) The highest decreases in relative terms were recorded in Latvia (326 fewer persons acquired citizenship in 2011) and Bulgaria (312)
One indicator commonly used to measure the effect of national policies on citizenship is the lsquonaturalisation ratersquo or the ratio between the total number of citizenships granted and the stock of foreign residents in a country at the beginning of the year The country with the highest naturalisation rate in 2011 was Hungary (98 acquisitions per 100 foreign residents) followed
by Poland (67) and Sweden (58) while Malta Portugal and the United Kingdom all reported rates between 4 and 5 acquisitions per 100 foreign residents
Chart 23 Naturalisation rate 2011 (per 100 foreign residents)
Source Eurostat (online data code migr_acq and migr_pop1ctz)
About 867 of those who acquired citizenship of an EU-27 Member State in 2011 were
previously citizens of a non-EU country This was the case in nearly all of the Member States These new EU-27 citizens came mainly from Africa (262 of the total) Asia (226) non-
EU27 Europe (189) and North and South America (169) EU-27 citizens who acquired citizenship of another Member State amounted to 82 263 persons accounting for 105 of the
total In absolute terms the main groups of EU citizens acquiring citizenship of another EU Member State were Romanians becoming citizens of Hungary (15658 persons) and Italy (3921 persons) Poles becoming citizens of Germany (4344 persons) and Portuguese becoming citizens
of France (3805 persons)
Social Europe EU Employment and Social Situation I Quarterly Review
Special Supplement on Demographic Trends
March 2013 I 23
In Luxembourg and Hungary the majority of new citizenships granted were to citizens of another EU Member State In the case of Luxembourg Portuguese citizens accounted for the largest share while in the case of Hungary those acquiring citizenship were almost exclusively Romanians
As in previous years the largest groups of new citizens in the EU Member States in 2011 were citizens of Morocco (64200 corresponding to 82 of all citizenships granted) and Turkey (48800 or 62) Compared with 2010 the number of Moroccan citizens acquiring citizenship
of an EU Member State decreased by 44 while the figure for Turkish citizens fell by 20 The largest share of Moroccans acquired their new citizenship in France (326) Spain (224) and Italy (167) while the highest proportion of Turkish nationals acquired their new citizenship in Germany (575) and France (129)
Marriages and divorces
The number of marriages is decreasing and the number of divorces is increasing although the trend in marriages may be due in part to ageing of the population In addition more and more
children are being born to un-married women and the countries with the highest extramarital birth rates are often also those with the highest fertility rates
Marriage as recognised by the law in each country has long been considered to indicate family
formation However the analysis of trends in family formation and dissolution based on just marriage and divorce data might not offer a full picture Legal alternatives to marriage like registered partnership have become more widespread and national legislation has evolved to confer more rights on unmarried couples Alongside these new legal forms other forms of non-
marital relationships have appeared making it more difficult for statisticians to collect data that can be compared across countries
Due to differences in the timing and formal recognition of changing patterns of family formation
and dissolution these concepts have become more difficult to operationalise
Fewer marriages more divorces
22 million marriages took place in the EU-27 in 2010 and 10 million divorces occurred in the
EU-27 in 2009 according to the most recent available aggregated data These figures may be expressed as 44 marriages for every 1000 persons (ie the crude marriage rate) and 19 divorces for every 1000 persons (ie the crude divorce rate)
Since 1965 the crude marriage rate in the EU-27 has declined by some 43 in relative terms
(from 77 per 1000 persons in 1965 to 44 in 2010)
Chart 24 Crude marriage and divorce rates EU-27
Source Eurostat (online data codes demo_nind and demo_ndivind) Note The series of divorce rate in EU-27 is discontinued due to unavailability of data by Member States to be aggregated
At the same time marriages have become less stable in the EU-27 as indicated by the increase in the crude divorce rate from 08 per 1000 persons in 1965 to 21 in 2007 Part of this increase
is due to the fact that in several countries divorce was legalised during the period Over 2008 and 2009 however the annual number of divorces decreased slightly to 19 per 1000 persons in 2009
Table 13 shows that in 2011 the crude marriage rate among the EU-27 Member States was highest in Cyprus (73 per 1000 persons) Lithuania (63) and Malta (61) At the other end of
Social Europe EU Employment and Social Situation I Quarterly Review
Special Supplement on Demographic Trends
March 2013 I 24
the scale the lowest crude marriage rates were reported by Bulgaria (29 per 1000 persons) Slovenia (32) and Luxembourg (33)
Table 13 Crude marriage rate (marriages per 1000 persons)
Source Eurostat (online data code demo_nind) Note EU-27 excludes French overseas departments for 1960 to 1990 CY Up to and including 2000 data refer to total marriages contracted in the country including marriages between non-residents 2009-2011 data refer to marriages where at least one spouse was resident in the country
As regards divorce Ireland (07 per 1000 persons) and several southern European Member
States including Italy (09) Slovenia (11) and Greece (12) have significantly lower crude divorce rates than Latvia (40 per 1000 persons) Lithuania (34) and Belgium (29) Divorce
became legal in Malta in 2011 so the first data available in 2011 show only 01 divorces per 1000 persons
Table 14 Crude divorce rate (divorces per 1000 persons)
Source Eurostat (online data code demo_ndivind) Note EU-27 excludes French overseas departments for 1960 to 1990 Divorce was not possible by law in Italy until 1970 in Spain until 1981 in Ireland until 1995 and in Malta until 2011
A rise in births outside marriage
The proportion of births outside marriage in the EU-27 in 2011 was 395 It continues to
increase signalling new patterns of family formation alongside the more traditional pattern
where children are born within marriage Extramarital births occur in non-marital relationships among cohabiting couples and to lone parents
Social Europe EU Employment and Social Situation I Quarterly Review
Special Supplement on Demographic Trends
March 2013 I 25
Table 15 Live births outside marriage ( share of total live births)
Source Eurostat (online data code demo_find) Note EU-27 excludes French overseas departments for 1960 to 1990 and excludes Romania for 1990
Extra-marital births increased in almost every country in the EU-27 during 2011 with the exception of Ireland Malta and Sweden In six Member States the majority of live births are
now outside marriage Estonia (597) Slovenia (568) Bulgaria (561) France (558) Sweden (543) and Belgium (500) Mediterranean countries like Greece Croatia Cyprus Italy and Malta along with Poland Lithuania and Romania are at the other end of the scale
with a large proportion over 70 of births occurring within marriage
Chart 25 Proportion of live births outside marriage and total fertility rate 2011
Source Eurostat (online data code demo_find)
Countries with higher proportions of births outside marriage often have higher fertility rates In France Sweden Belgium Denmark the United Kingdom and Netherlands high rates of live births outside marriage (above 45 of total live births) are associated with total fertility rates
above the EU-27 average (157 live births per woman in 2011) (Chart 25)
Social Europe EU Employment and Social Situation I Quarterly Review
Special Supplement on Demographic Trends
March 2013 I 26
Population development and employment growth
A what-if analysis can be instructive and tell how far employment growth can be sustained under current demographic trends The analysis below is based on the 2010 Eurostat demographic projections The scenarios are exclusively on the supply side and do not take into
account projections of labour demand
Europe 2020 targets promote lower school drop-out rates higher rates of tertiary education and higher employment In the past school drop-out rates have been decreasing though not as fast
as targeted earlier tertiary education has been increasing steadily employment grew until 2008 then decreased especially for young adults and migrants
In 2010 14 of EU residents aged 18-24 were not in education or training and did not have an upper secondary school diploma They are called lsquoearly leaversrsquo and the aim is to bring this
figure down to 10 by 2020 Even though more young adults complete secondary education and more are motivated to continue with education or training if current trends continue the outcome is likely to fall short of the objective
On the other hand the education levels of todayrsquos 20-24 year-olds is higher than it was 10 years ago As a result at current growth rates in 2020 40 of 30-34 year-olds are likely to have a tertiary degree thereby achieving the tertiary education target
Scenarios for the EU-27
The estimates in the text above and those in Chart 26 and Table 16 are based on Eurostatrsquos Population projections (Europop 2010) and annual Labour Force Survey employment and
education attainment rates as well as assumptions based on the Europe 2020 targets on education and employment
Chart 26 Population by sex age group an employment EU-27 2010 and 2030 (million)
2010 age 2030
90
80
70
60
50
40
30
20
10
0
Source Eurostat (online data codes proj_10c lfsa_ergan lfsa_ergaed lfsa_pgaed) and DG EMPL computations
In Chart 26 the 2030 employment counts were computed by assuming that employment rates remain constant across ages sex origin and education level whereas educational attainment rates follow observed trends This means that the education levels of each 5-year cohort (for instance those aged 20-24 in 2010) will change over time according to changes observed in the
period 2006-2011 as a result during the following five projection years some of its ISCED7 0-2 people will graduate to ISCED 3-4 and some of its (and newly graduated) ISCED 3-4 will graduate to ISCED 5-6 These graduation rates are assumed to depend on age and to remain
constant in the future
Education trends consist of two components The first is the educational level of young adults (aged 15-19) The ISCED 3-4 attainment of this group has been increasing and this trend is
assumed to continue tapering to a maximum of 25 in the long run Transitions between
7 International Standard Classification of Education see httpwwwuisunescoorgEducationPagesinternational-standard-classification-of-educationaspx
20 10 10 20 20 10 10 20
Social Europe EU Employment and Social Situation I Quarterly Review
Special Supplement on Demographic Trends
March 2013 I 27
education levels at successive ages are assumed to be constant It must be considered that as education levels continue rising they continue to raise employment rates In present scenarios as better-educated cohorts replace less-well educated ones the global employment rate rises and so does overall employment
The observed overall increase so far is largely the net effect of composition change where the positive impact of the increase in educational attainment more than offsets the negative impact of our active-age population becoming increasingly older or of migrant origin (non-EU-27)
Under these assumptions Chart 26 shows total employment declining by 5 million that is 25 from 2010 to 2030 the employment rate of those aged 20-64 in 2020 would be 685 a slight increase and far below the Europe 2020 target The reason for this change would be the rise in education levels mitigated by an ageing population and a growing proportion of
migrants Economic dependency8 would rise from 132 in 2010 to 147 in 2030 In Table 16 this is the lsquotrend education with constant employment ratesrsquo scenario
The Social Investment Package9 calls for measures that increase labour participation
employability and productivity It is important to analyse the feasibility and consequences of raising education levels and labour participation to assess the suitability of the measures envisaged
For instance focusing on opportunities for disadvantaged workers may bring in more people with lower skills and the changing skills composition would affect productivity10 In addition it pays to understand the impact of current population trends in education
Table 16 summarises employment in 2020 and 2030 under several scenarios Its purpose is to
analyse the difficulty and impact in 2030 of reaching the Europe 2020 employment objectives
The first scenario includes demographic change but no rise in educational attainment It is purely mechanical and its only purpose is to assess the impact of skills renewal due to cohort
turnover as older less-well-educated worker cohorts leave the labour market younger better-educated cohorts join it Although skills renewal is now slower than it was in the past 2-3 decades because of demographic changes the impact remains high
The second scenario allows for education to continue progressing as it did in the past thereby shifting overall employment Without an effort to attain the Europe 2020 employment objectives the EU-27 workforce will become older but also better educated As a result employment will be stable until 2020 but will decrease by 2-3 by 2030 feeling the impact of
demographics The declining population of working age will increasingly consist of older workers
The third scenario assumes that the Europe 2020 targets on education will be attained and the
trend towards a better-educated work force will continue after 2020 Here we should underline that
under the assumption that current education transitions continue the tertiary education
target would also be attained
Europe 2020 education targets will have a small impact on employment in 2030 This is because the targeted increase in tertiary attainment and the reduction in early leavers will affect only the very young cohorts of workers so that the effect will not materialise
by 2030 however the impact will be far larger after 2030
The fourth scenario assumes that in addition to the Europe 2020 target for education the target on employment will also be attained As regards those aged 65 and above this scenario
envisages the same rates of increase for employment as for people aged 55-64 Employment rate increases from 2010 to 2020 then assumed go on till 2030
But attaining the Europe 2020 employment target would require tapping into a potential labour
force consisting largely of older people and so-far inactive migrants These cohorts tend to be less educated than the rest of the labour force This means that not only will activating them be
harder but also that they will contribute to the less-skilled workforce whereas there is strong
8 Economic dependency is the ratio between the number of people not in employment and those who are 9 See COM(2013) 83 10 See Employment and Social Developments in Europe Chapter 4 p 279
Social Europe EU Employment and Social Situation I Quarterly Review
Special Supplement on Demographic Trends
March 2013 I 28
evidence suggesting that demand in future decades will concentrate on high-skilled rather than low-skilled workers11
Table 16 Work force scenarios under Europe 2020 assumptions EU-27 2020 and 2030
Source Eurostat (online data codes proj_10c lfsa_ergan lfsa_ergaed lfsa_pgaed) and DG EMPL computations Note (1) only EU citizens
Employment gains among women and young people who tend to be better educated may be easier to achieve and yield higher productivity gains however they alone will not mean the Europe 2020 employment target is met Up skilling via continuing education and training is
another way to motivate and nurture a productive workforce12
Differences among Member States
Population developments in the various Member States differ as the rate of ageing varies and
these find themselves in different phases For instance eastern States have relatively young and slowly-ageing populations now but face the prospect of very rapid ageing from 2025 onwards13 In addition some Member States already make better use of their potential work
forces with higher education and employment rates than others
In the past two decades employment and productivity growth fuelled economic growth in roughly equal measure The observed pre-crisis 1 employment growth ended in 2008 When
the crisis abates employment can resume growth but this will be limited in future
Demographic ageing and workforce decline will create bottlenecks to the available labour force in the medium term even though at present countries still have un-deployed human resources which could potentially yield further employment growth
Chart 27 outlines the Member Statesrsquo different potentials for continuing employment growth Assuming that the EUrsquos economic and social system will need 1 employment growth Member States differ as to when such a lsquosustainablersquo growth path will have to come to an end simply
because human resources become scarce
Two scenarios are presented14
Under the first scenario there will be no further progress in activation its growth-end
year is the upper end of the blue bar in Chart 27
Under the second scenario each country exploits the maximum activation potential of women older people and educational progress its growth-end year is the upper end of the yellow bar in Chart 27 Four Member States can continue growing beyond 2040
11 See for instance httpwwwcedefopeuropaeuENpublications20633aspx
12 Source httpeceuropaeusocialmainjsplangId=enampcatId=113ampnewsId=1774ampfurtherNews=yes chapter 69 13 See the 2010 Demography Report (chapter I5)
14 See draft paper of C Fotakis J Peschner (2013) lsquo Growth potential of EU human resources and policy implications for future economic growthrsquo not yet published
Social Europe EU Employment and Social Situation I Quarterly Review
Special Supplement on Demographic Trends
March 2013 I 29
The Member States with the longer bars whose maximum potential for growth reaches further into the future are of two types Some have strong population growth and slow ageing such as Ireland others have large unused capacity to tap by increasing participation in (education and) labour
More critically the EU-27 is projected to have a large shortfall of well-educated (ISCED 5-6) workers Although their number will grow by virtue of rising education levels in the population this projected growth is slower than the increase in demand
Chart 27 Year in which a continued 1 employment growth from 2011 is projected to stop by
country
Source FotakisPeschner (2013)6 based on Eurostat LFS
In addition the untapped potential consists mainly of less-well educated people for two
reasons First the better educated are already well involved in the labour market Secondly the most promising sources of additional labour ie older people and migrants tend to be less well educated than prime-age EU nationals
Thus as regards high-skilled workers the time-window for growth is more limited Even the best activation policies can only palliate and delay the onset of shortages for just a few years
Social Europe EU Employment and Social Situation I Quarterly Review
Special Supplement on Demographic Trends
March 2013 I 30
European Commission
EU Employment and Social Situation Quarterly Review March 2013 ndash Special
Supplement on Demographic Trends
Luxembourg Publications Office of the European Union
2013 mdash 30 pp mdash 21 times 297 cm
ISBN 978-92-79-29383-2
ISSN 1977-8317 doi 10276741278
This publication is available in electronic format in English
KE-BH-13-0S2-EN-N
- Table of Contents
- Introduction
- Population change and age structure
- Fertility
- Mortality
- Migration and migrant population
- Marriages and divorces
- Population development and employment growth
-
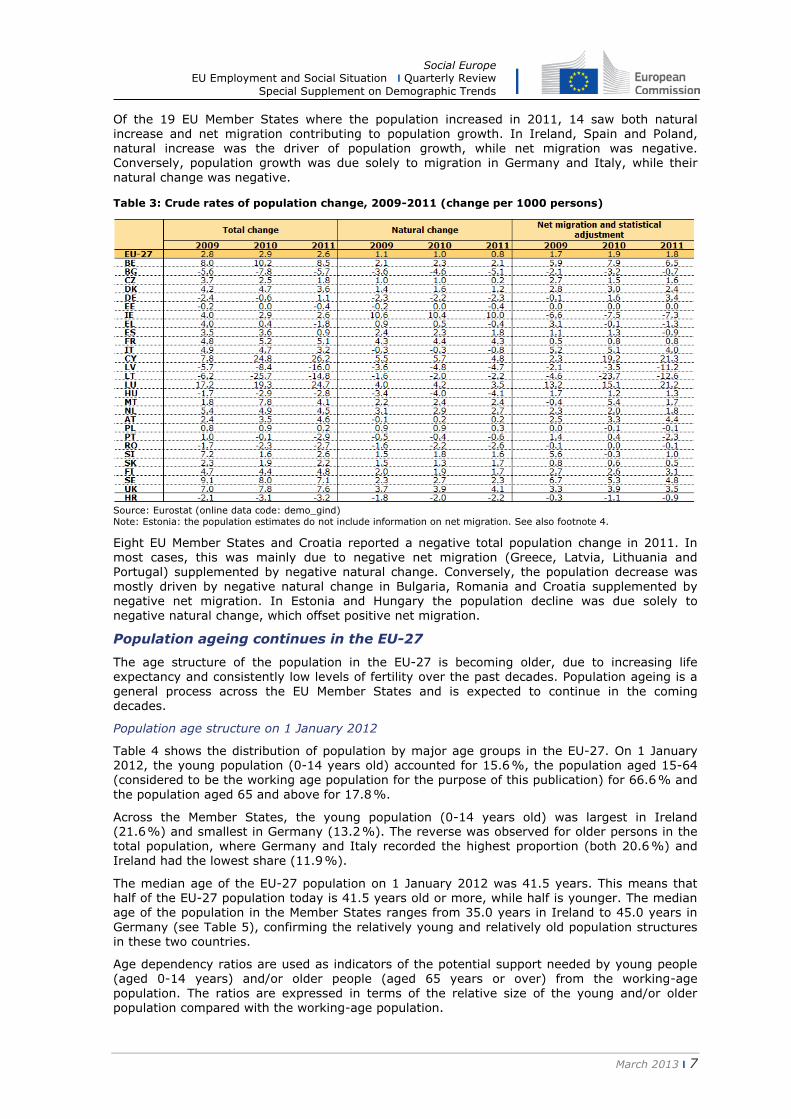
Social Europe EU Employment and Social Situation I Quarterly Review
Special Supplement on Demographic Trends
March 2013 I 11
Just below 16 live births per woman in the EU-27
In recent decades Europeans have generally been having fewer children which partly explains the slowdown in the EU-27s population growth The main indicator of fertility is the Total
Fertility Rate (TFR) this is the mean number of children that would be born alive to a woman
during her lifetime if she were to conform to the age-specific fertility rates for a given year throughout her childbearing years A total fertility rate of around 21 live births per woman is
considered to be the replacement level in other words the average number of live births per woman required to keep the population size constant in the absence of inward or outward migration A TFR below 13 live births per woman is described as lowest-low fertility TFR is used as an indicator for the fertility level and is comparable across countries since it takes into
account changes in the size and structure of the population
Table 6 Total fertility rates and mean age of women at childbirth EU-27 2002-2011
Source Eurostat (online data code demo_find) Note See footnote 4
The total fertility rate in the EU-27 has declined to well below the replacement level in recent decades As shown in Table 6 the total fertility rate was 146 live births per woman in the EU-27 in 2002 the first year in which information is available for all 27 Member States A slight
recovery was subsequently observed in most EU Member States with the EU-27 average increasing to 160 live births per woman up to 2010 but then decreasing to 157 in 2011
Table 7 shows the TFR in the EU countries and Croatia for selected years The indicator declined steeply between 1980 and 2000-2002 in many countries to far below the replacement level in
2000 values had fallen below 13 in Bulgaria the Czech Republic Greece Spain Italy Slovenia and Slovakia After bottoming out between 2000 and 2002 the TFR has increased again in most Member States in the nine years to 2011 with all EU countries seeing rates above 13 with the
exception of Hungary Poland and Romania
Table 7 Total fertility rates selected years
Source Eurostat (online data code demo_find) Note See footnote 4
In the past 50 years total fertility rates in the Member States have in general been converging in 1960 and in 1980 the disparity between the highest (Ireland) and the lowest (Hungary in
Social Europe EU Employment and Social Situation I Quarterly Review
Special Supplement on Demographic Trends
March 2013 I 12
1960 Luxembourg in 1980) was 17 while in 1970 it was around 20 By 1990 this difference had decreased to 11 (between Cyprus and Italy) Since 2000 it has fallen to around 08 Ireland and Hungary representing the two extremes in 2011 Ireland and France continued to report the highest fertility rates for the most recent period available (2011) with just over 20
live births per woman In contrast the lowest fertility rates in 2011 were recorded in Hungary
(12 live births per woman) and in Poland and Romania (13 live births per woman) Among the countries for which 1990 data are available nine Member States (Belgium Denmark Greece
France Italy the Netherlands Slovenia Finland and United Kingdom) had a 2011 TFR equal to or higher than their 1990 TFR On the other hand the TFR fell by more than 30 between 1990 and 2011 in Cyprus Hungary Poland Romania and Slovakia In absolute terms the decline in the total fertility rate was largest in Cyprus from 241 in 1990 to 135 in 2011
Mean age at childbirth and at first child are increasing
Another reason that partly explains the downward trend in fertility rates within the EU is the
decision of many parents to delay starting a family While only a relatively short time series is available for the EU-27 as a whole Table 6 shows that the mean age of women at childbirth continued to rise between 2002 and 2011 when it stood at 300 years On the other hand the
slight increase in the total fertility rate observed in recent years may in part be attributed to a catching-up process following this postponing of the decision to have children When women give birth later in life the total fertility rate tends to decrease at first before subsequently recovering A more precise indicator for the postponement of births is the mean age of mothers
at the birth of the first child This indicator is not available for all Member States so it is not available for the EU-27
Chart 8 Mean age of women at first child and total fertility rate 2011
Source Eurostat (online data code demo_find) Note EU-27 BE DK FR IT and UK mean age at first child is not available See also footnote 4
Chart 8 shows that many of the countries with the highest total fertility rate also show high mean age for women at the birth of the first child Four different groups of countries can be
broadly identified based on their average value of the TFR (roughly equal to 16) and on their average value of the mean age at first child (roughly equal to 28) one group is composed of Ireland the Netherlands Finland and Sweden where both the TFR and the mean age at first child are above that average In the opposite quadrant are most of the countries that joined the
EU after 2004 plus Croatia in these countries both the TFR and the mean age of mothers at first child are below the average values The third group of countries have mothers with a higher age at first childbirth and a lower TFR compared to the average this is the case in
Germany Greece Spain Cyprus Luxembourg Austria Portugal and Slovenia The fourth and last group contains just Lithuania where the TFR is higher than the average but mothers are
younger at first child
Chart 9 illustrates the increase in the mean age at first child between 2002 and 2011 for the countries where the information is available for both years The increase was higher than 2 years in the Czech Republic Lithuania Hungary and Slovakia but around 05 years in Luxembourg and in the Netherlands
Social Europe EU Employment and Social Situation I Quarterly Review
Special Supplement on Demographic Trends
March 2013 I 13
Chart 9 Change in mean age of women at first child between 2002 and 2011
Source Eurostat (online data code demo_find) Note See footnote 4
Mortality
Over past years the annual number of deaths in the EU-27 has remained fairly stable at around 49 million In 2011 some 48 million persons died in the EU-27 mdash this was broadly in line with the annual number of deaths recorded over the previous four decades A peak was reached in 1993 and in 1995 with about 5 million deaths The crude death rate which is the number of
deaths per 1000 persons was 96 in the EU-27 in 2011 (see Chart 3)
The most commonly used indicator for analysing mortality is life expectancy at birth this is the mean number of years that a person can expect to live at birth if subjected to current mortality
conditions throughout the rest of his or her life It is a simple but very powerful way of illustrating the trend in mortality The total number of deaths depends on the size of the cohorts reaching the end of their life cycle and on mortality rates Economic development and the
improvement in environmental conditions improved lifestyles advances in healthcare and
medicine including reduced infant mortality have resulted in a continuous and rapid increase in life expectancy at birth across Europe during the last century This process has been going on for longer in Europe than in most other countries of the world making the EU-27 a world leader
for life expectancy Over the past 50 years life expectancy at birth has increased by about 10 years for both men and women in the EU-27 Further gains will be achieved mostly from the reduction in mortality at older ages Besides the reduction in fertility the gradual reduction in
mortality is the main factor contributing to the ageing of the population in the EU-27 While life expectancy is rising in all Members States major differences still exist between and within countries (for example by sex)
Life expectancy is increasing
Life expectancy in the EU-27 is generally higher than in most other regions of the world Life expectancy at birth in the EU-27 was estimated at 804 years in 2011 mdash 832 years for women
and 774 years for men This indicator is only available from 2002 to 2011 for the EU-27 as a whole but even this relatively short period of 10 years saw an increase in life expectancy of 23 years for women and 29 years for men (see Table 8)
Table 8 Life expectancy at birth EU-27 2002-2011
Source Eurostat (online data code demo_mlexpec) Note 2011 estimated See also footnote 4
Significant differences in life expectancy at birth are nevertheless observed between the EU
Member States as shown in Chart 10
For men the lowest life expectancy in 2011 was recorded in Lithuania (681 years) and the highest in Italy (801 years) For women the range was narrower from a low of 778 years in Bulgaria to a high of 857 years in France To compare in 2002 the lowest and highest life
expectancies were recorded in Latvia (647 years) and Sweden (777) for men and in Romania (747 years) and Spain (833) for women In the 10 years between 2002 and 2011 the rise in
Social Europe EU Employment and Social Situation I Quarterly Review
Special Supplement on Demographic Trends
March 2013 I 14
life expectancy at birth for men in the EU Member States ranged from a minimum of 19 years (in Bulgaria and Lithuania) to a maximum of 60 years (in Estonia) For women the increase ranged from 16 years (in Sweden) to 43 years (in Estonia) In 2002 the differences between the highest and lowest life expectancies among EU Member States amounted to 131 years for
men and 86 for women In 2011 the differences were 120 years for men and 79 years for
women Thus while life expectancy has been increasing in all countries it has increased slightly more in some of the countries where it was lower However this catching-up has been slow in
two of the low-life-expectancy countries Bulgaria and Romania
Chart 10 Life expectancy at birth men and women 2002 and 2011
Source Eurostat (online data code demo_mlexpec) Note EU-27 BE and IT 2011 estimated See also footnote 4
In 2011 the gender gap at birth was 58 years of life expectancy (see Chart 11) with women live longer than men in all EU countries However the gap varied substantially between EU Member States In 2011 the largest difference between the sexes was found in Lithuania (112 years) and the smallest in Cyprus and the Netherlands (both 38 years) In the Baltic States
women can expect to live more than 10 years longer than men Conversely the gender gap is less than 5 years in nine Member States In the 10 years up to 2011 the gender gap decreased with the exception of Bulgaria where it increased by 03 years and Poland where it remained
constant The reduction in the gender gap at birth was largest in absolute terms in Luxembourg (from 69 years in 2002 to 51 years in 2011) and Estonia (from 118 years in 2002 to 101 years in 2011) In the EU-27 the gender gap at birth decreased from 64 years in 2002 to 58
in 2011
Chart 11 The gender gap (women ndash men) in life expectancy at birth 2002 and 2011
Source Eurostat (online data code demo_mlexpec)
Social Europe EU Employment and Social Situation I Quarterly Review
Special Supplement on Demographic Trends
March 2013 I 15
Note EU-27 BE and IT 2011 estimated See also footnote 4
As people live longer interest has shifted to the older generations Table 9 shows life
expectancy at age 65 by sex for the EU-27 from 2002 to 2011 these are the only years for which information is available for all 27 Member States As can be seen the increase in life
expectancy for men and women at age 65 was 19 and 20 years respectively The gender gap at age 65 decreased slightly to 35 years in 2011 down from 36 years in 2002
Table 9 Life expectancy at age 65 EU-27 2002-2011
Source Eurostat (online data code demo_mlexpec) Note 2011 estimated See also footnote 4
Chart 12 shows life expectancy at age 65 by country and by sex In 2011 upon reaching the
age of 65 the average man could expect to live additional 134 (in Latvia) to 193 years (in France) The life expectancy of women at age 65 was higher ranging in 2011 from 173 years in Bulgaria to 238 years in France
Chart 12 Life expectancy at age 65 men and women 2002 and 2011
Source Eurostat (online data code demo_mlexpec) Note EU-27 BE and IT 2011 estimated See also footnote 4
Chart 13 shows the changes in the gender gap in life expectancy at age 65 between 2002 and
2011 by country due to the faster increase in life expectancy for women at older ages the gender gaps at age 65 increased in more than half the countries over that period The largest increase was in Estonia and Latvia +08 years between 2002 and 2011The gender gap decreased in the other Member States by more than half a year in Ireland Cyprus Malta and
the Netherlands In 2011 the largest gender gaps were in the Baltic States where women could expect to live more than 5 years longer than men At the other end of the scale the smallest gap 21 years was in Greece and Cyprus
Social Europe EU Employment and Social Situation I Quarterly Review
Special Supplement on Demographic Trends
March 2013 I 16
Chart 13 The gender gap (women ndash men) in life expectancy at age 65 2002 and 2011
Source Eurostat (online data code demo_mlexpec) Note EU-27 BE and IT 2011 estimated See also footnote 4
Falling infant mortality
Life expectancy at birth is improved by the reduced probability of dying One of the most significant changes in recent decades has been the reduction in infant mortality rates Around 20 thousand children died before reaching one year of age in the EU-27 in 2011 the most
recent year for which data are available this figure was almost 37 thousand in 1996 which is the first year for which information is available for all Member States and Croatia
Chart 14 Infant mortality rate 1996 and 2011
Source Eurostat (online data code demo_minfind)
The infant mortality rate almost halved in the EU-27 during the 15 years from 1996 to 2011 from 72 to 39 deaths per 1000 live births (see Chart 14) The biggest reductions were
generally recorded in those EU Member States with higher than average levels of infant mortality in 1996 The decrease in the central and eastern Member States is greater than in the other Member States Despite this progression some Member States still had relatively high
infant mortality rates in 2011 eg Romania (94 deaths per 1000 live births) and Bulgaria (85permil) In 2011 the lowest infant mortality rates in the EU-27 were in Sweden (21 deaths per 1000 live births) Finland (24permil) and Estonia (25permil) about one-fourth of the rates recorded in Romania and Bulgaria
Social Europe EU Employment and Social Situation I Quarterly Review
Special Supplement on Demographic Trends
March 2013 I 17
Migration and migrant population
Immigration to the EU-27 at 17 million
During 2011 there were an estimated 17 million immigrants to the EU-27 from a country
outside the EU-27 In addition 13 million people previously residing in an EU-27 Member State migrated to another Member State
Table 10 Immigration 2009-2011 (in absolute numbers and as a percentage of total
immigration)
Source Eurostat (online data code migr_imm5prv migr_imm1ctz) Note The individual values do not add up to the total due to rounding and to exclusion of the lsquounknownrsquo citizenship group from the table (p) provisional data (b) break in series (s) estimated
Thus about 32 million people immigrated5 to one of the EU-27
6 Member States while at least
23 million emigrants were reported to have left an EU-27 Member State It should be noted that these figures do not represent the migration flows tofrom the EU as a whole since they also include flows between different EU Member States
The United Kingdom reported the largest number of immigrants (566044) in 2011 followed by Germany (489422) Spain (457649) and Italy (385793) These four Member States together accounted for 603 of all immigrants to EU-27 Member States
Spain reported the highest number of emigrants in 2011 (507742) followed by the United
Kingdom (350703) Germany (249045) and France (213367) 16 of the EU-27 Member States reported more immigration than emigration in 2011 but in Bulgaria the Czech Republic Ireland Greece Spain Poland Romania and the three Baltic Member States emigrants
outnumbered immigrants
Relative to the size of the resident population Luxembourg recorded the highest number of immigrants in 2011 (38 immigrants per 1000 persons) followed by Cyprus (26) and Malta (13)
The highest rates of emigration in 2011 were reported for Ireland (19 emigrants per 1 000 persons) and Lithuania (18 emigrants per 1000 persons)
5 A person is considered to have immigrated if he or she establishes his or her usual residence in a Member State for at least twelve months having previously been usually resident in another Member State or a third country as set out in Article 2 of Regulation (EC) 8622007
Social Europe EU Employment and Social Situation I Quarterly Review
Special Supplement on Demographic Trends
March 2013 I 18
Chart 15 Immigrants 2011 (per 1 000 persons)
Source Eurostat (online data code migr_imm1ctz and migr_pop1ctz) Note Data on the number of persons refer to 1 January 2012 for HR
Citizens of non-EU countries can be categorised according to the level of development of their country of citizenship based on the Human Development Index (HDI) calculated by the United
Nations By this measure the largest share (524 of all immigrants to the EU are from medium HDI countries and 346 are from high HDI (but non-EU) countries By contrast low HDI countries (63) EFTA countries (36) and Candidate countries (31) accounted for
relatively low shares of total immigration to the EU-27 in 2011
Chart 16 Share of immigrants by citizenship group EU-27 2011 ()
Source Eurostat (online data code migr_imm5prv) Note Candidate countries as of 1 January 2011 Montenegro Croatia former Yugoslav Republic of Macedonia and Turkey
In 2011 the relative share of returning nationals within the total number of immigrants was highest in Lithuania (893 of all immigrants) Portugal (636) Croatia (553) Estonia (548) and Greece (545) These were the only EU Member States to report return migration higher than 50 By contrast Luxembourg Austria Italy Cyprus and Spain reported
relatively low shares as return migration in 2011 accounted for less than 10 of immigrants
Chart 17 Share of return migrants EU-27 2011 ()
Source Eurostat (online data code migr_imm1ctz)
Regarding the gender distribution of immigrants in 2011 there were slightly more men than women as a whole (521 compared to 479) The country reporting the highest share of male immigrants was Slovakia (624) by contrast the highest share of female immigrants
was reported in Cyprus (552)
Social Europe EU Employment and Social Situation I Quarterly Review
Special Supplement on Demographic Trends
March 2013 I 19
Foreign population at 207 million and foreign-born population at 330 million in EU-27
The EU-27 foreign population (people residing in an EU-27 Member State with citizenship of a non EU-27 Member State) on 1 January 2012 was 207 million representing 41 of the EU-27
population In addition there were 136 million persons living in an EU-27 Member State with
citizenship of another EU-27 Member State on 1 January 2012
Due to better data availability information on citizenship has often been used to study populations with a foreign background However since citizenship can change over time it is also useful to present information by country of birth
There were 330 million people born outside a country of the EU-27 on 1 January 2012 and there were 172 million persons who were born in a different EU-27 Member State from the country of residence Only in Luxembourg Ireland Hungary Cyprus and Malta did foreign-born
persons from other EU-27 countries outnumber those born outside the EU-27 People born abroad outnumbered foreign citizens in all Member States except Luxembourg Latvia and the Czech Republic
Table 11 Foreign and foreign-born population by group of citizenship and country of birth 1
January 2012 (in absolute numbers and as a percentage of the total foreignforeign-born
population)
Source Eurostat (online data code migr_pop1ctz) Note The individual values do not add up to the total due to rounding and to exclusion of the lsquounknownrsquo citizenship group from the table Population data for HR comes from 2011 Census as on 31 March 2011 (p) provisional data (s) estimated
In absolute terms the largest numbers of foreigners living in the EU on 1 January 2012 were
found in Germany (74 million) Spain (55 million) Italy (48 million) the United Kingdom (48 million) and France (38 million) Non-nationals in these five Member States collectively represented 771 of the total number of non-nationals living in the EU-27 while the same five Member States had a 629 share of the EUrsquos population In relative terms the EU-27 Member
State with the highest share of non-nationals was Luxembourg where they accounted for 438 of the total population The vast majority (864) of non-nationals living in Luxembourg were citizens of other EU Member States As at 1 January 2012 a high proportion of non-
nationals (10 or more of the resident population) was also observed in Cyprus Latvia
Estonia Spain Austria and Belgium
In most EU Member States the majority of non-nationals are citizens of non-EU countries At the
beginning of 2012 citizens of other EU-27 Member States represented the majority of non-nationals living in Luxembourg Ireland Belgium Slovakia Cyprus and Hungary In Latvia and Estonia the proportion of citizens from non-EU countries is particularly large due to the high
Social Europe EU Employment and Social Situation I Quarterly Review
Special Supplement on Demographic Trends
March 2013 I 20
number of recognised non-citizens (mainly former Soviet Union citizens who are permanently resident in these countries but have not acquired citizenship)
Chart 18 Share of foreigners in the resident population EU-27 1 January 2012 ()
Source Eurostat (online data code migr_pop1ctz)
Looking at the distribution by continent of citizens of non-EU countries living in the EU the largest proportion (385) were citizens of a European country outside the EU-27 A total of 79
million citizens from European countries outside the EU-27 were residing in the EU at the start of 2012 among these more than half were citizens of Turkey Albania or Ukraine The next biggest group was from Africa (245) followed by Asia (220) the Americas (142) and Oceania (08) More than half the African citizens living in the EU were from North Africa
often from Morocco or Algeria Many Asian citizens living in the EU came from southern or eastern Asia in particular from India or China Citizens of Ecuador and the United States made up the largest share of non-nationals from the Americas living in the EU
Chart 19 Citizens of non-EU countries
resident in the EU-27 by continent of origin
1 January 2012 ()
Chart 20 Non-EU citizens resident in the
EU-27 by level of human development index
(HDI) of country of citizenship 1 January
2012 ()
Source Eurostat
Among the non-EU citizens living in the EU-27 in 2012 some 442 were citizens of a high HDI country (with Turkey Albania and Russia accounting for almost half) while a slightly higher share (483) came from medium HDI countries (one fifth from Morocco followed by China and Ukraine) the remaining 76 were from low HDI countries (30 with Nigerian or Iraqi
citizenship)
The citizenship structure of the population of non-nationals living in the EU varies greatly between Member States It is influenced by factors such as labour migration historical links
between countries of origin and destination and established networks in destination countries Romanians (living in another EU Member State) and Turkish citizens were the biggest groups of non-nationals living in the EU-27 in 2012 There were 23 million citizens from each of these
countries each group accounting for 70 of all non-nationals living in the EU-27 in 2012 The third largest group was Moroccans (19 million people or 56 of all non-nationals) The group of non-nationals living in the EU with the most significant increase over the period from 2001 to
Social Europe EU Employment and Social Situation I Quarterly Review
Special Supplement on Demographic Trends
March 2013 I 21
2012 was Romanians (living in another EU Member State) their numbers increasing almost eight-fold from 03 million in 2001 to 24 million by 2012
Chart 21 Main countries of origin of non-nationals EU-27 1 January 2012 (million)
Note 1 Estimates Eurostat
An analysis of the age structure of the population shows that for the EU-27 as a whole the foreign population was younger than the national population The distribution by age of
foreigners shows compared to nationals a greater proportion of relatively young working age adults In 2012 the median age of the national population in the EU-27 was 419 years while the median age of foreigners living in the EU was 347 years
Chart 22 Age structure of the national and foreign population EU-27 1 January 2012 ()
Source Eurostat (online data code migr_pop2ctz)
Acquisition of citizenship down by 35 in 2011
The number of people acquiring the citizenship of an EU-27 Member State in 2011 was 782200
corresponding to a 35 decrease with respect to 2010 2010 saw the greatest number of people acquiring the citizenship of an EU Member State since 2001 and the first time that the total number rose above 08 million
The United Kingdom had the highest number of persons acquiring citizenship in 2011 at 177
600 (or 227 of the EU-27 total) The next highest numbers were in France (114584) Spain (114599) and Germany (109594) none of the remaining Member States granted citizenship to more than 100000 people in 2011
Social Europe EU Employment and Social Situation I Quarterly Review
Special Supplement on Demographic Trends
March 2013 I 22
Table 12 Number of persons having acquired the citizenship of the reporting country 2001-2011
(thousand)
Source Eurostat (online data code migr_acq)
In absolute terms the highest decreases were observed in France (28691 fewer persons were
granted French citizenship compared to 2010) followed by the United Kingdom (17277) Italy (9785) and Spain (9122) The highest decreases in relative terms were recorded in Latvia (326 fewer persons acquired citizenship in 2011) and Bulgaria (312)
One indicator commonly used to measure the effect of national policies on citizenship is the lsquonaturalisation ratersquo or the ratio between the total number of citizenships granted and the stock of foreign residents in a country at the beginning of the year The country with the highest naturalisation rate in 2011 was Hungary (98 acquisitions per 100 foreign residents) followed
by Poland (67) and Sweden (58) while Malta Portugal and the United Kingdom all reported rates between 4 and 5 acquisitions per 100 foreign residents
Chart 23 Naturalisation rate 2011 (per 100 foreign residents)
Source Eurostat (online data code migr_acq and migr_pop1ctz)
About 867 of those who acquired citizenship of an EU-27 Member State in 2011 were
previously citizens of a non-EU country This was the case in nearly all of the Member States These new EU-27 citizens came mainly from Africa (262 of the total) Asia (226) non-
EU27 Europe (189) and North and South America (169) EU-27 citizens who acquired citizenship of another Member State amounted to 82 263 persons accounting for 105 of the
total In absolute terms the main groups of EU citizens acquiring citizenship of another EU Member State were Romanians becoming citizens of Hungary (15658 persons) and Italy (3921 persons) Poles becoming citizens of Germany (4344 persons) and Portuguese becoming citizens
of France (3805 persons)
Social Europe EU Employment and Social Situation I Quarterly Review
Special Supplement on Demographic Trends
March 2013 I 23
In Luxembourg and Hungary the majority of new citizenships granted were to citizens of another EU Member State In the case of Luxembourg Portuguese citizens accounted for the largest share while in the case of Hungary those acquiring citizenship were almost exclusively Romanians
As in previous years the largest groups of new citizens in the EU Member States in 2011 were citizens of Morocco (64200 corresponding to 82 of all citizenships granted) and Turkey (48800 or 62) Compared with 2010 the number of Moroccan citizens acquiring citizenship
of an EU Member State decreased by 44 while the figure for Turkish citizens fell by 20 The largest share of Moroccans acquired their new citizenship in France (326) Spain (224) and Italy (167) while the highest proportion of Turkish nationals acquired their new citizenship in Germany (575) and France (129)
Marriages and divorces
The number of marriages is decreasing and the number of divorces is increasing although the trend in marriages may be due in part to ageing of the population In addition more and more
children are being born to un-married women and the countries with the highest extramarital birth rates are often also those with the highest fertility rates
Marriage as recognised by the law in each country has long been considered to indicate family
formation However the analysis of trends in family formation and dissolution based on just marriage and divorce data might not offer a full picture Legal alternatives to marriage like registered partnership have become more widespread and national legislation has evolved to confer more rights on unmarried couples Alongside these new legal forms other forms of non-
marital relationships have appeared making it more difficult for statisticians to collect data that can be compared across countries
Due to differences in the timing and formal recognition of changing patterns of family formation
and dissolution these concepts have become more difficult to operationalise
Fewer marriages more divorces
22 million marriages took place in the EU-27 in 2010 and 10 million divorces occurred in the
EU-27 in 2009 according to the most recent available aggregated data These figures may be expressed as 44 marriages for every 1000 persons (ie the crude marriage rate) and 19 divorces for every 1000 persons (ie the crude divorce rate)
Since 1965 the crude marriage rate in the EU-27 has declined by some 43 in relative terms
(from 77 per 1000 persons in 1965 to 44 in 2010)
Chart 24 Crude marriage and divorce rates EU-27
Source Eurostat (online data codes demo_nind and demo_ndivind) Note The series of divorce rate in EU-27 is discontinued due to unavailability of data by Member States to be aggregated
At the same time marriages have become less stable in the EU-27 as indicated by the increase in the crude divorce rate from 08 per 1000 persons in 1965 to 21 in 2007 Part of this increase
is due to the fact that in several countries divorce was legalised during the period Over 2008 and 2009 however the annual number of divorces decreased slightly to 19 per 1000 persons in 2009
Table 13 shows that in 2011 the crude marriage rate among the EU-27 Member States was highest in Cyprus (73 per 1000 persons) Lithuania (63) and Malta (61) At the other end of
Social Europe EU Employment and Social Situation I Quarterly Review
Special Supplement on Demographic Trends
March 2013 I 24
the scale the lowest crude marriage rates were reported by Bulgaria (29 per 1000 persons) Slovenia (32) and Luxembourg (33)
Table 13 Crude marriage rate (marriages per 1000 persons)
Source Eurostat (online data code demo_nind) Note EU-27 excludes French overseas departments for 1960 to 1990 CY Up to and including 2000 data refer to total marriages contracted in the country including marriages between non-residents 2009-2011 data refer to marriages where at least one spouse was resident in the country
As regards divorce Ireland (07 per 1000 persons) and several southern European Member
States including Italy (09) Slovenia (11) and Greece (12) have significantly lower crude divorce rates than Latvia (40 per 1000 persons) Lithuania (34) and Belgium (29) Divorce
became legal in Malta in 2011 so the first data available in 2011 show only 01 divorces per 1000 persons
Table 14 Crude divorce rate (divorces per 1000 persons)
Source Eurostat (online data code demo_ndivind) Note EU-27 excludes French overseas departments for 1960 to 1990 Divorce was not possible by law in Italy until 1970 in Spain until 1981 in Ireland until 1995 and in Malta until 2011
A rise in births outside marriage
The proportion of births outside marriage in the EU-27 in 2011 was 395 It continues to
increase signalling new patterns of family formation alongside the more traditional pattern
where children are born within marriage Extramarital births occur in non-marital relationships among cohabiting couples and to lone parents
Social Europe EU Employment and Social Situation I Quarterly Review
Special Supplement on Demographic Trends
March 2013 I 25
Table 15 Live births outside marriage ( share of total live births)
Source Eurostat (online data code demo_find) Note EU-27 excludes French overseas departments for 1960 to 1990 and excludes Romania for 1990
Extra-marital births increased in almost every country in the EU-27 during 2011 with the exception of Ireland Malta and Sweden In six Member States the majority of live births are
now outside marriage Estonia (597) Slovenia (568) Bulgaria (561) France (558) Sweden (543) and Belgium (500) Mediterranean countries like Greece Croatia Cyprus Italy and Malta along with Poland Lithuania and Romania are at the other end of the scale
with a large proportion over 70 of births occurring within marriage
Chart 25 Proportion of live births outside marriage and total fertility rate 2011
Source Eurostat (online data code demo_find)
Countries with higher proportions of births outside marriage often have higher fertility rates In France Sweden Belgium Denmark the United Kingdom and Netherlands high rates of live births outside marriage (above 45 of total live births) are associated with total fertility rates
above the EU-27 average (157 live births per woman in 2011) (Chart 25)
Social Europe EU Employment and Social Situation I Quarterly Review
Special Supplement on Demographic Trends
March 2013 I 26
Population development and employment growth
A what-if analysis can be instructive and tell how far employment growth can be sustained under current demographic trends The analysis below is based on the 2010 Eurostat demographic projections The scenarios are exclusively on the supply side and do not take into
account projections of labour demand
Europe 2020 targets promote lower school drop-out rates higher rates of tertiary education and higher employment In the past school drop-out rates have been decreasing though not as fast
as targeted earlier tertiary education has been increasing steadily employment grew until 2008 then decreased especially for young adults and migrants
In 2010 14 of EU residents aged 18-24 were not in education or training and did not have an upper secondary school diploma They are called lsquoearly leaversrsquo and the aim is to bring this
figure down to 10 by 2020 Even though more young adults complete secondary education and more are motivated to continue with education or training if current trends continue the outcome is likely to fall short of the objective
On the other hand the education levels of todayrsquos 20-24 year-olds is higher than it was 10 years ago As a result at current growth rates in 2020 40 of 30-34 year-olds are likely to have a tertiary degree thereby achieving the tertiary education target
Scenarios for the EU-27
The estimates in the text above and those in Chart 26 and Table 16 are based on Eurostatrsquos Population projections (Europop 2010) and annual Labour Force Survey employment and
education attainment rates as well as assumptions based on the Europe 2020 targets on education and employment
Chart 26 Population by sex age group an employment EU-27 2010 and 2030 (million)
2010 age 2030
90
80
70
60
50
40
30
20
10
0
Source Eurostat (online data codes proj_10c lfsa_ergan lfsa_ergaed lfsa_pgaed) and DG EMPL computations
In Chart 26 the 2030 employment counts were computed by assuming that employment rates remain constant across ages sex origin and education level whereas educational attainment rates follow observed trends This means that the education levels of each 5-year cohort (for instance those aged 20-24 in 2010) will change over time according to changes observed in the
period 2006-2011 as a result during the following five projection years some of its ISCED7 0-2 people will graduate to ISCED 3-4 and some of its (and newly graduated) ISCED 3-4 will graduate to ISCED 5-6 These graduation rates are assumed to depend on age and to remain
constant in the future
Education trends consist of two components The first is the educational level of young adults (aged 15-19) The ISCED 3-4 attainment of this group has been increasing and this trend is
assumed to continue tapering to a maximum of 25 in the long run Transitions between
7 International Standard Classification of Education see httpwwwuisunescoorgEducationPagesinternational-standard-classification-of-educationaspx
20 10 10 20 20 10 10 20
Social Europe EU Employment and Social Situation I Quarterly Review
Special Supplement on Demographic Trends
March 2013 I 27
education levels at successive ages are assumed to be constant It must be considered that as education levels continue rising they continue to raise employment rates In present scenarios as better-educated cohorts replace less-well educated ones the global employment rate rises and so does overall employment
The observed overall increase so far is largely the net effect of composition change where the positive impact of the increase in educational attainment more than offsets the negative impact of our active-age population becoming increasingly older or of migrant origin (non-EU-27)
Under these assumptions Chart 26 shows total employment declining by 5 million that is 25 from 2010 to 2030 the employment rate of those aged 20-64 in 2020 would be 685 a slight increase and far below the Europe 2020 target The reason for this change would be the rise in education levels mitigated by an ageing population and a growing proportion of
migrants Economic dependency8 would rise from 132 in 2010 to 147 in 2030 In Table 16 this is the lsquotrend education with constant employment ratesrsquo scenario
The Social Investment Package9 calls for measures that increase labour participation
employability and productivity It is important to analyse the feasibility and consequences of raising education levels and labour participation to assess the suitability of the measures envisaged
For instance focusing on opportunities for disadvantaged workers may bring in more people with lower skills and the changing skills composition would affect productivity10 In addition it pays to understand the impact of current population trends in education
Table 16 summarises employment in 2020 and 2030 under several scenarios Its purpose is to
analyse the difficulty and impact in 2030 of reaching the Europe 2020 employment objectives
The first scenario includes demographic change but no rise in educational attainment It is purely mechanical and its only purpose is to assess the impact of skills renewal due to cohort
turnover as older less-well-educated worker cohorts leave the labour market younger better-educated cohorts join it Although skills renewal is now slower than it was in the past 2-3 decades because of demographic changes the impact remains high
The second scenario allows for education to continue progressing as it did in the past thereby shifting overall employment Without an effort to attain the Europe 2020 employment objectives the EU-27 workforce will become older but also better educated As a result employment will be stable until 2020 but will decrease by 2-3 by 2030 feeling the impact of
demographics The declining population of working age will increasingly consist of older workers
The third scenario assumes that the Europe 2020 targets on education will be attained and the
trend towards a better-educated work force will continue after 2020 Here we should underline that
under the assumption that current education transitions continue the tertiary education
target would also be attained
Europe 2020 education targets will have a small impact on employment in 2030 This is because the targeted increase in tertiary attainment and the reduction in early leavers will affect only the very young cohorts of workers so that the effect will not materialise
by 2030 however the impact will be far larger after 2030
The fourth scenario assumes that in addition to the Europe 2020 target for education the target on employment will also be attained As regards those aged 65 and above this scenario
envisages the same rates of increase for employment as for people aged 55-64 Employment rate increases from 2010 to 2020 then assumed go on till 2030
But attaining the Europe 2020 employment target would require tapping into a potential labour
force consisting largely of older people and so-far inactive migrants These cohorts tend to be less educated than the rest of the labour force This means that not only will activating them be
harder but also that they will contribute to the less-skilled workforce whereas there is strong
8 Economic dependency is the ratio between the number of people not in employment and those who are 9 See COM(2013) 83 10 See Employment and Social Developments in Europe Chapter 4 p 279
Social Europe EU Employment and Social Situation I Quarterly Review
Special Supplement on Demographic Trends
March 2013 I 28
evidence suggesting that demand in future decades will concentrate on high-skilled rather than low-skilled workers11
Table 16 Work force scenarios under Europe 2020 assumptions EU-27 2020 and 2030
Source Eurostat (online data codes proj_10c lfsa_ergan lfsa_ergaed lfsa_pgaed) and DG EMPL computations Note (1) only EU citizens
Employment gains among women and young people who tend to be better educated may be easier to achieve and yield higher productivity gains however they alone will not mean the Europe 2020 employment target is met Up skilling via continuing education and training is
another way to motivate and nurture a productive workforce12
Differences among Member States
Population developments in the various Member States differ as the rate of ageing varies and
these find themselves in different phases For instance eastern States have relatively young and slowly-ageing populations now but face the prospect of very rapid ageing from 2025 onwards13 In addition some Member States already make better use of their potential work
forces with higher education and employment rates than others
In the past two decades employment and productivity growth fuelled economic growth in roughly equal measure The observed pre-crisis 1 employment growth ended in 2008 When
the crisis abates employment can resume growth but this will be limited in future
Demographic ageing and workforce decline will create bottlenecks to the available labour force in the medium term even though at present countries still have un-deployed human resources which could potentially yield further employment growth
Chart 27 outlines the Member Statesrsquo different potentials for continuing employment growth Assuming that the EUrsquos economic and social system will need 1 employment growth Member States differ as to when such a lsquosustainablersquo growth path will have to come to an end simply
because human resources become scarce
Two scenarios are presented14
Under the first scenario there will be no further progress in activation its growth-end
year is the upper end of the blue bar in Chart 27
Under the second scenario each country exploits the maximum activation potential of women older people and educational progress its growth-end year is the upper end of the yellow bar in Chart 27 Four Member States can continue growing beyond 2040
11 See for instance httpwwwcedefopeuropaeuENpublications20633aspx
12 Source httpeceuropaeusocialmainjsplangId=enampcatId=113ampnewsId=1774ampfurtherNews=yes chapter 69 13 See the 2010 Demography Report (chapter I5)
14 See draft paper of C Fotakis J Peschner (2013) lsquo Growth potential of EU human resources and policy implications for future economic growthrsquo not yet published
Social Europe EU Employment and Social Situation I Quarterly Review
Special Supplement on Demographic Trends
March 2013 I 29
The Member States with the longer bars whose maximum potential for growth reaches further into the future are of two types Some have strong population growth and slow ageing such as Ireland others have large unused capacity to tap by increasing participation in (education and) labour
More critically the EU-27 is projected to have a large shortfall of well-educated (ISCED 5-6) workers Although their number will grow by virtue of rising education levels in the population this projected growth is slower than the increase in demand
Chart 27 Year in which a continued 1 employment growth from 2011 is projected to stop by
country
Source FotakisPeschner (2013)6 based on Eurostat LFS
In addition the untapped potential consists mainly of less-well educated people for two
reasons First the better educated are already well involved in the labour market Secondly the most promising sources of additional labour ie older people and migrants tend to be less well educated than prime-age EU nationals
Thus as regards high-skilled workers the time-window for growth is more limited Even the best activation policies can only palliate and delay the onset of shortages for just a few years
Social Europe EU Employment and Social Situation I Quarterly Review
Special Supplement on Demographic Trends
March 2013 I 30
European Commission
EU Employment and Social Situation Quarterly Review March 2013 ndash Special
Supplement on Demographic Trends
Luxembourg Publications Office of the European Union
2013 mdash 30 pp mdash 21 times 297 cm
ISBN 978-92-79-29383-2
ISSN 1977-8317 doi 10276741278
This publication is available in electronic format in English
KE-BH-13-0S2-EN-N
- Table of Contents
- Introduction
- Population change and age structure
- Fertility
- Mortality
- Migration and migrant population
- Marriages and divorces
- Population development and employment growth
-
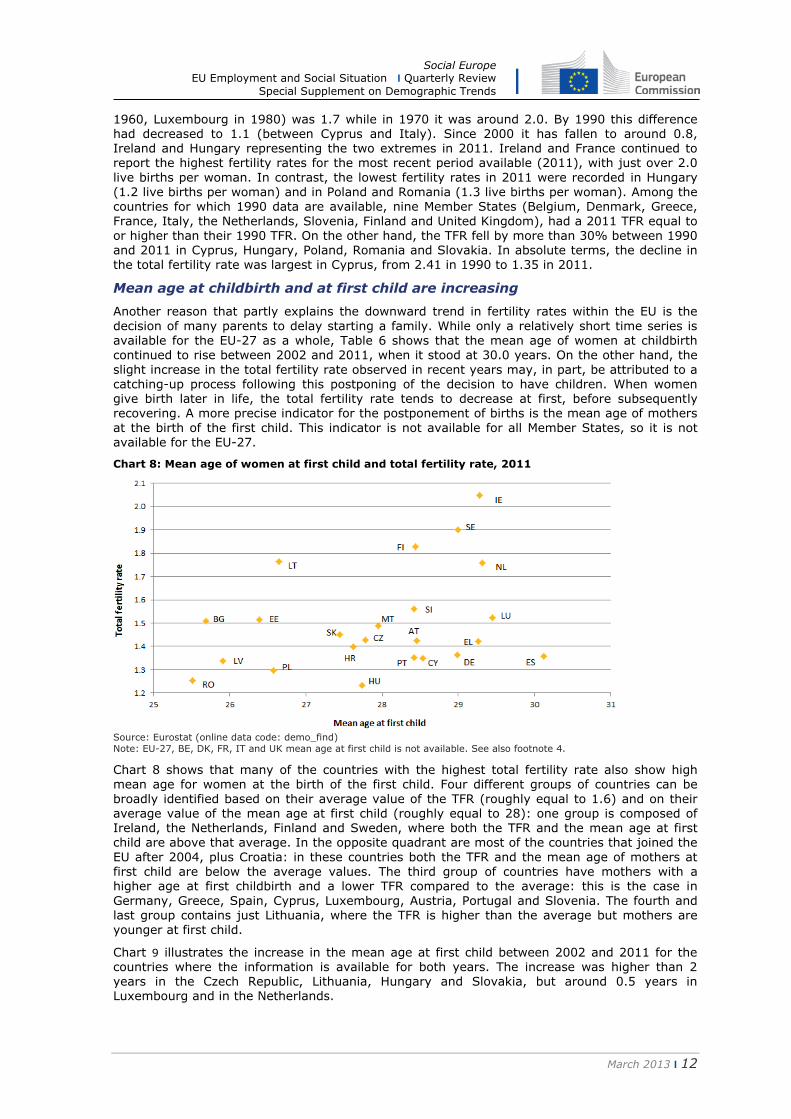
Social Europe EU Employment and Social Situation I Quarterly Review
Special Supplement on Demographic Trends
March 2013 I 14
life expectancy at birth for men in the EU Member States ranged from a minimum of 19 years (in Bulgaria and Lithuania) to a maximum of 60 years (in Estonia) For women the increase ranged from 16 years (in Sweden) to 43 years (in Estonia) In 2002 the differences between the highest and lowest life expectancies among EU Member States amounted to 131 years for
men and 86 for women In 2011 the differences were 120 years for men and 79 years for
women Thus while life expectancy has been increasing in all countries it has increased slightly more in some of the countries where it was lower However this catching-up has been slow in
two of the low-life-expectancy countries Bulgaria and Romania
Chart 10 Life expectancy at birth men and women 2002 and 2011
Source Eurostat (online data code demo_mlexpec) Note EU-27 BE and IT 2011 estimated See also footnote 4
In 2011 the gender gap at birth was 58 years of life expectancy (see Chart 11) with women live longer than men in all EU countries However the gap varied substantially between EU Member States In 2011 the largest difference between the sexes was found in Lithuania (112 years) and the smallest in Cyprus and the Netherlands (both 38 years) In the Baltic States
women can expect to live more than 10 years longer than men Conversely the gender gap is less than 5 years in nine Member States In the 10 years up to 2011 the gender gap decreased with the exception of Bulgaria where it increased by 03 years and Poland where it remained
constant The reduction in the gender gap at birth was largest in absolute terms in Luxembourg (from 69 years in 2002 to 51 years in 2011) and Estonia (from 118 years in 2002 to 101 years in 2011) In the EU-27 the gender gap at birth decreased from 64 years in 2002 to 58
in 2011
Chart 11 The gender gap (women ndash men) in life expectancy at birth 2002 and 2011
Source Eurostat (online data code demo_mlexpec)
Social Europe EU Employment and Social Situation I Quarterly Review
Special Supplement on Demographic Trends
March 2013 I 15
Note EU-27 BE and IT 2011 estimated See also footnote 4
As people live longer interest has shifted to the older generations Table 9 shows life
expectancy at age 65 by sex for the EU-27 from 2002 to 2011 these are the only years for which information is available for all 27 Member States As can be seen the increase in life
expectancy for men and women at age 65 was 19 and 20 years respectively The gender gap at age 65 decreased slightly to 35 years in 2011 down from 36 years in 2002
Table 9 Life expectancy at age 65 EU-27 2002-2011
Source Eurostat (online data code demo_mlexpec) Note 2011 estimated See also footnote 4
Chart 12 shows life expectancy at age 65 by country and by sex In 2011 upon reaching the
age of 65 the average man could expect to live additional 134 (in Latvia) to 193 years (in France) The life expectancy of women at age 65 was higher ranging in 2011 from 173 years in Bulgaria to 238 years in France
Chart 12 Life expectancy at age 65 men and women 2002 and 2011
Source Eurostat (online data code demo_mlexpec) Note EU-27 BE and IT 2011 estimated See also footnote 4
Chart 13 shows the changes in the gender gap in life expectancy at age 65 between 2002 and
2011 by country due to the faster increase in life expectancy for women at older ages the gender gaps at age 65 increased in more than half the countries over that period The largest increase was in Estonia and Latvia +08 years between 2002 and 2011The gender gap decreased in the other Member States by more than half a year in Ireland Cyprus Malta and
the Netherlands In 2011 the largest gender gaps were in the Baltic States where women could expect to live more than 5 years longer than men At the other end of the scale the smallest gap 21 years was in Greece and Cyprus
Social Europe EU Employment and Social Situation I Quarterly Review
Special Supplement on Demographic Trends
March 2013 I 16
Chart 13 The gender gap (women ndash men) in life expectancy at age 65 2002 and 2011
Source Eurostat (online data code demo_mlexpec) Note EU-27 BE and IT 2011 estimated See also footnote 4
Falling infant mortality
Life expectancy at birth is improved by the reduced probability of dying One of the most significant changes in recent decades has been the reduction in infant mortality rates Around 20 thousand children died before reaching one year of age in the EU-27 in 2011 the most
recent year for which data are available this figure was almost 37 thousand in 1996 which is the first year for which information is available for all Member States and Croatia
Chart 14 Infant mortality rate 1996 and 2011
Source Eurostat (online data code demo_minfind)
The infant mortality rate almost halved in the EU-27 during the 15 years from 1996 to 2011 from 72 to 39 deaths per 1000 live births (see Chart 14) The biggest reductions were
generally recorded in those EU Member States with higher than average levels of infant mortality in 1996 The decrease in the central and eastern Member States is greater than in the other Member States Despite this progression some Member States still had relatively high
infant mortality rates in 2011 eg Romania (94 deaths per 1000 live births) and Bulgaria (85permil) In 2011 the lowest infant mortality rates in the EU-27 were in Sweden (21 deaths per 1000 live births) Finland (24permil) and Estonia (25permil) about one-fourth of the rates recorded in Romania and Bulgaria
Social Europe EU Employment and Social Situation I Quarterly Review
Special Supplement on Demographic Trends
March 2013 I 17
Migration and migrant population
Immigration to the EU-27 at 17 million
During 2011 there were an estimated 17 million immigrants to the EU-27 from a country
outside the EU-27 In addition 13 million people previously residing in an EU-27 Member State migrated to another Member State
Table 10 Immigration 2009-2011 (in absolute numbers and as a percentage of total
immigration)
Source Eurostat (online data code migr_imm5prv migr_imm1ctz) Note The individual values do not add up to the total due to rounding and to exclusion of the lsquounknownrsquo citizenship group from the table (p) provisional data (b) break in series (s) estimated
Thus about 32 million people immigrated5 to one of the EU-27
6 Member States while at least
23 million emigrants were reported to have left an EU-27 Member State It should be noted that these figures do not represent the migration flows tofrom the EU as a whole since they also include flows between different EU Member States
The United Kingdom reported the largest number of immigrants (566044) in 2011 followed by Germany (489422) Spain (457649) and Italy (385793) These four Member States together accounted for 603 of all immigrants to EU-27 Member States
Spain reported the highest number of emigrants in 2011 (507742) followed by the United
Kingdom (350703) Germany (249045) and France (213367) 16 of the EU-27 Member States reported more immigration than emigration in 2011 but in Bulgaria the Czech Republic Ireland Greece Spain Poland Romania and the three Baltic Member States emigrants
outnumbered immigrants
Relative to the size of the resident population Luxembourg recorded the highest number of immigrants in 2011 (38 immigrants per 1000 persons) followed by Cyprus (26) and Malta (13)
The highest rates of emigration in 2011 were reported for Ireland (19 emigrants per 1 000 persons) and Lithuania (18 emigrants per 1000 persons)
5 A person is considered to have immigrated if he or she establishes his or her usual residence in a Member State for at least twelve months having previously been usually resident in another Member State or a third country as set out in Article 2 of Regulation (EC) 8622007
Social Europe EU Employment and Social Situation I Quarterly Review
Special Supplement on Demographic Trends
March 2013 I 18
Chart 15 Immigrants 2011 (per 1 000 persons)
Source Eurostat (online data code migr_imm1ctz and migr_pop1ctz) Note Data on the number of persons refer to 1 January 2012 for HR
Citizens of non-EU countries can be categorised according to the level of development of their country of citizenship based on the Human Development Index (HDI) calculated by the United
Nations By this measure the largest share (524 of all immigrants to the EU are from medium HDI countries and 346 are from high HDI (but non-EU) countries By contrast low HDI countries (63) EFTA countries (36) and Candidate countries (31) accounted for
relatively low shares of total immigration to the EU-27 in 2011
Chart 16 Share of immigrants by citizenship group EU-27 2011 ()
Source Eurostat (online data code migr_imm5prv) Note Candidate countries as of 1 January 2011 Montenegro Croatia former Yugoslav Republic of Macedonia and Turkey
In 2011 the relative share of returning nationals within the total number of immigrants was highest in Lithuania (893 of all immigrants) Portugal (636) Croatia (553) Estonia (548) and Greece (545) These were the only EU Member States to report return migration higher than 50 By contrast Luxembourg Austria Italy Cyprus and Spain reported
relatively low shares as return migration in 2011 accounted for less than 10 of immigrants
Chart 17 Share of return migrants EU-27 2011 ()
Source Eurostat (online data code migr_imm1ctz)
Regarding the gender distribution of immigrants in 2011 there were slightly more men than women as a whole (521 compared to 479) The country reporting the highest share of male immigrants was Slovakia (624) by contrast the highest share of female immigrants
was reported in Cyprus (552)
Social Europe EU Employment and Social Situation I Quarterly Review
Special Supplement on Demographic Trends
March 2013 I 19
Foreign population at 207 million and foreign-born population at 330 million in EU-27
The EU-27 foreign population (people residing in an EU-27 Member State with citizenship of a non EU-27 Member State) on 1 January 2012 was 207 million representing 41 of the EU-27
population In addition there were 136 million persons living in an EU-27 Member State with
citizenship of another EU-27 Member State on 1 January 2012
Due to better data availability information on citizenship has often been used to study populations with a foreign background However since citizenship can change over time it is also useful to present information by country of birth
There were 330 million people born outside a country of the EU-27 on 1 January 2012 and there were 172 million persons who were born in a different EU-27 Member State from the country of residence Only in Luxembourg Ireland Hungary Cyprus and Malta did foreign-born
persons from other EU-27 countries outnumber those born outside the EU-27 People born abroad outnumbered foreign citizens in all Member States except Luxembourg Latvia and the Czech Republic
Table 11 Foreign and foreign-born population by group of citizenship and country of birth 1
January 2012 (in absolute numbers and as a percentage of the total foreignforeign-born
population)
Source Eurostat (online data code migr_pop1ctz) Note The individual values do not add up to the total due to rounding and to exclusion of the lsquounknownrsquo citizenship group from the table Population data for HR comes from 2011 Census as on 31 March 2011 (p) provisional data (s) estimated
In absolute terms the largest numbers of foreigners living in the EU on 1 January 2012 were
found in Germany (74 million) Spain (55 million) Italy (48 million) the United Kingdom (48 million) and France (38 million) Non-nationals in these five Member States collectively represented 771 of the total number of non-nationals living in the EU-27 while the same five Member States had a 629 share of the EUrsquos population In relative terms the EU-27 Member
State with the highest share of non-nationals was Luxembourg where they accounted for 438 of the total population The vast majority (864) of non-nationals living in Luxembourg were citizens of other EU Member States As at 1 January 2012 a high proportion of non-
nationals (10 or more of the resident population) was also observed in Cyprus Latvia
Estonia Spain Austria and Belgium
In most EU Member States the majority of non-nationals are citizens of non-EU countries At the
beginning of 2012 citizens of other EU-27 Member States represented the majority of non-nationals living in Luxembourg Ireland Belgium Slovakia Cyprus and Hungary In Latvia and Estonia the proportion of citizens from non-EU countries is particularly large due to the high
Social Europe EU Employment and Social Situation I Quarterly Review
Special Supplement on Demographic Trends
March 2013 I 20
number of recognised non-citizens (mainly former Soviet Union citizens who are permanently resident in these countries but have not acquired citizenship)
Chart 18 Share of foreigners in the resident population EU-27 1 January 2012 ()
Source Eurostat (online data code migr_pop1ctz)
Looking at the distribution by continent of citizens of non-EU countries living in the EU the largest proportion (385) were citizens of a European country outside the EU-27 A total of 79
million citizens from European countries outside the EU-27 were residing in the EU at the start of 2012 among these more than half were citizens of Turkey Albania or Ukraine The next biggest group was from Africa (245) followed by Asia (220) the Americas (142) and Oceania (08) More than half the African citizens living in the EU were from North Africa
often from Morocco or Algeria Many Asian citizens living in the EU came from southern or eastern Asia in particular from India or China Citizens of Ecuador and the United States made up the largest share of non-nationals from the Americas living in the EU
Chart 19 Citizens of non-EU countries
resident in the EU-27 by continent of origin
1 January 2012 ()
Chart 20 Non-EU citizens resident in the
EU-27 by level of human development index
(HDI) of country of citizenship 1 January
2012 ()
Source Eurostat
Among the non-EU citizens living in the EU-27 in 2012 some 442 were citizens of a high HDI country (with Turkey Albania and Russia accounting for almost half) while a slightly higher share (483) came from medium HDI countries (one fifth from Morocco followed by China and Ukraine) the remaining 76 were from low HDI countries (30 with Nigerian or Iraqi
citizenship)
The citizenship structure of the population of non-nationals living in the EU varies greatly between Member States It is influenced by factors such as labour migration historical links
between countries of origin and destination and established networks in destination countries Romanians (living in another EU Member State) and Turkish citizens were the biggest groups of non-nationals living in the EU-27 in 2012 There were 23 million citizens from each of these
countries each group accounting for 70 of all non-nationals living in the EU-27 in 2012 The third largest group was Moroccans (19 million people or 56 of all non-nationals) The group of non-nationals living in the EU with the most significant increase over the period from 2001 to
Social Europe EU Employment and Social Situation I Quarterly Review
Special Supplement on Demographic Trends
March 2013 I 21
2012 was Romanians (living in another EU Member State) their numbers increasing almost eight-fold from 03 million in 2001 to 24 million by 2012
Chart 21 Main countries of origin of non-nationals EU-27 1 January 2012 (million)
Note 1 Estimates Eurostat
An analysis of the age structure of the population shows that for the EU-27 as a whole the foreign population was younger than the national population The distribution by age of
foreigners shows compared to nationals a greater proportion of relatively young working age adults In 2012 the median age of the national population in the EU-27 was 419 years while the median age of foreigners living in the EU was 347 years
Chart 22 Age structure of the national and foreign population EU-27 1 January 2012 ()
Source Eurostat (online data code migr_pop2ctz)
Acquisition of citizenship down by 35 in 2011
The number of people acquiring the citizenship of an EU-27 Member State in 2011 was 782200
corresponding to a 35 decrease with respect to 2010 2010 saw the greatest number of people acquiring the citizenship of an EU Member State since 2001 and the first time that the total number rose above 08 million
The United Kingdom had the highest number of persons acquiring citizenship in 2011 at 177
600 (or 227 of the EU-27 total) The next highest numbers were in France (114584) Spain (114599) and Germany (109594) none of the remaining Member States granted citizenship to more than 100000 people in 2011
Social Europe EU Employment and Social Situation I Quarterly Review
Special Supplement on Demographic Trends
March 2013 I 22
Table 12 Number of persons having acquired the citizenship of the reporting country 2001-2011
(thousand)
Source Eurostat (online data code migr_acq)
In absolute terms the highest decreases were observed in France (28691 fewer persons were
granted French citizenship compared to 2010) followed by the United Kingdom (17277) Italy (9785) and Spain (9122) The highest decreases in relative terms were recorded in Latvia (326 fewer persons acquired citizenship in 2011) and Bulgaria (312)
One indicator commonly used to measure the effect of national policies on citizenship is the lsquonaturalisation ratersquo or the ratio between the total number of citizenships granted and the stock of foreign residents in a country at the beginning of the year The country with the highest naturalisation rate in 2011 was Hungary (98 acquisitions per 100 foreign residents) followed
by Poland (67) and Sweden (58) while Malta Portugal and the United Kingdom all reported rates between 4 and 5 acquisitions per 100 foreign residents
Chart 23 Naturalisation rate 2011 (per 100 foreign residents)
Source Eurostat (online data code migr_acq and migr_pop1ctz)
About 867 of those who acquired citizenship of an EU-27 Member State in 2011 were
previously citizens of a non-EU country This was the case in nearly all of the Member States These new EU-27 citizens came mainly from Africa (262 of the total) Asia (226) non-
EU27 Europe (189) and North and South America (169) EU-27 citizens who acquired citizenship of another Member State amounted to 82 263 persons accounting for 105 of the
total In absolute terms the main groups of EU citizens acquiring citizenship of another EU Member State were Romanians becoming citizens of Hungary (15658 persons) and Italy (3921 persons) Poles becoming citizens of Germany (4344 persons) and Portuguese becoming citizens
of France (3805 persons)
Social Europe EU Employment and Social Situation I Quarterly Review
Special Supplement on Demographic Trends
March 2013 I 23
In Luxembourg and Hungary the majority of new citizenships granted were to citizens of another EU Member State In the case of Luxembourg Portuguese citizens accounted for the largest share while in the case of Hungary those acquiring citizenship were almost exclusively Romanians
As in previous years the largest groups of new citizens in the EU Member States in 2011 were citizens of Morocco (64200 corresponding to 82 of all citizenships granted) and Turkey (48800 or 62) Compared with 2010 the number of Moroccan citizens acquiring citizenship
of an EU Member State decreased by 44 while the figure for Turkish citizens fell by 20 The largest share of Moroccans acquired their new citizenship in France (326) Spain (224) and Italy (167) while the highest proportion of Turkish nationals acquired their new citizenship in Germany (575) and France (129)
Marriages and divorces
The number of marriages is decreasing and the number of divorces is increasing although the trend in marriages may be due in part to ageing of the population In addition more and more
children are being born to un-married women and the countries with the highest extramarital birth rates are often also those with the highest fertility rates
Marriage as recognised by the law in each country has long been considered to indicate family
formation However the analysis of trends in family formation and dissolution based on just marriage and divorce data might not offer a full picture Legal alternatives to marriage like registered partnership have become more widespread and national legislation has evolved to confer more rights on unmarried couples Alongside these new legal forms other forms of non-
marital relationships have appeared making it more difficult for statisticians to collect data that can be compared across countries
Due to differences in the timing and formal recognition of changing patterns of family formation
and dissolution these concepts have become more difficult to operationalise
Fewer marriages more divorces
22 million marriages took place in the EU-27 in 2010 and 10 million divorces occurred in the
EU-27 in 2009 according to the most recent available aggregated data These figures may be expressed as 44 marriages for every 1000 persons (ie the crude marriage rate) and 19 divorces for every 1000 persons (ie the crude divorce rate)
Since 1965 the crude marriage rate in the EU-27 has declined by some 43 in relative terms
(from 77 per 1000 persons in 1965 to 44 in 2010)
Chart 24 Crude marriage and divorce rates EU-27
Source Eurostat (online data codes demo_nind and demo_ndivind) Note The series of divorce rate in EU-27 is discontinued due to unavailability of data by Member States to be aggregated
At the same time marriages have become less stable in the EU-27 as indicated by the increase in the crude divorce rate from 08 per 1000 persons in 1965 to 21 in 2007 Part of this increase
is due to the fact that in several countries divorce was legalised during the period Over 2008 and 2009 however the annual number of divorces decreased slightly to 19 per 1000 persons in 2009
Table 13 shows that in 2011 the crude marriage rate among the EU-27 Member States was highest in Cyprus (73 per 1000 persons) Lithuania (63) and Malta (61) At the other end of
Social Europe EU Employment and Social Situation I Quarterly Review
Special Supplement on Demographic Trends
March 2013 I 24
the scale the lowest crude marriage rates were reported by Bulgaria (29 per 1000 persons) Slovenia (32) and Luxembourg (33)
Table 13 Crude marriage rate (marriages per 1000 persons)
Source Eurostat (online data code demo_nind) Note EU-27 excludes French overseas departments for 1960 to 1990 CY Up to and including 2000 data refer to total marriages contracted in the country including marriages between non-residents 2009-2011 data refer to marriages where at least one spouse was resident in the country
As regards divorce Ireland (07 per 1000 persons) and several southern European Member
States including Italy (09) Slovenia (11) and Greece (12) have significantly lower crude divorce rates than Latvia (40 per 1000 persons) Lithuania (34) and Belgium (29) Divorce
became legal in Malta in 2011 so the first data available in 2011 show only 01 divorces per 1000 persons
Table 14 Crude divorce rate (divorces per 1000 persons)
Source Eurostat (online data code demo_ndivind) Note EU-27 excludes French overseas departments for 1960 to 1990 Divorce was not possible by law in Italy until 1970 in Spain until 1981 in Ireland until 1995 and in Malta until 2011
A rise in births outside marriage
The proportion of births outside marriage in the EU-27 in 2011 was 395 It continues to
increase signalling new patterns of family formation alongside the more traditional pattern
where children are born within marriage Extramarital births occur in non-marital relationships among cohabiting couples and to lone parents
Social Europe EU Employment and Social Situation I Quarterly Review
Special Supplement on Demographic Trends
March 2013 I 25
Table 15 Live births outside marriage ( share of total live births)
Source Eurostat (online data code demo_find) Note EU-27 excludes French overseas departments for 1960 to 1990 and excludes Romania for 1990
Extra-marital births increased in almost every country in the EU-27 during 2011 with the exception of Ireland Malta and Sweden In six Member States the majority of live births are
now outside marriage Estonia (597) Slovenia (568) Bulgaria (561) France (558) Sweden (543) and Belgium (500) Mediterranean countries like Greece Croatia Cyprus Italy and Malta along with Poland Lithuania and Romania are at the other end of the scale
with a large proportion over 70 of births occurring within marriage
Chart 25 Proportion of live births outside marriage and total fertility rate 2011
Source Eurostat (online data code demo_find)
Countries with higher proportions of births outside marriage often have higher fertility rates In France Sweden Belgium Denmark the United Kingdom and Netherlands high rates of live births outside marriage (above 45 of total live births) are associated with total fertility rates
above the EU-27 average (157 live births per woman in 2011) (Chart 25)
Social Europe EU Employment and Social Situation I Quarterly Review
Special Supplement on Demographic Trends
March 2013 I 26
Population development and employment growth
A what-if analysis can be instructive and tell how far employment growth can be sustained under current demographic trends The analysis below is based on the 2010 Eurostat demographic projections The scenarios are exclusively on the supply side and do not take into
account projections of labour demand
Europe 2020 targets promote lower school drop-out rates higher rates of tertiary education and higher employment In the past school drop-out rates have been decreasing though not as fast
as targeted earlier tertiary education has been increasing steadily employment grew until 2008 then decreased especially for young adults and migrants
In 2010 14 of EU residents aged 18-24 were not in education or training and did not have an upper secondary school diploma They are called lsquoearly leaversrsquo and the aim is to bring this
figure down to 10 by 2020 Even though more young adults complete secondary education and more are motivated to continue with education or training if current trends continue the outcome is likely to fall short of the objective
On the other hand the education levels of todayrsquos 20-24 year-olds is higher than it was 10 years ago As a result at current growth rates in 2020 40 of 30-34 year-olds are likely to have a tertiary degree thereby achieving the tertiary education target
Scenarios for the EU-27
The estimates in the text above and those in Chart 26 and Table 16 are based on Eurostatrsquos Population projections (Europop 2010) and annual Labour Force Survey employment and
education attainment rates as well as assumptions based on the Europe 2020 targets on education and employment
Chart 26 Population by sex age group an employment EU-27 2010 and 2030 (million)
2010 age 2030
90
80
70
60
50
40
30
20
10
0
Source Eurostat (online data codes proj_10c lfsa_ergan lfsa_ergaed lfsa_pgaed) and DG EMPL computations
In Chart 26 the 2030 employment counts were computed by assuming that employment rates remain constant across ages sex origin and education level whereas educational attainment rates follow observed trends This means that the education levels of each 5-year cohort (for instance those aged 20-24 in 2010) will change over time according to changes observed in the
period 2006-2011 as a result during the following five projection years some of its ISCED7 0-2 people will graduate to ISCED 3-4 and some of its (and newly graduated) ISCED 3-4 will graduate to ISCED 5-6 These graduation rates are assumed to depend on age and to remain
constant in the future
Education trends consist of two components The first is the educational level of young adults (aged 15-19) The ISCED 3-4 attainment of this group has been increasing and this trend is
assumed to continue tapering to a maximum of 25 in the long run Transitions between
7 International Standard Classification of Education see httpwwwuisunescoorgEducationPagesinternational-standard-classification-of-educationaspx
20 10 10 20 20 10 10 20
Social Europe EU Employment and Social Situation I Quarterly Review
Special Supplement on Demographic Trends
March 2013 I 27
education levels at successive ages are assumed to be constant It must be considered that as education levels continue rising they continue to raise employment rates In present scenarios as better-educated cohorts replace less-well educated ones the global employment rate rises and so does overall employment
The observed overall increase so far is largely the net effect of composition change where the positive impact of the increase in educational attainment more than offsets the negative impact of our active-age population becoming increasingly older or of migrant origin (non-EU-27)
Under these assumptions Chart 26 shows total employment declining by 5 million that is 25 from 2010 to 2030 the employment rate of those aged 20-64 in 2020 would be 685 a slight increase and far below the Europe 2020 target The reason for this change would be the rise in education levels mitigated by an ageing population and a growing proportion of
migrants Economic dependency8 would rise from 132 in 2010 to 147 in 2030 In Table 16 this is the lsquotrend education with constant employment ratesrsquo scenario
The Social Investment Package9 calls for measures that increase labour participation
employability and productivity It is important to analyse the feasibility and consequences of raising education levels and labour participation to assess the suitability of the measures envisaged
For instance focusing on opportunities for disadvantaged workers may bring in more people with lower skills and the changing skills composition would affect productivity10 In addition it pays to understand the impact of current population trends in education
Table 16 summarises employment in 2020 and 2030 under several scenarios Its purpose is to
analyse the difficulty and impact in 2030 of reaching the Europe 2020 employment objectives
The first scenario includes demographic change but no rise in educational attainment It is purely mechanical and its only purpose is to assess the impact of skills renewal due to cohort
turnover as older less-well-educated worker cohorts leave the labour market younger better-educated cohorts join it Although skills renewal is now slower than it was in the past 2-3 decades because of demographic changes the impact remains high
The second scenario allows for education to continue progressing as it did in the past thereby shifting overall employment Without an effort to attain the Europe 2020 employment objectives the EU-27 workforce will become older but also better educated As a result employment will be stable until 2020 but will decrease by 2-3 by 2030 feeling the impact of
demographics The declining population of working age will increasingly consist of older workers
The third scenario assumes that the Europe 2020 targets on education will be attained and the
trend towards a better-educated work force will continue after 2020 Here we should underline that
under the assumption that current education transitions continue the tertiary education
target would also be attained
Europe 2020 education targets will have a small impact on employment in 2030 This is because the targeted increase in tertiary attainment and the reduction in early leavers will affect only the very young cohorts of workers so that the effect will not materialise
by 2030 however the impact will be far larger after 2030
The fourth scenario assumes that in addition to the Europe 2020 target for education the target on employment will also be attained As regards those aged 65 and above this scenario
envisages the same rates of increase for employment as for people aged 55-64 Employment rate increases from 2010 to 2020 then assumed go on till 2030
But attaining the Europe 2020 employment target would require tapping into a potential labour
force consisting largely of older people and so-far inactive migrants These cohorts tend to be less educated than the rest of the labour force This means that not only will activating them be
harder but also that they will contribute to the less-skilled workforce whereas there is strong
8 Economic dependency is the ratio between the number of people not in employment and those who are 9 See COM(2013) 83 10 See Employment and Social Developments in Europe Chapter 4 p 279
Social Europe EU Employment and Social Situation I Quarterly Review
Special Supplement on Demographic Trends
March 2013 I 28
evidence suggesting that demand in future decades will concentrate on high-skilled rather than low-skilled workers11
Table 16 Work force scenarios under Europe 2020 assumptions EU-27 2020 and 2030
Source Eurostat (online data codes proj_10c lfsa_ergan lfsa_ergaed lfsa_pgaed) and DG EMPL computations Note (1) only EU citizens
Employment gains among women and young people who tend to be better educated may be easier to achieve and yield higher productivity gains however they alone will not mean the Europe 2020 employment target is met Up skilling via continuing education and training is
another way to motivate and nurture a productive workforce12
Differences among Member States
Population developments in the various Member States differ as the rate of ageing varies and
these find themselves in different phases For instance eastern States have relatively young and slowly-ageing populations now but face the prospect of very rapid ageing from 2025 onwards13 In addition some Member States already make better use of their potential work
forces with higher education and employment rates than others
In the past two decades employment and productivity growth fuelled economic growth in roughly equal measure The observed pre-crisis 1 employment growth ended in 2008 When
the crisis abates employment can resume growth but this will be limited in future
Demographic ageing and workforce decline will create bottlenecks to the available labour force in the medium term even though at present countries still have un-deployed human resources which could potentially yield further employment growth
Chart 27 outlines the Member Statesrsquo different potentials for continuing employment growth Assuming that the EUrsquos economic and social system will need 1 employment growth Member States differ as to when such a lsquosustainablersquo growth path will have to come to an end simply
because human resources become scarce
Two scenarios are presented14
Under the first scenario there will be no further progress in activation its growth-end
year is the upper end of the blue bar in Chart 27
Under the second scenario each country exploits the maximum activation potential of women older people and educational progress its growth-end year is the upper end of the yellow bar in Chart 27 Four Member States can continue growing beyond 2040
11 See for instance httpwwwcedefopeuropaeuENpublications20633aspx
12 Source httpeceuropaeusocialmainjsplangId=enampcatId=113ampnewsId=1774ampfurtherNews=yes chapter 69 13 See the 2010 Demography Report (chapter I5)
14 See draft paper of C Fotakis J Peschner (2013) lsquo Growth potential of EU human resources and policy implications for future economic growthrsquo not yet published
Social Europe EU Employment and Social Situation I Quarterly Review
Special Supplement on Demographic Trends
March 2013 I 29
The Member States with the longer bars whose maximum potential for growth reaches further into the future are of two types Some have strong population growth and slow ageing such as Ireland others have large unused capacity to tap by increasing participation in (education and) labour
More critically the EU-27 is projected to have a large shortfall of well-educated (ISCED 5-6) workers Although their number will grow by virtue of rising education levels in the population this projected growth is slower than the increase in demand
Chart 27 Year in which a continued 1 employment growth from 2011 is projected to stop by
country
Source FotakisPeschner (2013)6 based on Eurostat LFS
In addition the untapped potential consists mainly of less-well educated people for two
reasons First the better educated are already well involved in the labour market Secondly the most promising sources of additional labour ie older people and migrants tend to be less well educated than prime-age EU nationals
Thus as regards high-skilled workers the time-window for growth is more limited Even the best activation policies can only palliate and delay the onset of shortages for just a few years
Social Europe EU Employment and Social Situation I Quarterly Review
Special Supplement on Demographic Trends
March 2013 I 30
European Commission
EU Employment and Social Situation Quarterly Review March 2013 ndash Special
Supplement on Demographic Trends
Luxembourg Publications Office of the European Union
2013 mdash 30 pp mdash 21 times 297 cm
ISBN 978-92-79-29383-2
ISSN 1977-8317 doi 10276741278
This publication is available in electronic format in English
KE-BH-13-0S2-EN-N
- Table of Contents
- Introduction
- Population change and age structure
- Fertility
- Mortality
- Migration and migrant population
- Marriages and divorces
- Population development and employment growth
-
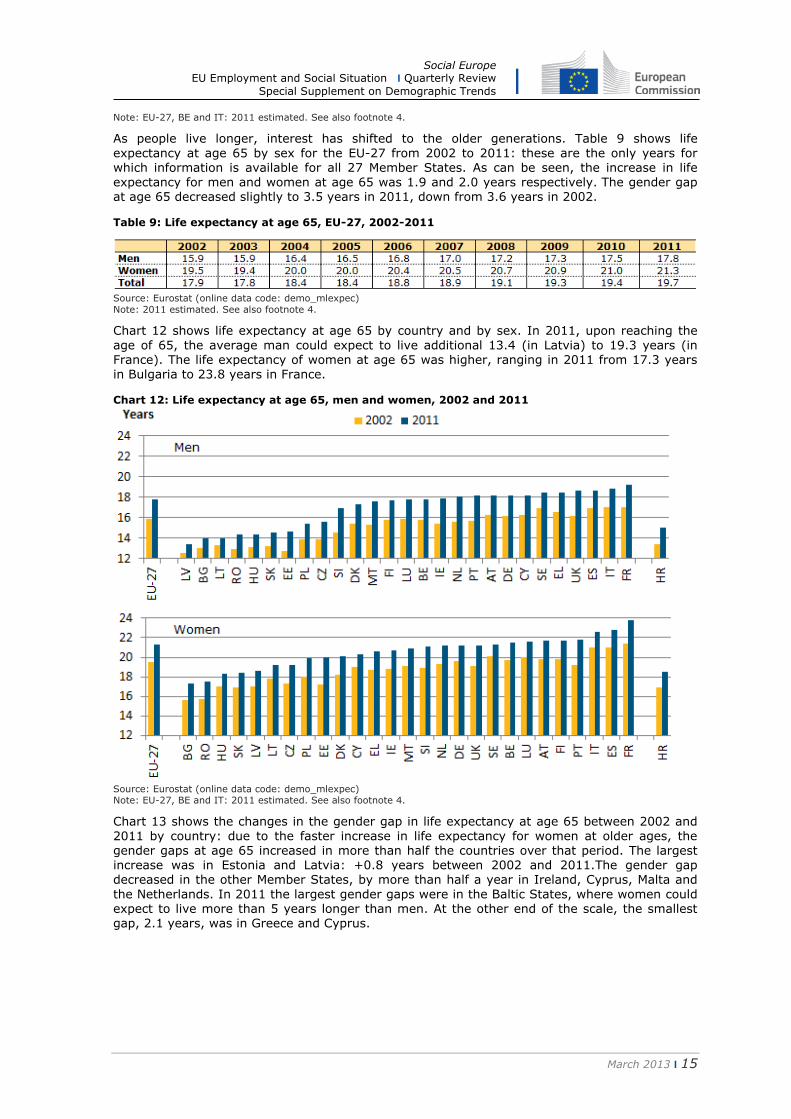
Social Europe EU Employment and Social Situation I Quarterly Review
Special Supplement on Demographic Trends
March 2013 I 17
Migration and migrant population
Immigration to the EU-27 at 17 million
During 2011 there were an estimated 17 million immigrants to the EU-27 from a country
outside the EU-27 In addition 13 million people previously residing in an EU-27 Member State migrated to another Member State
Table 10 Immigration 2009-2011 (in absolute numbers and as a percentage of total
immigration)
Source Eurostat (online data code migr_imm5prv migr_imm1ctz) Note The individual values do not add up to the total due to rounding and to exclusion of the lsquounknownrsquo citizenship group from the table (p) provisional data (b) break in series (s) estimated
Thus about 32 million people immigrated5 to one of the EU-27
6 Member States while at least
23 million emigrants were reported to have left an EU-27 Member State It should be noted that these figures do not represent the migration flows tofrom the EU as a whole since they also include flows between different EU Member States
The United Kingdom reported the largest number of immigrants (566044) in 2011 followed by Germany (489422) Spain (457649) and Italy (385793) These four Member States together accounted for 603 of all immigrants to EU-27 Member States
Spain reported the highest number of emigrants in 2011 (507742) followed by the United
Kingdom (350703) Germany (249045) and France (213367) 16 of the EU-27 Member States reported more immigration than emigration in 2011 but in Bulgaria the Czech Republic Ireland Greece Spain Poland Romania and the three Baltic Member States emigrants
outnumbered immigrants
Relative to the size of the resident population Luxembourg recorded the highest number of immigrants in 2011 (38 immigrants per 1000 persons) followed by Cyprus (26) and Malta (13)
The highest rates of emigration in 2011 were reported for Ireland (19 emigrants per 1 000 persons) and Lithuania (18 emigrants per 1000 persons)
5 A person is considered to have immigrated if he or she establishes his or her usual residence in a Member State for at least twelve months having previously been usually resident in another Member State or a third country as set out in Article 2 of Regulation (EC) 8622007
Social Europe EU Employment and Social Situation I Quarterly Review
Special Supplement on Demographic Trends
March 2013 I 18
Chart 15 Immigrants 2011 (per 1 000 persons)
Source Eurostat (online data code migr_imm1ctz and migr_pop1ctz) Note Data on the number of persons refer to 1 January 2012 for HR
Citizens of non-EU countries can be categorised according to the level of development of their country of citizenship based on the Human Development Index (HDI) calculated by the United
Nations By this measure the largest share (524 of all immigrants to the EU are from medium HDI countries and 346 are from high HDI (but non-EU) countries By contrast low HDI countries (63) EFTA countries (36) and Candidate countries (31) accounted for
relatively low shares of total immigration to the EU-27 in 2011
Chart 16 Share of immigrants by citizenship group EU-27 2011 ()
Source Eurostat (online data code migr_imm5prv) Note Candidate countries as of 1 January 2011 Montenegro Croatia former Yugoslav Republic of Macedonia and Turkey
In 2011 the relative share of returning nationals within the total number of immigrants was highest in Lithuania (893 of all immigrants) Portugal (636) Croatia (553) Estonia (548) and Greece (545) These were the only EU Member States to report return migration higher than 50 By contrast Luxembourg Austria Italy Cyprus and Spain reported
relatively low shares as return migration in 2011 accounted for less than 10 of immigrants
Chart 17 Share of return migrants EU-27 2011 ()
Source Eurostat (online data code migr_imm1ctz)
Regarding the gender distribution of immigrants in 2011 there were slightly more men than women as a whole (521 compared to 479) The country reporting the highest share of male immigrants was Slovakia (624) by contrast the highest share of female immigrants
was reported in Cyprus (552)
Social Europe EU Employment and Social Situation I Quarterly Review
Special Supplement on Demographic Trends
March 2013 I 19
Foreign population at 207 million and foreign-born population at 330 million in EU-27
The EU-27 foreign population (people residing in an EU-27 Member State with citizenship of a non EU-27 Member State) on 1 January 2012 was 207 million representing 41 of the EU-27
population In addition there were 136 million persons living in an EU-27 Member State with
citizenship of another EU-27 Member State on 1 January 2012
Due to better data availability information on citizenship has often been used to study populations with a foreign background However since citizenship can change over time it is also useful to present information by country of birth
There were 330 million people born outside a country of the EU-27 on 1 January 2012 and there were 172 million persons who were born in a different EU-27 Member State from the country of residence Only in Luxembourg Ireland Hungary Cyprus and Malta did foreign-born
persons from other EU-27 countries outnumber those born outside the EU-27 People born abroad outnumbered foreign citizens in all Member States except Luxembourg Latvia and the Czech Republic
Table 11 Foreign and foreign-born population by group of citizenship and country of birth 1
January 2012 (in absolute numbers and as a percentage of the total foreignforeign-born
population)
Source Eurostat (online data code migr_pop1ctz) Note The individual values do not add up to the total due to rounding and to exclusion of the lsquounknownrsquo citizenship group from the table Population data for HR comes from 2011 Census as on 31 March 2011 (p) provisional data (s) estimated
In absolute terms the largest numbers of foreigners living in the EU on 1 January 2012 were
found in Germany (74 million) Spain (55 million) Italy (48 million) the United Kingdom (48 million) and France (38 million) Non-nationals in these five Member States collectively represented 771 of the total number of non-nationals living in the EU-27 while the same five Member States had a 629 share of the EUrsquos population In relative terms the EU-27 Member
State with the highest share of non-nationals was Luxembourg where they accounted for 438 of the total population The vast majority (864) of non-nationals living in Luxembourg were citizens of other EU Member States As at 1 January 2012 a high proportion of non-
nationals (10 or more of the resident population) was also observed in Cyprus Latvia
Estonia Spain Austria and Belgium
In most EU Member States the majority of non-nationals are citizens of non-EU countries At the
beginning of 2012 citizens of other EU-27 Member States represented the majority of non-nationals living in Luxembourg Ireland Belgium Slovakia Cyprus and Hungary In Latvia and Estonia the proportion of citizens from non-EU countries is particularly large due to the high
Social Europe EU Employment and Social Situation I Quarterly Review
Special Supplement on Demographic Trends
March 2013 I 20
number of recognised non-citizens (mainly former Soviet Union citizens who are permanently resident in these countries but have not acquired citizenship)
Chart 18 Share of foreigners in the resident population EU-27 1 January 2012 ()
Source Eurostat (online data code migr_pop1ctz)
Looking at the distribution by continent of citizens of non-EU countries living in the EU the largest proportion (385) were citizens of a European country outside the EU-27 A total of 79
million citizens from European countries outside the EU-27 were residing in the EU at the start of 2012 among these more than half were citizens of Turkey Albania or Ukraine The next biggest group was from Africa (245) followed by Asia (220) the Americas (142) and Oceania (08) More than half the African citizens living in the EU were from North Africa
often from Morocco or Algeria Many Asian citizens living in the EU came from southern or eastern Asia in particular from India or China Citizens of Ecuador and the United States made up the largest share of non-nationals from the Americas living in the EU
Chart 19 Citizens of non-EU countries
resident in the EU-27 by continent of origin
1 January 2012 ()
Chart 20 Non-EU citizens resident in the
EU-27 by level of human development index
(HDI) of country of citizenship 1 January
2012 ()
Source Eurostat
Among the non-EU citizens living in the EU-27 in 2012 some 442 were citizens of a high HDI country (with Turkey Albania and Russia accounting for almost half) while a slightly higher share (483) came from medium HDI countries (one fifth from Morocco followed by China and Ukraine) the remaining 76 were from low HDI countries (30 with Nigerian or Iraqi
citizenship)
The citizenship structure of the population of non-nationals living in the EU varies greatly between Member States It is influenced by factors such as labour migration historical links
between countries of origin and destination and established networks in destination countries Romanians (living in another EU Member State) and Turkish citizens were the biggest groups of non-nationals living in the EU-27 in 2012 There were 23 million citizens from each of these
countries each group accounting for 70 of all non-nationals living in the EU-27 in 2012 The third largest group was Moroccans (19 million people or 56 of all non-nationals) The group of non-nationals living in the EU with the most significant increase over the period from 2001 to
Social Europe EU Employment and Social Situation I Quarterly Review
Special Supplement on Demographic Trends
March 2013 I 21
2012 was Romanians (living in another EU Member State) their numbers increasing almost eight-fold from 03 million in 2001 to 24 million by 2012
Chart 21 Main countries of origin of non-nationals EU-27 1 January 2012 (million)
Note 1 Estimates Eurostat
An analysis of the age structure of the population shows that for the EU-27 as a whole the foreign population was younger than the national population The distribution by age of
foreigners shows compared to nationals a greater proportion of relatively young working age adults In 2012 the median age of the national population in the EU-27 was 419 years while the median age of foreigners living in the EU was 347 years
Chart 22 Age structure of the national and foreign population EU-27 1 January 2012 ()
Source Eurostat (online data code migr_pop2ctz)
Acquisition of citizenship down by 35 in 2011
The number of people acquiring the citizenship of an EU-27 Member State in 2011 was 782200
corresponding to a 35 decrease with respect to 2010 2010 saw the greatest number of people acquiring the citizenship of an EU Member State since 2001 and the first time that the total number rose above 08 million
The United Kingdom had the highest number of persons acquiring citizenship in 2011 at 177
600 (or 227 of the EU-27 total) The next highest numbers were in France (114584) Spain (114599) and Germany (109594) none of the remaining Member States granted citizenship to more than 100000 people in 2011
Social Europe EU Employment and Social Situation I Quarterly Review
Special Supplement on Demographic Trends
March 2013 I 22
Table 12 Number of persons having acquired the citizenship of the reporting country 2001-2011
(thousand)
Source Eurostat (online data code migr_acq)
In absolute terms the highest decreases were observed in France (28691 fewer persons were
granted French citizenship compared to 2010) followed by the United Kingdom (17277) Italy (9785) and Spain (9122) The highest decreases in relative terms were recorded in Latvia (326 fewer persons acquired citizenship in 2011) and Bulgaria (312)
One indicator commonly used to measure the effect of national policies on citizenship is the lsquonaturalisation ratersquo or the ratio between the total number of citizenships granted and the stock of foreign residents in a country at the beginning of the year The country with the highest naturalisation rate in 2011 was Hungary (98 acquisitions per 100 foreign residents) followed
by Poland (67) and Sweden (58) while Malta Portugal and the United Kingdom all reported rates between 4 and 5 acquisitions per 100 foreign residents
Chart 23 Naturalisation rate 2011 (per 100 foreign residents)
Source Eurostat (online data code migr_acq and migr_pop1ctz)
About 867 of those who acquired citizenship of an EU-27 Member State in 2011 were
previously citizens of a non-EU country This was the case in nearly all of the Member States These new EU-27 citizens came mainly from Africa (262 of the total) Asia (226) non-
EU27 Europe (189) and North and South America (169) EU-27 citizens who acquired citizenship of another Member State amounted to 82 263 persons accounting for 105 of the
total In absolute terms the main groups of EU citizens acquiring citizenship of another EU Member State were Romanians becoming citizens of Hungary (15658 persons) and Italy (3921 persons) Poles becoming citizens of Germany (4344 persons) and Portuguese becoming citizens
of France (3805 persons)
Social Europe EU Employment and Social Situation I Quarterly Review
Special Supplement on Demographic Trends
March 2013 I 23
In Luxembourg and Hungary the majority of new citizenships granted were to citizens of another EU Member State In the case of Luxembourg Portuguese citizens accounted for the largest share while in the case of Hungary those acquiring citizenship were almost exclusively Romanians
As in previous years the largest groups of new citizens in the EU Member States in 2011 were citizens of Morocco (64200 corresponding to 82 of all citizenships granted) and Turkey (48800 or 62) Compared with 2010 the number of Moroccan citizens acquiring citizenship
of an EU Member State decreased by 44 while the figure for Turkish citizens fell by 20 The largest share of Moroccans acquired their new citizenship in France (326) Spain (224) and Italy (167) while the highest proportion of Turkish nationals acquired their new citizenship in Germany (575) and France (129)
Marriages and divorces
The number of marriages is decreasing and the number of divorces is increasing although the trend in marriages may be due in part to ageing of the population In addition more and more
children are being born to un-married women and the countries with the highest extramarital birth rates are often also those with the highest fertility rates
Marriage as recognised by the law in each country has long been considered to indicate family
formation However the analysis of trends in family formation and dissolution based on just marriage and divorce data might not offer a full picture Legal alternatives to marriage like registered partnership have become more widespread and national legislation has evolved to confer more rights on unmarried couples Alongside these new legal forms other forms of non-
marital relationships have appeared making it more difficult for statisticians to collect data that can be compared across countries
Due to differences in the timing and formal recognition of changing patterns of family formation
and dissolution these concepts have become more difficult to operationalise
Fewer marriages more divorces
22 million marriages took place in the EU-27 in 2010 and 10 million divorces occurred in the
EU-27 in 2009 according to the most recent available aggregated data These figures may be expressed as 44 marriages for every 1000 persons (ie the crude marriage rate) and 19 divorces for every 1000 persons (ie the crude divorce rate)
Since 1965 the crude marriage rate in the EU-27 has declined by some 43 in relative terms
(from 77 per 1000 persons in 1965 to 44 in 2010)
Chart 24 Crude marriage and divorce rates EU-27
Source Eurostat (online data codes demo_nind and demo_ndivind) Note The series of divorce rate in EU-27 is discontinued due to unavailability of data by Member States to be aggregated
At the same time marriages have become less stable in the EU-27 as indicated by the increase in the crude divorce rate from 08 per 1000 persons in 1965 to 21 in 2007 Part of this increase
is due to the fact that in several countries divorce was legalised during the period Over 2008 and 2009 however the annual number of divorces decreased slightly to 19 per 1000 persons in 2009
Table 13 shows that in 2011 the crude marriage rate among the EU-27 Member States was highest in Cyprus (73 per 1000 persons) Lithuania (63) and Malta (61) At the other end of
Social Europe EU Employment and Social Situation I Quarterly Review
Special Supplement on Demographic Trends
March 2013 I 24
the scale the lowest crude marriage rates were reported by Bulgaria (29 per 1000 persons) Slovenia (32) and Luxembourg (33)
Table 13 Crude marriage rate (marriages per 1000 persons)
Source Eurostat (online data code demo_nind) Note EU-27 excludes French overseas departments for 1960 to 1990 CY Up to and including 2000 data refer to total marriages contracted in the country including marriages between non-residents 2009-2011 data refer to marriages where at least one spouse was resident in the country
As regards divorce Ireland (07 per 1000 persons) and several southern European Member
States including Italy (09) Slovenia (11) and Greece (12) have significantly lower crude divorce rates than Latvia (40 per 1000 persons) Lithuania (34) and Belgium (29) Divorce
became legal in Malta in 2011 so the first data available in 2011 show only 01 divorces per 1000 persons
Table 14 Crude divorce rate (divorces per 1000 persons)
Source Eurostat (online data code demo_ndivind) Note EU-27 excludes French overseas departments for 1960 to 1990 Divorce was not possible by law in Italy until 1970 in Spain until 1981 in Ireland until 1995 and in Malta until 2011
A rise in births outside marriage
The proportion of births outside marriage in the EU-27 in 2011 was 395 It continues to
increase signalling new patterns of family formation alongside the more traditional pattern
where children are born within marriage Extramarital births occur in non-marital relationships among cohabiting couples and to lone parents
Social Europe EU Employment and Social Situation I Quarterly Review
Special Supplement on Demographic Trends
March 2013 I 25
Table 15 Live births outside marriage ( share of total live births)
Source Eurostat (online data code demo_find) Note EU-27 excludes French overseas departments for 1960 to 1990 and excludes Romania for 1990
Extra-marital births increased in almost every country in the EU-27 during 2011 with the exception of Ireland Malta and Sweden In six Member States the majority of live births are
now outside marriage Estonia (597) Slovenia (568) Bulgaria (561) France (558) Sweden (543) and Belgium (500) Mediterranean countries like Greece Croatia Cyprus Italy and Malta along with Poland Lithuania and Romania are at the other end of the scale
with a large proportion over 70 of births occurring within marriage
Chart 25 Proportion of live births outside marriage and total fertility rate 2011
Source Eurostat (online data code demo_find)
Countries with higher proportions of births outside marriage often have higher fertility rates In France Sweden Belgium Denmark the United Kingdom and Netherlands high rates of live births outside marriage (above 45 of total live births) are associated with total fertility rates
above the EU-27 average (157 live births per woman in 2011) (Chart 25)
Social Europe EU Employment and Social Situation I Quarterly Review
Special Supplement on Demographic Trends
March 2013 I 26
Population development and employment growth
A what-if analysis can be instructive and tell how far employment growth can be sustained under current demographic trends The analysis below is based on the 2010 Eurostat demographic projections The scenarios are exclusively on the supply side and do not take into
account projections of labour demand
Europe 2020 targets promote lower school drop-out rates higher rates of tertiary education and higher employment In the past school drop-out rates have been decreasing though not as fast
as targeted earlier tertiary education has been increasing steadily employment grew until 2008 then decreased especially for young adults and migrants
In 2010 14 of EU residents aged 18-24 were not in education or training and did not have an upper secondary school diploma They are called lsquoearly leaversrsquo and the aim is to bring this
figure down to 10 by 2020 Even though more young adults complete secondary education and more are motivated to continue with education or training if current trends continue the outcome is likely to fall short of the objective
On the other hand the education levels of todayrsquos 20-24 year-olds is higher than it was 10 years ago As a result at current growth rates in 2020 40 of 30-34 year-olds are likely to have a tertiary degree thereby achieving the tertiary education target
Scenarios for the EU-27
The estimates in the text above and those in Chart 26 and Table 16 are based on Eurostatrsquos Population projections (Europop 2010) and annual Labour Force Survey employment and
education attainment rates as well as assumptions based on the Europe 2020 targets on education and employment
Chart 26 Population by sex age group an employment EU-27 2010 and 2030 (million)
2010 age 2030
90
80
70
60
50
40
30
20
10
0
Source Eurostat (online data codes proj_10c lfsa_ergan lfsa_ergaed lfsa_pgaed) and DG EMPL computations
In Chart 26 the 2030 employment counts were computed by assuming that employment rates remain constant across ages sex origin and education level whereas educational attainment rates follow observed trends This means that the education levels of each 5-year cohort (for instance those aged 20-24 in 2010) will change over time according to changes observed in the
period 2006-2011 as a result during the following five projection years some of its ISCED7 0-2 people will graduate to ISCED 3-4 and some of its (and newly graduated) ISCED 3-4 will graduate to ISCED 5-6 These graduation rates are assumed to depend on age and to remain
constant in the future
Education trends consist of two components The first is the educational level of young adults (aged 15-19) The ISCED 3-4 attainment of this group has been increasing and this trend is
assumed to continue tapering to a maximum of 25 in the long run Transitions between
7 International Standard Classification of Education see httpwwwuisunescoorgEducationPagesinternational-standard-classification-of-educationaspx
20 10 10 20 20 10 10 20
Social Europe EU Employment and Social Situation I Quarterly Review
Special Supplement on Demographic Trends
March 2013 I 27
education levels at successive ages are assumed to be constant It must be considered that as education levels continue rising they continue to raise employment rates In present scenarios as better-educated cohorts replace less-well educated ones the global employment rate rises and so does overall employment
The observed overall increase so far is largely the net effect of composition change where the positive impact of the increase in educational attainment more than offsets the negative impact of our active-age population becoming increasingly older or of migrant origin (non-EU-27)
Under these assumptions Chart 26 shows total employment declining by 5 million that is 25 from 2010 to 2030 the employment rate of those aged 20-64 in 2020 would be 685 a slight increase and far below the Europe 2020 target The reason for this change would be the rise in education levels mitigated by an ageing population and a growing proportion of
migrants Economic dependency8 would rise from 132 in 2010 to 147 in 2030 In Table 16 this is the lsquotrend education with constant employment ratesrsquo scenario
The Social Investment Package9 calls for measures that increase labour participation
employability and productivity It is important to analyse the feasibility and consequences of raising education levels and labour participation to assess the suitability of the measures envisaged
For instance focusing on opportunities for disadvantaged workers may bring in more people with lower skills and the changing skills composition would affect productivity10 In addition it pays to understand the impact of current population trends in education
Table 16 summarises employment in 2020 and 2030 under several scenarios Its purpose is to
analyse the difficulty and impact in 2030 of reaching the Europe 2020 employment objectives
The first scenario includes demographic change but no rise in educational attainment It is purely mechanical and its only purpose is to assess the impact of skills renewal due to cohort
turnover as older less-well-educated worker cohorts leave the labour market younger better-educated cohorts join it Although skills renewal is now slower than it was in the past 2-3 decades because of demographic changes the impact remains high
The second scenario allows for education to continue progressing as it did in the past thereby shifting overall employment Without an effort to attain the Europe 2020 employment objectives the EU-27 workforce will become older but also better educated As a result employment will be stable until 2020 but will decrease by 2-3 by 2030 feeling the impact of
demographics The declining population of working age will increasingly consist of older workers
The third scenario assumes that the Europe 2020 targets on education will be attained and the
trend towards a better-educated work force will continue after 2020 Here we should underline that
under the assumption that current education transitions continue the tertiary education
target would also be attained
Europe 2020 education targets will have a small impact on employment in 2030 This is because the targeted increase in tertiary attainment and the reduction in early leavers will affect only the very young cohorts of workers so that the effect will not materialise
by 2030 however the impact will be far larger after 2030
The fourth scenario assumes that in addition to the Europe 2020 target for education the target on employment will also be attained As regards those aged 65 and above this scenario
envisages the same rates of increase for employment as for people aged 55-64 Employment rate increases from 2010 to 2020 then assumed go on till 2030
But attaining the Europe 2020 employment target would require tapping into a potential labour
force consisting largely of older people and so-far inactive migrants These cohorts tend to be less educated than the rest of the labour force This means that not only will activating them be
harder but also that they will contribute to the less-skilled workforce whereas there is strong
8 Economic dependency is the ratio between the number of people not in employment and those who are 9 See COM(2013) 83 10 See Employment and Social Developments in Europe Chapter 4 p 279
Social Europe EU Employment and Social Situation I Quarterly Review
Special Supplement on Demographic Trends
March 2013 I 28
evidence suggesting that demand in future decades will concentrate on high-skilled rather than low-skilled workers11
Table 16 Work force scenarios under Europe 2020 assumptions EU-27 2020 and 2030
Source Eurostat (online data codes proj_10c lfsa_ergan lfsa_ergaed lfsa_pgaed) and DG EMPL computations Note (1) only EU citizens
Employment gains among women and young people who tend to be better educated may be easier to achieve and yield higher productivity gains however they alone will not mean the Europe 2020 employment target is met Up skilling via continuing education and training is
another way to motivate and nurture a productive workforce12
Differences among Member States
Population developments in the various Member States differ as the rate of ageing varies and
these find themselves in different phases For instance eastern States have relatively young and slowly-ageing populations now but face the prospect of very rapid ageing from 2025 onwards13 In addition some Member States already make better use of their potential work
forces with higher education and employment rates than others
In the past two decades employment and productivity growth fuelled economic growth in roughly equal measure The observed pre-crisis 1 employment growth ended in 2008 When
the crisis abates employment can resume growth but this will be limited in future
Demographic ageing and workforce decline will create bottlenecks to the available labour force in the medium term even though at present countries still have un-deployed human resources which could potentially yield further employment growth
Chart 27 outlines the Member Statesrsquo different potentials for continuing employment growth Assuming that the EUrsquos economic and social system will need 1 employment growth Member States differ as to when such a lsquosustainablersquo growth path will have to come to an end simply
because human resources become scarce
Two scenarios are presented14
Under the first scenario there will be no further progress in activation its growth-end
year is the upper end of the blue bar in Chart 27
Under the second scenario each country exploits the maximum activation potential of women older people and educational progress its growth-end year is the upper end of the yellow bar in Chart 27 Four Member States can continue growing beyond 2040
11 See for instance httpwwwcedefopeuropaeuENpublications20633aspx
12 Source httpeceuropaeusocialmainjsplangId=enampcatId=113ampnewsId=1774ampfurtherNews=yes chapter 69 13 See the 2010 Demography Report (chapter I5)
14 See draft paper of C Fotakis J Peschner (2013) lsquo Growth potential of EU human resources and policy implications for future economic growthrsquo not yet published
Social Europe EU Employment and Social Situation I Quarterly Review
Special Supplement on Demographic Trends
March 2013 I 29
The Member States with the longer bars whose maximum potential for growth reaches further into the future are of two types Some have strong population growth and slow ageing such as Ireland others have large unused capacity to tap by increasing participation in (education and) labour
More critically the EU-27 is projected to have a large shortfall of well-educated (ISCED 5-6) workers Although their number will grow by virtue of rising education levels in the population this projected growth is slower than the increase in demand
Chart 27 Year in which a continued 1 employment growth from 2011 is projected to stop by
country
Source FotakisPeschner (2013)6 based on Eurostat LFS
In addition the untapped potential consists mainly of less-well educated people for two
reasons First the better educated are already well involved in the labour market Secondly the most promising sources of additional labour ie older people and migrants tend to be less well educated than prime-age EU nationals
Thus as regards high-skilled workers the time-window for growth is more limited Even the best activation policies can only palliate and delay the onset of shortages for just a few years
Social Europe EU Employment and Social Situation I Quarterly Review
Special Supplement on Demographic Trends
March 2013 I 30
European Commission
EU Employment and Social Situation Quarterly Review March 2013 ndash Special
Supplement on Demographic Trends
Luxembourg Publications Office of the European Union
2013 mdash 30 pp mdash 21 times 297 cm
ISBN 978-92-79-29383-2
ISSN 1977-8317 doi 10276741278
This publication is available in electronic format in English
KE-BH-13-0S2-EN-N
- Table of Contents
- Introduction
- Population change and age structure
- Fertility
- Mortality
- Migration and migrant population
- Marriages and divorces
- Population development and employment growth
-
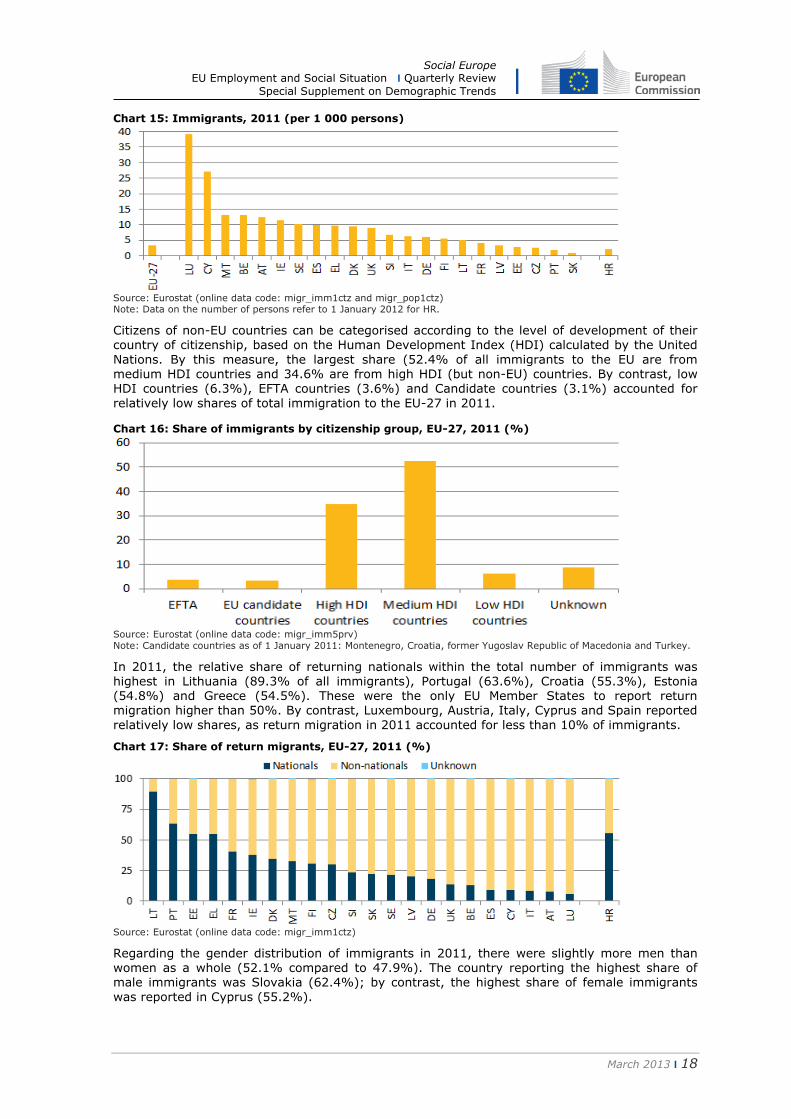
Social Europe EU Employment and Social Situation I Quarterly Review
Special Supplement on Demographic Trends
March 2013 I 21
2012 was Romanians (living in another EU Member State) their numbers increasing almost eight-fold from 03 million in 2001 to 24 million by 2012
Chart 21 Main countries of origin of non-nationals EU-27 1 January 2012 (million)
Note 1 Estimates Eurostat
An analysis of the age structure of the population shows that for the EU-27 as a whole the foreign population was younger than the national population The distribution by age of
foreigners shows compared to nationals a greater proportion of relatively young working age adults In 2012 the median age of the national population in the EU-27 was 419 years while the median age of foreigners living in the EU was 347 years
Chart 22 Age structure of the national and foreign population EU-27 1 January 2012 ()
Source Eurostat (online data code migr_pop2ctz)
Acquisition of citizenship down by 35 in 2011
The number of people acquiring the citizenship of an EU-27 Member State in 2011 was 782200
corresponding to a 35 decrease with respect to 2010 2010 saw the greatest number of people acquiring the citizenship of an EU Member State since 2001 and the first time that the total number rose above 08 million
The United Kingdom had the highest number of persons acquiring citizenship in 2011 at 177
600 (or 227 of the EU-27 total) The next highest numbers were in France (114584) Spain (114599) and Germany (109594) none of the remaining Member States granted citizenship to more than 100000 people in 2011
Social Europe EU Employment and Social Situation I Quarterly Review
Special Supplement on Demographic Trends
March 2013 I 22
Table 12 Number of persons having acquired the citizenship of the reporting country 2001-2011
(thousand)
Source Eurostat (online data code migr_acq)
In absolute terms the highest decreases were observed in France (28691 fewer persons were
granted French citizenship compared to 2010) followed by the United Kingdom (17277) Italy (9785) and Spain (9122) The highest decreases in relative terms were recorded in Latvia (326 fewer persons acquired citizenship in 2011) and Bulgaria (312)
One indicator commonly used to measure the effect of national policies on citizenship is the lsquonaturalisation ratersquo or the ratio between the total number of citizenships granted and the stock of foreign residents in a country at the beginning of the year The country with the highest naturalisation rate in 2011 was Hungary (98 acquisitions per 100 foreign residents) followed
by Poland (67) and Sweden (58) while Malta Portugal and the United Kingdom all reported rates between 4 and 5 acquisitions per 100 foreign residents
Chart 23 Naturalisation rate 2011 (per 100 foreign residents)
Source Eurostat (online data code migr_acq and migr_pop1ctz)
About 867 of those who acquired citizenship of an EU-27 Member State in 2011 were
previously citizens of a non-EU country This was the case in nearly all of the Member States These new EU-27 citizens came mainly from Africa (262 of the total) Asia (226) non-
EU27 Europe (189) and North and South America (169) EU-27 citizens who acquired citizenship of another Member State amounted to 82 263 persons accounting for 105 of the
total In absolute terms the main groups of EU citizens acquiring citizenship of another EU Member State were Romanians becoming citizens of Hungary (15658 persons) and Italy (3921 persons) Poles becoming citizens of Germany (4344 persons) and Portuguese becoming citizens
of France (3805 persons)
Social Europe EU Employment and Social Situation I Quarterly Review
Special Supplement on Demographic Trends
March 2013 I 23
In Luxembourg and Hungary the majority of new citizenships granted were to citizens of another EU Member State In the case of Luxembourg Portuguese citizens accounted for the largest share while in the case of Hungary those acquiring citizenship were almost exclusively Romanians
As in previous years the largest groups of new citizens in the EU Member States in 2011 were citizens of Morocco (64200 corresponding to 82 of all citizenships granted) and Turkey (48800 or 62) Compared with 2010 the number of Moroccan citizens acquiring citizenship
of an EU Member State decreased by 44 while the figure for Turkish citizens fell by 20 The largest share of Moroccans acquired their new citizenship in France (326) Spain (224) and Italy (167) while the highest proportion of Turkish nationals acquired their new citizenship in Germany (575) and France (129)
Marriages and divorces
The number of marriages is decreasing and the number of divorces is increasing although the trend in marriages may be due in part to ageing of the population In addition more and more
children are being born to un-married women and the countries with the highest extramarital birth rates are often also those with the highest fertility rates
Marriage as recognised by the law in each country has long been considered to indicate family
formation However the analysis of trends in family formation and dissolution based on just marriage and divorce data might not offer a full picture Legal alternatives to marriage like registered partnership have become more widespread and national legislation has evolved to confer more rights on unmarried couples Alongside these new legal forms other forms of non-
marital relationships have appeared making it more difficult for statisticians to collect data that can be compared across countries
Due to differences in the timing and formal recognition of changing patterns of family formation
and dissolution these concepts have become more difficult to operationalise
Fewer marriages more divorces
22 million marriages took place in the EU-27 in 2010 and 10 million divorces occurred in the
EU-27 in 2009 according to the most recent available aggregated data These figures may be expressed as 44 marriages for every 1000 persons (ie the crude marriage rate) and 19 divorces for every 1000 persons (ie the crude divorce rate)
Since 1965 the crude marriage rate in the EU-27 has declined by some 43 in relative terms
(from 77 per 1000 persons in 1965 to 44 in 2010)
Chart 24 Crude marriage and divorce rates EU-27
Source Eurostat (online data codes demo_nind and demo_ndivind) Note The series of divorce rate in EU-27 is discontinued due to unavailability of data by Member States to be aggregated
At the same time marriages have become less stable in the EU-27 as indicated by the increase in the crude divorce rate from 08 per 1000 persons in 1965 to 21 in 2007 Part of this increase
is due to the fact that in several countries divorce was legalised during the period Over 2008 and 2009 however the annual number of divorces decreased slightly to 19 per 1000 persons in 2009
Table 13 shows that in 2011 the crude marriage rate among the EU-27 Member States was highest in Cyprus (73 per 1000 persons) Lithuania (63) and Malta (61) At the other end of
Social Europe EU Employment and Social Situation I Quarterly Review
Special Supplement on Demographic Trends
March 2013 I 24
the scale the lowest crude marriage rates were reported by Bulgaria (29 per 1000 persons) Slovenia (32) and Luxembourg (33)
Table 13 Crude marriage rate (marriages per 1000 persons)
Source Eurostat (online data code demo_nind) Note EU-27 excludes French overseas departments for 1960 to 1990 CY Up to and including 2000 data refer to total marriages contracted in the country including marriages between non-residents 2009-2011 data refer to marriages where at least one spouse was resident in the country
As regards divorce Ireland (07 per 1000 persons) and several southern European Member
States including Italy (09) Slovenia (11) and Greece (12) have significantly lower crude divorce rates than Latvia (40 per 1000 persons) Lithuania (34) and Belgium (29) Divorce
became legal in Malta in 2011 so the first data available in 2011 show only 01 divorces per 1000 persons
Table 14 Crude divorce rate (divorces per 1000 persons)
Source Eurostat (online data code demo_ndivind) Note EU-27 excludes French overseas departments for 1960 to 1990 Divorce was not possible by law in Italy until 1970 in Spain until 1981 in Ireland until 1995 and in Malta until 2011
A rise in births outside marriage
The proportion of births outside marriage in the EU-27 in 2011 was 395 It continues to
increase signalling new patterns of family formation alongside the more traditional pattern
where children are born within marriage Extramarital births occur in non-marital relationships among cohabiting couples and to lone parents
Social Europe EU Employment and Social Situation I Quarterly Review
Special Supplement on Demographic Trends
March 2013 I 25
Table 15 Live births outside marriage ( share of total live births)
Source Eurostat (online data code demo_find) Note EU-27 excludes French overseas departments for 1960 to 1990 and excludes Romania for 1990
Extra-marital births increased in almost every country in the EU-27 during 2011 with the exception of Ireland Malta and Sweden In six Member States the majority of live births are
now outside marriage Estonia (597) Slovenia (568) Bulgaria (561) France (558) Sweden (543) and Belgium (500) Mediterranean countries like Greece Croatia Cyprus Italy and Malta along with Poland Lithuania and Romania are at the other end of the scale
with a large proportion over 70 of births occurring within marriage
Chart 25 Proportion of live births outside marriage and total fertility rate 2011
Source Eurostat (online data code demo_find)
Countries with higher proportions of births outside marriage often have higher fertility rates In France Sweden Belgium Denmark the United Kingdom and Netherlands high rates of live births outside marriage (above 45 of total live births) are associated with total fertility rates
above the EU-27 average (157 live births per woman in 2011) (Chart 25)
Social Europe EU Employment and Social Situation I Quarterly Review
Special Supplement on Demographic Trends
March 2013 I 26
Population development and employment growth
A what-if analysis can be instructive and tell how far employment growth can be sustained under current demographic trends The analysis below is based on the 2010 Eurostat demographic projections The scenarios are exclusively on the supply side and do not take into
account projections of labour demand
Europe 2020 targets promote lower school drop-out rates higher rates of tertiary education and higher employment In the past school drop-out rates have been decreasing though not as fast
as targeted earlier tertiary education has been increasing steadily employment grew until 2008 then decreased especially for young adults and migrants
In 2010 14 of EU residents aged 18-24 were not in education or training and did not have an upper secondary school diploma They are called lsquoearly leaversrsquo and the aim is to bring this
figure down to 10 by 2020 Even though more young adults complete secondary education and more are motivated to continue with education or training if current trends continue the outcome is likely to fall short of the objective
On the other hand the education levels of todayrsquos 20-24 year-olds is higher than it was 10 years ago As a result at current growth rates in 2020 40 of 30-34 year-olds are likely to have a tertiary degree thereby achieving the tertiary education target
Scenarios for the EU-27
The estimates in the text above and those in Chart 26 and Table 16 are based on Eurostatrsquos Population projections (Europop 2010) and annual Labour Force Survey employment and
education attainment rates as well as assumptions based on the Europe 2020 targets on education and employment
Chart 26 Population by sex age group an employment EU-27 2010 and 2030 (million)
2010 age 2030
90
80
70
60
50
40
30
20
10
0
Source Eurostat (online data codes proj_10c lfsa_ergan lfsa_ergaed lfsa_pgaed) and DG EMPL computations
In Chart 26 the 2030 employment counts were computed by assuming that employment rates remain constant across ages sex origin and education level whereas educational attainment rates follow observed trends This means that the education levels of each 5-year cohort (for instance those aged 20-24 in 2010) will change over time according to changes observed in the
period 2006-2011 as a result during the following five projection years some of its ISCED7 0-2 people will graduate to ISCED 3-4 and some of its (and newly graduated) ISCED 3-4 will graduate to ISCED 5-6 These graduation rates are assumed to depend on age and to remain
constant in the future
Education trends consist of two components The first is the educational level of young adults (aged 15-19) The ISCED 3-4 attainment of this group has been increasing and this trend is
assumed to continue tapering to a maximum of 25 in the long run Transitions between
7 International Standard Classification of Education see httpwwwuisunescoorgEducationPagesinternational-standard-classification-of-educationaspx
20 10 10 20 20 10 10 20
Social Europe EU Employment and Social Situation I Quarterly Review
Special Supplement on Demographic Trends
March 2013 I 27
education levels at successive ages are assumed to be constant It must be considered that as education levels continue rising they continue to raise employment rates In present scenarios as better-educated cohorts replace less-well educated ones the global employment rate rises and so does overall employment
The observed overall increase so far is largely the net effect of composition change where the positive impact of the increase in educational attainment more than offsets the negative impact of our active-age population becoming increasingly older or of migrant origin (non-EU-27)
Under these assumptions Chart 26 shows total employment declining by 5 million that is 25 from 2010 to 2030 the employment rate of those aged 20-64 in 2020 would be 685 a slight increase and far below the Europe 2020 target The reason for this change would be the rise in education levels mitigated by an ageing population and a growing proportion of
migrants Economic dependency8 would rise from 132 in 2010 to 147 in 2030 In Table 16 this is the lsquotrend education with constant employment ratesrsquo scenario
The Social Investment Package9 calls for measures that increase labour participation
employability and productivity It is important to analyse the feasibility and consequences of raising education levels and labour participation to assess the suitability of the measures envisaged
For instance focusing on opportunities for disadvantaged workers may bring in more people with lower skills and the changing skills composition would affect productivity10 In addition it pays to understand the impact of current population trends in education
Table 16 summarises employment in 2020 and 2030 under several scenarios Its purpose is to
analyse the difficulty and impact in 2030 of reaching the Europe 2020 employment objectives
The first scenario includes demographic change but no rise in educational attainment It is purely mechanical and its only purpose is to assess the impact of skills renewal due to cohort
turnover as older less-well-educated worker cohorts leave the labour market younger better-educated cohorts join it Although skills renewal is now slower than it was in the past 2-3 decades because of demographic changes the impact remains high
The second scenario allows for education to continue progressing as it did in the past thereby shifting overall employment Without an effort to attain the Europe 2020 employment objectives the EU-27 workforce will become older but also better educated As a result employment will be stable until 2020 but will decrease by 2-3 by 2030 feeling the impact of
demographics The declining population of working age will increasingly consist of older workers
The third scenario assumes that the Europe 2020 targets on education will be attained and the
trend towards a better-educated work force will continue after 2020 Here we should underline that
under the assumption that current education transitions continue the tertiary education
target would also be attained
Europe 2020 education targets will have a small impact on employment in 2030 This is because the targeted increase in tertiary attainment and the reduction in early leavers will affect only the very young cohorts of workers so that the effect will not materialise
by 2030 however the impact will be far larger after 2030
The fourth scenario assumes that in addition to the Europe 2020 target for education the target on employment will also be attained As regards those aged 65 and above this scenario
envisages the same rates of increase for employment as for people aged 55-64 Employment rate increases from 2010 to 2020 then assumed go on till 2030
But attaining the Europe 2020 employment target would require tapping into a potential labour
force consisting largely of older people and so-far inactive migrants These cohorts tend to be less educated than the rest of the labour force This means that not only will activating them be
harder but also that they will contribute to the less-skilled workforce whereas there is strong
8 Economic dependency is the ratio between the number of people not in employment and those who are 9 See COM(2013) 83 10 See Employment and Social Developments in Europe Chapter 4 p 279
Social Europe EU Employment and Social Situation I Quarterly Review
Special Supplement on Demographic Trends
March 2013 I 28
evidence suggesting that demand in future decades will concentrate on high-skilled rather than low-skilled workers11
Table 16 Work force scenarios under Europe 2020 assumptions EU-27 2020 and 2030
Source Eurostat (online data codes proj_10c lfsa_ergan lfsa_ergaed lfsa_pgaed) and DG EMPL computations Note (1) only EU citizens
Employment gains among women and young people who tend to be better educated may be easier to achieve and yield higher productivity gains however they alone will not mean the Europe 2020 employment target is met Up skilling via continuing education and training is
another way to motivate and nurture a productive workforce12
Differences among Member States
Population developments in the various Member States differ as the rate of ageing varies and
these find themselves in different phases For instance eastern States have relatively young and slowly-ageing populations now but face the prospect of very rapid ageing from 2025 onwards13 In addition some Member States already make better use of their potential work
forces with higher education and employment rates than others
In the past two decades employment and productivity growth fuelled economic growth in roughly equal measure The observed pre-crisis 1 employment growth ended in 2008 When
the crisis abates employment can resume growth but this will be limited in future
Demographic ageing and workforce decline will create bottlenecks to the available labour force in the medium term even though at present countries still have un-deployed human resources which could potentially yield further employment growth
Chart 27 outlines the Member Statesrsquo different potentials for continuing employment growth Assuming that the EUrsquos economic and social system will need 1 employment growth Member States differ as to when such a lsquosustainablersquo growth path will have to come to an end simply
because human resources become scarce
Two scenarios are presented14
Under the first scenario there will be no further progress in activation its growth-end
year is the upper end of the blue bar in Chart 27
Under the second scenario each country exploits the maximum activation potential of women older people and educational progress its growth-end year is the upper end of the yellow bar in Chart 27 Four Member States can continue growing beyond 2040
11 See for instance httpwwwcedefopeuropaeuENpublications20633aspx
12 Source httpeceuropaeusocialmainjsplangId=enampcatId=113ampnewsId=1774ampfurtherNews=yes chapter 69 13 See the 2010 Demography Report (chapter I5)
14 See draft paper of C Fotakis J Peschner (2013) lsquo Growth potential of EU human resources and policy implications for future economic growthrsquo not yet published
Social Europe EU Employment and Social Situation I Quarterly Review
Special Supplement on Demographic Trends
March 2013 I 29
The Member States with the longer bars whose maximum potential for growth reaches further into the future are of two types Some have strong population growth and slow ageing such as Ireland others have large unused capacity to tap by increasing participation in (education and) labour
More critically the EU-27 is projected to have a large shortfall of well-educated (ISCED 5-6) workers Although their number will grow by virtue of rising education levels in the population this projected growth is slower than the increase in demand
Chart 27 Year in which a continued 1 employment growth from 2011 is projected to stop by
country
Source FotakisPeschner (2013)6 based on Eurostat LFS
In addition the untapped potential consists mainly of less-well educated people for two
reasons First the better educated are already well involved in the labour market Secondly the most promising sources of additional labour ie older people and migrants tend to be less well educated than prime-age EU nationals
Thus as regards high-skilled workers the time-window for growth is more limited Even the best activation policies can only palliate and delay the onset of shortages for just a few years
Social Europe EU Employment and Social Situation I Quarterly Review
Special Supplement on Demographic Trends
March 2013 I 30
European Commission
EU Employment and Social Situation Quarterly Review March 2013 ndash Special
Supplement on Demographic Trends
Luxembourg Publications Office of the European Union
2013 mdash 30 pp mdash 21 times 297 cm
ISBN 978-92-79-29383-2
ISSN 1977-8317 doi 10276741278
This publication is available in electronic format in English
KE-BH-13-0S2-EN-N
- Table of Contents
- Introduction
- Population change and age structure
- Fertility
- Mortality
- Migration and migrant population
- Marriages and divorces
- Population development and employment growth
-
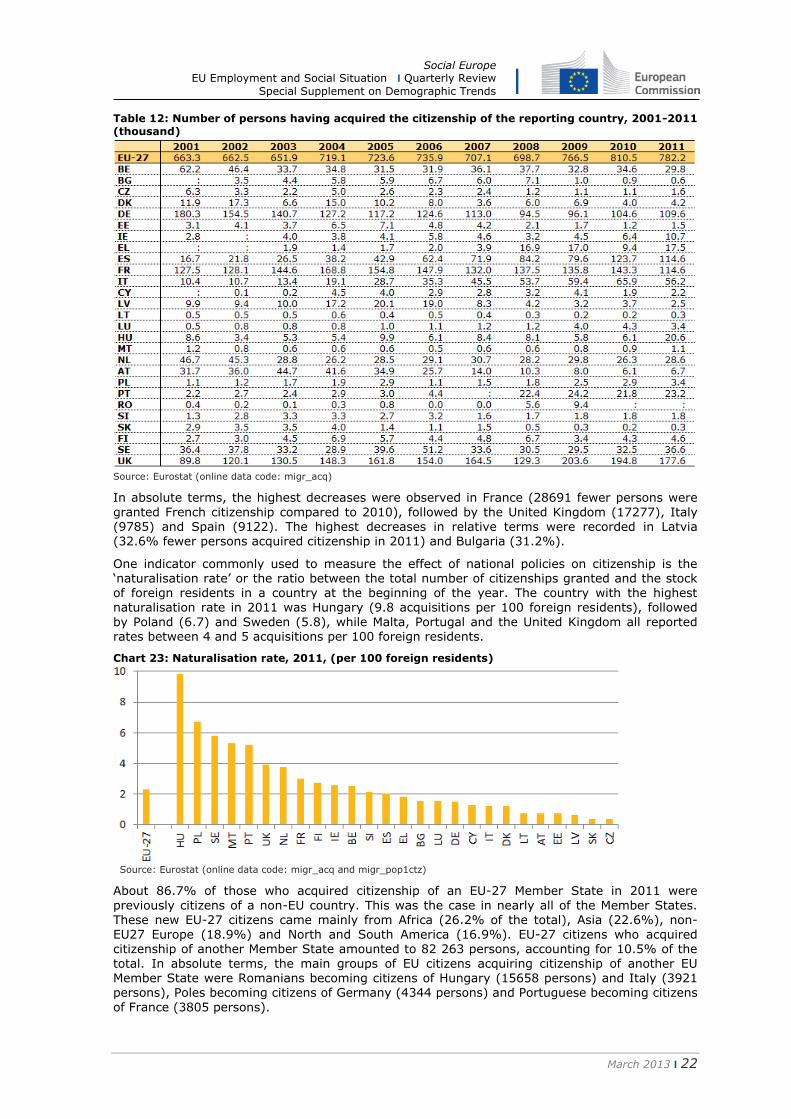
Social Europe EU Employment and Social Situation I Quarterly Review
Special Supplement on Demographic Trends
March 2013 I 30
European Commission
EU Employment and Social Situation Quarterly Review March 2013 ndash Special
Supplement on Demographic Trends
Luxembourg Publications Office of the European Union
2013 mdash 30 pp mdash 21 times 297 cm
ISBN 978-92-79-29383-2
ISSN 1977-8317 doi 10276741278
This publication is available in electronic format in English
KE-BH-13-0S2-EN-N
- Table of Contents
- Introduction
- Population change and age structure
- Fertility
- Mortality
- Migration and migrant population
- Marriages and divorces
- Population development and employment growth
-