map parent presentation
TRANSCRIPT

Universal American School Dubai
MAP Presentation
November 2015Presenter: Amanda DeCardy
MAP Measures of Academic Progress™
Administer twice a year to measure growthAdaptive testReadingLanguage Usage MathematicsSciencePlaces students on an equal interval scale to help teachers and administrators target student learningResults available immediately to teachers
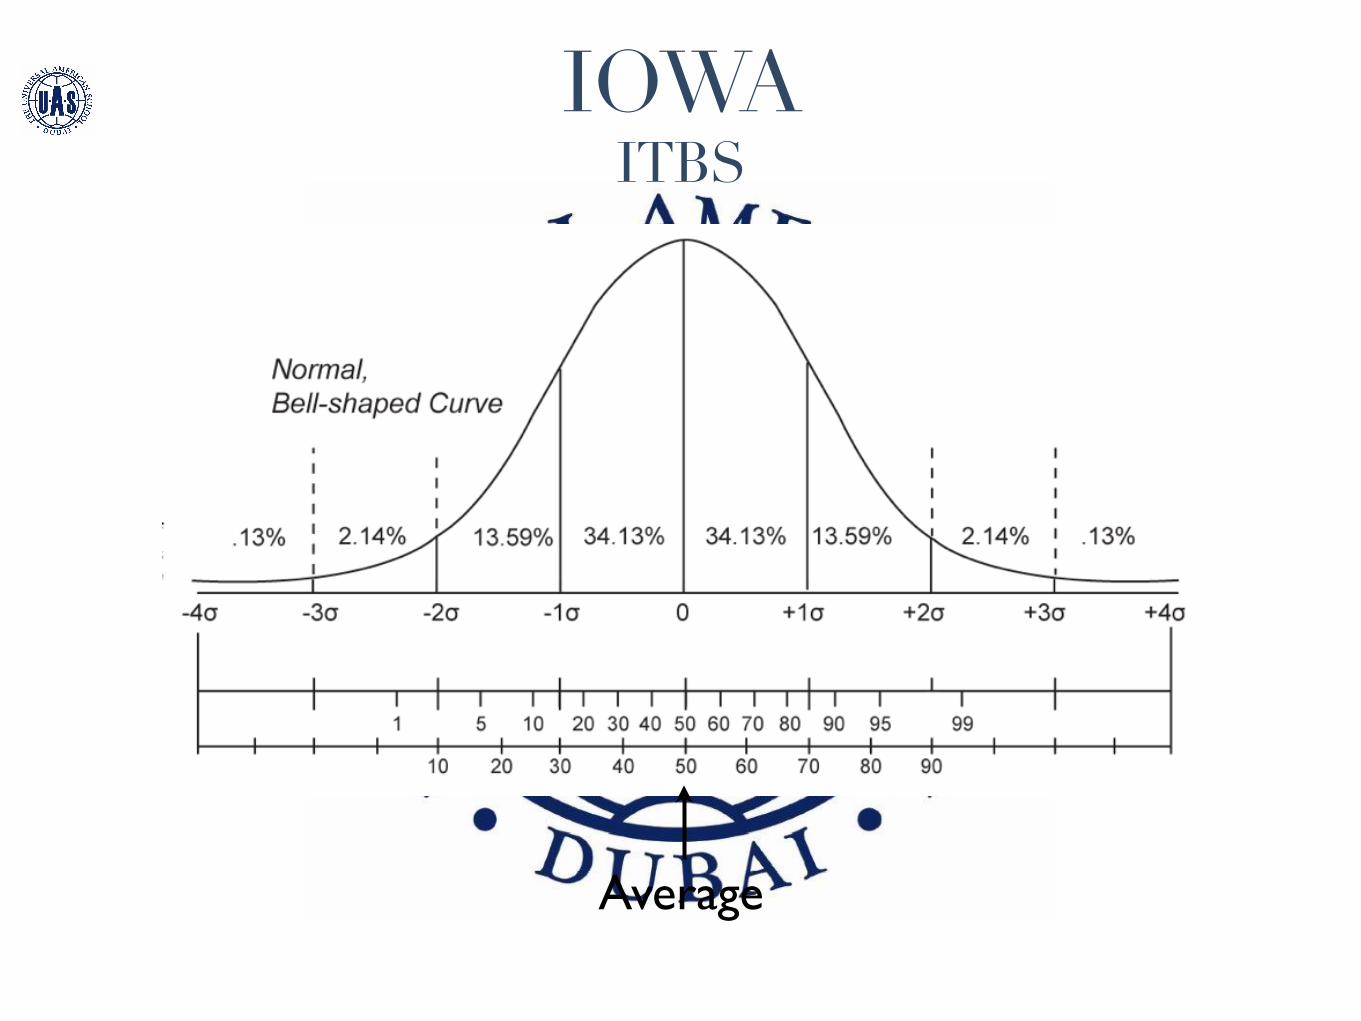
IOWA ITBS
Average
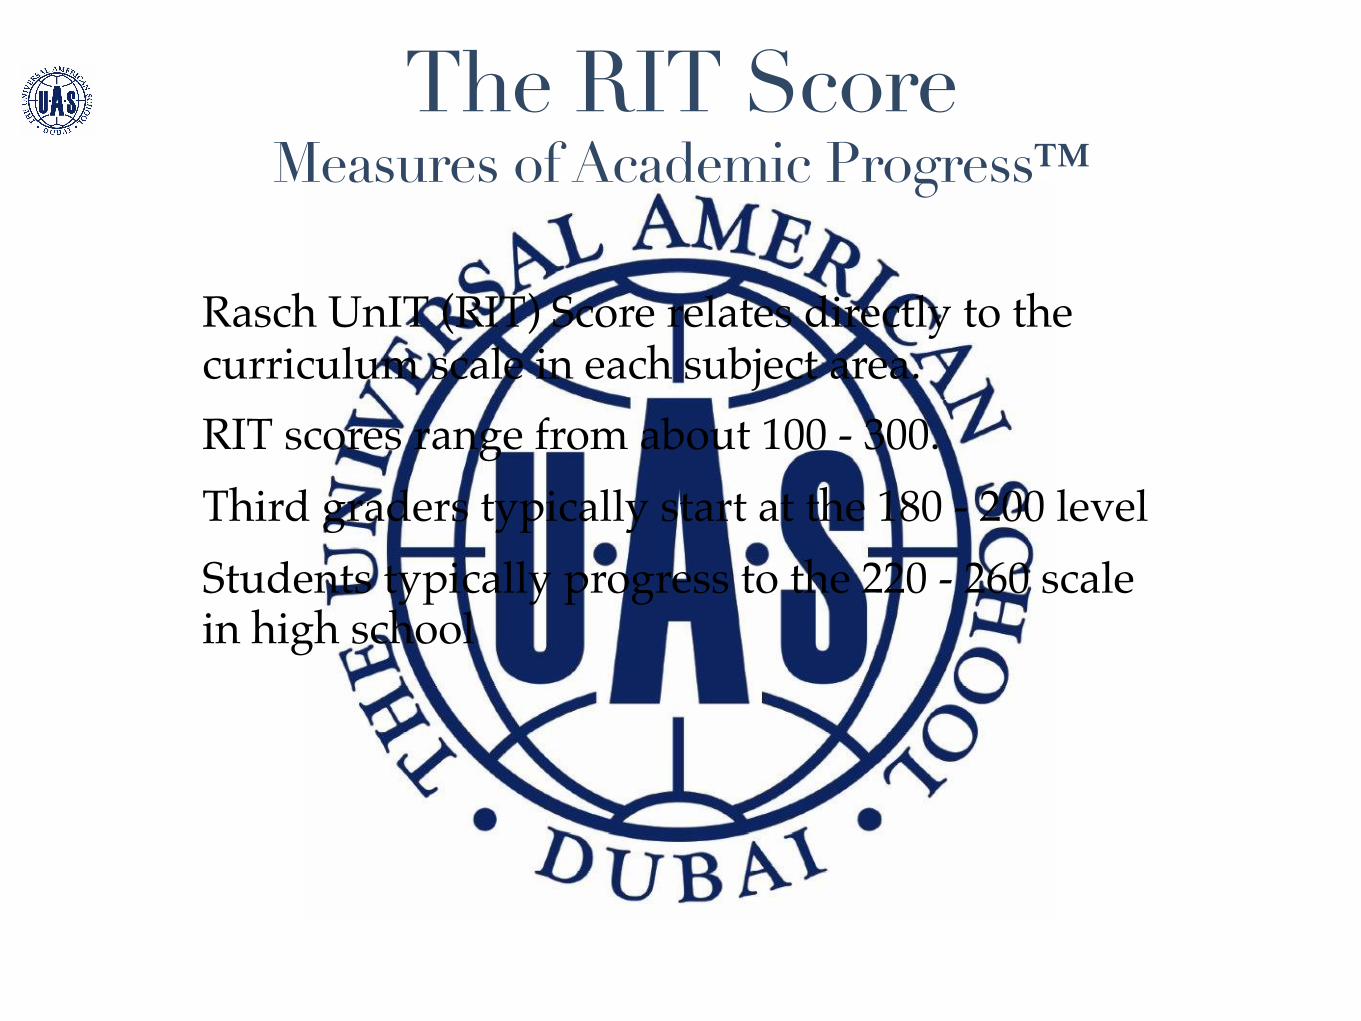
The RIT Score Measures of Academic Progress™
Rasch UnIT (RIT) Score relates directly to the curriculum scale in each subject area.RIT scores range from about 100 - 300. Third graders typically start at the 180 - 200 levelStudents typically progress to the 220 - 260 scale in high school
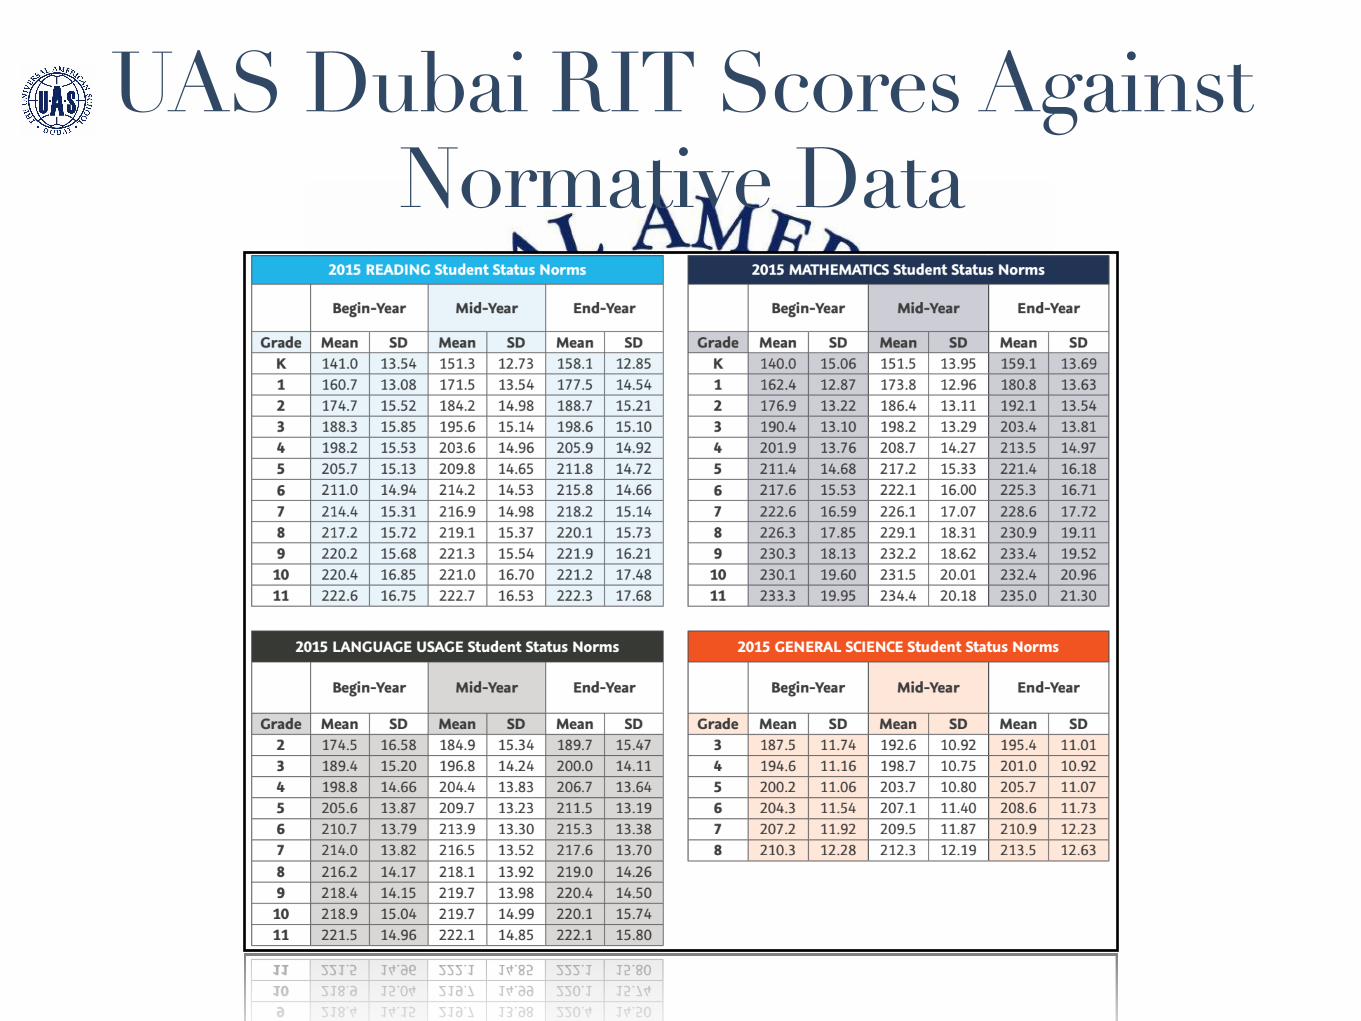
UAS Dubai RIT Scores Against Normative Data
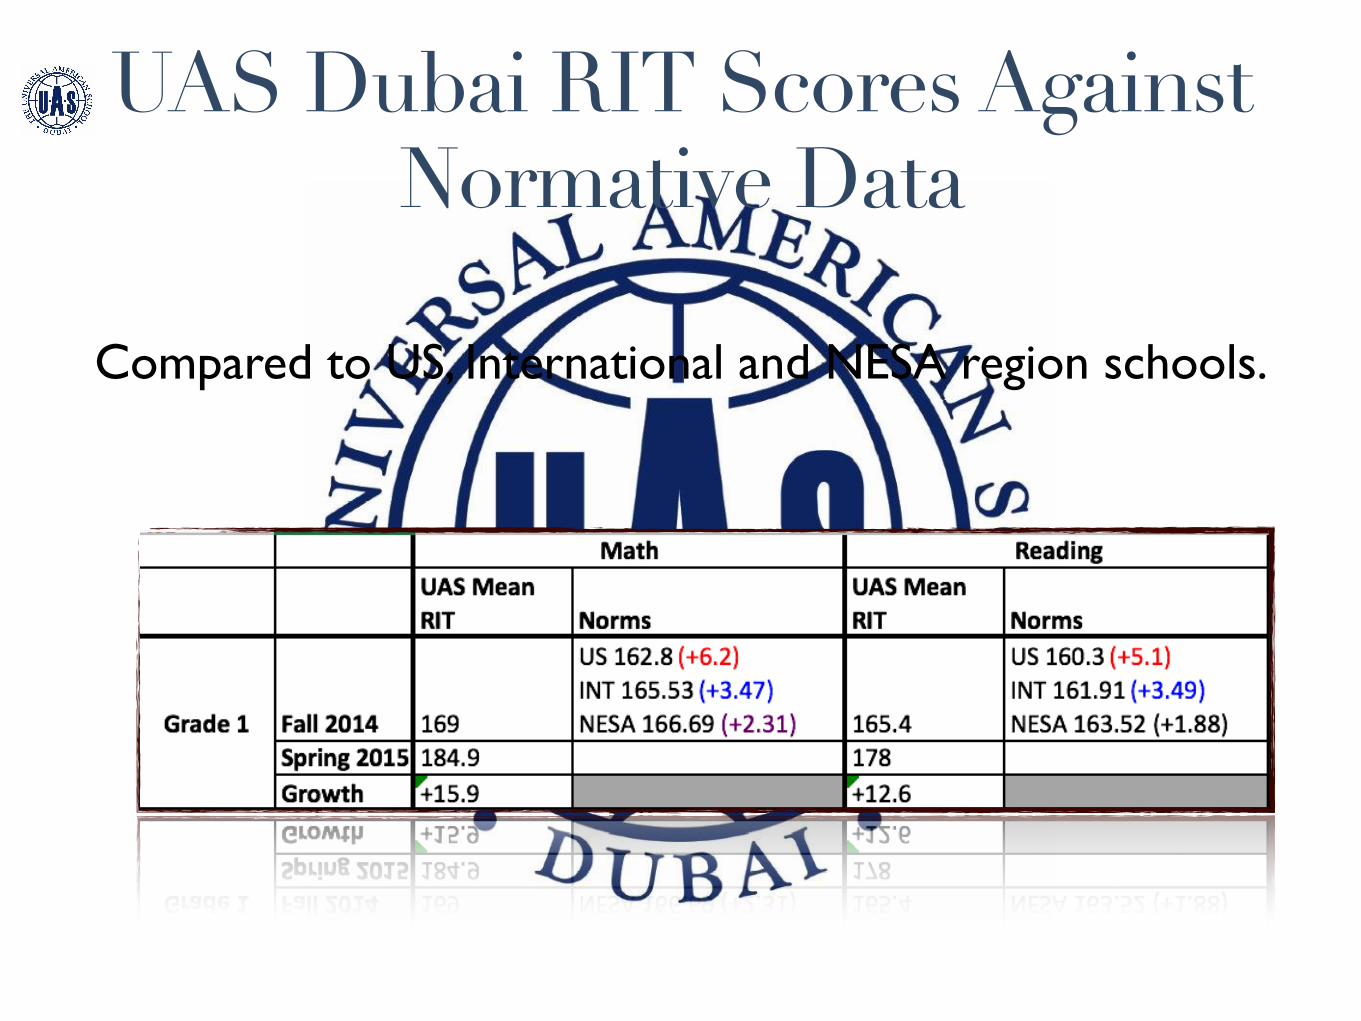
UAS Dubai RIT Scores Against Normative Data
Compared to US, International and NESA region schools.
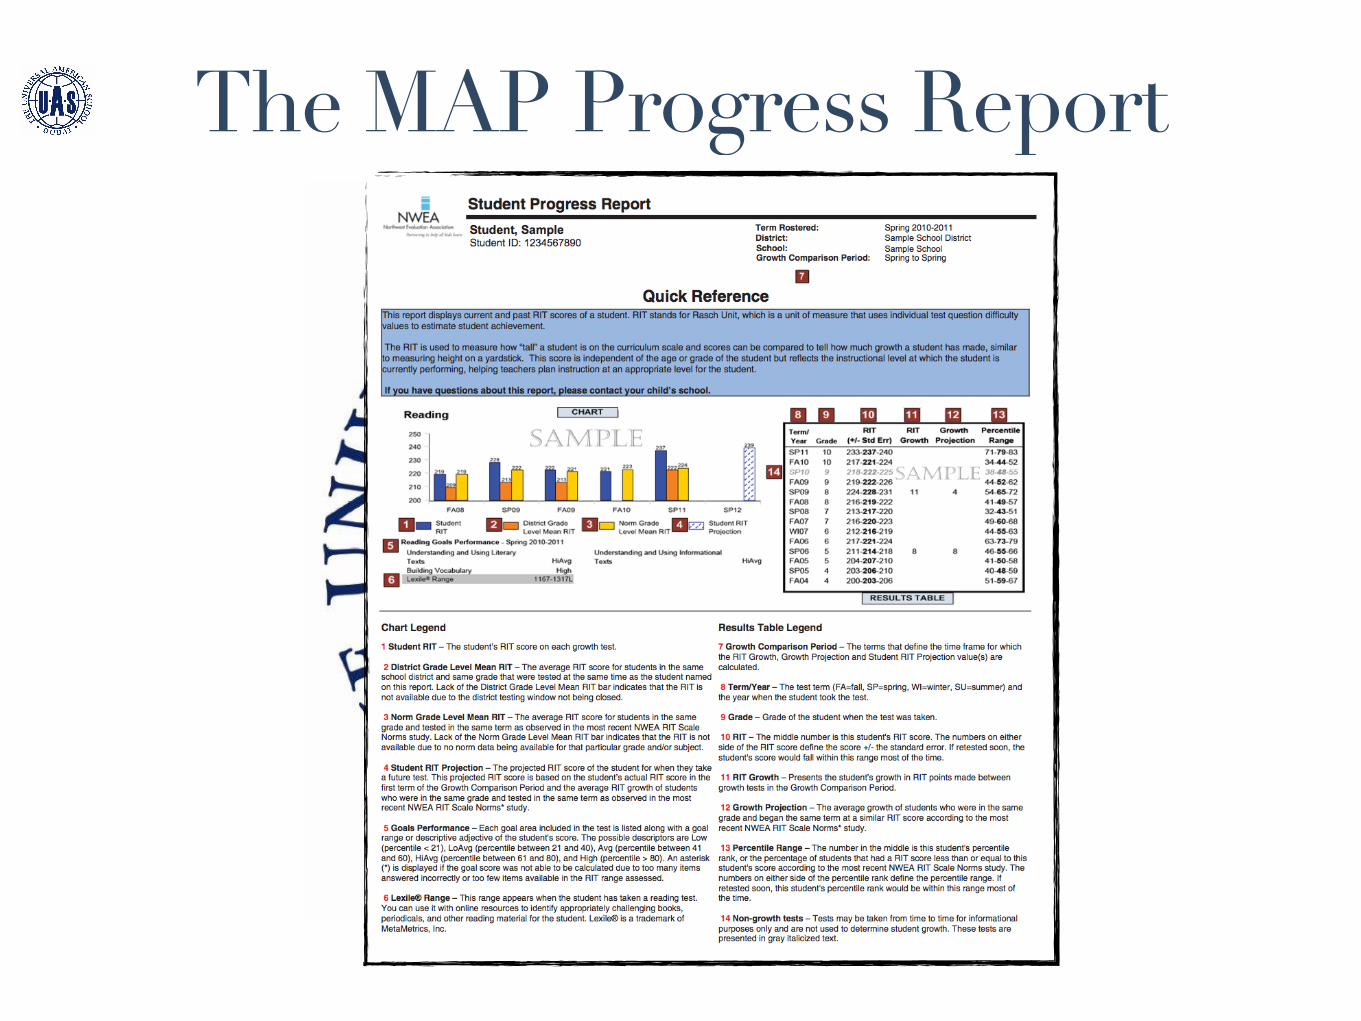
The MAP Progress Report

The MAP Progress Report Student RIT – The student’s RIT score on each growth test.
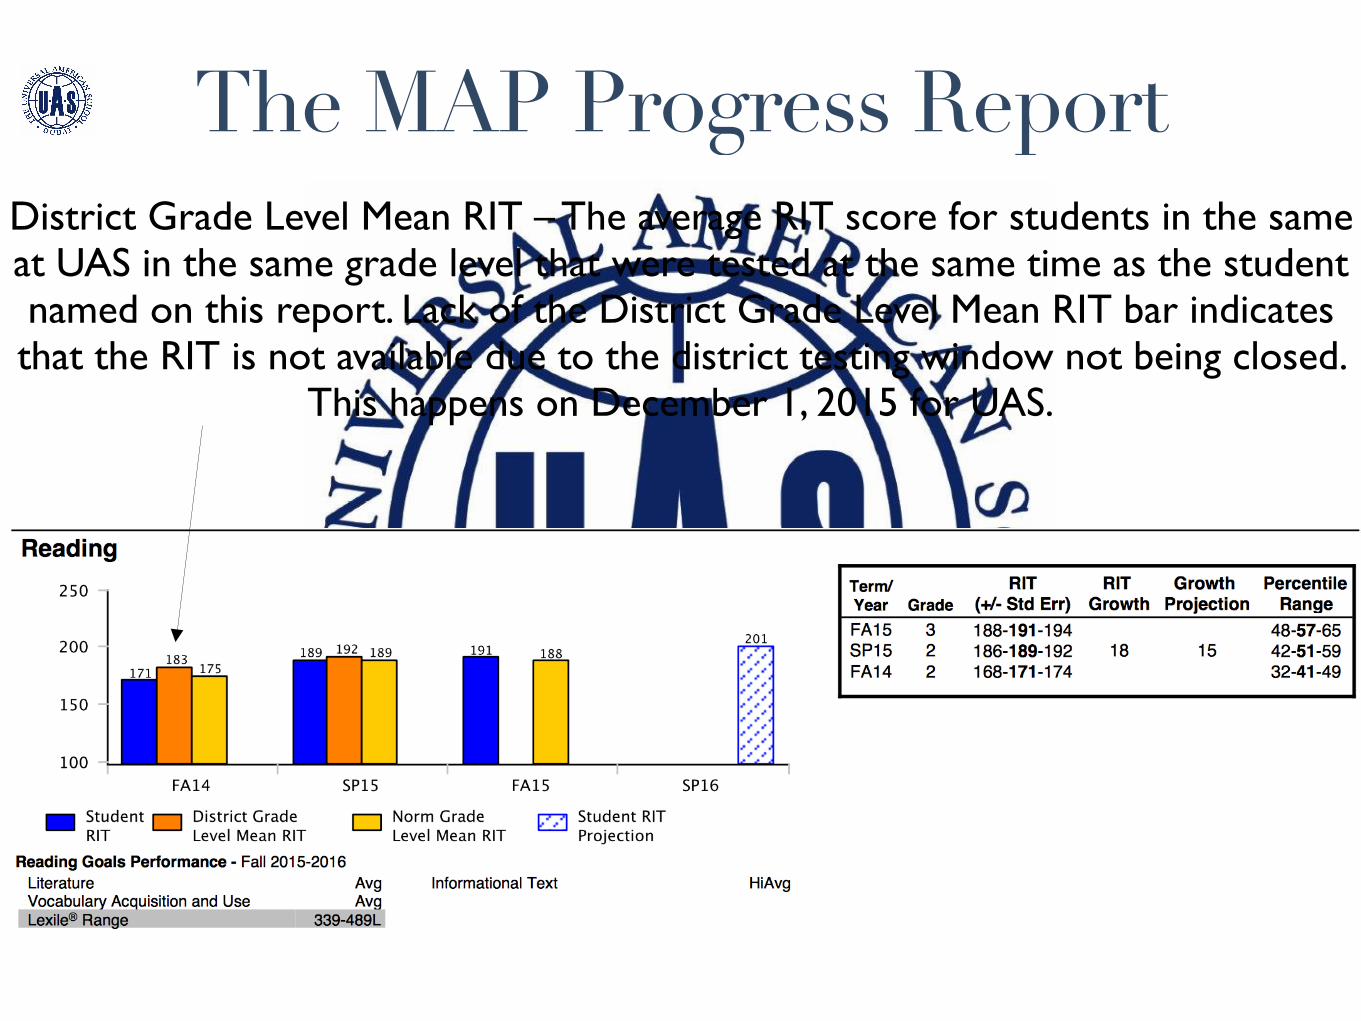
The MAP Progress Report District Grade Level Mean RIT – The average RIT score for students in the same at UAS in the same grade level that were tested at the same time as the student named on this report. Lack of the District Grade Level Mean RIT bar indicates that the RIT is not available due to the district testing window not being closed.
This happens on December 1, 2015 for UAS.
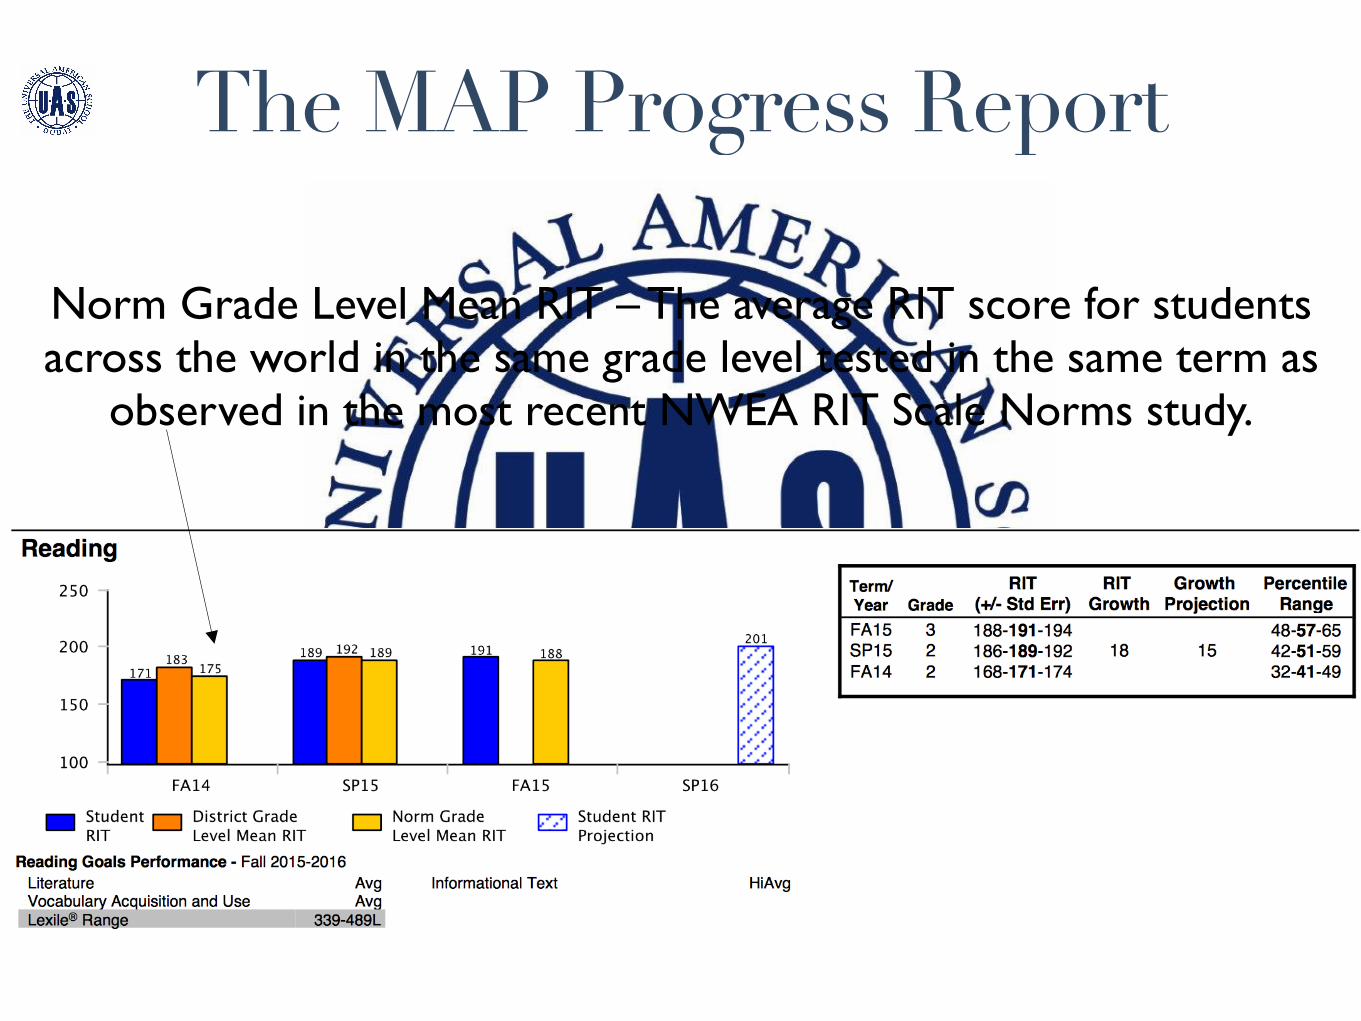
The MAP Progress Report
Norm Grade Level Mean RIT – The average RIT score for students across the world in the same grade level tested in the same term as
observed in the most recent NWEA RIT Scale Norms study.
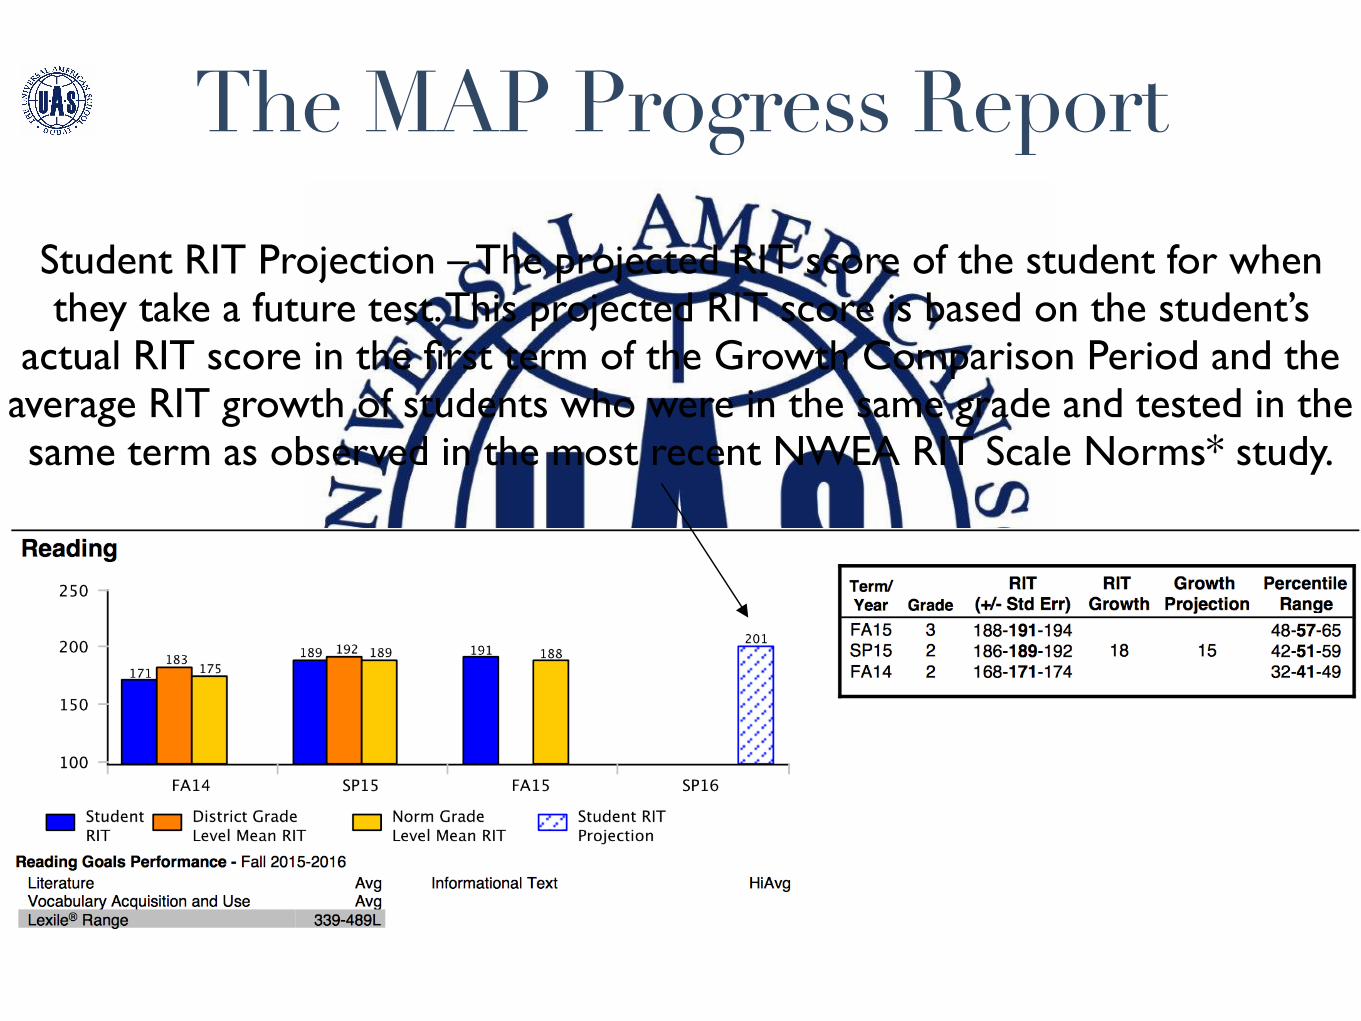
The MAP Progress Report Student RIT Projection – The projected RIT score of the student for when they take a future test. This projected RIT score is based on the student’s
actual RIT score in the first term of the Growth Comparison Period and the average RIT growth of students who were in the same grade and tested in the same term as observed in the most recent NWEA RIT Scale Norms* study.
The MAP Progress Report
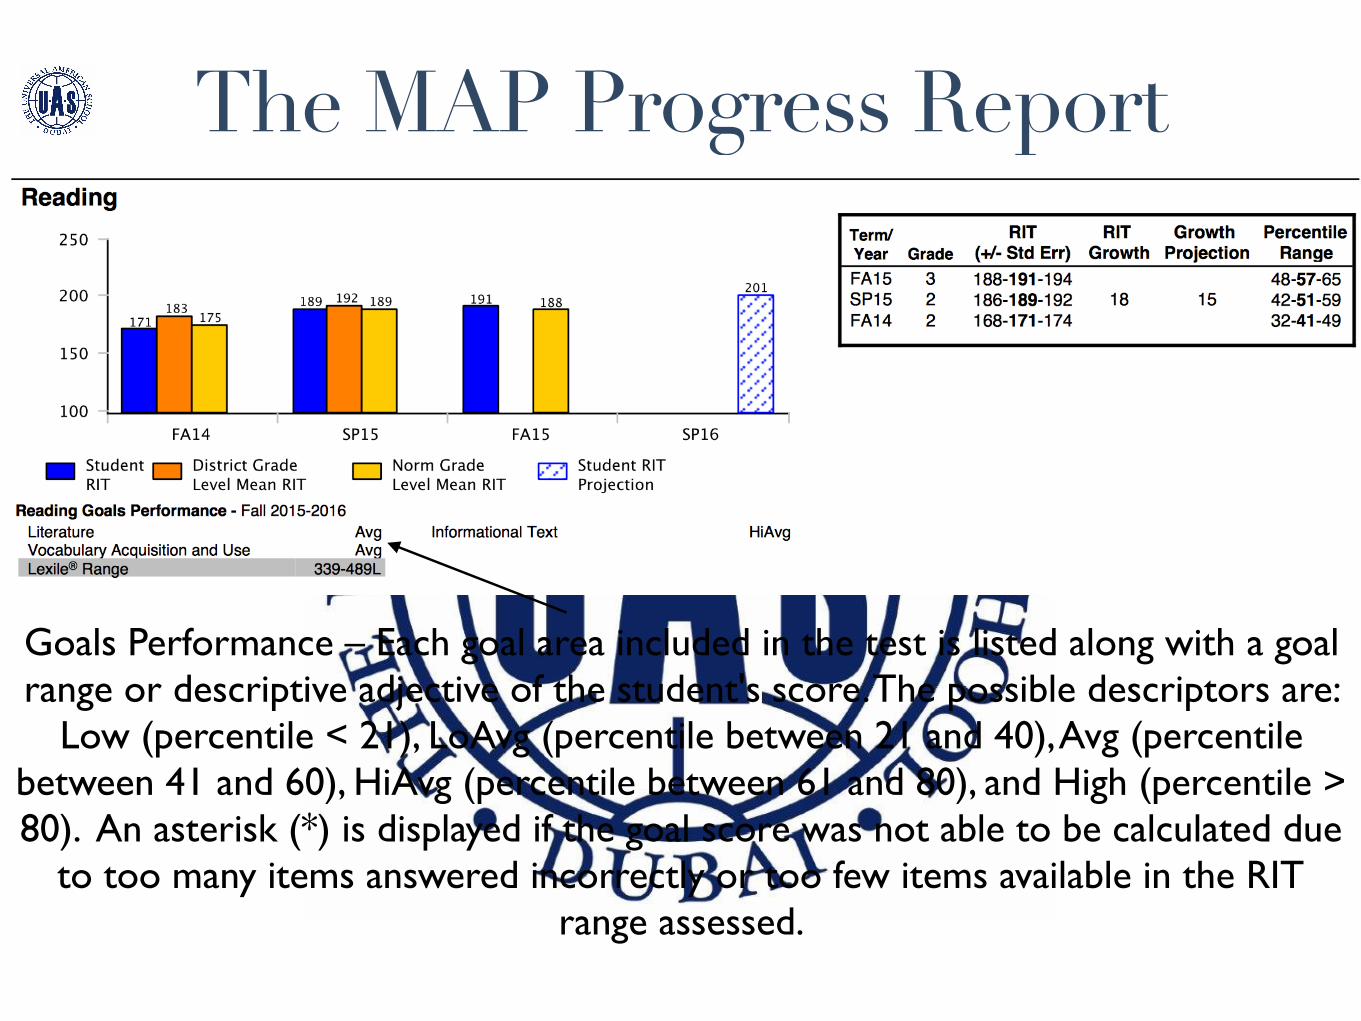
Goals Performance – Each goal area included in the test is listed along with a goal range or descriptive adjective of the student's score. The possible descriptors are:
Low (percentile < 21), LoAvg (percentile between 21 and 40), Avg (percentile between 41 and 60), HiAvg (percentile between 61 and 80), and High (percentile > 80). An asterisk (*) is displayed if the goal score was not able to be calculated due
to too many items answered incorrectly or too few items available in the RIT range assessed.
The MAP Progress Report
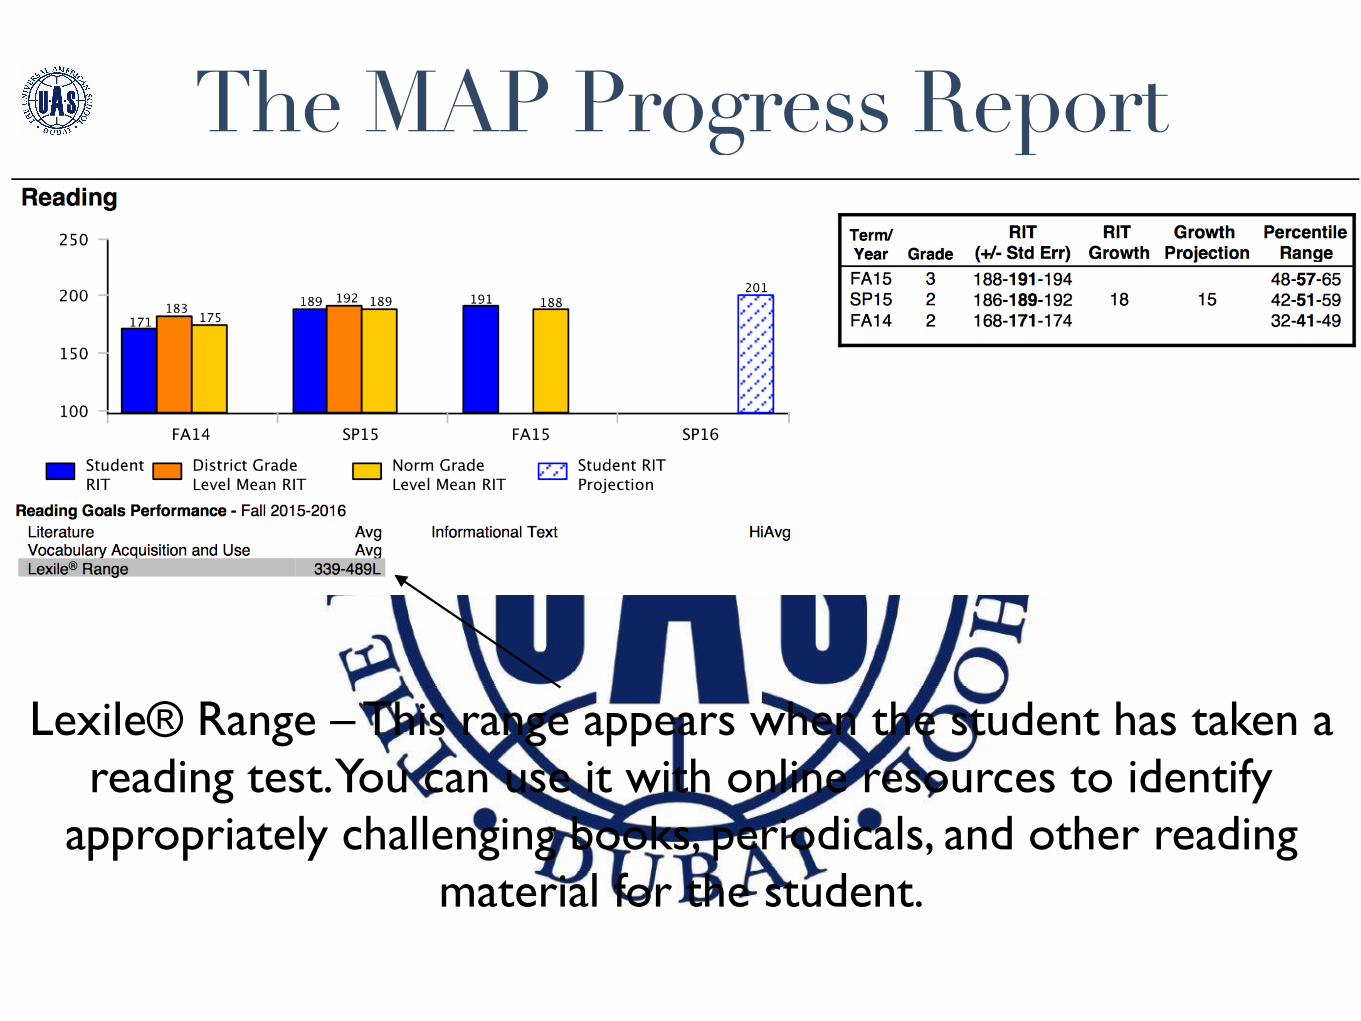
Lexile® Range – This range appears when the student has taken a reading test. You can use it with online resources to identify
appropriately challenging books, periodicals, and other reading material for the student.
The MAP Progress Report
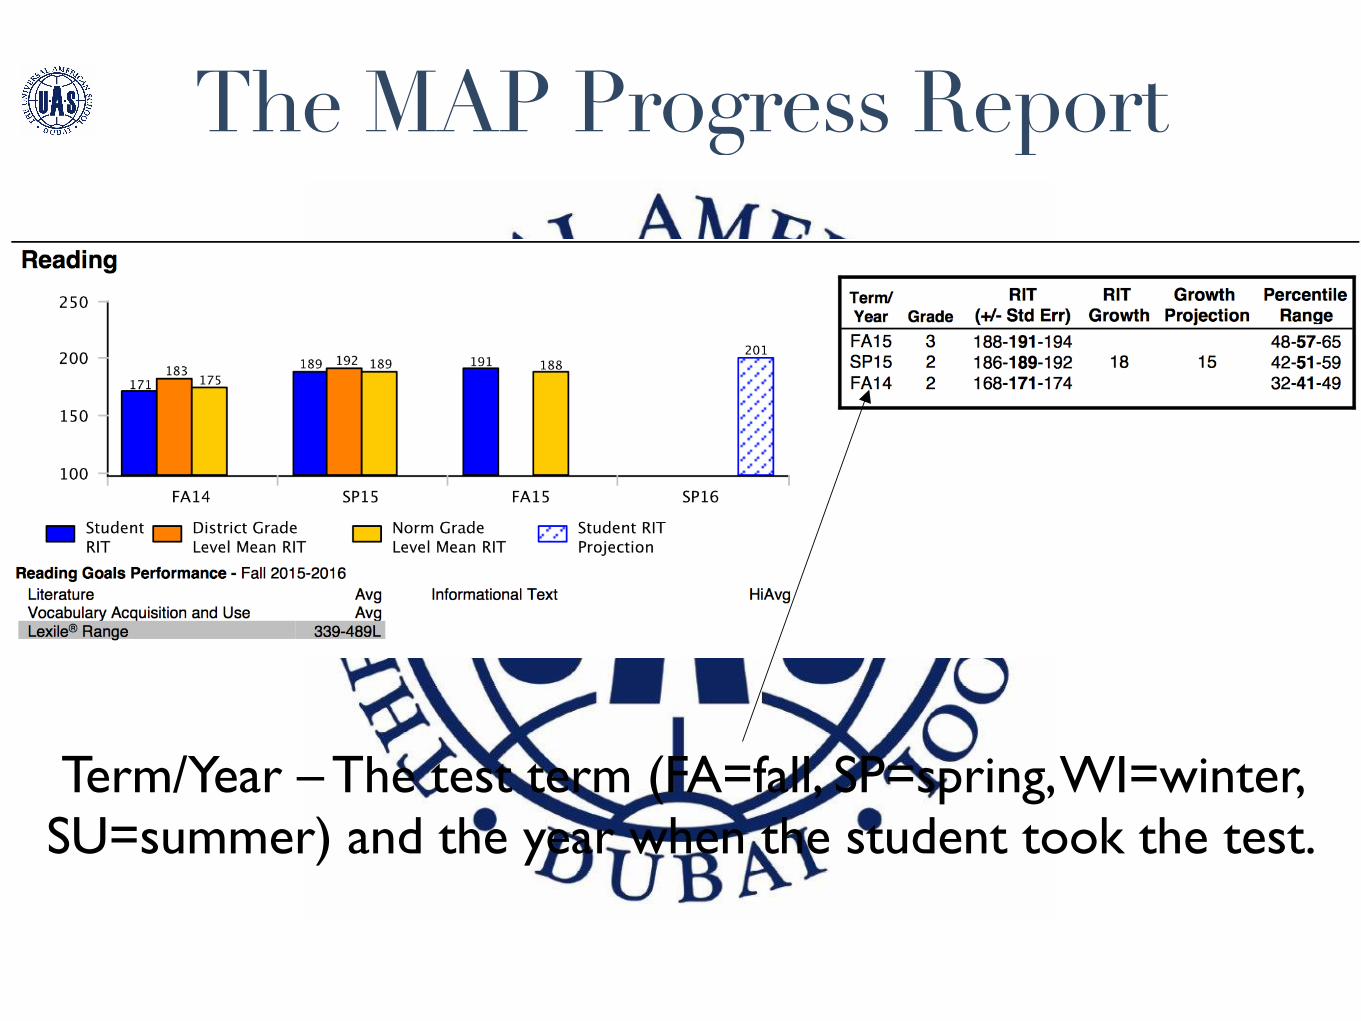
Term/Year – The test term (FA=fall, SP=spring, WI=winter, SU=summer) and the year when the student took the test.
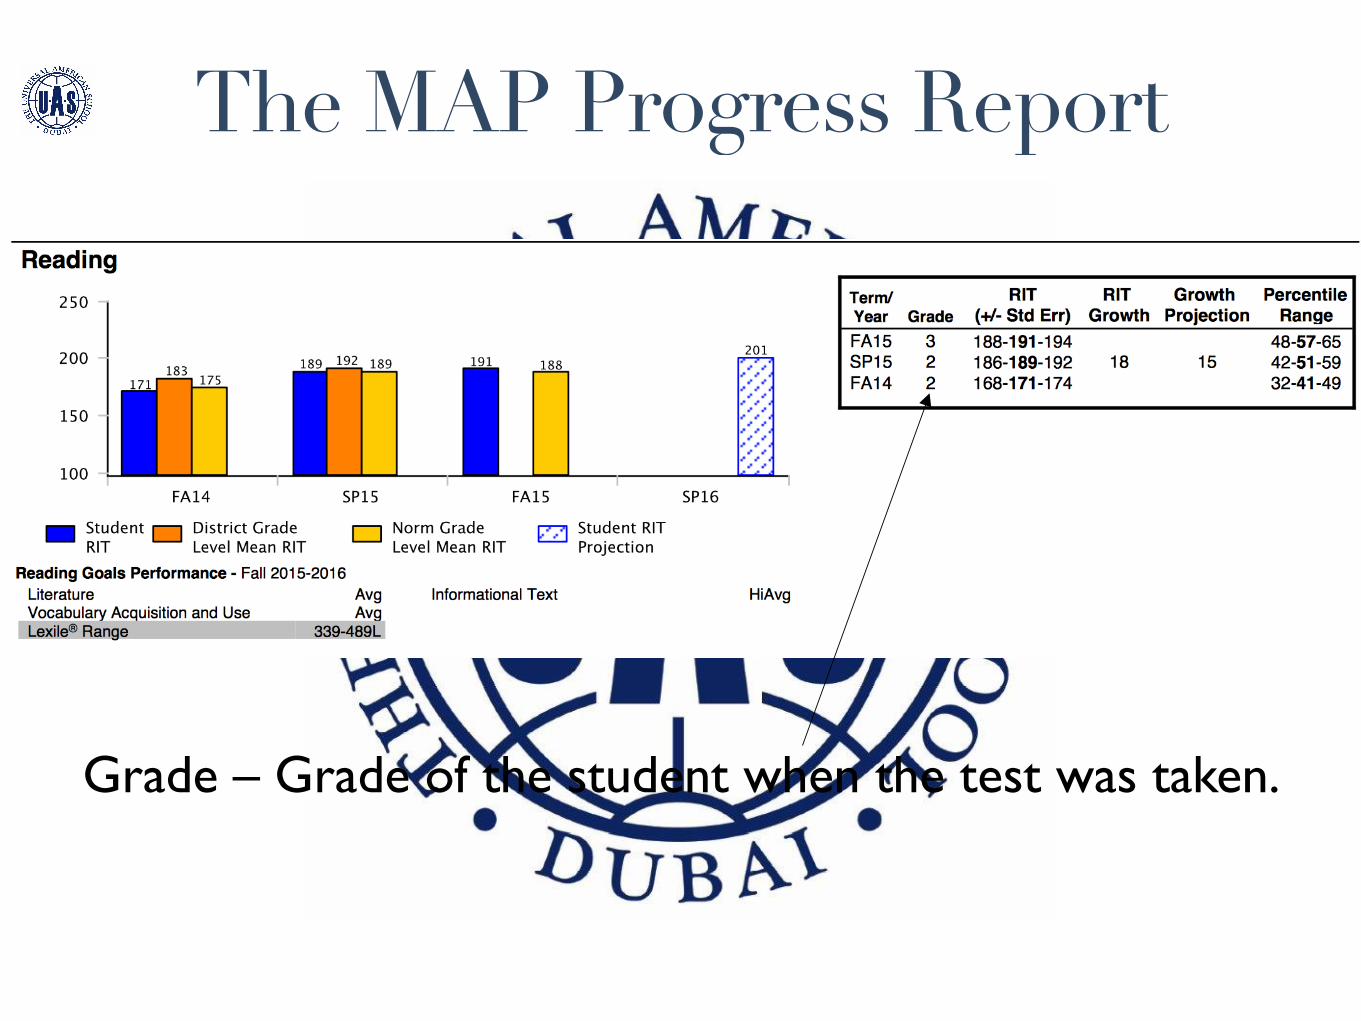
The MAP Progress Report
Grade – Grade of the student when the test was taken.
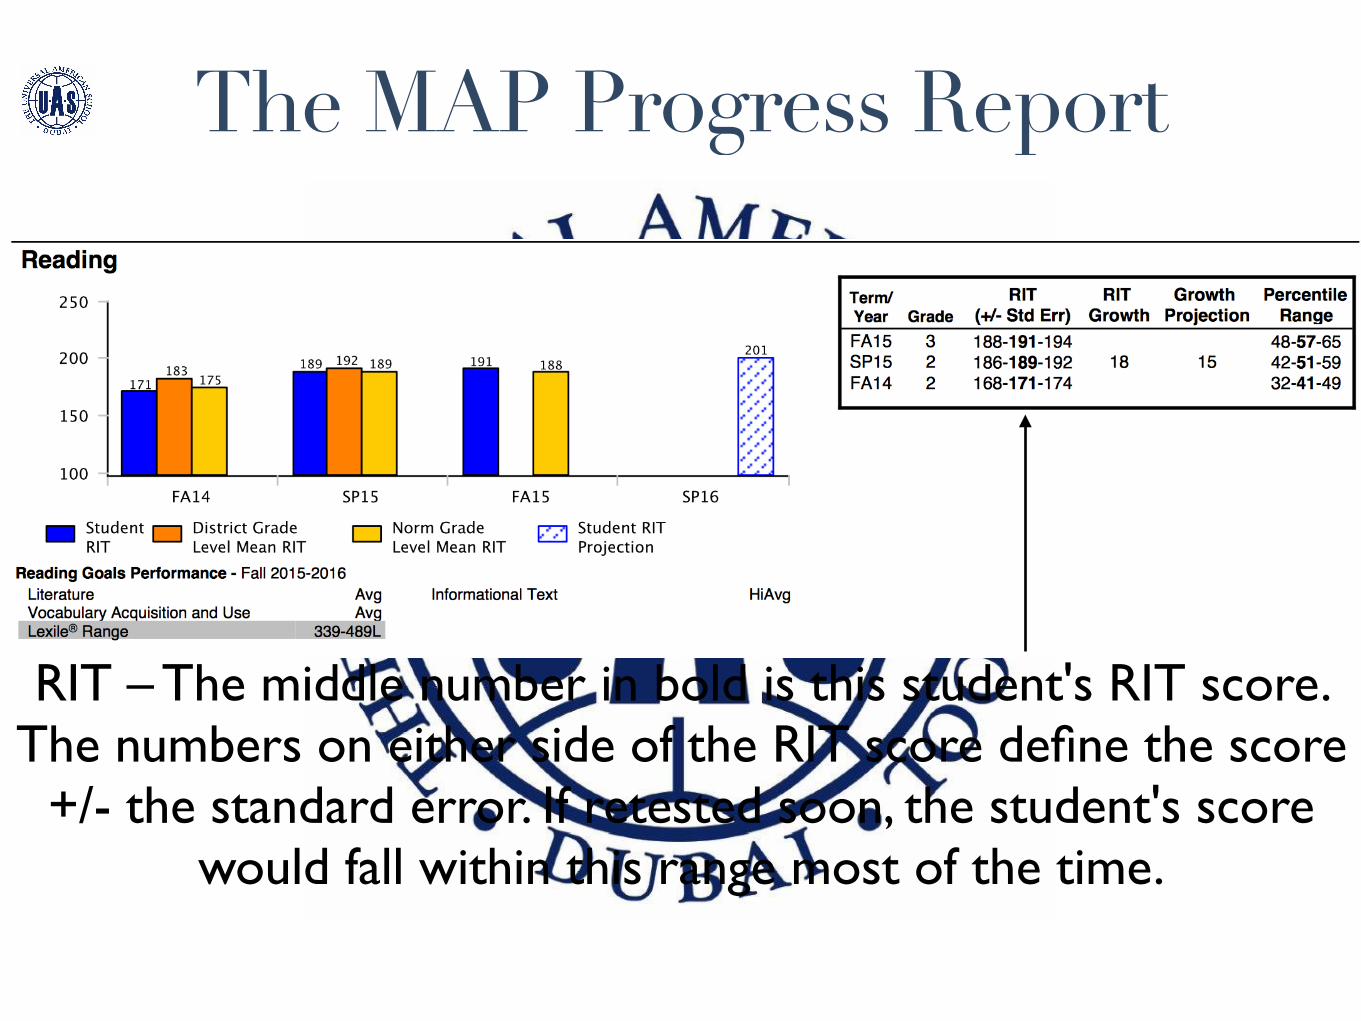
The MAP Progress Report
RIT – The middle number in bold is this student's RIT score. The numbers on either side of the RIT score define the score
+/- the standard error. If retested soon, the student's score would fall within this range most of the time.
The MAP Progress Report
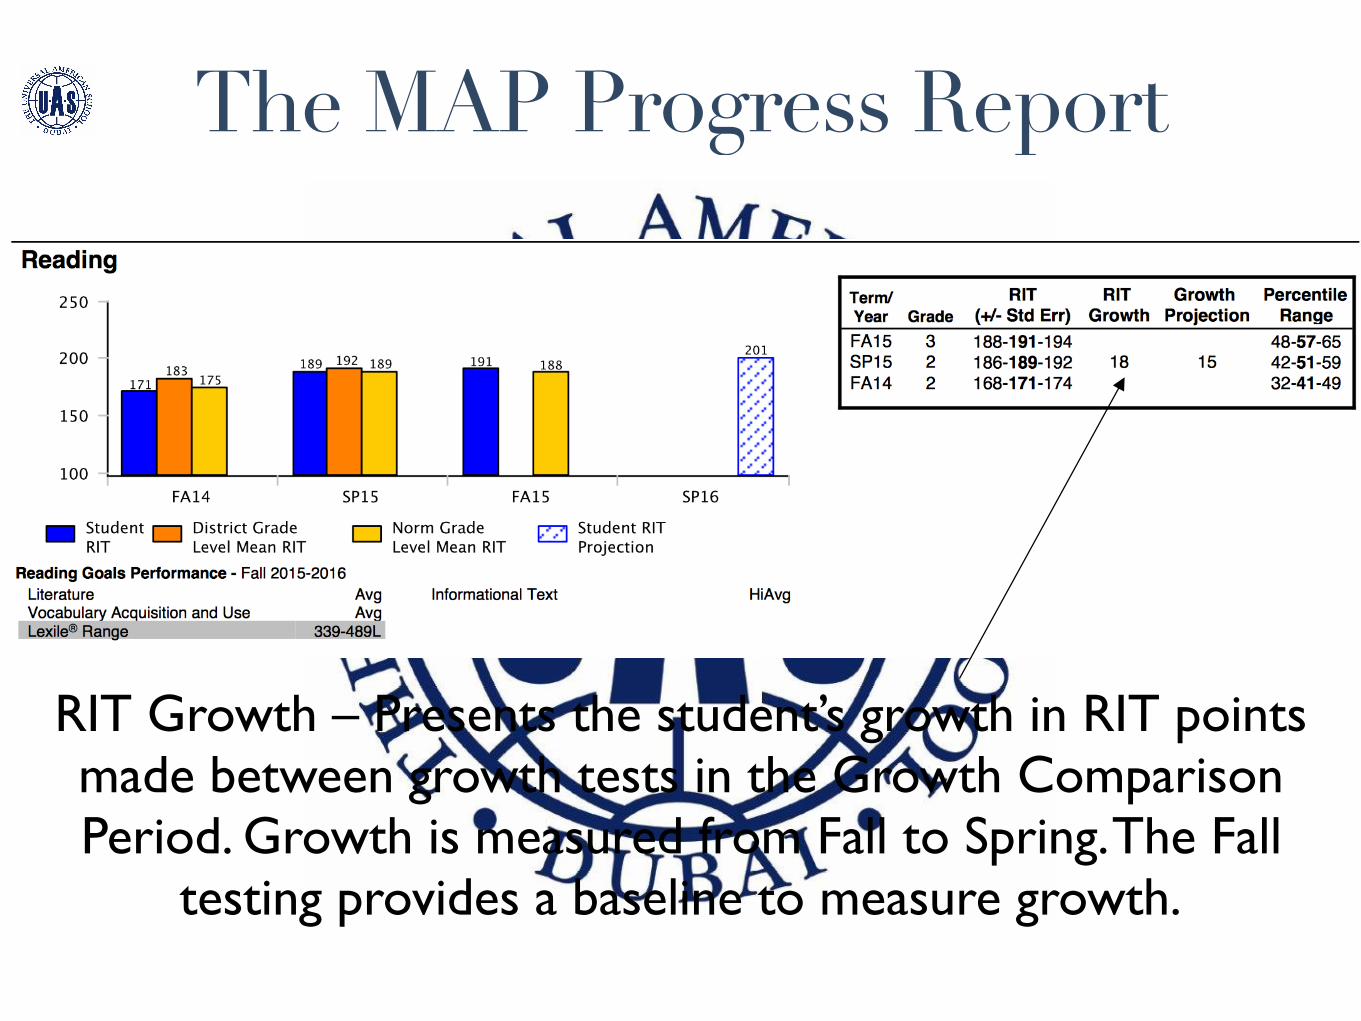
RIT Growth – Presents the student’s growth in RIT points made between growth tests in the Growth Comparison Period. Growth is measured from Fall to Spring. The Fall
testing provides a baseline to measure growth.
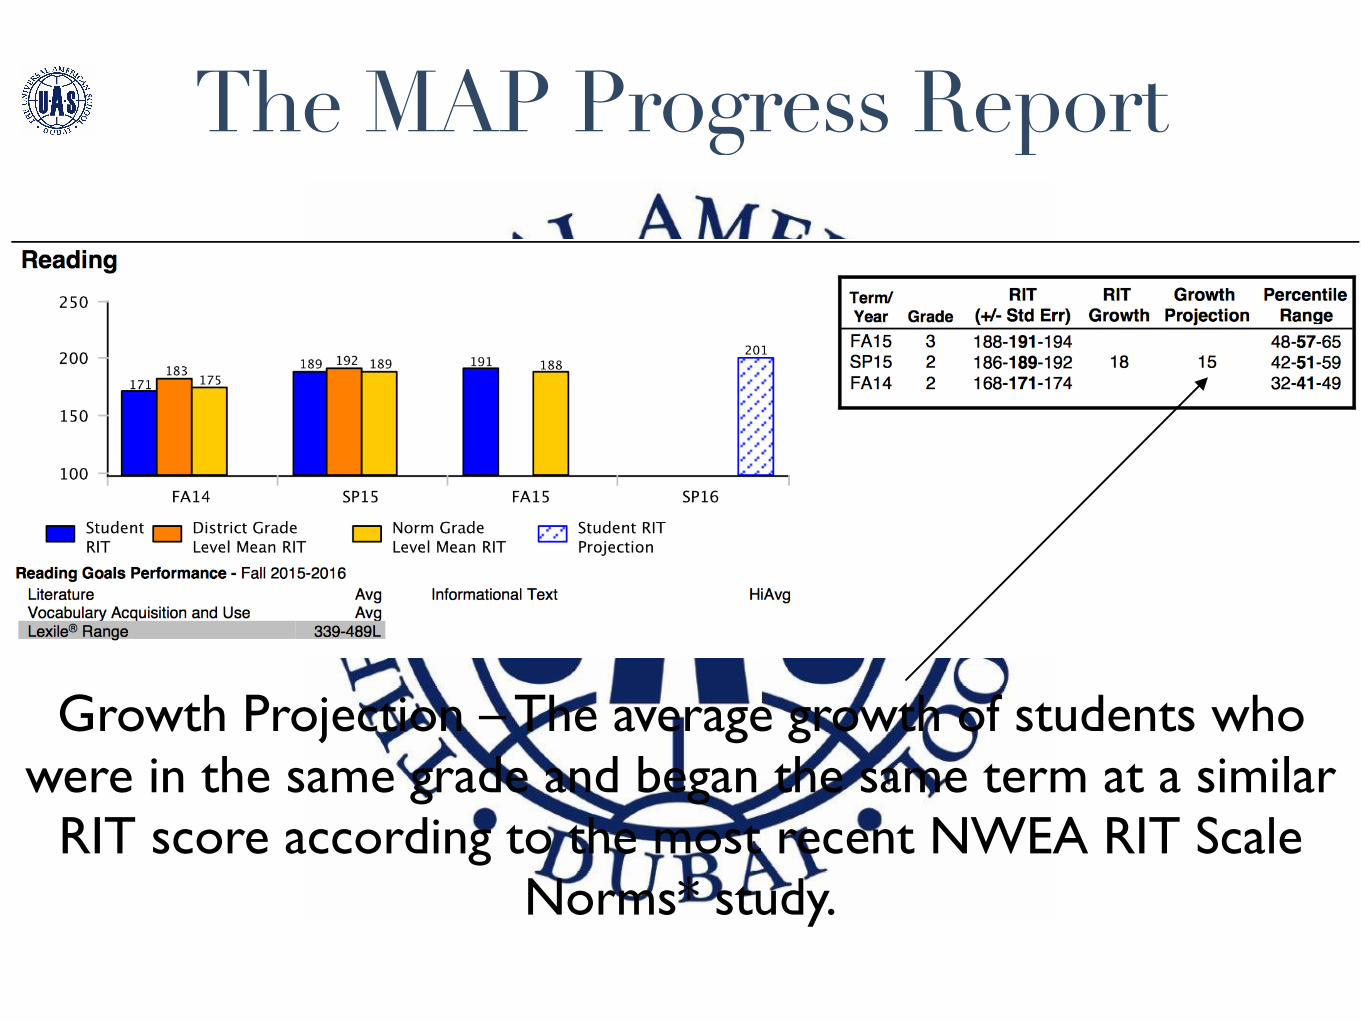
The MAP Progress Report
Growth Projection – The average growth of students who were in the same grade and began the same term at a similar
RIT score according to the most recent NWEA RIT Scale Norms* study.
The MAP Progress Report
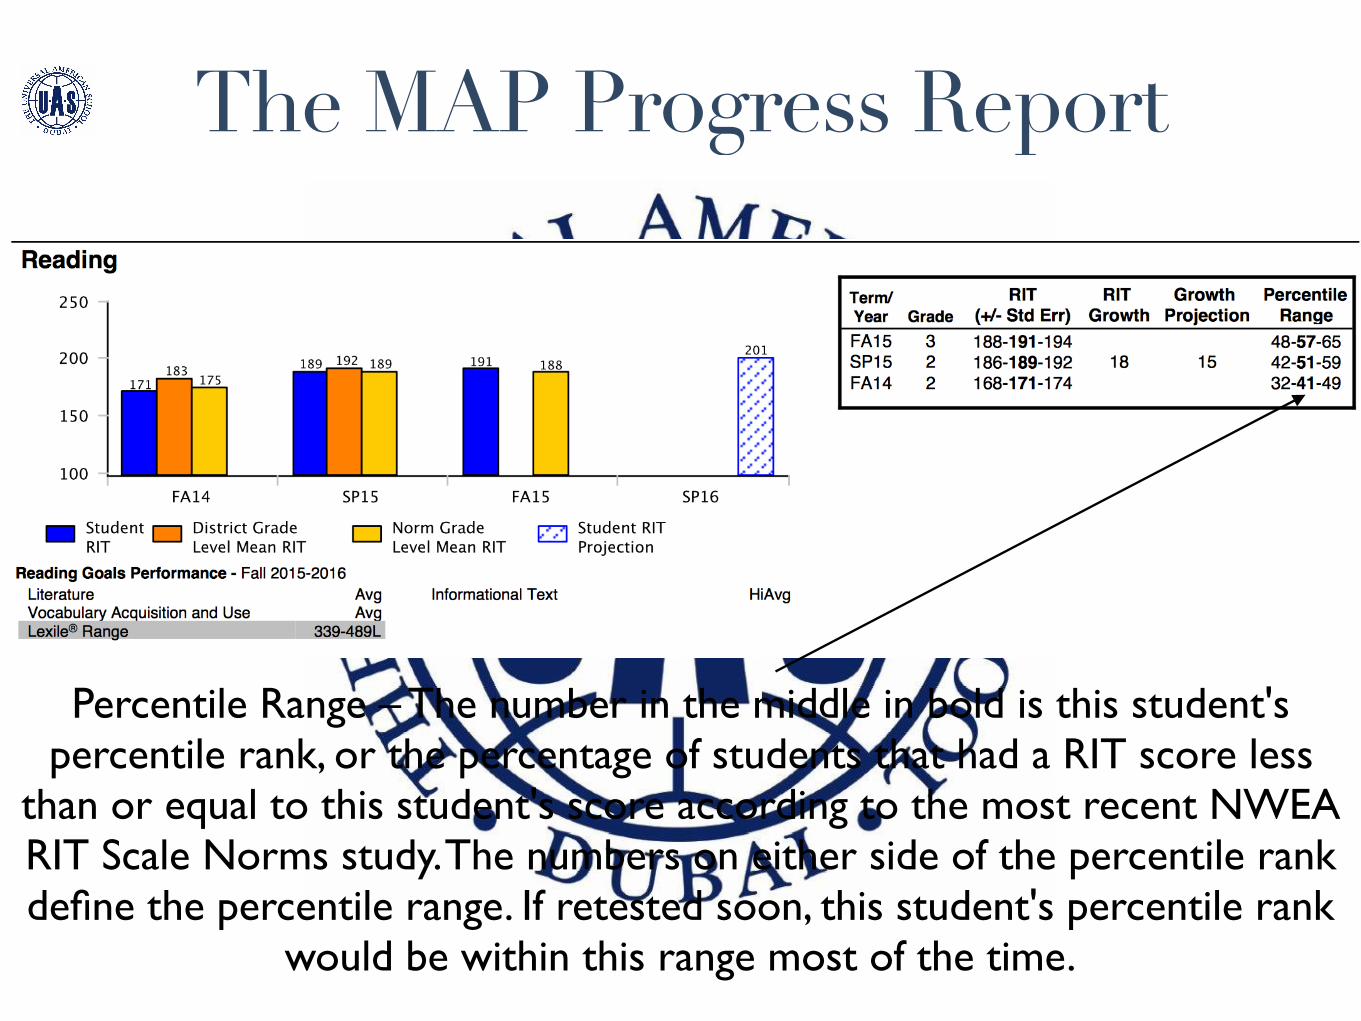
Percentile Range – The number in the middle in bold is this student's percentile rank, or the percentage of students that had a RIT score less
than or equal to this student's score according to the most recent NWEA RIT Scale Norms study. The numbers on either side of the percentile rank define the percentile range. If retested soon, this student's percentile rank
would be within this range most of the time.
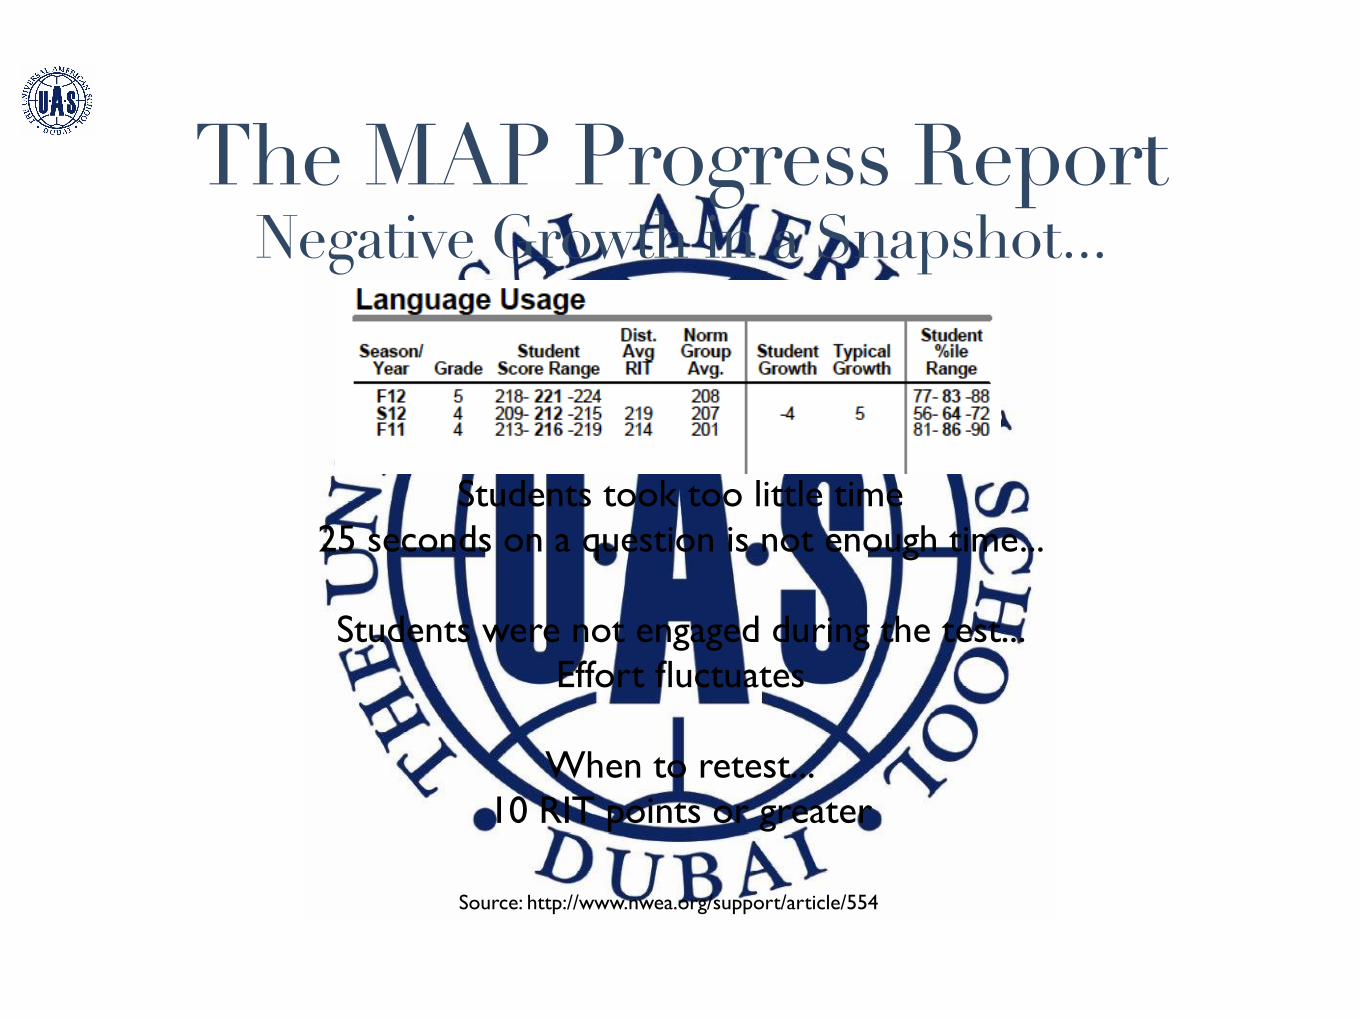
The MAP Progress Report Negative Growth in a Snapshot...
Source: http://www.nwea.org/support/article/554
Students took too little time25 seconds on a question is not enough time...
Students were not engaged during the test...Effort fluctuates
When to retest...10 RIT points or greater
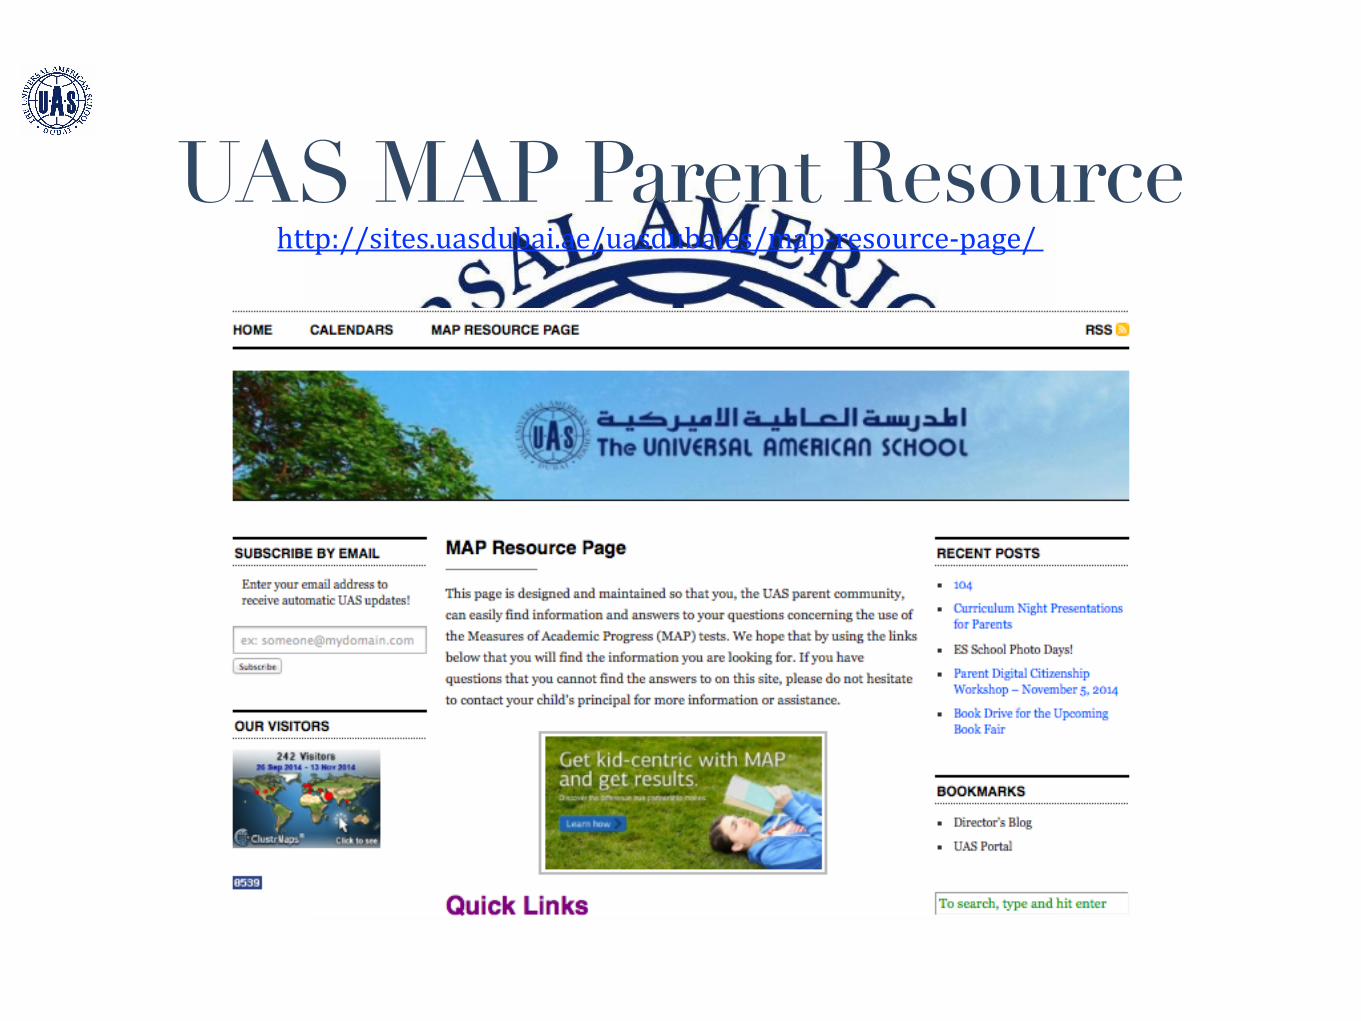
UAS MAP Parent Resource http://sites.uasdubai.ae/uasdubaies/map-‐resource-‐page/