management of innovation in a sensor company
TRANSCRIPT
w
DM981 – Management of Innovation
Prof. Dr. Nuran Acur
Department of Design, Manufacture, and Engineering Management
University of Strathclyde
Simulation Report – Team Baldwin
by
Michael Dördelmann
Juan Rosenzweig
Pulkit Vijayvargiya
DM981 – Management of Innovation Team Baldwin
I
I Statement of Academic Honesty “I declare that this submission is entirely my own original work. I declare that, except where fully reference direct quotations have been included, no aspect of this submission has been copied from any other source. I declare that all other works cited in this submission have been appropriately referenced. I understand that any act of Academic Dishonestly such as plagiarism or collusion may result in the nonaward of my degree.”
Date: 23rd April 2014
Name: Michael Dördelmann (Reg.No.: 201351504)
Signature:
Name: Juan Rosenzweig (Reg.No.:)
Signature:
Name: Pulkit Vijayvargiya (Reg.No.:)
Signature:
DM981 – Management of Innovation Team Baldwin
II
III Table of Contents
II Statement of Academic Honesty ..................................................................I
III Table of Contents ..........................................................................................II
IV Abstract ........................................................................................................ III
V List of Figures and List of Tables ............................................................... III
1 Introduction ...................................................................................................1
2 Business Analysis ........................................................................................2
2.1 Company Profile ...................................................................................2
2.2 Business Environment and SWOT-Analysis .........................................4
2.3 Companies Valures and Strategy Explained ........................................5
2.3 Practise Round Content........................................................................6
3 Rounds Decisions, Developments and Strategies.....................................7
3.1 Decisions, Operations and Strategies, Rounds 1 - 8 ............................7
3.3 Ending Results Analysis ..................................................................... 14
4 Discussion and Possible Improvements .................................................. 16
5 Conclusion .................................................................................................. 17
VI References.................................................................................................. VII
DM981 – Management of Innovation Team Baldwin
III
IV Abstract
Being one essential part of innovation management, business processes, market analysis,
decision making and financial investments have to be explored and trained. In order to
reach this, the Capsim business simulation has been established, covering decisions in
R&D, Finance, Production, marketing, HR and Quality Management to enable deeper
understanding for the students. In the course of this report, the simulation itself, the
purpose and the team constellation will be explained. After that strategy, decisions made
and outcome will be analysed critically. The report will end in a discussion and conclusion.
Note: Toe total length of this report is in the range of 15 pages as stated in the report constraints. Due to design and flow reasons, some pages are split up so the page count reaches 17.
V List of Figures and List of Tables
List of Figures
Fig. 1: Marketing Decisions Practice Round .............................................................................. 6
Fig. 2: Marketing Decisions Ro1 ................................................................................................ 7
Fig. 3: Production Investment – Ro2 ......................................................................................... 8
Fig. 4: Andrews Investment in Low-Cost ................................................................................... 9
Fig. 5: TQM Investments and Impacts Ro4 ............................................................................. 10
Fig. 6: Investments in Production Ro4 ..................................................................................... 10
Fig. 7: Extra Analysis of the Low-Cost Sector ......................................................................... 11
Fig. 8: Production Decisions Ro5 ............................................................................................ 11
Fig. 9: TQM impacts in comparison Ro6 ................................................................................. 12
Fig. 10: Liabilities Ro6 ................................................................................................................ 12
Fig. 11: Liabilities Ro7 & Ro8 .................................................................................................... 13
Fig. 12: Performance Measurements after Round 8 ................................................................. 14
Fig. 13: Stock Price Development Ro0 – Ro8 and Rating Ro8 ................................................. 14
Fig. 14: Product Profits and Profit History .................................................................................. 15
List of Tables
Fig. 1: Product Overview – Team Baldwin................................................................................. 2
Fig. 2: SWOT Analysis ............................................................................................................... 4

DM981 – Management of Innovation Team Baldwin
IV
1 Introduction
We are living in an experience economy. Innovation should be experienced. It should be
seen, it should be heard, it should be smelled, it should be felt and it should be tasted
before implementation. Innovation should be learned in all senses. Of course, innovation
theory is important: it should be heard. But practitioners should be able to see it working in
real life, to experience it. They should know how it tastes like to create a new product and
launch it into the market, they should feel the pain that is involved in failure, but also how it
feels like to get better afterwards. Innovation is using all our senses. And that’s when
simulation came in to picture.
A simulation is a virtual medium through which various types of skills can be acquired
(Gopinath and Sawyer, 1999). The word simulation implies an imitation of a real-life
process, usually via a computer or other technological device, in order to provide a lifelike
experience. This has proven to be a very reliable and successful method of training in
thousands of industries worldwide (Bill, 1997). They can be used both to allow specializa-
tion in a certain area, and to educate individuals in the workings of the sectors as a whole,
making training simulations incredibly versatile. It is important to emphasize that training
simulations are not just games (Klabbers, 1999); their aim is to educate and inform in an
exciting and memorable way, rather than purely to entertain. Since training simulations
are available based on such a wide range of different industries, and with thousands of
different aims and objectives, it is difficult to outline a specific skill-set that will be improved
by taking part in a training simulation. However, skills that every good training simulation
should build on include:
Business awareness
Time management and organization
Team coordination
Problem solving
Real like Business experience
In order to enable in-depth training in these areas, the Capsim simulation was imple-
mented in the Class DM981 – Management of Innovation, to make the students aware of
all impacts connected to their business decisions related to innovation. The Capsim
Business simulation is the global leader in business simulation and was designed to tech
in every learning environment (Capsim, 2014). Created in 1985, the company created
several successful business simulation models and has grown over the years, providing
comprehensive, expert live support, integrating case studies and business models from all
over the world and a growing global user portfolio (Ibid.).

DM981 – Management of Innovation Team Baldwin
V
2 Business Analysis
2.1 Company Profile
Baldwin, is a Sensor manufacturing company with strong foundation of ethics, manufac-
turing process control, and customer service. High sensor volume delivery has been
instrumental in the continued growth and success of Baldwin as a company in the sensor
industry. We are a high volume manufacturer of high quality sensors at an affordable
price. Increasing demand for our sensors in the world market has caused steady growth
since the founding of the company. We initially targeted, and then established, our
sensors as the sensors of choice in the traditional and low end sensor markets.
In this competitive industry we always stay ahead of others by meeting the requirements
and expectations of customers with continuous improvement of our products, services,
and business processes. Our mission Statement is:
“Be the sensor company of choice by providing high quality, easy to use, low cost sensors
that meet the customer requirements.”
Our Products: Baldwin sensors are developed and manufactured on a customer-specific
basis at different production lines. We manufacture sensors for a wide customer base,
including different range of customer segments named as traditional, low end, high end,
performance and size across the entire globe. We provide five different types of sensors
targeting the diverse requirements of each customer segment, which attribute highest
importance to quality and integrity on the basis of strategic alignment and production
requirements. Our different product verities are:
Baldwin Products Target Customer Segment
Baker Traditional
Bead Low End
Bid High End
Bold Performance
Buddy Size
Table 1 – Product Overview – Team Baldwin
Our Success story: We are the market leaders in the sensor industry with maximum
overall market share. Thanks to our state-of-the-art production facilities; we provide high
flexibility and scalability to our customers. Our customers can plan flexible lot sizes to suit
their own requirements. At Baldwin, tradition and innovation go hand-in-hand, we are
continuously investing in R&D for better results. The production requirements and
strategic alignment of our customers attribute great importance to target-oriented working,
absolute reliability and integrity. Every day, we successfully meet this challenge head-on.
We establish and maintain long-term partnerships with our customers, whose develop-
ment and production periods generally last many years. This is precisely why our
customers chose Baldwin as their partner: because our competence, size and financial
stability make us the ideal companion on the long road ahead.

DM981 – Management of Innovation Team Baldwin
VI
Executive Board - Baldwin:
Michael Dördelmann - Chief Executive Officer
Michael was born in Germany in 1989. He made his B.Eng in Germany and
gained several years of work experience in the Automotive Engineering Sector
and in the Consulting Sector. His core competencies are organisational and
analytical thinking.
Core Responsibilities:
Michael is the driving force behind the company; he is making
things happen, by putting together the resources to support
the company and taking the product to the market place. As
the Chief Executive Officer of Baldwin, Michael is in charge of
Strategic Business Development, Investments, as well as
Marketing and Sales.
Professional Career
Juan Rosenzweig - Chief Financial Officer
Juan was born in Mexico City in 1987. He studied Civil engineering in Vienna’s University
of Technology and managed throughout his carrier to develop a few business ideas.
Among which is SOLACERO, a home products manufacturing company. His international
background has given him access to international managerial positions as well as a good
understanding on the importance and integration of diversity in
working environments.
Core Responsibilities:
As Chief Financial Officer of Baldwin, Juan is responsible for
Finance, Purchasing, IT, Investor Relations, Human Resources,
Compliance and Risk Management.
Professional Career:
2008 Project manager at Metalnica
20010 Co–founder and Vice president Solacero
2008 Project Manager Daimler
2010 Senior Consultant - MD Corp.
2012 Head of Department – Strategy - MD Corp.
DM981 – Management of Innovation Team Baldwin
VII
Pulkit Vijayvargiya - Chief Operating Officer
Pulkit was born in India in 1988. He studied Mechanical Engineering from 2007 through
2011 at UEC-Ujjain. Over the course of his career, which spans around 3 years since his
graduation, Pulkit assumed responsibility for the initial set-up, further development, growth
and integration of technology companies in a variety of executive
management positions or has assisted businesses as a manage-
ment consulting engineer.
Core Responsibilities:
Pulkit makes sure that company operations flow smoothly and
economically. He is responsible for making certain that necessary
work is done properly and on time. As the Chief Operating Officer
of Baldwin, Pulkit is in charge of Research & Development,
operations and production and is the creative head of the company.
Professional Career:
2008 Co–founder and Vice president at Sunflowers
2011 Process Design engineer at Denso-Toyota
2012 Project management engineer at Denso, Japan
2.2 Business Environment and SWOT Analysis
The initial business environment developed after the government’s decision to split a
monopoly sensors manufacturer into 6 identical companies with the same market
positions. Situation that leads to equally divided competition with well understood market
conditions. Such conditions required urgent managerial decisions in marketing, produc-
tion, R&D and finance in order to react to the new implied competition.
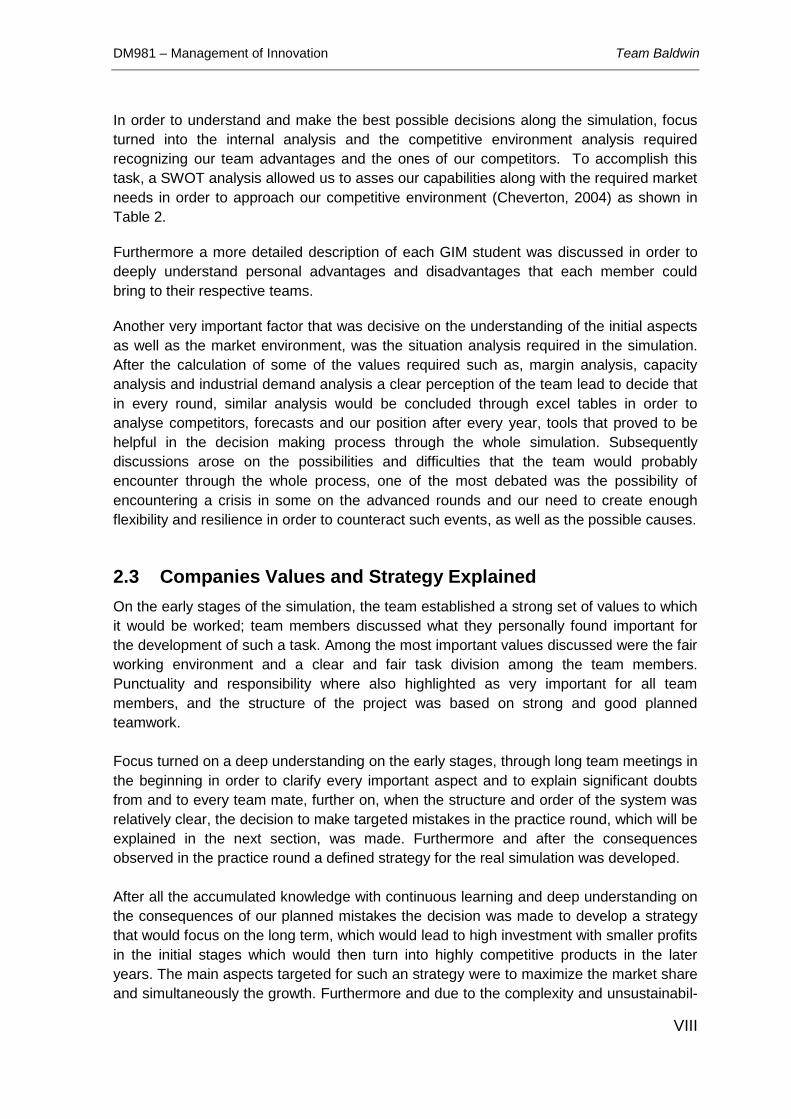
Strengths Weaknesses
- Understanding abilities of 3 engineers
- Good managerial capabilities
- Competitiveness of team members
- Teamwork
- Lack of understanding on financial
aspects
- Language and cultural barriers
Opportunities Threats
- Learn from mistakes on practice
rounds
- Develop financial understanding
- Other teams advantage on financial
aspects
- Strong competition
Table 2 – SWOT Analysis
DM981 – Management of Innovation Team Baldwin
VIII
In order to understand and make the best possible decisions along the simulation, focus
turned into the internal analysis and the competitive environment analysis required
recognizing our team advantages and the ones of our competitors. To accomplish this
task, a SWOT analysis allowed us to asses our capabilities along with the required market
needs in order to approach our competitive environment (Cheverton, 2004) as shown in
Table 2.
Furthermore a more detailed description of each GIM student was discussed in order to
deeply understand personal advantages and disadvantages that each member could
bring to their respective teams.
Another very important factor that was decisive on the understanding of the initial aspects
as well as the market environment, was the situation analysis required in the simulation.
After the calculation of some of the values required such as, margin analysis, capacity
analysis and industrial demand analysis a clear perception of the team lead to decide that
in every round, similar analysis would be concluded through excel tables in order to
analyse competitors, forecasts and our position after every year, tools that proved to be
helpful in the decision making process through the whole simulation. Subsequently
discussions arose on the possibilities and difficulties that the team would probably
encounter through the whole process, one of the most debated was the possibility of
encountering a crisis in some on the advanced rounds and our need to create enough
flexibility and resilience in order to counteract such events, as well as the possible causes.
2.3 Companies Values and Strategy Explained
On the early stages of the simulation, the team established a strong set of values to which
it would be worked; team members discussed what they personally found important for
the development of such a task. Among the most important values discussed were the fair
working environment and a clear and fair task division among the team members.
Punctuality and responsibility where also highlighted as very important for all team
members, and the structure of the project was based on strong and good planned
teamwork.
Focus turned on a deep understanding on the early stages, through long team meetings in
the beginning in order to clarify every important aspect and to explain significant doubts
from and to every team mate, further on, when the structure and order of the system was
relatively clear, the decision to make targeted mistakes in the practice round, which will be
explained in the next section, was made. Furthermore and after the consequences
observed in the practice round a defined strategy for the real simulation was developed.
After all the accumulated knowledge with continuous learning and deep understanding on
the consequences of our planned mistakes the decision was made to develop a strategy
that would focus on the long term, which would lead to high investment with smaller profits
in the initial stages which would then turn into highly competitive products in the later
years. The main aspects targeted for such an strategy were to maximize the market share
and simultaneously the growth. Furthermore and due to the complexity and unsustainabil-
DM981 – Management of Innovation Team Baldwin
IX
ity of a diversified strategy in every sector, the team took the decision to focus on the low
cost product market while not losing flexibility in other markets. This approach was taken
in order to understand the strategies that other teams would approach after the first round
and having the ability to react in consequence. After our general strategy was clear, the
team was ready to act internally for the decisions and react externally to our competitors.
Detailed strategies and how the flexibility in our team decisions made a difference will be
explained in detail in following sections.
2.4 Practise Rounds Content
The approach taken to understand and organize the whole Capsim simulation was based
on Concurrent Engineering, where a special focus was given to the initial stages of the
project considering all possible aspects to generate a greater understanding for the
beginning and avoiding problems that could have been avoided in the future (Clausing,
1994). In order to apply these concepts the team decided to meet very frequently and for
longer periods until the simulation aspects were fully understood, knowing that if in the
beginning the concepts were clear complications and future decision would get easier in
every round.
Consequently, after the complete business environment, SWOT and Strategy were
understood a clearer perspective to approach the practice rounds was defined. This
approach intended to create well denoted mistakes to understand the consequences of
these. The decisions focused on taking the best approaches possible in the R&D depart-
ment, while analysing the effects of over and under forecasting in 2 of the segments which
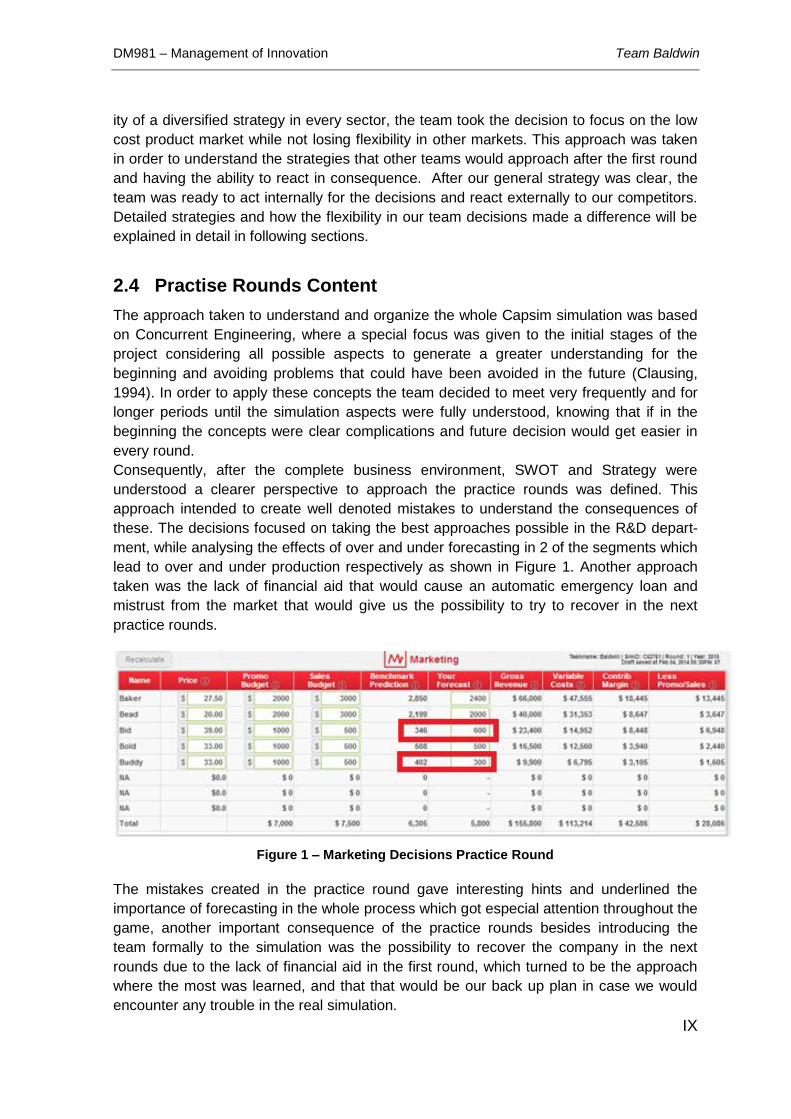
lead to over and under production respectively as shown in Figure 1. Another approach
taken was the lack of financial aid that would cause an automatic emergency loan and
mistrust from the market that would give us the possibility to try to recover in the next
practice rounds.
Figure 1 – Marketing Decisions Practice Round
The mistakes created in the practice round gave interesting hints and underlined the
importance of forecasting in the whole process which got especial attention throughout the
game, another important consequence of the practice rounds besides introducing the
team formally to the simulation was the possibility to recover the company in the next
rounds due to the lack of financial aid in the first round, which turned to be the approach
where the most was learned, and that that would be our back up plan in case we would
encounter any trouble in the real simulation.
DM981 – Management of Innovation Team Baldwin
X
3 Rounds Decisions, Developments and Strategies
3.1 Decisions, Operations and Strategies – Rounds 1 - 8
Round 1
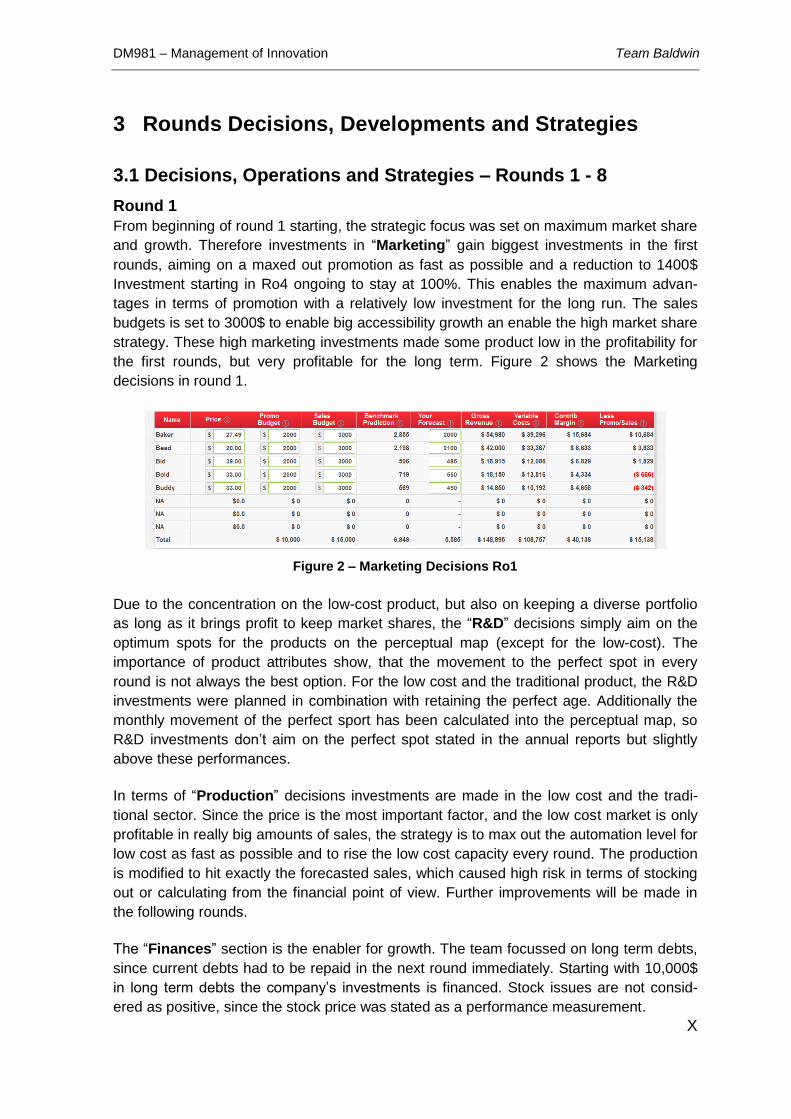
From beginning of round 1 starting, the strategic focus was set on maximum market share
and growth. Therefore investments in “Marketing” gain biggest investments in the first
rounds, aiming on a maxed out promotion as fast as possible and a reduction to 1400$
Investment starting in Ro4 ongoing to stay at 100%. This enables the maximum advan-
tages in terms of promotion with a relatively low investment for the long run. The sales
budgets is set to 3000$ to enable big accessibility growth an enable the high market share
strategy. These high marketing investments made some product low in the profitability for
the first rounds, but very profitable for the long term. Figure 2 shows the Marketing
decisions in round 1.
Figure 2 – Marketing Decisions Ro1
Due to the concentration on the low-cost product, but also on keeping a diverse portfolio
as long as it brings profit to keep market shares, the “R&D” decisions simply aim on the
optimum spots for the products on the perceptual map (except for the low-cost). The
importance of product attributes show, that the movement to the perfect spot in every
round is not always the best option. For the low cost and the traditional product, the R&D
investments were planned in combination with retaining the perfect age. Additionally the
monthly movement of the perfect sport has been calculated into the perceptual map, so
R&D investments don’t aim on the perfect spot stated in the annual reports but slightly
above these performances.
In terms of “Production” decisions investments are made in the low cost and the tradi-
tional sector. Since the price is the most important factor, and the low cost market is only
profitable in really big amounts of sales, the strategy is to max out the automation level for
low cost as fast as possible and to rise the low cost capacity every round. The production
is modified to hit exactly the forecasted sales, which caused high risk in terms of stocking
out or calculating from the financial point of view. Further improvements will be made in
the following rounds.
The “Finances” section is the enabler for growth. The team focussed on long term debts,
since current debts had to be repaid in the next round immediately. Starting with 10,000$
in long term debts the company’s investments is financed. Stock issues are not consid-
ered as positive, since the stock price was stated as a performance measurement.
DM981 – Management of Innovation Team Baldwin
XI
Round 2
The risky forecasts and the high investments caused a small minus in profits in the first
round, which was expected by the team. Nevertheless, the high rise in market share to
21.44% showed first success for future plans. Also market leadership was gained in
traditional, low-cost and performance market.
This rounds R&D decisions stay the same as last round, investing in R&D for all products
but low-cost, to fit to the perfect spot movement in consideration of the products age.
Also in Marketing the decisions for promotion budget and sales budget for low-cost and
traditional stay the same. Prices for Bid, Bold and Buddy were set to the maximum, since
price is a non-relevant attribute for these sectors. Bead and Baker still remain in a middle
priced area. The forecast is chosen very risk and close to the bench mark prediction due
to expected advantages of high promotion and sales investments. In future rounds, these
decisions were better understood and adopted.
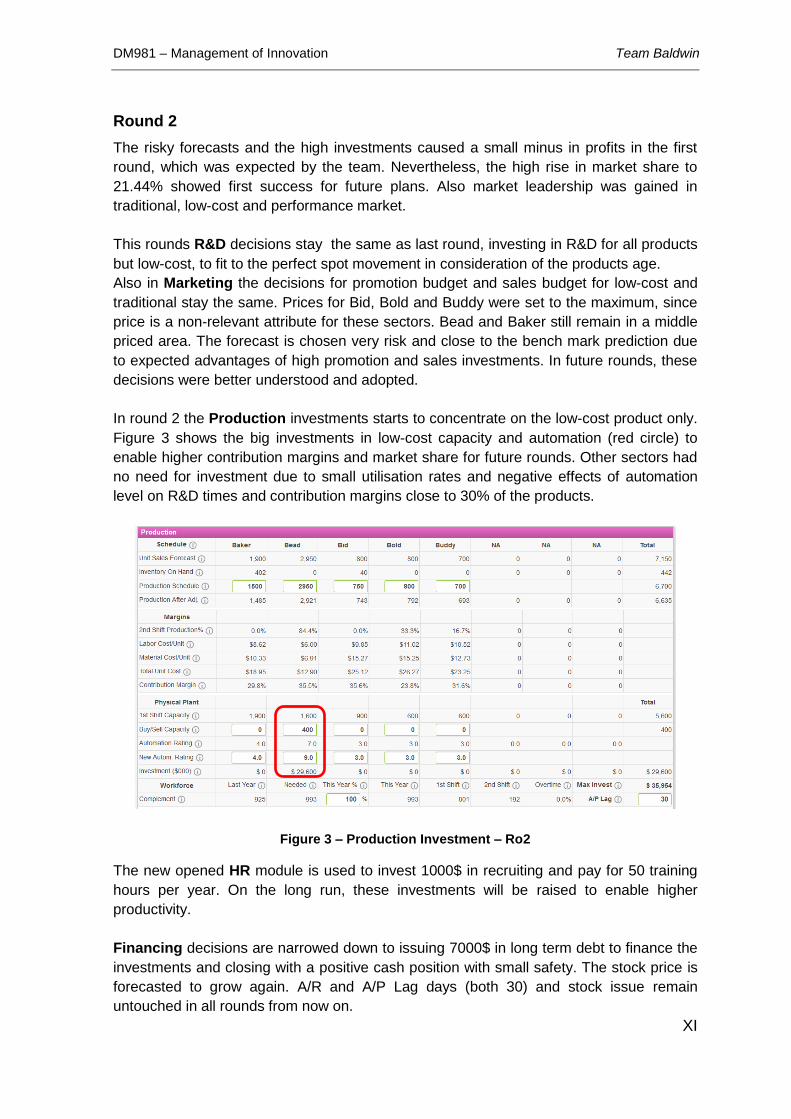
In round 2 the Production investments starts to concentrate on the low-cost product only.
Figure 3 shows the big investments in low-cost capacity and automation (red circle) to
enable higher contribution margins and market share for future rounds. Other sectors had
no need for investment due to small utilisation rates and negative effects of automation
level on R&D times and contribution margins close to 30% of the products.
Figure 3 – Production Investment – Ro2
The new opened HR module is used to invest 1000$ in recruiting and pay for 50 training
hours per year. On the long run, these investments will be raised to enable higher
productivity.
Financing decisions are narrowed down to issuing 7000$ in long term debt to finance the
investments and closing with a positive cash position with small safety. The stock price is
forecasted to grow again. A/R and A/P Lag days (both 30) and stock issue remain
untouched in all rounds from now on.

DM981 – Management of Innovation Team Baldwin
XII
Round 3
Again the risky forecast and the high investments caused problems in the finance and
triggered the emergency loan, but also positive profits again. The market share rose to
22.49% and the companies investments started to impact on performance attributes. The
annual report revealed the loss of the buddy product showing the difficulties of a complete
diverse product portfolio. To enable further profit growth in the markets the company
concentrates on and the high competition in this market sector, the Size-product Buddy
will be dropped and only remained inventory will be sold. Performance-product Bold will
be kept due to the company’s good market position in this sector and lower competition.
Further on, the main competition is seen in Andrews due to their starting investments in
the low-cost sector. This is shown in Figure 4. Additionally Erie was set on the “watch list”
for the future due to their product portfolio. Therefore, costs are lowered in a big step to
17.00 to catch up in market share in the low cost sector and to cause higher stock at
competing companies. The strategy for the long term is to gain complete market domi-
nance in this sector and “scare” competitors to invest here. This would enable maximum
prices and high demands due to high marked demand and no production from competi-
tors.
Figure 4 - Andrews Investment in Low-Cost
The investments in R&D and Marketing are set as in the last rounds. For promotion this
round is expected to be the last round of 2000$ investment, being close to the max out
point. The forecast is set lower and less risky than in last rounds. Decisions in Production
are 10% overproduction to allow best possible market share and calculate with more
security in financial decisions. Additionally investments the automation level of low cost
will cause a max out in round 4 and further capacity investments will permit consistent
growth for the future in this market.
While the investments in HR are raised to 2000$, trainings hours stay the same. On the
long run and with better profits of the company, these investments will grow.
In the Financial decisions, the ending of the first bond package needs a long term debt
issue of 15,000$ to remain in the financial save zone. This time the financial position is
considered as more secure and a better result is expected due to forecast adoptions.

DM981 – Management of Innovation Team Baldwin
XIII
Round 4
While the high issue of long term debts lowered the bond rating to CCC, this necessary
step empowered company’s growth with excellent effects. Starting this round, the market
share stays nearly unattached, profits raise and stock prices grow. While Chester and
Digby are not seen as relevant competitors anymore, Andrews and Erie are doing quite
well in performance.
With the start of the TQM module this round and the maxing out of promotion budged, this
round can be seen as one of the most important rounds of the company. First decision
that allowed total dominance in the markets was the huge investments in TQM from the
very beginning to gain the maximum outcomes from these investments for as many
rounds as possible. The earlier all improvements hit in, the more time the company can
profit from them. That’s why a 2,000$ investment over 2 rounds in all factors is considered
as best step. The tem expects to be able to repay debts after 2 more rounds of major
investments, after maxing out in TQM and adopting the production Investments. Figure 5
shows the TQM investments and the possible impacts on performance.
Figure 5 – TQM Investments and Impacts Ro4
While R&D and Marketing strategy and decisions stay the same as in past rounds,
second break through investments are the Production investments. Beginning this round,
the Performance-product was adopted to retain profitability and major investments in low-
cost shall cause market dominance and low costs for the products but retain high
contribution margin. Figure 6 shows the Investments in production of Round 4.
Figure 6 – Investments in Production Ro4
Decisions in HR stay the same while big investments are supported by the Financing
decisions issuing 15,000$ in long term debt again. Beginning this round, the company
starts to pay dividends to cause positive effects on the stock price.

DM981 – Management of Innovation Team Baldwin
XIV
Round 5
The big investments of round 4 started to pay off and the company gained even more
market share, higher profits and stock price. The Capstone courier provided an overview
of the TQM advantage over all other companies and confirmed the company’s course in
this topic. Furthermore, the team did an additional analysis on the low-cost product sector
to check the investments of competitors and the 100% secure sales due to market
demand and possible competitor maximum productions (neglecting possible stock
amounts). Figure 7 provides an overview about the analysis and the results.
Figure 7 – Extra Analysis of the Low-Cost Sector
Due to the fact the secure sales were really low and competitors started investing higher
amounts into the market, the strategy for low-cost products was overthought. In the future,
the company aimed on minimal cost, maximal market share to cause total dominance and
high stocks on the competitor’s site.
This round the only investments on low-cost R&D are made, to remain in the cycle and
minimise the effect on the ideal age position of the product. The performance point is set
to the ideal position of round 7 to gain maximum positive impact in rounds 6 to 8.
While Marketing decisions doesn’t change and the forecast strategy stays the same, big
investments are made in the Production site again. Capacity of Low-cost and Perform-
ance are raised for 800 and 400 costing 43,400$. Figure 8 provides an overview of these
investments.
Figure 8 – Production Decisions Ro5
In HR the investment in recruiting is risen to 4,000$ and training hours are set to 60 to
enable faster productivity growth for future rounds.
The TQM decisions stay the same for this round, maxing out in all attributes to gain the
maximum performance. To finance this last round of big investments, long term debts of
30,000$ have to be borrowed by the bank to remain in the save zone.
Round 4: Andrews Baldwin Digby Erie Ferris Summary Secure Sales
Low Cost Capacity 2200 1600 1400 800 6000 Round Demand Growth Rate
Max. Capacity 4400 3200 2800 1600 12000 0 8960 11,70%
1 10008 11,70%
2 11179 11,70%
3 12487 11,70%
Round 5: Andrews Baldwin Digby Erie Ferris Summary Secure Sales 4 13948 11,70%
Low Cost Capacity 2400 1800 1500 1550 7250 5 15580 11,70%
Max. Capacity (2x) 4800 3600 3000 3100 14500 6 17403 11,70%
Cap. Investment -200 0 -200 -100 -750 -1250 7 19439 11,70%
8 21714
Low End - Bead
1948
1080
DM981 – Management of Innovation Team Baldwin
XV
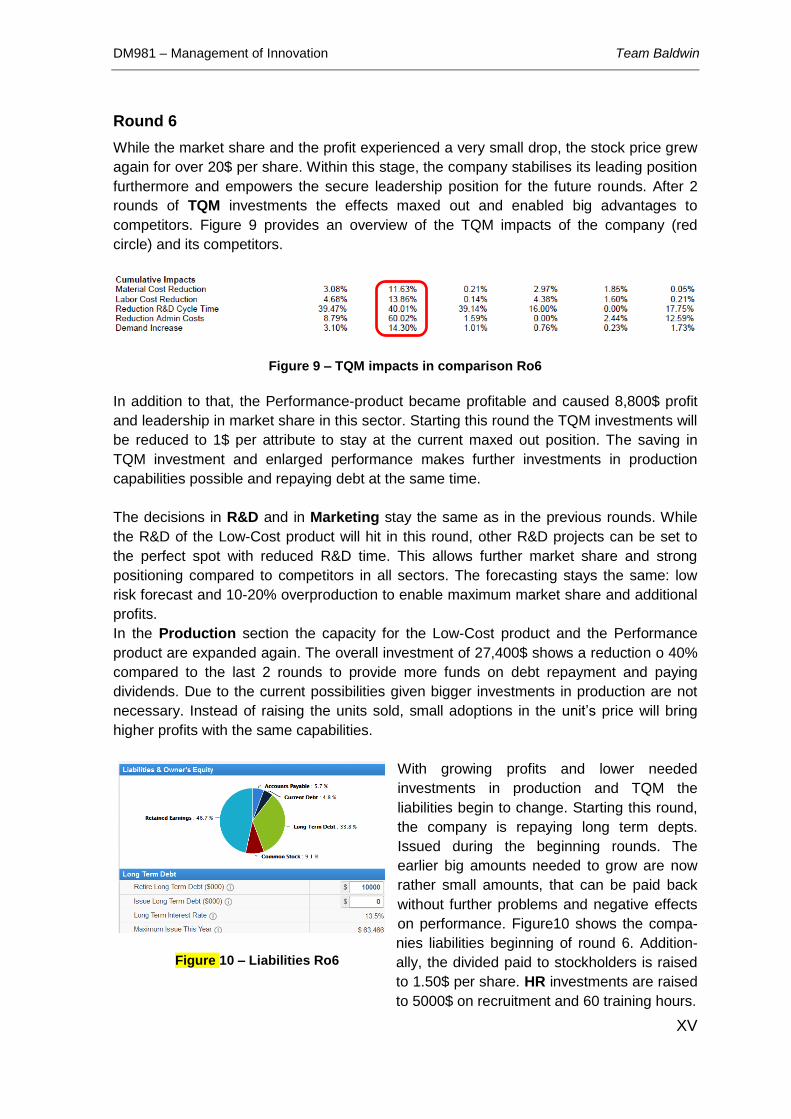
Round 6
While the market share and the profit experienced a very small drop, the stock price grew
again for over 20$ per share. Within this stage, the company stabilises its leading position
furthermore and empowers the secure leadership position for the future rounds. After 2
rounds of TQM investments the effects maxed out and enabled big advantages to
competitors. Figure 9 provides an overview of the TQM impacts of the company (red
circle) and its competitors.
Figure 9 – TQM impacts in comparison Ro6
In addition to that, the Performance-product became profitable and caused 8,800$ profit
and leadership in market share in this sector. Starting this round the TQM investments will
be reduced to 1$ per attribute to stay at the current maxed out position. The saving in
TQM investment and enlarged performance makes further investments in production
capabilities possible and repaying debt at the same time.
The decisions in R&D and in Marketing stay the same as in the previous rounds. While
the R&D of the Low-Cost product will hit in this round, other R&D projects can be set to
the perfect spot with reduced R&D time. This allows further market share and strong
positioning compared to competitors in all sectors. The forecasting stays the same: low
risk forecast and 10-20% overproduction to enable maximum market share and additional
profits.
In the Production section the capacity for the Low-Cost product and the Performance
product are expanded again. The overall investment of 27,400$ shows a reduction o 40%
compared to the last 2 rounds to provide more funds on debt repayment and paying
dividends. Due to the current possibilities given bigger investments in production are not
necessary. Instead of raising the units sold, small adoptions in the unit’s price will bring
higher profits with the same capabilities.
With growing profits and lower needed
investments in production and TQM the
liabilities begin to change. Starting this round,
the company is repaying long term depts.
Issued during the beginning rounds. The
earlier big amounts needed to grow are now
rather small amounts, that can be paid back
without further problems and negative effects
on performance. Figure10 shows the compa-
nies liabilities beginning of round 6. Addition-
ally, the divided paid to stockholders is raised
to 1.50$ per share. HR investments are raised
to 5000$ on recruitment and 60 training hours.
Figure 10 – Liabilities Ro6

DM981 – Management of Innovation Team Baldwin
XVI
Round 7 and 8
By reason of the good results of the last rounds decisions the company is stable in its
current leading position. The last two rounds the team focussed on repaying long term
debts and paying higher dividends to raise rating and stock price.
The investments in the Production are lowered and concentrated on the Low-Cost
product only. Due to the market growth and the good position of the company, the price
can be raised, the production capabilities used for 100% and the margin still hold above
57%. In both rounds combined the Low-Cost production capacity are raised for 500
ending with a total capacity of 5000 after round 8.
R&D, Marketing and HR decisions and strategies stay the same in these rounds. R&D
still profits from shorter development times and aims on the perfect spots by early market
entry, the Marketing and forecast strategies remain at 1400$ promotion, 3000$ sales and
secure forecasting. In HR the payment of 5000$ on recruiting and 60 Training hours stays
unchanged to allow further productivity growth. Also the TQM investments stay untouched
at 1$ per attribute.
The Financing activities of the last two rounds minimize the overall debt of the company
essentially and elevated the profits made even more. Moreover, the ratings of the
companies remaining debts are raised and the higher dividends paid (Ro7: 4.00$, Ro8:
5.50$) let the market price per share grow further more. Figure 11 provides an overview of
the last rounds liabilities.
Figure 11 – Liabilities Ro7 & Ro8
Round 7 Round 8

DM981 – Management of Innovation Team Baldwin
XVII
3.2 Ending Results Analysis
After all eight rounds played, the company achievements and performance measurements
compared with its competitors are analysed. Figure 12 provides an overview of cumulative
profits, market share, average ROA and final stock price stock price in comparison of all
competitors. The company is benchmark in all four categories, having big advantages in
profits, and stock price and small advantages in market share and ROA average.
Figure 12 – Performance Measurements after Round 8
Ending round 8 the company additionally enabled profits of over 53 million $ and closing
cash big enough to repay all outstanding debts. Since round 5 the company’s Final Score
Relative is 100.0 in overall, meaning that in all performance indicators measured, Baldwin
was benchmark and never lost its leadership position in the last 4 rounds played. Also, the
stock price development of the last 5 rounds shows the advantage compared to its
competitors (see Figure 13).
Figure 13 – Stock Price Development Ro0 – Ro8 and Rating Ro8
a) Cumulative Profits b) Market Share, End of Ro8
c) ROA – Average Ro1-8 d) Stock Price, End of Ro8
(in million)
DM981 – Management of Innovation Team Baldwin
XVIII
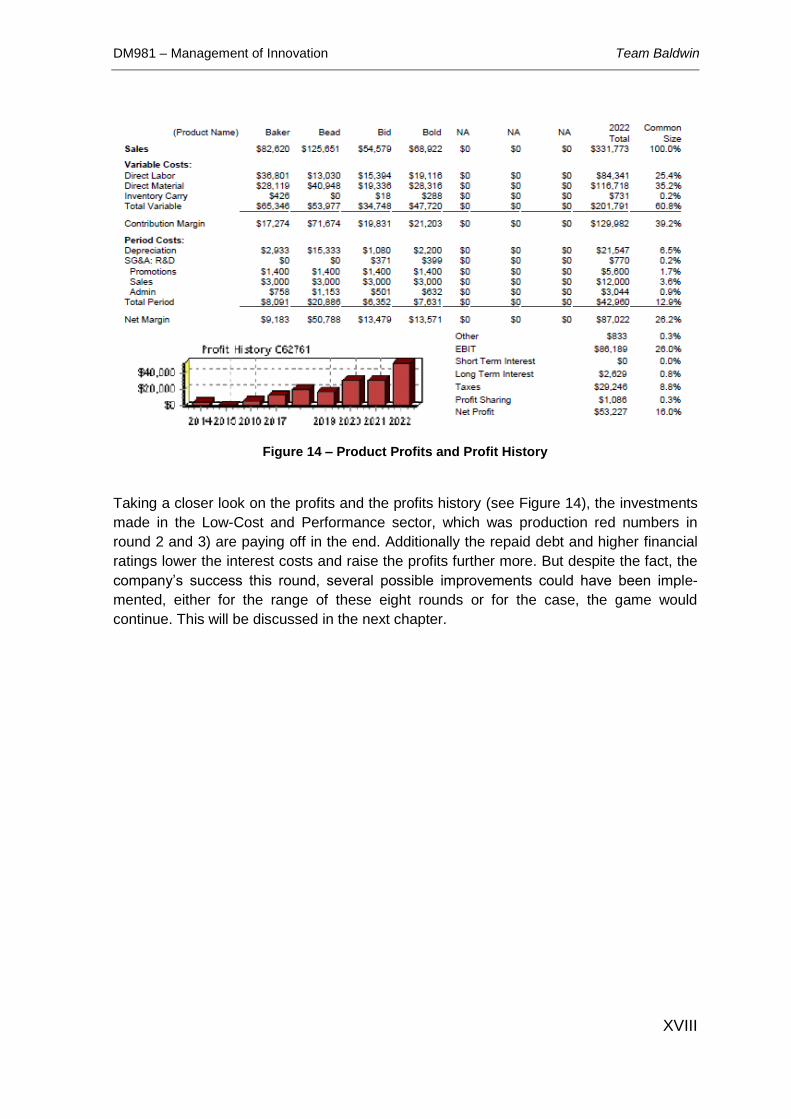
Figure 14 – Product Profits and Profit History
Taking a closer look on the profits and the profits history (see Figure 14), the investments
made in the Low-Cost and Performance sector, which was production red numbers in
round 2 and 3) are paying off in the end. Additionally the repaid debt and higher financial
ratings lower the interest costs and raise the profits further more. But despite the fact, the
company’s success this round, several possible improvements could have been imple-
mented, either for the range of these eight rounds or for the case, the game would
continue. This will be discussed in the next chapter.

DM981 – Management of Innovation Team Baldwin
XIX
4 Discussion and Possible Improvements
In the course of this simulation, the team discovered several investments that could have
been implemented to enable even higher profits and further company growth.
Traditional Sector
Investments in the traditional sector automation(level 6-7) and capacity (up to 3000)
starting at the point of the TQM module introduction would have caused higher market
share due to lower price, no product performance lacks due to TQM and impacts on R&D
cycle time and would have risen the contribution margin essentially. When this fact was
detected in round 7, the team decided to concentrate on debt repayments and stock price
boosts due to the close end of the simulation.
Low-Cost Sector
In order to gain every point of the customer survey, the team stayed to the MBTF level of
14000 in the Low-Cost sector. Compared to possible improvements in profit and the fact
of capacity lacks in the last round, this factor could have been lowered to 12000-125000
without major effects on the market share itself.
High End Sector
Due to high earnings starting in round 4 the team could have introduced a new product to
the high end market, causing higher profits, market share and further growth. Due to high
needed investments and the close end of the complete simulation, the team decided to
stay with the current products and maximise their outcome. In case the simulation would
go on for several more rounds, this decision would have been changed.
Forecasting
The forecasting decisions in the first 3 rounds were too opportunistic and the missing
overproduction caused either stock outs or not calculated missing profits due to stock.
This caused the emergency loan once and negative profits for the first two rounds. With
right forecasting and calculations, the company’s growth would have been made possible
even with higher security.

DM981 – Management of Innovation Team Baldwin
XX
5 Conclusion and Reflection
The Capsim Business Simulation enabled awareness over a broad range of decisions that
have to be considered in management of innovations and in processes implementing
innovations in business environment. After the analysis of the team capabilities and
market opportunities the team successfully implemented a new product strategy and
made decisions in all departments with excellent results. The final results show the
Baldwin Company being on top of all competitors in all relevant key performance indica-
tors measured. The major time spent in the beginning of the project to empower real
program and market understanding and to analyse all possible program capabilities gave
essential advantages. This management style could be compared to concepts like
concurrent engineering, where more time is spent in the planning and development phase
to reduce risk for later project stages.
Furthermore the program understanding was accompanied by interdisciplinary learning
processes of all team members as for example in financial management or strategic
technology management. The project clearly showed that all areas of concern have to be
mastered to bring innovation to success. A lack of competencies in one single area can
cause overall fail and negative profits.

DM981 – Management of Innovation Team Baldwin
XXI
VI References
Capsim (2014). Capsim Homepage – About, [Online] Available at: http://www.capsim.com/about/ [Accessed: 14.04.2014]
Cheverton, P., 2004. Key marketing skills. 2nd ed. ed. London ; Sterling, VA :
Kogan Page .
Clausing, D., 1994. Total quality development [internet resource] : a step-by-step
guide to world-class concurrent engineering. New York : ASME Press .
Gopinath, C. and Sawyer, J. (1999). Exploring the Learning from an Enterprise Simulation, Journal of Management Development, Sage Publishing
Ellet, Bill (1997). TMR Shortlist of Business Simulations, Training Media Review Publications
Klabbers, Jan H. G. (1999). Three Easy Pieces: A Taxonomy of Gaming. In: The International Simulation & Gaming Research Yearbook: Simulations and Games for Strategy and Policy Planning, Saxon Graphics Ldt.