making the breakthrough
TRANSCRIPT

MAKING THE BREAKTHROUGHGreen hydrogen policies and technology costs
Highlights and excerpts from
GREEN HYDROGEN: A guide to
policy making
Green hydrogen cost reduction

2
© IRENA 2021
Unless otherwise stated, material in this publication may be freely used, shared, copied, reproduced, printed and/or stored, provided that appropriate acknowledgement is given of IRENA as the source and copyright holder. Material in this publication that is attributed to third parties may be subject to separate terms of use and restrictions, and appropriate permissions from these third parties may need to be secured before any use of such material.
Citation:
IRENA (2021), Making the breakthrough: Green hydrogen policies and technology costs, International Renewable Energy Agency, Abu Dhabi.
ISBN 978-92-9260-314-4
This document highlights key findings from:
• Green hydrogen: A guide to policy making (IRENA, 2020; ISBN 978-92-9260-286-4)
• Green hydrogen cost reduction: Scaling up electrolysers to meet the 1.5°C climate goal (IRENA, 2020; ISBN 978-92-9260-295-6)
About IRENA
The International Renewable Energy Agency (IRENA) serves as the principal platform for international co-operation, a centre of excellence, a repository of policy, technology, resource and financial knowledge, and a driver of action on the ground to advance the transformation of the global energy system. An intergovernmental organisation established in 2011, IRENA promotes the widespread adoption and sustainable use of all forms of renewable energy, including bioenergy, geothermal, hydropower, ocean, solar and wind energy, in the pursuit of sustainable development, energy access, energy security and low-carbon economic growth and prosperity. www.irena.org
Available for download: www.irena.org/publicationsFor further information or to provide feedback: [email protected]
Acknowledgements
The present overview benefited from multiple contributions, both by IRENA staff and by external experts. Policy guidance sections were prepared primarily by Emanuele Bianco and Herib Blanco under the guidance of Rabia Ferroukhi, while the electrolyser cost analysis was prepared by Emanuele Taibi, Herib Blanco and Raul Miranda, along with Marcelo Carmo (Forschungszentrum Jülich), under the guidance of Dolf Gielen and Roland Roesch. Other contributors and expert reviewers are acknowledged in IRENA’s original studies.
The Federal Ministry for Economic Affairs and Energy (BMWI) of the Federal Republic of Germany and the Ministry of Economy, Trade and Industry (METI) of Japan provided valuable support for IRENA’s research on green hydrogen.
Disclaimer
This publication and the material herein are provided “as is”. All reasonable precautions have been taken by IRENA to verify the reliability of the material in this publication. However, neither IRENA nor any of its officials, agents, data or other third-party content providers provides a warranty of any kind, either expressed or implied, and they accept no responsibility or liability for any consequence of use of the publication or material herein.
The information contained herein does not necessarily represent the views of all Members of IRENA. The mention of specific companies or certain projects or products does not imply that they are endorsed or recommended by IRENA in preference to others of a similar nature that are not mentioned. The designations employed and the presentation of material herein do not imply the expression of any opinion on the part of IRENA concerning the legal status of any region, country, territory, city or area or of its authorities, or concerning the delimitation of frontiers or boundaries.

3
While 2020 may be remembered for the tragic COVID-19 crisis, it was also an unprecedented
year for the global energy transition and the growing momentum of hydrogen technology.
Many countries, in aligning their pandemic response with longer-term goals, have announced
strategies to develop hydrogen as a key energy carrier. In parallel, numerous countries, cities
and companies have adopted net-zero targets for energy-related carbon dioxide emissions,
bringing the need for hydrogen to the forefront.
But not all types of hydrogen are compatible with sustainable, climate-safe energy use
or net-zero emissions. Only “green” hydrogen – produced with electricity from renewable
sources – fulfils these criteria, which also entail avoiding “grey” and hybrid “blue” hydrogen.
Green hydrogen uptake is essential for sectors like aviation, international shipping and heavy
industry, where energy intensity is high and emissions are hardest to abate.
Green hydrogen, however, is still not ready to take off without widespread and
co-ordinated support across the value chain. The Collaborative Framework on Green
Hydrogen, set up by the International Renewable Energy Agency (IRENA) in mid-2020,
offers a platform to strengthen support in co-operation with IRENA’s member countries
and partners.
The past two years have witnessed increased momentum, with around 20 countries
adopting a national hydrogen strategy or announcing their intention to do so. Industry
investors plan at least 25 gigawatts of electrolyser capacity for green hydrogen by 2026.
Still, far steeper growth is needed – in renewable power as well as green hydrogen capacity
– to fulfil ambitious climate goals and hold the rise in average global temperatures at
1.5 degrees Celsius.
Green hydrogen, on average, costs between two and three times more to make than blue
hydrogen, with the true potential and viability of the latter requiring further investigation.
With electricity input accounting for much of the production cost for green hydrogen, falling
renewable power costs will narrow the gap. Attention, meanwhile, must shift to the second-
largest cost component, electrolysers.
With larger production facilities, design standardisation and insights from early adopters,
the proposed strategies could cut costs by 40% in the short term and up to 80% in the long
term, this study finds.
In price terms, the resulting green hydrogen could fall below the USD 2 per kilogram mark –
low enough to compete – within a decade. This opens the way for large-scale manufacturing
capacity, new jobs and economic growth. But getting there depends on defining the right
business model, creating markets, and optimising the supply chain in a way that both
developed and developing countries, equally, can enjoy the transition to a clean, resilient
energy system.
IRENA stands ready to help countries worldwide, whatever their energy challenges or level
of economic development, make the leap.
FOREWORD
Francesco La CameraDirector-General, IRENA

4
MAKING THE BREAKTHROUGH
KEY FINDINGS 06
GREEN HYDROGEN AND CLIMATE GOALS 091.1 Electrolyser cost reduction 101.2 Cost reduction potential 121.3 Fostering innovation 15
STATUS, DRIVERS AND BARRIERS 172.1 Different shades of hydrogen 192.2 New drivers for green hydrogen 212.3 Barriers to green hydrogen uptake 24
ELECTROLYSER COSTS AND TECHNOLOGIES 263.1 Need for cost reduction 273.2 Technology characteristics 28
COST REDUCTION STRATEGIES 324.1 Stack level 324.2 System level 39
GUIDANCE FOR POLICY MAKERS 445.1 Policy pillars 445.2 Supporting policies 53
PROJECTS, MILESTONES AND ROLES 546.1 Green hydrogen project pipeline 546.2 Milestones 566.3 Stakeholder roles 58
WAY FORWARD 61
References 64Photo credits 66Abbreviations 67
2
3456
CONTENTS
1

5
Green hydrogen policies and technology costs
FIGURESFigure 1 How electrolyser scale-up drives down costs 08
Figure 2 Electricity and electrolysers: Potential to cut hydrogen costs by 80% 12
Figure 3 Electrolyser cost reduction by 2030 and 2050, based on IRENA scenarios 13
Figure 4 Green hydrogen production, conversion and end uses across the energy system 18
Figure 5 Main shades of hydrogen 19
Figure 6 Hydrogen production cost as a function of investment, electricity price and operating hours 26
Figure 7 Basic components of water electrolysers at different levels 30
Figure 8 Trade-offs between efficiency, durability and cost for electrolysers 31
Figure 9 Typical system design and balance of plant for an alkaline electrolyser 33
Figure 10 Cost breakdown by major component for alkaline electrolysers based on current costs 33
Figure 11 Cost breakdown for PEM electrolysers as a function of manufacturing scale (units of 1 MW per year) 43
Figure 12 Steps leading to the formulation of a national strategy 46
Figure 13 Recent hydrogen policies and strategies 48
Figure 14 Electrolyser capacity in national strategies versus climate-safe scenario for 2030 49
Figure 15 Main aspects and instruments mentioned in the EU hydrogen strategy 51
Figure 16 Ways to decarbonise end-use energy 52
Figure 17 Key barriers, and policies to address them, across the hydrogen value chain 53
Figure 18 Milestones for four cost reduction strategies across three stages of deployment for electrolysers 57
Figure 19 Main actions and functions for key stakeholders influencing green hydrogen uptake 60
TABLESTable 1 Key performance indicators for four electrolyser technologies today and in 2050 14
Table 2 Iridium and platinum loading for PEM electrolysers with increased performance and material reduction strategies 34
Table 3 Proposed activities to improve the performance of alkaline electrolysers 35
Table 4 Proposed activities to improve the performance of PEM electrolysers 36
Table 5 Proposed activities to improve the performance of AEM electrolysers 37
Table 6 Proposed activities to improve the performance of solid oxide electrolysers 38
Table 7 Key performance indicators for electroyser technologies 40
Table 8 Learning rate by stack component for three types of electrolysers 42
Table 9 Some key players involved in manufacturing water electrolyser systems 55
BOXESBox 1 Roles for green hydrogen in different energy transition scenarios 23
Box 2 Hydrogen emissions from grid-powered electrolysis 25
Box 3 The EU hydrogen strategy 50

6
KEY FINDINGS
Green hydrogen, produced by renewable power, can help eliminate carbon dioxide (CO2) emissions in challenging sectors like steel, chemicals, long-haul transport, shipping and aviation. Thanks to the decline in renewable power costs, hydrogen could become a cost-competitive clean energy carrier worldwide by 2030.
However, ongoing innovation and consistent policy attention are needed to make green hydrogen viable as part of a sustainable energy mix. Regulations, market design, and the costs of power and electrolyser production will all come into play.
The International Renewable Energy Agency (IRENA) has released two in-depth studies on how to scale up hydrogen production based on renewable power sources in time to meet climate goals:
• Green hydrogen: A guide to policy making (Nov 2020)
• Green hydrogen cost reduction: Scaling up electrolysers to meet the 1.5°C climate goal (Dec 2020)
As global economies strive for carbon neutrality, cost-competitive renewable hydrogen is possible within the decade.
Green hydrogen can cut emissions from heavy industry and transport

7
Green hydrogen policies and technology costs
The present overview encompasses key findings from the two studies. It aims to highlight the challenges and assist in the crucial decision making needed to cut production costs and bring green hydrogen into the energy mainstream.
As the world strives to cut greenhouse gas emissions and reach carbon neutrality by 2050, energy-intensive industries and transport present a major challenge. Emissions are especially hard to abate in sectors such as steelmaking and cement, aviation and long-haul shipping. Hydrogen based on renewables, or green hydrogen, has emerged as a vital clean energy carrier.
This is the only hydrogen type fully compatible with net-zero emission targets and sustainable, climate-safe energy use. Grey and hybrid blue hydrogen can also boost energy supply, but without eliminating fossil fuel use. Blue hydrogen, while cleaner than grey, still relies on carbon capture and storage (CCS).
Energy planning has recently started to include green hydrogen for several reasons:
• It results in no residual greenhouse gas emissions.
• It can increase system flexibility, particularly through seasonal storage, helping to integrate higher shares of solar and wind power.
• Although currently expensive, it will become more competitive due to rapidly falling costs for electricity from renewables. Solar photovoltaic (PV) and wind power costs have already declined 80% and 40%, respectively, in the last decade, with these trends expected to continue.
Hydrogen, meanwhile, can be converted into other energy carriers like methanol, ammonia and synthetic liquids for a broadening range of uses.
Green hydrogen now costs USD 4-6/kilogram (kg), 2-3 times more than grey hydrogen. The largest single cost driver is renewable electricity, which is becoming cheaper every year. But electricity itself is not the only factor to consider.
Electrolysers – which split water into hydrogen and oxygen – must also be scaled up and improved to make green hydrogen cost-competitive. Their costs, having fallen 60% since 2010, could fall another 40% in the short term and 80% in the longer term, the latest IRENA analysis indicates. Achieving these reductions hinges on innovation to improve electrolyser performance, scaling up manufacturing capacity, standardisation, and growing economies of scale.
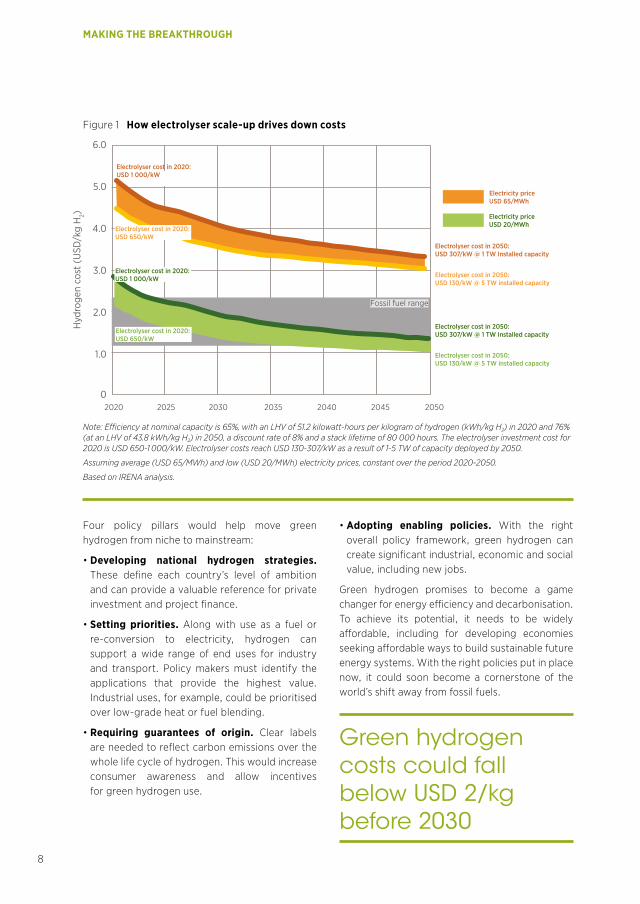
This could bring green hydrogen costs below the USD 2/kg mark – a crucial milestone for cost competitiveness – before 2030 (see Figure 1).
While renewable power keeps getting cheaper, electrolyser costs must also fall
8
MAKING THE BREAKTHROUGH
Four policy pillars would help move green hydrogen from niche to mainstream:
• Developing national hydrogen strategies. These define each country’s level of ambition and can provide a valuable reference for private investment and project finance.
• Setting priorities. Along with use as a fuel or re-conversion to electricity, hydrogen can support a wide range of end uses for industry and transport. Policy makers must identify the applications that provide the highest value. Industrial uses, for example, could be prioritised over low-grade heat or fuel blending.
• Requiring guarantees of origin. Clear labels are needed to reflect carbon emissions over the whole life cycle of hydrogen. This would increase consumer awareness and allow incentives for green hydrogen use.
• Adopting enabling policies. With the right overall policy framework, green hydrogen can create significant industrial, economic and social value, including new jobs.
Green hydrogen promises to become a game changer for energy efficiency and decarbonisation. To achieve its potential, it needs to be widely affordable, including for developing economies seeking affordable ways to build sustainable future energy systems. With the right policies put in place now, it could soon become a cornerstone of the world’s shift away from fossil fuels.
Green hydrogen costs could fall below USD 2/kg before 2030
Figure 1 How electrolyser scale-up drives down costs
Hyd
roge
n co
st (
USD
/kg
H2)
0
1.0
2.0
3.0
4.0
5.0
6.0
2020 2025 2030 2035 2040 2045 2050
Electrolyser cost in 2050: USD 130/kW @ 5 TW installed capacity
Electrolyser cost in 2050: USD 307/kW @ 1 TW Installed capacity
Fossil fuel range
Electrolyser cost in 2050: USD 130/kW @ 5 TW installed capacity
Electrolyser cost in 2050: USD 307/kW @ 1 TW Installed capacity
Electrolyser cost in 2020: USD 650/kW
Electrolyser cost in 2020: USD 1 000/kW
Electrolyser cost in 2020: USD 650/kW
Electrolyser cost in 2020: USD 1 000/kW
Electricity price USD 65/MWh
Electricity price USD 20/MWh
Note: Efficiency at nominal capacity is 65%, with an LHV of 51.2 kilowatt-hours per kilogram of hydrogen (kWh/kg H2) in 2020 and 76% (at an LHV of 43.8 kWh/kg H2) in 2050, a discount rate of 8% and a stack lifetime of 80 000 hours. The electrolyser investment cost for 2020 is USD 650-1 000/kW. Electrolyser costs reach USD 130-307/kW as a result of 1-5 TW of capacity deployed by 2050.
Assuming average (USD 65/MWh) and low (USD 20/MWh) electricity prices, constant over the period 2020-2050.
Based on IRENA analysis.

9
1 GREEN HYDROGEN AND CLIMATE GOALS
The challenge of climate change has prompted the need for rapid adoption of new technologies. The global community in 2015 committed to taking action to keep global temperature rise this century well below 2 degrees Celsius (°C ) in relation to pre-industrial levels. Growing numbers of countries are pledging to reach net-zero carbon dioxide (CO2) emissions by mid-century with the goal of limiting temperature rise to 1.5°C. Achieving the deep or full decarbonisation of economies will require concerted and wide-ranging action across all economic sectors.
The necessary emission reductions have barely begun. An estimated 8.8% less CO2 was emitted in the first six months of 2020 than in the same period in 2019, following the COVID-19 pandemic and the consequent lockdowns (Liu et al., 2020). But for continued long-term reduction, the need for structural and transformational changes in our global energy production, consumption and underlying socio-economic systems cannot be understated.
Dramatic emission reductions will be both technologically feasible and economically affordable. IRENA’s Global Renewables Outlook offers viable options for reaching net-zero emissions in the 2050-2060 time frame. The Deeper Decarbonisation Perspective suggests possibilities for accelerated action to reduce CO2 emissions while bringing an economic payback of between USD 1.5 and USD 5 for every USD 1 spent on the energy transition (IRENA, 2020a).
The energy transformation requires a major shift in electricity generation from fossil fuels to renewable sources like solar and wind, greater energy efficiency, and the widespread electrification of energy uses, from cars to heating and cooling in buildings. Still, not all sectors or industries can easily make the switch from fossil fuels to electricity. Hard-to-electrify (and therefore hard-to-abate) sectors include steel, cement, chemicals, long-haul road transport, maritime shipping and aviation (IRENA, 2020b).
Green hydrogen can provide a link between growing renewable electricity generation and sectors where emissions are hardest to abate (IRENA, 2018). Hydrogen in general is a suitable energy carrier for applications remote from electricity grids or that require a high energy density, and it can serve as a feedstock for chemical reactions to produce a range of synthetic fuels and feedstocks.
Green hydrogen brings other, system-wide benefits. These include potential for additional system flexibility and storage, which support further deployment of variable renewable energy (VRE); contribution to energy security; reduced air pollution; and other socio-economic benefits such as economic growth and job creation, and industrial competitiveness.

10
MAKING THE BREAKTHROUGH
1 In the context of decarbonisation, hydrogen produced from fossil fuels without capturing most of the CO2 emissions does not fulfil the criteria of renewable energy, although it represents the vast majority of hydrogen production today.
2 The trend over the last decade of falling renewable electricity prices is expected to continue; 82%, 47% and 39% for solar photovoltaic (PV), offshore and onshore wind respectively (IRENA, 2020c).
Yet key barriers must be addressed to realise the full potential of green hydrogen. Chief among those is cost. Overcoming the barriers and transitioning green hydrogen from a niche player to a widespread energy carrier will require dedicated policy in each of the stages of technology readiness, market penetration and market growth.
An integrated policy approach is needed. This can help reduce initial resistance and reach the minimum threshold for market penetration, resting on four central pillars: building national hydrogen uptake strategies, identifying policy priorities, establishing a governance system and enabling policies, and creating a system for guarantee of origin for green hydrogen.
As more countries pursue deep decarbonisation strategies, hydrogen will have a critical role to play. This will be particularly so where direct electrification is challenging and in harder-to-abate sectors, such as steel, chemicals, long-haul transport, shipping and aviation. In this context, hydrogen needs to be low carbon from the outset and ultimately green (produced by electrolysis of water using renewable electricity).
In addition to regulations and market design, the cost of production is a major barrier to the uptake of green hydrogen. Costs are falling – due largely to falling renewable power costs – but green hydrogen is still 2-3 times more expensive than blue hydrogen (produced from fossil fuels with CCS), and further cost reductions are needed.1
The largest single cost component for on-site production of green hydrogen is the cost of the renewable electricity needed to power the electrolyser unit. This renders production of green hydrogen more expensive than blue hydrogen, regardless of the cost of the electrolyser.
A low cost of electricity is therefore a necessary condition to produce competitive green hydrogen. This creates an opportunity to produce hydrogen at locations around the world that have optimal renewable resources, in order to achieve competitiveness.2
Low electricity cost is not enough by itself for competitive green hydrogen production, however. Reductions are also needed in the cost of electrolysis facilities.
This is the second-largest cost component of green hydrogen production. The potential exists to reduce investment costs for electrolysis plants by 40% in the short term and 80% in the long term.
1.1 ELECTROLYSER COST REDUCTION
Key strategies to reduce electrolyser costs range from the fundamental design of the electrolyser stack to broader system-wide elements, including:
• Electrolyser design and construction: Increased module size and innovation with increased stack manufacturing have significant impacts on cost. Increasing the plant from 1 megawatt (MW) (typical today) to 20 MW could reduce costs by over a third. Cost, however, is not the only factor influencing plant size, as each technology has its own stack design, which also varies among manufacturers. The optimal system design also depends on the application that drives system performance in aspects such as efficiency and flexibility.
• Economies of scale: Increasing stack production through automated processes in gigawatt-scale manufacturing facilities can achieve a step-change cost reduction. At lower manufacture rates, the stack is about 45% of the total cost, yet at higher production rates, it can go down to 30%. For polymer electrolyte membrane (PEM) electrolysers, the tipping point seems to be around 1 000 units (of 1 MW) per year, where this scale-up allows an almost 50% cost reduction in stack manufacturing. The cost of the surrounding plant is as important as the electrolyser stack, and savings can be achieved through standardisation of system components and plant design.

11
Green hydrogen policies and technology costs
• Procurement of materials: Scarce materials can represent a barrier to electrolyser cost and scale-up. Current production of iridium and platinum for PEM electrolysers will only support an estimated 3 gigawatts (GW) to 7.5 GW of annual manufacturing capacity, compared to an estimated annual manufacturing requirement of around 100 GW by 2030. Solutions that avoid the use of such materials are already being implemented by leading alkaline electrolyser manufacturers, however, and technologies exist to significantly reduce the requirements for such materials in PEM electrolysers. Anion exchange membrane (AEM) electrolysers do not need scarce materials in the first place.
• Efficiency and flexibility in operations: Power supply represents large efficiency losses at low load, limiting system flexibility, from an economic perspective. A modular plant design with multiple stacks and power supply units can address this problem. Compression could also represent a bottleneck for flexibility, since it might not be able to change its production rate as quickly as the stack. One alternative to deal with this is an integrated plant design with enough capacity to deal with variability of production through optimised and integrated electricity and hydrogen storage. Green hydrogen production can provide significant flexibility for the power system, if the value of such services is recognised and remunerated adequately. Where hydrogen will play a key role in terms of flexibility, as it does not have any significant alternative sources to compete with, will be in the seasonal storage of renewables. Although this comes at significant efficiency losses, it is a necessary cornerstone for achieving 100% renewable generation in power systems with heavy reliance on variable resources, such as solar and wind.
• Industrial applications: Electrolysis system design and operation can be optimised for specific applications. These can range from: large industry users requiring a stable supply and with low logistics costs; large-scale, off-grid facilities with access to low-cost renewables, but that incur significant costs to deliver hydrogen to the end user; and decentralised production that requires small modules for flexibility, which compensate for higher investment per unit of electrolyser capacity with reduced (or near-zero on-site) logistic costs.
• Learning rates: Several studies show that potential learning rates for fuel cells and electrolysers are similar to solar PV and can reach values between 16% and 21%. This is significantly lower than the 36% learning rates experienced over the last 10 years for PV (IRENA, 2020c). With such learning rates and a deployment pathway in line with a 1.5°C climate target, a reduction in the cost of electrolysers of over 40% may be achievable by 2030.
Up to 85% of green hydrogen production costs can be reduced in the long term by a combination of cheaper electricity and lower electrolyser capital costs, along with increased efficiency and optimised electrolyser operation (see Figure 2).

12
MAKING THE BREAKTHROUGH
1.2 COST REDUCTION POTENTIAL In the best-case scenario, green hydrogen can already be produced at costs competitive with blue hydrogen today. This is possible using low-cost renewable electricity, i.e., around USD 20 per megawatt-hour (MWh). The potential exists for green hydrogen cost reduction to varying degrees between 2020 and 2050, depending on electrolyser costs and deployment levels.
Cost reductions of 60% could be achieved by 2030 through a combination of manufacturing scale, learning rate, technological improvements and increased module size (Hydrogen Council, 2020).
Figure 3 illustrates IRENA's scenarios for electrolyser cost reduction by 2030 and 2050.
A low electricity price is essential for the production of competitive green hydrogen, cost reductions in electrolysers cannot compensate for high electricity prices. Combined with low electricity cost, an aggressive electrolyser deployment pathway3 can make green hydrogen cheaper than low-carbon alternatives (i.e., < USD 1/kg), in markets with low electrolyser costs, before 2040.
If rapid scale-up takes place in the next decade, green hydrogen is expected to start becoming competitive with blue hydrogen by 2030 in a wide range of countries – e.g., those with electricity prices of USD 30/MWh – and in applications.
Today’s cost and performance are not the same for all electrolyser technologies (see Table 1).
Note: ‘Today’ captures best and average conditions. ‘Average’ signifies an investment of USD 770/kilowatt (kW), efficiency of 65% (lower heating value – LHV), an electricity price of USD 53/MWh, full load hours of 3 200 (onshore wind) and a weighted average cost of capital (WACC) of 10% (relatively high risk). ‘Best’ signifies investment of USD 130/kW, efficiency of 76% (LHV), electricity price of USD 20/MWh, full load hours of 4 200 (onshore wind) and a WACC of 6% (similar to renewable electricity today).
Based on IRENA analysis
Figure 2 Electricity and electrolysers: Potential to cut hydrogen costs by 80%
3 Meaning 5 terawatts (TW) of installed capacity by 2050.
0
1
2
3
4
5
6
Hyr
ogen
pro
duct
ion
cost
(U
SD/k
gH2)
TODAY FUTURE80
% reduc
tion i
n
electr
olyser
cost
Full l
oad ho
urs
from 32
00 to 420
0 hour
s
Lifet
ime o
f elec
trolys
ers
from 10
to 20
year
s
WACC fr
om 10% to
6%
Electri
city c
ost
from 53
to 20
USD
/MW
h
Electro
lyser
e�cie
ncy
from 65%
to 76
% (LHV)

13
Green hydrogen policies and technology costs
Alkaline and PEM electrolysers are the most advanced and already commercial, while each technology has its own competitive advantage.
Alkaline electrolysers have the lowest installed cost, while PEM electrolysers have a much smaller footprint, combined with higher production rate and output pressure.
Meanwhile, solid oxide has the highest electrical efficiency. As the cell stack is only part of the electrolyser facility footprint, a reduced stack footprint of around 60% for PEM compared to alkaline translates into a 20%-24% reduction in the facility footprint, with an estimated footprint of 8 hectares (ha) – 13 ha for a 1 GW facility using PEM, compared to between 10 ha and 17 ha using alkaline (ISPT, 2020).
Gaps in cost and performance are expected to narrow over time as innovation and mass deployment of different electrolysis technologies drive convergence towards similar costs.
The wide range in system costs is expected to remain, however, as this is very much dependent on the scale, application and scope of delivery. For instance, a containerised system inside an existing facility with existing power supply is significantly lower cost than a new building in a plot of land to be purchased, with a complete water and electricity supply system included, high-purity hydrogen for fuel cell applications and high-output pressure.
Normally, numbers for system costs include not only the cell stack, but also the balance of stacks, power plant rectifiers, the hydrogen purification system, water supply and purification, cooling and commissioning – yet exclude shipping, civil works and site preparations.
Notes: 1 TW of installed capacity by 2050 is about 1.2 TW of cumulative capacity due to lifetime and replacement. Similarly, 5 TW by 2050 is equivalent to 5.48 TW of cumulative capacity deployed.
Based on IRENA analysis.
Figure 3 Electrolyser cost reduction by 2030 and 2050, based on IRENA scenarios
450
400
350
300
200
150
100
250
600
550
500
0 1 000 2 000 3 000 4 000 5 000 6 000
Elec
trol
yser
cos
t (U
SD/k
Wel)
Cost curve electrolysers
IRENA - Planned Energy Scenario 2030
IRENA - Transforming Energy Scenario - 2030
>_ 1 TW of installed capacity by 2050
>_ 5 TW of installed capacity by 2050

14
MAKING THE BREAKTHROUGH
Notably, the 2020 numbers are cost estimates for a system ordered in 2020, given the lowest price possible (on the limit of zero profit). As the market scales up rapidly in the initial phase, the investment in manufacturing facilities must be recovered based on falling production costs.
Therefore the gap between cost and price is currently higher than it will be 10 or 20 years from now. As a reference, an estimated investment of EUR 45 million to EUR 69 million (about USD 54 million to USD 83 million) is needed per gigawatt of manufacturing capacity (Cihlar et al., 2020).
2020 2050Alkaline PEM AEM SOEC Alkaline PEM AEM SOEC
Cell pressure [bar] < 30 < 70 < 35 < 10 > 70 > 70 > 70 > 20
Efficiency (system) [kWh/kgH2]
50-78 50-83 57-69 45-55 < 45 < 45 < 45 < 40
Lifetime [thousand hours]
60 50-80 > 5 < 20 100 100-120 100 80
Capital costs estimate for large stacks
(stack-only, > 1 MW) [USD/kWel]
270 400 - > 2 000 < 100 < 100 < 100 < 200
Capital cost range estimate for
the entire system, >10 MW
[USD/kWel]
500-
1 000
700-
1 400
- - < 200 < 200 < 200 < 300
Table 1 Key performance indicators for four electrolyser technologies today and in 2050
Note: PEM = polymer electrolyte membrane (commercial technology); AEM = anion exchange membrane (lab-scale today); SOEC = solid oxide electrolysers (lab-scale today).
Based on IRENA analysis.

15
Green hydrogen policies and technology costs
1.3 FOSTERING INNOVATION Innovation is crucial to reduce cost and improve the performance of electrolysers. The ultimate goals are to: 1) reduce cost by standardising and simplifying manufacturing and design to allow for industrialisation and scale-up; 2) improve efficiency to reduce the amount of electricity required to produce one unit of hydrogen; and 3) increase durability to extend the equipment lifetime and spread the cost of the electrolyser facility over a larger hydrogen production volume.
Governments can drive further innovation in electrolysers by issuing clear long-term policy signals on:
• Facilitating investment in production, logistics and utilisation of green hydrogen, including all areas that will help this low-carbon energy carrier to become competitive; technology cost and performance improvements, material supply, business models and trading using common standards and certifications.
• Establishing regulations and designing markets that support investments in innovation and help scale up the production of green hydrogen. This includes approaches such as setting manufacturing or deployment targets, tax incentives, mandatory quotas in hard-to-decarbonise sectors and other de-risking mechanisms, while enabling new business models that can guarantee predictable revenues for the private sector to invest at scale.
• Supporting ongoing research, development and demonstration (RD&D) to: reduce the use of iridium and platinum in the manufacture of PEM electrolysers; transition all alkaline units to be platinum- and cobalt-free; and, in general, mandate reduced scarce materials utilisation as a condition for manufacturing scale-up.
• Fostering co-ordination and common goals along the hydrogen value chain, across borders, across relevant sectors and among stakeholders.

16
MAKING THE BREAKTHROUGH
The recent green hydrogen studies complement a range of work aimed at providing analytical insights and outlining options to accelerate the energy transition.
The Global Renewables Outlook (IRENA, 2020a) provides detailed global and regional roadmaps for emission reductions alongside assessment of the socio-economic implications. The 2020 edition includes the Deeper Decarbonisation Perspective, detailing options for net-zero or zero emissions. The next edition will provide further analysis of a pathway consistent with a 1.5°C goal.
Building on that technical and socio-economic assessment, the International Renewable Energy Agency (IRENA) has continued assessing specific facets of that pathway, including the policy and financial frameworks needed.
This includes the roles of direct and indirect electrification, the implications for power systems, the role of green hydrogen and of biomass, and options for specific, challenging end-use sectors.
Other publications relevant to green hydrogen strategies include: Hydrogen: A renewable energy perspective (IRENA, 2019a); Reaching zero with renewables (IRENA, 2020b) and Renewable energy policies in a time of transition: Heating and cooling (IRENA, IEA and REN21, 2020).
IRENA also continues to convene experts and stakeholders through Innovation Weeks, Policy Days and Policy Talks as well as through the Collaborative Framework on Green Hydrogen, which brings together a broad range of member states and other stakeholders to exchange knowledge and experience.
RECENT STUDIES ON GREEN HYDROGEN AND DEEP DECARBONISATION
GLOBAL RENEWABLES OUTLOOK
2050ENERGY TRANSFORMATION
E D I T I O N : 2 0 2 0
GREEN HYDROGEN
COST REDUCTION
SCALING UP ELECTROLYSERS
TO MEET THE 1.5°C CLIMATE GOALH2 O2

17
Green hydrogen policies and technology costs
2H
Henry Cavendish discovered the element in
1766The first industrial water electrolyser was built in
1888
Most abundant chemical structure in the universe
1.01Hydrogen
STATUS, DRIVERS AND BARRIERS
H2OH2
O
Hydrogen means water (hydro-) creator (-gen): its combustion releases only water H
• Hydrogen is already in widespread use, mainly as an industrial feedstock for methanol and ammonia. It is produced mostly from natural gas and coal, which account for more than 95% of pure hydrogen production today.
• Green hydrogen is the only type of hydrogen compatible with a long-term sustainable energy system. To differentiate this from other pathways, a certification scheme is needed to track greenhouse gas (GHG) emissions across the entire value chain. This should reflect life-cycle emissions in a standard taxonomy with clear boundaries and thresholds.
• Recent interest in hydrogen, unlike previous waves, is driven by a competitive renewable electricity supply (already available), the focus on net-zero energy systems and growing recognition of hydrogen’s versatility. These factors have prompted support from a wide range of stakeholders.
• Major challenges remain: prohibitive costs across the value chain; infrastructure gaps, from pipe-lines to storage and shipping; and energy losses requiring more power uptake. As a new energy carrier for many applications, hydrogen is not yet included in most current policy frameworks.
KEY
PO
INTS

18
MAKING THE BREAKTHROUGH
Figure 4 Green hydrogen production, conversion and end uses across the energy system
Source: IRENA (2020f).
Note: N2 = nitrogen; NH3 = ammonia
* The term synthetic fuels refers here to a range of hydrogen-based fuels produced through chemical processes with a carbon source (carbon monoxide (CO) and CO2 captured from emission streams, biogenic sources or directly from the air). They include methanol, jet fuels, meth-ane and other hydrocarbons. The main advantage of these fuels is that they can be used to replace their fossil fuel-based counterparts and in many cases be used as direct replacements – that is, as drop-in fuels. Synthetic fuels produce carbon emissions when combusted, but if their production process consumes the same amount of CO2, in principle it allows them to have net-zero carbon emissions.
Renewableenergy
Electrolysis
SustainableCO2 capture
Storage
Pipeline
Steel industry
Chemical industry
Refineries
Trucks
Shipping
Greenammonia
Synthetic fuels*
2
2
2
2
2
2
2
CO2
N2 2
INDUSTRY
POWERGENERATION
HEATING
Shipping
Aviation
Cars
Rail
Trucks
Buses
TRANSPORT
PRODUCTION FURTHERPROCESSING END USE
WITHOUT TRANSFORMATION
WITH TRANSFORMATION
TRANSFORMATION
NH3
TRANSPORT
NH3
Green hydrogen is an energy carrier that can be used in many applications (see Figure 4). However, its actual use is still very limited. Each year around 120 million tonnes of hydrogen are produced globally, of which two-thirds are pure hydrogen and one-third is in a mixture with other gases (IRENA, 2019a).
Hydrogen output is mostly used for crude oil refining and for ammonia and methanol synthesis, which together represent almost 75% of the combined pure and mixed hydrogen demand.
Today’s hydrogen production is mostly based on natural gas and coal, which together account for 95% of production. Electrolysis produces around 5% of global hydrogen, as a by-product of chlorine production. Currently, there is no significant hydrogen production from renewable sources: green hydrogen has been limited to demonstration projects (IRENA, 2019a).

19
Green hydrogen policies and technology costs
2.1 DIFFERENT SHADES OF HYDROGENHydrogen can be produced with multiple processes and energy sources; a colour code nomenclature is becoming commonly used to facilitate discussion (see Figure 5). Policy makers should use an objective measure of impact based on life-cycle greenhouse gas (GHG) emissions, especially since there might be cases that do not fully fall under one colour (e.g., mixed hydrogen sources, electrolysis with electricity from the grid).
Colour
Process
Source
TURQUOISE GREEN
Pyrolysis Electrolysis
GREY
SMR or gasification
Methane or coal Methane
BLUEHYDROGEN HYDROGENHYDROGEN HYDROGEN
SMR or gasificationwith carbon capture (85-95%)
Methane or coal Renewableelectricity
*
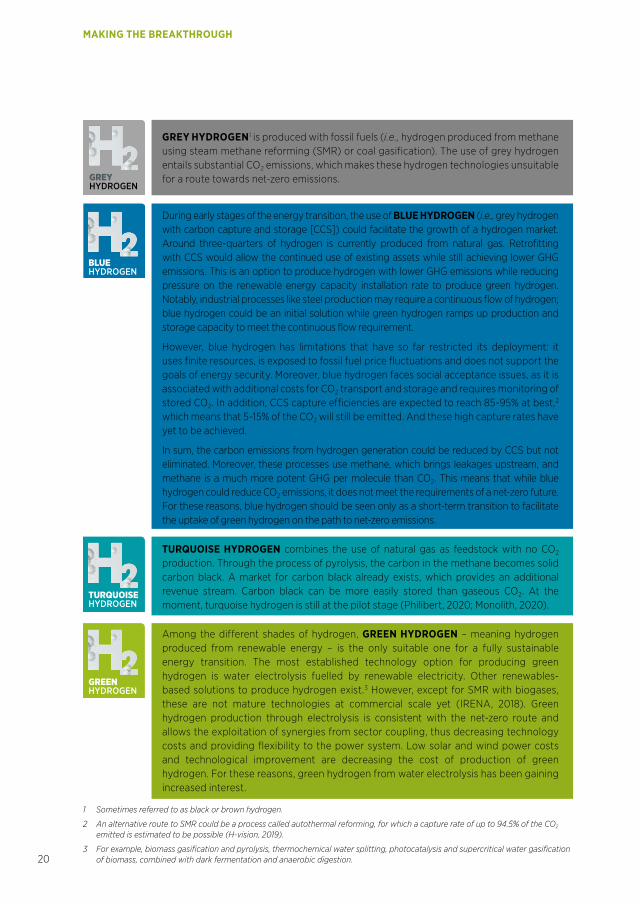
Figure 5 Main shades of hydrogen
Note: SMR = steam methane reforming.
* Turquoise hydrogen is an emerging decarbonisation option.
20
MAKING THE BREAKTHROUGH
GREY HYDROGEN1 is produced with fossil fuels (i.e., hydrogen produced from methane using steam methane reforming (SMR) or coal gasification). The use of grey hydrogen entails substantial CO2 emissions, which makes these hydrogen technologies unsuitable for a route towards net-zero emissions.
During early stages of the energy transition, the use of BLUE HYDROGEN (i.e., grey hydrogen with carbon capture and storage [CCS]) could facilitate the growth of a hydrogen market. Around three-quarters of hydrogen is currently produced from natural gas. Retrofitting with CCS would allow the continued use of existing assets while still achieving lower GHG emissions. This is an option to produce hydrogen with lower GHG emissions while reducing pressure on the renewable energy capacity installation rate to produce green hydrogen. Notably, industrial processes like steel production may require a continuous flow of hydrogen; blue hydrogen could be an initial solution while green hydrogen ramps up production and storage capacity to meet the continuous flow requirement.
However, blue hydrogen has limitations that have so far restricted its deployment: it uses finite resources, is exposed to fossil fuel price fluctuations and does not support the goals of energy security. Moreover, blue hydrogen faces social acceptance issues, as it is associated with additional costs for CO2 transport and storage and requires monitoring of stored CO2. In addition, CCS capture efficiencies are expected to reach 85-95% at best,2 which means that 5-15% of the CO2 will still be emitted. And these high capture rates have yet to be achieved.
In sum, the carbon emissions from hydrogen generation could be reduced by CCS but not eliminated. Moreover, these processes use methane, which brings leakages upstream, and methane is a much more potent GHG per molecule than CO2. This means that while blue hydrogen could reduce CO2 emissions, it does not meet the requirements of a net-zero future. For these reasons, blue hydrogen should be seen only as a short-term transition to facilitate the uptake of green hydrogen on the path to net-zero emissions.
TURQUOISE HYDROGEN combines the use of natural gas as feedstock with no CO2 production. Through the process of pyrolysis, the carbon in the methane becomes solid carbon black. A market for carbon black already exists, which provides an additional revenue stream. Carbon black can be more easily stored than gaseous CO2. At the moment, turquoise hydrogen is still at the pilot stage (Philibert, 2020; Monolith, 2020).
Among the different shades of hydrogen, GREEN HYDROGEN – meaning hydrogen produced from renewable energy – is the only suitable one for a fully sustainable energy transition. The most established technology option for producing green hydrogen is water electrolysis fuelled by renewable electricity. Other renewables-based solutions to produce hydrogen exist.3 However, except for SMR with biogases, these are not mature technologies at commercial scale yet (IRENA, 2018). Green hydrogen production through electrolysis is consistent with the net-zero route and allows the exploitation of synergies from sector coupling, thus decreasing technology costs and providing flexibility to the power system. Low solar and wind power costs and technological improvement are decreasing the cost of production of green hydrogen. For these reasons, green hydrogen from water electrolysis has been gaining increased interest.
1 Sometimes referred to as black or brown hydrogen.
2 An alternative route to SMR could be a process called autothermal reforming, for which a capture rate of up to 94.5% of the CO2 emitted is estimated to be possible (H-vision, 2019).
3 For example, biomass gasification and pyrolysis, thermochemical water splitting, photocatalysis and supercritical water gasification of biomass, combined with dark fermentation and anaerobic digestion.
TURQUOISE GREENGREY BLUEHYDROGEN HYDROGENHYDROGEN HYDROGEN
GREYHYDROGEN
TURQUOISE GREENGREY BLUEHYDROGEN HYDROGENHYDROGEN HYDROGEN
BLUEHYDROGEN
TURQUOISE GREENGREY BLUEHYDROGEN HYDROGENHYDROGEN HYDROGEN
TURQUOISEHYDROGEN
TURQUOISE GREENGREY BLUEHYDROGEN HYDROGENHYDROGEN HYDROGEN
GREENHYDROGEN

21
Green hydrogen policies and technology costs
2.2 NEW DRIVERS FOR GREEN HYDROGEN
There have been several waves of interest in hydrogen in the past. These were mostly driven by oil price shocks, concerns about peak oil demand or air pollution, and research on alternative fuels. Hydrogen can contribute to energy security by providing another energy carrier with different supply chains, producers and markets; this can diversify the energy mix and improve the resilience of the system.
Hydrogen can also reduce air pollution when used in fuel cells, with no emissions other than water. Its uptake promotes economic growth and job creation given the large investment needed to develop hydrogen as an energy carrier from an industrial feedstock.
As a result, more and more energy scenarios are giving green hydrogen a prominent role, albeit with significantly different volumes of penetration (see Box 1). The new wave of interest is focused on delivering low-carbon solutions and additional benefits that only green hydrogen can provide. The drivers for green hydrogen include:
Low solar and wind electricity costs. The major cost driver for green hydrogen is the cost of electricity. The price of
electricity procured from solar PV and onshore wind plants has decreased substantially in the last decade. In 2018, solar energy was contracted at a global average price of USD 56/MWh, compared with USD 250/MWh in 2018. Onshore wind prices also fell during that period, from USD 75/MWh in 2010 to USD 48/MWh in 2018 (IRENA, 2019b). New record-low prices were marked in 2019 and 2020 around the world: solar PV was contracted at USD 13.12/MWh in Portugal (Morais, 2020) and USD 13.5/MWh in the United Arab Emirates (Abu Dhabi) (Shumkov, 2020); onshore wind was contracted at USD 21.3/MWh in Saudi Arabia (Masdar, 2019), while in Brazil, prices ranged between USD 20.5 and 21.5/MWh (BNEF, 2019). With the continuously decreasing costs of solar PV and wind electricity, the production of green hydrogen is increasingly economically attractive.
Technologies ready for scale-up. Many of the components in the hydrogen value chain have already been deployed on a
small scale and are ready for commercialisation, now requiring investment to scale up. The capital cost of electrolysis has fallen by 60% since 2010 (Hydrogen Council, 2020), resulting in a decrease in hydrogen cost from a range of USD 10-15/kg to as low as USD 4-6/kg in that period.
Many strategies exist to bring down costs further and support the wider adoption of hydrogen (IRENA, 2020d). The cost of fuel cells4 for vehicles has decreased by at least 70% since 2006 (US DOE, 2017).
While some technologies (such as ammonia-fuelled ships) are yet to be demonstrated at scale (IRENA, 2020b), scaling up green hydrogen could make those pathways increasingly cost-effective and attractive.
4 Fuel cells use the same principles as an electrolyser, but in the opposite direction, for converting hydrogen and oxygen into water in a process that produces electricity. Fuel cells can be used for stationary applications (e.g., centralised power generation) or distributed applications (e.g., fuel cell electric vehicles). Fuel cells can also convert other reactants, such as hydrocarbons, ethers or alcohols.
2.
1.

22
MAKING THE BREAKTHROUGH
Benefits for the power system. As the share of solar and wind power, or variable renewable energy (VRE), rapidly
increases in various markets around the world, the power system will need more flexibility. The electrolysers used to produce green hydrogen can be designed as flexible resources that can quickly ramp up or down to compensate for fluctuations in VRE production, by reacting to electricity prices (Eichman et al., 2014). Green hydrogen can be stored for long periods, and can be used in periods when VRE is not available for power generation with stationary fuel cells or hydrogen-ready gas turbines. Flexible resources can reduce VRE curtailment, stabilise wholesale market prices and reduce the hours with zero or below-zero electricity prices (or negative price), which increases the investment recovery for renewable generators and facilitates their expansion. Finally, hydrogen is suitable for long-term, seasonal energy storage, complementing pumped-storage hydropower plants. Green hydrogen thus supports the integration of higher shares of VRE into the grid, increasing system efficiency and cost-effectiveness.
Government aims to create net-zero energy systems. By mid-2020, seven countries had already adopted net-
zero GHG emission targets in legislation, and 15 others had proposed similar legislation or policy documents. In total, more than 120 countries have announced net-zero emission goals (WEF, 2020). Among them is China, the largest GHG emitter, which recently pledged to cut its net carbon emissions to zero within 40 years. While these net-zero commitments have still to be transformed into practical actions, they will require cutting emissions in the “hard-to-abate” sectors where green hydrogen can play an important role.
Broader use of hydrogen. Previous waves of interest in hydrogen were focused mainly on expanding its use in
fuel-cell electric vehicles (FCEVs). In contrast, the new interest covers many possible green hydrogen uses across the entire economy, including the additional conversion of hydrogen to other energy carriers and products, such as ammonia, methanol and synthetic liquids. These uses can increase the future demand for hydrogen and can take advantage of possible synergies to decrease costs in the green hydrogen value chain. Green hydrogen can, in fact, improve industrial competitiveness, not only for the countries that establish technology leadership in its deployment, but also by providing an opportunity for existing industries to have a role in a low-carbon future. Countries with large renewable resources could derive major economic benefits by becoming net exporters of green hydrogen in a global green hydrogen economy.
Interest among multiple stakeholders. As a result of all the above points, interest in hydrogen is now widespread in both
public and private institutions. These include energy utilities, steel makers, chemical companies, port authorities, car and aircraft manufacturers, shipowners and airlines, multiple jurisdictions and countries aiming to use their renewable resources for export or to use hydrogen to improve their own energy security. These many players have also created partnerships and ongoing initiatives to foster collaboration and co-ordination of efforts.6
Yet green hydrogen uptake continues to face various barriers.
4.
5.3.
6.
5 System flexibility is here defined as the ability of the power system to match generation and demand at any time scale.
6 The Hydrogen Council is an example of a private initiative. Launched in 2017, it includes over 90 member companies positioned across the supply chain. The Hydrogen Initiative under the Clean Energy Ministerial is an example of a public initiative, where nine countries and the European Union (EU) are collaborating to advance hydrogen. The Fuel Cell and Hydrogen Joint Undertaking is an example of private-public partnership in the EU.

23
Green hydrogen policies and technology costs
Box 1 Roles for green hydrogen in different energy transition scenarios
The role given to green hydrogen in existing regional and global energy transition scenarios differs greatly due to a number of factors.
First, not all scenarios aim for the same GHG reduction target. The more ambitious the GHG reduction target, the greater is the amount of green hydrogen expected in the system. For low levels of decarbonisation, renewable power and electrification might be enough. But with deeper decarbonisation targets, green hydrogen would play a larger role in the future energy mix.
Second, not all scenarios rely on the same set of enabling policies. The removal of fossil fuel subsidies, for example, would increase the space for carbon-free solutions.
Third, the technology options available vary among scenarios. Scenarios that give greater weight to the social, political and sustainability challenges of nuclear, carbon capture, use and storage, and bioenergy anticipate limited contributions from those technologies to the energy transition, and thus require greater green hydrogen use.
Fourth, the more end uses for green hydrogen included in a scenario, the higher the hydrogen use will be. Scenarios that cover all hydrogen applications and downstream conversion to other energy carriers and products provide more flexibility in ways to achieve decarbonisation. More hydrogen pathways also help create larger economies of scale and faster deployment, leading to a virtuous circle of increasing both demand and supply.
Finally, cost assumptions, typically input data including capital and operating costs (Quarton et al., 2020) differ among scenarios. Those with the highest ambitions for hydrogen deployment are those with the most optimistic assumptions for cost reduction.
For all these reasons, the role of green hydrogen varies widely among scenarios. However, as more and more scenarios are being developed to reach zero or net-zero emissions, green hydrogen is more prominently present in scenarios and public discourse.

24
MAKING THE BREAKTHROUGH
2.3 BARRIERS TO GREEN HYDROGEN UPTAKE
Certain barriers apply to all shades of hydrogen. These include a lack of dedicated infrastructure (e.g., transport and storage facilities). Others relate mainly to the production stage of electrolysis for green hydrogen (e.g., energy losses, lack of value recognition, challenges ensuring sustainability and high production costs).
HIGH PRODUCTION COSTS. Green hydrogen produced using electricity from an average VRE plant in 2019 would be two
to three times more expensive than grey hydrogen. In addition, adopting green hydrogen technologies for end uses can be expensive. Vehicles with fuel cells and hydrogen tanks cost at least 1.5 to 2 times more than their fossil fuel counterparts (NREL, 2020). Similarly, synthetic fuels for aviation are today, even at the best sites in the world, up to eight times more expensive than fossil jet fuel (IRENA, 2019a).
LACK OF DEDICATED INFRASTRUCTURE. Hydrogen has to date been produced close to where it is used, with limited
dedicated transport infrastructure. There are only about 5 000 kilometres of hydrogen transmission pipelines around the world (Hydrogen Analysis Resource Center, 2016), compared with more than 3 million kilometres for natural gas. There are 470 hydrogen refuelling stations around the world (AFC TCP, 2020), compared with more than 200 000 petrol and diesel refuelling stations in the United States and the EU. Natural gas infrastructure could be repurposed for hydrogen (IRENA, IEA and REN21, 2020), but not all regions of the world have existing infrastructure. Conversely, synthetic fuels made from green hydrogen may be able to use existing infrastructure, although it might need to be expanded.
ENERGY LOSSES. Green hydrogen incurs significant energy losses at each stage of the value chain. About 30-35% of the
energy used to produce hydrogen through electrolysis is lost (IRENA, 2020d). In addition, the conversion of hydrogen to other carriers (such as ammonia) can result in 13-25% energy loss, and transporting hydrogen requires additional energy inputs, which are typically equivalent to 10-12% of the energy of the hydrogen itself (BNEF, 2020; Staffell et al., 2018; Ikäheimo et al., 2017). Using hydrogen in fuel cells can lead to an additional 40-50% energy loss.
The total energy loss will depend on the final use of hydrogen. The higher the energy losses, the more renewable electricity capacity is needed to produce green hydrogen. The key issue, however, is not the total capacity needed, since global renewable potential entails higher orders of magnitude than hydrogen demand, and green hydrogen developers are likely to first select areas with abundant renewable energy resources. The key issue is whether the annual pace of development of the solar and wind potential will be fast enough to meet the needs for both the electrification of end uses and the development of a global supply chain in green hydrogen, and the cost that this additional capacity will entail.
LACK OF VALUE RECOGNITION. There is no green hydrogen market, no green steel, no green shipping fuel and basically
no valuation of the lower GHG emissions that green hydrogen can deliver. Hydrogen is not even counted in official energy statistics of total final energy consumption, and there are no internationally recognised ways of differentiating green from grey hydrogen. At the same time, the lack of targets or incentives to promote the use of green products inhibits many of the possible downstream uses for green hydrogen. This limits the demand for green hydrogen.
NEED TO ENSURE SUSTAINABILITY. Electricity can be supplied from a renewable energy plant directly
connected to the electrolyser, from the grid, or from a mix of the two. Using only electricity from a renewable energy plant ensures that the hydrogen is “green” in any given moment. Grid-connected electrolysers can produce for more hours, reducing the cost of hydrogen. However, grid electricity may include electricity produced from fossil fuel plants, so any CO2 emissions associated with that electricity will have to be considered when evaluating the sustainability of hydrogen. As a result, for producers of hydrogen from electrolysis, the amount of fossil fuel-generated electricity can become a barrier, in particular if the relative carbon emissions are measured based on national emission factors. Box 2 highlights options to ensure that grid-connected electrolysers deliver hydrogen with minimum emissions.
2.
1.
4.
5.
3.

25
Green hydrogen policies and technology costs
Box 2 Hydrogen emissions from grid-powered electrolysis
For hydrogen from electrolysis to have lower overall emissions than grey hydrogen, CO2 emissions per unit of electricity need to be lower than 190 grams of CO2 per kilowatt-hour (Reiter and Lindorfer, 2015). Only a few countries (mostly benefiting from hydropower) have average CO2 emissions per kWh below that threshold and thus can ensure the sustainability of electrolytic hydrogen. Most other countries are currently above that threshold.
However, electrolysers can be designed to serve as flexible demand-side resources that can be ramped down or turned off when the national power mix is above a certain threshold of CO2 emissions, if tracked, and then turned back on when renewable production is higher, and in particular when VRE production would otherwise be curtailed. In general, low electricity prices are a proxy for high renewable energy production (IRENA, 2020e), so that electricity prices can signal electrolyser activities. Moreover, when electricity prices are too high to produce competitive hydrogen, the electrolyser would shut down anyway. The significant (for some countries) and increasing renewable energy share of electricity production will also decrease the carbon footprint of electrolytic hydrogen production.
A hybrid model can also be used, where off-grid solar and wind power generation is the main source of electricity, but grid electricity can top up production to decrease the impact of initial investment costs while causing only a small increase in the carbon footprint of the electrolysis plant.
Power purchase agreements with grid-connected solar and wind plants may also ensure the sustainability of electricity consumption and at the same time make green hydrogen an additional driver for the decarbonisation of the power grid.
26
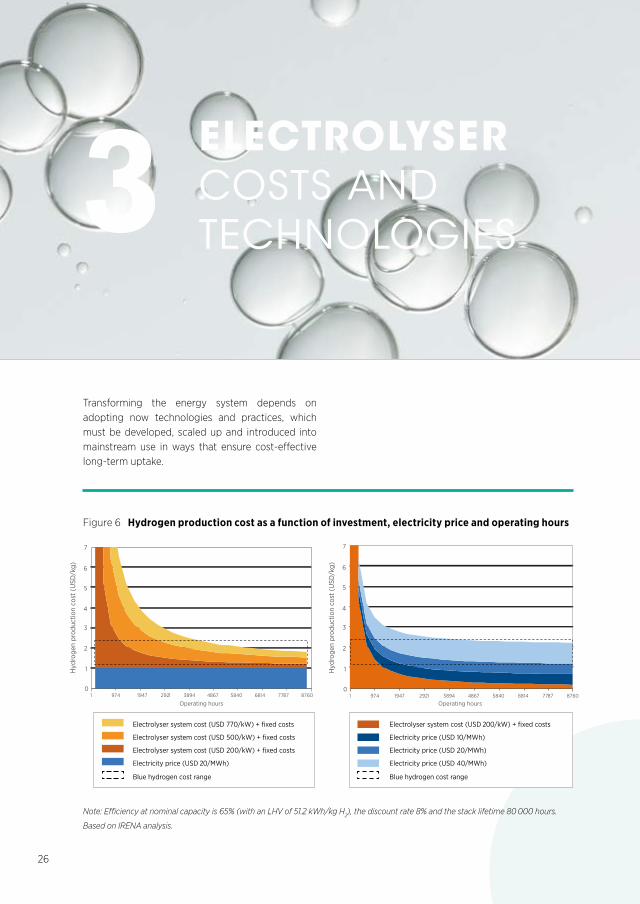
Note: Efficiency at nominal capacity is 65% (with an LHV of 51.2 kWh/kg H2), the discount rate 8% and the stack lifetime 80 000 hours.
Based on IRENA analysis.
3 ELECTROLYSER COSTS AND TECHNOLOGIES
Transforming the energy system depends on adopting now technologies and practices, which must be developed, scaled up and introduced into mainstream use in ways that ensure cost-effective long-term uptake.
Figure 6 Hydrogen production cost as a function of investment, electricity price and operating hours
Electricity price (USD 40/MWh)
Blue hydrogen cost range
Electrolyser system cost (USD 200/kW) + fixed costs
Electricity price (USD 20/MWh)
Electricity price (USD 10/MWh)
Electricity price (USD 20/MWh)
Blue hydrogen cost range
Electrolyser system cost (USD 500/kW) + fixed costs
Electrolyser system cost (USD 200/kW) + fixed costs
Electrolyser system cost (USD 770/kW) + fixed costs
0,00
1,00
2,00
3,00
4,00
5,00
6,00
7,00
1 974 1947 2921 3894 4867 5840 6814 7787 8760
Hyd
roge
n pr
oduc
tion
cost
(USD
/kg)
Operating hours
0,0
1,0
2,0
3,0
4,0
5,0
6,0
7,0
1 974 1947 2921 3894 4867 5840 6814 7787 8760
Hyd
roge
n pr
oduc
tion
cost
(USD
/kg)
0
1
2
3
4
5
6
7
Hyd
roge
n pr
oduc
tion
cost
(U
SD/k
g)
0
1
2
3
4
5
6
7
Hyd
roge
n pr
oduc
tion
cost
(U
SD/k
g)
Operating hours

27
MAKING THE BREAKTHROUGH: Green hydrogen policies and technology costs
• The major cost component for green hydrogen is electricity supply. Cost decline in this is already under way through the competitive deployment of renewables.
• There is a need to focus on reducing procurement and construction costs and increasing the performance and durability of electrolysers to achieve further cost reductions in green hydrogen production.
• Green hydrogen can already achieve cost-competitiveness with fossil-based hydrogen today in ideal locations with the lowest renewable electricity costs. Cost reductions in renewable electricity and electrolysers will continue to increase the number of sites where green hydrogen can be produced competitively, however.
• Policy support in recently unveiled hydrogen strategies in many countries is mostly in the form of explicit electrolyser capacity targets and, to a more limited extent, cost targets. These have yet to translate into specific regulatory instruments. So far, these explicit targets are not enough to be in line with 1.5°C decarbonisation pathways.
3.1 NEED FOR COST REDUCTION
KEY
PO
INTS

28
MAKING THE BREAKTHROUGH
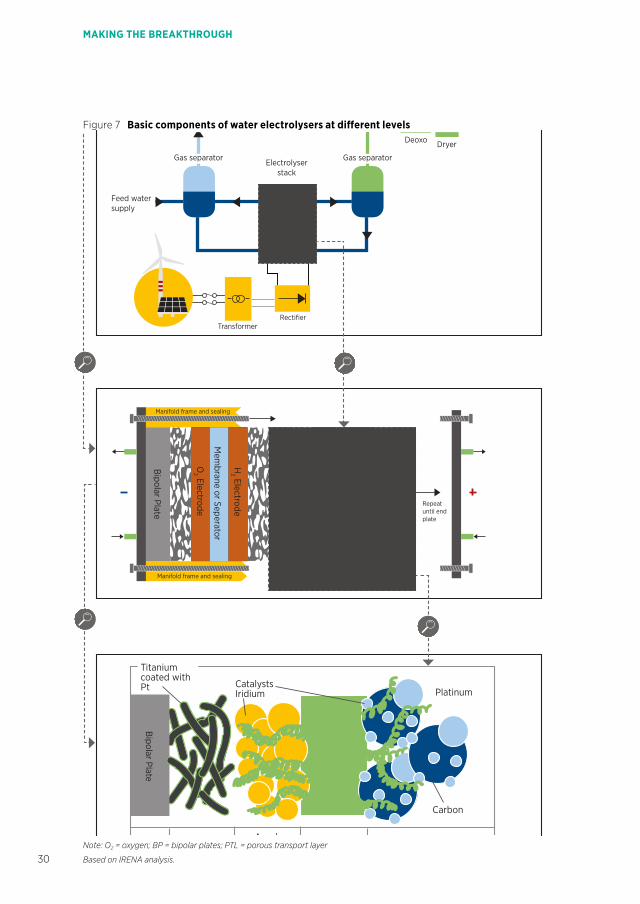
• An electrolysis stack (or electrolyser stack) splits water into hydrogen and oxygen, while the
balance of plant comprises power and water supplies, water purification, compression and
other components.
• Well-designed electrolysers can provide valuable energy storage and manage the variability
of solar and wind power.
• The materials and processes for electrolyser manufacturing require further innovation,
especially to reduce performance trade-offs between different components.
KEY
PO
INTS
3.2 TECHNOLOGY CHARACTERISTICS
The stack is where the actual splitting of water into
hydrogen and oxygen takes place. The balance of
plant, meanwhile, provides power supply, water supply
and purification, compression, possibly electricity and
hydrogen buffers, and hydrogen processing. While
these two main parts account for similar cost shares,
the greater potential for near-term cost reduction is
in this balance of plant. Further innovation in needed,
through concerted RD&D, to reduce overall costs
while boosting performance and durability.
• The flexibility of alkaline and PEM stacks is
sufficient to follow fluctuations in wind and solar
energy supply. The flexibility of the system is
limited, however, by the balance of plant (e.g., the
compressors) rather than the stack. Furthermore,
flexibility in the very short-term time scales
involved (i.e., sub-second) is not the key value
proposition for electrolysers, as their key system
value lies in bulk energy storage. This effectively
decouples variability of generation from stability
of hydrogen and power-to-X demand through
hydrogen storage in gas infrastructure (e.g., salt
caverns, pipelines) and liquid e-fuels storage.
29
Green hydrogen policies and technology costs
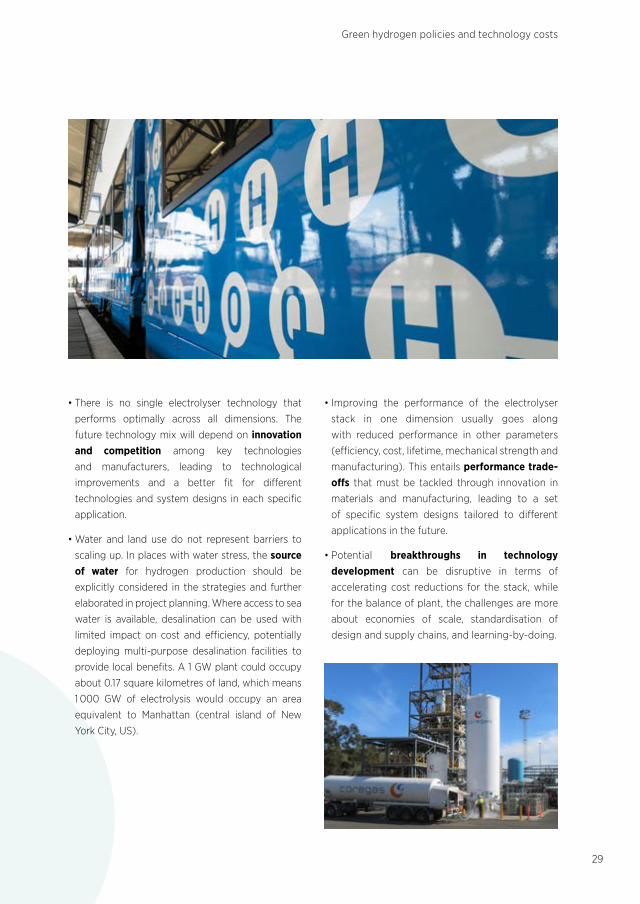
• There is no single electrolyser technology that
performs optimally across all dimensions. The
future technology mix will depend on innovation and competition among key technologies
and manufacturers, leading to technological
improvements and a better fit for different
technologies and system designs in each specific
application.
• Water and land use do not represent barriers to
scaling up. In places with water stress, the source of water for hydrogen production should be
explicitly considered in the strategies and further
elaborated in project planning. Where access to sea
water is available, desalination can be used with
limited impact on cost and efficiency, potentially
deploying multi-purpose desalination facilities to
provide local benefits. A 1 GW plant could occupy
about 0.17 square kilometres of land, which means
1 000 GW of electrolysis would occupy an area
equivalent to Manhattan (central island of New
York City, US).
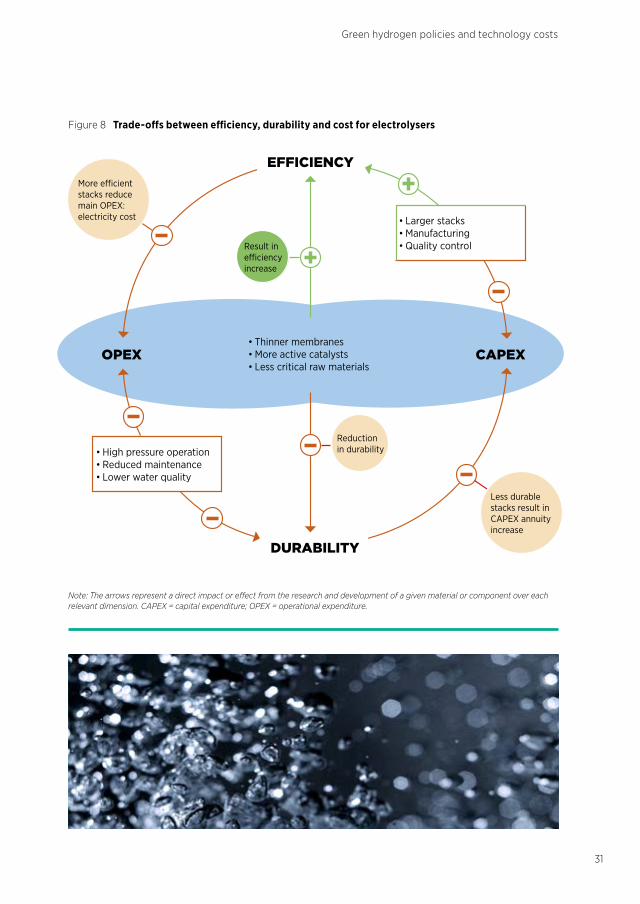
• Improving the performance of the electrolyser
stack in one dimension usually goes along
with reduced performance in other parameters
(efficiency, cost, lifetime, mechanical strength and
manufacturing). This entails performance trade-offs that must be tackled through innovation in
materials and manufacturing, leading to a set
of specific system designs tailored to different
applications in the future.
• Potential breakthroughs in technology development can be disruptive in terms of
accelerating cost reductions for the stack, while
for the balance of plant, the challenges are more
about economies of scale, standardisation of
design and supply chains, and learning-by-doing.
30
MAKING THE BREAKTHROUGH
Figure 7 Basic components of water electrolysers at different levels
Note: O2 = oxygen; BP = bipolar plates; PTL = porous transport layer
Based on IRENA analysis.
Anode Electrode
Manifold frame and sealing
Bipolar Plate
Bipolar Plate
Bipolar Plate
Repeat until end plate
RectifierTransformer
Gas separator Gas separator
Feed water supply
To compressor and storage
Deoxo Dryer
Cathode ElectrodeMembrane
CatalystsIridium Platinum
Manifold frame and sealing
Mem
brane or Seperator
Mem
brane or Seperator
H2 Electrode
O2 Electrode
H2 Electrode
O2 Electrode
Porous Transport
Layer
Porous Transport
Layer
Bipolar Plate
Titanium coated with Pt
BP PTL
Carbon
Electrolyser stack
31
Green hydrogen policies and technology costs
Figure 8 Trade-offs between efficiency, durability and cost for electrolysers
Note: The arrows represent a direct impact or effect from the research and development of a given material or component over each relevant dimension. CAPEX = capital expenditure; OPEX = operational expenditure.
DURABILITY
EFFICIENCY
OPEX CAPEX
• High pressure operation• Reduced maintenance• Lower water quality
• Larger stacks• Manufacturing• Quality control
• Thinner membranes• More active catalysts• Less critical raw materials
Less durable stacks result in CAPEX annuity increase
stacks reduce main OPEX: electricity cost
Result in
increase
Reduction in durability

32
4 COST REDUCTION STRATEGIES
• Government support for research programmes is needed to continue improving commercially
available technologies and make potential breakthroughs in emerging technologies.
• Given the differences in design and maturity among the various technologies, the use of
comparable performance indicators seems to be a suitable approach to guide innovation
efforts. These performance indicators, including long-term targets, can be used by governments
to benchmark performance of funded projects and to set research programme goals.
• To prevent critical materials from becoming a barrier to scaling up, alkaline systems need to
shift to platinum- and cobalt-free design. This is already commercially available from some
manufacturers today; yet it must become a prerequisite for policy support before scaling
up manufacturing capacity. For PEM electrolysers, further efforts are needed to reduce the
platinum and iridium content by at least one order of magnitude and, if possible, in the future,
replace these with more common materials. Titanium is also a significant cost component
that should be reduced in use. Although less scarce than other materials, it is still required in
significant quantities for current PEM designs.
• Increasing the size of a facility can have the largest cost reduction effect on the balance of
plant. Yet facility size is not defined based on cost only, but is also based on the application
(e.g., the residential or transport sectors use smaller sizes than industrial applications). Higher
cost due to smaller scale can partly be offset by savings in the delivery of the hydrogen, due
to on-site production.
KEY
PO
INTS
4.1 STACK LEVEL

33
MAKING THE BREAKTHROUGH: Green hydrogen policies and technology costs
Figure 9 Typical system design and balance of plant for an alkaline electrolyser
Note: This configuration is for a generic system and might not be representative of all existing manufacturers.
Based on IRENA analysis.
Hydrogen
Oxygen
Water
Water/KOH
Figure 10 Cost breakdown by major component for alkaline electrolysers based on current costs
90 %
80 %
70 %
60 %
50 %
40 %
20 %
10 %
0 %
30 %
100 %
1 MW 10 MW 100 MW
Cos
t br
eakd
own
by c
ompo
nent
Inve
stm
ent
cost
(U
SD/k
Wel)
1200
1000
800
400
200
0
600
Rest of balance of plant
Gas conditioning
Power electronics
Cell stack
Investment cost (USD/kWel)Based on IRENA analysis, based on Böhm et al., 2020.

34
MAKING THE BREAKTHROUGH
Table 2 Iridium and platinum loading for PEM electrolysers with increased performance and material reduction strategies
Based on IRENA analysis.
TODAY FUTURE
Current density (A/cm2) 2 5
Electrode area (cm2) 1 200 5 000
Iridium loading (mg/cm2) 5 0.2
Iridium loading (g/kW) 1.3 0.4
Platinum loading (mg/cm2) 2 0.05
Platinum loading (g/kW) 0.5 0.1
22 NNHH33
35
Green hydrogen policies and technology costs
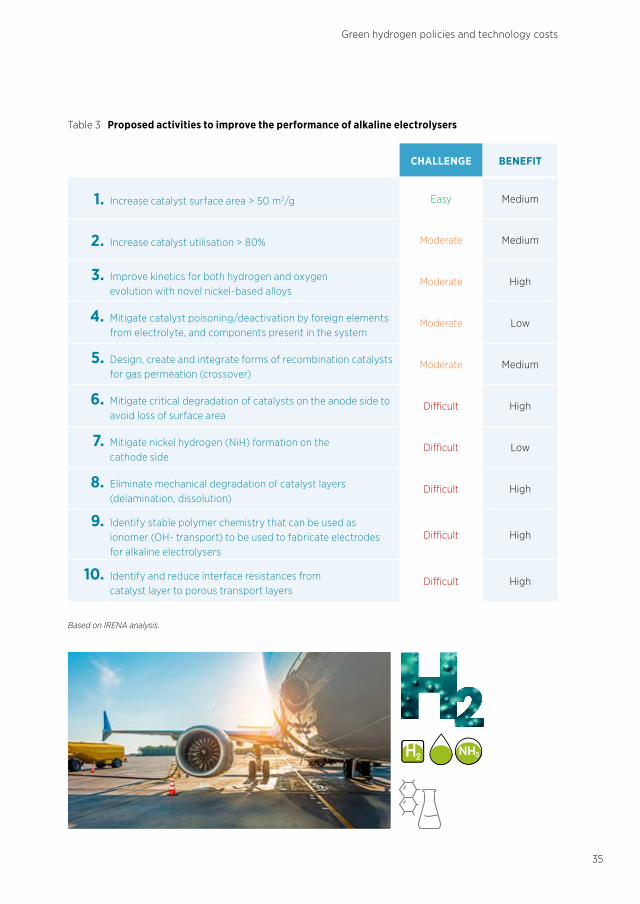
CHALLENGE BENEFIT
1. Increase catalyst surface area > 50 m2/g Easy Medium
2. Increase catalyst utilisation > 80% Moderate Medium
3. Improve kinetics for both hydrogen and oxygen evolution with novel nickel-based alloys
Moderate High
4. Mitigate catalyst poisoning/deactivation by foreign elements from electrolyte, and components present in the system
Moderate Low
5. Design, create and integrate forms of recombination catalysts for gas permeation (crossover)
Moderate Medium
6. Mitigate critical degradation of catalysts on the anode side to avoid loss of surface area
Difficult High
7. Mitigate nickel hydrogen (NiH) formation on the cathode side
Difficult Low
8. Eliminate mechanical degradation of catalyst layers (delamination, dissolution)
Difficult High
9. Identify stable polymer chemistry that can be used as ionomer (OH- transport) to be used to fabricate electrodes for alkaline electrolysers
Difficult High
10. Identify and reduce interface resistances from catalyst layer to porous transport layers
Difficult High
Table 3 Proposed activities to improve the performance of alkaline electrolysers
Based on IRENA analysis.

36
MAKING THE BREAKTHROUGH
CHALLENGE BENEFIT
1. Mitigate membrane poisoning/deactivation by foreign elements from components and system
Easy Medium
2. Design, create and integrate forms of recombination catalysts for gas permeation (crossover)
Easy Medium
3. Increase catalyst utilisation of anode and cathode catalysts Moderate High
4. Identify and reduce interface resistances from catalyst layer to porous transport layers
Moderate Medium
5. Reduce the ohmic losses and gas permeation of perfluorinated sulfonic acid (PFSA) membranes
Difficult High
6. Improve kinetics for oxygen evolution using iridium-free catalysts, maintaining stability like the best iridium
Difficult High
7. Eliminate mechanical degradation of catalyst layers (delamination, dissolution)
Difficult Medium
8. Create noble metal free protective layers for porous transport layers
Difficult High
9. Create titanium-free porous transport layers Difficult High
Table 4 Proposed activities to improve the performance of PEM electrolysers
Based on IRENA analysis.

22
37
Green hydrogen policies and technology costs
CHALLENGE BENEFIT
1. Develop cost-effective porous transport layers for AEM electrolysers
Moderate Medium
2. Identify and reduce interface resistances from catalyst layer to porous transport layers
Moderate Medium
3. Control the oxidised state of electrocatalysts on the oxygen side (anode)
Moderate Medium
4. Reduce the ohmic losses and gas permeation of AEM membranes
Moderate High
5. Improve kinetics for hydrogen and oxygen evolution and maintain long-term stability
Moderate High
6. Increase AEM membrane durability Difficult High
7. Eliminate mechanical degradation of catalyst layers (delamination, dissolution) and improve ionomer/catalyst binding properties
Difficult High
Table 5 Proposed activities to improve the performance of AEM electrolysers
Based on IRENA analysis.

38
MAKING THE BREAKTHROUGH
CHALLENGE BENEFIT
1. Stabilise the chemical structure and compatibility of the electrodes
Moderate Medium
2. Control the oxidation state of electrocatalysts on the oxygen side (anode) or nickel agglomeration
Moderate Medium
3. Increase the electrocatalytic activity of electrodes at lower temperatures
Moderate Low
4. Solve challenges related to lanthanum manganite (LSM) or lanthanum ferrite (LSF) delamination from electrolyte
Moderate High
5. Improve kinetics for hydrogen and oxygen evolution and maintain long-term stability
Difficult High
6. Eliminate or reduce contamination issues related to silicon dioxide (SiO2) dissolution from stack sealants
Difficult Medium
7. Eliminate thermal instability issues caused by an expansion coefficient mismatch between electrolytes and electrodes
Difficult High
8. Scale up stack components towards larger, MW-size stack units
Difficult High
Table 6 Proposed activities to improve the performance of solid oxide electrolysers
Based on IRENA analysis.

39
Green hydrogen policies and technology costs
• The largest benefits from economies of scale in electrolyser manufacturing seem to be reached around the 1 GW/year level. Several industrial players claim to have reached this scale or are working towards expansion. One measure governments could take is to set manufacturing capacity targets, manufacturing tax benefits, grants and loans for capacity expansion and work in close collaboration with industry. The Netherlands and the UK are examples of where this is happening.
• A predictable 5-10 year pipeline of electrolysis projects – driven by green hydrogen demand – will be key for manufacturers to invest in new, larger and automated production facilities. Uncertainties about the demand for green hydrogen versus fossil fuel-based hydrogen is a key obstacle to the scaling up of electrolyser manufacturing: policy makers should carefully assess the balance, as learning from investments in green hydrogen versus blue hydrogen production are not interchangeable.
• Water electrolysis deployment for green hydrogen has been limited so far, which introduces uncertainty around the cost reduction that can be achieved by scaling up. From this limited experience, electrolysers seem to display a similar relationship between cost decrease and global capacity as solar PV does – which could result in a 40% cost reduction, given the capacity targets that governments have already announced. One action that governments could take is to ensure cost is communicated transparently, in order to be able to track progress and identify potential.
• Cost declines are greatest during the current, early stage of deployment, when the cumulative capacity deployed is still small and the market is relatively concentrated in a few companies. Current costs suffer from lack of transparency, due to the nascent stage of the industry, which will likely be resolved as large-scale manufacturing facilities come online and large projects get commissioned. This, in turn, will facilitate price discovery and improve cost reduction forecasts.
KEY
PO
INTS
4.2 SYSTEM LEVEL
Table 6 lists key performance indicators (KPIs) for the four-electrolysis technologies considered here, both for the state of-the-art in 2020 and as targets for 2050. The table also indicates which component are specifically related to, or most affect, any given KPI.
Table 7 shows learning rates, by component, for alkaline, PEM and solid oxide electrolysers.

40
MAKING THE BREAKTHROUGH
2020 Target 2050 R&D focus
PEM electrolysers
Nominal current density 1-2 A/cm² 4-6 A/cm2 Design, membrane
Voltage range (limits) 1.4-2.5 V < 1.7 V Catalyst, membrane
Operating temperature 50 – 80°C 80°C Effect on durability
Cell pressure < 30 bar > 70 bar Membrane, reconversion catalysts
Load range 5% – 120% 5% – 300% Membrane
H2 purity 99.9% –99.9999% Same Membrane
Voltage efficiency (LHV) 50% – 68% > 80% Catalysts
Electrical efficiency (stack) 47-66 kWh/kg H2 < 42 kWh/kg H2 Catalysts/membrane
Electrical efficiency (system) 50-83 kWh/kg H2 < 45 kWh/kg H2 Balance of plant
Lifetime (stack) 50 000 - 80 000 hours 100 000 -120 000 hours
Membrane, catalysts, porous transport layers
Stack unit size 1 MW 10 MW Membrane electrode assembly, porous transport layer
Electrode area 1 500 cm² > 10 000 cm² Membrane electrode assembly, porous transport layer
Cold start (to nominal load) < 20 minutes < 5 minutes Insulation (design)
Capital costs (stack) minimum 1 MW
USD 400/kW < USD 100/kW Membrane electrode assembly, porous transport layers, bipolar plates
Capital costs (system) minimum 10 MW
USD 700 – 1 400/kW < USD 200/kW Rectifier, water purification
Alkaline electrolysers
Nominal current density 0.2–0.8 A/cm² > 2 A/cm2 Diaphragm
Voltage range (limits) 1.4–3 V < 1.7 V Catalysts
Operating temperature 70-90°C > 90°C Diaphragm, frames, balance of plant components
Cell pressure < 30 bar > 70 bar Diaphragm, cell, frames
Load range 15% – 100% 5% – 300% Diaphragm
H2 purity 99.9% – 99.9998% > 99.9999% Diaphragm
Voltage efficiency (LHV) 50% – 68% > 70% Catalysts, temperature
Electrical efficiency (stack) 47–66 kWh/kg H2 < 42 kWh/kg H2 Diaphragm, catalysts
Electrical efficiency (system)
50–78 kWh/kg H2 < 45 kWh/kg H2 Balance of plant
Lifetime (stack) 60 000 hours 100 000 hours Electrodes
Stack unit size 1 MW 10 MW Electrodes
Electrode area 10 000 - 30 000 cm² 30 000 cm² Electrodes
Cold start (to nominal load) < 50 minutes < 30 minutes Insulation (design)
Table 7 Key performance indicators for electroyser technologies

41
Green hydrogen policies and technology costs
Table 7 (continued)
2020 Target 2050 R&D focus
Alkaline electrolysers (continued)
Capital costs (stack) minimum 1 MW
USD 270/kW < USD 100/kW Electrodes
Capital costs (system) minimum 10 MW
USD 500 – 1 000/kW
< USD 200/kW Balance of plant
AEM electrolysers
Nominal current density 0.2 – 2 A/cm² > 2 A/cm² Membrane, reconversion catalysts
Voltage range (limits) 1.4 – 2.0 V < 2 V Catalyst
Operating temperature 40-60°C 80°C Effect on durability
Cell pressure < 35 bar > 70 bar Membrane
Load range 5% – 100% 5% – 200% Membrane
H2 purity 99.9% – 99.999% > 99.9999% Membrane
Voltage efficiency (LHV) 52% – 67% > 75% Catalysts
Electrical efficiency (stack) 51.5-66 kWh/kg H2 < 42 kWh/kg H2 Catalysts/membrane
Electrical efficiency (system) 57-69 kWh/kg H2 < 45 kWh/kg H2 Balance of plant
Lifetime (stack) > 5 000 hours 100 000 hours Membrane, electrodes
Stack unit size 2.5 kW 2 MW Membrane electrode assembly
Electrode area < 300 cm² 1 000 cm² Membrane electrode assembly
Cold start (to nominal load) < 20 minutes < 5 minutes Insulation (design)
Capital costs (stack) minimum 1 MW
Unknown < USD 100/kW Membrane electrode assembly
Capital costs (system) minimum 10 MW
Unknown < USD 200/kW Rectifier
Solid oxide electrolysers
Nominal current density 0.3 – 1 A/cm² > 2 A/cm2 Electrolyte, electrodes
Voltage range (limits) 1.0 – 1.5 V < 1.48 V Catalysts
Operating temperature 700-850°C < 600°C Electrolyte
Cell pressure 1 bar > 20 bar Electrolyte, electrodes
Load range 30% – 125% 0% – 200% Electrolyte, electrodes
H2 purity 99.9% > 99.9999% Electrolyte, electrodes
Voltage efficiency (LHV) 75% - 85 % > 85% Catalysts
Electrical efficiency (stack) 35-50 kWh/kg H2 < 35 kWh/kg H2 Electrolyte, electrodes
Electrical efficiency (system) 40-50 kWh/kg H2 < 40 kWh/kg H2 Balance of plant
Lifetime (stack) < 20 000 hours 80 000 hours All
Stack unit size 5 kW 200 kW All
Electrode area 200 cm² 500 cm² All
Cold start (to nominal load) > 600 minutes < 300 minutes Insulation (design)
Capital costs (stack) minimum 1 MW
> USD 2 000/kW < USD 200/kW Electrolyte, electrodes
Capital costs (system) minimum 1 MW
Unknown < USD 300/kW All
Note: A/cm2 = amperes per square centimetre; V = volts; °C = degrees Celsius; kWh/kg H2 = kilowatt hours per kilogram of hydrogen; MW = Megawatt; cm² = square centimetres; kW = kilowatt
Based on IRENA analysis.

42
MAKING THE BREAKTHROUGH
TECHNOLOGY COMPONENT LEARNING RATE (%)
Alkaline Structural rings 5
Polytetrafluoroethylene seal 8
Bipolar plates 18
(Pre)electrodes 18
Membrane 18
Flanges 5
Tie rods 5
PEM Stack assembling 8
Small parts 5
MEA manufacturing 8
Catalysts 8
Membranes 18
Current collectors 18
Bipolar plates 18
End plates 8
Solid oxide Stack assembling 8
Electrolyte 18
Catalysts 18
Porous transport layer 18
Interconnector 18
Sealings 5
End and pressure plates 8
Balance of plant Power supply 12
Gas conditioning 7
Small purchased parts 12 – 15
Machining 10
Welding 10
Table 8 Learning rate by stack component for three types of electrolysers
MEA = membrane electrode assembly
Source: Bohm et al., 2019.

43
Green hydrogen policies and technology costs
Figure 11 Cost breakdown for PEM electrolysers as a function of manufacturing scale (units of 1 MW per year)
Note: Costs include material, labour, capital, energy, maintenance, buildings and scrap costs.
Source: Mayyas et al., 2019.

44
5 GUIDANCE FOR POLICY MAKERS
• Each country needs a long-term hydrogen strategy. This defines national ambitions, outlines the amount of support required, and provides a reference for private investment and finance in green hydrogen development.
• Hydrogen strategies may be preceded by decades of research and demonstration projects and should be followed by impact assessments.
• Such assessments are needed to quantify the costs and benefits of different applications and to identify suitable policy instruments.
• While green hydrogen can be used across the energy system, initial policies and support should focus on the most attractive applications in each local context.
• Guarantee-of-origin schemes require labels of hydrogen and hydrogen products, indicating emissions over the entire product life cycle. Clear labelling would increase consumer awareness and facilitate incentive claims for green hydrogen use.
• As green hydrogen becomes mainstream, policies should cover its integration into the broader energy system. Civil society and industry must be involved to maximise the benefits.
• Each sector entails specific challenges, degrees of competition, and needs for service, along with its own incumbent and alternative technologies. Policy must be tailored to drive green hydrogen uptake across the value chain.
KEY
PO
INTS
5.1 POLICY PILLARS

45
Green hydrogen policies and technology costs
Turning green hydrogen from a niche player into a widespread energy carrier calls for an integrated policy approach to build the market. This rests on four central pillars:
National hydrogen strategies. These can start with research and development (R&D) programmes, followed by a
vision document on “why hydrogen”, “why this jurisdiction”, and “why now”. Next is a roadmap of short-term actions, identifying high-priority research areas and applications. Finally, the strategy sets levels of ambition and of support. It can be followed by economic, social and environmental impact analyses.
Policy priorities for green hydrogen. Each country or region should identify its highest-value hydrogen pathways,
along with policy goals like reducing air pollution, boosting economic growth or decarbonising hard-to-abate sectors.
Other decarbonisation alternatives should also be weighed, and renewable power should not be diverted from other, existing productive uses.
A guarantee-of-origin system. A certification system helps to differentiate, and value, green hydrogen. Common
classifications are needed for all hydrogen in use, with life-cycle emissions indicated for any given batch.
Governance system and enabling policies. These create the socio-economic space for green hydrogen
uptake. R&D, workforce and other policies should reflect the systemic and social value of energy choices. New policies can create local value chains and encourage demand for green products. Specific measures can level the playing field with fossil fuels.
4.
3.
2.
1.

46
MAKING THE BREAKTHROUGH
1R&DPROGRAMMES 2VISION DOCUMENT 3ROADMAP
PUBLIC-PRIVATE PARTNERSHIP
4STRATEGY
• Support basic and exploratory research• Start “moonshot” programmes• Aim for technology leadership
• Showcase potential / end goal
• Align private and public views
• Highlight benefits and added value
• Define major milestones and targets
• Present indicative timeline for scaling up
• Showcase actions to advance
• Create Information platforms• Create general consensus on the vision• Co-ordinate future e orts
• Define key targets
• Ensure coherence with rest of energy policy
• Introduce direct, integrating and enabling measures
• Introduce a timeline
Figure 12 Steps leading to the formulation of a national strategy

22 NN
47
Green hydrogen policies and technology costs
As a follow-up to the strategy, a set of analyses must be carried out to assess the impact of the introduction or change of specific policies. The analyses assess the economic, social and environmental consequences of the implementation of the proposed measures in the strategy. They evaluate alternative timelines and scopes, as well as interactions with other technologies. After these analyses, the actual regulations and laws are introduced, followed by regular revisions to adjust them according to progress and latest trends.
This process from R&D to strategy is far from linear or quick. Moreover, countries can skip the public-facing steps described here and issue a national hydrogen strategy while keeping the investigation activities confidential.
National strategies lay out a clear pathway to increase hydrogen uptake

CaliforniaVision document
France Strategy
CanadaVision document
2018
2019
2020
European UnionVision document
Republic of KoreaRoadmapEuropean Union Roadmap
New ZealandVision document
Republic of Korea Strategy
China R&D programme
PortugalVision document
Spain Strategy
Japan Roadmap
Japan Strategy
Australia Strategy
Norway Strategy
Germany Strategy
European Union Strategy
Chile Strategy
Finland Strategy
Italy Vision document
Canada Strategy
Russian Federation Roadmap
Netherlands Strategy
Upcoming Strategies:
AustriaColombiaDenmarkMoroccoOman
ParaguayUnited KingdomUruguay
Portugal Strategy
and moreto come
R&D PROGRAMMES ROADMAPVISION DOCUMENT STRATEGY
48
MAKING THE BREAKTHROUGH
Figure 13 Recent hydrogen policies and strategies
Note: R&D = research and development
Hydrogen policies are evolving rapidly. While information in this figure is as complete as possible, more countries may have announced, drafted and published vision, roadmap and strategy documents.
Source: IRENA, 2020f), updated.
Growing numbers of countries have adopted hydrogen policies and strategies

49
Green hydrogen policies and technology costs
Figure 14 Electrolyser capacity in national strategies versus climate-safe scenario for 2030
Based on IRENA analysis.
Gap
to b
e fil
led
300
250
200
150
100
50
02020
Elec
trol
yser
cap
acity
(G
W)
2030: Currentnational strategies
2030: Transforming Energy Scenario
Current strategies are insufficient to meet climate goals

50
MAKING THE BREAKTHROUGH
Box 3 The EU hydrogen strategy
The EU strategy aims for an integrated view of the hydrogen value chain, and establishes a supporting governance system and policy framework to promote hydrogen deployment (see Figure 15).
The ambition of EU policy makers is to make the European industry a global leader, both in green hydrogen equipment and zero-carbon heavy industry. For this reason, the strategy identifies green hydrogen as the only shade of hydrogen compatible with a net-zero emission system.
The strategy aims to create at least 6 GW of electrolyser capacity by 2024, enough to produce up to 1 million tonnes per year (Mt/yr) of green hydrogen. That would increase to 40 GW in EU countries by 2030, with an additional 40 GW of electrolyser capacity in southern and eastern neighbours (e.g., Ukraine or Morocco), from which the EU could import green hydrogen.
The strategy sets a number of actions, including not only regulatory changes indicated by impact assessments, but also supporting investments designed to kick-start deployment.
The strategy adopts a staged approach:
(2020-2024): Scale up electrolyser capacity to 6 GW and produce up to 1 Mt/yr of renewable hydrogen. The focus is on decarbonising applications that already use hydrogen and facilitating the uptake of green hydrogen in new end-use applications. The hydrogen supply would be mostly local to avoid the need for extensive infrastructure while planning for infrastructure expansion. Some existing hydrogen production is retrofitted with carbon capture.
(2025-2030): Scale up electrolyser capacity to 40 GW in EU countries and produce up to 10 Mt/yr of renewable hydrogen. An additional 40 GW of capacity may be commissioned in neighbouring regions, via co-operation. Transporting the green hydrogen will require a pan-European grid infrastructure that could be largely based on existing natural gas infrastructure. International trade with neighbouring regions can also be developed. The hydrogen market is assumed to be efficient in terms of allocation, with unhindered cross-border trade.
(2030-2050): Green hydrogen reaches maturity and is deployed at large scale across all hard-to-abate sectors where alternatives have a higher cost. E-fuels made from hydrogen would be used in a wide range of sectors, including aviation and shipping.
Reaching the key goals for 2030 requires estimated investments of EUR 24 billion to EUR 42 billion (about USD 29 billion to USD 50 billion) for electrolyser capacity, in addition to between EUR 220 billion and EUR 340 billion (about USD 265 billion to USD 410 billion) for 80-120 GW of additional renewable-based power generation capacity, EUR 65 billion (USD 78 billion) for infra-structure and EUR 11 billion (USD 13 billion) for retrofitting existing natural gas plants.
2020
2030
2025
2050
1STAGE
2STAGE
3STAGE

51
Green hydrogen policies and technology costs
SUPPLY INFRASTRUCTURE
• Use of life cycle CO2 thresholds
• Threshold for low carbon
• Use of certification schemes
• Adoption of tenders
• Reform of gas market legislation
• Repurposing gas infrastructure
• Provide equal access to all stakeholders
• Revision of ETS
• Introduction of ”Carbon Contract for Dierence“
• Market-based support schemes
• Quotas of green hydrogen in end uses
DEMAND
INVESTMENT
Important Projects of Common European Interest (IPCEI); REACT-EU;InvestEU programme; European Regional Development Fund and the Cohesion Fund
RESEARCH AND INNOVATION
Larger and more e�cient electrolysers; innovative production technologies; assess the repurposing of natural gas infrastructure; environmental impact; safety and materials
INTERNATIONAL DIMENSION
Partnerships with neighbouring regions; IPHE, CEM, MI, IEA, IRENA; global trading; trade policy to avoid market distortions; Euro as benchmark for hydrogen trading
Figure 15 Main aspects and instruments mentioned in the EU hydrogen strategy
Notes: CEM = Clean Energy Ministerial; ETS = emissions trading system; IEA = International Energy Agency; IPHE = International Partnership for Hydrogen and Fuel Cells in the Economy; MI = Mission Innovation; REACT-EU = Recovery Assistance for Cohesion and the Territories of Europe.
Source: European Commission, 2020.

52
MAKING THE BREAKTHROUGH
HEATING
INDUSTRY
LANDTRANSPORT
SHIPPING
AVIATION
RENEWABLES GREEN HYDROGEN
ENERGYEFFICIENCY
DIRECTELECTRIFICATION
• Solar water heaters, direct geothermal use, biomass (low- grade heating)
• Solar drying, biomass (productive uses)
• Biofuels
• Biofuels
• Wind energy
• Biojet fuels
• Heat pumps
• Electric industrial application (e.g., arc furnaces)
• Battery electric vehicles
• Short-distance shipping
• Short-distance aviation
• Retrofit of buildings
• Technological advancement
• Use of best available technologies
• Performance standards• Travel avoidance• Engine design
• Ship design • Operation optimisation• Travel avoidance
• Plane design
• Travel avoidance
• High-grade heating
• Steelmaking refineries
• Chemical industry
• Fuel-cell electric vehicles
• Green ammonia
• Methanol
• Hydrogen and synthetic fuels for aviation
Figure 16 Ways to decarbonise end-use energy
Based on IRENA, IEA and REN 21, 2020, and IRENA, 2020b.
Hydrogen is one of several options available to replace fossil fuels

53
Green hydrogen policies and technology costs
5.2 SUPPORTING POLICIESGreen hydrogen is at an early stage in most applications and needs policy support to advance from niche to mainstream and be part of the energy transition. Some barriers to the deployment of green hydrogen in various sectors are relatively consistent across end uses, the cost barrier being the main one.
Other barriers are more sector-specific and call for a tailored approach (see Figure 17).
Once priorities are set, policy makers need to address the barriers specific to the sectors where green hydrogen is expected to be deployed.
22 NNHH33
Figure 17 Key barriers, and policies to address them, across the hydrogen value chain
ELECTROLYSIS
BA
RR
IER
SP
OLI
CY
OP
TIO
NS
INDUSTRY AVIATION SHIPPINGINFRASTRUCTURE
- Capital cost
- Electricity cost
- Lack of hydrogen market
- Barriers to power market
- Limited existing infrastructure
- Technical limitations of users
- Lack of investment
- High cost
- Lack of demand for green products
- Global competition and carbon leakage
- High cost
- Procurement of sustainable CO2
- Policy focus on biofuels
- High cost
- Technical barriers
+ Set capacity targets
+ O�er loans
+ Introduce feed-in premium
+ Allow participation in ancillary markets
+ Collaborate on global trading of hydrogen
+ Identify priorities for conversion
+ Align blending targets
+ Provide financing
+ O�er dedicated loans
+ Develop public procurement of green products
+ Phase out high-emission technologies
+ Set targets
+ Review policy focus
+ Expand emissions trading system
+ Introduce fiscal incentives
+ Set targets for zero-emission vessels
+ Support infrastructure development
Hydrogen > Ammonia

54
6 PROJECTS, MILESTONES AND ROLES
• Announcements of projects coming online in the next five years add up to a total that is two orders of magnitude greater than today’s globally installed capacity. Still, even steeper growth would be needed to be in line with 1.5°C pathways.
• This requires a further acceleration in the deployment of renewable power capacity, which needs to be at least ten times higher in 2050 than it was in 2019.
• To achieve this, hydrogen uptake must be focused on sectors where direct electrification is more difficult, to maximise the efficiency of renewable electricity use.
As research and development (R&D) institutions dedicated to green hydrogen emerge, intensified competition could result in faster innovation and significant reductions in costs.
Currently, the field of green hydrogen production is growing so fast that new players can sometimes be difficult to identify. Historically, with a few exceptions, water electrolysers were manufactured by small companies.
Now, large enterprises are active in acquiring and merging small- to medium-sized electrolyser companies into their subsidiary portfolios. This will dramatically and positively increase investment, much more rapidly changing the technology and decreasing costs. Table 8 provides a non-exhaustive list of companies, enterprises and key players involved in the manufacturing and/or commercialisation of water electrolysers.
6.1 GREEN HYDROGEN PROJECT PIPELINE
KEY
PO
INTS

55
MAKING THE BREAKTHROUGH: Green hydrogen policies and technology costs
COMPANY MANUFACTURING SITE ELECTROLYSER TYPE
AQUAHYDREX Australia, US Alkaline
AREVAH2 France, Germany PEM
ASAHI KASEI Japan Alkaline
CARBOTECH Germany PEM
COCKERILLL JINGLI China Alkaline
CUMMINS - HYDROGENICS Belgium, Canada, Germany PEM and Alkaline
DENORA Italy, Japan, US PEM and Alkaline
ENAPTER Italy AEM
GINER ELX US PEM
GREEN HYDROGEN SYSTEMS Denmark Alkaline
HALDOR TOPSOE Denmark Solid Oxide
HITACHI ZOSEN Japan Alkaline and PEM
HONDA Japan PEM
HYDROGENPRO Norway Alkaline
iGAS Germany PEM
ITM UK PEM
KOBELCO Japan Alkaline and PEM
KUMATEC Germany Alkaline
MCPHY France, Italy, Germany Alkaline
NEL HYDROGEN Denmark, Norway, US PEM and Alkaline
PERIC China Alkaline
PLUG POWER US PEM
SHANGHAI ZHIZHEN China Alkaline
SIEMENS ENERGY Germany PEM
SOLIDPOWERItaly, Switzerland, Germany, Australia
Solid Oxide
SUNFIRE Germany Solid Oxide
TELEDYNE US PEM
THYSSENKRUPP UHDE Germany Alkaline
TIANJIN China Alkaline
TOSHIBA Japan Solid Oxide
Table 9 Some key players involved in manufacturing water electrolyser systems
Based on IRENA analysis.
Alkaline electrolysers AEM electrolysers Solid oxide electrolysers PEM electrolysers

56
MAKING THE BREAKTHROUGH
• Progress towards lower costs is not inherently time-bound. The best cost reduction pathway will be defined by how quickly specific key milestones are achieved. This depends on
governments setting time-bound targets and measures to support green hydrogen demand,
which in turn will promote scale-up (explicitly or implicitly) and increased competition in
electrolyser manufacturing and deployment.
• No single cost reduction strategy is recommended to pursue exclusively, and the four
strategies presented here can all be considered in parallel. A combination of government
support for research programmes in parallel with the establishment of policies and targets,
combined with private sector moves towards standardisation and optimised designs, will
lead to lower electrolyser costs and ultimately cheaper green hydrogen.
• A 40% cost decline could be achievable in the short term, with a total 80% cost reduction
in the long term when all the targets are achieved.
• Investment cost is only one component of the total green hydrogen cost. To achieve cost
competitiveness with fossil-based hydrogen, low electricity cost, favourable regulation,
higher efficiency and a longer lifetime will be needed.
KEY
PO
INTS
6.2 MILESTONES

57
Green hydrogen policies and technology costs
Figure 18 Milestones for four cost reduction strategies across three stages of deployment for electrolysers
Based on IRENA analysis.
STAGE 1 STAGE 2 STAGE 3
Alkaline and PEM
AEM and solid oxide
Few players (oligopoly)
1-100 MW/yr plants
1-10 MW/yr plants
Diversified Competitive
0.1-5 GW/yr plants >5 GW/yr plants
>10 MW/yr plants
1-10 MW modules 10-100 MW modules >100 MW modules
1-10 MW modules 10-100 MW modules
Numbering up
Optimised larger module
Balance of plant in-house
Specialised suppliers for BoP
Mass manufacturing (AEM)
Custom designs
Standard design by application
Demonstration projects
Current density
Membrane thickness
Bipolar plates (PEM)
Pt and Co free (alk)
Pt and Ir reduction
Private research
AEM membranes Demonstration
SOEC lifetime
STRATEGY
Manufacturing
Module size
Learning-by-doing
Research
scale

58
MAKING THE BREAKTHROUGH
6.3 STAKEHOLDER ROLES Today, green hydrogen represents only a limited share of global supply. The transition to a future where green hydrogen has not only displaced fossil-based hydrogen, but also gone beyond the industrial sector to become a versatile energy carrier, will therefore not happen overnight. It will also not happen without participation by multiple stakeholders.
Co-ordination will be crucial in at least four key areas:
Across the value chain: Hydrogen supply must be scaled up in parallel with infrastructure development and, more
importantly, demand. At least during the early stages, when a market has not yet developed, production projects need to be co-developed with an off-taker, since there is no grid or ubiquitous established sink that can absorb all the production. While blending in the gas grid, if combined with tracing and financial compensation, can provide an alternative, it is only an alternative for early stages of development.
Across borders: All sectors, from electrolysers to fuel cells, direct reduction of steel to ammonia ships
and synthetic fuels, will benefit from global collaboration. This applies to the deployment level – enabling learning from projects to drive costs down – and at the research level, enabling the co-ordination of national programmes.
Across sectors: Green hydrogen development would benefit from combining different applications to
aggregate demand, justifying larger projects and achieving economies of scale that benefit production and, perhaps, infrastructure.
Among multiple stakeholders: Green hydrogen will not scale up without support from multiple stakeholders. Fortunately,
there is already widespread interest in hydrogen from energy utilities, steel makers, chemical companies, port authorities, car and aircraft manufacturers, shipowners and airlines, amongst others, but their actions need to be in the same direction.
1
2
3
4

22 NNHH33
59
Green hydrogen policies and technology costs
For governments, there are multiple actions that could be pursued to promote green hydrogen production. Most of these will have the largest impact in the early stages of deployment (see Figure 19). Some, however, such as market regulation and financing, will be crucial once the market kicks off and the scale-up process begins.
Governments should also adopt a flexible approach in which strategies and targets are frequently reviewed to give consideration to the latest developments. For example, the Australian strategy includes this approach (Strategic Actions 2.1 and 2.2) to remove market barriers and support technology growth, as the market develops.
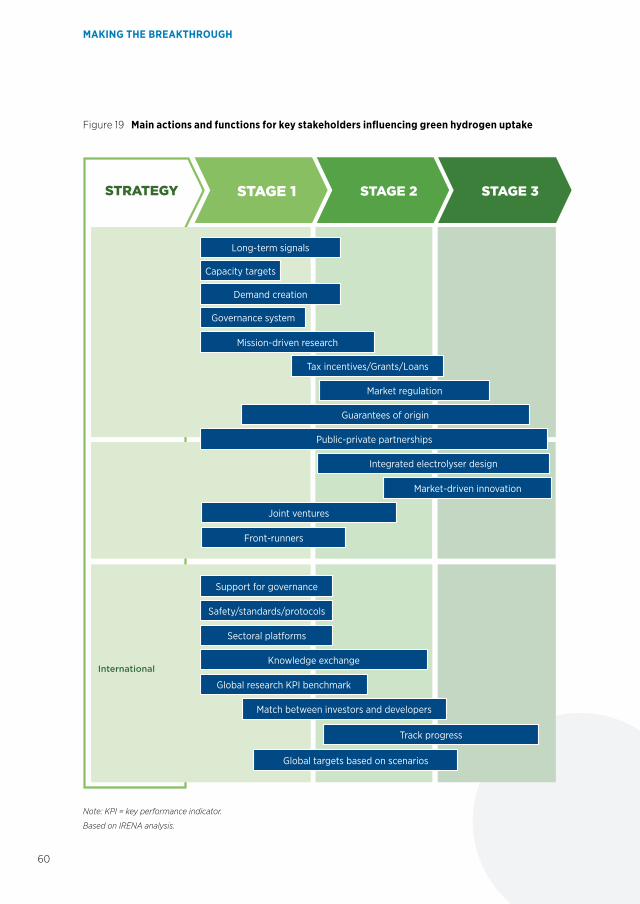
60
MAKING THE BREAKTHROUGH
Figure 19 Main actions and functions for key stakeholders influencing green hydrogen uptake
Note: KPI = key performance indicator.
Based on IRENA analysis.
STRATEGY STAGE 1 STAGE 2 STAGE 3
Long-term signals
Capacity targets
Governance system
Demand creation
Mission-driven research
Tax incentives/Grants/Loans
Market regulation
Guarantees of origin
Public-private partnerships
Integrated electrolyser design
Market-driven innovation
Joint ventures
Front-runners
Support for governance
Safety/standards/protocols
Sectoral platforms
Knowledge exchange
Global research KPI benchmark
Match between investors and developers
Track progress
Global targets based on scenarios
International

61
Green hydrogen policies and technology costs
Global interest is rising in green hydrogen as one of the solutions for an energy transition towards zero or net-zero emissions. Unlike earlier waves of interest in hydrogen, this new wave focuses on creating a link between renewable electricity and hard-to-electrify end uses.
Its drivers include: low renewable electricity costs, the maturity of relevant technology, power system flexibility benefits, national pledges to achieve net-zero emissions, and a more extensive base of interested stakeholders.
WAY FORWARD
HNational pledges to achieve net-zero emissions
Low renewable energy cost
Extensive base of interested stakeholders
Maturity of relevant technology
Power system flexibility benefits
1.01Hydrogen
Broader use of hydrogen

62
MAKING THE BREAKTHROUGH
Indeed, the years 2019 and 2020 witnessed increased momentum for green hydrogen, with many countries around the world implementing national hydrogen strategies or announcing their intentions to do so. Measures to support green hydrogen have even been included in post-COVID-19 recovery packages.
Although interest in green hydrogen is reaching unprecedented levels, several barriers impede its full contribution to the energy transition. The primary obstacle is the high cost of green hydrogen compared to grey hydrogen and fossil fuel sources. Other barriers include the lack of dedicated infrastructure, the lack of value recognition for reduced GHG emissions, and other barriers related to the development of an emerging industry.
While the hydrogen sector has received attention from governments, more dedicated policy support is needed to ensure technology readiness, market penetration and market growth. IRENA has identified four pillars for green hydrogen policy making: national hydrogen strategies, policy priorities for green hydrogen, guarantee of origin systems and enabling policies.
National hydrogen strategies define a country’s level of ambition for hydrogen and outline the amount of support required to achieve such ambition. They serve as a reference for private actors in the hydrogen industry, helping to encourage increased levels of financing. Effective national strategies should lay out a clear pathway to increasing hydrogen uptake.

63
A wide range of end uses can utilise green hydrogen. To avoid diluting efforts, national policy makers should identify the applications that provide the highest value and prioritise action towards them. By doing so, governments can ensure that their policy efforts provide more immediate benefits, creating higher demand for green hydrogen.
Guarantee-of-origin schemes should be based on life-cycle greenhouse gas emissions. They should be designed to allow policy makers and end users to understand the impact of this energy carrier, ensure consistency and compatibility with emissions for other commodities, and allow comparison with other energy sources.
Enabling policies are economy-wide policies that can help to level the playing field between hydrogen and fossil fuels. These policies should be applied to allow hydrogen actors to provide value to the entire energy system, and to broader economic and social systems.
Green hydrogen policies and technology costs

64
MAKING THE BREAKTHROUGH
AFC TCP (2020), Energy technology perspectives 2020, International Energy Agency Advanced Fuel Cells Technology Collaboration Programme, Paris, www.iea.org/reports/energy-technology-perspectives-2020.
BNEF (2020), Hydrogen economy outlook, BloombergNEF, London.
BNEF (2019), Renewable Energy Auctions Database, BloombergNEF, London (requires subscription).
Böhm, H. et al. (2020), “Projecting cost development for future large-scale power-to-gas implementations by scaling effects”, Applied Energy, Vol. 264, pp. 114780, https://dx.doi.org/10.1016/j.apenergy.2020.114780.
Cihlar, J. et al. (2020), Hydrogen generation in Europe: Overview of key costs and benefits, European Commission, Brussels, https://dx.doi.org/10.2833/122757.
Eichman, J., K. Harrison and M. Peters (2014), Novel electrolyzer applications: Providing more than just hydrogen, National Renewable Energy Laboratory, Golden, Colorado, www.nrel.gov/docs/fy14osti/61758.pdf.
European Commission (2020)
H-vision (2019), Annexes to the H-vision main report, Rotterdam, www.deltalinqs.nl/stream/h-vision-annexes-to-the-main-report/20190702124825.
Hydrogen Analysis Resource Center (2016), “Hydrogen pipelines September 2016”, Hydrogen Tools, https://h2tools.org/sites/default/files/ imports/files//Hydrogen%2520Pipelines%2520 September%25202016.xlsx.
Hydrogen Council (2020), Path to hydrogen competitiveness: A cost perspective, Brussels, https://hydrogencouncil.com/wp-content/uploads/2020/01/Path-to-Hydrogen-Competitiveness_Full-Study-1.pdf.
Ikäheimo, J. et al. (2018), “Power-to-ammonia in future North European 100% renewable power and heat system”, International Journal of Hydrogen Energy, Vol. 43, Elsevier, Amsterdam, pp. 17295-17308, www.sciencedirect.com/science/article/abs/pii/S0360319918319931?via%3Dihub.
IRENA (2020a), Global renewables outlook: Energy transformation 2050, International Renewable Energy Agency, Abu Dhabi.
IRENA (2020b), Reaching zero with renewables: Eliminating CO2 emissions from industry and
transport in line with the 1.5°C climate goal, International Renewable Energy Agency, Abu Dhabi.
IRENA (2020c), Renewable power generation costs in 2019, International Renewable Energy Agency, Abu Dhabi.
IRENA (2020d), Green hydrogen cost reduction: Scaling up electrolysers to meet the 1.5°C climate goal, International Renewable Energy Agency, Abu Dhabi.
IRENA (2020e), Power system organisational structures for the renewable energy era, International Renewable Energy Agency, Abu Dhabi.
IRENA (2020f), Green hydrogen: A guide to policy making, International Renewable Energy Agency, Abu Dhabi.
IRENA (2019a), Hydrogen: A renewable energy perspective, International Renewable Energy Agency, Abu Dhabi.
IRENA (2019b), Renewable energy auctions: Status and trends beyond price, International Renewable Energy Agency, Abu Dhabi.
IRENA (2018), Hydrogen from renewable power: Technology outlook for the energy transition, International Renewable Energy Agency, Abu Dhabi.
IRENA, IEA and REN21 (2020), Renewable energy policies in a time of transition: Heating and cooling, IRENA, Organisation for International Co-operation and Development / International Energy Agency and Renewable Energy Policy Network for the 21st Century, Abu Dhabi and Paris.
ISPT (2020), Gigawatt green hydrogen plant: State-of-the-art design and total installed capital costs, Hydrohub Innovation Program, Institute for Sustainable Process Technology, Amersfoort, https://ispt.eu/media/ISPT-public-report-gigawatt-green-hydrogen-plant.pdf.
Liu, Z. et al. (2020), “Near-real-time monitoring of global CO2 emissions reveals the effects of the COVID-19 pandemic”, Nature Communications, Vol. 11, Springer Nature, London, www.nature.com/articles/s41467-020-18922-7.
Masdar (2019), “Dumat Al Jandal”, Masdar website, 10 January, https://masdar.ae/en/masdar-clean-energy/projects/dumat-al-jandal.
Mayyas, A. et al. (2019), Manufacturing cost analysis for proton exchange membrane water electrolyzers, Technical Report NREL/TP-6A20-72740, National Renewable Energy Laboratory, Golden, CO, United States.
REFERENCES

65
Green hydrogen policies and technology costs
Monolith (2020), “Monolith Materials plans to build country’s first large scale carbon-free ammonia plant”, Monolith Materials, Lincoln, Nebraska, 6 October, www.monolithmaterials.com/news/monolith-materials-carbon-free-ammonia-plant.
Morais, L. (2020), “Portugal announces winners in 670-MW solar auction”, Renewables Now, 8 September, www.renewablesnow.com/news/portugal-announces-winners-in-670-mw-solarauction-712816.
NREL (2020), “Gasoline internal combustion engine vehicle”, National Renewable Energy Laboratory, Golden, Colorado, https://atb.nrel.gov/transportation/2020/index.html?t=lg.
Philibert, C. (2020), “Methane splitting and turquoise ammonia”, Ammonia Energy Association, New York, www.ammoniaenergy.org/articles/methane-splitting-and-turquoise-ammonia.
Quarton, C. et al. (2020), “The curious case of the conflicting roles of hydrogen in global energy scenarios”, Sustainable Energy & Fuels, Vol. 4, Iss. 1, Royal Society of Chemistry, Cambridge, pp. 80-95, https://pubs.rsc.org/en/content/articlepdf/2020/se/c9se00833k.
Reiter, G. and J. Lindorfer (2015), “Global warming potential of hydrogen and methane production from renewable electricity via power-to-gas
technology”, The International Journal of Life Cycle Assessment, Vol. 20, Springer Nature, London, pp. 477-489, www.doi.org/10.1007/s11367-015-0848-0.
Staffell, L. et al. (2018), “The role of hydrogen and fuel cells in the global energy system”, Energy & Environmental Science, Vol. 12, Iss. 2, Royal Society of Chemistry, Cambridge, pp. 463-491, www.pubs.rsc.org/en/content/articlepdf/2019/ee/c8ee01157e.
Shumkov, I. (2020), “Record low bid for 2-GW solar project shines in Abu Dhabi”, Renewables Now, 28 April, www.renewablesnow.com/news/record-low-bid-for-2-gw-solar-project-shines-in-abu-dhabi-696804.
US DOE (2017), “Fuel Cells Sub-Program Overview”, FY 2017 Annual Progress Report, Hydrogen and Fuel Cells Program, US Department of Energy, Washington, D.C., www.hydrogen.energy.gov/pdfs/progress17/v_0_papageorgopoulos_2017.pdf.
WEF (2020), Insight report: The net-zero challenge: Fast-forward to decisive climate action, World Economic Forum in collaboration with Boston Consulting Group, Geneva, www3.weforum.org/docs/WEF_The_Net_Zero_Challenge.pdf.
Further references on green hydrogen are listed in the preceding cost reduction study (IRENA, 2020d) and policy guide (IRENA, 2020f).

66
MAKING THE BREAKTHROUGH
PHOTO CREDITS
Page 07: © Alex Vog; shutterstockPage 15: Hamburg, Germany; © FrankHH; shutterstockPage 19: Hydrogen storage tank; © petrmalinak; shutterstockPage 21: Hydrogen Pilot Plant, Loy Yang, Victoria, Australia; © Dorothy Chiron; shutterstockPage 23: Hydrogen train, Groningen, the Netherlands © Sander van der Werf; shutterstockPage 23: © hramovnick; shutterstockPage 23: © zhengzaishuru; shutterstockPage 23: © Nicole Glass Photography; shutterstockPage 23: © alexfan32; shutterstockPage 23: Frankfurt, Germany; © Grzegorz Czapski; shutterstockPage 25: © Sergio Bertino; shutterstockPage 27: © luchschenF; shutterstockPage 28: © Kaca Skokanova; shutterstockPage 29: Groningen, the Netherlands © Sander van der Werf; shutterstockPage 29: Hydrogen Pilot Plant, Loy Yang, Victoria, Australia; © Dorothy Chiron; shutterstockPage 35: © aapsky; shutterstockPage 37: © luchschenF; shutterstockPage 43: Oulu, Finland; © MBNEWS; shutterstockPage 45: © Alexander Kirch; shutterstockPage 46: © Alexander Kirch; shutterstockPage 47: © luchschenF; shutterstockPage 47: Tokyo, Japan; © MAHATHIR MOHD YASIN; shutterstockPage 49: Hydrogen Energy Project, Hastings, Victoria, Australia; © Dorothy Chiron; shutterstockPage 50: Strasbourg, France; © olrat; shutterstockPage 52: © D.Alimkin; shutterstockPage 53: © Wojciech Wrzesien; shutterstockPage 56: © Alexander Kirch; shutterstockPage 58: © Alexander Kirch; shutterstockPage 59: © Anan Chincho; shutterstockPage 59: Hydrocracking installation; © diyanski; shutterstockPage 61: © hramovnick; shutterstockPage 61: © alexfan32; shutterstockPage 62: © Mr Doomits; shutterstockPage 63: © Scharfsinn; shutterstock

67
Green hydrogen policies and technology costs
AEM Anion exchange membrane
CCS Carbon capture and storage
CO2 Carbon dioxide
EU European Union
EUR Euro
H2 Hydrogen
IRENA International Renewable Energy Agency
KPI Key performance indicator
LHV Lower heating value
PEM Polymer electrolyte membrane
PV Photovoltaic
R&D Research and development
RD&D Research, development and demonstration
SMR Steam methane reforming
SOEC Solid oxide electrolysers
UK United Kingdom
US United States
USD United States dollar
VRE Variable renewable energy
WACC Weighted average capital cost
UNITS OF MEASURE°C Degrees Celsius
A Ampere
cm2 Square centimetre
g Gram
GW Gigawatt
ha Hectare
kg Kilogram
kW Kilowatt
kWel Kilowatt electric
kWh Kilowatt-hour
Mt Million tonnes
MW Megawatt
MWh Megawatt-hour
TW Terawatt
V Volt
ABBREVIATIONS

www.irena.org
ISBN 978-92-9260-314-4
MAKING THE BREAKTHROUGHGreen hydrogen policies and technology costs