?lo5 - census.gov · mccarthur 1986: emst and gillman 1988). weights are provided so that...
TRANSCRIPT

I I THE SURVEY OF INCOME AND
PROGRAM PARTICIPATION
I I I I I I I I I I I I I I I I
U. S. Department of Commerce BUREAU OF THE CENSUS
I r
ALTERNATIVE SAMPLES FOR WELFARE DURATION IN SIPP: DOES ATTRITION MATTER
No. 145 ? l o 5
J. Fitzgerald Bureau of the CensusIBowdoin College X. zuo Bureau of the CensusIShanghai Academy of Social Science

I I I Alternative Samples for Welfare Duration in SIPP:
Does Attrition Matter?
I John Fitzgerald, Bureau of the Census and Bowdoin College and Xuejin Zuo, Bureau of the Census and Shanghai Academy
I of Social Science
ABSTRACT
I The survey of Income and Program Participation (SIPP) has been an important tool for studying how long people stay on welfare programs (i.e., welfare durations) because it has monthly
I data on use of various welfare programs. This paper focuses on the impact of alternate treatment of sample attrition when &fining spells of welfare receipt by unmarried mothers. The analysis compares a sample that excludes those who miss an interview to one that does not exclude such cases. The
I latter sample is 60 percent larger. The comparison is based on non-parametric estimates of the probability of remaining on welfare at specified intervals (the survivor function) and hazard models with covariates reflecting the recipient personal characteristics (age, race, education, and children)
I and policy variables (AFDC benefit levels and unemployment rates). The comparison shows that, while attrition affects sample means, conditional estimates from behavioral models are less affected. The paper concludes that attrition may not be a large problem for welfare duration models using
I SIPP. The paper also compares samples with and without imputation and finds little difference.
I KEYWORDS
Welfare duration. attrition bias, imputation
I I. INTRODI JCTION AND BACKGROUND
I Policy makers have long been concerned with the causes and consequences of welfare program use. In the last decade, a number of studies have investigated the dynamics of welfare use. Using longitudinal data on individuals and hazard models. researchers have sought to identify why
I some persons or groups stay longer on welfare than others. The Survey of Income and Program Participation (SIPP) is one important source of data for this work because it includes monthly measures of recipiency for a variety of welfare programs. This paper focusses on the impact of
I alternative treatment of sample attrition and imputations when defining welfare spells in SIPP where a spell means successive months of welfare receipt.
I A. Past Welfare Studm
I I 1

Most work on welfare dynamics is fairly recent. The main welfare program of interest is the Aid to Fadies with Dependent Children program (AFDC), the largest cash welfare program in the U.S. It primady serves unmarried mothers.' Several studies have used annual data. See Hutchens (198 I), Plotnick (1983), Bane and Ellwood (1983) and extension by Ellwood (1986), and part of O'neill, et aL (1984). Annual data can lead to over-statement of welfare dependency since one month of welfare receipt in each of two different years can result in a two year spell of recipiency by the definitions usually used in these studies.
Monthly data bn recipiency has been used by O'neill, et al., in addition to their work cited above, who used administrative records from 1969-1982. Blank (1989) uses monthly data as well, £ram the control group of the Seattle/Denver Income Maintenance Experiments (SIMEDIME) from the mid 1970's. Fitzgerald (1991) compares results on welfare spells from the 1984 Panel of SIPP to those of Blank and finds them quite similar. Ruggles (1989), and Long and Doyle (1989) also use estimates from SIPP.
For our current purposes, we want to focus on how sipp has been used. Ruggles (1989) and Long and Doyle (1989) restrict their interest to welfare spells by persons who completed all interviews of the 1984 SIPP panel. Thus anyone who missed an interview is dropped. Fitzgerald (1988,1991) used a sample of all persons without dropping non-interviews (hereafter called the total panel sample) treating persons who drop from the samples as being censored--that is, contributing no further information--as of the interview missed. These alternative assumptions are our focus.
R. Attntlon m SIPP . . .
As with any longitudinal survey, SIPP sample attrition and non-response problems have received much attention. It has been documented that attrition acts selectively over the course of a panel so that the average characteristics of those completing all interviews, hereafter called complete panel persons, are different from initial average characteristics (McCarthur and Short 1985; Short and McCarthur 1986: Emst and Gillman 1988). Weights are provided so that computations can be performed which correct for this attrition, under the assumption that those remaining in the panel can represent those who dropped out.
Weights can serve other functions as well, such as aiding in specification tests. but we do not propse to enter that debate. Our concern is simply how treatment of sample attrition will affect empirical models of welfare spells. Even if the mean characteristics from the complete panel sample were very different from the total panel sample. behavioral models of welfare use estimated conditional on the observed covariates could be the same.
'Roughly half of the states have also adopted the AFDC-U program which provides aid to two- parent families where the primary earner is unemployed. AFDC-U families constitute less than seven percent of the total AFDC caseload (Committee on Ways and Means, 1989, p. 402, 426).

I ' I G IN Dl W I O N MODELS
I In a certain sense. loss of information due to inability to follow individuals is natural in duration models. We are interested in the length of time that a person remains in a particular state, say receiving welfare. Even if all persons in a panel were completely interviewed over the panel,
I some would still be receiving welfare as the panel ends. For these persons, we do not know the length of their spell due to our inability to continue to interview them. They contribute censored (on
I the right) spells of recipiency. Censoring of this type, as by the end of the panel or a random sample cut, is considered a random event and is routinely handled.2 In a maximum likelihood framework, censored spells contribute information that a spell is at least a given length.
N A stronger result is that more general schemes for censoring can also be ignored (that is, treated as above) when estimating hazard models, provided that the censoring meets a "quasi-
I independence" condition (Lawless 1982, pp. 38-43; Kalbfleisch and Prentice 1980, pp. 1 19- 122; cf, Williams and Lagakos 1977, for a general treatment). Essentially, this condition states that, conditional on all covariates, the censoring process is not selectively terminating spells that are in
I particularly high or low risk of ending normally. In our context, sample attrition censoring is not selectively censoring people according to some unmeasured (or unobservable) covariate related to their exit probability. Non-independent censoring would occur if persons who were just about to end
I their welfare spells leave the sample, for example, Lawless (1982, p., 479-484) and Cox and Oakes (1984, p. 144-146) discuss problems with testmg this assumption. It is normally not testable without strong, arbitrary assumptions on the true functional form of the relationship.
I A related question more relevant for our comparison is whether problems are caused by selecting the subsample of complete panel members, those that missed no interviews. This type of
I sampling scheme, called selection by virtue of survival.%ises issues similar to those above. Hoem (1985) presents a good discussion of the issue and how it relates to the question of the appropriateness of weighting in an event history context. He argues that this type of selection can
I be ignored when it meets a particular condition. The condition states that, conditional on the measured covariates. the probability of attrition (non-selection) does not vary according to the current situation of the person (i.e., whether on welfare or not). Again, the issue is whether unmeasured
1- covariates that determine whether the person survives the panel are related to transition probabilities. Hoem notes that if selection is not ignorable. weighting can be used to counteract the selection bias
1 if the spells have a known probability of inclusion in the target sample.
I I I I I 3
'Recipienc~ spells can also be censored on the left, that is, ongoing at the beginning of the panel. Work with these spells, drawn from the "length-bias" distribution, requires arbitrary assumptions. (Heckman and Singer 1984, p. 103) Previous work on welfare durations has ignored such spells, and we do likewise as noted later.
'Hoem (1985) attributes this phrase to Ryder (1965).

A choice that faces users of SIPP for event history analysis is whether the ease of using the complete panel members and associated panel weights, which provide some guard against the non-ignorable selection by survival, outweighs the gain in sample size available if one is willing to use the total panel. The total panel can be used without weights, or weights could be developed to weight individual spells based on their sample inclusion probability.
Our approach to questions raised above is descrrptive and simple. We adopt a null hypothesis of independent censoring and ignorable selection. Under this null hypothesis, we estimate models using usual methods from alternative samples, one including only cases that complete all interviews and one including only attrition cases. We then test whether estimated parameters from the different samples are equal. Differences are evidence against ignorable selection.
DATA AND S M I 9 -ON
SIPP is a longitudinal sample of households representing the non-institutionalized population of the U.S. It includes monthly information on income, use of government programs, labor force participation, and demographic characteristics. Interviews are conducted every four months during the panel asking about activity in the previous four months. The 1984 panel includes about 20,000 households and interviews began in October, 1983. It consists of eight or nine interviews (32 to 36 months), although some households were dropped after five or six interview^.^ For more details on SIPP, see Nelson, McMillen, and Kasprzyk (1985). We work with the 1984 Longitudinal Research File which potentially includes 32 months of data, and has been longitudinally edited for consistency (SIPP, 1989, pp. B-1 to B-19.
B. Welfare Reciplency . .
We selected a subsample of unmarried women with children (female heads of families) who received welfare or foodstamps at any time during the 1984 panel. We selected this group because female heads are of primary policy interest, and secondly, because the welfare data on this group may be more reliable.Welfare receipt can be defined in a number of ways. Our interest is in the AFDC program and we considered to methods of identifying recipients. Our fust definition codes a woman as a recipient if she reports receiving AFDC income during a given month; our second definition codes her as a recipient if she reports receiving either AFDC or General Assistance. Our second definition includes women who misreport their AFDC receipt as General Assistance, a known
1 About 15 percent of the sample was cut, in a random design, to save costs.
'Problems with rnisreporting of recipiency have been documented by Coder and Ruggles ( 1988) and others. Work leading to Fitzgerald ( 1988) showed that many married couples with income and many men report receiving AFDC. These persons would ordinarily be ineligible. The sample of female heads is categorically eligible due to being unmarried with children,.

problem (Marquis and Moore 1989). This second definition is probably more reliable and we present these result^.^
A spell of welfare receipt is d e M as the length of time that a woman continuously receives welfare income (AFDC or General Assistance). The spell can occur at any time during the panel. To further guard against misreporting, we performed consistency checks to insure that the woman was AFDC eligible, i.e., unmarried and a parent of guar~iian.~
Persons who miss interviews during the p l or refbse to answer specific items may have data imputed to them. For the main results given in the text, we excluded all imputed recipiency data from our analysis. Persons who missed interviews were considered censored at that interview. Appendix tables contain results that use imputed data. Generally, the results are quite similar. We contrast the imputed and non-imputed data results near the close of each section.
Before discussing the counts, some definitions are in order. Completed spells require that we see a month of non-receipt on each side of the spell. Left censored spells are ongoing at the beginning of the panel, or begin immediately after a missed interview. Right censoring, where the woman leaves the panel while still on welfare, occurs in two distinct ways. First, the spell can be censored by the end of the panel or by the sample cuts at the fifth or sixth interview; we call this "independent" right censoring since it occurs randomly. Second, the spell can be censored by attrition, i.e., a missed interview; this type of censoring is potentially non-independent since the censoring process could be related to unobservables associated with leaving AFDC.
Table 1 shows the welfare spells by female heads in the 1984 panel disaggregated by censoring status. This table shows 1172 spells by unmarried mothers, including multiple spells by the same .
6We reason that unmarried women with children who report receiving general assistance are most likely receiving AFDC. An administrative record check supports this assumption. Kent Marquis and Jeff Moore of the Census Bureau Kindly prepared an analysis for us comparing recorded receipt of AFDC from state administrative records for a four state convenience sample, to reported receipt of (a) AFDC alone and (b) AFDC or General Assistance. To the extent possible the analysis worked with unmarried adult women with children in their households. The analysis recipiency from administrative records showed receipt, fell dramatically (to 5 percent from 35 percent) under definition (b). Definition (b) does lead to a slight rise in fals reports of receipt (to 6 percent from 3 percent), but this does not outbalance the former error reduction.
'We eliminated spells where (1) for more than one month of the spell, the woman has no children living with her, and (2), the woman was married for other than the first or last month of the spell. We allowed the one-month inconsistencies in order to prevent timing of reported events withing a month from causing us to drop spells.

person. Panel A shows that our decision to work with only complete and right censored spells reduces sample size considerably; we have 500 complete and right censored spells by female heads. To avoid complications due to multiple spells for some women, but not all, we selected the first observed spell for each woman. finally, we drop persons who joined the panel after the fmt wave . by entering an interviewed household ("associated persons"). This gives our final sample of 384 spells.
We next &fine an indicator FULL, for whether the person completed all interviews, described as complete panel members above. Persons who were present in all 32 months of the panel and who have a positive panel weght are asslgned FTlLL-1, and FULL-) otherwise. Something similar to the FULL-1 sample has been used by Ruggles (1 989) and Long and Doyle (1 989) in studying welfare recipiency .
The bottom panel shows disaggregation by FULL. Note that we lose 37 percent of our spells if we work with the FULL-1 subsample. The panel also shows the potential severity of the non- independent censoring problem. Of the 384 spells, 41 are censored by attrition.
Appendix Table A-1 shows counts for spells using imputed data. Imputations lead to a larger number of spells overall, but also larger numbers of left censored and both left and right censored spells. In panel B, one can see that the number of first observed complete or right censored spells is 383, nearly the same as the 384 without imputed data. We fmd that results for these first observed spells are similar for imputed and non-imputed samples; results that would use left censored data might find bigger differences.*
D. Time on Welfare: Survivor Fu t ions
With the data on first observed spells, we can begin to compare the FULL-0 and FULL=l subsamples, hereafter called the "attrition" sample and "complete" sample, respectively. Table 2 presents Kaplan-Meier estimates of the survivor function for time on welfare. Three' weighting options are shown: ( I ) unweighted, (2) weighted by the cross-sectional weight relevant to the first interview? and (3) weighted by the panel weight. Few analysts will be pleased by the second option:
8 The reader may wonder why the imputed data has disproportionately more FULL=O cases. There are two reasons: (1 ) using imputations causes more FULL= 1 spells to be linked back to the beginning of the panel, thus becoming left censored and not included; (2) using imputations produces more short imputed spells for the FULL=O sample. These short spells are fully imputed (i.e. no non-imputed AFDC is ever reported by these women). We presume that these cases are in our case. (See footnote 14.) Weights have a negligible impact for the complete samples.
The weight used is fnlwgd, the cross-sectional weight for the interview month, from the first wave of the 1984 Panel. Note that this is rn a calendar year weight available in the

I' I it is our attempt to give a weight to everyone in the file using readily available weights. It does
provide some control for initial non-interviews, but does not control for subsequent attrition.
I Based on Table 2, the attrition sample has somewhat shorter spells, i.e., a lower survivor function. The unweighted median spell length, where the survivor function hits 50 percent, is
I between 11 and 12 months for the complete sample; and 9-10 months for the attrition sample. The survivor functions diverge as the data things out in the tails, but the difference is withing sampling error. A log-rank test for equality of the survivor functions between these two samples cannot reject
I that the survivor functions are the same.'' This test does not take into account the clustered sampling of the SIPP design, but this effect may not be important in our case. (See footnote 14.) Weights have
1 a negligible impact for the complete sample.
Results using imputed data, shown in Table A-2, lead to similar conclusions. Interestingly,
I the overall survivor hctions are nearly the same for the imputed and non-imputed data, suggesting that the imputatimdo not affect estimated spell length.
I Whether the survivor functions differ or not, the attrition and complete samples could have identical exit rate hazards . . on measured covariates, a point to which we now turn.
I ARE I iAURlX - I The conceptual model that underlies estimation of exit rates from AFDC is a model of choice:
a woman on AFDC chooses between the option of staying on or getting off welfare. In these discrete
I choice models, a woman chooses the option that maximizes the present value of her expected utility given her current constraints. The non-welfare option is often taken to be gett a job, increasing current work hours, or marrying. The expected returns on these options can vary through time, as
I job offers are obtained for example, producing a sequence of decision giving rise to spells. See Blank (1989) for an example.
I B. Variable D e w . .
The brief discussion above suggests a parsimonious set of covariates that are relevant for a
I I
Longitudinal Research File. The Wave 1 weights were extracted from the wave by wave SIPP file and appended to the Longitudinal Research File data.
I "'For log-rank test on the unweighted sample, we obtained a Chi-square statistic of 408 with 1 degree of freedom, giving a p-value of .52. Our SAS statistics package could not produce this
I test for a weighted sample. For the unweighted sample using imputed data, the Chi-square was .30 (p-value .58).
I I 7

welfare duration model. Multivariate hazard models are presented in the next section. This section describes the relevant variables and shows how they differ between the attrition sample and the full sample.
Table 3 shows descriptions of the variables and means taken at the beginning of the spell. Most are self-explanatory. State-level variables were assigned to persons based on state of residence." State welfare benefits are measured by the maximum AFDC payment for a family of four. This is an indicator of the relevant components of a state's welfare package. Obviously, it also picks up effects of other correlated, but unmeasured, state specific attributes (Ellwood and Bane 1985). The unemployment rate, UNEMP, is an annual rate by state.
The means reveal several differences between the attrition sample and the complete sample. Those m the complete sample are somewhat no re likely to be black and have higher average age, but most characteristics are quite similar. The slightly higher proportion black in the complete sample is puzzling since other tabulations from SIPP using different sample show higher attrition among blacks (Short and McCarthur 1986; Ernst and Gillman 1988). But it could simply reflect sampling variability with our small sample size. Other sample differences are consistent with these earlier tabulations. Differences in unemployment and AFDC benefit levels reflect geographic residence differences and calendar time differences.
Imputed data means m Table A-3 are similar, although they show proportionately more blacks in the attrition sample. We believe that this change reflects that blacks are more likely to be imputed with AFDC.
D SPECIFICATION AND RESULTS '
We estimated several types of reduced form hazards and duration models. Inthis paper we report our estimates f?om two specifications. First we show a log-normal regression model for spell length, based on covariates measured at the beginnjng of the spell. '' Second, we show a discrete time hazard for exit rates from welfare. The latter model is preferred for two reasons: it allows a fairly flexible specification for the shape of the hazard and it allows time-varying covariates."
"We linked our data files to internal Census files that identify state of residence for each sample member. Public use files for SIPP only identify 38 separate states. The rest are grouped for confidentiality or are not sampled.
"We also ran Weibull and log-logistic hazards and found results quite similar to those of the log-normal .
13We ignore a well known problem in SIPP, the "seam" problem whereby transitions are reported more frequently between interviews than within interview (Burkhead and Coder 1985; Jabine 1990, pp. 58-60). Fitzgerald (1991) attempts to control for the probletn by using dummy variables to indicate transitions at the seams, and finds that the correction makes little

I I Let the (uncensored) length of spell for individual i be T,. If Yi=log (Ti) is normally distributed
then spell length is log normally distributed. We assume that the conditional mean of Yi equals 6'Xi where Xi represents the beginning of spell covariates. Construction of the likelihood under the
I assumption of independent censoring can be found in many texts (e.g. Lawless 1982, p. 314).
Table 4 shows three sets of results: unweighted, weighted by the fmt interview weight, and
1 weighted by the pnei weight. Comparison between the complete panel sample (FULL-1) and the total sample (FULLA or 1) gives an indication of both the difference in the coefficients and the effect
I of the larger sample size. Asymptotic standard errors are computed from the information matrix. While these standard errors are biased because we do not take into account the sample clustering in SIPP, this design effect may not be large in our case.14 Further, taking account of clustering would
I likely increase the measured standard errors, i.e., remove downward bias in variances, and make it more likely that we Id accept a hypothesis of no difference between samples.
m The coefficients in the table have signs that we expect. Higher education shortens spells, while being black, haing young children, and geing in a high benefit state lengthens spells. The remaining coefficients are statistically insmcant, although the point estimates have reasonable
I interpretations in light of our conceptual model.
Coefficients appear roughly similar between the complete and total sample, although the
I coefficients in the total sample are somewhat attenuated toward zero, particularly for BLACK and NKIDS. To see if there is a significant difference overall, we ran a likelihood ratio test for the restriction that the coefficients are equal between the attrition (FULL=O) and complete (FULL-1)
I samples. For the unweighted sample, we found that the coefficients are not significantly different. For the sample weighted by the first interview weight (Fnlwgt), we can reject that the coefficients are
I I difference for AFDC spell data. We hope to pursue better corrections in future work.
I I4 To give a rough idea of the extent of clustering for our sample of spells, we ran a simple test suggested by Bob Fay of the Census Bureau. We ran the test on data from the 1985 panel-
I -we are simultaneously working with this data--since we do not have the strata codes in the 1984 longitudinal file at this time. We conjecture that the 1984 results would be similar. We pseudo strata codes provided in SIPP for variance estimation. We computed a
I Chi-square test for independence across the cells. For the sample of all persons with welfare spells, we obtained Chi-square statistic of 85.9 with 71 degrees of freedom. This gives a p- value o f . 109, not highly significant. For the sample of persons with first observed, complete
I or right censored spells, the p-value is .078. This suggests that the spells are not heavily clustered, which gives us some confidence in our standard errors.
I I 9

the same.'' Thus there is some evidence that the samples differ, but this is the only test in the paper where we see an overall statistically significant difference.
By comparing standard errors between the complete and total sample, a moderate gain in precision can be seen from using the larger total sample. But, based on t-tests at conventional levels, the overall picture is similar. This is because attenuation of the coefficients balances the gain in precision. The exception is that the coefficient on black becomes insignificantly different from zero in the total sample.
To see the effect of the three weighting schemes, not that the coefficients and standard errors are fairly similar across all three schemes for the complete samples. Lastly, the imputed data sample in Table A-4 produces nearly the same results as above. For the imputed data sample, the likelihood ratio test for equality of coefficients between the complete and attrition sample cannot reject that they are equal.16
rn B. Discrete Hazard h b k €
A discrete time hazard model assumes that failure and censoring times are observed in intervals. Define the discrete time hazard rate as
Pi(t) = Prob(Ti=t 1 Ti >= t, X,(t)) where Ti is a discrete random variable for (uncensored) spell length, and &(t) are the covariates at time t. The sample likelihood function is the product of individual likelihood piece which are one of two kinds. Persons with complete spells contribute
t- 1 Prob(Ti = t 1 xi(t)) = Pi(t)II (1 -Pi(t))
j- 1
Persons with censored spells contribute
t Prob(Ti > t 1 xi(t)) = I1 (1 -Pi (t))
j- 1
'' For the unweighted sample the Chi-square statistic has a value of 10.8 with 10 degrees of freedom (10 restrictions); this is not significant at a 10 percent level. For the sample weighted by the first interview weight (Fnlwgt), the statistic equals 20.2, also with 10 degrees of freedom, which is significant at a five percent level.
'"or estimates from the imputed data sample, the likelihood ration Chi-square statistics were 9.3 and 9.2 for the unweighted and weighted cases, respectively. Neither are significant at a ten percent level.
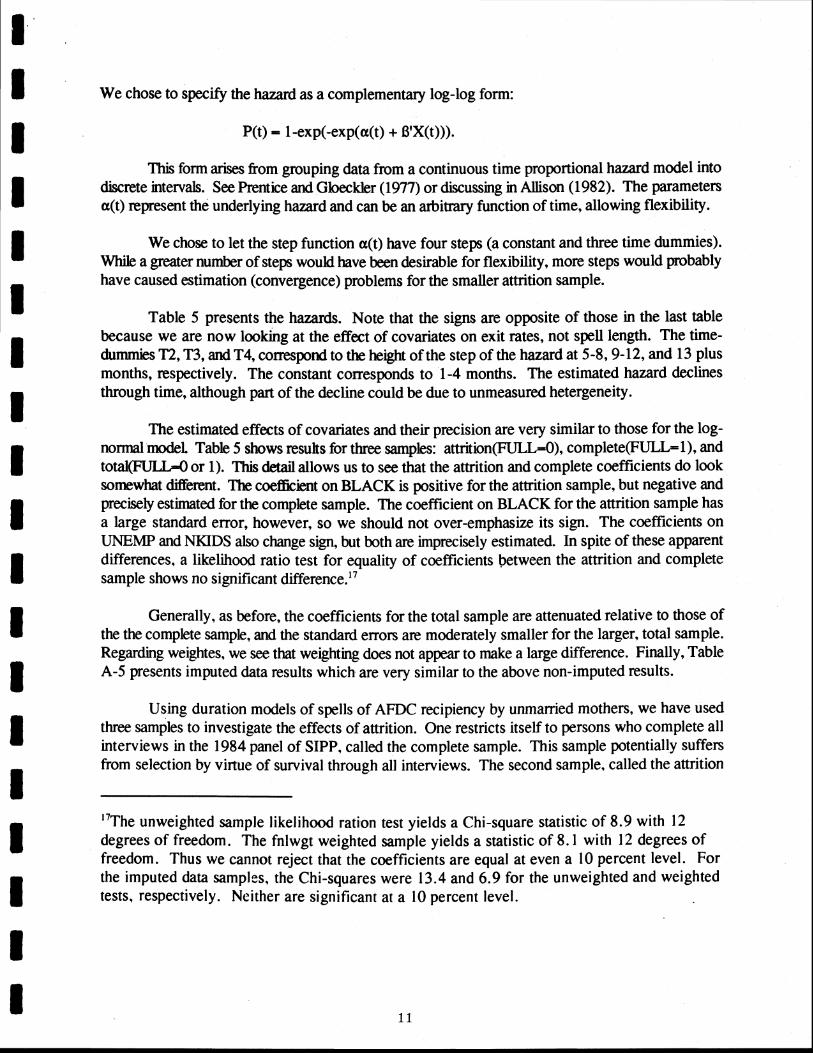
We chose to specify the hazard as a complementary log-log form:
This form arises from grouping data from a continuous time proportional hazard model into discrete intervals. See Prentice and Gloeckler (1977) or discussing in Allison (1982). The parameters a(t) represent the underlying hazard and can be an arbitrary function of time, allowing flexibility.
We chose to let the step function a(t) have four steps (a constant and three time dummies). While a greater number of steps would have been desirable for flexibility, more steps would probably have caused estimation (convergence) problems for the smaller attrition sample.
Table 5 presents the hazards. Note that the signs are opposite of those in the last table because we are now looking at the effect of covariates on exit rates, not spell length. The time- dummies 72 , T3, and T4, correspond to the h e a t of the step of the hazard at 5-8,9-12, and 13 plus months, respectively. The constant corresponds to 1-4 months. The estimated hazard declines through time, although part of the decline could be due to unmeasured hetergeneity.
The estimated effects of covariates and their precision are very similar to those for the log- normal model. Table 5 shows results for three samples: attrition(FULL==O), complete(FULL- 1 ), and total@ULLdl or 1). This detail allows us to see that the attrition and complete coefficients do look somewhat different. The coefkient on BLACK is positive for the attrition sample, but negative and precisely estimated for the complete sample. The coefficient on BLACK for the attrition sample has a large standard error, however, so we should not over-emphasize its sign. The coefficients on UNEMP and NKIDS also change sign, but both are imprecisely estimated. In spite of these apparent differences, a likelihood ratio test for equality of coefficients between the attrition and complete sample shows no significant difference."
Generally, as before, the coefficients for the total sample are attenuated relative to those of the the complete sample. and the standard errors are moderately smaller for the larger, total sample. Regarding weightes, we see that weighting does not appear to make a large difference. Finally, Table A-5 presents imputed data results which are very similar to the above non-imputed results.
Using duration models of spells of AFDC recipiency by unmarried mothers, we have used three samples to investigate the effects of attrition. One restricts itself to persons who complete ail interviews in the 1984 panel of SIPP, called the complete sample. This sample potentially suffers from selection by virtue of survival through all interviews. The second sample, called the attrition
"The unweighted sample likelihood ration test yields a Chi-square statistic of 8.9 with 12 degrees of freedom. The fnlwgt weighted sample yields a statistic of 8.1 with 12 degrees of freedom. Thus we cannot reject that the coefficients are equal at even a 10 percent level. For the imputed data samples, the Chi-squares were 13.4 and 6.9 for the unweighted and weighted tests, respectively. Neither are significant at a 10 percent level.

sample, uses spells by persons who were initially interviewed, and later dropped the attrition sample, uses spells by persons who were initially interviewed, and later dropped out. The third sample, called the total sample, combines the first two. Te total sample is 59 percent larger than the complete sample (384 spells compared to 242).
We have several conclusions. One, overall (unconditional) Kaplan-Meier estimates of spell length show that the complete sample has somewhat longer spell lengths, although the difference is not statistically s igMlc~ t . Two, if we use (behavioral) models of spell length that allows us to condition on relevant covariates, estimated effects of covariates are generally similar, with some exceptions, notably race. Moreover, using a likelihood ratio test, one generally cannot reject that coefficients are the same for the spells from the complete sample versus the spells from the attrition sample. (There was a statistically si@icant difference in one the eight such tests reported here.) We should add that we are dealing with moderate to small sample sizes, and larger samples might better detect differences. Three, the much larger sample size of the total sample does give a moderate improvement in precision for effects of covariates. However, overall t-values do not change much since the total sample coeaients are smaller relative to the complete sample. Four, weights do not have a large impact. Five, redefining spells using imputed data produces results that are remarkably similar to those that exclude imputed recipiency data.
Even though attrition can alter sample means for some characteristics, our model-based results suggest that attrition may not be a large problem for welfare duration models using SIPP. Those who want to use readily available panel weights can work with the complete sample, and not suffer large loss efficiency. Those who prefer to depend on models and work with unweighted samples can enjoy the benefits of 60 percent larger samples if the total sample is used. For those who want weights for the larger sample, improved weighting schems for this type of spell data in SIPP must be developed.
REFERENCES
ALLISON, PAUL D. (1982), "Discrete-Time Methods for the Analysis of Event Histories," '
cal MeWology, edited by Samuel Leinhart. San Francisco: Jossey-Bass. . .
BANE, MARY JO, and ELLWOOD, DAVID (1983). The Dyn&s of DependePce: T k Route to Self S lafficlencv. Report prepared for U.S. Department of Health and Human Services, Urban Systems Research and Engineering, Inc.
BLANK, REBECCA (1989), "Analyzing the Length of Welfare Spells," Economics, 39,245-74.
BURKHEAD. D., and CODER, J. (1985), "Gross Changes in Income Recipiency from the . . Survey of Income and Program Participation," Proceedings of the Social ~ s t ~ c s Sect- . . ~cal Assoution Meetmgs. 35 1-56.
CODER. JOHN. and RUGGLES, PATRICIA (1988), "Welfare Recipiency as Observed in the SIPP." SIPP Working Pamr Series. No. 88 18. Bureau of the Census. Washington.

I I COMMITTEE . . ON . WAYS . . AND MEANS (1987), Background Data
w l t h g the J- of the C w e e on Wavs aqdAkam, U.S. House of
I Representatives, Washington, D.C.: Government Printing Office.
. . . . COX, D.R., and OAKES, D. (1984), on
I of SurvivalRm, Cambridge: Chapman and Hall.
ELWOOD, DAVID (1986), -8 Would Be' L B . . , Report
I prepared for U.S. Department of Health and Human Services, Princeton NJ: Mathematica Policy Research.
I ELLWOOD, DAVID, and BANE, MARY JO (1985), 'The Impact of AFDC on Family Structure and Living Arrangements," p, edited by Ran Ehrenberg, Vol
I 7. Greenwich CN: JAI Press.
ERNST, LAWRENCE, and GILLMAN, DANIEL (1988), 'Excluding Sample That Misses Some Interviews from SIPP Longitudinal Estimates," W P WarlungPaper S
I @, No. 8825.
l T ' I Z G M , JOHN (1988), 'The Effects of the Marriage Market and AFDC Benefits on . . . . .
I Recipient Duration on AFDC," Individuals and T m 1 Jn- . . through, 157-72, Washington, D.C.: U.S. Department of Commerce, Bureau of the Census.
I e l ) , 'Welfare Duration and the Marriage Market: Evidence from SIPP," H u m a n o u r c e s (forthcoming).
I HOEM, J.M. (1985), 'Weighting Misclassification, and Other Issues in the Analysis of Survey Samples of Life Histories," v s of J 'abor M&et D m . . , edited by James Heckman
i and Burton Singer, 249-93, New York: Cambridge University Press.
HUTCHENS, ROBERT (1981), "Entry and Exit Transitions in a Government Transfer
I Program: The Case of Aid to Families with Dependent Children," The J o u m a l o f ~ u m a n , 16,217-37.
I JABINE, THOMAS B. (1990), Survey of Inco rned P r o m P-, . . . Washington, D.C.: U.S. Bureau of the Census.
I . . . . KALBFLEISCH, JOHN D., and PRENTICE, ROSS L. (1980), Wiley Ser~es m ProbdaLQ . . . . -s.. The S t ~ t ~ c a l Analysis of Failure T-, New York: John Wiley
I and Sons, Inc.
LAWLESS. JERALD F. (1982). Statlstlcal M o d e l s a n d M e t h o d s e . . . . , New
i York: John Wiley and Sons, Inc.
8 13

LONG, SHARON K., and DOYLE, PAT (1989), 'Welfare Recipiency and Welfare Recidivism: An Analysis of Short-term Dynamics," Presented at the Allied Social Science Association Meetings.
MARQUIS, KENT, and MOORE, JEFF (1989), "Response Errors in SIPP: P r e w Results," p ~ o f C o w , Washington, DC.: U.S. Bureau of the Census.
MCCARTHUR, EDITH, and SHORT, KATHLEEN (1985), "Characteristics of Sample Attrition in the Survey of Income and Program Participation," Proceedings of the Sectian on &UW!
NELSON, D., MCMILLEN, D., and KASPRZYK, D. (1985), "An Overview of the S m , Update 1 ," SIPP WoxhgPaper S-, No. 8401.
OtNEIL, JUNE, WOLFE, DOUG, BASSI, LAURA, and HANNAN, MARK (1984), "An Analysis of Time on Welfare," report prepared for the Department of Health and Human Services by Urban Institute.
PLOTNICK, ROBERT (1983), "Turnover in the AFDC Population: An Event History Analysis," The, 18,665-8 1.
PRENTICE, R.L., and GLOECKLER, L.A. (1978), "Regression Analysis of Grouped Survival Data with Applications to Breast Cancer Data," Biomeuics, 3457-67.
RUGGLES, PATRICIA (1989), "Welfare Dependency and Its Causes: Determinants of the Duration of Welfare Spells," SIPP W o r m Pamr S- No. 8908, Bureau of the Census, Washington, D.C.
RYDER, N.B. (1%5), 'The Measurement of Fertility Patterns," Change, edited by M.S. Sheps and J.C. Ridley, Pittsburg: University of Pittsburg Press.
SHORT, KATHLEEN, and MCCARTHUR, EDITH (1986), "Life Events and Sample Attrition in the Survey of Income and Program Participation," P m - survey
h Methods Ameri-~cal Association Meet . . . . w, Chicago IL.
SIPP (1989). S u r v e y . o m e md Pro- (SIPP) 1984 F u l l Micrc&iLa . . .
h File. Prepared by Data User Services Division. Washington D.C.: Bureau of the Census.
WILLIAMS. J.S., and LAGAKOS. S.W. (1977). "Models for Censored Survival Analysis: Constant-Sum and Variable-Sum Models," Bimetrika. 64. 21 5-24.

Table 1. Welfare Spells by Female Heads in 1984 SIPP Panel Sample Counts (Non-Imputed Data)
Panel A: All Spells AFDC On1 y AFDC or General
Assistance
Count Percent Count Percent
I. All Spells (including multiple) 1214 -- 1480 --
11. Spells by Eligible Women (unmanied with children 1056 100.00 1172 100.00
A. Complete 1 176 16.67 243 20.73
B. Right Censored 2 233 22.06 257 21.93
C. Left Censo~d 3 176 16.67 283 24.15
D. Both Right and Left Censod 4 47 1 44.6 389 33.19
Panel B: AFDC or General Assistance Sample Disaggregate by Full
F U L M Full=l Total
I. Complete Count 65 123 188 Column Percent 45.77 50.83 48.96
11. Right Censored 1. Independently Censored
Count 3 6 119 155 Column Percent 25.35 49.1 7 40.36
2. Censored by Attrition Count 4 1 0 4 1 Column Percent 28.87 0.00 10.68
111. Total Count 1 42 242 3 84 Row Percent 36.98 63.02 100.0
Note: Authors' compiitiuion. Sample of spell by wonlen who were inmartied mothers. on (a) AFDC alone or (b) AFDC or Gcncral Assistance. at some time dtuing 1984 Panel of SIPP. Full-1 sample completed all intewiews: Ful l4 mssed at least onc. P i u ~ l B shows tabdat~on for the fitst complctc or tight censolrcl spll .

Table 2. Survival Functions for the First Observed Spell of AFDC by Female Heads
(Non-Imputed Data)
Spell Len&
Unweighted Weighted by Fnlwgt by pnlwgt
( M O ~ ) Full-1 Ful l4 Full-1 Ful l4 Full- 1 0 1 .m 1 . o m 1 .m 1 .00000 1.00000
25 0.35498 0.35768 0.35280 Notes: AutholJs computations for sample of unmarried women with children receiving AFDC or General
Assistance. from 1984 Panel of SIPP.

I Table 3. Means for Sample of Female Heads at Beginning of First Observed Spell of AFDC
(Non-Imputed Data)
ariable Unweighted Weighted by Fnlwgt by Mwgt
I Full- 1 Ful l4 Full-1 Ful l4 Full-1 Complete Attrition Complete Attrition Complete
GE (at spell beginning 6 29.1 8$9 27.8521 29.1442 27.8515 28.831 1 UC (highest grade
completed) 10.8388 10.8873 10.8648 10.8879 10.9507 ,BLAO( (1-black, &white
or other) 0.3884 0.3661 0.3920 0.3480 0.4295
PROPING (property income) 1.8016 0.0704 1.5857 0.0693 1.2636
1 . 7 m 1.6760 1.7167 1.6028 1.6874 S (Number of kids
age < 6 0.7520 0.7676 0.7557 0.7504 0.7507
L M A X (maximum benefit level for family of four, by state, $100)
L 4.3683 4.2316 4.3709 4.1562 4.3696
h@ (percent) 8.6404 9.2485 8.5907 9.2410 8.6141
fz%%'aE!$h 11-12 9- 10 12-13 9- 10 11-12
Sample Size 2 42 142 2 42 142 242
r otes: Authors' computation. Sample of unmarried mothers lyceiving AFDC or General Assistance. from 1984 Panel of SIPP.
I I 1 I I I I I 17
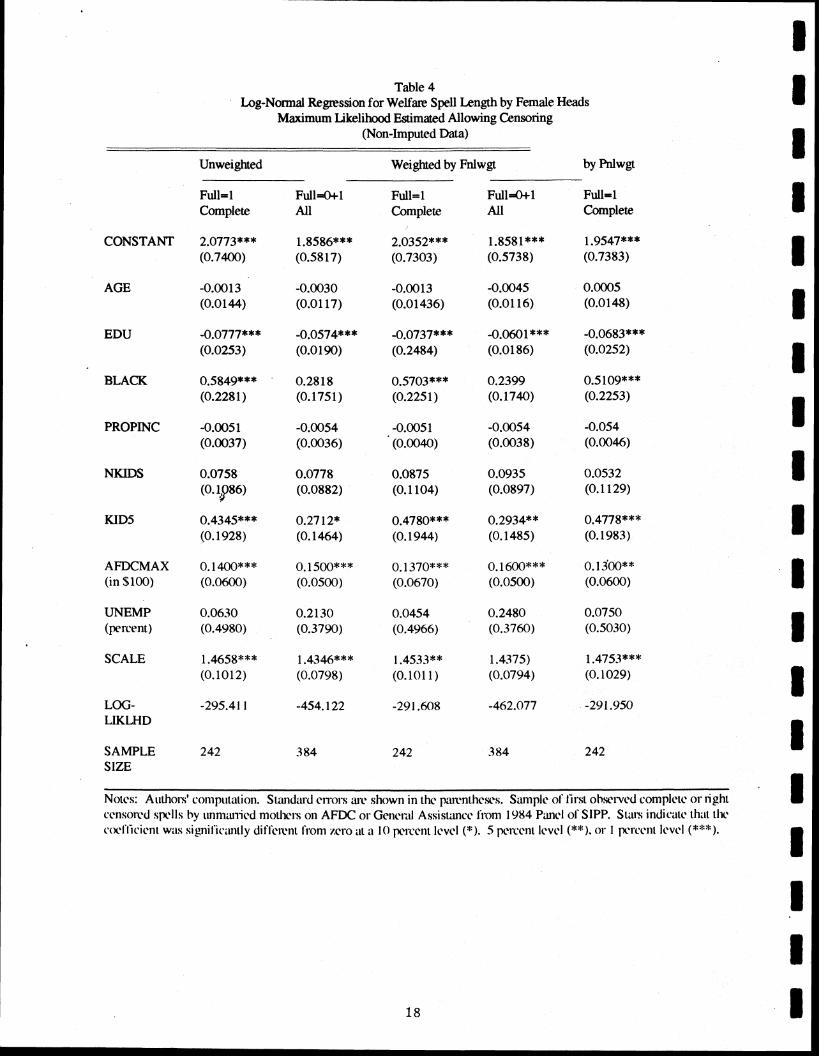
Table 4 Log-Normal Regression for Welfare Spell Length by Female Heads
Maximum Likelihood Estimated Allowing Censoring (Non-Imputed Data)
Unweighted Weighted by Fnlwgt by Pnlwgt
Full-1 Full-O+l Full-1 Full-Oel Full-1 Complete All Complete All Complete
CONSTANT 2.0773*** 1.8586*** 2.0352*** 1.8581*** 1.9547*** (0.7400) (0.5817) (0.7303) (0.5738) (0.7383)
AGE -0.001 3 -0.0030 -0.0013 -0.0045 0.0005 (0.0 1 44) (0.01 17) (0.0 1436) (0.0 1 16) (0.0 148)
EDU -0.0777*** -0.0574*** -0.0737*** -0.0601*** -0.0683*** (0.0253) (0.01 90) (0.2484) (0.01 86) (0.0252)
BLACK 0.5849*** 0.281 8 0.5703*** 0.2399 0.5109*** (0.2281) (0.1751) (0.2251) (0.1740) (0.2253)
PROPINC -0.005 1 -0.0054 -0.005 1 -0.0054 -0.054 (0.0037) (0.0036) (0.0040) (0.0038) (0.0046)
AFDCMAX 0.1400*** 0.1500*** 0.1370*** 0.1600*** 0.13'00** (in $100) (0.0600) (0.0500) (0.0670) (0.0500) (0.0600)
UNEMP 0.0630 0.2130 0.0454 0.2480 0.0750 (percent) (0.4980) (0.3790) (0.4966) (0.3760) (0.5030)
SCALE 1.4658*** 1.4346*** 1.4533"" 1.4375) 1.4753""" (0.1012) (0.0798) (0.101 1) (0.0794) (0.1029)
LOG- -295.41 1 -454.122 -291.608 -462.077 -291.950 LIKLHD
SAMPLE 242 3 84 242 3 84 242 SIZE
Note's: Authot?i' coiiipittation. S~aldiil.d CITO~S mv shown in the pi~vnthcsc.~. Siunplc of tirst ohw~lrcd coniplctc or tight cc11sorc.d spclls by immanicd niotlwts on AFDC or Gcncntl Assistmcc froni 1984 Pancl o f SIPP. Slaus indicatc thi~t thC cocl'l'icicn~ was significiu~tly dilli'~mt h n i rcro a 1 0 Fwcnt lcvcl (*). 5 vrccnt lcvcl (*:Ic). or 1 pcrccnt lcvcl (:I:#::':).

Table 5. Parameter Estimates from the Discrete Hazard Model
(Non-Imputed Data)
Unweighted Weighted by Fnlwgt by M w @
Full- 1 FullLOI-1 Full- 1 Full-O+l Full-1 Complete All Complete All Complete