linking organisational culture and values with a firm’s
TRANSCRIPT

Linking organisational culture and values with a firm’s performance
A case study from the New Zealand airline industry
by
Cato Sæle
A 90 credit thesis submitted in partial fulfilment
of the requirements for the degree of
Master of Business
Unitec Business School
Unitec New Zealand
2007

ii
ABSTRACT
The purpose of this research has been two fold. Firstly to conduct a cultural assessment of a
New Zealand airline (referred to as “Pukeko Air Ltd.” for confidentiality reasons) in order to
identify the perceived current and future preferred organisational culture and organisational
values present in this organisation. Secondly to assess how selected organisational members
associated the present and future cultural and values profile with organisational performance.
A hybrid research methodology was employed, where data was collected in two stages; one
quantitative and the other qualitative. First, a quantitative survey questionnaire was distributed
to all employees, effectively combining Cameron and Quinn’s (1999) Organisational Culture
Assessment Instrument, and McDonald and Gandz’ (1992, p. 69) “Shared values for the
modern business corporation”. Second, the results and outcome of the survey formed the basis
for six qualitative interviews with senior management staff. The interview questions sought
management’s interpretation of survey findings, and in particular the relationship between the
current and future cultures and values and associations with organisational performance.
The findings from the research show a relatively close alignment between the current and
preferred future organisational culture. This signifies that the organisation is in a good
situation for the future. Moreover, the research project sought senior staff members’
perceptions of organisational culture’s role in performance. The findings suggest performance
is somewhat affected by culture and values, and that these elements helps determining what
sort of airline the organisation wants to become, as well as reducing impact of external factors
affecting the company. The study indicates not only what type of culture and which values are
deemed conducive to success from a management point of view, but also highlights the
perceived importance of commitment and ownership in creating a strong culture in this New
Zealand airline.

iii
DECLARATION
Name of candidate: Cato Saele
This Thesis is submitted in partial fulfilment for the requirements for the Unitec degree of
Master of Business.
CANDIDATE’S DECLARATION I confirm that:
• This Thesis represents my own work;
• The contribution of supervisors and others to this work was consistent with the Unitec
Regulations and Policies.
• Research for this work has been conducted in accordance with the Unitec Research Ethics
Committee Policy and Procedures, and has fulfilled any requirements set for this project
by the Unitec Research Ethics Committee.
Research Ethics Committee Approval Number: 2006.723
Candidate Signature: Date:
Student number: 1224365

iv
ACKNOWLEDGEMENTS
There are some people whom I would like to thank for their guidance and support throughout
the process of preparing this research thesis.
First and foremost, I would like to thank my primary supervisor and Associate Head of
School, Dr. Noel Burchell for his insightful comments and advice as well as general support
during the research process. I would also like to thank my associate supervisor and
Programme Director, Dr. Simon Peel for his contribution, comments, and guidance towards
the completion of my thesis.
Second, a special thanks to postgraduate administrator Cynthia Almeida for administrative
support throughout my postgraduate studies. I would also like to acknowledge other members
of staff at Unitec’s School of Management and Entrepreneurship for their assistance in
matters related to this research.
Moreover, I especially like to thank my case study organisation for allowing me to conduct
this study within their firm, and I extend my gratitude for the cooperation and support
throughout my data collection phase.
Finally, thanks to all my fellow postgraduate colleagues for their friendship and
encouragement during our studies in general and throughout the research process in particular.
Last, but definitely most importantly, I want to thank my beloved fiancée Anne for putting up
with me during the two years of time-consuming studies in New Zealand, and in particular
during the research period. I could not have done it if it had not been for your endless love,
encouragement and support.

v
TABLE OF CONTENTS
1 INTRODUCTION.............................................................................................................. 1
1.1 Overview .................................................................................................................... 1
1.2 Objectives of the study............................................................................................... 3
1.3 Methodology .............................................................................................................. 4
1.4 Outline of the thesis.................................................................................................... 5
2 LITERATURE REVIEW................................................................................................... 6
2.1 Introduction ................................................................................................................ 6
2.2 Organisational culture ................................................................................................ 7
2.2.1 What is organisational culture? .......................................................................... 7
2.2.2 Culture as something the organisation “is” versus something it “has” ............ 10
2.2.3 Definitions........................................................................................................ 11
2.2.4 The role of organisational founders and leaders .............................................. 12
2.2.5 Early associations of culture with performance and management ................... 13
2.2.6 Levels of culture............................................................................................... 14
2.2.7 Strength of culture............................................................................................ 15
2.2.8 Sub-cultures and counter cultures .................................................................... 16
2.3 Values....................................................................................................................... 18
2.3.1 Shared values.................................................................................................... 19
2.3.2 Values in the workplace ................................................................................... 21
2.3.3 Values and organisational effectiveness .......................................................... 22
2.4 Culture and performance.......................................................................................... 24
2.4.1 Culture’s role in competitive advantage, effectiveness, and profit .................. 25
2.4.2 Uniqueness of culture....................................................................................... 28
2.4.3 Approaches to the culture-performance relationship ....................................... 28
2.4.4 Critique of the culture-performance link.......................................................... 29
2.5 Organisational culture assessment ........................................................................... 29
2.5.1 Appropriate means of measurement................................................................. 30
2.5.2 Organisational Culture Assessment instrument ............................................... 32
2.6 Organisational culture and the success of airlines ................................................... 33
2.6.1 Airline culture and performance ...................................................................... 34
2.7 Summary .................................................................................................................. 36

vi
3 METHODOLOGY........................................................................................................... 37
3.1 Introduction .............................................................................................................. 37
3.2 Research methodology ............................................................................................. 38
3.3 Data Collection Methods.......................................................................................... 42
3.4 Survey instruments................................................................................................... 45
3.4.1 The Format of the Questionnaire ..................................................................... 45
3.4.2 Pilot Study ........................................................................................................ 46
3.4.3 Research Participants/Subjects......................................................................... 47
3.4.4 The Nature of the Interview ............................................................................. 48
3.5 Data Analysis ........................................................................................................... 49
3.5.1 Demographics................................................................................................... 50
3.5.2 Analysis of Organisational Culture Assessment Instrument............................ 50
3.5.3 Reliability and Validity of OCAI ..................................................................... 51
3.5.4 Analysis of Organisational Values................................................................... 53
3.5.5 Analysis of Open-ended Interviews ................................................................. 55
3.6 Ethical Considerations.............................................................................................. 55
3.7 Summary .................................................................................................................. 56
4 RESULTS AND DISCUSSION ...................................................................................... 57
4.1 Introduction .............................................................................................................. 57
4.1.1 Research process and challenges.......................................................................... 58
4.1.2 Plotting an Organisational Culture Assessment Instrument (OCAI) profile........ 59
4.1.3 Interviews ............................................................................................................. 59
4.2 Survey results part 1: Demographics data................................................................ 61
4.3 Survey results part 2: Organisational culture ........................................................... 63
4.3.1 Perceptions of the current organisational culture................................................. 63
4.3.2 Organisational culture preferred for the future .................................................... 65
4.3.3 Profiles for individual items on the OCAI ........................................................... 67
4.4 Organisational culture plots based on demographic data......................................... 71
4.4.1 Organisational culture: management vs. non- management ................................ 73
4.4.2 Organisational culture: time with organisation .................................................... 75
4.4.3 Organisational culture: entry through organisation A or organisation B ............. 77
4.4.4 Organisational culture: departmental analysis ..................................................... 79
vii
4.5 Research question #1: “How relevant is the organisational culture concept to this
firm?” ....................................................................................................................... 82
4.5.1 Perceived importance of organisational culture to the company and industry: an
interpretation by the researcher ................................................................................ 84
4.6 Research question # 2: “What is the perceived current and preferred culture of the
organisation?”........................................................................................................... 88
4.6.1 The Hierarchy Culture.......................................................................................... 88
4.6.2 The Market Culture .............................................................................................. 90
4.6.3 The Adhocracy Culture ........................................................................................ 90
4.6.4 The Clan Culture .................................................................................................. 92
4.6.5 Perceived cultural situation in the case organisation: Researcher’s
interpretation ........................................................................................................ 94
4.6.6 Trends in organisational culture......................................................................... 101
4.7 Survey results part 3: Organisational values .......................................................... 103
4.7.1 Top and bottom of the ranked values ................................................................. 108
4.7.2 Value analysis by demographics ........................................................................ 113
4.8 Research question # 3: “What are the current and preferred future values for this
organisation?”......................................................................................................... 121
4.8.1 Values perceived more important for the future ................................................ 121
4.8.2 Values perceived less important for the future................................................... 123
4.8.3 Perceived organisational values: an interpretation by the researcher ................ 126
4.9 Research question # 4: “What is the perceived relationship from a senior staff point
of view, between culture and values, and organisational economic performance in
this firm?”............................................................................................................... 131
4.9.1 Relationship between culture and performance: an interpretation by the
researcher ............................................................................................................... 135
4.10 Research question # 5: “How do senior managers perceive the relationship between
their culture and economic performance?” ............................................................ 139
4.11 Thematic grouping of open ended question response ............................................ 141
4.11.1 Communication .................................................................................................. 141
4.11.2 Support ............................................................................................................... 142
4.11.3 Leadership .......................................................................................................... 142
4.11.4 Commitment....................................................................................................... 144
4.11.5 Miscellaneous views .......................................................................................... 144

viii
4.11.6 Concluding remarks about the comments and feedback.................................... 145
4.12 Conclusions about the research questions.............................................................. 146
4.12.1 Conclusions concerning research question one.................................................. 146
4.12.2 Conclusions concerning research question two ................................................. 147
4.12.3 Conclusions concerning research question three ............................................... 147
4.12.4 Conclusions concerning research question four................................................. 148
4.12.5 Conclusions concerning research question five ................................................. 150
4.13 Summary ................................................................................................................ 151
5 CONCLUSIONS AND IMPLICATIONS ..................................................................... 154
5.1 Introduction ............................................................................................................ 154
5.2 Summary of conclusions concerning the research questions ................................. 154
5.2.1 Research question one........................................................................................ 155
5.2.2 Research question two........................................................................................ 156
5.2.3 Research question three...................................................................................... 157
5.2.4 Research question four ....................................................................................... 158
5.2.5 Research question five ....................................................................................... 160
5.3 Conclusions about the main research question ...................................................... 161
5.4 Recommendations .................................................................................................. 162
5.5 Limitations ............................................................................................................. 163
5.6 Implications for further research ............................................................................ 164
REFERENCES……………………………………….………………………………….......165
APPENDICES…………………………………………………...………………………….174

ix
List of figures and tables
Figure 2.1: Sackmann's (1991) Iceberg model of culture ........................................................ 18
Figure 2.2: A sequence of processes and events contributing to the transmission and
maintenance of organisational value system.................................................................... 20
Figure 2.3: Proposed model of variables influencing organisational performance.................. 27
Figure 4.1: Respondents by department ................................................................................... 62
Figure 4.2: Respondents perceptions of the current culture shown on the OCAI profile (n=30)
.......................................................................................................................................... 64
Table 4.1: Average scores for the four OCAI quadrants as shown in Figure 4.2 .................... 64
Figure 4.3: Respondents perceptions of the preferred future organisational culture situation
(n=28) ............................................................................................................................... 65
Table 4.2: Average scores for the four OCAI quadrants as shown in Figure 4.3 .................... 65
Figure 4.4: Current vs. preferred future culture in the organisation (n=30 NOW, n=28
FUTURE) ......................................................................................................................... 66
Table 4.3: Average scores for the four OCAI quadrants as shown in Figure 4.4 .................... 66
Figure 4.7: Perceived organisational culture among management staff .................................. 73
Table 4.4: Scores for Figure 4.7............................................................................................... 73
Figure 4.8: Perceived organisational culture among non-management staff: now vs. future .. 73
Table 4.5: Scores for Figure 4.8............................................................................................... 73
Figure 4.9: Perceived culture, management vs. non-management: current situation............... 74
Table 4.6: Scores for Figure 4.9............................................................................................... 74
Figure 4.10: Perceived culture, management vs. non-management: preferred future situation
.......................................................................................................................................... 74
Table 4.7: Score for Figure 4.10 .............................................................................................. 74
Figure 4.11: Less than four years with the organisation: now vs. future ................................. 75
Table 4.8: Scores for Figure 4.11............................................................................................. 75
Figure 4.12: More than four years with the organisation: now vs. future................................ 75
Table 4.9: Scores for Figure 4.12............................................................................................. 75
Figure 4.13: Perceived culture, less than four years vs. more than four years with the
organisation: current situation.......................................................................................... 76
Table 4.10: Scores for Figure 4.13........................................................................................... 76
Figure 4.14: Perceived culture, less than four years vs. more than four years with the
organisation: preferred future situation ............................................................................ 76

x
Table 4.11: Scores for Figure 4.14........................................................................................... 76
Figure 4.15: Entry through organisation A: now vs. future ..................................................... 77
Table 4.15: Scores for Figure 4.20........................................................................................... 77
Figure 4.16: Entry through organisation B: now vs. future ..................................................... 77
Table 4.16: Scores for Figure 4.21........................................................................................... 77
Figure 4.17: Perceived culture, entry through A vs. B: current situation ................................ 78
Table 4.14: Scores for Figure 4.17........................................................................................... 78
Figure 4.18: Perceived culture, entry through A vs. B: preferred situation ............................. 78
Table 4.18: Scores for Figure 4.23........................................................................................... 78
Figure 4.19: Operational departments: now vs. future............................................................. 79
Table 4.16: Scores for Figure 4.19........................................................................................... 79
Figure 4.20: Management: now vs. future ............................................................................... 79
Table 4.17: Scores for Figure 4.20........................................................................................... 79
Figure 4.21: Functional/administrative departments: now vs. future....................................... 80
Table 4.18: Scores for Figure 4.21........................................................................................... 80
Figure 4.22: Other departments: now vs. future....................................................................... 80
Table 4.19: Scores for Figure 4.22........................................................................................... 80
Figure 4.23: Perceived culture, operations/management/functional/other: current situation .. 81
Table 4.20: Scores for Figure 4.23........................................................................................... 81
Figure 4.24: Perceived culture, operations/management/functional/other: preferred future
culture............................................................................................................................... 81
Table 4.21: Scores for Figure 4.24........................................................................................... 81
Table 4.22: The Hierarchy Culture (n = 30 Current, n=28 Future).......................................... 88
Table 4.23: The Market Culture (n = 30 Current, n=28 Future) .............................................. 90
Table 4.24: The Adhocracy Culture (n = 30 Current, n=28 Future) ........................................ 90
Table 4.25: The Clan Culture (n = 30 Current, n=28 Future) .................................................. 92
Table 4.26: Differences between culture strength, now and future ......................................... 94
Table 4.27: The organisational culture profile ......................................................................... 95
Table 4.28: Scores for individual items on the OCAI – Now .................................................. 98
Table 4.29: Scores for individual items on the OCAI - Future ................................................ 99
Figure 4.25: Difference between current and future perceptions of "Organisational
characteristics" ................................................................................................................. 99
Figure 4.26: An average culture plot for more than 1000 organisations................................ 100

xi
Figure 4.27: Current organisational culture vs. average plot for more than 1000 organisations
(case organisation in bold) ............................................................................................. 100
Table 4.30: Results of values as chosen by survey respondents (n=28) ................................ 104
Figure 4.28: Organisational values ranked by preferred future situation............................... 105
Figure 4.29: Organisational values ranked by current situation............................................. 106
Figure 4.30: Organisational values ranked by preferred future situation............................... 107
Figure 4.31: Top 12 values ranked by preferred future situation........................................... 108
Figure 4.32: Bottom 12 values ranked by preferred future situation ..................................... 109
Table 4.31: Shared value concepts embedded in Quinn and McGrath's model of organisations
(values identified in Pukeko Air Ltd. ranked by relative importance)........................... 110
Figure 4.33: Ranked values embedded in culture plot ........................................................... 111
Figure 4.34: Organisational values: Management role vs. non-management role (NOW and
FUTURE n=28).............................................................................................................. 113
Figure 4.35: Organisational values: Less than 4 years with organisation vs. more than 4 years
(NOW and FUTURE n=28) ........................................................................................... 114
Figure 4.36: Organisational values: Way of entry into current organisation (NOW and
FUTURE n=28).............................................................................................................. 115
Figure 4.37: Organisational values: Departmental values as currently perceived (n = 28) ... 118
Figure 4.38: Organisational values: Departmental values as preferred for the future (n = 28)
........................................................................................................................................ 119
Table 4.32: Broadmindedness (n = 28) .................................................................................. 121
Table 4.33: Development (n = 28) ......................................................................................... 121
Table 4.34: Fairness (n = 28) ................................................................................................. 122
Table 4.35: Moral Integrity (n = 28) ...................................................................................... 122
Table 4.36: Consideration (n = 28) ........................................................................................ 123
Table 4.37: Diligence (n = 28) ............................................................................................... 123
Table 4.38: Experimentation (n = 28) .................................................................................... 124
Table 4.39: Obedience (n = 28).............................................................................................. 124
Table 4.40: Economy (n = 28) ............................................................................................... 125
Table 4.41: Logic (n = 28) ..................................................................................................... 125
Figure 4.39: Overall perception of organisational culture relevance to organisation (n=28) 131
Figure 4.40: Overall perception of organisational values relevance to organisation (n=28) . 132

xii
APPENDICES
Appendix 1: Organisational Culture Assessment Instrument, as used in the case organisation
Appendix 2: McDonald and Gandz’ (1992) Values for the Modern Business Corporation
Appendix 3: Interview Questions
Appendix 4: OCAI Worksheet for calculating survey responses
ABBREVIATIONS
OCAI ORGANISATIONAL CULTURE ASSESSMENT INSTRUMENT CVF COMPETING VALUES FRAMEWORK HR HUMAN RESOURCES GM GENERAL MANAGER OCP ORGANISATIONAL CULTURE PROFILE

1
1 INTRODUCTION
1.1 Overview The airline industry is today one of the largest service industries. In 2000 the industry itself
was worth more than US$1000 billion, employed more than 22 million people and it was the
chosen means of transportation for around 1.25 billion people (D. Chan, 2000a). It is a
fiercely competitive industry, where only the airlines who can adapt to the ever-present
changes, transitions, and the environmental happenings can compete seriously (Appelbaum &
Fewster, 2003; Quick, 1992).
Successful airlines must be prepared to handle turbulence not only in the skies, but also on the
ground. The terrorist attacks of September 11th 2001 is just one event over recent years to hit
the airline industry hard, leading to the downfall of European airlines such as Swissair and
Sabena, and 200,000 airline staff being laid off in the USA and Europe in the months just
after the attacks (Economist, 2001).
However, it is not all dark and negative in the industry. It appears some of the success stories
from the airline industry can be attributed to having a well functioning corporate culture, most
notably Southwest Airlines (e.g. Bunz & Maes, 1998; Laszlo, 1999; Quick, 1992; Smith,
2004), Singapore Airlines (D. Chan, 2000b), JetBlue (e.g. Fiorino, 2002; Weinstein, 2006),
and West Jet (e.g. Mark & Crossan, 2002).
The role of culture cannot be overlooked in any organisation. In today’s turbulent world there
is a need to adapt to frequent changes and the willingness to change must be in place.
Organisational culture appears to play a significant role, even in airlines. While airlines such
as Eastern Air Lines, Pan Am, Texas Air (although initially very successful), and People
2
Express failed, Southwest Airlines thrived. The intangible, powerful factor giving Southwest
Airlines the most important competitive advantage and their success is said to be their
organisational culture (Cameron & Quinn, 1999). While overseas studies show a linkage
between culture and performance in major airlines, no study has been conducted in New
Zealand, in particular one that focuses on a smaller airline.
The notion of organisational culture as an element of business is much covered in both
academic literature and popular management literature over the last 25 years. Some
businesses reflect a “strong” culture, others a “unique” culture that provide them with a
competitive advantage when conducting their business. In particular, the airline industry has
shown that organisational culture is an important element in succeeding within this industry.
Even though the notion of organisational culture was sparingly discussed before 1980, the
success story of Southwest Airlines of the USA goes back to 1971 and therefore so does the
organisation’s culture. Southwest Airlines has been profitable for 32 consecutive years
("Southwest", 2005). The rest is history.
This success has not only been achieved by one airline in the business, but several. Numerous
airlines have also replicated the Southwest model. There is talk of the “Southwest Effect”. In
New Zealand there are not as many airlines operating as in the US or Europe. There are
however, a few low cost and regional airlines in the market. Do these airlines emphasise the
importance of organisational culture as a means to improve firm performance?
In spite of the limited size, the small New Zealand airlines must compete to gain any market
share due to increasing competition from foreign airlines, as well as fierce competition on the
Trans-Tasman and Pacific Islands flights and also increasing domestic competition. How can
the element of organisational culture be an element in strengthening performance and
competitive advantage, and to what degree is it perceived to affect the airlines’ performance?

3
1.2 Objectives of the study This research explores the perceived role of organisational culture in the economic
performance of a smaller New Zealand airline. The study aims to answer whether the
organisation’s economic performance can be linked to its culture, and more particularly its
values, based on the perceptions of its staff and senior managers. This research however,
cannot prove that increased economic performance is directly attributable to its culture as
many other factors are involved. A firm in the New Zealand airline market has been chosen to
make such a study manageable, given its size and main offices primarily being located in
Auckland, New Zealand.
This research identifies the organisational culture of a New Zealand small airline operator,
and investigates its role in the performance of the company. The purpose of the research is to
discover whether there are any gaps in the current organisational culture, as understood by
senior management and its staff.
Hence, the specific research question has been formulated as: “What is the perceived relationship between organisational culture and firm
performance within a small New Zealand airline?”
While values are often viewed as being subsumed within the cultural concept (e.g. Schein,
1984; Trice & Beyer, 1993), they are also a distinct aspect that can be measured separate from
the overall culture itself. This approach was adopted in the research sub-questions.
Resolution of this research question was addressed through the following five sub-questions:
1. How relevant is the organisational culture concept to this firm?
2. What is the perceived current and preferred culture of the airline?
3. What are the current and preferred values for this firm?

4
4. What is the perceived relationship from a staff point of view, between culture and
values, and organisational economic performance in this firm?
5. How do senior managers perceive the relationship between their culture and economic
performance?
This study will conduct a cultural study of the case airline in question, through assessing the
perceptions of the entire pool of staff members, as well as the senior management, and present
a cultural diagnosis with recommendations for future research.
This research is of particular importance to the airline in question which will get an objective
assessment of its corporate culture with an analysis highlighting how far away the
organisation is from the preferred situation as opposed to the perceived current situation. In
addition, the study can provide valuable information on the role of organisational culture in
the performance of small airlines with operations in New Zealand, as there are a very limited
number of available cultural assessment studies of New Zealand airlines.
1.3 Methodology The aim of this research in the New Zealand airline is to:
• Identify the current and preferred future organisational culture and organisational
values of the company, highlighting any discrepancy between the current and
preferred future situation.
• Discuss the findings of the above survey with those in more senior positions within
the company, and identify the perceptions of senior management, comparing these
with the findings of the survey. Particular reference is made to the relationship
between culture and performance.

5
A survey will be used to identify perceptions from the organisation’s members on the
elements of culture and values, and these will in return form the basis for discussion with
senior management. These discussions will ultimately address the role of organisational
culture and values in the organisation’s performance.
1.4 Outline of the thesis This thesis will first start with a review of the existing literature, covering the main
dimensions of organisational culture, organisational values, organisational culture assessment,
and the role of organisational culture in the airline industry. Second, the thesis discusses the
research methodology of the study, detailing data collection, survey instruments, samples,
data analysis, as well as reliability, validity and limitations of the of the methodology. The
results and findings of the research are presented thorough a framework of diagrams and
models, while continuously discussing these findings. Finally, the researcher presents
conclusions and implications, and the way to proceed for the airline company.

6
2 LITERATURE REVIEW
2.1 Introduction This chapter explores the existing literature in the field of organisational/corporate culture and
values, and how an organisation’s culture can affect performance. Primarily empirical
research from articles in academic, peer-reviewed journals has been investigated but also
published books in the field of organisational/corporate culture have been studied. Some of
these books were rather groundbreaking in their field when released in the early 1980s and
these books are today essential, seminal literature when studying organisational culture.
The review of literature first introduces the topic of organisational culture, discussing what
culture in organisations is considered to be in the eyes of scholars and practitioners, as well as
what it means to have “strong” cultures. Second, the concept of organisational values is
presented. Third, the link between organisational culture and performance in the literature is
assessed. Moreover, organisational culture assessment and the tools for diagnosing culture
that have been developed over time are briefly introduced. Finally, the role of organisational
culture in the performance of airlines is looked at before a gap in the literature is highlighted
and a summary is presented.

7
2.2 Organisational culture The concept of corporate culture has been a dominant topic in management literature in the
Western world since the beginning of the 1980s (e.g. Barley, Meyer, & Gash, 1988; Salama &
Easterby-Smith, 1994). Although the concept of organisational culture dates back to early
sociological studies in the 1950s (Barley et al., 1988), it took up until the late 1970s and early
1980s for researchers and practitioners to appreciate its importance in organisational life.
According to Hofstede, Neuijen, Ohayv, and Sanders (1990), the term “organisational
culture” did not enter the U.S. academic literature until 1979, through Andrew Pettigrew’s
article “On studying organizational cultures” (1979). The term “corporate culture”; however,
was used some years before this by Silverzweig and Allen (1976). Today, Hofstede et al.
(1990) argue, organisational culture has the same status in organisations as structure, strategy,
and control, while Schwartz and Davis (1981) say there is actually a tight relationship
between organisational culture and strategy.
2.2.1 What is organisational culture? Organisational culture has been considered quite differently by scholars during the time the
concept has been known and accepted. Wilkins (1983) argues how organisational culture is
best seen as people’s customary behaviour and their taken-for-granted ways of seeing the
world. Emphasis should, according to Wilkins (1983), be placed on the underlying, taken-for-
granted assumptions as well as orientations of a group of people. This is in line with Schein
(1992), whose emphasis and preference is on the basic assumptions among a group of people,
because these tend to be taken for granted. Cameron and Quinn (1999) follow up on this and
say that the organisational culture “refers to the taken-for-granted values, underlying
assumptions, expectations, collective memories, and definitions present in an organization”
(p. 14).

8
Culture can also be seen as ubiquitous, and covering all areas of group (i.e. organisational)
life (Schein, 1990). Schein (1990) considers culture to be what a group learns over time as
this group solves its own problems of survival in an external environment, as well as its
problems of internal integration.
Harris and Cronen (1979) have seen organisational culture as a “master contract”, including
the organisation’s self-image as well as rules that organise beliefs and actions in light of this
image. Goffee and Jones (1996) consider culture to be “community”, that is the outcome of
how people relate to one another. Pettigrew (1979) takes the concepts of purpose,
commitment, and order and looks at how these are generated in an organisation. Through the
feelings and actions of the founder, as well as through a mix of beliefs, ideology, language,
rituals and myths, Pettigrew (1979) labels all of this organisational culture. Schwartz and
Davis (1981) look at it from another angle, by looking at what organisational culture is not.
Culture is, say Schwartz and Davis (1981), not climate; a view also held by Trice and Beyer
(1993). Cameron and Ettington (1988) confirm that there is some confusion in the literature
between culture and climate. Moreover, Schwartz and Davis hold that culture is a pattern of
beliefs and expectations which is shared by the organisation’s members. Trice and Beyer
(1993) further expand on the list of what cultures are not; not groupthink, not social structure,
not metaphor, and finally, not necessarily the key to success. Conversely, the authors say that
cultures are collective, emotionally charged, historically based, inherently symbolic, dynamic,
and inherently fuzzy. Geert Hofstede (1991), long time guru on national cultures and its role
in communication, negotiations, and business, believes organisational culture is holistic,
historically determined, related to the things anthropologists study, socially constructed, soft,
and difficult to change.
9
Yet another view is offered, which deals with industry characteristics and its role in
organisational culture (Gordon, 1985, 1991). Gordon (1985) suggests that “factors such as the
characteristics of the industry, the marketplace and the diversity, size, and market position of
the organization define the broad outlines of an appropriate culture” (p. 121). In his research
the author found that successful companies placed higher value on factors different to those
who were less successful. However, Gordon’s view differs from Peters and Waterman (1982)
by claiming there is not so much one winning culture as there are industry determinants of
organisational culture development. Chatman & Jehn (1994) attempted to generate a more
systematic assessment of industry effects on organisational culture, and through this research
they re-opened the discussion commenced by Gordon (1985) almost a decade earlier. The
authors offer empirical support for similarities among cultures of firms who operate in the
same industry, as well as a link between culture and industry characteristics. They discovered,
among other things, that innovation, stability and an orientation toward people and towards
outcomes and results, as well as an emphasis on being easy going, putting attention to detail,
and having collaborative or team orientation “are pervasive organizational culture themes” (p.
543). This proposed research will attempt to look for some of these elements in the airline
industry.
There has always been little agreement as to what the concept of culture does and what it
means to an organisation. Schein (1990) points to reasons for this confusion being that the
study of organisational culture lends itself to numerous areas of study, within a great range of
fields. Culture, says Schein (1990), lies at an intersection of a number of social that includes
anthropology, sociology, social psychology and organisational behaviour. The fact that the
study of organisational culture is influenced by numerous disciplines is recognised in the
literature (e.g. Ouchi & Wilkins, 1985). It has been argued that even though societal and

10
community culture has been studied for many decades, organisational culture only gained
attention in the last 25 years (Cameron & Ettington, 1988).
Lundberg (1990) holds that culture is:
• a shared, common frame of reference (that is, taken for granted and shared by a
significant part of the members);
• acquired and governs (that is, socially learned and transmitted by its members,
serving rules for their organisational behaviour);
• a common psychology (that is, it refers to the uniqueness of the organisation as well
as contributing to its identity);
• enduring over time (that is, can be seen in all fairly stable unit regardless of size
providing it has a reasonable history);
• symbolic (that is, it is manifested in observable elements such as language and
behaviour);
• at its core, typically invisible and determinant (that is, at its foundation it consists of
a configuration of deeply embedded values and assumptions);
• modifiable, but not easily so.
Clearly, organisational culture is embedded in most aspects of organisational life, as scholars
have identified over the years.
2.2.2 Culture as something the organisation “is” versus something it “has” Literature on organisational culture shows a distinction between whether culture is something
an organisation is or has. Smircich (1983) investigated the ways culture has developed in the
study of organisations, and distinguishes the approaches of critical variables from root
metaphors. Cameron and Ettington (1988) looked at a number of definitions from the
literature and highlight the view that culture is something an organisation has, rather than is;

11
the former being more prevalent in the sociological literature, while the latter is more
prevalent in the anthropological literature. In another area of the literature, organisational
culture is seen as socially constructed (e.g. Burt, Gabbay, Holt, & Moran, 1994; Rousseau,
1990; Schein, 1996), developed and shared by groups of people. Finally, according to
Smircich (1983), “culture as a root metaphor promotes a view of organizations as expressive
forms, manifestations of human consciousness” (p. 347).
2.2.3 Definitions Classic works such as Peters and Waterman’s “In search of excellence” (1982) as well as
“Corporate cultures: the rites and rituals of corporate life” (Deal & Kennedy, 1982) have
given insight into the phenomenon of organisational cultures, through the description of
successful cultures as well as how to influence one’s corporate culture. Schein (1992), among
the earliest authors publishing works on organisational culture, observes that when certain
things in groups are shared or held in common we can talk about having a culture in an
organisation. A more extensive definition can be:
a pattern of shared basic assumptions that the group learned as it solved its problems
of external adaptation and internal integration, that has worked well enough to be
considered valid and, therefore, to be taught to new members as the correct way to
perceive, think, and feel in relation to those problems (Schein, 1992, p. 12).
Stonehouse and Pemberton (1999) offer another view. They see organisational culture as
consisting of “the values, attitudes and beliefs that steer the actions and behaviours of the
individuals making up the organisation” (1999, p. 137). This is not unlike Hofstede’s (1991)
view, stating that organisational culture is defined as “the collective programming of the mind
which distinguishes the members of one organization from another” (p. 180). Ouchi (1981)
sees it as “a set of symbols, ceremonies, and myths that communicate the underlying values

12
and beliefs of that organization to its employees” (p. 41). It has even been defined as bluntly
as “the way we do things around here” (e.g. Deal & Kennedy, 1982; Kilmann, Saxton, &
Serpa, 1986). This last view actually says a lot, in all its simplicity.
2.2.4 The role of organisational founders and leaders The views above suggest the employees of an organisation are the ones developing the
company’s culture. A different view is that the founder of the company, often the leader, is
the one introducing the culture (Schein, 1983). The founder or founders of organisations have
been seen to instil the basic underlying assumptions that form an organisation’s culture
(Schein, 1984). Even more so, the leader is in some cases seen as the culture, for example in
the case of Southwest Airlines, where there is a concern that the company culture might
disappear the day the leader is gone (e.g. Bunz & Maes, 1998; Smith, 2004). The role of the
founder or leader is acknowledged by numerous writers in the field, such as Pettigrew (1979)
(in the shape of the entrepreneur), Trice and Beyer (1993) (charismatic founders), and Kotter
and Heskett (1992) (top management implements vision/philosophy/strategy). Quick (1992)
argues that even though culture can be seen as the means through which problems and
challenges are addressed, an organisational culture cannot be seen as a replacement for
suitable leadership; responsibility and problem-solving behaviour must be at the core.
13
2.2.5 Early associations of culture with performance and management The foundations of literature on organisational culture, as we know it today, is to a large
degree based on studies from the late 1970s and the mid 1980s (e.g. Denison, 1984; Martin &
Siehl, 1983; Ouchi & Price, 1978; Ouchi & Wilkins, 1985; Pettigrew, 1979; Schein, 1984,
1985a, 1985b; Smircich, 1983) as well as groundbreaking published books from professionals
in the field (e.g. Deal & Kennedy, 1982; Ouchi, 1981; Pascale & Athos, 1981; Peters &
Waterman, 1982). In these years, some academic journals even published special issues on the
topic of organisational culture, most notably Academic Science Quarterly (1983) and
Organizational Dynamics (1983).
Wilkins (1983) argues that interest in organisational culture started as a result of major factors
affecting American businesses, a view which is also shared by Trice and Beyer (1993). The
first factor is seen to be the economic turbulence in the early 1980s. This turbulence resulted
in strategic changes, acquisitions as well as attempted increases in innovation. The second
major factor was the increased literature on the Japanese industry and its management style
(Brannen & Kleinberg, 2000; Ouchi & Wilkins, 1985; Smircich & Calás, 1987; Wilkins,
1983). The Japanese were considered to do business and run their industry differently to
American managers. Works by Ouchi (1981) as well as Pascale and Athos (1981), has
showed that the Japanese appeared to be more concerned with the role of, and the
management of an organisation’s culture. Weiss (1984) claims that personnel and investment
practices in some Japanese companies are designed to encourage high performance, and that
these management decisions are the reason for the high productivity, rather than attributing
the difference to the organisation’s culture. Schein (1981); however, critiques of the published
works of both Ouchi (1981) and Pascale and Athos (1981) are critical in that none of the
authors present much evidence to justify the hypothesis that Japanese organisations are

14
successful mainly due to the management style they utilise. Nonetheless, following the works
of these scholars on Japanese ways to do business, there have been claims that the most
successful American companies share the same concern for the creation of strong cultures
(e.g. Deal & Kennedy, 1982; Peters & Waterman, 1982). It did; however, take some time
before culture was accepted as a fact of organisational life by managers, but eventually it
became an integral part of organisations, and their organisational change programmes (Cooke
& Rousseau, 1988). Today, organisational culture appears to be accepted by more and more
leaders and managers as integral in organisational life and success.
2.2.6 Levels of culture Culture has by many scholars been considered a layered phenomenon where a set of
interrelated levels of meanings coexist (see, for example, Lundberg, 1990; Schein, 1984,
1992). Schein (1992) specifies three levels of culture. The first level consists of artefacts;
what is visible and observable. The second level is espoused values/values and beliefs; those
elements of an organisation that are shared among members, such as goals, strategies and
philosophies, and that explains why people behave the way they do. The third level identified
by Schein (1992) consists of the basic underlying assumptions: all those unconscious, taken-
for-granted beliefs that exist within an organisation. These taken-for-granted assumptions are
considered very powerful because they are less debatable and more difficult to confront than
the espoused values (Schein, 1984). In addition to the three levels coined by Schein (1992),
another level, 1B, has been added by Ott (1989); patterns of behaviour. These are the
unconscious acts performed by organisational members without thinking about it, such as
human resource practices as well as rites and rituals. Sackmann (1991) considers the different
levels of culture, in saying that:
an understanding of culture in a given organizational setting requires an understanding
of the ideational aspects of culture – the underlying process of sense making, the

15
cognitive construction, or the cultural knowledge that exists in a particular
organization and that are used to attribute meaning to observable behaviors and
corporate artifacts (p. 298).
The second and third level of culture is what this research will investigate, with an emphasis
on the espoused values and the elements shared by organisational members.
2.2.7 Strength of culture One of the more frequently cited cultural dimensions within the field of cultural research is
the notion of cultural strength (Cameron & Ettington, 1988). Early published works on
organisational culture argued that there is an absolute need for “strong” cultures in order for
organisations to be effective. O’Reilly (1989) states two reasons for why strong cultures are
valuable: the fit between organisational culture and strategy, and the increased commitment
by employees to the firm. He argues these provide a competitive edge and that strong culture
organisations this way get an advantage over their competitors. Schein (1984) contests the
notion of an absolute need for strong cultures to achieve effectiveness, by arguing how the
relationship must be much more complex. He points to the need for a contingency or
situational approach, and he holds that the critical variables are “contents of the culture and
the degree to which its solutions fit the problems posed by the environment” (Schein, 1984, p.
7). However, Schein acknowledges that cultural strength is among the cultural dimension of
primary interest. Other scholars (e.g. Deal & Kennedy, 1982; Sathe, 1983) agree with this
view, referring to how clearly ordered shared beliefs and values are paramount for reinforcing
organisational behaviour, which in turn are considered to be “strong” cultures. Peters and
Waterman said in their book about the importance of having strong cultures:
Without exception, the dominance and coherence of culture proved to be an essential
quality of the excellent companies. Moreover, the stronger the culture and the more it
was directed toward the marketplace, the less need was there for policy manuals,

16
organization charts, or detailed procedures and rules. In these companies, people way
down the line know what they are supposed to do in most situations because the
handful of guiding values is crystal clear (Peters & Waterman, 1982, p. 76-77).
Saffold (1988) presents five weaknesses inherent in a strong culture hypothesis: the
assumption of unitary culture; the ambiguity of strength as a measure of culture; dependence
upon composite culture profiles; insufficient attention to culture-performance links; and the
use of inadequate methodologies. He also presents in his research three correctives to enhance
the validity of culture and performance studies: First, the use of appropriate measures of a
culture’s impact will help evaluate the cultural phenomena more than the generalised notion
of culture strength. Second, the researcher must use a contextual rather than a modal analysis
of culture. This can take the shape of a culture-performance framework that examines how
culturally conditioned processes can contribute to outcome, and is a better solution than
pointing to “a general fog of thick culture and to suggest that in some way this swirling mist
boosts performance” (Saffold, 1988, p. 552). Finally, attention to multiple interactions is
essential in order to assess the organisation’s widely dispersed cultural features. Alvesson
(2002); however, believes the three correctives - the appropriate measures, contextual
analysis, and attention to multiple interactions - may discourage researchers from attempting
to study the culture-performance relationship. Yet, this last corrective is very much in line
with other proponents of multiple-method approach to culture research (see, for example,
Martin & Siehl, 1983; Ouchi & Wilkins, 1985; Rousseau, 1990). Some debate appears to
surround cultural strength, and this is one factor the proposed research will look into with
regards to the case organisation.
2.2.8 Sub-cultures and counter cultures Shared assumptions are said to form around functional units, just like these assumptions are
thought by founders to new members of the organisation (Schein, 1996). Organisations can be

17
characterised not only by a dominant culture, but just as much by what has been labelled
subcultures (Cooke & Rousseau, 1988). It can be a work unit culture, a department culture, a
division culture – basically any community within the corporate context (Sathe, 1983). These
communities reflect the enactments of the myriad distinct work and social environments
within an organisation (Cooke & Rousseau, 1988). Because members of an organisation will
have similar experiences or educational background they will group together according to
these similarities. Communicating across these functional groups is according to Schein
(1996) difficult for the reasons that they have different goals and they attribute different
meanings to the same words used. Shared assumptions will reflect how each functional group
thinks. Such creation of subcultures is according to Cooke and Rousseau (1988) a natural by-
product of the organisation’s tendency to differentiate by level and function.
Because organisational differentiation occurs it allows for counter cultures to emerge (Cooke
& Rousseau, 1988; Martin & Siehl, 1983). Counter cultures represent ways of thinking and
believing that are in conflict between subcultures. Conflicting subcultures are not necessarily
counter cultures (Cooke & Rousseau, 1988). If elements of a dominant culture are shared in
spite of there being differences between two departments we do not talk of counter cultures.
In the opposite case, where the elements of the dominant culture are resisted, a counter culture
is in place. The counter culture rise, according to Cooke and Rousseau (1988), is due to
differentiation and insularity. The authors claim the insularity or narrow-mindedness is
developed when units are protected from the pressure of the rest of the organisation by
elements such as powerful leaders and geographic distance. As long as the boundaries are
there the counter culture will prevail.

18
2.3 Values In close relation to the concept of organisational culture we find the element of values. It has
been considered an important component of organisational culture, with Sathe (1983)
highlighting beliefs and values as primary components. Pettigrew (1979) holds that “culture is
the system of such publicly and collectively accepted meanings operating for a given group at
a given time” (p. 574) – in other words the values held by the organisation’s members.
Values, together with beliefs, have been considered one of the central cognitive components
of culture, and these were by Sackmann (1991) illustrated as the hidden part of an iceberg that
is not visible below the water line (fig. 2.1).
Figure 2.1: Sackmann's (1991) Iceberg model of culture
Values can be considered as our own, personal “bottom line”, and it becomes clear that
organisations are also considered to have values in that one can read between the lines of
every decision made and every objective formulated (Posner, Kouzes, & Schmidt, 1985). In
other words, values set patterns for activities, opinions, and actions (Ouchi, 1981). Accepted
operational definitions of the term were formulated in early discussions on values (e.g.
Brown, 1976; Fallding, 1965). Fallding (1965), for example, holds that a value “is a

19
generalized end that guides behaviour toward uniformity in a variety of situations” (p. 224).
Another view is that a value can refer “to a single prescriptive or proscriptive belief which
transcends objects and situations to which attitudes are tied” (Brown, 1976, p. 16). This is
somewhat in line with Connor and Becker (1975) who say that a value can be seen as “global
beliefs about desirable end-states underlying attitudinal and behavioural processes” (p. 551).
Wiener (1988) claims that there is a certain amount of agreement between researchers in the
field of organisational culture that shared values is a key element in the definition of culture.
As long as existing values support the right goals and strategies, culture can be seen as an
important asset in the organisation (Wiener, 1988). Not studying shared values is one of
Wiener’s (1988) critiques of earlier publications on organisational culture (e.g. Deal &
Kennedy, 1982). Studies like this one emphasised for example organisational structure,
leadership style, and reward systems, but not the importance of having shared values.
2.3.1 Shared values Shared values at the organisational level are seen as an important component of organisational
culture (e.g. O'Reilly & Chatman, 1996; Schein, 1985b). Shared values among the members
of an organisation is considered to be an organisational value system (Wiener, 1988). Figure
2.2 shows a value system’s contribution to the cultural maintenance process.
Meglino and Ravlin (1998) highlight values as modes of behaviour, as they are frequently
used by researchers as well as practitioners to describe an organisation’s culture (Schein,
1985b). They also claim that most theorists consider values as products of culture and they
emphasise how value similarity creates a culture or social system, drawing on the work of
Kluckhohn (as cited in Meglino & Ravlin, 1998). Finally, Meglino and Ravlin (1998) hold
that values specify behaviour needed to satisfy individuals’ needs, in the same way that an
organisation’s culture specifies necessary behaviours for the organisation to survive in its

20
environment. This is referred to as external adaptation (Schein, 1985b). Conversely, according
to the authors, it is also possible for an organisation’s culture to promote values that are not
appropriate for survival. They also emphasise that shared values may not necessarily result in
higher performance if the values do not also encourage the correct behaviours for the
performance of the task as well as organisational survival. Chatman (1991) employed the
Organizational Culture Profile (OCP) to compare individual values and organisational values,
collecting responses from senior employees in order to predict value congruence at
organisational entry. Values were assessed upon entry, and then again at a later stage, with
results showing that employees will fit in better as they gain organisational experience as
opposed to when they originally enter into the organisation. Through socialisation the
employees’ values had been shaped to fit the values of the organisation.
Figure 2.2: A sequence of processes and events contributing to the transmission and maintenance of organisational value system
Source: Wiener (1988)

21
2.3.2 Values in the workplace Values of managers and employees of organisations are phenomena that have captured
researchers’ interest for some time (Meglino & Ravlin, 1998). Posner and Schmidt (1984;
Posner & Schmidt, 1992) twice investigated the values of American managers. The first time
they found that integrity was the characteristic most highly rated by managers. In the second
study, this was again found to be true. Therefore, it was concluded that managerial values are
enduring, as the findings were remarkably consistent over time (Posner & Schmidt, 1992).
Presumably, this applies to other values as well, but is not much discussed by the authors.
In the literature a distinction is made between values and work values. The latter implies that a
set of values govern employee work behaviour, and Pine and Innis (1987) hold that work
values are “an individual’s needs and priorities and consequent personal dispositions and
orientations to work roles that have the perceived capacity to satisfy those needs and
priorities” (p. 280). For any multinationals to become global organisations, diverse individual
work values must converge and be integrated into a common set of values, in order to create a
universal corporate culture (Ralston, Holt, Terpstra, & Kai-Cheng, 1997).
To consider values in the workplace is really about probing for reasons why people work and
how they behave in their jobs, and the way in which they do it (Posner & Munson, 1979).
Values are neither attitudes nor behaviours; rather, they are considered the building blocks of
the behaviour of and the choices made by individuals (Stackman, Pinder, & Connor, 2000). It
has been well documented in the literature from the early 1980s that having deeply embedded
shared values can contribute to competitive advantage (see, for example, Pascale & Athos,
1981; Peters & Waterman, 1982).

22
2.3.3 Values and organisational effectiveness It has been demonstrated empirically that values affect organisational effectiveness (e.g.
O'Reilly, Chatman, & Caldwell, 1991; Posner et al., 1985). O’Reilly et al. (1991) found an
association between person-organisation fit and turnover, and this was linked back to how
individual preferences matched the organisational realities. This, in turn, can be linked to how
agreement among members of an organisation about central values can define organisational
culture (Rousseau, 1990). Enz (1988) also considers values an important part of
organisational culture, and discusses value congruity as a way to determine consensus
between functional groups and top management.
Peters and Waterman (1982) argue in their book that shared values represent the core of
corporate cultures. Hofstede et al. (1990); however, claim to have shown empirically that
shared perceptions of daily practices are found at the core of the organisational culture. A
reason for this, Hofstede et al. (1990) claim, is in the way “the U.S. management literature
rarely distinguishes between the values of founders and significant leaders and the values of
the bulk of the organization’s members” (p. 311).
In the 1990s core values considered important for organisational success were listed by
scholars in the field. Lawrence (1998) summarises some of the most important humanistic and
developmental values and highlights “…organisational learning, development, innovation,
creativity, increased participation and equity, teamwork, high trust between employer and
employee, respect, openness, honesty, commitment, cooperation, flexibility, diversity, and a
recognition of equal opportunity” (p. 159) as the key areas. Besides this, some authors argue
that congruence of values can result in higher levels of organisational performance through
for example increased commitment (e.g. Chatman, 1991; Peters & Waterman, 1982). Peters

23
and Waterman (1982) hold that excellent companies are driven by coherent value systems and
that it is the values of the leader that influence the organisation.
Congruence between the core values of the organisation and the individual is considered
beneficial by those arguing the case for the necessity of having shared values in the
organisation (e.g. Chatman, 1991; McDonald & Gandz, 1992). Robert Haas of Levi Strauss &
Co. has argued that a company’s values are crucial to its competitive success and that values
drive the business (Howard, 1990). Although several value surveys have been developed (e.g.
Rokeach, 1973; S. H. Schwartz, 1992), one set of relevant shared values for the modern
business corporation has been presented by McDonald and Gandz (1992). They suggest a list
of 24 value concepts, and the list was developed by asking senior managers and consultants to
express their views on shared values. According to McDonald and Gandz (1992) elements of
these values exists to some degree in all organisations, although their relative importance will
vary.
There appears to be a clear association between values and organisational culture, and the role
of these elements at an organisational level. Other scholars have emphasised the importance
of how shared beliefs and values must be in line with the needs of the organisation, as well as
its business and its members (Sathe, 1983). Should this not be the case in any given
organisation, it can result in dysfunctional consequences. Sathe (1983) summarises the role of
having the correct and appropriate organisational values by claiming that “culture is a liability
when the shared beliefs and values are not in keeping with the needs of the organization, its
members, and its other constituencies” (p. 10).

24
2.4 Culture and performance The role of organisational culture in organisational performance is a topic that has received
extensive coverage in the literature; although, from different viewpoints and with different
findings as to its relevance. Alvesson (2002) summarises four views on the relationship
between organisational culture and performance: the strong-culture thesis, where a strong
culture leads to high performance; the exact opposite, where high performance leads to
creation of “strong” culture; the contingency approach, where certain cultures are appropriate
and necessary and; and finally the “adaptive cultures”, which are the key to better
performance through its ability to respond to environmental changes quickly.
At the earliest stage, Peters and Waterman (1982) argued their case for “strong” cultures and
its role in the so-called 62 “excellent” US companies. This spurred a generation of researchers
to further investigate the role of organisational culture in an organisation’s performance,
effectiveness, and profitability. Even though Peters and Waterman (1982) have harvested
some critique for their publication, primarily for In Search of Excellence’s conceptual and
research underpinnings (see, for example, Carroll, 1983), it has always been considered an
important and groundbreaking work.
In the mid-eighties Denison (1984) stated that there is little evidence on the impact of an
organisation’s culture on its performance, but was later going to make new discoveries.
Gordon (1985) discovered around that same time that companies in dynamic industries shared
cultural values that contributed to increased stability. By the early nineties; however, a link
between organisational culture and performance had been better established by the same
before mentioned Denison (1990), although primarily for the short term. He found that
organisations with participative cultures were performing better than those cultures that were

25
not. This is in line with Burt, Gabbay, Holt, and Moran (1994), who hold that a feature of
culture important for an organisation’s performance is the extent to which the employees buy
into it.
After this initial period of interest around the role of culture in performance, a number of
other scholars built on the foundation laid by the likes of Daniel Denison through empirical
research (e.g. Denison & Mishra, 1995; Gordon & DiTomaso, 1992; Kotter & Heskett, 1992;
Marcoulides & Heck, 1993; Sørensen, 2002). Some degree of correlation has also been found
by Burt, Gabbay, Holt, and Moran (1994), as well as by Ogbonna and Harris (2000), to
mention a few. Rashid and his colleagues (2003) found from studying organisational culture
literature that there is a clear link between culture and organisational performance. However,
Lewis (1994) concludes her study of a tertiary institution in Australia by stating that
behaviour is the only thing that can directly affect an organisation’s performance. Lewis
(1994) points out that “while behaviour may be one embodiment of culture, culture is
certainly not the only determinant of behaviour (p. 51)”.
From this range of literature, it appears as the role of organisational culture in performance
has received increasingly more interest and acceptance over the years. Although such a
relationship is difficult to prove, some of the above mentioned scholars have found different
degrees of correlation. This relationship will be addressed in the proposed research.
2.4.1 Culture’s role in competitive advantage, effectiveness, and profit Culture appears to also have an effect on other elements of organisational life which can be
linked to performance. Such writings include competitive advantage (e.g. Barney, 1986; L. L.
M. Chan, Schaffer, & Snape, 2004; Peters & Waterman, 1982; Pfeffer, 1995; Sadri & Lees,
2001); organisational effectiveness (e.g. Cameron, 1986; Den Hartog & Verburg, 2004;
Denison & Mishra, 1995; Quinn & Cameron, 1983; Steers, 1975); the role of culture in

26
financial matters such as economic performance (e.g. Calori & Sarnin, 1991; Rashid et al.,
2003; van der Post, de Coning, & Smit, 1998), as well as revenue growth (e.g. Christensen &
Gordon, 1999; Denison & Mishra, 1995).
Superior business performance has also been seen as a result of an interaction between
organisational culture, industry environment, and top management. Wright, Theerathorn, Tu,
Gilmore, and Lado (1992) found some evidence of this in their study of 47 businesses. This
takes Gordon’s (1985) discussion of industry characteristics and its role in organisational
culture one step further in adding top managers as a factor.
Ouchi (1981) attributes the financial success of certain Japanese firms to their strong
emphasis on humanistic values, while Pascale and Athos (1981) similarly hold that the
Japanese upper hand over the American businesses all came down to their focus on human
relations.
Culture’s role in performance can be seen from another angle. Strong culture has been seen to
clarify an organisation’s goals and practices. Employees’ uncertainty with regards to risk
involved in taking one action or another can be reduced and the employees can respond
quicker to each event (Burt et al., 1994).
Marcoulides and Heck (1993) suggest a model of more variables that influence organisational
performance. A set of observable variables and latent constructs helps define an
organisation’s culture, as well as how these variables help explain the level of performance
(fig 2.3). This illustrates the fact that organisational culture is not limited to just a few
variables, and more importantly, that these variables are interconnected. One can presume that
if one variable is overlooked, the level of performance could be affected.

27
Figure 2.3: Proposed model of variables influencing organisational performance
Source: Adapted from Marcoulides and Heck (1993)
In a more recent article by Kaliprasad (2006) the author refers to those organisational cultures
who achieve higher revenue, higher net income, workforce expansion, and stock-price
growth, as being high performance cultures, showing the organisational culture’s impact on
long-term economic performance. Furthermore, for an organisation to sustain a high
performance culture, it must know how to address the following five performance gaps:
marketplace and senior leaders’ perception of the marketplace; senior leaders’ perceptions of
the marketplace and the organisation’s vision, mission, values, and strategies; the vision,
mission, values, and strategies and direct leadership practices; leadership practices and
employee behaviours that meet customer needs; and finally enabling infrastructures and
support of behaviours compatible with sustainable high performance. Ultimately, Kaliprasad
(2006) claims, the quest to becoming a high-performing organisation from an internal systems
point-of-view, is simply a question of better understanding of people. From this it can be
concluded that if staff members do not buy into the visions, missions, values, and actions of
management, performance as well as the organisation as a whole, is likely to suffer.
Organisational Structure/Purpose
Organisational Values
Organisational Climate
Task Organisation
Worker Attitudes and Goals
Organisational Performance
28
2.4.2 Uniqueness of culture Barney (1986) presents arguments for how certain firms can enjoy competitive advantage
over its competitors, and as a result, sustained superior financial performance. In order to
achieve this, three conditions must be met: the culture must be valuable; the culture must be
rare; and the culture must be imperfectly imitable. Barney (1986) argues that all three
conditions must be in place. Emphasis is placed on the need for an imperfectly imitable
culture, because “the culture-driven success of one firm creates an incentive for other firms to
modify their cultures to duplicate that success (Barney, 1986, p. 659)”. As a result, because
few other firms can obtain the same benefits and engage in activities in order to obtain them,
firms that have valuable, rare, and imperfectly imitable cultures will enjoy positive economic
consequences of its culture. This is an organisational element that needs to be protected, and it
is where the organisation can harvest strong competitive advantage from. Moreover, it partly
represents the explanation behind some organisational success stories from the past three
decades. This uniqueness of culture will be investigated in the proposed research project.
2.4.3 Approaches to the culture-performance relationship There are numerous ways to approach the complex relationship between culture and
performance. Alvesson (2002) distinguishes between three versions of how managers can
work with culture. The first is to consider culture as building blocks in an organisational
design, containing the norms, values, beliefs, and behaviour styles of the organisation’s
employees. Management is in control of the culture. Second, achieving shared understanding
can be done by allowing management to shape organisational reality in a favourable way.
Management and culture are inter-dependable. Finally, looking at organisational culture as a
diagnostic instrument can assist in making better decisions and avoiding mistakes. Culture is
considered to be strong and resistant, and management must adapt to it.

29
2.4.4 Critique of the culture-performance link Not all scholars are willing to accept the idea of a link between culture and performance
without putting forth some question marks. Critiques of Peters and Waterman’s In search of
excellence (1982) are well known (e.g. Carroll, 1983). Others are equally unwilling to fully
accept the propositions that have appeared in the literature. For example, Saffold (1988)
claims that simple models for relating culture to performance no longer fit what has been
uncovered about the role of organisational culture in organisations; there is a need for a more
sophisticated understanding of the culture-performance link.
Despite some scepticism towards the culture-performance link, the 1990s saw at least 10
empirical survey studies being published (Wilderom, Glunk, & Maslowski, 2000). Yet most
of these, Wilderom et al. (2000) reports, had serious weaknesses such as a small number of
participating organisations, and intra-organisational respondents that were not representative
of the organisational culture as a whole.
In summary, it is difficult to say exactly how organisational culture impacts a company’s
performance. Whipp, Rosenfeld, & Pettigrew (1989) conclude their study by saying that some
elements of culture “may supply vital links between the rational aspects of policy and the
subjective, less tangible features of employees’ behaviour exactly because of the way values
pervade an enterprise” (p. 582), meaning there is little reason to doubt there is a link between
culture and performance; however, vague it may or may not appear to researchers.
2.5 Organisational culture assessment This section will present some of the techniques available to researchers when it comes to
assessing organisational culture. Assessing the organisation’s culture can be seen as a possible
means of checking for congruence in terms of where the organisation is currently (that is, at

30
the time of observation) as opposed to the future desired goals, strategies, and results
(Marcoulides & Heck, 1993). Even though the organisation’s culture has been a hot topic
among organisational culture scholars for more than 30 years (Barley et al., 1988), there is
still little agreement on how to actually measure culture (e.g. Locatelli & West, 1996;
O'Reilly et al., 1991), and whether a culture audit will actually produce any clear answers
(Wilkins, 1983).
2.5.1 Appropriate means of measurement A main shortcoming of culture measurement tools is seen by Mallak, Lyth, Olson, Ulshafer,
and Sardone (2004) to be an inability to surface unanticipated findings, meaning they assume
the ability to provide the information necessary to understand and manage culture. In addition,
multiple methods are needed to “crack” the culture, something which can be done best using
variety of sources. As there is (so far) not one best method for diagnosing organisational
culture (Cameron & Quinn, 1999) such a claim would be the same as saying there is one best
organisational design, one best style of leadership, and one best set of organisational
dimensions in an organisation’s success.
O'Reilly et al. (1991) developed the Organizational Culture Profile (OCP) in order to
investigate person-culture fit in organisations and calculate this fit by “correlating the profile
of organisational values with the profile of the individual’s preferences” (p. 494). This way,
they demonstrated the OCPs ability to assess people as well as organisation. The authors
conclude that the results show reasonable reliability and validity, and claim that an important
finding of the initial study was that a link between an individual’s preference for a certain
culture and the culture of the organisation the person joins can be seen, and that this is related
to satisfaction, commitment and, ultimately, turnover.

31
The use of the Critical Incident Technique (CIT) offers, according to Mallak et al. (2004), a
means for identifying good and poor service episodes across a variety of industries. This
technique for measuring culture offers “a rich methodology for surfacing an organization’s
culture from a bottom-up perspective” (Mallak et al., 2004, p. 180). Although primarily used
in the health care sector, it can be used in most service industries; however, it is not the
appropriate tool for this research project, as it needs development to fit the situation in which
it is going to be used.
A summary of instruments available for culture assessment has been put together by
Ashkanasy, Broadfoot, and Falkus (2000). A classification of 18 instruments, made between
1975 and 1992, was developed in order to allow for comparison between the numerous
surveys available to the researcher on organisational culture. The instruments measured levels
ranging from behaviours to beliefs and values. First, Ashkanasy et al (2000) divided the 18
instruments into those who measure patterns of behaviour and those who measure values and
beliefs. The former (in which three could be categorised) focus on the first level of Schein’s
(1985b) typology and the latter (in which 15 could be categorised) focus on Schein’s (1985b)
second level of organisational culture.
Furthermore, Ashkanasy et al. (2000) divide the 15 culture instruments measuring values and
beliefs into two categories; typing or profile scales. Typing scales deals with taxonomies and
the profiling scales deal with measuring the strengths and weaknesses of organisational
members’ values and beliefs. Ashkanasy et al. (2000) point out that little significant
development of survey measures of culture has been developed since 1992. The only notable
exception is the “Global Leadership and Organizational Behavior Effectiveness” (GLOBE)
instrument, which has been developed for cross-national studies of organisational culture and

32
leadership. Multiple method studies of culture appear to be shared by scholars as the best way
of capturing and diagnosing an organisation’s culture.
Finally, survey assessment of organisational culture has been attributed numerous advantages
by researchers (Ashkanasy et al., 2000). Examples are that they allow for replication and
cross-sectional comparison, as well as helping initiation of culture change efforts. One widely
accepted cultural measurement tool is the OCAI instrument (Cameron & Quinn, 1999).
2.5.2 Organisational Culture Assessment instrument The Organisational Culture Assessment Instrument (OCAI) was developed from a two
dimensional framework which represented the “core values” of an organisation (Quinn &
Rohrbaugh, 1981). Quinn and Rohrbaugh (1983) later developed the Competing Values
Framework (CVF), and based on this Quinn and Cameron (1983) developed a model for
predicting organisational life cycle development. The CVF is also the theoretical model upon
which the OCAI was based (Cameron & Quinn, 1999). The tool has so far been used in
almost 10,000 organisations around the world, in almost any thinkable sector such as private
and public sector, health care, education, and start-ups (Cameron, 2004).
According to Igo and Skitmore (2006), the notion of competing values “has been rated as one
of the 50 most important models in the history of business study and has proven its worth
since its conception in the mid 1980s” (p. 125). Furthermore, it has shown to serve as guide
and indicator in terms of cultural change, motivation of employees as well as development of
leadership skills (Igo & Skitmore, 2006).
33
2.6 Organisational culture and the success of airlines There is little critical literature on how culture has played a role in an airline’s success.
However, one airline stands out when it comes to attributing success to the company’s
culture, and that is Southwest Airlines. Southwest Airlines is probably one of the best known
success stories in the airline industry with a number of articles and even books written about
its particular culture (e.g. Bunz & Maes, 1998; Gittell, 2003; Quick, 1992; Smith, 2004).
Gittell (2003) has written an entire book on Southwest Airlines, emphasising the power of
relationships rather than just accrediting the company’s success to its culture, leadership, and
strategy. Sometimes authors have written about Southwest in order to compare the
organisation with other airlines (Seal & Kleiner, 1999), trying to identify what others could do
better. The easy going, relaxed corporate style of the organisation, as well as having shared
goals, shared knowledge as well as mutual respect is said to be contributing elements of the
airline’s culture towards it’s success (Smith, 2004).
Empirical research on how an organisational culture contributes to an airline’s success
appears to be limited. Quick (1992) notes that suggesting culture is the only variable in an
organisation’s economic success, or even an important variable, is unsubstantiated. Rather, he
suggests that culture can be seen as “the connective tissue knitting together an organization’s
people so that they can succeed in the face of environmental challenges and opportunities”
(Quick, 1992, p. 45). Smith (2004) supports this by listing several elements in Southwest’s
competitive cost advantage, in addition to the organisational culture: people job security, fare
structure system, reservation system, and meal costs, to name but a few.
Quick (1992) recognises that the leaders of some airlines have contributed to an
organisational culture which has fostered success, providing the examples of Robert Crandall
(American Airlines), Frank Lorenzo (Texas Air), and most notably, Herb Kelleher (Southwest

34
Airlines). The impact of the leader or founder on the organisational culture is in line with the
findings of Schein (1983), who found that entrepreneurs are strong-minded in what they want
to do with their original idea, clearly affecting the culture. Lorenzo (Texas Air) and Kelleher
(Southwest) are examples of this, both coming from start-up airlines.
Southwest Airlines are in a league of their own, showing profit for 32 of the last 33 years
(Flint, 2005) and much credit for this has been given to former CEO Herb Kelleher, now
executive chairman. His niche strategy, together with contribution in creating a unique
organisational culture, has helped Southwest Airlines earn the status as one of the most
successful airlines in the history of the industry. In an industry which is struggling overall,
Kelleher has shaped a culture which helps the company to overcome the constant challenges
faced, as well as the work environment (Quick, 1992). Quick (1992) goes on to highlight what
was identified by Schein (1983) as the “artefacts” and “creations” deriving from the values,
beliefs, and assumptions of the leader, regarding people as well as the work itself, as a major
contributing factor in the organisational culture of the airline.
2.6.1 Airline culture and performance In their study of the role of organisational culture on performance, Kotter and Heskett (1992)
undertook important research on organisational culture with regards to airlines and their
performance. In their study they found that American Airlines had a very good fit between
their organisational culture and the environment they operated in, while a competitor
Northwest Airlines had only an average good fit with their environment. American Airlines
were also found to have the appropriate culture to value leadership from its managers.
Leadership practices will according to some scholars (e.g. Kaliprasad, 2006) guide employee
behaviour, which in return must be appropriate to meet customer demands. This can play a
contributing role in creating a high performing organisation.

35
In their study of firm performance, Kotter and Heskett (1992) investigated a number of other
airlines as well: American Airlines (12), Continental (180), Delta (9), Eastern (199),
Northwest (83), Pan Am (196), Piedmont (87), TWA (194), United (116), and US Air (73);
with the companies’ rank in terms of cultural strength as identified in 207 American
companies shown in brackets. The airlines in this survey were all large airlines at the time of
investigation; however, Eastern Airlines and Pan Am have since ceased operation, while
Piedmont has gone through numerous restructurings. Throughout the study, American
Airlines is frequently recognised as one of the stronger performers of all 207 companies,
based on a number of financial indicators. Moreover, having the 12th highest culture score of
all participating companies, the conclusion is that American Airlines has a high-performing
organisational culture.

36
2.7 Summary There is clearly some evidence that organisational culture plays a role in the success of
organisations. In the airline industry we can see that the examples of Southwest and American
Airlines have been highlighted a number of times over the last decades. Even though there is a
lot of research undertaken on organisational cultures in general, there is little specifically on
the role of culture in the airline industry and how this relates to its performance. Moreover,
what has been written on culture in airlines has mostly been published in journals and
magazines that do not base their articles on primary research.
What has been done in terms of empirical research has contributed to knowledge of how
organisational culture impacts an organisation’s performance, through approaching
investigation into culture with appropriate qualitative research techniques. Still, there is
clearly a gap in the literature to be filled concerning in particular the role of culture in airline
performance. This researcher’s research question will attempt to start closing this gap when
addressing the effects of organisational culture in airline success. First, investigating the role
of organisational culture and organisational values in smaller airlines has not been given much
attention, apart from what has been done primarily in Southwest airlines. Second, little
research exists on the role of culture and values in a New Zealand airline.
The next chapter will present the research methodology used in this research to collect and
analyse data on organisational culture and values in the New Zealand airline industry.

37
3 METHODOLOGY
3.1 Introduction
The purpose of this section is to give an account of how the researcher behind this thesis
designed and conducted the research. In this section a number of issues are presented:
Research methodology, methods of data collection, formulation of a research question, the
online survey tool, the interview process and the selection of the sample. Furthermore,
relevant methods for analysing the data collected are presented, the limitations to the research,
as well as what ethical considerations the researcher had to take into account before the study
could be initiated.
This research in the New Zealand airline industry aims to identify a link between
organisational culture and organisational performance. The primary research question for this
research has been formulated as: “What is the perceived relationship between organisational
culture and firm performance of a smaller New Zealand airline?” To answer this main
question, five sub questions have been developed:
1. How relevant is the organisational culture concept to this firm?
2. What is the perceived current and preferred culture of the organisation?
3. What are the current and preferred values for this organisation?
4. What is the perceived relationship from a staff point of view, between culture and
values, and organisational economic performance in this firm?
5. How do senior managers perceive the relationship between their culture and economic
performance?

38
3.2 Research methodology
A hybrid method methodology was used in this study in order to get the relevant data needed
for this project. The hybrid methodology is used in this context to collect data from a number
of sources in the organisation, through a qualitative and quantitative process, as one source of
information or one method would not suffice when investigating organisational culture.
Harrigan (1983) explains how hybrid methodologies are characterised by multiple data
sources, and that such studies need a carefully structured sample design. Cooke and Rousseau
(1988) hold that “qualitative and quantitative methods are complementary approaches to the
study and assessment of organizational processes and attributes” (p. 246). The authors also
argue that any culture intervention based on only qualitative data collection techniques have a
tendency to be too broad and therefore also vague. This approach deals with the
understanding of human behaviour, based on participants’ own frame of reference (Collis &
Hussey, 2003). This approach fits with this proposed research, as perceptions of culture are of
primary interest. In addition, Healy and Perry (2000) emphasise that the positivist approach is
insufficient when looking at the social science area, and this study is more consistent with a
social science orientation.
This particular project also used elements of the case study approach. It involved a one-
organisation case study of a New Zealand airline, where quantitative and qualitative
approaches were used to complement each other. Case studies have been seen as a
methodological tool for three types of research: descriptive, explorative, and explanatory
(Yin, 1994). The two latter explain situations without any single outcome, and causal
relationships respectively. Stake (1995) defined descriptive and explorative case studies as
being a disciplined and qualitative inquiry mode into single cases, however not essentially
qualitative (Stake, 2000). This research is explorative in that it delves into an organisation’s

39
culture, looking at what sort of culture is present and how it reveals itself. Moreover, this
research is explanatory in that it aims to establish a link between the current cultural situation,
the organisational values, and how these elements are interpreted by management. Ultimately,
the outcome should provide an insight into what ways the organisational culture affects
performance.
Hybrid research techniques where elements of qualitative and quantitative methods are
combined are common in studies involving social research (e.g. Burchell & Kolb, 2003;
Harrigan, 1983). This hybrid approach was employed in this study to answer the research
questions. First, the quantitative approach was employed. In this research, members of the
organisation were surveyed regarding their perceptions of the organisational culture and
values. The quantitative approach is most often found in the sciences, where the ultimate goal
is to identify facts or understand the concept. In science the researcher should not be biased
but stay objective, and look at large samples in order to find a definitive true answer from
which to try to generalise from the sample to a population (Collis & Hussey, 2003). In this
research, a survey questionnaire tool was used to highlight any potential gap between the
current and preferred culture as perceived by a sample of the organisation’s employees and
the management team. Furthermore, Amaratunga, Baldry, Sarshar and Newton (2002) claim
that the strengths of the quantitative approach is in the fact that it can provide wide coverage
of the range of situations, and that it is cost-efficient as well as fast to execute. For this student
research to be feasible it must be both cost-efficient and executed quickly and effectively, as
the total time available for conducting the actual research is strictly limited.
The qualitative approach is frequently employed in the social sciences and is also employed in
this study. The data gathered with this approach tends to be, according to Collis and Hussey
(2003), rich and subjective and is likely to come from a small sample. Some strengths of this

40
approach, according to Amaratunga et al. (2002), is the ability to look at a process or situation
over a longer period of time, increasing the ability to understand people’s meaning as well as
the ability to pick up on new issues, should they arise during the process. Ahmad and Ali
(2003) present further strengths of the qualitative methodology by claiming it provides greater
accuracy, higher level of detail, as well as providing a deeper understanding of the concept
investigated. Ahmad and Ali (2003) summarise by saying the qualitative methodology “is
used where there is a concern for understanding how things happen and how they are related,
rather than only measuring the relationship between variables” (p. 2).
In this study one to one interviews are used in line with Ahmad and Ali’s view: to develop a
greater understanding of the concept researched. That concept is in this case an organisation’s
culture and the picture that has been created of this particular culture through the
Organisational Culture Assessment Instrument (OCAI). Interviews were used in order to
understand any potential shift in culture and values in the organisation from the present
situation and into the future, and to bring into light any reasons for this development. In the
case of this research it has been important to use the qualitative interviews to fully understand
the quantitative data collected through the survey questionnaire.
Easterby-Smith, Thorpe and Lowe (1991) hold that a qualitative approach to interviews is
appropriate when there needs to be a high degree of confidentiality regarding the issue
discussed (e.g. commercially sensitive areas – quite common in the airline industry). This fits
nicely with this researcher’s proposed research. Semi-structured interviews with open-ended
questions allow the interviewer and interviewee to discuss views and interpretations on the
subjects in question.

41
Cultural studies are often regarded as being interpretive in nature. Taking an interpretivistic
perspective on organisational culture is a recognised approach by a myriad of scholars (e.g.
Collins & Smith, 2004; Maull, Brown, & Cliffe, 2001; Schultz & Hatch, 1996). As this study
sought to identify the meanings associated with culture, this approach was used as it permitted
the executives to explain what culture meant to them and the organisation.
In this study, combining elements from a survey questionnaire of a single case organisation,
as well as semi-structured interviews, was a way of mixing methodologies. Mixing
methodologies “allows you to take a broader, and often complimentary, view of the research
problem or issue” (Collis & Hussey, 2003, p. 76). Even though Collis and Hussey (2003)
point to difficulties in mixing methodologies, it is commonly employed by researchers (for
discussions, see e.g. Ouchi & Wilkins, 1985; Van Maanen, 1979).
The purpose of this mixed methodology research in this study was to:
• Obtain data from staff members on the current and the preferred organisational culture
in a small New Zealand airline through the use of the OCAI assessment instrument as
an electronic questionnaire described by Cameron and Quinn (1999).
• Obtain data on the values of staff members in a small New Zealand airline through
using an electronic questionnaire based on shared value concepts identified by
McDonald and Gandz (1992).
• Identify from a staff point of view, through qualitative comments in an electronic
survey, the importance of the organisational culture, as well as what is the perceived

42
relationship between culture and values, and organisational economic performance in
this firm.
• Interview senior managers in order to gain their perceptions of the survey findings and
how these are associated with economic performance in the airline.
3.3 Data Collection Methods Data collection was completed in two stages. Stage one consisted of a survey questionnaire of
the organisation’s more senior employees. This three-part questionnaire was made into an e-
survey and made available online to staff via email (Appendix 1 page 172). Part one of the
questionnaire collected demographic data, while parts two and three of the survey have
utilised the instrument developed and made popular by Cameron and Quinn (1999) and the
values employed in the study by McDonald and Gandz (1992). The combination of Cameron
and Quinn’s (1999) Organisational Culture Assessment Instrument and values survey of
McDonald and Gandz (1992) have not been previously reported in the literature.
Part two is based on the Competing Values Framework (CVF) initially developed by Quinn
and Rohrbaugh (1981; Quinn & Rohrbaugh, 1983) and employs the survey tool developed by
Cameron and Quinn (1999) – the Organizational Culture Assessment Instrument (OCAI). The
CVF study method has proven validity and reliability through literally thousands of
organisational culture analyses (Cameron & Quinn, 1999). Furthermore, Cameron and Quinn
claim that the OCAI has been found to predict organisational performance (1999), which was
of importance to this research. This part comprises six questions on organisational culture
which are to be answered twice, where respondents highlight the difference between the
current and the preferred future organisational culture. The preferred culture reflects
perceptions of what constitutes a high performing organisation. Additionally, asking
43
organisational members, especially key executives, to respond to culture assessment
instruments with regards to what behaviours they believe are critical in achieving
organisational goals as well as preferred future strategies, is what Cooke and Rousseau
(1988), consider to be a way of facilitating the identification of behaviour desired and needed
from all organisational members. This fits with the researcher’s project, as it aims to identify
the views of senior managers and staff members in general, and to what degree these are
aligned and in line with organisational goals.
The third part of the questionnaire used elements of a study by McDonald and Gandz (1992)
and consisted of a list of 24 shared value concepts from which the respondents select eight
that they believe most strongly describe the current organisation, and which eight values are
the most appropriate for the future. Parts two and three allow for a useful cross-referencing
with previous studies. An online version of this survey questionnaire was developed by the
researcher, and made available on the survey tool site http://www.questionpro.com for
respondents to access electronically whenever it suited them.
The organisation had at the time of conducting the research between 350-400 staff members
in total, based across New Zealand. This number could not be more specific due to there
being a great number of part-time employees and contracted staff members. The three-part
survey was sent out to all staff members having an email address or who had chosen to
subscribe to company email directly to their private email account.
Stage two of the research was undertaken through interviewing key executives at the most
senior levels of the organisation. A maximum of ten interviews were initially planned to be
conducted, but only 6 interviews were finally scheduled due to a lack of availability of senior
executives in the organisation at the time of the interviews. The purpose of the interviews was

44
only to follow up on the results from the survey and it was not the intention of the researcher
to create a full new set of data. There were two reasons for this: First, creating too much new
data from the interviews with management would result in excess information, ultimately
making the research too vast and unmanageable for the proposed scope. Second, senior
management staff needed only give their interpretations and perceptions on the outcome of
the survey questionnaire to give an insider’s view of why the results show what they do.
Interviews can be seen as part of both the positivist and interpretivistic approach (Collis &
Hussey, 2003). The main difference between the two is the way in which questions are
formulated. The research approach suggested conducting in-depth interviews with semi-
structured open-ended questions, in order to explore the answers in depth; as opposed to the
positivist questions which are closed (i.e. the possible answers are predetermined and limited
in numbers). The researcher allowed the interviewees to deliberate freely on each question by
asking for perceptions, interpretations, and personal views in order to try and get an idea of
why the organisational culture and values were diagnosed the way they were. Had closed
questions been asked this could have limited the way interviewees were able to express their
perceptions.
Stage two of the research moved the setting of the research one level up, from staff members
at all levels of the organisation to senior managers, rather than broadening the scope. The
questions asked at this stage were based on the analysis of the findings of the survey as well
as key ideas from the literature on culture and performance. The interviews were conducted at
different levels of management from departments including HR, marketing, IT, and finance,
operations, as well as the GM. These were the key informants of the organisation.

45
With the assistance of the organisation, the electronic survey was distributed over email
throughout the organisation. Furthermore, senior managers (key informants) were targets for
interviews following analysis of the survey results. They were also nominated by the
organisation, and the main selection criterion was that they should hold management
positions. The interviews took place in October and November of 2006.
3.4 Survey instruments The strength of the survey instrument used in this research according to Cameron and Quinn
(1999) is that it requires the respondents to only answer six items. These six dimensions are:
dominant characteristics, organisational leadership, management of employees, organisation
glue, strategic emphases, and criteria of success. Cameron and Quinn (1999) argue that
This instrument has been found to be both useful and accurate in diagnosing important
aspects of an organization’s underlying culture. It has been used in more than a
thousand organizations that we know of, and it has been found to predict
organizational performance (p. 18).
Commonly, the instrument is completed twice, as was the case for this research as well – first
to assess the current situation of the organisation, and the second time to assess how
respondents would prefer their organisation to be in for example five years.
3.4.1 The Format of the Questionnaire The questionnaire used for this research consists of three parts. Part one consisted of general
questions on demographics such as age, gender, and length of service to the organisation.
Part two of the questionnaire replicated in full the Organisational Culture Assessment
Instrument (OCAI) by Cameron and Quinn (1999). Following short but concise instructions

46
the respondents had to go through the six elements of the OCAI (dominant characteristics,
organisational leadership, management of employees, organisation glue, strategic emphases,
and criteria of success) twice. Each of these questions had four alternatives and a total of 100
points should be divided among the alternatives A, B, C, and D. The OCAI is constructed in a
way that the respondent gives his or her answers to how they perceive the current situation as
well as the preferred future situation by answering the same set of questions twice (See
Appendix 1 on page 172).
The third part of the questionnaire was based on a study by McDonald and Gandz (1992),
where they listed 24 values deemed to be relevant in the context of modern business
corporations. The values were listed in their original form and context, along with the
accompanying definitions (See Appendix 2 page 181). The only modification made was in
changing the value aggressiveness to the more “New Zealand-friendly” assertiveness.
According to the Oxford English Dictionary the meaning of these words is the same, although
aggressiveness can be considered to have a rather different meaning in New Zealand. Making
minor adaptations to how a list of values are reported has been done by other scholars (see,
for example, Lawrence, 1998). In this study, the respondents were asked to choose eight of
the 24 listed values, through identifying for themselves which are considered to be the most
important eight values in the organisation. These eight values were not ranked in any way.
3.4.2 Pilot Study Eight fellow students and colleagues without any prior knowledge of this survey instrument
were invited to do a pilot test of the online survey prior to it being sent out to the actual
respondents, and all of them accepted. They came from different backgrounds and with
different languages (five to be exact) as their mother tongue. Collis and Hussey (2003) argue
that it is the important to pilot questionnaires before they are distributed, even if it is just on

47
colleagues and friends as it will help spot glaring errors you otherwise would not spot
yourself. In this case, the pilot participants were asked to give their feedback to the following
questions:
1. How long did it take you to complete the survey?
2. Did you feel the survey took too long to complete?
3. Did you feel discouraged by having to complete the same six questions in Section 2
twice?
4. Did you find the instructions given prior to each section to be clear and explanatory,
having never seen this questionnaire before?
5. Could any the sections of the questionnaire be misunderstood or misinterpreted and if
you believe so please demonstrate how?
6. If NO to question 3 and/or 4; do you have any suggestions with regards to how
instructions could be improved?
Participants spent on average 14 minutes to complete the pilot survey, none of them felt it was
too long, and they were all comfortable with having to answer the OCAI twice. Instructions
were only slightly altered following the pilot test, for greater clarity and understanding, also
with regards to possible respondents whose first language was not English.
3.4.3 Research Participants/Subjects The questionnaire was sent out to all members of the organisation as this proved to be feasible
given the electronic nature of the questionnaire as well as being in the interest of the case
organisation. The recipients all had email addresses in the company or they subscribed to
email from the company to their private e-mail address. The recipients received the
questionnaire as a URL taking them straight to the e-survey. The survey was available for two

48
working weeks, and a reminder was sent out halfway through the process. The questionnaire
was to be completed in the respondent’s own time.
Following an analysis of the results from the survey, interviews with ten senior managers was
planned. These executives represented most departments in the organisation and were
nominated by the company itself based on their availability and accessibility. Eventually a
total of six interviews were conducted due to unavailability issues.
3.4.4 The Nature of the Interview In this particular research, findings from the survey of the organisation’s senior employees
were discussed via the interview with the senior management of the airline in an attempt to
discover how they interpreted the results, and whether there are any discrepancies between
what was identified in the survey and what was perceived by this group concerning the
company. Collis and Hussey (2003) highlight that interviewees can be reluctant to be truthful
about certain issues, should the setting not be a confidential one-to-one situation. In a fiercely
competitive industry in which airlines operate, there will always be elements of the business
that cannot be disclosed for fear of losing competitive advantage. For this reason, factual
figures on performance were not investigated. Rather, questions based on the findings from
the survey were asked in order to get management’s interpretation of what the results could
signify in this organisation. During the course of the interviews, each person was asked the
same five questions:
• The first one aimed to determine whether the respondent believed the organisational
culture concept had any particular importance for the airline industry;
• The second question allowed the person to give an opinion on the shift in the OCAI
diagram;

49
• The third question allowed for interpretation of the values that had the greatest
increase or decrease in importance;
• The fourth question asked the respondent to relate organisational culture to the
company’s performance;
• Finally, each interviewee was asked to comment on particular incidents which show
the organisation’s unique culture and why it can be considered appropriate or not.
The interview questions can be seen in Appendix 3, page 182.
3.5 Data Analysis The data gathered from the survey was subjected to quantitative analysis. All survey data
gathered was transferred to Microsoft Excel for calculation. Only simple calculations were
needed to draw up average culture plots for the organisation as well as to determine each
value’s relative importance. Excel was also used to create the numerous diagrams, charts and
tables that became the result of all the gathered data.
The interviews from the qualitative part of the research were recorded and transcribed
verbatim in order to facilitate analysis of the interview contents. The transcripts were
investigated both manually and by creating nodes using QSR’s qualitative research software
N6 in order to highlight and collate themes. According to the software developer’s website N6
is appropriate to group together concepts so that meaningful context can be interpreted. The
software is appropriate for organisational analysis and mixed method research in particular
("QSR", 2006). Themes were identified during the interviews, and later reviewed with respect
to the organisational culture literature available. This is presented in Chapter 4 “Results and
Discussion”.

50
3.5.1 Demographics The following demographic information was collected: gender, age, length of service with the
organisation, management vs. non-management role, and finally what department the
respondent belonged to. The demographics data were collected in order to check for
significant differences between gender and age groups, but more importantly differences
between different departments and with regards to total time with the organisation.
3.5.2 Analysis of Organisational Culture Assessment Instrument OCAI scores from each of the 28 (30 in the case of the current situation) participants were
entered into an Excel spreadsheet for easy calculation of necessary averages used in OCAI
plots. Scoring the OCAI is relatively easy as it requires primarily simple arithmetic
calculations (Cameron & Quinn, 1999). For each completed OCAI survey (Appendix 1)
returned, in step one all A responses in the NOW column for the six dimensions were added
together and then divided by six. This results is an average score for the A alternatives in the
NOW column. This step was repeated for alternatives B, C and D as well. Step two was to
add all the responses from the PREFERRED column for the A, B, C, and D responses.
A worksheet developed by Cameron and Quinn (1999) was used throughout the calculation of
the average OCAI plots, by incorporating this into an Excel-document (Appendix 4 page
183). The scores emerging as a result of the OCAI where plotted on a graph in yet another
worksheet in order to draw a picture of the organisation’s culture. The graph used for plotting
the scores is shown below in figure 3.1. It has been argued that “insight and understanding is
best created, not by submitting data to statistical test, but creating pictures of data” (Tukey, as
cited in Cameron & Quinn, 1999, p. 55). The picture created from the OCAI data assists the
researcher in highlighting certain attributes of the organisational culture that would have been

51
less obvious without this visual depiction. Moreover, Cameron and Quinn (1999) argue that
“the OCAI focuses on some core attributes of an organization that reflects its culture” (p. 55).
The rating of six core attributes (dominant characteristics, organisational leadership,
management of employees, organisation glue, strategic emphases, and criteria of success) has
given indications as to what type of culture is dominant in the organisation. An example of a
culture plot for the current and preferred culture is illustrated in figure 3.2.
3.5.3 Reliability and Validity of OCAI According to Collis and Hussey (2003), reliability is concerned with whether the findings of
the research is credible or not. They also say that if research findings can be repeated, the
findings are reliable.
Cameron and Quinn (1999) hold that reliability in the context of the OCAI refers to the extent
to which the instrument measures culture types consistently. Numerous studies have
confirmed the OCAI’s reliability (e.g. Quinn & Spreitzer, 1991; Yeung, Brockbank, & Ulrich,
1991; Zammuto & Krakower, 1991). These studies reinforce the researcher’s confidence in
using the OCAI for this particular study. Cameron and Quinn (1999) further strengthen this
argument in saying that “sufficient evidence has been produced regarding the reliability if the
OCAI to create confidence that it matches or exceeds the reliability of the most commonly
used instruments in the social and organizational sciences” (p. 140).
Validity is the extent to which findings of the research actually represent what is happening in
reality (Collis & Hussey, 2003). Cameron and Quinn (1999) say that validity refers to the
extent to which phenomena that are supposed to be measured are actually measured; In the
case of the OCAI it refers to whether the instrument really measures the four types of
organisational culture (adhocracy, clan, hierarchy, and market).

52
Figure 3.1: The Organisational Culture Profile
Figure 3.2: Culture Plot, current and preferred future situation
Source: Cameron & Quinn (1999)
Current Situation Preferred Situation
53
Faulty research procedures and misleading measurements can undermine the validity of a
particular research. Collis and Hussey (2003) highlight two different types of ways to assess
validity of research. First, face validity deals with making sure the measures or tests used
really do measure what they are supposed to measure. Second, construct validity deals with
the fact that there are phenomena, hypothetical constructs, which are not directly observable
and that require the researcher to demonstrate that observations and findings can be explained
by the construct. With regards to this study, face validity deals with whether the respondents
found the survey tool believable or not, in the sense that it actually did measure organisational
culture. No issues arose from the pilot test and no comments had been made during the two
weeks the survey was active. Similarly, construct validity in relation to this study deals with
whether inference can actually be made by the researcher from the use of the OCAI survey
tool as well as the values construct, and back to the theories upon which these survey
instruments are based on.
According to Cameron and Quinn (1999), no study of the OCAI has produced contradictory
disconfirmatory evidence, however, a number of studies have produced evidence for its
validity (e.g. Cameron & Freeman, 1991; Quinn & Spreitzer, 1991; Zammuto & Krakower,
1991).
3.5.4 Analysis of Organisational Values In the third part of the survey questionnaire respondents had to choose 8 values (in no
particular order) from a list of 24. This allowed the researcher to create a picture of which
values are present in the organisation today versus those values that are considered important
for the future. Any values currently present but less emphasised for the future could therefore
be deemed less important for the organisation.

54
The results of the third part of the survey questionnaire were plotted into Excel to facilitate
ranking of chosen values. Excel also allowed for easy creation of tables of frequency.
McDonald and Gandz (1992) embedded these 24 values across the same four quadrants (clan,
adhocracy, hierarchy, and market) Cameron and Quinn (1999) did with the organisational
culture. This allows for a cross-referencing of findings of the OCAI and the values identified
by McDonald and Gandz (1992). By plotting the values for the current and preferred future
situation in Figure 3.3 based on the frequency of which they have been selected as important
by respondents, the figure will create a picture of the organisational values which can be
compared with the outcome of the OCAI (see Figure 4.31, page 108).
Figure 3.3: Shared value concepts embedded in Quinn and McGrath’s model of organisations (McDonald & Gandz, 1992, p. 69)

55
3.5.5 Analysis of Open-ended Interviews Transcripts of the six interviews were all processed manually using a highlighter to group
together reoccurring themes and separate particularly useful quotes from the rest of the
interview transcript. The interviews were also processed using QSR’s software for qualitative
research, N6, to compare with what was found previously.
3.6 Ethical Considerations The research project adhered to Unitec New Zealand’s ethics process, and gained ethical
approval from the Unitec Research Ethics Committee (UREC) with approval number
2006.723. Furthermore, key management personnel within the New Zealand airline were
approached and gave written approval to approach members of staff for completion of the
survey questionnaire, as well as allowing for interviews with key senior staff members. The
interviewees were presented with a participant information sheet regarding the research, and
following a brief explanation of the interview process they were asked to sign a consent form.
No consent forms were required for the survey, as the respondents gave their consent upon
choosing to complete it.
Moreover, the completed thesis makes no direct reference to any employee within the
organisation, and all data collected will remain totally confidential. Finally, upon completion,
a copy of this research thesis will be made available to the General Manager of the
organisation.

56
3.7 Summary
Using a hybrid method combining qualitative and quantitative methods, this single
organisation case study was conducted in a New Zealand airline company. Employees were
surveyed using an electronic questionnaire distributed online, and the findings from the
survey questionnaire were discussed via an interview with members of senior management.
These interviews were recorded and transcribed, and analysis of the total pool of data was
undertaken using Microsoft Excel and QSR’s N6. In the next chapter, results from the data
collection are presented in detail and discussed continuously.

57
4 RESULTS AND DISCUSSION
4.1 Introduction The results and findings of this research are presented in the sections below. This chapter
explores findings related to the main research questions, as well as the sub questions
identified. This chapter also presents a discussion of the key results and findings that have
been revealed in this research. Issues found are highlighted, and compared with the literature
where relevant. The discussion primarily presents a picture of the organisational culture and
values particular to this case organisation, based on the perceptions of the organisation’s
members. The relevance of this particular culture to the organisation, and whether it is
appropriate as well as aligned with the culture preferred for the future, is also discussed.
Finally, conclusions, further implications and directions for further research are presented in
the next chapter.
The goal of this research was to investigate the perceived relationship between organisational
culture and firm performance in a New Zealand airline. This chapter presents a discussion of
the key findings that have been revealed, with regards to the original research questions:
1. How relevant is the organisational culture concept to this firm?
2. What is the perceived current and preferred culture of the organisation?
3. What are the current and preferred values for this organisation?
4. What is the perceived relationship from a senior staff point of view, between
culture and values, and organisational economic performance in this firm?
5. How do senior managers perceive the relationship between their culture and
economic performance?

58
The chapter is split into four sections:
• First, the findings and results from the electronic survey questionnaire is presented,
divided into the same three groups as the questionnaire itself: Demographics, the
Organisational Culture Assessment Instrument (OCAI) by Cameron and Quinn
(1999), and McDonald and Gandz’ (1992) shared values relevant to a modern
business corporation.
• Second, each research question is answered with regards to the findings of the survey
and the interviews, and compared with the literature. This section combines the
survey outcome with the interview findings.
• Third, the responses from the survey questionnaire’s other comments are presented,
and discussed where relevant.
• Finally, the chapter is summarised before leading into the final chapter presenting
conclusions.
4.1.1 Research process and challenges The researcher intended from the outset of the process to approach a New Zealand airline in
which to conduct the actual research on culture and values. A total of seven airlines of varying
sizes with operations in New Zealand were initially approached, of which several responded
to the request, although one company expressed more interest than the others. This company
agreed to become the case organisation for this research.
Distributing the online survey was a more time consuming process than expected. The
company researched required a confidentiality agreement of their own, in addition to the
Unitec Research Ethics Committee (UREC) approval of the research guaranteeing full
confidentiality. Following the signing of the company confidentiality agreement, the survey

59
was finally distributed on October 16th 2006 and responses were received over a two week
period.
The findings from the survey formed the basis for the questions for the face to face interviews
with staff in senior management positions. Each interviewee was requested to interpret the
outcome of the survey based on their perceptions. The delay in gaining the company
confidentiality agreement extended the timeline for the project. Because the researcher
himself was on a tight completion timeline for the field work, some interviews which were
cancelled could not be rescheduled in time.
4.1.2 Plotting an Organisational Culture Assessment Instrument (OCAI) profile Each respondent completed the OCAI section of the survey twice to determine the current and
future preferred culture of the organisation. For each individual questionnaire completed, the
As, Bs, Cs, and Ds were calculated and the average for each of these was determined. That
results in a score for each of the six alternatives in the OCAI. This is calculated for both the
present and future results. Results from each survey respondents were entered into an Excel
spreadsheet and an average based on all respondents has been calculated. This average is used
for plotting the OCAI quadrants throughout this chapter.
4.1.3 Interviews In late October 2006 the researcher conducted six individual semi-structured interviews with
senior management staff at Pukeko Air Ltd. Results of the survey questionnaire formed the
basis of the topics discussed with the interview subjects, and these yielded the main themes
for this section concerning the interview findings. On the outset of the research, a proposed
maximum of ten interviewees were going to be approached. A group of nine individuals were
eventually identified as appropriate and later approached, but in the end three declined to
participate due to workload reasons. Reasons for choosing the interviewees are explained in

60
detail in chapter 3 under data collection. No interviewee is directly referred to in this section;
rather their ideas are grouped together as a set of emerging themes arising from the six
interview sessions.
The interview subjects were selected from all major departments in order to cover the
perceptions that are likely to be representative of business as a whole. A list of potential
interviewees was suggested by the company’s General Manager, with the final decision
resting with the researcher. The General Manager, together with managers from five primary
areas of business (operations, functional/administrative, management, and “others”), were
interviewed on the basis of the results from the survey questionnaire. The researcher used the
QSR N6 software for helping identifying recurring themes in the transcripts from the
interviewees. The same process was undertaken manually by the researcher using highlighter
pens of different colours, a process possible due to the relatively small number of
interviewees.

61
4.2 Survey results part 1: Demographics data In total, 28 individuals responded to the whole survey questionnaire, representing
approximately 8 % of all members of the organisation. Because the organisation could not be
more specific about how many employees who actually received the survey invitation (350-
400 potential recipients), this percentage is not necessarily accurate. Of those who completed
the survey, 53 % were male and 47 % female. Furthermore, of those completing the survey 50
% were aged 40 and above, 33 % between 30 and 39, and the remaining 17 % were aged
between 18 and 29 years. The current organisation consists of employees from what was once
two separate organisations, with 63 % coming from the younger and smaller of the two
organisations and the remaining 37 % come from the larger and more well-established firm.
None of the respondents had been hired directly into the new organisation. The percentage of
respondents having been four years or more with either of the individual companies totalled
67 %. Those having been with the organisation for one to four years total 30 % and the
remaining 3 % had been with the organisation for a year or less. Sixty percent of the
respondents considered themselves to be in management position, while 40 % considered
themselves not to be part of the company management.
Finally, 30 % of respondents belonged to a functional/administrative department, 30 %
belonged to an operational department, 17 % considered themselves part of management, and
the remaining 23 % belonged to other departments within the organisation (Fig. 4.1).

62
Figure 4.1: Respondents by department
Respondents by Department
Operations30%
Management17%
Functional/Administrative Department
30%
Other23%
From the survey respondents’ demographic data presented above, there are issues that stand
out and merit some comments. First, it can be noted that 50 % of the respondents are 40 years
and above. Age is often said make a difference as to willingness to change, especially in terms
of deep seated values and beliefs. This may or may not make a difference in the event where it
is concluded that a particular culture or some values are emphasised too much or too little.
Second, more than 60% of the respondents have backgrounds derived from either one of the
two former companies that make up the case organisation. Staff members who were
previously employed by two separate organisations now represent a new and separate
organisation. If this sample is representative for the organisation as a whole, this can result in
the culture of this organisation being dominated by members who worked in either of the two
previous companies. Should the cultural values associated with these two earlier companies
be inappropriate for the future of the organisation, it may be difficult to communicate to this
majority of staff that certain values are inappropriate for the future. Finally, 67 % of the
respondents have spent four years or more with either organisation. This can be a sign that –
should it be representative for the organisation as a whole – the majority will have a good idea
of what kind of culture is present and what values are accepted, which in return can mean the
culture is deep-seated.

63
4.3 Survey results part 2: Organisational culture The results of the OCAI as identified in the organisation is in this section presented
graphically, plotted in a four quadrant figure as developed by Cameron and Quinn (1999). In
this chapter these figures are completed based on member perceptions of the current and
preferred future situation in the organisation, for the organisation as a whole as well as for
selected demographics data, in order to illustrate in numerous ways the perceived cultural
situations.
4.3.1 Perceptions of the current organisational culture Because the OCAI focuses on core attributes of the organisation being surveyed, the ratings of
survey respondents give an indication of the types of dominant culture present in the
organisation, as well as the preferred future culture should there be any difference (Cameron
& Quinn, 1999). A culture profile based on perceptions of the current situation has been
developed for the organisation surveyed, based on 30 respondents who completed the survey
up until this point (Fig. 4.2).

64
Figure 4.2: Respondents perceptions of the current culture shown on the OCAI profile (n=30)
Table 4.1: Average scores for the four OCAI quadrants as shown in Figure 4.2
A: Clan Culture B: Adhocracy Culture C: Market Culture D: Hierarchy Culture 28 19 26 27

65
4.3.2 Organisational culture preferred for the future After the respondents had to deliberate on their current organisational culture they were asked
to consider what would be an appropriate culture profile for the organisation in the future. In
the survey, “future” was in this case considered to be in “about five years time”. The cultural
profile for the preferred situation turned out only slightly different from the current situation
(Fig. 4.3).
Figure 4.3: Respondents perceptions of the preferred future organisational culture situation (n=28)
Table 4.2: Average scores for the four OCAI quadrants as shown in Figure 4.3
A: Clan Culture B: Adhocracy Culture C: Market Culture D: Hierarchy Culture 30 23 23 24

66
When the perceptions of the current and future preferred culture are put together the
difference can be illustrated as shown in Figure 4.4. (n = 30 NOW and n = 28 FUTURE)
Figure 4.4: Current vs. preferred future culture in the organisation (n=30 NOW, n=28 FUTURE)
Table 4.3: Average scores for the four OCAI quadrants as shown in Figure 4.4
A: Clan Culture
B: Adhocracy Culture
C: Market Culture
D: Hierarchy Culture
NOW 28 19 26 27 FUTURE 30 23 23 24 Difference + 2 + 4 - 3 - 3

67
4.3.3 Profiles for individual items on the OCAI According to Cameron and Quinn (1999) it can be informative to plot scores for each of the
six individual questions on the OCAI, permitting the researcher to determine whether or not
each cultural attribute reflect the same dominant culture type. The authors also hold that this
allows the researcher to determine whether or not, as well as to what degree the current
culture is congruent with the preferred future culture.
In the case organisation the individual items have been plotted in Figures 4.5 and 4.6 below.
When comparing the scores for each of the six items on the quadrant profiles, it is clear that
there are no major discrepancies between the current and preferred situation. The few notable
exceptions are seen in Organisational Glue, Management of Employees, and Criteria of
Success. First, quadrant D (hierarchy) in Organisational Characteristics is much less
emphasised for the preferred culture (from 28 to 17). This is in line with the preferred
dominant culture, where the emphasis on The Hierarchy Culture for the preferred culture is
reduced overall, although not as much as for the isolated element of Organisational
Characteristics.
Quadrants C and D retreat somewhat in Management of Employees as seen in Figures 4.5 and
4.6 (from 30 to 21 and from 31 to 23 respectively). Once again there is less emphasis on the
Hierarchy quadrant for the preferred culture, this time together with the Market quadrant.
Coincidentally, these quadrants go back the most for the dominant culture as well, and could
indicate a desire for a shift of focus in terms of how employees are managed.
Finally, quadrant A under the attribute Criteria of Success is more emphasised in the preferred
culture, gaining another eight points (from 23 to 31). This could indicate that there is a belief

68
that more of the Clan attribute is needed in order to sustain success in the future. The Clan
culture moves in the same direction in the dominant culture as well.
It should be noted, however, that Cameron and Quinn (1999) hold that the researcher should
be sensitive to differences of more than ten points, something that only occurs in the attribute
Organisational Characteristics. It can be concluded that the discrepancies identified in
Pukeko Air are not always of greatest importance; rather, they appear to confirm the overall
culture plots for the current and preferred situation.

69
10
20
30
40
50
10
20
30
40
50
Clan
MarketHierarchy
Adhocracy
ACDB
Organisational Characteristics A B C D 31 20 22 28
10
20
30
40
50
10
20
30
40
50
Clan
MarketHierarchy
Adhocracy
ACDB
Organisational Leader A B C D 25 23 25 27
10
20
30
40
50
10
20
30
40
50
Clan
MarketHierarchy
Adhocracy
ACDB
Management of Employees A B C D 29 20 30 31
10
20
30
40
50
10
20
30
40
50
Clan
MarketHierarchy
Adhocracy
A
CDB
Organisational Glue A B C D 34 19 23 25
10
20
30
40
50
10
20
30
40
50
Clan
MarketHierarchy
Adhocracy
A
CDB
Strategic Emphasis A B C D 24 21 25 29
10
20
30
40
50
10
20
30
40
50
Clan
MarketHierarchy
Adhocracy
A
CDB
Criteria of Success A B C D 23 15 29 31
Figure 4.5: Profiles for individual items on the OCAI - Current situation (n=30)

70
10
20
30
40
50
10
20
30
40
50
Clan
MarketHierarchy
Adhocracy
A
CDB
Organisational Characteristics A B C D 30 27 23 17
10
20
30
40
50
10
20
30
40
50
Clan
MarketHierarchy
Adhocracy
A
CDB
Organisational Leader A B C D 29 24 19 26
10
20
30
40
50
10
20
30
40
50
Clan
MarketHierarchy
Adhocracy
A
CDB
Management of Employees A B C D 33 22 21 23
10
20
30
40
50
10
20
30
40
50
Clan
MarketHierarchy
Adhocracy
A
CDB
Organisational Glue A B C D 34 21 21 21
10
20
30
40
50
10
20
30
40
50
Clan
MarketHierarchy
Adhocracy
A
CDB
Strategic Emphasis A B C D 29 23 21 24
10
20
30
40
50
10
20
30
40
50
Clan
MarketHierarchy
Adhocracy
A
CDB
Criteria of Success A B C D 31 17 24 27
Figure 4.6: Profiles for individual items on the OCAI - Future desired situation (n=28)

71
4.4 Organisational culture plots based on demographic data In the following section, differences in perceived organisational culture are presented based
on demographic criteria collected in the survey. Figures 4.7 and 4.8 illustrate the differences
in perceived culture by management staff and non-management staff, for both the current and
preferred future situation (n=30 and 28 respectively). Figure 4.9 illustrates the perceived
current situation only for the two groups (n=30), and Figure 4.10 illustrates the preferred
future situation only for the two groups (n=28). This latter figure has been developed to
enable an easier comparison with what is important for the future, which is possibly more
relevant than the current situation.
Overall, there is not much difference between the views of management and non-management
concerning Pukeko Air’s organisational culture. The greatest difference for the current
situation is seen in the Hierarchy culture (quadrant D); however, the difference is only seven
points. For the preferred situation the difference is even less; it appears as if the two groups do
agree upon where they want to be some time into the near future.
Figures 4.11 (n=30) and 4.12 (n=28) illustrate the perceived differences based on
respondents’ time with the organisation, grouped by those who have been with the
organisation for less than four years and those who have been there for more than four years.
Figure 4.13 illustrates the perceived current situation only for the two groups (n=30), and
Figure 4.14 illustrates the preferred future situation only for the two groups (n=28). Dividing
the respondents based on their time with the organisation does not reveal any real differences
between the two groups. This suggests that there is little difference in the views on culture
whether respondents have spent more or less than four years with either organisation making
up the current one.

72
Furthermore, Figures 4.15 (n=30) and 4.16 (n=28) show the situation with regards to whether
the respondents entered into the current organisation through organisation A or organisation
B. They illustrate any cultural discrepancies resulting from respondents entering into the
future from different backgrounds. Figure 4.17 illustrates the perceived current situation only
for the two groups (n=30), and Figure 4.18 illustrates the preferred future situation only for
the two groups (n=28). While the current situation is almost identical for the two groups, there
is a gap between the two groups when looking at the Market culture. The difference of ten
points is important, most likely resulting from the combining of separate companies with
different organisational cultures, possibly representing an area which needs attention from
management.
Finally, the organisation is for the sake of this research split into departments (n=30 NOW,
n=28 FUTURE): operations (Fig. 4.19), management (Fig. 4.20), functional/administrative
(Fig. 4.21), and finally one group named “others” (Fig. 4.22). Figure 4.23 places the four units
against each other, presenting a picture of the differences between departments as perceived
by respondents today. Similarly, Figure 4.24 presents a picture of the preferred future
organisational culture situation of the organisation. While it is not surprising to see
differences in views on organisational culture between various departments, any discrepancy
of at least ten points should be noted. Clan culture (quadrant A) and the Market culture
(quadrant C) display differences of ten points at most for the former and 12 points at the most
for the latter. The departments which are furthers apart should be looked at more closely,
however, such differences may reflect essential distinctions between departments given their
functional requirements.

73
4.4.1 Organisational culture: management vs. non- management
Figure 4.7: Perceived organisational culture among management staff
Table 4.4: Scores for Figure 4.7
A: Clan
Culture
B: Adhocracy
Culture
C: Market Culture
D: Hierarchy Culture
NOW 31 21 25 23 FUTURE 29 24 26 21 Difference -2 +3 +1 -2
Figure 4.8: Perceived organisational culture among non-management staff: now vs. future
Table 4.5: Scores for Figure 4.8
A: Clan
Culture
B: Adhocracy
Culture
C: Market Culture
D: Hierarchy Culture
NOW 25 19 26 30 FUTURE 32 21 22 25 Difference +7 +2 -4 -5

74
Figure 4.9: Perceived culture, management vs. non-management: current situation
Table 4.6: Scores for Figure 4.9
A: Clan
Culture
B: Adhocracy
Culture
C: Market Culture
D: Hierarchy Culture
NOW: MGMT 31 21 25 23 NOW: NON-
MGMT 25 19 26 30 Difference 6 2 1 7
Figure 4.10: Perceived culture, management vs. non-management: preferred future situation
Table 4.7: Score for Figure 4.10
A: Clan
Culture
B: Adhocracy
Culture
C: Market Culture
D: Hierarchy Culture
FUTURE: MGMT 29 24 26 21
FUTURE: NON-
MGMT 32 21 22 25 Difference 3 3 4 4

75
4.4.2 Organisational culture: time with organisation
Figure 4.11: Less than four years with the organisation: now vs. future
Table 4.8: Scores for Figure 4.11
A: Clan
Culture
B: Adhocracy
Culture
C: Market Culture
D: Hierarchy Culture
NOW 31 21 25 23 FUTURE 33 23 22 22
Difference +2 +2 -3 -1
Figure 4.12: More than four years with the organisation: now vs. future
Table 4.9: Scores for Figure 4.12
A: Clan
Culture
B: Adhocracy
Culture
C: Market Culture
D: Hierarchy Culture
NOW 26 19 26 29 FUTURE 30 21 24 24
Difference +4 +2 -2 -5

76
Figure 4.13: Perceived culture, less than four years vs. more than four years with the organisation: current situation
Table 4.10: Scores for Figure 4.13
A: Clan
Culture
B: Adhocracy
Culture
C: Market Culture
D: Hierarchy Culture
NOW: > 4 YEARS 31 21 25 23
NOW: + 4 YEARS 26 19 26 29 Difference 5 2 1 6
Figure 4.14: Perceived culture, less than four years vs. more than four years with the organisation: preferred future situation
Table 4.11: Scores for Figure 4.14
A: Clan
Culture
B: Adhocracy
Culture
C: Market Culture
D: Hierarchy Culture
FUTURE: > 4 YEARS 33 23 22 22 FUTURE:
+ 4 YEARS 30 21 24 24 Difference 3 2 2 2

77
4.4.3 Organisational culture: entry through organisation A or organisation B
Figure 4.15: Entry through organisation A: now vs. future
Table 4.15: Scores for Figure 4.20
A: Clan
Culture
B: Adhocracy
Culture
C: Market Culture
D: Hierarchy Culture
NOW 26 20 26 28 FUTURE 28 22 30 21
Difference +2 +2 +4 -7
Figure 4.16: Entry through organisation B: now vs. future
Table 4.16: Scores for Figure 4.21
A: Clan
Culture
B: Adhocracy
Culture
C: Market Culture
D: Hierarchy Culture
NOW 29 19 25 27 FUTURE 33 22 20 25
Difference +4 +3 -5 -2

78
Figure 4.17: Perceived culture, entry through A vs. B: current situation
Table 4.14: Scores for Figure 4.17
A: Clan
Culture
B: Adhocracy
Culture
C: Market Culture
D: Hierarchy Culture
NOW: ENTRY A 26 20 26 28
NOW: ENTRY B 29 19 25 27
Difference 3 1 1 1
Figure 4.18: Perceived culture, entry through A vs. B: preferred situation
Table 4.18: Scores for Figure 4.23
A: Clan
Culture
B: Adhocracy
Culture
C: Market Culture
D: Hierarchy Culture
FUTURE: ENTRY A 28 22 30 21 FUTURE: ENTRY B 33 22 20 25
Difference 5 0 10 4

79
4.4.4 Organisational culture: departmental analysis Figure 4.19: Operational departments: now vs. future
Table 4.16: Scores for Figure 4.19
A: Clan
Culture
B: Adhocracy
Culture
C: Market Culture
D: Hierarchy Culture
NOW 23 16 30 31 FUTURE 30 18 24 28
Difference +7 +2 -6 -3
Figure 4.20: Management: now vs. future
Table 4.17: Scores for Figure 4.20
A: Clan
Culture
B: Adhocracy
Culture
C: Market Culture
D: Hierarchy Culture
NOW 25 22 31 22 FUTURE 26 26 29 19
Difference +1 +4 -2 -3

80
Figure 4.21: Functional/administrative departments: now vs. future
Table 4.18: Scores for Figure 4.21
A: Clan
Culture
B: Adhocracy
Culture
C: Market Culture
D: Hierarchy Culture
NOW 30 21 24 25 FUTURE 32 24 24 20
Difference +2 +3 0 -5
Figure 4.22: Other departments: now vs. future
Table 4.19: Scores for Figure 4.22
A: Clan
Culture
B: Adhocracy
Culture
C: Market Culture
D: Hierarchy Culture
NOW 33 20 19 27 FUTURE 33 22 20 24
Difference 0 +2 +1 -3

81
Figure 4.23: Perceived culture, operations/management/functional/other: current situation
Table 4.20: Scores for Figure 4.23
NOW A:
Clan Culture
B: Adhocracy
Culture
C: Market Culture
D: Hierarchy Culture
OPERATIONS 23 16 30 31
MANAGEMENT 25 22 31 22 FUNCTIONAL 30 21 24 25
OTHER 33 20 19 27
Figure 4.24: Perceived culture, operations/management/functional/other: preferred future culture
Table 4.21: Scores for Figure 4.24
FUTURE A:
Clan Culture
B: Adhocracy
Culture
C: Market Culture
D: Hierarchy Culture
OPERATIONS 30 18 24 28
MANAGEMENT 26 26 29 19 FUNCTIONAL 32 24 24 20
OTHER 33 22 20 24

82
4.5 Research question #1: “How relevant is the organisational culture concept to this firm?”
All respondents without exception considered organisational culture to be an important
element in the airline industry, with terms such as “very relevant”, “vital”, “absolutely
crucial”, and “pretty important” being used to describe its importance. Moreover, being
“young”, “energetic”, “enthusiastic”, and “fun” was seen as desired characteristics for the
industry in the future.
The understanding of the concept of organisational culture appeared to be problematic to
some respondents, although not all, with one giving an account of how organisational culture
is “the constellation of all the things, that of artefacts and habits and beliefs of an
organisation” – not unlike several definitions of culture presented by scholars (e.g. Ouchi,
1981; Schein, 1992; Stonehouse & Pemberton, 1999).
Because of the degree of customer interface, participants believed that organisational culture
is the one way you can really differentiate yourself from the opposition, as what is actually
offered by airlines is a rather standardised product. What actually reflects how the customer is
going to perceive the organisation as a whole, was viewed to be the organisation’s culture,
through his or her interactions with the company. In the words of one respondent,
“organisational culture is probably the essence of competitive advantage for our industry” –
being an industry primarily focused on cost and efficiency means that the opportunity to offer
differentiation in the context of customer service is driven by the culture. The organisational
culture is ultimately seen as important to the type of airline the organisation wants to be.
There is a must for the industry to differentiate and add value through the personality of the
organisation’s staff. Having got customers “on board” in the sense of having created loyalty
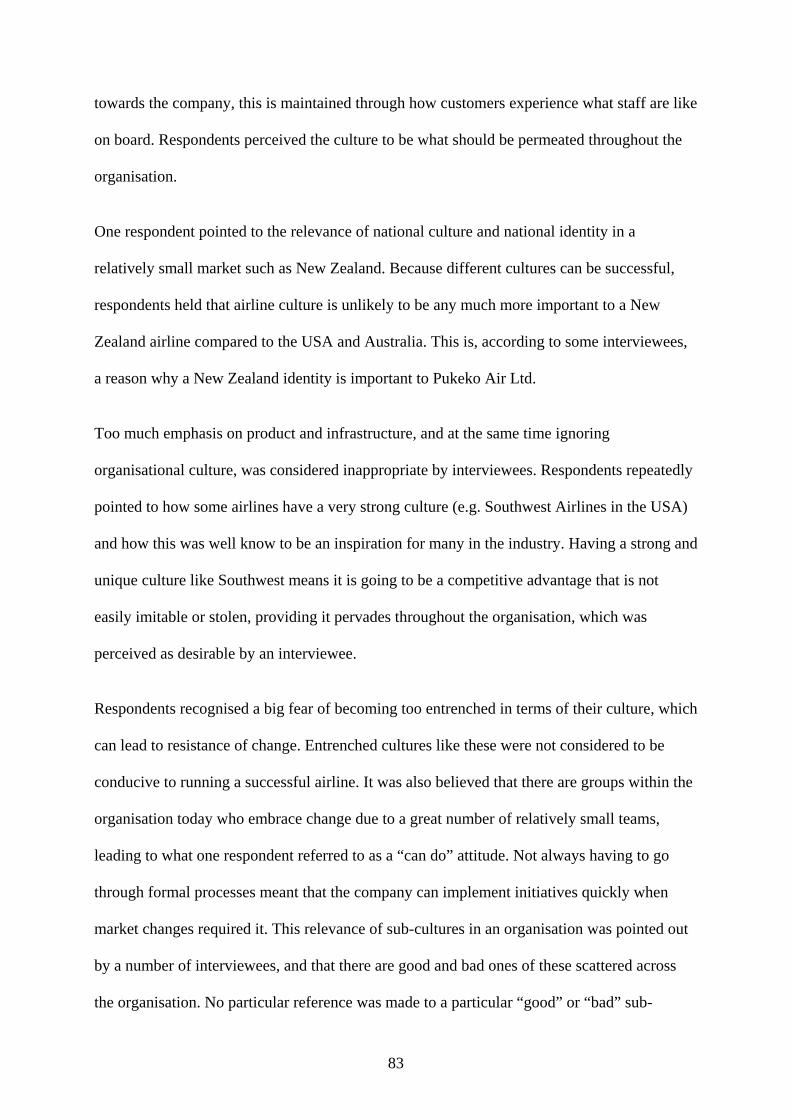
83
towards the company, this is maintained through how customers experience what staff are like
on board. Respondents perceived the culture to be what should be permeated throughout the
organisation.
One respondent pointed to the relevance of national culture and national identity in a
relatively small market such as New Zealand. Because different cultures can be successful,
respondents held that airline culture is unlikely to be any much more important to a New
Zealand airline compared to the USA and Australia. This is, according to some interviewees,
a reason why a New Zealand identity is important to Pukeko Air Ltd.
Too much emphasis on product and infrastructure, and at the same time ignoring
organisational culture, was considered inappropriate by interviewees. Respondents repeatedly
pointed to how some airlines have a very strong culture (e.g. Southwest Airlines in the USA)
and how this was well know to be an inspiration for many in the industry. Having a strong and
unique culture like Southwest means it is going to be a competitive advantage that is not
easily imitable or stolen, providing it pervades throughout the organisation, which was
perceived as desirable by an interviewee.
Respondents recognised a big fear of becoming too entrenched in terms of their culture, which
can lead to resistance of change. Entrenched cultures like these were not considered to be
conducive to running a successful airline. It was also believed that there are groups within the
organisation today who embrace change due to a great number of relatively small teams,
leading to what one respondent referred to as a “can do” attitude. Not always having to go
through formal processes meant that the company can implement initiatives quickly when
market changes required it. This relevance of sub-cultures in an organisation was pointed out
by a number of interviewees, and that there are good and bad ones of these scattered across
the organisation. No particular reference was made to a particular “good” or “bad” sub-

84
culture, although it could be inferred from the conversations that the management team was
considered to be a well-working sub-culture. One respondent wanted to see the good sub-
cultures “bottled and spread around the organisation”.
It was emphasised that there is a cultural divide within the organisation today, with staff
coming from different backgrounds and therefore having different mindsets. The target,
however, is to give staff the right environment in which to deliver good service. The
organisation intends to take the good elements from each unit and wrap them into one great
culture.
Finally, it was noted by one respondent that culture is important but that it appears to be
driven by a few people at the top. These people push the organisation in the direction they
thought the company should be heading.
Overall, when senior management in this organisation reflected on the relevance of culture to
the industry they all agreed in principle that it is most definitely relevant, but it was pointed
out the organisation cannot be all about culture. It must, however, be emphasised and it must
be appropriate to matter. Interpretations of these discussions are presented in the next section.
4.5.1 Perceived importance of organisational culture to the company and industry: an interpretation by the researcher
From the opinions presented above, it is clear that the relevance and importance of
organisational culture to the airline industry was recognised by the organisation’s senior
management. In the airline industry respondents agreed unanimously that organisational
culture is a key point of differentiation in the industry. When all actors in the market reach the
limits of what degree of differentiation can be made on the basis of cost and efficiency,
organisational culture was perceived to be one of the areas where it is still possible to stand
out in the crowd. This differentiation is possible because of the degree of customer interface,

85
and the element of customer service which is allegedly driven by the organisation’s culture.
This is in agreement with the available but limited literature on the role of organisational
culture in the success of airlines. As highlighted by Quick (1992), culture is not the only
variable in an airline’s success. Rather, it should be perceived as a connective tissue helping
the organisation succeed in the competitive environment. Smith (2004) lists a number of other
elements that are important for Southwest Airlines, things that are not necessarily related to
the organisational culture. There is essentially more to an airline’s success than just the
culture, and a parallel can be drawn to the works of for example Smircich (1983) and
Cameron and Ettington (1988) where the debates concerns whether culture is something an
organisation is or something it has – is it the organisation itself which is the culture,
regardless of its people, or does it have a certain culture namely because of its people and
everyone involved. Because the culture at Southwest Airlines is most likely impossible to
copy, and because this culture has resulted in other areas of business unique to this airline, the
organisation can be said to have a well functioning culture at the same time as it is the culture.
Only having or only being a culture can potentially mean there is a weakness in place. The
organisation can loose all its employees and thereby losing the culture, while if the culture is
solely embedded in the organisation’s name, history, management and so on, it can be
difficult for employees to grasp the cultural elements. Together, however, having some and
being some can potentially compliment each other, and strengthen the cultural element –
possibly leading to higher performance.
Furthermore, some of the airline’s senior managers made comments that pointed in the
direction of an agreement that the organisational culture is a contributing factor in
determining what type of airline the company wants to be. This type of relationship has been
discussed by O’Reilly (1989), who claims the role of a strong culture is to reinforce the fit
between culture and strategy, as well as strengthening the commitment of employees to the

86
firm. Creating a unique organisational culture based on the company’s strategy certainly
helped Southwest Airlines, as pointed out by Flint (2005).
Another reason why Pukeko Air’s management consider organisational culture to play an
important role in the industry today is the role staff have in contributing towards creating
loyalty to the company. The case organisation’s culture has, according to one interviewee,
contributed in deciding what kind of people are hired for the job, and for this reason it appears
as though culture also plays a role in strategies of differentiation considered relevant in an
industry offering a rather standardised product.
The role of national culture was by the majority of interviewees perceived to be of importance
for the airline industry, particularly in a relatively small market like New Zealand. Airline
cultures were said to not be very different regardless of country of operation, which is why the
national identity plays a role as well. In the event where New Zealanders choose to fly “home
grown” airlines rather than foreign airlines, this was by management believed to have
implications for any foreign entrant. It was believed that the operational cultures of different
countries would seemingly be the same across the industry, and being a local company may
for this reason affect business in a positive manner. It is important to note that the researcher
has found no evidence in the literature to support this, however, this was an experience made
by the organisation.
The findings identify another important issue in the role of organisational culture in airlines. It
was agreed upon by the managers interviewed that placing less importance on the culture and
too much focus on product and infrastructure can be counter productive. Unlike product
offerings and material elements of the companies, a strong culture becomes a competitive
advantage that cannot be easily stolen or imitated, as long as it is strong enough to permeate

87
the organisation (cf. Barney, 1986). This also fits with Cameron and Ettington’s (1988) work
on the role of cultural strength, saying that there must be a strong culture in place for an
organisation to be effective. This notion has of course been contested, and arguments claimed
that such relationships are more complex (e.g. Schein, 1984).
At the same time, there was a fear expressed by interviewees of becoming too entrenched in
the current culture and therefore resistant to change, ultimately an undesirable situation not
considered conducive to successful airlines. In this context, sub-cultures within the company
were highlighted as some groups within the organisation are always more open to change than
others. The groups who are considered more willing to change were said to have the kind of
culture that is desired throughout the organisation. Emergence of sub-cultures with different
assumptions and beliefs are common according to Cooke and Rousseau (1988), as what is
perceived as reality tends to be differentiated by level and function. For this reason, different
cultures emerge throughout an organisation. In the case organisation there appeared to be
some awareness of which sub-cultures have the right mentality, and this is the mindset that
the organisation should copy and try to introduce into other areas of the business.
From the discussion above it can be concluded that organisational culture is considered an
important element in the success of the airline industry in general, and the case organisation in
particular. The relevance of organisational culture to the industry is a relationship which is
difficult to establish, however, based on comments made by the airline’s management it is
recognised as being both relevant and believed to be able to make a difference.

88
4.6 Research question # 2: “What is the perceived current and preferred culture of the organisation?”
The current and preferred cultures for Pukeko Air are shown in Fig 4.2 and 4.3 on pages 64
and 65. Sections 4.6.1 to 4.6.4 represent the views of the six interviewees. The respondents
were asked to present their understanding of the OCAI diagram, and give an account of their
thoughts regarding the current (Fig. 4.2 page 64) and future situation (Fig. 4.3 page 65), with
emphasis on the changes between “now” and “preferred future” situation (Fig. 4.4 page 66).
Each interviewee was provided with a short description of the four cultures, in order to
highlight their differences. They then attempted to interpret the cultural shift, through
discussing the present versus the future situation. Most respondents treated each quadrant
separately, other referred back and forth between the four.
4.6.1 The Hierarchy Culture
Table 4.22: The Hierarchy Culture (n = 30 Current, n=28 Future)
Culture Type Current % Future % Difference Current Rank Future Rank
Hierarchy Culture
27 % 24 % 3 %
reduction 2nd 2nd
The Hierarchy culture is one of the quadrants which is attributed less relative importance for
the preferred future situation. All interviewees acknowledged the importance of the Hierarchy
culture in the airline industry, which is why it is currently the second most dominant culture in
the organisation. It was recognised that an element of hierarchy is an absolute necessity for
any airline having to adhere to rules, regulations and policies. According to the management
staff’s interpretation of this shift, employees want to be innovative and dynamic, which is
seen as important capabilities for an industry in almost constant change. On the other hand,
the reason why hierarchy culture is, and will remain in the future, the second strongest culture

89
is the absolute need for rules, regulations, and policies in an airline. Clear rules and standard
procedures are needed to operate according to safety regulations of aviation authorities.
Respondents noted how an airline cannot have staff innovating while flying an aircraft or
performing engineering tasks on aircrafts. Some elements of the business needs clear rules
and standard procedures to be followed. However, as one interviewee commented:
“Hierarchical tends to mean that decisions aren’t made where the knowledge is greatest”, such
as decisions that must be made while in the air, and the main office cannot be contacted
easily. This can somewhat explain the reduced importance of this culture. Conversely, it was
perceived that one reason why the Hierarchy culture loses a few points is because the industry
is so dynamic and constantly changing that innovation is absolutely necessary to keep up with
the competition. On the other hand, an element of stability and control was perceived as
crucial.
Furthermore, it was recognised by respondents that moving slightly away from hierarchy
culture deals with an innate preference New Zealanders will have towards this type of
organisation. Hierarchy is, according to several of the interviewees, not considered to be a
highly ranked element in the New Zealand national identity. Another reason relates back to
how the industry has some degree of military heritage, and how engineers and the Air Force
always have worked under a logical, structured environment. Finally, it was believed that
distancing oneself from the hierarchy was simply human nature, as staff want to have more
control themselves, rather than control being imposed on them. The interpretations of the
hierarchy culture fits nicely with the culture profile as presented by Cameron and Quinn
(1999) in table 4.27.

90
4.6.2 The Market Culture
Table 4.23: The Market Culture (n = 30 Current, n=28 Future)
Culture Type Current % Future % Difference Current Rank Future Rank
Market Culture
26 % 23 % 3 %
reduction 3rd Joint 3rd
The culture in this quadrant was considered to represent the competitive industry the airlines
are in and that the company needs a big element of the Market culture, both today and for the
future. Respondents also interpreted the fact that Market culture did not change much means it
is commonly accepted across the organisation that the organisation needs an element of that to
be competitive. “You have to have an element of that, I don’t think you’ll find that any
reducing” was a comment by an interviewee. Continuing to uphold the Market culture and
being market driven was perceived to contribute in making sure the company stays
competitive. Operating in such a highly competitive market, which shows no sign of
becoming less competitive, will make sure the company keeps driving hard to maintain the
competitiveness. Finally, the market element was considered “inevitable but not always
palatable”. Continuing to be market driven was perceived to be a reason why people will
come back to the company. Cameron and Quinn’s (1999) Market culture profile can be
clearly recognised in these perceptions, as the company perceives itself to be competitive, and
with an emphasis on beating the competitors.
4.6.3 The Adhocracy Culture Table 4.24: The Adhocracy Culture (n = 30 Current, n=28 Future)
Culture Type Current % Future % Difference Current Rank Future Rank
Adhocracy Culture
19 % 23 % 4 %
increase 4th Joint 3rd

91
Reasons for increase in the Adhocracy culture were perceived to be a desire for more
innovation and growth. There was an agreement towards the importance of innovation and
growth being important elements in succeeding in the highly competitive airline industry.
Respondents were of the opinion that the present leader of the company is an Adhocracy type
of person, which is one reason a key value in the organisation now, and even more so in the
future, is innovation. The organisation allows its employees to be innovative and to contribute
with ideas. This is in line with the desired reduction in emphasis on hierarchy culture. Still,
the Adhocracy culture has least dominance in the organisation today, in spite of interviewees
claiming the current leader in an “adhocracy type of person”, and one commenting that
“[adhocracy] is looking at what we are trying to go for, which is more innovation and
visionary, rather than the traditional, what we’ve done in the past”.
In an airline there are groups of employees who are by nature not innovative, and who prefer
to follow a hierarchy and procedures. Furthermore, another reason why the future situation
has a greater emphasis on the Adhocracy culture was believed to be that the words
“innovator”, “entrepreneur”, and “visionary” are seen as attractive characteristics to the New
Zealand culture. Conversely, at the opposite end words such as “co-ordinator”, “monitor”,
“organiser”, “hard driven” and “competitor” are considered less attractive from a New
Zealand point of view. Another reason was considered to be the need for increased decision
speed in the future in order to keep up with competitors and the increased flexibility and
individuality of the Adhocracy culture allows for this to be facilitated. Finally, it was noted
that in addition to being innovative there is also the need to retain key people, which was seen
as one reason why the four cultures are rather balanced at this organisation.

92
4.6.4 The Clan Culture
Table 4.25: The Clan Culture (n = 30 Current, n=28 Future)
Culture Type Current % Future % Difference Current Rank Future Rank
Clan Culture
28 % 30 % 2 %
increase 1st 1st
Upon hearing the Clan culture mentioned, all respondents immediately used analogies in the
line of the company being “one big happy family”. This was seen as important in order to get
people to work together, and making sure everyone is pulling in the same direction. The
strengthening of Clan culture in the future can be seen as a result of recent changes in the
organisation, and a fear that these are elements of a culture that may or may not be as much
emphasised in the future.
Teamwork was considered to be a building block for delivering consistent customer service
and, in doing this it was noted by one respondent that you must get the leadership right to get
the teamwork right. The respondent also pointed out that teamwork is considered by the
employees to be an important element in success, which can be an explanation for the desired
increase in the Clan culture quadrant. The teamwork used today as a tool for achieving
success can also explain the dominance of Clan culture, together with a Clan culture being
conducive for confident decision making and risk taking; all which is in line with the culture
profile defined by Cameron and Quinn (1999).
The notion that Clan culture is a building block for delivering consistent customer service can
be a reflection of how Market culture remains strong but almost unchanged. It was reiterated
that superior customer service can be a competitive advantage and an important element in the
competitive industry. A Clan culture was considered more united, and for this reason

93
employees are more likely to be innovative and confident in their decision making, as well as
prepared to take risks. Furthermore, respondents repeatedly referred to Clan culture as
something that is easier to have in smaller groups but acknowledged that with the right
leadership this can be done across organisations of most sizes. A challenge for the leadership
is to stay close to the workforce and be there as a coach and mentor, which is not always easy
in the industry with people on the ground and in the air. Being flexible and working as a team
is seen as important, but it was pointed out that being sensitive to the customer will still be of
the utmost importance.

94
4.6.5 Perceived cultural situation in the case organisation: Researcher’s interpretation
The organisational culture as perceived today shows no clear dominating culture, based on the
results from the survey questionnaire distributed in the company. However, three of the four
cultures are more pronounced than the last one, with Clan culture (28), Hierarchy culture
(27) and Market culture (26), ranking ahead of the Adhocracy culture (19). This means the
relative importance of each culture today can be ranked as follows:
I. Clan Culture II. Hierarchy Culture III. Market Culture IV. Adhocracy Culture
When looking at the future preferred organisational culture we see a slight shift in the
direction of the upper two cultures. Clan Culture (30) is preferred as the most dominating
culture for the future, ahead of Hierarchy culture (24), followed closely by Adhocracy
culture (23) and Market culture (23) given equal importance. The new rank, therefore, is as
follows:
I. Clan Culture II. Hierarchy Culture III= Adhocracy Culture III= Market Culture
This suggests that the cultural preferences for the future have not changed in terms of relative
importance, however, their strengths have changed somewhat. The Clan culture is the most
desired culture for the future, scoring higher than the three other cultures that are given almost
equal importance.
Table 4.26: Differences between culture strength, now and future
A: Clan Culture B: Adhocracy Culture
C: Market Culture
D: Hierarchy Culture
NOW 28 19 26 27
FUTURE 30 23 23 24
Difference + 2 + 4 - 3 - 3

95
In order to interpret the culture profiles drawn up based on the respondents feedback,
Cameron and Quinn (1999) propose that the profiles can be interpreted from the standpoints
of differing perspectives. They refer to six different comparison standards: type of culture;
discrepancies between current and preferred future culture; strength of the dominating culture;
congruence of the profiles based on different attributes and demographic groups; comparison
with the average culture profile of almost one thousand organisations; and comparability with
some general trends over more than ten years’ work with the instrument.
Table 4.27: The organisational culture profile
The Clan Culture A very friendly place to work where people share a lot of themselves. It is like an extended family. The leaders, or the heads or the organisation, are considered to be mentors and perhaps even parent figures. The organisation is held together by loyalty and tradition. Commitment is high. The organisation emphasises the long-term benefit of human resources development and attaches great importance to cohesion and morale. Success is defined in terms of sensitivity to customers and concern for people. The organisation places a premium on teamwork, participation, and consensus.
The Adhocracy Culture A dynamic, entrepreneurial, and creative place to work. People stick their necks out and take risks. The leaders are considered innovators and risk takers. The glue that holds the organisation together is commitment to experimentation and innovation. The emphasis is on being on the leading edge. The organisation’s long-term emphasis is on growth and acquiring new resources. Success means gaining unique and new products or services. Being a product or service leader is important. The organisation encourages individual initiative and freedom.
The Hierarchy Culture A very formalised and structured place to work. Procedures govern what people do. The leaders pride themselves on being good coordinators and organisers who are efficiency-minded. Maintaining a smooth-running organisation is most critical. Formal rules and policies hold the organisation together. The long-term concern is on stability and performance with efficient, smooth operations. Success is defined in terms of dependable delivery, smooth scheduling, and low cost. The management of employees is concerned with secure employment and predictability.
The Market Culture A results-oriented organisation whose major concerns is with getting the job done. People are competitive and goal-oriented. The leaders are hard drivers, producers, and competitors. They are tough and demanding. The glue that holds the organisation together is an emphasis on winning. Reputation and success are common concerns. The long-term focus is on competitive actions and achievement of measurable goals and targets. Success is defined in terms of market share and penetration. Competitive pricing and market leadership are important. The organisational style is hard-driving competitiveness.
Source: Cameron and Quinn (1999, p. 59)

96
Type: The role as most pronounced in the organisation is not only held by one culture, but
shared by three culture of almost identical perceived importance. Cameron and Quinn (1999)
hold that the culture with the highest scores are the cultures that tend to be mostly emphasised
in the organisation, as the culture types are said to identify the basic assumptions, styles and
values that predominate. Based on the scores, the Clan culture is the culture that is most
emphasised in this organisation, and therefore ultimately the dominant culture, with
Hierarchy and Market culture following very closely. According to the authors this is
important to know in order to determine whether the organisational culture matches the
demands of the competitive environment, as this compatibility must meet the demands of the
operational environment. What characterises a Clan culture has been explained in a few
sentences in Fig. 4.27.
Discrepancies: It is of importance to identify the discrepancies between the current and
preferred culture. This must be done in order to design a map for any potential change.
Cameron and Quinn (1999) emphasise that one should pay particular attention to
discrepancies of 10 percentage points and more. The organisation in question can be said to
be in a rather good position in this sense, as the greatest discrepancy between current and
preferred culture can be seen in the Adhocracy culture, showing a difference of only four
points. The dominating culture(s) are not making any radical shifts. Rather, the already
dominating Clan culture is reinforced while the other dominating Hierarchy culture
remains number two, in spite of being allocated less strength for the future. Market culture,
currently regarded as number three, falls back slightly and shares the role as the least
emphasised culture for the future, along with the Adhocracy culture. Still, it is important to
acknowledge how Adhocracy culture takes a great stride forward in relative importance in the
future. Again, what these culture types entail can be seen in Fig. 4.27.

97
Strength: Cultural strength relates to the actual score allocated to each culture type. Higher
score equals a stronger, more dominant culture. As highlighted by Cameron and Quinn
(1999), research has revealed that strong cultures “are associated with homogeneity of effort,
clear focus, and higher performance in environments where unity and common vision are
required” (p. 63). Cultural strength and its importance for organisations to be effective is
commonly accepted in the cultural literature (e.g. Cameron & Ettington, 1988; Deal &
Kennedy, 1982; O'Reilly, 1989; Peters & Waterman, 1982).
In spite of the relatively small difference between the three cultures with highest score
achieved, based purely on the scores, Clan culture is the strongest in the organisation today.
However, even though the organisation cannot be said to have any one dominant culture
today, at the opposite end the Adhocracy culture must be said to be the weakest culture,
trailing the highest scoring culture by nine points.
When looking at the preferred future culture, culture strength becomes slightly more evident.
The Clan culture will be six points ahead of number two, hierarchy culture, which in return
is only going to be one point ahead of the other two culture types. Overall, considering the
gaps will never reach ten points in any direction, it appears as the organisation is not going to
be largely dominated by any one culture in the future either.
Congruence: In a congruent culture, strategy, leadership style, reward system, management
of employees, and dominant characteristics have a tendency to emphasise the same set of
cultural values (Cameron & Quinn, 1999). According to the authors, the individual plots look
similar in congruent cultures, while the shapes in incongruent culture will have different
shapes. They also relate this congruence to performance, saying how “although not a
prerequisite for success, [congruent cultures] are more typical of high performing
organisations than incongruent cultures. This view is also shared with other scholars on the

98
field, with for example Peters and Waterman (1982) who say that “the dominance and
coherence of a culture proved to be an essential quality of the excellent companies” (p. 76).
Looking at Figure 4.5 and 4.6 on pages 69 and 70, it is possible to get an idea of the situation
at the case organisation. Overall there is not too much difference between the six items.
Organisational characteristics (Q #1), Organisational Leadership (Q #2), Strategic Emphasis
(Q #5), and Criteria of Success (Q #6) look similar, while Management of Employees (Q #3)
and Organisational Glue (Q #4) are similar, although slightly different from the rest. Clan
culture does show a difference between highest and smallest score of 11 points, Adhocracy
culture has a difference of eight points, Market culture displays a difference of eight points,
and Hierarchy culture displays a difference of only six points at most. According to
Cameron and Quinn’s (1999) advice on looking for discrepancies of more than ten point, only
Clan culture displays a tendency to stand out, primarily because of its relatively high
maximum score of 34 points (see table 4.28).
Table 4.28: Scores for individual items on the OCAI – Now
A B C D Q #1 31 20 22 28 Q #2 25 23 25 27 Q #3 29 20 30 31 Q #4 34 19 23 25 Q #5 24 21 25 29 Q #6 23 15 29 31
Similarly, in terms of the preferred future situation there is a difference of five points in Clan
culture, ten points in Adhocracy culture, five points in Market culture and ten points in
Hierarchy culture (see table 4.29).

99
Table 4.29: Scores for individual items on the OCAI - Future
A B C D Q #1 30 27 23 17 Q #2 29 24 19 26 Q #3 33 22 21 23 Q #4 34 21 21 21 Q #5 29 23 21 24 Q #6 31 17 24 27
Overall, Organisational characteristics (Q #1) is the attribute which shows the most clear
discrepancy, as illustrated in Figure 4.25. The other five organisational attributes display very
little movement when the present and the future are compared.
Figure 4.25: Difference between current and future perceptions of "Organisational characteristics"
Norm comparisons: The final perspective for interpretation highlighted by Cameron and
Quinn (1999) is to compare the organisation against an “average organisation”. The average
culture plot from when the authors published their book can be seen in figure 4.26. When this
is compared with the case organisation we can see there is a difference between the average
culture and that of the case organisation (Fig. 4.27). Obviously, this average does not reflect
any “ideal” culture, as both high performers and those who are not doing so well are
represented in this average. We do see, however, a greater emphasis on the Clan culture and

100
Adhocracy culture than in the average organisation, and a lower emphasis on the Market
culture than in the average organisation.
Figure 4.26: An average culture plot for more than 1000 organisations
Source: Cameron and Quinn (1999, p. 66)
Figure 4.27: Current organisational culture vs. average plot for more than 1000 organisations (case
organisation in bold)

101
4.6.6 Trends in organisational culture
In Cameron and Quinn’s (1999) work on with the Organisational Culture Assessment
Instrument (OCAI), they have put together their observations of more than a thousand
organisations and see how some trends have emerged. First, the authors say, top managers
tend to rate clan scores higher than would fellow managers in lower levels of the organisation.
Second, trends show that adhocracy scores are generally rated lowest in the average
organisation. Typically, the authors hold, fewer firms are dominated by the Adhocracy culture
as opposed to domination by any of the three other cultures. This corresponds well with the
case organisation as Adhocracy culture is the culture which appeared to have least presence of
the four cultures, scoring significantly lower than the rest (see, for example, fig. 4.27 in the
previous section).
A third trend shows that companies have a tendency to gravitate toward an emphasis on
Hierarchy culture and Market culture. It is pointed out that once the organisation is dominated
by the lower two quadrants, it is difficult to direct the company towards the top two. Also, the
lower two tend to be dominating the longest. This is currently not the case for this
organisation, as Clan culture dominates today and is perceived to be strongest in the future as
well. However, due to the relatively small difference between three of the culture types, and
the low score of Adhocracy culture, the culture plot looks like it is gravitating towards the
bottom half, just like the trend predicts.
Furthermore, management consultants have recently equated the upper quadrants with
“leadership” and the lower two quadrants with “management” (Cameron & Quinn, 1999).
Cameron and Quinn (1999) discuss how it is a common belief that “leadership” emphasises
teamwork, innovation, and change (as found in Clan culture and Adhocracy culture), while

102
“management” favours the stability and productivity (as found in the hierarchy culture and
Market culture). However, the authors say they do not agree with this distinction between
leadership and management, arguing their point that leadership and management is needed in
order to strengthen, maintain, change, or create any of the four cultures. In the case
organisation, it is fair to believe there must be elements of both leadership and management in
place, considering the relative equal dispersion across all four cultures. Essentially, the
authors argue, “both leadership and management are needed for organizational effectiveness
[…] all four culture types (and the management competencies that accompany them) are
valuable and necessary” (Cameron & Quinn, 1999, p. 71).
Finally, the last trend discussed by the authors is that there are paradoxes in cultural profiles,
and that an organisation need not be dominated by any one side of the quadrant, or only the
top or the bottom. High performing organisations can simultaneously emphasise Clan culture
and Market culture, or Hierarchy and Adhocracy culture. In the case of the research
organisation, the left side of the quadrant is dominating. In Cameron’s (1986) research on
organisational effectiveness it was pointed out that organisations who are effective can behave
in contradictory and an flexible ways. Stability and control resulting from the Hierarchy
culture, and support for and development of employees in the Clan culture can very well
result in high organisational effectiveness. This is not unlike for example Peters and
Waterman’s (1982) ideas.

103
4.7 Survey results part 3: Organisational values In addition to assessing their own organisational culture with regards to the present and future
situation, in the third part of the survey respondents also examined the current and preferred
future organisational values. Based on McDonald and Gandz’ (1992) shared values for the
modern business corporation the 24 values presented in that study has been used for this third
part.
Respondents had to choose a set of values corresponding to what they perceive is currently
present in the organisation as well as what values they would most prefer to be emphasised
for the future, in order to be successful and high-performing. The researcher decided that
respondents were to choose eight of the 24 values, representing 1/3 or the total, rather than
simply ranking or rating each value on a Likert type scale for all 24 by importance (Table
4.30). Instructing the respondents to select a set of values based on whether these are
considered to be important or not, allows each respondent to leave out the values considered
to be of less importance for the organisation. On the other hand there is a risk of social bias:
the respondent will select a set of values which sounds good to have in an organisation, rather
than having to rank each of the 24 values by importance. Furthermore, it was perceived to be
less time consuming for respondents to choose eight values. Following this the values could
be shown in rank order of importance as seen from a present point of view as well as a future
preferred point of view.

104
Table 4.30: Results of values as chosen by survey respondents (n=28)
VALUE FUTURE NOW ADAPTABILITY 17 17 COOPERATION 16 18 HUMOUR 15 16 CREATIVITY 14 13 BROAD-MINDEDNESS 13 7 DEVELOPMENT 13 7 ASSERTIVENESS 12 11 FAIRNESS 12 7 OPENNESS 11 9 INITIATIVE 10 8 ECONOMY 9 13 AUTONOMY 9 7 SOCIAL EQUALITY 7 10 COURTESY 7 8 CAUTIOUSNESS 7 7 MORAL INTEGRITY 7 4 LOGIC 5 10 EXPERIMENTATION 4 9 FORGIVENESS 4 5 OBEDIENCE 3 9 CONSIDERATION 3 8 FORMALITY 3 5 DILIGENCE 2 12 ORDERLINESS 2 3
In Figure 4.28 the organisational values for the current and future situation are listed together,
ranked by preferred future situation. Moreover, for an overview of the current and preferred
future values only, these are listed separately in Figures 4.29 and 4.30. In Figures 4.31 and
4.32, the values have been split into the top and bottom half for greater clarity, still ranked by
the preferred future situation. These were also the graphs presented to the interviewees for
interpretation when they were asked to give their perceptions of why certain values gained
support while others lost support.
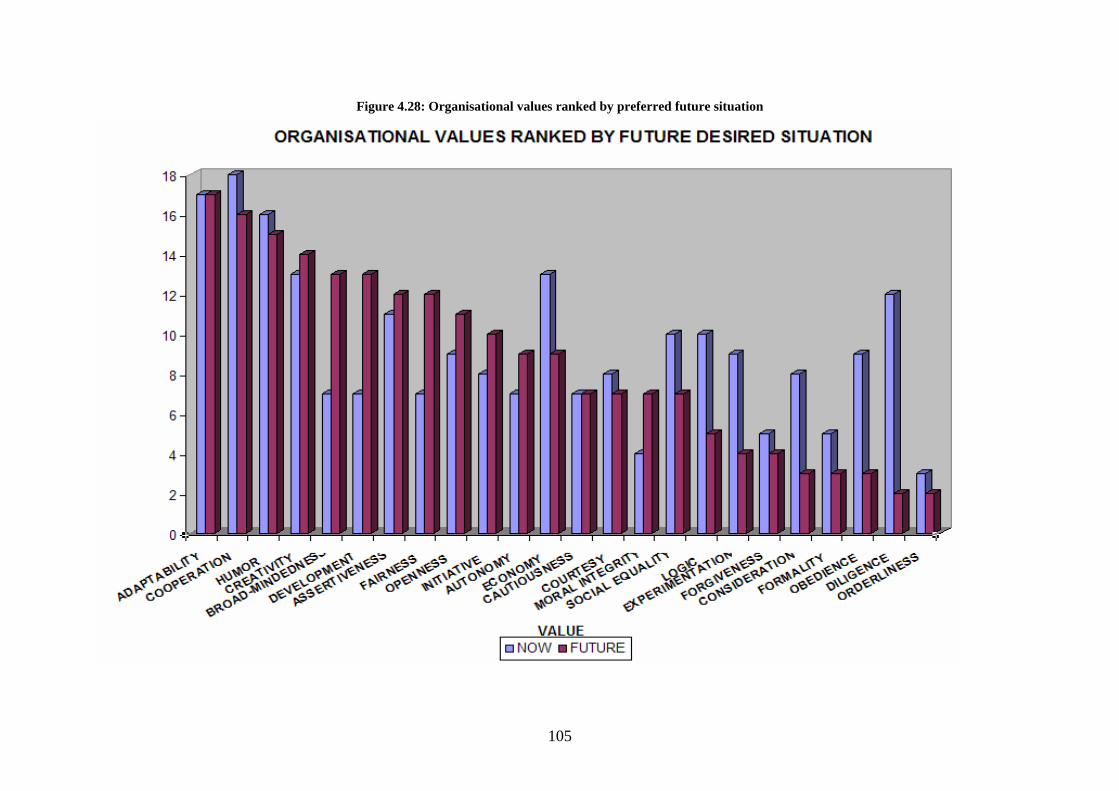
105
Figure 4.28: Organisational values ranked by preferred future situation

106
Figure 4.29: Organisational values ranked by current situation
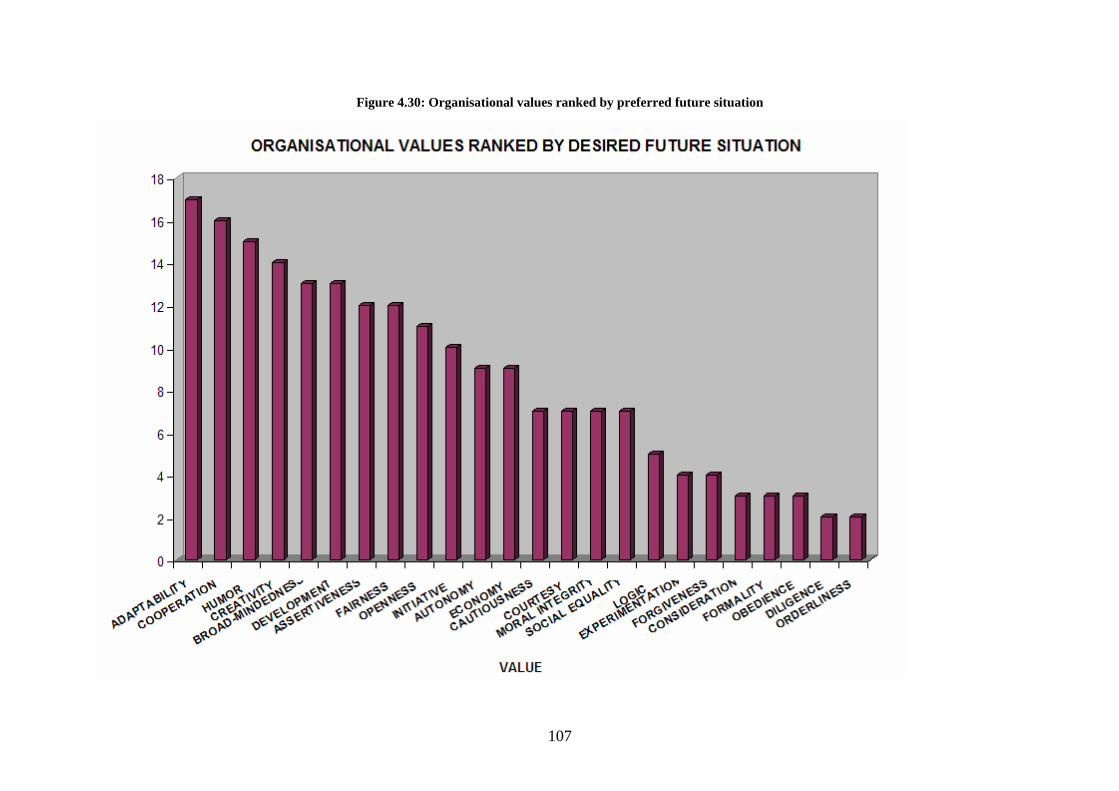
107
Figure 4.30: Organisational values ranked by preferred future situation

108
4.7.1 Top and bottom of the ranked values Figure 4.31: Top 12 values ranked by preferred future situation

109
Figure 4.32: Bottom 12 values ranked by preferred future situation

110
Table 4.31: Shared value concepts embedded in Quinn and McGrath's model of organisations (values identified in Pukeko Air Ltd. ranked by relative importance)
The Clan NOW FUTURE The Adhocracy NOW FUTURE
Quadrant 1: The Consensual Culture Purpose: Group Cohesion
Quadrant 2: The Developmental Culture Purpose: Broad Purposes
Salient values: Salient Values: Broad-mindedness 16th 5th Adaptability 2nd 1st Consideration 13th 20th Autonomy 16th 11th Cooperation 1st 2nd Creativity 4th = 4th Courtesy 13th 13th Development 16th 5th Fairness 16th 7th Experimentation 10th 18th Forgiveness 21st 18th Humour 3rd = 3rd Moral Integrity 23rd 13th Openness 10th 9th Social Equality 8th 13th
Information Processing Styles: Information Processing Styles: Discussion Insight
Participation Invention Consensus Innovation
The Hierarchy NOW FUTURE The Market NOW FUTURE
Quadrant 3: The Hierarchical Culture Purpose: Execution of Regulations
Quadrant 4: The Rational Culture Purpose: Pursuit of Objectives
Salient values: Salient values: Cautiousness 16th 13th Assertiveness 7th = 7th Economy 4th 11th Diligence 6th 23rd Formality 21st 20th Initiative 13th 10th Logic 8th 17th Obedience 10th 20th Orderliness 24th 23rd
Information Processing Styles: Information Processing Styles: Measurement Goal Clarification
Documentation Individual Judgement Computation Decisiveness
Source: McDonald and Gandz (1992, p. 69)
Note: Differences of more than 10 places in ranking highlighted in bold. Ranking of values with = have remained unchanged.

111
Figure 4.33: Ranked values embedded in culture plot
Based on McDonald and Gandz’ (1992) shared value concepts embedded in Quinn and
McGrath’s model of organisations (table 4.31), the identified values from the case
organisation have been ranked by importance, based on the number of times each value has
been chosen. The value’s rank has been listed next to the value itself, and highlighted in bold
if there has been a shift of more than ten places between the current and preferred future
situation.
Diligence 6th, 23rd
Development 16th, 5th
Obedience 10th, 20th
Broad-mindedness
16th, 5th
Moral Integrity 23rd, 13th

112
Finally, the rankings from table 4.31 have been embedded in the culture plot in figure 4.33, to
illustrate reasons for the shift between “now” and “future” as seen in the OCAI. This graph is
produced for the purpose of displaying how the combination of Cameron and Quinn’s (1999)
and McDonald and Gandz’ (1992) tools for assessing organisational culture and
organisational values respectively, can be used for cross referencing. The shifts in each of the
four culture quadrants can this way be explained by the increased or reduced emphasis on the
values which fit in to their respective quadrants (cf. table 4.31). Increased importance of
broadmindedness and moral integrity contribute to strengthening of the Clan culture, and
increased importance of development contributes to the strengthening of the Adhocracy
culture. Similarly, less emphasis on values such as obedience and diligence are reasons for the
weakening of the Hierarchy and Market culture respectively.
A key point emerging from combining the results of the two survey instruments is in what
quadrant the majority of preferred values can be found. From the culture plot it is already
clear that the future dominating quadrant is Clan culture. Incidentally, in this quadrant we also
find five of the Top 10 values preferred for the future. Conversely, in the Hierarchy quadrant
we find five of the lowest ranked values, even though Hierarchy Culture is the second
strongest culture for the future. Moreover, the values which fit into the Hierarchy quadrant are
perceived to be “hard”, often undesirable values, while the values we find in the Clan
quadrant are perceived to be “soft” and presumably desirable values. At the case organisation,
it can be concluded that the “soft” values are presumably more desirable; however, the “hard”
values belonging in the Hierarchy quadrant are recognised as necessary due to the highly
regulated aviation industry.
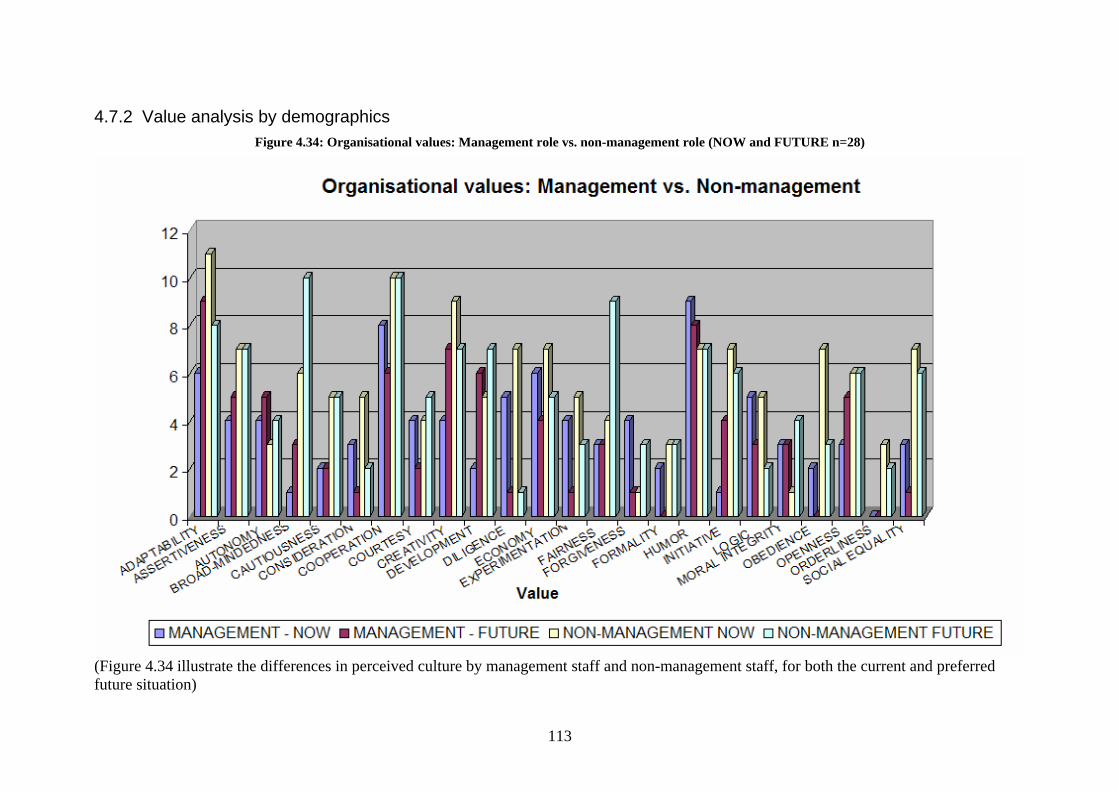
113
4.7.2 Value analysis by demographics Figure 4.34: Organisational values: Management role vs. non-management role (NOW and FUTURE n=28)
(Figure 4.34 illustrate the differences in perceived culture by management staff and non-management staff, for both the current and preferred future situation)

114
Figure 4.35: Organisational values: Less than 4 years with organisation vs. more than 4 years (NOW and FUTURE n=28)
(Figure 4.35 illustrate the perceived differences based on respondents’ time with the organisation, grouped by those who have been with the organisation for less than four years and those who have been there for more than four years)
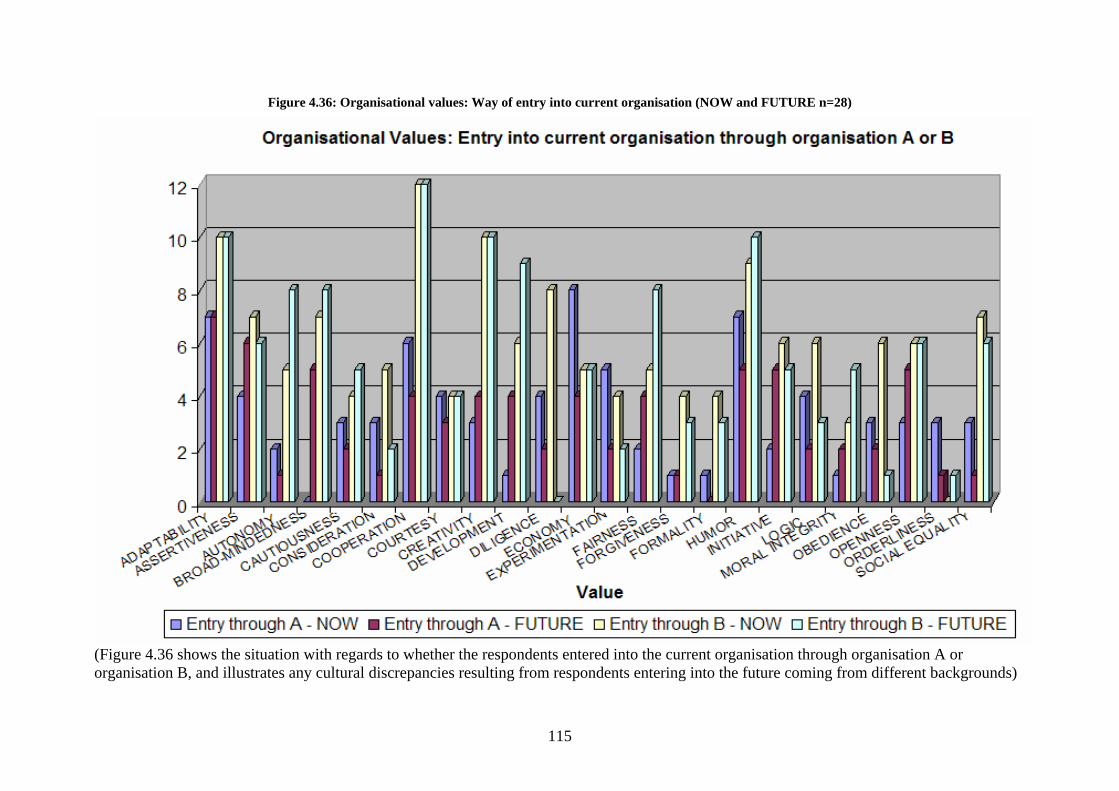
115
Figure 4.36: Organisational values: Way of entry into current organisation (NOW and FUTURE n=28)
(Figure 4.36 shows the situation with regards to whether the respondents entered into the current organisation through organisation A or organisation B, and illustrates any cultural discrepancies resulting from respondents entering into the future coming from different backgrounds)

116
Figure 4.34 should enable any major differences between the perceived values of management
and non-management staff to be highlighted. The columns that show clear differences
between management and non-management, or the current and future situation, are of
particular interest. Notable differences in the current culture can be seen in the following
values (number of times chosen by management, non-management respectively in brackets -
n=28): broad-mindedness (1,6), creativity (4,7), initiative (1,7), and obedience (2,7).
Differences in the preferred future culture can be seen in broad-mindedness (3,10), fairness
(3,9), and social equality (1,6). Although these groups are not directly comparable in their
present form, as the two groups management and non-management do not consist of the same
number of people, it can give an indication as to how desired each value is. It should be noted
that none of these differences are very dramatic, although it shows there are gaps, as well as
where the gaps are, between management and non-management respondents.
Whether respondents have spent more than or less than four years with either organisation
making up the current unit can make a difference as to their perceived values (Fig. 4.35).
Differences in the current values can be seen in the following values (number of times chosen
by “less than four years”, “more than four years” in brackets): cooperation (5,13), diligence
(4,8), economy (4,9), and obedience (2,7). The future values which stand out are: broad-
mindedness (4,9), cautiousness (1,6), cooperation (6,10), economy (2,7), fairness (3,9),
humour (10,5), and moral integrity (0,7). Interestingly, humour is the only value among both
the current and preferred future ones which is ranked higher by those having spent less than
four years with the organisation. A reason for this may be the fact that those having been with
the organisation less than four years have an idea of work being a lot of fun and humour.
These could also be staff members joining the organisation on entry level, and therefore they
have a different view on what work should be like.

117
The third demographic element concerns which organisation the respondents originally joined
from, prior to the current organisation being formed (Fig. 4.36). This is, not surprisingly,
where the greatest gaps can be seen. Differences in the current values can be seen in the
following values (number of times chosen by “organisation A”, “organisation B” in brackets):
broad-mindedness (0,7), cooperation (6,12), creativity (3,10), development (1,6), diligence
(4,8), initiative (2,6), and social equality (3,7). The future values which stand out are:
autonomy (1,8), cooperation (4,12), creativity (4,10), development (4,7), fairness (4,8),
humour (5,10), and social equality (1,6). With staff coming from different backgrounds there
is always a risk these will bring with the different values, which is clearly the case here.
Although there is agreement on the vast majority of values, there are a few key values that
need to be addressed.

118
Figure 4.37: Organisational values: Departmental values as currently perceived (n = 28)
(The organisation has been split into departments: operations, management, functional/administrative, and one group named “others”. Figure 4.37 places the four units against each other, presenting a picture of the differences between departments as perceived by respondents today)

119
Figure 4.38: Organisational values: Departmental values as preferred for the future (n = 28)
In the same manner as figure 4.37 above, figure 4.38 presents a picture of the preferred future organisational values.

120
While the analysis of Figures 4.34 to 4.38 concerning the demographics criteria above is
relevant, examining different departments in the organisation, and how well aligned may be
more relevant. It is no surprise that differences do exist within organisations just as much as
between them, as each department typically forms their own culture; and is part of a wider
work unit culture, or division culture (Sathe, 1983).
In the case organisation we find the greatest gaps in the following values, as perceived today
(highest, lowest in brackets): adaptability (2, 6), creativity (1, 5), humour (2, 8), initiative (0,
4), logic (0, 5), and social equality (1, 6). The greatest gaps in the preferred future values
turned out as follows: adaptability (3, 7), assertiveness (1, 6), courtesy (0, 4), creativity (1, 6),
humour (2, 7), initiative (1, 6), and openness (1, 5). What this shows is that when comparing
departments, major differences likely exist in the set of values perceived to be important. This
can be a concern for the organisation for several reasons. First, it can ultimately prevent the
development and emphasis of any one dominant culture throughout the organisation, should
this be desirable from the organisation’s point of view. Although we have seen from the
overall culture plot that there is little discrepancy between the current and preferred
organisational culture (fig. 4.4), these values are integral in shaping an organisation’s culture
as seen in Table 4.31. Second, values must be aligned across the organisation for all staff
members to pull in the same direction, something which according to figure 4.37 and 4.38 is
not the case today. Even though sub-cultures are normal in an organisation, some fundamental
values ought to be equally strong in all departments. Values shape culture, and in order to be
valuable culture should be strong according to O’Reilly (1989). He gives two reasons for this:
it can result in a fit between culture and strategy, as well as increased commitment from the
employees. For management at Pukeko Air to successfully keep up with industry changes
strategies must be in place to swiftly react to any changes in regulations, fuel prices, and
customer demands. This is where commitment might facilitate implementation of strategy.

121
4.8 Research question # 3: “What are the current and preferred future values for this organisation?”
4.8.1 Values perceived more important for the future This section presents comments from senior managers via the interviews concerning selected
values that were noteworthy in some way, and are based on the values listed in the survey
questionnaire. Figure 4.31 and 4.32 on page 108 and 109 were presented to the interview
subjects, and they were first asked to comment on the values that were considered to be more
important for the future, including those values with the greatest gap between the current and
preferred future situation (Fig. 4.28 page 105).
Table 4.32: Broadmindedness (n = 28)
Value Current Score Future Score Difference Current Rank Future Rank
Broad-mindedness
7 13 +6 16th 5th
Broad-mindedness: The interviewees agreed in general that broad-mindedness was a desired
value for the future because individual business units have tended to be somewhat “siloed” in
the past. People protected their work and made their own performance look good, rather than
cooperating. Another view that was shared by interviewees is that management has not been
seen as open enough for ideas, because recent changes to the organisation has affected the
time spent listening to people. This was seen as a concern to most respondents, particularly
because the change processes was not as democratic as they could have been. Finally, being
broadminded was considered important because it stimulates the innovation necessary to be
competitive.
Table 4.33: Development (n = 28)
Value Current Score Future Score Difference Current Rank Future Rank
Development 7 13 +6 16th 5th

122
Development: All respondents without exception acknowledged that there has not been as
much investment into staff development as should have been. An over emphasised focus on
organisational development means individual development has been neglected, and would be
the reason why development is a much desired value for the future. It was pointed out that
there is no point having lots of people if no investment is going to be made into them, and that
this can result in people moving elsewhere in order to feel valued.
Table 4.34: Fairness (n = 28)
Value Current Score Future Score Difference Current Rank Future Rank
Fairness 7 12 +5 16th 7th
Fairness: In the context of the airline, respondents perceived that overall it is not a very fair
environment they operate in. The airline industry being a highly unionised industry, fairness
will always be high on the agenda. Furthermore, some interviewees were aware of staff
having taken more responsibility during times of transition and change, and who have not
been rewarded or recognised for their services. Ultimately, interviewees noted, staff should be
rewarded for the job they do and not for their length of service.
Table 4.35: Moral Integrity (n = 28)
Value Current Score Future Score Difference Current Rank Future Rank
Moral Integrity
4 7 +3 23rd 13th
Moral Integrity: While some points did come up during the interviews, not all respondents
presented their views on moral integrity. One perception which was repeated was related to
how change initiatives can lead to someone losing their job, and whether this is always done
in the most ethical way.

123
4.8.2 Values perceived less important for the future Values that were considered less important for the future, primarily those values with the
biggest gap between the current and future preferred situation, were also presented to the
interviewees (Fig. 4.32 page 109).
Table 4.36: Consideration (n = 28)
Value Current Score Future Score Difference Current Rank
Future Rank
Consideration 8 3 -5 13th 20th
Consideration: Even though consideration appeared to be a desirable value in the
organisation, there was a consensus among respondents that the organisation can be too
considerate. Being too family oriented and caring could mean things happen that should not
happen, and that this degree of informality could mean too little focus on business issues and
too much focus on people issues. It was also noted that consideration relates to fairness, one
of the values survey respondents wanted more of in the future, meaning that the organisation
can be too considerate to the extent that fairness is affected. Another perception was that a
reduction in consideration relates to the desire for more structure. This could reduce job
security and help staff discover where they fit in.
Table 4.37: Diligence (n = 28)
Value Current Score Future Score Difference Current Rank Future Rank
Diligence 12 2 -10 6th 23rd
Diligence: All participants seemed to agree that diligence is an organisational value that does
not fit with what this organisation is all about. Having gone through a lot of change recently
people have been known to put in a significant amount of hours to get things moving along
the change process. It was perceived that work life and personal life have not been balanced
recently. People would like more stability from now on. The resistance to diligence was also

124
as attributed to human nature, because no one would want to work very hard over a significant
period of time. It was also recognised that this could even be dangerous, both to the company
and the individual.
Table 4.38: Experimentation (n = 28)
Value Current Score Future Score Difference Current Rank
Future Rank
Experimentation 9 4 -5 10th 18th
Experimentation: Another value considered less important for the future is experimentation.
Senior managers perceived it as an important organisational value, however, it was recognised
that the sheer amount of change in the organisation means lots of projects have been tried
internally. Too much testing of new things leads to “a little change fatigue element”, as
commented by an interviewee. In the competitive industry there is not much room for error,
and one should get things right the first time. Furthermore, it was noted that the organisation
wants broad-mindedness but not experimentation, which was by management perceived as
conflicting notions. Moreover, to achieve innovation as identified in the Adhocracy quadrant
(see figure 4.4) you also need to experiment, which was also believed to be conflicting.
Table 4.39: Obedience (n = 28)
Value Current Score Future Score Difference Current Rank Future Rank
Obedience 9 3 -6 10th 20th
Obedience: Not ranking obedience as an important value for the future was perceived by
interviewee subjects as being a product of human nature. Wanting more autonomy and
freedom is more common in today’s organisations. Respondents agree that employees would
want to take responsibility and accountability for their own actions, rather than orders being
pushed down from the top. Several respondents emphasised that certain groups within an
airline are obedient and rule bound by nature, and need to be this way as well due to the

125
regulatory nature of the industry. Obedience being ranked as relatively little desired ties well
with the results from broadmindedness, as identified by one respondent. Ultimately,
obedience can prevent innovation, which is a desired value.
Table 4.40: Economy (n = 28)
Value Current Score Future Score Difference Current Rank Future Rank
Economy 13 9 -4 4th 11th
Economy: The minor change to a value such as economy was attributed to how the small
margins in the industry force airline to cut costs everywhere to keep up with competition. This
was perceived as possibly being seen as a threat by employees, worried about their jobs.
Table 4.41: Logic (n = 28)
Value Current Score Future Score Difference Current Rank Future Rank
Logic 10 5 -5 8th 17th
Logic: In spite of having being one of the values changing the most with regards to the
preferred future situation, little explanation could be provided by the interviewees as to why
this particular one is looking at such a major shift. Some views were however offered, mostly
relating to how a desire for more innovation and creativity as previously identified does not
necessary involve any large degree of logic. Creative thinking is ultimately seen as a contrast
to rational thinking. If staff are supposed to come up with new ways of doing things it is
perceived “they have to be a little bit less logical sometimes”.

126
4.8.3 Perceived organisational values: an interpretation by the researcher The four organisational values most chosen by respondents for the current situation are
adaptability, cooperation, humour, and creativity. These values are according to
McDonald and Gandz (1992) defined as:
ADAPTABILITY: Being flexible and changing in response to new circumstances
COOPERATION: Being cooperative and working well with others
HUMOUR: Creating fun and being light-hearted
CREATIVITY: Developing new ideas and applying innovative approaches
Interestingly, these are also the four values most desired by the organisation’s employees for
the future. Between 50 % and 60 % of the 28 respondents had chosen these values as one of
their future preferred eight from the total of 24 values. A further 35 % to 46 % of the 28
respondents had chosen the next six values on the ranked list, with the remaining 14 values
being chosen by a maximum of 32 % of all respondents.
Figure 4.28 on page 105 illustrate graphically the values’ preferred by the respondents, clearly
showing how some values which are emphasised today are not particularly desired for the
future. During the interviews with senior management staff, the subjects were presented with
slides of Figures 4.31 and 4.32 on pages 108 and 109, representing the top and bottom half of
the values, ranked by which values were perceived as being desired for the organisation’s
future.
In the top half, three values stand out, namely Broadmindedness, Development and Fairness.
These values display a discrepancy in the sense that they are considered less important today
than what is preferred for the future. Definitions by McDonald and Gandz (1992) are:

127
BROAD-MINDEDNESS: Accepting different viewpoints and opinions
DEVELOPMENT: Achieving personal growth, learning and development
FAIRNESS: Being fair and providing just recognition based on merit
The interviewees were questioned on possible reasons for why broad-mindedness is a
desirable value for the future. It was perceived that parts of the business had been somewhat
excluded from the rest during recent changes, and that this could be considered as the
opposite of being broad-minded. In addition, change efforts have resulted in less time for
individual innovation and limited time for listening to staff. Rather, emphasis has been on
organisational development with less democratic processes than what was probably desired by
staff. This has resulted in individuals protecting their work and emphasising their own
performance, rather than making efforts to cooperate.
In close relation to broad-mindedness the second value which is perceived to be desired and
important for the future is development. In a similar manner this is a value believed to be
important for the future, due to the limited investment into staff that has taken place recently.
Once again interviewees reiterated that personal development has been neglected when the
organisation has been taken into new directions. A primary concern was identified as the risk
that staff may leave if they feel they are not being invested in. Staff who are not feeling
valued are likely to move on, according to some interviewees.
The third value believed to be more important for the organisation’s future than it is today is
fairness. Interestingly, the comparatively low emphasis on this value can, according the
respondents, also be linked to the recent change processes. Some employees who have taken
on more responsibility during times of transition and change are said to not feel they have
been rewarded and recognised accordingly for their efforts. Another element impacting the
value of fairness is perceived to be the fact that the airline industry is not necessarily a fair

128
environment to work in. Being a highly unionised industry, fairness was perceived to always
be high on the agenda in an airline.
In the bottom half of the value rankings, five values stand out. These values display a
discrepancy in the sense that they are considered to be emphasised in the organisation today,
however not as desired for the future. Overall, there appears to be more values that should be
less emphasised in the future, than values that should be more emphasised. Again, definitions
for these five values are provided by McDonald and Gandz (1992) and are as follows:
CONSIDERATION: Being caring, kind and considerate
DILIGENCE: Working long and hard to achieve results
EXPERIMENTATION: Taking a trial and error approach to problem solving
OBEDIENCE: Complying with directions and conforming to rules
LOGIC: Being rational and thinking in terms of facts and figures
Consideration is a value which has lost support and which some interviewees tied in with
fairness. On first look consideration can appear to be a desirable value to have in an
organisation, however, the interview subjects all agreed that an organisation can be too
considerate. This appears to have been the case in the organisation over recent times, as
becoming too family oriented has meant things that should not happen has been allowed to go
by unmentioned. Focus was said to have moved away from business and onto people issues.
This way fairness in the company is affected in a negative way, something which corresponds
with fairness being a value the respondents want more focus on. There is, however, a conflict
between this statement saying focus has moved to people, and the previously identified
broad-mindedness and development both being explained by a lack of focus on people. The
explanation probably lies in the fact that too much consideration has in the case organisation
been said to take away elements of structure in the job, in return leading to uncertainty on the
129
job, as identified by interviewees. From this it appears as broad-mindedness and development
both imply a lack of focus on people development in this organisation, as opposed to a wrong
focus resulting from excess consideration.
Management’s surprise at learning from the interview sessions that experimentation is
perceived to be a value less desired for the future, was shortly afterwards followed by
reflections on how lots of new things had been tried out in the organisation during recent
change processes. On the other hand, it is difficult to explain why there is increased desire for
broad-mindedness and less desire for experimentation although one explanation for this can
be based in the wording of each definition. Furthermore, to achieve the increased innovation
desired as identified in the Adhocracy culture quadrant of Figure 4.4 (page 66), there was a
shared belief that experimentation is needed. Respondents did concede that this is a value that
might have scored higher had it not been for recent changes.
Another value less desired for the future, obedience, suggests an increased emphasis on
broad-mindedness. Although less emphasis on obedience was perceived to be a reflection of
human nature, respondents agreed that employees would want to take responsibility and
accountability for their actions rather than having to take order from the top. Even though the
airline industry in some areas is rule bound and obedient due to its regulated nature,
obedience can still be seen as an impediment to innovation.
In terms of a reduced focus on logic, management interviewees did not have as many
explanations to present. Most significantly, it can be tied in with other values such as broad-
mindedness and the desire for more innovation and individual creativity. It was pointed to

130
how being creative does not necessarily involve much logic, and how creative thinking is seen
as a contrast to rational thinking as the definition of the value indicates.
Finally, diligence is the value emphasised today which takes the greatest drop in relative
importance, falling 17 places from 6th to 23rd place when ranked against the other values
(Table 4.31 page 110). Ultimately, diligence was not perceived to be a value describing what
the organisation is all about. Again, this goes back to recent change and the significant
amount of work employees have had to put in to keep the organisation moving in the right
direction. The balance between work life and personal life was said to have suffered during
this period and may be the explanation why the organisation is seen as being diligent today. In
addition, in line with obedience, resistance to diligence can be seen as a natural tendency in
human nature, in particular when employees have had to work hard over a long period of
time. More importantly, diligence can be considered as a stressful element and a failure to
address this could lead to a weakened company in the future.

131
4.9 Research question # 4: “What is the perceived relationship from a senior staff point of view, between culture and values, and organisational economic performance in this firm?”
In the case organisation both the survey respondents and the interviewees were asked about
their perceptions on the role of organisational culture on the company’s performance. At the
end of the questionnaire the survey respondents were asked two broad Likert-scale questions,
in contrast to the rather specific considerations that needed to be made after having
deliberated on the perceived situation of the organisation. The first question presented the
statement “Organisational culture is important to the performance of Pukeko Air Ltd.” The
outcome is illustrated in figure 4.39.
Figure 4.39: Overall perception of organisational culture relevance to organisation (n=28)
Sixty percent of the respondents reported they “strongly agree” to this statement, while 25 %
“agree” with this. This means 85 % of the respondents rate organisational culture as
something positive for the organisation and its daily performance. It shows that respondents
actually believe a well-functioning organisational culture will make a difference to the
organisation’s performance. With 85 % of respondents indicating that they agree with culture
being important, this can signify a willingness to develop a unitary culture where all members

132
of the organisation pull in the same direction. 15 % of total responses said they did not have
an opinion or disagreed with the statement. However, because of the relatively low response
rate from some departments it is important to note that this may not be altogether
representative for the organisation. Rather, it shows a snapshot of the organisation as a whole,
and gives an indication of what the situation is like.
In a similar manner, a convincing 92 % of all respondents strongly agree or agree with the
statement “organisational values are important for sustaining success at the organisation”
(Fig. 4.40). Only 8 % were neutral to, or disagreed with this statement. One reason for this
outcome may be that the concept of organisational values are more easily understood than
organisational culture, due to the fact that several of the values expressed in this research can
actually be felt in day-to-day activities.
Figure 4.40: Overall perception of organisational values relevance to organisation (n=28)
Based on the outcome of these two questions, it is reasonable to accept that in the mind of the
organisation’s employees, organisational culture and organisational values do make a
difference in terms of good performance and success. This can be seen as a good starting
133
point for building awareness of culture and values, as the large majority of respondents
already perceive organisational culture as something relevant to the company and that they
actually believe it can be a competitive advantage. This formed the basis of the discussions
with management regarding research question four, on the role of organisational culture and
values in the company’s performance.
All six interviewees stated that organisational culture does make a difference to an
organisation’s performance; however, they tend to list different reasons. Three of the
interviewees distinguished between financial and overall performance of the company. Being
an airline you can achieve overall excellent performance in the form of for example, customer
service without being successful on the balance sheet. It was noted by one interviewee that in
a period of change there is a tendency for staff to be a lot more reactive in their decision
making simply because there is no time for proactive strategic thinking and because of this,
performance will suffer. One interviewee commented that this links back to being
broadminded, and not isolated, in what the company is doing. The culture that is being driven
through at the moment holds that each employee has to be aware of the decisions made and
how these can impact everything else in the organisation. Moreover, it was noted by one
interviewee that there is currently a lack of a shared vision in the organisation. Values that are
handed down to the organisation imply compliance, but if you have values and a vision that
comes from within, that applies commitment. The link between organisational culture and
performance ultimately depends on a strong link between vision and values, and whether the
values truly reflect the organisation as a whole.
There was a shared perception that getting commitment from your employees will lead to
good performance, with four of the six interviewees supporting this view. It all comes down

134
to buy-in and the shared vision and it was pointed out that companies who have a shared
vision can do great things, with one respondent emphasising “yeah, I think that is the key –
commitment”.
In another discussion with an interviewee, it was noted that the values you want the
organisation to have are not necessarily the actual values that are found within the
organisation. Distinct groups within the organisation results in various sub-cultures, which are
quite common also with airlines. Different groups have certain values, and their output can
translate into performance in different ways. Therefore, the perception is that there are few
universal values that can result in performance within an airline. It appeared to be commonly
accepted that certain groups within the organisation could be more flexible, which could
potentially result in increased performance.
It is important to highlight that the managers were aware that external factors such as fuel
prices are among the elements most crucial to the company’s performance. However, strong
culture in the organisation has proven in the past to impact performance, and this is what the
company aims to return to through a cultural shift. Resetting the culture at the case
organisation is done in order to achieve higher levels of performance, as was pointed out by
one member of management.
Finally, a comment was made saying that culture is not going to matter in performance unless
managers understands it and know how to translate this connection into action. Without acting
it out themselves and showing they know how to, staff are not likely to buy into it. Moreover,
there was a perception that staff are going to work well for their manager, and in the event
where they do not like their manager they are not going to work well for them. Ultimately, if

135
staff get along with their managers, they are going to work well, and this can translate into
increased performance.
4.9.1 Relationship between culture and performance: an interpretation by the researcher
The 4th research sub-question concerns the link between culture and performance. Ultimately,
this is a relationship which is difficult to prove, but based on the findings from the survey and
interviews conducted in this research an attempt will be made to find some evidence.
At the early stage of research on organisational culture, Denison (1984) argued that there was
little evidence on the impact of culture on organisational performance. The link was better
established by the early nineties with Denison (1990) turning around completely and now
leading the way, having found some evidence in his research. In Pukeko Air Ltd. the role of
culture on the organisation’s performance can be viewed from two angles: from a perception
point-of-view, and based on what has emerged from the survey regarding culture alignment.
Firstly, all senior managers questioned on the role of culture in the organisation do believe
that having a well-functioning culture will make a difference as to whether performance will
be good or bad. This could be considered an important step on the way to building a great
culture. Had senior management not been aware of nor interested in the organisation’s culture
they would have invested little interest and time into it. Culture’s role as an element in
performance has probably been ignored for as long as organisational culture itself has been
considered taken-for-granted, underlying assumptions. Secondly, when looking at the culture
plot in Figure 4.4 on page 66, illustrating the differences in current and preferred future
culture, it is obvious there is little real discrepancy between the current and future situation.
Although there are differences between the two sets of quadrants, the organisation can be

136
considered to be in a positive position, in particular when Cameron and Quinn (1999) advises
the culture researcher to pay particular notice of any discrepancy of more than 10. This does
not occur in any quadrant when diagnosing the culture of Pukeko Air as a whole.
Denison (1990) found that organisations with participative cultures performed better than the
organisations whose cultures were not as participative. This is in line with what is currently
being practised at Pukeko Air, where employees are reminded to be aware of how all
decisions made can impact to some degree on every other part of the organisation. Moreover,
the increased desire for more broadmindedness in the organisation can be a sign that the
culture is not yet as participative as it could be, leaving room for further improvement and
fine-tuning of the culture for it to contribute in performance excellence.
Although many of the 24 values used for this study are shared across the organisation, and the
culture shows little discrepancy between the current and future preferred situation, there was
reportedly a lack of shared vision in the organisation. This element leaves the organisation’s
performance vulnerable, as identified by Kaliprasad (2006). He argues that in order to sustain
a high performance culture, certain gaps must be closed. Among these are the senior leaders’
perceptions of the marketplace and the organisation’s vision; as well as the vision and direct
leadership practices. Because of a perceived lack of shared vision there could be problems in
filling these gaps, ultimately preventing a high performance culture from emerging.
A key element emerging from discussions with senior management was commitment. The
senior managers were clearly aware of the significance of commitment, and its significance is
echoed in the literature. O’Reilly (1989) presents commitment as a reason why a strong
culture is valuable, and commitment as a value was highlighted as being an important value

137
for organisational success (Lawrence, 1998). Because the culture in Pukeko Air is relatively
aligned it can be considered to be strong, and from this we can assume that commitment
might also be strong. However, from the survey it was commented by 15 % of respondents
leaving additional comments, that more commitment is needed from management. Scholars
have pointed out that an increase in commitment is a key element in attaining higher levels of
organisational performance (e.g. Chatman, 1991; Peters & Waterman, 1982). Moreover, a
shared vision also plays a role in commitment, as highlighted in one interview. With the
shared vision lacking as identified above, there is an element that should be addressed in order
to further improve performance.
The comments made regarding how the current culture and the values that can be found in the
organisation, are not necessarily the right culture or the right values for the organisation at any
given time, is also something which is discussed by researchers. Schein (1984, p. 7) holds that
the important thing is the “contents of the culture and the degree to which its solutions fit the
problems posed by the environment”, which ultimately is a contingency or situational
approach. As long as existing values support the right goals and strategies, culture can be
considered an important asset (Wiener, 1988).
Another element that was discussed with management was the differences in performance
within the organisation, and between the different departments. Figures 4.19 to 4.24 on pages
79-81, as well as 4.37 and 4.38 on pages 118-119, illustrate differences (and similarities)
between departments within the organisation. Because all departments can be expected to
understand “good” performance differently, it is difficult to compare them. From the OCAI
survey it has been revealed that the differences in organisational culture between the four
primary groups identified for the purpose of this research (operations, management,
138
functional, and one labelled “others”) are not greatly different, with the exception of the Clan
and Market quadrant in the current culture (Fig. 4.22 page 80). In these two groups, the
discrepancy is ten and twelve points respectively. These individual culture plots all contribute
towards the overall culture plot, which appears to be aligned and almost free from major gaps.
The desire from management for more flexibility from certain groups within the organisation
is likely to be something that can be influenced to a certain degree, through making sure
certain values are emphasised while others should be less emphasised. Having congruence
between core values of the individual and groups, and the organisation, has been found to be
beneficial to the organisation, resulting in stronger commitment (Chatman, 1991; McDonald
& Gandz, 1992). Shared values can lead to a strong culture, and a strong culture can in return
lead to business excellence, which is ultimately what any organisation seeks (Peters &
Waterman, 1982).
The culture-performance link has never been a straightforward issue for researchers, as
highlighted by Marcoulides and Heck (1993). The authors argue that this relationship is not
easy to establish, due to the number of variables involved. Senior managers at Pukeko Air
acknowledged in a similar manner that numerous elements are involved, while also conceding
that one of the primary factors affecting their company and industry is fuel prices. This is
perhaps the one element affecting performance that cannot be influenced by management.
Ultimately, this issue relates back to the first sub-question on the relevance of organisational
culture in the airline industry, where the element of culture was highlighted as a primary
competitive advantage for today’s airlines.
In summary, we have seen that organisational culture is perceived to play a role in high
performance in the case organisation, although one not easily identified or established. The
case organisation has an aligned and strong culture; both important for high performance.

139
4.10 Research question # 5: “How do senior managers perceive the relationship between their culture and economic performance?”
The final question from the interviews was a relatively open one, which related to how
organisational culture has specifically impacted the case organisation in any positive way in
times of change, transition, or isolated incidents. The interviewees were asked to come up
with examples of situations from their own experience. This question is closely linked to
research question four, and the majority of information which was gathered for that question
was repeated by the interviewees for this final question. Parallels were in many cases already
drawn between the case organisation and the culture-performance link in the previous
question, which resulted in a limited pool of data for discussion. Certain issues did however
emerge.
Working in small teams was mentioned as one way of dealing with times of organisational
change. This allowed for openness and honesty towards fellow colleagues.
The concept of commitment was echoed by all respondents as a primary reason why projects
have been successful in the past. Staff have been said to show this commitment through using
a lot of discretional effort to do whatever necessary to avoid disruption of flights. Staff
coming to work on their days off, in particular crew, rather than getting cancellations, has not
been uncommon. It is perceived to be part of the integrity of the employees.
It was recognised that crew may or may not care about “colleagues” on the ground, but they
will still go great lengths for their colleagues in the air. Yet, this shows strong commitment to
the company and fellow employees, and also a great sense of ownership.
During periods of change the perceived diligence can be seen through all the “blood, sweat,
and tears” people have put in over recent times, which was considered impossible without the

140
degree of commitment. Ultimately, if people did not care they would not have done this for
their company.
When looking at the findings presented above, it is clear that most comments made during the
interview sessions concerned “commitment”. This appears to be a key element in the case
organisation, and perhaps a key element in the organisation’s future plans. As argued by
O’Reilly (1989) commitment is an element in a strong culture and a contributor in helping
organisations getting an advantage over their competitors. With regards to the airline industry
in particular, Quick (1992, p. 45) notes that culture should only be considered as “the
connective tissue knitting together an organization’s people so that they can succeed in the
face of environmental challenges and opportunities”.
In summary, this final research question overlaps research question four, and comments given
on both of these effectively contribute to answering both research questions. They have been
presented here separately with the purpose of highlighting areas where the case organisation
most vividly see how their organisational culture contributes towards a higher performance. In
the end, interviewees partly used examples from their own organisation when presented with
question four, thereby leaving less to comment upon for this final research question. Research
question five does, however, relate closely to the open ended comments left by survey
respondents at the very end of the survey questionnaire which is addressed in detail in the
next section.

141
4.11 Thematic grouping of open ended question response The survey questionnaire included one open ended question at the very end, allowing
respondents to provide any comment and feedback on matters relating to the organisation’s
culture and values, or these concepts in general. Almost 54 % of the survey respondents,
totalling 15 respondents chose not to record their comments, leaving 13 respondents who
chose to comment. The comments made are summarised in the section below by major
themes that emerged from the analysis of the additional comments completed at the end of the
survey. For reasons of confidentiality, the number of people referred to in this section is not
always specified.
4.11.1 Communication Of the comments reported in the open ended question, issues involving communication were
the most prevalent. Eight of the 13 respondents (61 %) commented on issues concerning
inadequate internal communication. It was commented that not enough information is
released from the company to the staff. A general lack of, or inadequate communication
between management and staff was considered by several respondents as a problem. Others
put it differently, saying that staff are not listened to and that this can result in people leaving
the company. It was commented that one possible reason for this was individual’s uneasiness
about change, resulting from a lack of information needed to get through a change process. In
return, “poor attitudes are not addressed and left to fester”, as commented by one respondent.
More communication from management regarding the ongoing situation was wanted and
needed by respondents, with one respondent commenting that “being open and discussing
what is happening even if they do not know” is an absolute must.

142
4.11.2 Support Support is another area identified, with 46 % of comments submitted (6 respondents)
mentioning a lack of support from management. Some respondents feel they are not
considered important to the organisation, with one respondent feeling there is no support from
his or her manager, and that this treatment affects the necessary creativity and innovation that
should be a product of workers. Conversely, one respondent argues that there are managers
who work tirelessly towards increasing staff moral and ethics, but the respondent recognises
that more work can be done in this area. Another respondent would also like to see the morale
boosted in order to achieve a competitive spirit. Several respondents feel that some groups of
staff are treated more favourably than their own group, resulting in the favoured groups
getting all the benefits. One respondent notes that consideration for workers goes a long way,
and that management must uphold dignity and integrity towards hardworking staff in spite of
what the industry is facing.
4.11.3 Leadership Another area important to respondents is leadership, as commented by 30 % of respondents,
totalling four people. It appears to be a common belief that there are some areas of the
business lack the appropriate leadership necessary. An increased focus on leadership and
mentoring as opposed to only financial results is deemed necessary by one respondent. This
was in fact echoed by one of the interviewees: “One of those challenges for our leadership
team is how do you stay close to that work force and be there a coach and facilitator and all
that sort of thing and keep that participation in it”. This is recognised as a challenge by
management, and can be a likely reason for why some staff members have commented on this
issue in the survey.

143
Although leadership is an element that cannot easily be replicated, it is important to note how
a great airline such as Southwest Airlines has often been characterised by great leadership.
Furthermore, one survey respondent noted that management is more interested in developing
their own skills rather than developing individual skills as well as improving the company as a
whole. Overall, this perceived lack of leadership quality was noted by one respondent who
considered that it creates instability in the work place. The impact of the leader on the
organisation’s culture is in line with the findings of Schein (1983), who looked into how the
leader often introduces an organisational culture. The airline industry has seen some very
important and significant leaders – both entrepreneurs and other strong-minded characters
(Quick, 1992). The Pukeko Air management claimed to be entrepreneurial, although not only
through its leader and its managers. This is seen as a key value that needs to be spread
throughout the organisation. Even though Pukeko Air does not still have its founders at the
helm of the organisation, many elements of the original culture is, according to interviewees,
still in place.
Finally, when looking at the preferred future culture in Figure 4.4 page 66, we see that the
culture has one dominant quadrant in the top half, and one in the bottom half. As previously
mentioned, management consultants have equated the upper quadrants of the Clan and
Adhocracy with “leadership” and flexibility and the lower two of Market and Hierarchy
quadrants with “management” and stability. In this study the culture plot is spread almost
equally across the four quadrants (Clan 30 %, Adhocracy 23 %, Market 23 %, Hierarchy 24
%), suggesting a strong emphasis on both leadership and management, which is a good sign
for Pukeko Air.
144
4.11.4 Commitment It was noted by some respondents that more commitment is needed, with one particular
respondent feeling that management should accept responsibility before passing anything on
to staff, making them accountable. It was also noted that there is now more responsibility
given in the organisation, however, without the necessary authority.
4.11.5 Miscellaneous views
• It was recognised that there is an element of “fun” in the organisation, and that this
contributes in keeping some people at the organisation.
• It was also felt that the culture has changed dramatically recently, from “a fun and
caring environment to one that is unstable and uncaring”. The emerging culture is
considered by some respondents to be not as suitable for the company, and that
building a different culture could make the organisation a better place to work.
• Working towards a shared vision was highlighted by another respondent, saying that
the important thing is getting the basics right and establishing a set of behaviours that
will ultimately build a good culture.
• It appears to be some confusion regarding corporate identity. Having been formed
from separate organisations there is confusion as to what the organisation should be
identified as. With business spread over multiple premises respondents feel there is a
lack of unity, and that not even managers know the right identity.

145
4.11.6 Concluding remarks about the comments and feedback
Allowing the survey respondents to comment freely on the notions of culture and values
before submitting the survey, was done specifically to gather any addition perceptions people
would have on their mind regarding these issues that were not addressed in the three part
survey. With little over half of all respondents choosing to leave some form of comment, this
could signify that culture and values do occupy a place in employees’ minds. Most
respondents appear to have a clear idea of what it means to have an organisational culture, and
also what they want it to be like. A problem with allowing respondents to comment freely on
any theme is the way in which such comments could potentially be presented, without
compromising confidentiality when number are small. Some things that could be revealed are
perhaps only known by a small group of people, this way putting this group at risk. Most
comments, however, are in agreement and can easily be presented. These are ultimately the
comments which are useful for the researcher, and can be linked to the available literature and
the study as a whole.
This section has provided a useful insight into the minds of half of all survey respondents, and
their views on the organisation’s culture and values. Some of what has been revealed can be
considered valuable information for the organisation, as this has been the respondents’ best
opportunity to express their opinions in an anonymous setting. Moreover, the thematic
grouping has reiterated the importance of such elements as commitment and leadership to the
organisation’s members, which also surfaced in the interviews with managers.

146
4.12 Conclusions about the research questions
4.12.1 Conclusions concerning research question one In the literature the role of organisational culture in airlines has already been highlighted
numerous times (e.g. Bunz & Maes, 1998; Gittell, 2003; Quick, 1992; Smith, 2004), although
primarily as an element of success within a small group of airlines. In the case airline the role
of culture was unanimously acknowledged by senior managers as something crucial to
success, due to the limited possibilities of differentiation in the industry. The culture can,
according to an interviewee in this research, be decisive in determining what type of airline
the company wants to be, and members of the organisation are considered as contributors
towards the customer’s experience, which in return creates loyalty to the company. Even more
so, the case organisation’s management believed that too little emphasis on culture and too
much focus on product and infrastructure could be counter productive. At the same time,
becoming too entrenched in the culture can result in resistance to change, which is an equally
undesirable situation. Furthermore, sub-cultures were recognised by senior management as
something which is both useful and desirable in an organisation, and that management is
paying attention to this element of organisational life. Taking elements from sub cultures
perceived to be good and spreading it across the organisation was considered a possibility for
the future. In summary, organisational culture was perceived to be of importance to the airline
industry in general, and the case organisation in particular. While conceding that the element
of culture and its role in business is not easily grasped, it is clearly recognised. As a result of
this awareness, the organisation is already paying much needed attention to the element of
culture, and aims to continue to do so. The answer to the first research question appears to be
that the organisational culture concept does have some degree of relevance to the case
organisation, based on management perceptions and the available literature.

147
4.12.2 Conclusions concerning research question two The findings reveal that Pukeko Air has primarily a Clan culture within the organisation
today, and this is also the case in terms of what culture is desired for the future. There is no
major discrepancy between the current and preferred future organisational culture as seen in
the culture plot comparing the present and the future (Fig. 4.4 page 66). Based on this it can
be assumed that the organisational culture does not at this stage need to be changed, meaning
the organisation is more or less exactly where it wants to be for the future.
The most important difference between the present and the future can be seen in the Hierarchy
culture quadrant. The OCAI reveal a slight desired increase in emphasis on Hierarchy and
Clan culture, and a small reduction in emphasis on Hierarchy and Market culture. The relative
importance of each culture quadrant remains almost unchanged, however, each quadrant’s
strength have changed, with Clan culture being the most desired culture for the future, and
Hierarchy and market culture following closely. Moreover, when compared to an “average”
organisational culture plot based on 1000 previous diagnoses, the difference between the case
organisation and this average is not significant, as no quadrant has a gap in score of ten or
more. Also when looking at trends related to organisational culture there is congruence.
Although the “average culture plot” and the trends do not aim to describe any “one right
culture”, it is interesting to discover there is little difference between the case organisation and
what has been revealed elsewhere in terms of organisational culture. In summary, the
organisation has a Clan culture in the organisation today, which is the culture perceived to be
strongest in the future as well. This answers research question two.
4.12.3 Conclusions concerning research question three A set of values did stand out to the organisation’s members as more important than the rest.
However, what was perceived to be emphasised in the organisation today was not necessarily

148
considered important for the future. Four values remain almost equally important in the future
as they are perceived to be today: Adaptability, cooperation, humour, and creativity. The
values which have been identified as displaying the greatest gaps when ranked against each
other are broad-mindedness (up 11 places), moral integrity (up 10 places), development (up
11 places), obedience (down 10 places), and diligence (down 17 places). This set of values
basically answer research question three. The complete list of values accompanied by scores
can be seen in Table 4.31 on page 110. It is important for the airline to acknowledge the
organisational values which gain and lose support, in order to make sure the right values are
emphasised as the company develops and grows. The differences in these values also help
explain the shifts in the culture quadrants, once again highlighting how the two research tools
used allow for cross-referencing. In addition, differences in emphasised values are somewhat
different when making a distinction between management and non-management staff, the
time spent with the organisation, where the respondent was employed previously, and most
evidently, what department or business unit the respondent belongs to.
4.12.4 Conclusions concerning research question four The airline’s senior staff did indeed believe organisational culture makes a difference in terms
of their economic performance. Half of those interviewed did, however, distinguish between
financial performance and overall performance of the company, which could signify that
finances is not everything when this organisation is defining success and high performance.
Still, the fact that organisational culture is recognised as an important element of business
success can be considered an important step towards in the right direction. Had the situation
been the opposite, and no attention had been paid to culture, the organisation would have
neglected something which by both scholars and practitioners (e.g. Kaliprasad, 2006; Ouchi,
1981; Peters & Waterman, 1982) is said to truly make a difference in sustaining success. It

149
was, however, concluded by everyone involved that even though organisational culture is
important for success, there are external factors such as fuel prices which affect the airline
industry significantly, and which cannot be controlled. A well functioning culture cannot be
considered the solution to all organisational worries; rather, it must be seen as the connective
element holding the influencing elements of an organisation together.
The aligned culture at Pukeko Air Ltd. can be seen as one contributor in achieving high
performance. A set of strong values which are agreed upon by the majority of respondents
will play an important role as well, as employees attempt to identify with their organisation.
The absence of this could ultimately affected staff commitment, which in return could impact
on performance. Moreover, the lack of shared vision which has been revealed raises some
concern, as this could potentially prevent a high performing culture from emerging.
Considering that the culture of the organisation is aligned according to the findings of this
research, it is likely to also be strong. Even across different departments it has been uncovered
that the culture is to a large degree shared. From this it can be assumed that commitment
today is equally strong. In spite of this, comments were made saying more commitment is
needed from management. Ultimately, shared vision and commitment are two decisive
elements in building a high performing organisation.
This sub question can be answered through pointing to findings showing how management
are aware of a link between culture and performance, and also perceive it as relevant to
sustained success. Cultural strength can lead to higher commitment, which in return is can
positively impact organisational performance.

150
4.12.5 Conclusions concerning research question five Senior managers at Pukeko Air Ltd. did feel their organisational culture is already conducive
to success and superior performance, while revealing how certain organisational practices
such as team work helps in coping with organisational change. Moreover, the notion of
commitment, this time in connection with ownership, came up as an important factor in
achieving competitive advantage, and ultimately a strong economic performance.
The thematic grouping of the comments which were left at the end of the survey questionnaire
also reflects what was considered to be good and bad about the present culture. Lack of
communication and support from management were to two most prevalent issues arising,
while leadership and commitment were other issues repeatedly mentioned. From this we see
that even though organisational commitment is perceived by management to be high, it is just
as much a concern to some employees.
The answer to this final research sub question is basically that managers of the organisation
do indeed perceive the current organisational culture to be conducive to success. This is a
result of certain organisational practices as well as high levels of perceived commitment and
ownership from all staff members.

151
4.13 Summary This chapter has reported many elements of this organisation’s organisational culture and
values, and has given the researcher an insight into the present as well as preferred future
cultural situation. Findings from the survey questionnaire as well as the interviews with
management have been used to discuss the five research sub-questions in this research.
First, findings have been presented through both illustrative pie diagrams and OCAI diagrams
which were drawn up based on the perceptions of the current and preferred future
organisational culture. From the culture plot it has became clear that the Clan culture,
Hierarchy culture and Market culture has an almost equally strong presence in the
organisation, with the Adhocracy culture currently being the least emphasised.
When the future preferred situation was plotted on the graph, the Clan culture took the
dominating cultural role in the organisation, while the other three cultures have a very similar
importance. When the current and future cultures are plotted together, the Adhocracy culture
showed the largest increase in importance followed by the Clan culture. Conversely, the other
two cultures were perceived a being less critical. Following the portrayal of the overall
organisational culture profile, a set of OCAI plot diagrams were portrayed based on the
demographics data presented first in this chapter. This pool of data formed the basis for
discussion of research questions one and two, allowing the interviewees to present their
perception on the role of organisational culture in the airline industry in general, and in their
own company in particular. Culture’s impact was acknowledged, but it was agreed that
organisational culture cannot be considered the solution to all problems faced by the industry.
The organisational values chosen by survey respondents were also presented graphically,
ranked by their importance in the current as well as the preferred future situation. It became

152
clear that values such as adaptability, cooperation, humour, and creativity remained almost
unchanged between the two time periods, in other words were equally desired for the future as
they are today. There were however some disparities in values between the current and
preferred future situation such as broad-mindedness, development, fairness at the top (i.e. a
desired increase in emphasis in the future), and obedience, consideration, logic, and diligence
(i.e. reduced emphasis in the future) at the bottom.
Organisational values were presented with respect to demographics data, illustrating
differences between for example departments and time within the organisation. The values
identified were also embedded across the OCAI plot displaying both the current and preferred
organisational culture, displaying the usefulness of combining the two survey tools used for
this research. These findings formed the basis for discussion of research question three.
Research question four was discussed based on the perceived relationship between
organisational culture and values, and the organisation’s performance. The vast majority of
survey respondents and all six interviewees believed there is a tight link between a well-
functioning organisational culture and high performance. An even greater percentage agrees
that organisational values are important to the success of the firm, with a persuasive 92 %
saying they agree or strongly agree. In addition, findings from Research Question five were
presented and discussed based primarily on information derived through the interviews. This
final question was discussed while also incorporating elements from the survey questionnaire,
where respondents were asked to comment freely on organisational culture and values in
general or with regards to the organisation. A set of common themes emerged and the
responses could be grouped together and linked to the research questions. This way the
themes could occasionally contribute to the researcher’s discussion of the research questions.
The most prevalent themes were communication, support, commitment, leadership;

153
essentially a group of important issues that appeared numerous times across survey findings
and discussion with interviewees.
Finally, concluding remarks about the research sub questions have been presented, leading
this research project into the final chapter synthesising conclusions, recommendations,
limitations, and implications.

154
5 CONCLUSIONS AND IMPLICATIONS
5.1 Introduction This research provides an exploratory insight into the organisational culture and particularly
the values of a New Zealand airline, through asking the question:
What is the perceived relationship between organisational culture and firm performance of a smaller New Zealand airline? Five sub-questions emerged from the main research question:
• How relevant is the organisational culture concept to this firm?
• What is the perceived current and preferred future culture of the organisation?
• What are the current and preferred future values for this organisation?
• What is the perceived relationship from a senior staff point of view, between
culture and values, and organisational economic performance in this firm?
• How do senior managers perceive the relationship between their culture and
economic performance?
The conclusions from the pool of data resulting from the five sub-questions cover a diagnosis
of the organisational culture and organisational values of the case-study organisation Pukeko
Air Ltd., as well as how culture impacts the airline’s performance. First, conclusions
concerning each research question have been presented in Chapter 4, and a summary of these
conclusions appear in the paragraphs below. This conclusions section will treat each research
question individually. Second, an attempt to answer the main research question based on sub
question conclusions is presented. Finally, recommendations for the case organisation,
limitations to the research, and implications for future research is presented.
5.2 Summary of conclusions concerning the research questions Conclusions to each of the five research sub questions have been presented in detail at the end
of Chapter 4. Brief summaries to each of these conclusions are presented in the section below.

155
5.2.1 Research question one
Research question one looked for support for, and perceptions of the role of organisational
culture in the aviation industry, and asked “How relevant is the organisational culture concept
to this firm?”
• Organisational culture is from a staff member and management point of view
perceived to be of importance to the aviation industry in general, and Pukeko Air in
particular, as is also the case in many other industries. Culture’s relevance is
highlighted in the literature, although it is rarely considered the only element in
success (Quick, 1992; Smith, 2004)
• Organisational culture is perceived to be particularly relevant to this airline due to lack
of possibilities of differentiation from other airlines in the market it operates, and
because culture can play a contributing role as to what kind of airline this organisation
wants to become
• The Pukeko Air management claimed to pay attention to organisational culture already
before this study was conducted. This awareness of organisational culture can
facilitate building and shaping a strong and appropriate culture, as the company most
likely has some insight into elements of its own culture
In conclusion, the first research question has been answered with the help of discussions with
the organisation’s management and the available literature. Culture’s positive impact is
highlighted in the literature, and the airline’s management supports this view. Culture can
contribute in shaping the organisation, and is perceived to be an element in becoming a
successful company.

156
5.2.2 Research question two Research question two looked into the culture of the organisation, and asked “What is the
perceived current and preferred future culture of the organisation?”
• Clan culture is the dominant culture today and is, according to the survey, the most
preferred culture for the future
• Clan culture, the strongest culture in Pukeko Air today as well as for the preferred
future situation, is characterised by people focus and is considered an “extended
family” where commitment is high. Having a strong culture has been said to lead to
higher commitment (O'Reilly, 1989), and with Clan culture being the strongest culture
one can assume commitment will remain high
• There is little difference between current and preferred future cultural profile that
suggests that the organisation is likely to be in a good position for the future
• Hierarchy culture looks set to remain the second strongest cultural type, but its
strength is likely to be reduced if the preferred cultures for the future actually
materialise. It has been recognised by management that an element of Hierarchy
culture is needed in the aviation industry in general and Pukeko Air in particular, due
to laws, regulations, and policies these companies must adhere to
• The gap between Pukeko Air’s culture plot and an average culture plot based on 1000
organisations is small. Although this average does not represent any ideal culture plot,
it is of interest to Pukeko Air to see whether or not their culture plot differs drastically
when compared with this average (Cameron & Quinn, 1999)

157
In conclusion, the second research question has been answered with an electronic edition of
Cameron and Quinn’s (1999) “Organisational Culture Assessment Instrument”. This survey
tool has revealed that the organisation has a Clan culture today, and that this looks set to be
the strongest culture in the future as well.
5.2.3 Research question three Research question three looked into the values of the organisation, and asked “What are the
current and preferred future values for this organisation?”
• Four values have been revealed as more desired than the rest of McDonald and Gandz’
(1992) list of 24 values: Adaptability, cooperation, humour, and creativity. These
appear to be equally desirable for the future as for the present
• Three values from the complete list of 24 values stand out as being more desired for
the future: Broad-mindedness, moral integrity, and development
• Obedience and diligence are, based on the survey findings, values which are perceived
to be emphasised today, but that are less desired for the future
• The desire for more broad-mindedness, moral integrity, and development explains in
part the strengthening of Clan culture and Adhocracy culture. Similarly, the
weakening of obedience and diligence play a role in the reduced strength of the
Hierarchy and Market cultures
In conclusion, the third research question has been answered with an electronic version of
McDonald and Gandz’ (1992) list of 24 values for the modern corporation. This survey tool
has revealed a set of values which are considered strongly emphasised today: Adaptability,
158
cooperation, humour, and creativity. These are the values preferred for the future as well,
which should mean the organisation is in a good situation for the future. A set of values more
desired for the future have also been revealed (broad-mindedness, moral integrity and
development), while other should be attributed less emphasis (obedience and diligence).
5.2.4 Research question four Research question four looked into the relationship between organisational culture, values and
organisational performance, and asked “What is the perceived relationship from a senior staff
point of view, between culture and values, and organisational economic performance in this
firm?”
• The organisation’s members, both managers and non-managers, have in general a
strong belief in organisational culture as an element in high performance and success
• A need to differentiate between economic and overall performance was acknowledged
by senior managers, as was revealed during interview sessions. It was perceived that
one can be successful in the industry even without high profit margins, as elements
such as customer satisfaction and loyalty are important to an airline
• Senior staff claims to already pay attention to the organisation’s culture, which
confirms management’s interest in this element of organisational life
• External factors such as fuel prices are recognised as inhibitors to high performance,
as it cannot be controlled. In the same manner, arguments have been put forward that
organisational culture cannot be controlled either. Alvesson (2002), on the other hand,
holds that managers can work with culture in different ways. On the one hand,
managers can consider culture as building blocks in an organisational design,

159
containing the norms, values, beliefs, and behaviour styles of the organisation’s
employees. Management is in this case in control of the culture. Conversely, looking
at organisational culture as a diagnostic instrument can assist in making better
decisions and avoiding mistakes. Culture is considered to be strong and resistant, and
management is not in control and must in this case adapt to the culture
• It was commented in the survey questionnaire that there is a lack of shared vision in
the organisation. This can be a concern to Pukeko Air, and can prevent a high
performing culture from emerging. Kaliprasad (2006) are among those who argue that
a vision must be in line with the marketplace and the leadership practices. In addition,
Cameron and Quinn (1999) claim that a strong culture is associated with
“homogeneity of effort, clear focus, and higher performance in environments where
unity and common vision are required” (p. 63). This reinforces the claim that a shared
vision is necessary at Pukeko Air to achieve high performance, as cultural strength can
be affected negatively if there is no common vision.
• Because the culture has been identified as strong, commitment can be expected to be
strong as well. Some comments in the survey did, however, concern a perceived lack
of commitment from management. Cultural strength can be negatively affected should
commitment be weak or even absent (O’Reilly, 1989).
In conclusion, the fourth research question has been answered through the available literature
on culture and performance in general and the role of culture in airline performance in
particular. This literature has been compared with perceptions from the organisation’s senior
management. This organisation’s management appears to have belief in culture as a driving
force behind higher performance. In addition, findings show that a shared vision must be in

160
place to build a strong culture with high commitment. This can ultimately result in a higher
organisational performance.
5.2.5 Research question five Research question five looked for perceptions from managers regarding the relationship
between culture, values and performance, in asking “How do senior managers perceive the
relationship between their culture and economic performance?”
• With regards to the case organisation’s own culture, management believed that this
was already a successful one that could continue to support strong performance
• The findings suggest that commitment and ownership are considered important
elements in creating competitive advantage and strong performance in the case
organisation. Increased commitment can potentially result in higher levels of
organisational performance (Chatman, 1991; O'Reilly, 1989; Peters & Waterman,
1982). In addition, comments were made saying commitment and support from
management could have been better, and that the leadership exercised is not always
appropriate. This view differs from the perceptions of management, who believe
commitment is high throughout. This could be a concern for the organisation.
In conclusion, the fifth research question has been answered through allowing senior
managers to consider whether or not the organisation’s particular culture has been conducive
to high performance in the past, and whether it can lead to continued strong performance in
the future. The senior staff members interviewed have a strong belief in their own culture as
an element in success, and it is perceived to remain an important element in future success.
Ownership and commitment are considered key components in economic performance, and
while some managers believe these elements are in place, survey results challenge this view.

161
5.3 Conclusions about the main research question
The five sub questions from the previous section were carefully developed to resolve the main
research question: “What is the perceived relationship between organisational culture and firm
performance of a smaller New Zealand airline?” Each sub question has addressed an element
of either organisational culture or organisational values, or an association of these with
performance in the airline industry in general and the case organisation in particular. The
answer to the research question is multifaceted.
First, findings from this research indicate that organisational culture and organisational values
are perceived to have relevance to this New Zealand case airline. In the case of Pukeko Air,
the company has a relatively aligned culture when the current and preferred future situation is
compared, something that might suggest a strong culture and that the company is likely to be
well positioned for the future. Second, organisational culture is partially characterised by a set
of values which employees can relate to or not. The degree to which the organisation can
gather support for this set of values will likely contribute to shaping the future culture of this
organisation. In the case of Pukeko Air, the values which are preferred in the organisation
matches the preferred future organisational culture. Similarly, the least desired values belong
mostly with the culture types that are the least desired.
In conclusion, it is evident that the relationship between organisational culture and firm
performance is perceived to be closely linked. Convincing results from survey respondents, as
well as comments made by interviewees, are in agreement that a smaller New Zealand airline
can benefit from having a strong, well-functioning organisational culture which embraces the
right set of values. A key finding here is the fact that both the current and preferred future
values are relatively aligned.

162
Finally, scholars on the field of culture and performance argue that commitment is a reason
why a strong culture is valuable, and that it is also an important value in organisational
success (Lawrence, 1998; O'Reilly, 1989). At Pukeko Air, good performance is considered a
result of having a shared vision which creates cultural strength and commitment. A senior
manager echoed this and concluded: “Yeah, I think that is the key – commitment”.
5.4 Recommendations Based on these conclusions concerning the organisational culture and values in this study,
some recommendations can be offered for possible consideration by Pukeko Air.
First, even though the research reveals a great deal of alignment of the overall organisational
culture, there are differences between the organisation’s departments which can be viewed as
sub-cultures. Identifying well-functioning sub-cultures and which features are associated with
effectiveness in this sub-culture, and then disseminating across departments where this culture
would be relevant, could be an area of investigation for the organisation in the near future.
Second, the different departments appear to have different values, which in itself is not
surprising. However, having too few shared values throughout the organisation can ultimately
prevent the creation of, and emphasis on any primary dominant culture. This could be looked
at more in-depth in order to ensure at least certain values, as identified in this research, are
accepted throughout the organisation.
Finally, even though the findings from this study indicate the case organisation has a well-
aligned organisational culture, there may be a desire to change certain elements of the culture.
This can be useful for moving the organisation in a new direction, or for responding to an
environmental or market challenge. Cameron and Quinn (1999) presents a formula for
organisational culture change, and this could be investigated should it be deemed necessary.

163
5.5 Limitations
With most research there are limitations associated with the process involved (Lawrence,
1998), and applies to this study as well. First, as highlighted in the case whereby respondents
are asked to rate themselves there is always the possibility of social desirability bias where
respondents can easily select values or cultural orientations that present a favourable
impression. This study deals primarily with member perceptions rather than any firm realities
of their culture and values, and how this is associated with performance. Perceptions cannot
be considered absolutes; rather, they are all about different realities.
Second, because of the small number of participants in some of the departments of the
organisation surveyed in phase one of the data collection, fears of compromised anonymity
may further affect the responses given. When employees in small departments respond to the
survey it is highly likely they would want to paint a prettier picture of the situation, fearing
that being one of a small number of employees in any given department can compromise their
anonymity. Choosing not to respond to the questionnaire at all is another likely action.
Finally, the overall low response rate to the survey compared with the total number of
potential recipients, together with a relatively small number of interviewees, is in itself a
limitation to this study. This means the demographic groupings will have smaller numbers
than would have been desirable, and limits the ability to generalise within and beyond the
study.

164
5.6 Implications for further research In terms of the role of culture in the airline industry in general, future research needs to
investigate even more airlines, and how their organisational culture and values are conducive
to high performance. This is relevant in order to highlight and find ways to replicate the
positive aspects of successful companies in the aviation industry. This way an entire
struggling industry can reap the benefits of what only some airlines are enjoying today.
This thesis represents a step on the way towards identifying an organisational culture and
organisational values which are conducive to high performance among airlines in New
Zealand. The importance of this study is in the combination of two accepted tools for
assessing organisational culture and organisational values; McDonald and Gandz’ (1992)
values for the modern business corporation, and Cameron and Quinn’s (1999) “Organisational
Culture Assessment Instrument”. The combination of these has not previously been reported
in the literature. Moreover, this research has allowed for cross referencing of findings from
the OCAI and the values identified by McDonald and Gandz (1992), as a set of values
perceived to be present in the case organisation has been embedded across Cameron and
Quinn’s (1999) four culture quadrants. The implications of both the culture type and the set of
identified values being the same for the current and preferred future situation, is an important
outcome for the case organisation. With the current situation at the organisation being
perceived by senior staff to deliver high performance, Pukeko Air appears to be in a good
position for the future, as both the current culture and current values are the same culture and
values preferred for the future. These findings represent a starting point towards developing a
guideline for shaping an airline’s organisational culture, so it can achieve and maintain strong
performance, while at the same time the findings enhance the knowledge available in this
field of study.

165
REFERENCES
Ahmad, R., & Ali, N. A. (2003). The use of cognitive mapping technique in management research: Theory and practice. Management Research News, 26(7), 1-16.
Alvesson, M. (2002). Understanding organizational culture. London: Sage. Amaratunga, D., Baldry, D., Sarshar, M., & Newton, R. (2002). Quantitative and qualitative
research in the built environment: application of “mixed” research approach Work Study, 51(1), 17-31.
Appelbaum, S. H., & Fewster, B. M. (2003). Global aviation human resource management:
contemporary compensation and benefits practices. Management Research News, 26(7), 59 - 71.
Ashkanasy, N. M., Broadfoot, L. E., & Falkus, S. (2000). Questionnaire measures of
organizational culture. In Ashkanasy, N. M., Wilderom, C. P. M. & Peterson, M. F. (Eds.), Handbook of organizational culture and climate (pp. 131-145). Thousand Oaks, CA: Sage.
Barley, S. R., Meyer, G. W., & Gash, D. C. (1988). Cultures of culture: Academics,
practitioners and the pragmatics of normative control. Administrative Science Quarterly, 33(1), 24-60.
Barney, J. B. (1986). Organizational culture: Can it be a source of sustained competitive
advantage? Academy of Management Review, 11(3), 656-665. Brannen, M. Y., & Kleinberg, J. (2000). Images of Japanese management and the
development of organizational culture theory. In Ashkanasy, N. M., Wilderom, C. P. M. & Peterson, M. F. (Eds.), Handbook of organizational culture and climate (pp. 387-400). Thousand Oaks, CA: Sage.
Brown, M. A. (1976). Values - A necessary but neglected ingredient of motivation on the job.
Academy of Management Review, 1(4), 15-23. Bunz, U. K., & Maes, J. D. (1998). Learning excellence: Southwest Airlines' approach.
Managing Service Quality, 8(3), 163-169. Burchell, R. N., & Kolb, D. (2003). Pattern matching organisational cultures. Journal of
Australian and New Zealand Academy of Management, 9(3), 50-61. Burt, R. S., Gabbay, S. M., Holt, G., & Moran, P. (1994). Contingent organization as a
network theory: The culture-performance contingency function. Acta Sociologica, 37, 345-370.
Calori, R., & Sarnin, P. (1991). Corporate culture and economic performance: A French
study. Organization Studies, 12(1), 49-75. Cameron, K. S. (1986). A study of organizational effectiveness and its predictors.
Management Science, 32(1), 87-112.

166
Cameron, K. S. (2004). A process for changing organizational culture. Retrieved August 17, 2006, from http://www.creativity-at-work.com/pdf/A%20Process%20for%20Changing%20Organizational%20Culture.PDF
Cameron, K. S., & Ettington, D. R. (1988). The conceptual foundations of organizational
culture. In Smart, J. C. (Ed.), Higher education: Handbook of theory and research (Vol. IV, pp. 356-396). New York: Agathon Press.
Cameron, K. S., & Freeman, S. J. (1991). Cultural congruence, strength, and type:
Relationships to effectiveness. In Woodman, R. W. & Passmore, W. A. (Eds.), Research in organizational change and development (Vol. 5, pp. 23-58). Greenwich, CT: JAI Press.
Cameron, K. S., & Quinn, R. E. (1999). Diagnosing and changing organizational culture:
Based on the competing values framework. Reading, MA: Addison-Wesley. Carroll, D. T. (1983). A disappointing search for excellence. Harvard Business Review, 61(6),
78-88. Chan, D. (2000a). The development of the airline industry from 1978 to 1998 - A strategic
global overview. Journal of Management Development, 19(6), 489 - 514. Chan, D. (2000b). The story of Singapore Airlines and the Singapore Girl. Journal of
Management Development, 19(6), 456 - 472. Chan, L. L. M., Schaffer, M. A., & Snape, E. (2004). In search of sustained competitive
advantage: The impact of organizational culture, competitive strategy and human resource management practices on firm performance. International Journal of Human Resource Management, 15(1), 17-35.
Chatman, J. A. (1991). Matching people and organizations: Selection and socialization in
public accounting firms. Administrative Science Quarterly, 36, 459-484. Chatman, J. A., & Jehn, K. A. (1994). Assessing the relationship between industry
characteristics and organizational culture: How different can you be? Academy of Management Journal, 37(3), 522-553.
Christensen, E. W., & Gordon, G. G. (1999). An exploration of industry, culture and revenue
growth. Organization Studies, 20(3), 397-422. Collins, L. A., & Smith, A. J. (2004). Understanding the new Investors in People standard -
lessons from experience. Personnel Review, 33(5), 583-604. Collis, J., & Hussey, R. (2003). Business research (2nd ed.). New York: Palgrave Macmillan. Connor, P. E., & Becker, B. W. (1975). Values and the organization: Suggestions for
research. Academy of Management Journal, 18(3), 550-561.

167
Cooke, R. A., & Rousseau, D. M. (1988). Behavioral norms and expectations: A quantitative approach to the assessment of organizational culture. Group & Organization Studies, 13(3), 245-273.
Deal, T. E., & Kennedy, A. A. (1982). Corporate cultures: the rites and rituals of corporate
life. Reading, MA: Addison-Wesley. Den Hartog, D. N., & Verburg, R. M. (2004). High performance work systems, organisational
culture and firm effectiveness. Human Resource Management Journal, 14(1), 55-78. Denison, D. R. (1984). Bringing corporate culture to the bottom line. Organizational
Dynamics, 13(2), 5-22. Denison, D. R. (1990). Corporate culture and organizational effectiveness. New York, NY:
John Wiley & Sons. Denison, D. R., & Mishra, A. K. (1995). Toward a theory of organizational culture and
effectiveness. Organization Science, 6(2), 204-223. Easterby-Smith, M., Thorpe, R., & Lowe, A. (1991). Management Research: An Introduction.
London: Sage. Economist. (2001, November 24). The unpalatable truth. The Economist, 361, 57-58. Enz, C. A. (1988). The role of value congruity in intraorganizational power. Administrative
Science Quarterly, 33(2), 284-304. Fallding, H. (1965). A proposal for the empirical study of values. American Sociological
Review, 30(2), 223-233. Fiorino, F. (2002). JetBlue pursues growth while staying "small". Aviation Week & Space
Technology, 156, 41-44. Flint, P. (2005). Southwest keeps it simple. Air Transport World, 42, 26-32. Gittell, J. H. (2003). The Southwest Airlines Way: Using the power of relationships to achieve
high performance. New York: McGraw-Hill. Goffee, R., & Jones, G. (1996). What holds the modern company together? Harvard Business
Review, 74(6), 133-148. Gordon, G. G. (1985). The relationship of corporate culture to industry sector and corporate
performance. In Kilmann, R. H., Saxton, M. J. & Serpa, R. (Eds.), Gaining control of the corporate culture. San Francisco: Jossey-Bass.
Gordon, G. G. (1991). Industry determinants of organizational culture. Academy of
Management Review, 16(2), 396-415. Gordon, G. G., & DiTomaso, N. (1992). Predicting corporate performance from
organizational culture. Journal of Management Studies, 29(6), 783-799.

168
Harrigan, K. R. (1983). Research methodologies for contingency approaches to business strategy. Academy of Management Review, 8(3), 398-405.
Harris, L., & Cronen, V. E. (1979). A rules-based model for the analysis and evaluation of
organizational communication. Communication Quarterly, 27(1), 12-28. Healy, M., & Perry, C. (2000). Comprehensive criteria to judge validity and reliability of
qualitative research within the realism paradigm. Qualitative Market Research: An International Journal, 3(3), 118-126.
Hofstede, G. (1991). Cultures and organizations: Software of the mind: Intercultural
cooperation and its importance for survival. London: Profile Books Ltd. Hofstede, G., Neuijen, B., Ohayv, D. D., & Sanders, G. (1990). Measuring organizational
cultures: A qualitative and quantitative study across twenty cases. Administrative Science Quarterly, 35(2), 286-316.
Howard, R. (1990). Values make the company: An interview with Robert Haas. Harvard
Business Review, 68(5), 132-145. Igo, T., & Skitmore, M. (2006). Diagnosing the organizational culture of an Australian
engineering consultancy using the competing values framework. Construction Innovation, 6(2), 121-139.
Kaliprasad, M. (2006). The human factor II: Creating a high performance culture in an
organization. Cost Engineering, 48(6), 27-34. Kilmann, R. H., Saxton, M. J., & Serpa, R. (1986). Issues in understanding and changing
culture. California Management Review, 28(2), 87-94. Kotter, J. P., & Heskett, J. L. (1992). Corporate culture and performance. New York, NY:
Free Press. Laszlo, G. P. (1999). Southwest Airlines - living total quality in a service organization.
Managing Service Quality, 9(2), 90 - 95. Lawrence, A. (1998). Individual-organisational value congruence in human resource
practitioners. In Griffin, G. (Ed.), Management theory and practice: Moving to a new era (pp. 159-174). South Yarra, VIC: MacMillian Education.
Lewis, D. S. (1994). Organizational change: Relationship between reactions, behaviour and
organizational performance. Journal of Organizational Change Management, 7(5), 41-55.
Locatelli, V., & West, M. A. (1996). On elephants and blind researchers: Methods fro
accessing culture in organizations. Leadership & Organization Development Journal, 17(7), 12-21.
Lundberg, C. C. (1990). Surfacing organisational culture. Journal of Managerial Psychology,
5(4), 19-26.

169
Mallak, L. A., Lyth, D. M., Olson, S. D., Ulshafer, S. M., & Sardone, F. J. (2004). Diagnosing culture in health-care organizations using critical incidents. International Journal of Health Care Quality Assurance, 16(4), 180-190.
Marcoulides, G. A., & Heck, R. H. (1993). Organizational culture and performance:
Proposing and testing a model. Organization Science, 4(2), 209-225. Mark, K., & Crossan, M. (2002). WestJet airlines: The culture that breeds a passion to
succeed. Ivey Business Journal, 66(4), 60-71. Martin, J., & Siehl, C. (1983). Organizational culture and counterculture: An uneasy
symbiosis. Organizational Dynamics, 12(2), 52-64. Maull, R., Brown, P., & Cliffe, R. (2001). Organizational culture and quality improvement.
International Journal of Operations & Production Management, 21(3), 302-326. McDonald, P., & Gandz, J. (1992). Getting value from shared values. Organizational
Dynamics, 20(3), 64-77. Meglino, B. M., & Ravlin, E. C. (1998). Individual values in organizations: Concepts,
controversies, and research. Journal of Management, 24(3), 351-389. O'Reilly, C. A., III. (1989). Corporations, culture, and commitment: Motivation and social
control in organizations. California Management Review, 31(4), 9-25. O'Reilly, C. A., III, & Chatman, J. (1996). Culture as social control: Corporations, cults and
commitment. In Staw, B. & Cummings, L. (Eds.), Research in organizational behaviour (Vol. 18, pp. 157-200). Geenwitch, CT: JAI Press.
O'Reilly, C. A., III, Chatman, J., & Caldwell, D. F. (1991). People and organizational culture:
A profile comparison approach to assessing person-organization fit. Academy of Management Journal, 34(3), 487-516.
Ogbonna, E., & Harris, L. C. (2000). Leadership style, organizational culture and
performance: Empirical evidence from UK companies. International Journal of Human Resource Management, 11(4), 766-788.
Ott, J. S. (1989). The organizational culture prespective. Pacific Grove, CA: Brooks/Cole. Ouchi, W. G. (1981). Theory Z: How American business can meet the Japanese challenge.
Reading, MA: Addison-Wesley. Ouchi, W. G., & Price, R. L. (1978). Hierarchies, clans, and Theory Z: A new perspective on
organization development. Organizational Dynamics, 7(2), 24-44. Ouchi, W. G., & Wilkins, A. L. (1985). Organizational culture. Annual Review of Sociology,
11(1), 457-483. Pascale, R. T., & Athos, A. G. (1981). The art of Japanese management. New York, NY:
Penguin.

170
Peters, T. J., & Waterman, R. H. (1982). In search of excellence: lessons from America's best-run companies. New York: Harper & Row.
Pettigrew, A. M. (1979). On studying organizational cultures. Administrative Science
Quarterly, 24(4), 570-581. Pfeffer, J. (1995). Producing sustainable competitive advantage through the effective
management of people. Academy of Management Executive, 9(1), 55-69. Pine, G. J., & Innis, G. (1987). Cultural and individual work values. The Career Development
Quarterly, 35(4), 279-287. Posner, B. Z., Kouzes, J. M., & Schmidt, W. H. (1985). Shared values make a difference: An
empirical test of corporate culture. Human Resource Management, 24(3), 293-310. Posner, B. Z., & Munson, J. M. (1979). The importance of values in understanding
organizational behaviour. Human Resource Management, 18(3), 9-14. Posner, B. Z., & Schmidt, W. H. (1984). Values and the American manager: An update.
California Management Review, 26(3), 202-216. Posner, B. Z., & Schmidt, W. H. (1992). Values and the American manager: An update
updated. California Management Review, 34(3), 80-94. QSR International - N6 & NVivo. (2006). Retrieved November 15, 2006, from
http://www.qsrinternational.com/products/productoverview/product_overview.htm Quick, J. C. (1992). Crafting an Organizational Culture: Herb's Hand at Southwest Airlines.
Organizational Dynamics, 21(2), 45-56. Quinn, R. E., & Cameron, K. S. (1983). Organizational life cycles and some shifting citeria of
effectiveness: Some preliminary evidence. Management Science, 29(1), 31-51. Quinn, R. E., & Rohrbaugh, J. (1981). A competing values approach to organizational
effectiveness. Public Productivity Review(June), 122-140. Quinn, R. E., & Rohrbaugh, J. (1983). A spatial model of effectiveness criteria: towards a
competing values approach to organizational analysis. Management Science, 29(3), 363-377.
Quinn, R. E., & Spreitzer, G. M. (1991). The psychometrics of the competing values culture
instrument and an analysis of the impact of organizational culture on quality of life. In Woodman, R. W. & Passmore, W. A. (Eds.), Research in organizational change and development (Vol. 5, pp. 115-142). Greenwich, CT: JAI Press.
Ralston, D. A., Holt, D. H., Terpstra, R. H., & Kai-Cheng, Y. (1997). The impact of national
culture and economic ideology on managerial work values: A study of the United States, Russia, Japan, and China. Journal of International Business Studies, 28(1), 177-207.

171
Rashid, M. Z. A., Sambasivan, M., & Johari, J. (2003). The influence of corporate culture and organisational commitment on performance. Journal of Management Development, 22(8), 708-728.
Rokeach, M. (1973). The nature of human values. New York: Free Press. Rousseau, D. M. (1990). Assessing organizational culture: The case for multiple methods. In
Schneider, B. (Ed.), Organizational climate and culture (pp. 153-192). San Francisco: Jossey-Bass.
Sackmann, S. A. (1991). Uncovering culture in organizations. Journal of Applied Behavioral
Science, 27(3), 295-317. Sadri, G., & Lees, B. (2001). Developing corporate culture as a competitive advantage.
Journal of Management Development, 20(10), 853-859. Saffold, G. S., III. (1988). Culture traits, strength, and organizational performance: Moving
beyond 'strong' culture. Academy of Management Review, 13(4), 546-559. Salama, A., & Easterby-Smith, M. (1994). Cultural Change and Managerial Careers.
Personnel Review, 23(3), 21 - 33. Sathe, V. (1983). Implications of corporate culture: A manager's guide to action.
Organizational Dynamics, 12(2), 5-23. Schein, E. H. (1981). Does Japanese management style have a message for American
managers? Sloan Management Review, 23(1), 55-68. Schein, E. H. (1983). The role of the founder in creating organisational cultures.
Organisational Dynamics, 12(1), 13-29. Schein, E. H. (1984). Coming to a new awareness of organizational culture. Sloan
Management Review, 25(2), 3-16. Schein, E. H. (1985a). How culture forms, develops, and changes. In Kilmann, R. H., Saxton,
M. J. & Serpa, R. (Eds.), Gaining control of the corporate culture. San Francisco: Jossey-Bass.
Schein, E. H. (1985b). Organizational culture and leadership. San Francisco: Jossey-Bass
Inc. Schein, E. H. (1990). Organizational culture. American Psychologist, 45(2), 109-119. Schein, E. H. (1992). Organizational culture and leadership (2nd ed.). San Francisco: Jossey-
Bass Inc. Schein, E. H. (1996). Three cultures of management: The key to organizational learning.
Sloan Management Review, 38(1), 9-20.

172
Schultz, M., & Hatch, M. J. (1996). Living with multiple paradigms: The case of paradigm interplay in organizational culture studies. Academy of Management Review, 21(2), 529-557.
Schwartz, H., & Davis, S. M. (1981). Matching corporate culture and business strategy.
Organizational Dynamics, 10(1), 30-48. Schwartz, S. H. (1992). Universals in the content and structure of values: Theoretical
advances and empirical tests in 20 countries. In Zanna, M. P. (Ed.), Advances in Experimental Social Psychology (Vol. 25, pp. 1-65). San Diego, CA: Academic Press.
Seal, J., & Kleiner, B. H. (1999). Managing human behaviour in the airline industry.
Management Research News, 22(2/3), 1 - 64. Silverzweig, S., & Allen, F. R. (1976). Changing the corporate culture. Sloan Management
Review, 17(3), 33-49. Smircich, L. (1983). Concepts of culture and organizational analysis. Administrative Science
Quarterly, 28(3), 339-358. Smircich, L., & Calás, M. B. (1987). Organizational culture: A critical assessment. In Jablin,
F. M., Putnam, L. L., Roberts, K. & Porter, L. (Eds.), Handbook of organizational communication: An interdisciplinary perspective (pp. 228-263). Newbury Park, CA: Sage.
Smith, G. (2004). An evaluation of the corporate culture of Southwest Airlines. Measuring
Business Excellence, 8(4), 26 - 33. Southwest Airlines - A brief history. (2005). Southwest Airlines Retrieved 25th October,
2006, from http://www.southwest.com/about_swa/airborne.html Stackman, R. W., Pinder, C. C., & Connor, P. E. (2000). Values lost: Redirecting research on
values in the workplace. In Ashkanasy, N. M., Wilderom, C. P. M. & Peterson, M. F. (Eds.), Handbook of organizational culture and climate (pp. 37-54). Thousand Oaks, CA: Sage.
Stake, R. E. (1995). The art of case study research. Thousand Oaks, CA: Sage. Stake, R. E. (2000). Case studies. In Denzin, N. K. & Lincoln, Y. S. (Eds.), Handbook of
qualitative research. Thousand Oaks, CA: Sage. Steers, R. M. (1975). Problems in the measurement of organizational effectiveness.
Administrative Science Quarterly, 20(4), 546-558. Stonehouse, G. H., & Pemberton, J. D. (1999). Learning and knowledge management in the
intelligent organisation. Participation and Empowerment: An International Journal, 7(5), 131 - 144.
Sørensen, J. B. (2002). The strength of corporate culture and the reliability of firm
performance. Administrative Science Quarterly, 47(1), 70-91.

173
Trice, H. M., & Beyer, J. M. (1993). The culture of work organizations. Englewood Cliffs, NJ: Prentice-Hall.
van der Post, W. Z., de Coning, T. J., & Smit, E. v. (1998). The relationship between
organizational culture and financial performance: Some South African evidence. South African Journal of Business Management, 29(1), 30-41.
Van Maanen, J. (1979). The fact of fiction in organizational ethnography. Administrative
Science Quarterly, 24(4), 539-550. Weinstein, M. (2006). Out of the blue. Training, 43, 22-26. Weiss, A. (1984). Simple truths of Japanese manufacturing. Harvard Business Review, 62(4),
119-125. Whipp, R., Rosenfeld, R., & Pettigrew, A. M. (1989). Culture and competitiveness: Evidence
from two mature UK industries. Journal of Management Studies, 26(6), 561-585. Wiener, Y. (1988). Forms of value systems: A focus on organizational effectiveness and
cultural change and maintenance. Academy of Management Review, 13(4), 534-545. Wilderom, C. P. M., Glunk, U., & Maslowski, R. (2000). Organizational culture as a predictor
of organizational performance. In Ashkanasy, N. M., Wilderom, C. P. M. & Peterson, M. F. (Eds.), Handbook of organizational culture and climate (pp. 193-209). Thousand Oaks, CA: Sage.
Wilkins, A. L. (1983). The culture audit: a tool for understanding organizations.
Organizational Dynamics, 12(2), 24-38. Wright, P., Theerathorn, P., Tu, H., Gilmore, J. B., & Lado, A. (1992). Top managers,
organizational culture, and strategic profiles: Implications for business performance. American Business Review, 10(2), 25-37.
Yeung, A. K. O., Brockbank, J. W., & Ulrich, D. O. (1991). Organizational culture and
human resource practices: An empirical assessment. In Woodman, R. W. & Passmore, W. A. (Eds.), Research in organizational change and development (Vol. 5, pp. 59-81). Greenwich, CT: JAI Press.
Yin, R. K. (1994). Case study research: Design and methods. Thousand Oaks, CA: Sage. Zammuto, R. F., & Krakower, J. Y. (1991). Quantitative and qualitative studies of
organizational culture. In Woodman, R. W. & Passmore, W. A. (Eds.), Research in organizational change and development (Vol. 5, pp. 83-114). Greenwich, CT: JAI Press.

174
Questions marked with a * are required
Dear Pukeko Air Ltd. employee: You are invited to participate in a survey on organisational culture in Pukeko Air Ltd. In this survey, employees are being asked to answer questions concerning perceptions of the company's organisational culture and values. The researcher is a final year Master of Business [MBus] student at Unitec New Zealand in Auckland and this research project is prepared in partial satisfaction of the requirements of this degree. Your participation in this study is completely voluntary. However, I hope you choose to participate as this will provide valuable information for my research project and results that can be of benefit to the company. Your survey responses will be strictly confidential and data from this research will be reported only in a summary report. If you have questions at any time about the survey or the procedures you may contact me, the researcher, Cato Saele on 021 XXX XXXX or by email [email protected], or my supervisor Dr. Noel Burchell at [email protected]. It will take approximately 15 minutes to complete the questionnaire. It consists of three sections and you can follow your progress on top of the page. Thank you very much for your time and support. Please start with the survey now by clicking on the Continue button below.
PART 1: DEMOGRAPHICAL DATA This information will only be available to the researcher and your answers will not be used in any way that will identify you as an individual.
Please indicate your gender
Male Female
APPENDIX 1: ORGANISATIONAL CULTURE ASSESSMENT INSTRUMENT, AS USED IN THE CASE ORGANISATION

175
Please indicate your age
18-29 30-39 40 +
Please indicate how you first entered the organisation
Through A Through B Through C
Please indicate your number of years with the XYZ group of organisations (A, B, and C)
< 1 years 1 to < 4 years 4 years +
Your position in the organisation is characterised as
Management Non-management
Please indicate your department
A B C D E Other
PART 2: ORGANISATIONAL CULTURE ASSESSMENT In completing this questionnaire, you are providing information that will be used to develop a picture of your organisation’s culture and values. There are no right or wrong answers. Please answer the questions based on your experience of the company and just be as accurate as you can. This section consists of six questions. Each question has four alternatives. Allocate the 100 points among these four alternatives based on your perceptions of the current situation in your company. For example, in question one, if you think alternative A is very strong in your organisation, alternative B and C are somewhat less but similar, and alternative D is hardly present at all, you might give 55 points to A, 20 points to B and C, and five points to D. Just

176
be sure your total equals 100 points for each question. HINT: After filling in three of the four alternatives, the fourth one will be calculated automatically in most web-browsers! Dominant Characteristics * A. The organisation is a very personal place. It is like an extended family. People seem to share a lot of themselves. NOW
B. The organisation is a very dynamic entrepreneurial place. People are willing to stick their necks out and take risks. NOW
C. The organisation is very results oriented. A major concern is with getting the job done. People are very competitive and achievement oriented. NOW
D. The organisation is a very controlled and structured place. Formal procedures generally govern what people do. NOW
0 Values must add up to 100
Organisational Leadership * A. The leadership in the organisation is generally considered to exemplify mentoring, facilitating, or nurturing. NOW
B. The leadership in the organisation is generally considered to exemplify entrepreneurship, innovating, or risk taking. NOW
C. The leadership in the organisation is generally considered to exemplify a no-nonsense, aggressive, results-oriented focus. NOW
D. The leadership in the organisation is generally considered to exemplify coordinating, organising, or smooth-running efficiency. NOW
0 Values must add up to 100
Management of Employees * A. The management style in the organisation is characterised by teamwork, consensus, and participation. NOW
B. The management style in the organisation is characterised by individual risk-taking, innovation, freedom, and uniqueness. NOW
C. The management style in the organisation is characterized by hard-driving competitiveness, high demands, and achievement. NOW
D. The management style in the organisation is characterised by security of employment, conformity, predictability, and stability in relationships. NOW
0 Values must add up to 100

177
Organisation Glue * A. The glue that holds the organisation together is loyalty and mutual trust. Commitment to this organisation runs high. NOW
B. The glue that holds the organisation together is commitment to innovation and development. There is an emphasis on being on the cutting edge. NOW
C. The glue that holds the organisation together is the emphasis on achievement and goal accomplishment. Aggressiveness and winning are common themes. NOW
D. The glue that holds the organisation together is formal rules and policies. Maintaining a smooth-running organisation is important. NOW
0 Values must add up to 100
Strategic Emphases *
A. The organisation emphasises human development. High trust, openness, and participation persist. NOW
B. The organisation emphasises acquiring new resources and creating new challenges. Trying new things and prospecting for opportunities are valued. NOW
C. The organisation emphasizes competitive actions and achievement. Hitting stretch targets and winning in the marketplace are dominant. NOW
D. The organisation emphasises permanence and stability. Efficiency, control and smooth operations are important. NOW
0 Values must add up to 100
Criteria of Success * A. The organisation defines success on the basis of the development of human resources, teamwork, employee commitment, and concern for people. NOW
B. The organisation defines success on the basis of having the most unique or newest products. It is a product leader and innovator. NOW
C. The organisation defines success on the basis of winning in the marketplace and outpacing the competition. Competitive market leadership is key. NOW
D. The organisation defines success on the basis of efficiency. Dependable delivery, smooth scheduling and low-cost production are critical. NOW
0 Values must add up to 100
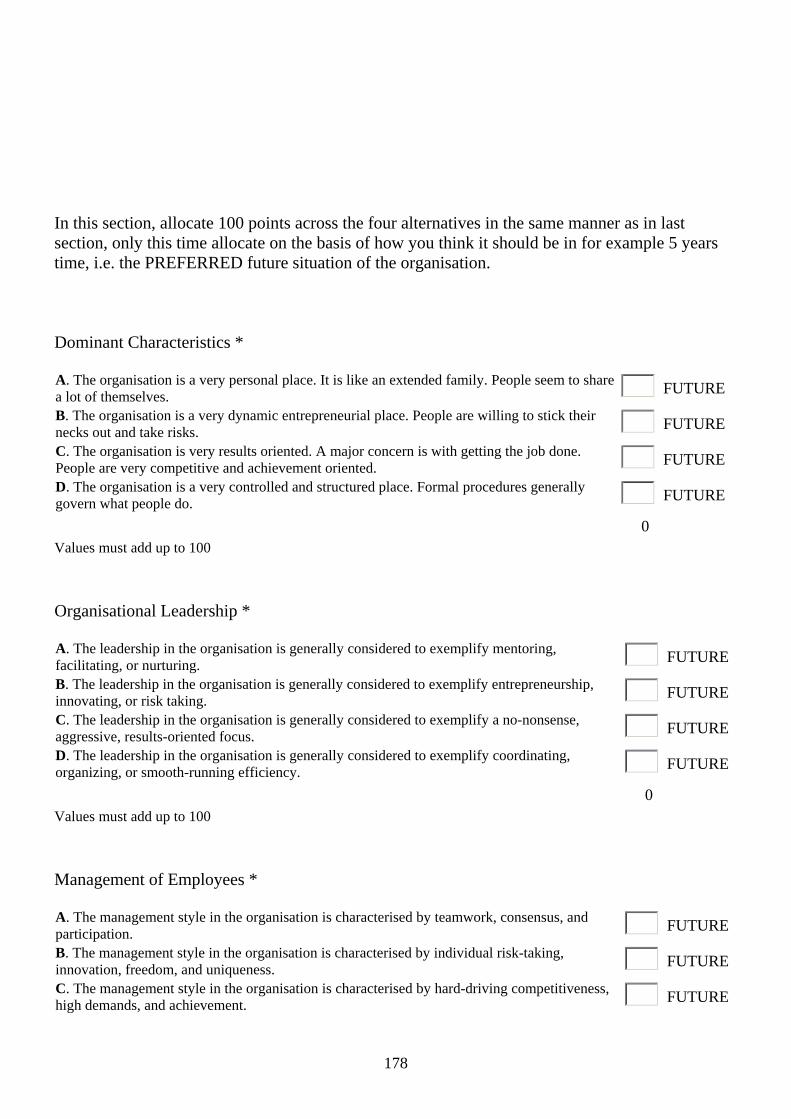
178
In this section, allocate 100 points across the four alternatives in the same manner as in last section, only this time allocate on the basis of how you think it should be in for example 5 years time, i.e. the PREFERRED future situation of the organisation.
Dominant Characteristics * A. The organisation is a very personal place. It is like an extended family. People seem to share a lot of themselves. FUTURE
B. The organisation is a very dynamic entrepreneurial place. People are willing to stick their necks out and take risks. FUTURE
C. The organisation is very results oriented. A major concern is with getting the job done. People are very competitive and achievement oriented. FUTURE
D. The organisation is a very controlled and structured place. Formal procedures generally govern what people do. FUTURE
0 Values must add up to 100
Organisational Leadership * A. The leadership in the organisation is generally considered to exemplify mentoring, facilitating, or nurturing. FUTURE
B. The leadership in the organisation is generally considered to exemplify entrepreneurship, innovating, or risk taking. FUTURE
C. The leadership in the organisation is generally considered to exemplify a no-nonsense, aggressive, results-oriented focus. FUTURE
D. The leadership in the organisation is generally considered to exemplify coordinating, organizing, or smooth-running efficiency. FUTURE
0 Values must add up to 100
Management of Employees * A. The management style in the organisation is characterised by teamwork, consensus, and participation. FUTURE
B. The management style in the organisation is characterised by individual risk-taking, innovation, freedom, and uniqueness. FUTURE
C. The management style in the organisation is characterised by hard-driving competitiveness, high demands, and achievement. FUTURE

179
D. The management style in the organisation is characterised by security of employment, conformity, predictability, and stability in relationships. FUTURE
0 Values must add up to 100
Organisation Glue * A. The glue that holds the organisation together is loyalty and mutual trust. Commitment to this organisation runs high. FUTURE
B. The glue that holds the organisation together is commitment to innovation and development. There is an emphasis on being on the cutting edge. FUTURE
C. The glue that holds the organisation together is the emphasis on achievement and goal accomplishment. Aggressiveness and winning are common themes. FUTURE
D. The glue that holds the organisation together is formal rules and policies. Maintaining a smooth-running organisation is important. FUTURE
0 Values must add up to 100
Strategic Emphases * A. The organisation emphasises human development. High trust, openness, and participation persist. FUTURE
B. The organisation emphasises acquiring new resources and creating new challenges. Trying new things and prospecting for opportunities are valued. FUTURE
C. The organisation emphasises competitive actions and achievement. Hitting stretch targets and winning in the marketplace are dominant. FUTURE
D. The organisation emphasises permanence and stability. Efficiency, control and smooth operations are important. FUTURE
0 Values must add up to 100
Criteria of Success * A. The organisation defines success on the basis of the development of human resources, teamwork, employee commitment, and concern for people. FUTURE
B. The organisation defines success on the basis of having the most unique or newest products. It is a product leader and innovator. FUTURE
C. The organisation defines success on the basis of winning in the marketplace and outpacing the competition. Competitive market leadership is key. FUTURE
D. The organisation defines success on the basis of efficiency. Dependable delivery, smooth scheduling and low-cost production are critical. FUTURE
0 Values must add up to 100

180
PART 3: SHARED VALUE CONCEPTS In this section you are going to choose EIGHT of the 24 values listed below, and tick the box next to it if you feel this value CURRENTLY most applies to Pukeko Air Ltd. Repeat the same step with regards to the values that you think best represent the PREFERRED future situation. You can choose the same eight values if you believe these are the most important for the future, or a whole new set – as long as the total in each column comes to no more than EIGHT. When you have completed this section, please recount the number of ticks one last time to ensure you have only chosen eight (8).
VALUES CURRENTLY
EXISTING IN THE
ORGANISATION
PREFERRED FUTURE VALUES OF THE
ORGANISATION ADAPTABILITY - Being flexible and changing in response to new circumstances
ASSERTIVENESS - Being assertive and pursing goals vigorously
AUTONOMY - Being independent and free to act BROAD-MINDEDNESS - Accepting different viewpoints and opinions
CAUTIOUSNESS - Being cautious and minimizing exposure to risk
CONSIDERATION - Being caring, kind and considerate COOPERATION - Being cooperative and working well with others
COURTESY - Being polite and having respect for individual dignity
CREATIVITY - Developing new ideas and applying innovative approaches

181
DEVELOPMENT - Achieving personal growth, learning and development
DILIGENCE - Working long and hard to achieve results ECONOMY - Being thrifty and careful in spending EXPERIMENTATION - Taking a trial and error approach to problem solving
FAIRNESS - Being fair and providing just recognition based on merit
FORGIVENESS - Being forgiving and understanding when errors occur
FORMALITY - Upholding proper ceremony and maintaining tradition
HUMOR - Creating fun and being light-hearted INITIATIVE - Seizing opportunity and taking responsibility without hesitation
LOGIC - Being rational and thinking in terms of facts and figures
MORAL INTEGRITY - Being honourable and following ethical principles
OBEDIENCE - Complying with directions and conforming to rules
OPENNESS - Being straightforward, sincere and candid in discussions
ORDERLINESS - Being neat, tidy and well-organized SOCIAL EQUALITY - Being equal to others and avoiding status differences

182
Strongly Agree
Agree Neutral Disagree Strongly Disagree
Organisational culture is important to the performance of Pukeko Air Ltd. *
Strongly Agree
Agree Neutral Disagree Strongly Disagree
Organisational values are important for sustaining success at Pukeko Air Ltd. *
Please take the opportunity to give me some additional feedback on any matters relating to the culture or values of the organisation, or culture and values in general.
Please contact [email protected] if you have any questions regarding this survey.

183
ADAPTABILITY - Being flexible and changing in response to new circumstances ASSERTIVENESS - Being assertive and pursing goals vigorously AUTONOMY - Being independent and free to act BROAD-MINDEDNESS - Accepting different viewpoints and opinions CAUTIOUSNESS - Being cautious and minimizing exposure to risk CONSIDERATION - Being caring, kind and considerate COOPERATION - Being cooperative and working well with others COURTESY - Being polite and having respect for individual dignity CREATIVITY - Developing new ideas and applying innovative approaches DEVELOPMENT - Achieving personal growth, learning and development DILIGENCE - Working long and hard to achieve results ECONOMY - Being thrifty and careful in spending EXPERIMENTATION - Taking a trial and error approach to problem solving FAIRNESS - Being fair and providing just recognition based on merit FORGIVENESS - Being forgiving and understanding when errors occur FORMALITY - Upholding proper ceremony and maintaining tradition HUMOR - Creating fun and being light-hearted INITIATIVE - Seizing opportunity and taking responsibility without hesitation LOGIC - Being rational and thinking in terms of facts and figures MORAL INTEGRITY - Being honourable and following ethical principles OBEDIENCE - Complying with directions and conforming to rules OPENNESS - Being straightforward, sincere and candid in discussions ORDERLINESS - Being neat, tidy and well-organized SOCIAL EQUALITY - Being equal to others and avoiding status differences
APPENDIX 2 – DEFINITION OF ORGANISATIONAL VALUES ACCORDING TO MCDONALD AND GANDZ (1992)

184
APPENDIX 3: INTERVIEW QUESTIONS
EXAMPLES OF STARTING POINTS FOR DISCUSSION WITH THE ORGANISATION’S MANAGEMENT
• How relevant is the “organisational culture concept” to the airline industry today?
What role do you think it has to play in New Zealand airlines?
• OCAI plot diagram: Looking at this diagram you can see that the organisation is
relatively stable with the current situation as opposed to the preferred future
situation. Why do you think this is the case (all the changes happening taken into
consideration)? Can you see (reading the brief descriptions on handout) any
explanation why the future situation should be positioned more towards the A and B
quadrants?
• Values diagram Top and Bottom 10: Look at the Top 10 organisational values -
Why do you think can be the reason for the significant changes in values such as
Broad-mindedness, and Development? Can you see any explanation for the decrease
in values such as Experimentation, Obedience, and Diligence?
• How do you perceived the relationship between organisational culture and values,
and organisational performance in this firm, from your point of view as a senior staff
member? Could you give an example?
• Finally, can you give an example of when the organisations unique culture and/or
values has helped it through a particular crisis/problem/transition, or had a positive
impact on performance in this organisation?

185
APPENDIX 4: EXAMPLE OF WORKSHEET FOR SCORING THE OCAI
NOW Scores PREFERRED Scores 0 1A 0 1B 20 1A 20 1B 0 2A 0 2B 50 2A 20 2B
30 3A 10 3B 60 3A 10 3B 40 4A 10 4B 60 4A 10 4B 20 5A 20 5B 50 5A 10 5B 30 6A 20 6B 60 6A 20 6B
120 Sum A 60 Sum B 300 Sum A 90 Sum B 20 Average 10 Average 50 Average 15 Average
20 1C 80 1D 10 1C 50 1D 20 2C 80 2D 0 2C 30 2D 10 3C 50 3D 10 3C 20 3D 0 4C 50 4D 0 4C 30 4D
20 5C 40 5D 20 5C 20 5D 20 6C 30 6D 10 6C 10 6D 90 Sum C 330 Sum D 50 Sum C 160 Sum D 15 Average 55 Average 8,3333 Average 26,6667 Average