lia c. chasar, barbara c. scudder, a. robin stewart, amanda … · mercury cycling in stream...
TRANSCRIPT

Full text access provided via ACS AuthorChoice
Environmental Science & Technology is published by the American ChemicalSociety. 1155 Sixteenth Street N.W., Washington, DC 20036
Article
Mercury Cycling in Stream Ecosystems. 3. TrophicDynamics and Methylmercury Bioaccumulation
Lia C. Chasar, Barbara C. Scudder, A. Robin Stewart, Amanda H. Bell, and George R. AikenEnviron. Sci. Technol., 2009, 43 (8), 2733-2739• DOI: 10.1021/es8027567 • Publication Date (Web): 11 March 2009
Downloaded from http://pubs.acs.org on May 7, 2009
More About This Article
Additional resources and features associated with this article are available within the HTML version:
• Supporting Information• Links to the 2 articles that cite this article, as of the time of this article download• Access to high resolution figures• Links to articles and content related to this article• Copyright permission to reproduce figures and/or text from this article

Mercury Cycling in StreamEcosystems. 3. Trophic Dynamicsand Methylmercury BioaccumulationL I A C . C H A S A R , * , †
B A R B A R A C . S C U D D E R , ‡
A . R O B I N S T E W A R T , § A M A N D A H . B E L L , ‡
A N D G E O R G E R . A I K E N |
U.S. Geological Survey, Florida Integrated Science Center,2639 North Monroe Street, Suite A-200, Tallahassee,Florida 32303, U.S. Geological Survey, Wisconsin WaterScience Center, 8505 Research Way, Middleton, Wisconsin53562, U.S. Geological Survey, National Research Program,345 Middlefield Road, Menlo Park, California 94025, and U.S.Geological Survey, National Research Program, 3215 MarineStreet, Suite E-127, Boulder, Colorado 80303
Received September 29, 2008. Revised manuscript receivedJanuary 27, 2009. Accepted February 3, 2009.
Trophic dynamics (community composition and feedingrelationships) have been identified as important drivers ofmethylmercury (MeHg) bioaccumulation in lakes, reservoirs,and marine ecosystems. The relative importance of trophicdynamics and geochemical controls on MeHg bioaccumulationin streams, however, remains poorly characterized. MeHgbioaccumulation was evaluated in eight stream ecosystemsacrosstheUnitedStates(Oregon,Wisconsin,andFlorida)spanninglarge ranges in climate, landscape characteristics, atmosphericHg deposition, and stream chemistry. Across all geographicregions and all streams, concentrations of total Hg (THg) in toppredator fish and forage fish, and MeHg in invertebrates,were strongly positively correlated to concentrations of filteredTHg (FTHg), filtered MeHg (FMeHg), and dissolved organiccarbon (DOC); to DOC complexity (as measured by specificultraviolet absorbance); and to percent wetland in the streambasins. Correlations were strongest for nonurban streams.Although regressions of log[Hg] versus δ15N indicate that Hgin biota increased significantly with increasing trophic positionwithin seven of eight individual streams, Hg concentrationsin top predator fish (including cutthroat, rainbow, and browntrout; green sunfish; and largemouth bass) were not stronglyinfluenced by differences in relative trophic position. Slopes oflog[Hg] versus δ15N, an indicator of the efficiency of trophicenrichment, ranged from 0.14 to 0.27 for all streams. These datasuggest that, across the large ranges in FTHg (0.14-14.2 ngL-1), FMeHg (0.023-1.03 ng L-1), and DOC (0.50-61.0 mg L-1)found in thisstudy,Hgcontamination in toppredatorfish instreamslikely is dominated by the amount of MeHg available foruptake at the base of the food web rather than by differencesin the trophic position of top predator fish.
Introduction
Because exposure to and uptake of mercury by fauna inaquatic ecosystems is primarily dietary (1, 2), Hg bioaccu-mulation must be evaluated in terms of (1) the quantity andchemical forms of Hg available to the base of aquatic foodwebs (3, 4) and (2) its transfer to successively higher trophiclevels (5). The physicochemical factors that mediate Hgsource, bioavailability, and bioaccumulation have beeninvestigated primarily in lakes and reservoirs, where elevatedHg levels in biota have been associated with wetlands,fluctuating water levels, low pH, and high levels of dissolvedorganic carbon (DOC). Studies of trophic transfer of Hg inlakes with similar environmental settings and Hg loadingrates suggest that both community complexity and the trophicpathway (pelagic versus benthic) drive the extent of meth-ylmercury (MeHg) accumulation in top consumers, such aspiscivorous fish (6-8). The apparent association of the degreeof MeHg bioaccumulation in aquatic biota with communitystructure and function may be driven by food chain length,efficiency of the trophic transfer of Hg, or differences in thesupply and availability of Hg. Studies conducted by VanderZanden and Rasmussen (8) and Stewart et al. (9) havedemonstrated that, for several lakes and reservoirs, theamount of Hg available to the food web base was the bestpredictor of Hg in top predator fish for both pelagic andbenthic food webs. Recent stream studies have suggestedthat processes associated with mercury bioaccumulation instream ecosystems may be similar to those in lakes (10, 11),but these studies have been limited in scope with respect tospatial and temporal coverage, environmental setting, andecology. More extensive temporal and spatial studies arenecessary to better understand the relative roles of com-munity complexity, trophic pathway, and water and sedimentgeochemistrytoMeHgbioaccumulationinstreamecosystems.
Streams are often more responsive than lakes to season-ality and local physical disturbance. Large fluctuations inflow, water chemistry, and bed sediment redox conditionsin stream ecosystems make it difficult to associate discretebed sediment and water samples with biota that integrateHg over varying ranges of time and space (12, 13). Additionaluncertainties in interpreting Hg concentrations in highertrophic level fish in streams may be generated by intraspecificdifferences in life stage and physical condition, high levelsof omnivory and opportunistic feeding, and migration (14).
We evaluated Hg concentrations in aquatic biota inrelation to water chemistry over a period of 3 years in streamsspanning a range of environmental conditionssincludingatmospheric Hg deposition, contributing area of wetlands,amount of urbanization, and productivitysacross the UnitedStates. This allowed us to assess seasonal and interannualvariability in chemical constituents of interest [such as totalHg (THg), MeHg, DOC, nutrients, major ions] and to estimatethe integrated environmental Hg exposure to aquatic biota.We also analyzed Hg concentrations and stable C and Nisotopes [as indicators of carbon source (δ13C) and trophicposition (δ15N)] in the tissue of aquatic biota to establish atemporally and spatially relevant assessment of food webcomplexity and trophic transfer of MeHg. The generalobjective of this study was to assess the relative roles ofgeochemistry and ecology in determining MeHg bioaccu-mulation in stream ecosystems. More specifically, we ex-amined Hg in aquatic organisms spanning a range of trophicpositions to determine the relative importance of fluvialMeHg concentrations and food-web structure among sites.
* Corresponding author phone: 850-553-3649; e-mail:[email protected].
† USGS, Tallahassee, FL.‡ USGS, Middleton, WI.§ USGS, Menlo Park, CA.| USGS, Boulder, CO.
Environ. Sci. Technol. 2009, 43, 2733–2739
10.1021/es8027567 Not subject to U.S. Copyright. Publ. 2009 Am. Chem. Soc. VOL. 43, NO. 8, 2009 / ENVIRONMENTAL SCIENCE & TECHNOLOGY 9 2733
Published on Web 03/11/2009

Experimental DesignStudy areas were located in Oregon, Wisconsin, and Florida.Eight streams (one urban and one or two nonurban in eachstudy area) were selected to represent wide ranges in basinsize, landscape type, streamwater chemistry (Table 1; Sup-porting Information Table S1), and atmospheric Hg loading(15, 16). Nonurban streams were selected to represent a rangein wetland coverage (Table 1) within each geographic studyarea. Urban sites (Portland, OR; Milwaukee, WI; Orlando,FL) were characterized as areas of rapid growth (17).
Naturally occurring stable isotopes (δ13C, δ15N) were usedto identify carbon sources and describe site-specific feedingrelationships for aquatic biota. However, while stable C andN isotope ratios have been used successfully in defininglinkages between trophic dynamics and contaminant bio-accumulation in lakes and marine systems (5, 18), theirapplication in stream systemsswhere source carbon andnitrogen isotopic ratios change over small spatial andtemporal scales (19, 20)shas been limited. In continuouslinear systems, such as streams, the use of stable C and Nisotopes as diet indicators must be grounded by informationon differences in source (food-web base) isotopic ratios bothwithin and among systems. In the current study, bioaccu-mulation of Hg with successively higher trophic levels wasevaluated using stream-specific regressions of log[Hg] versusδ15N for aquatic food webs after establishing differences inbase-level production within and among streams.
Aquatic Biota. Biological protocols for sample collectionand processing are summarized here; they are described indetail by Scudder et al. (21). In each stream, sampling focusedon two species of aquatic macroinvertebrates (one herbivoreand one detritivore or omnivore), two species of midtrophic-level forage fish (primarily omnivores), and one species ofpiscivorous top predator fish. Invertebrate herbivores (graz-ers) included snails and baetid mayfly larvae; herbivore/detritivores and omnivores (grazer-gatherers) included am-phipods, midge larvae, ephemerellid mayfly larvae, caddisflylarvae, grass shrimp, and crayfish. It was not possible to collect(1) sufficient numbers of the same invertebrate taxa acrossall seasons within specific streams or (2) the same taxa amongall streams. Forage fish included mosquitofish, shiners,
killifish, chubs, sculpin, dace, and juvenile sunfish. Toppredators included largemouth bass, trout (cutthroat, rain-bow, and brown), and green sunfish. These specific taxa weretargeted in an attempt to collect species that were trophicallylinked and functionally equivalent within each trophiccategory (invertebrates, forage fish, and predator fish) acrossall streams, and selections were based on existing local orregional literature describing community structure, diet, andlife history (22).
The timing, frequency, and intensity of biological samplingfor each trophic category were selected on the basis ofestimates of lifespan and tissue turnover for each functionalfeeding group, that is, weeks to months for invertebrates,months to years for forage fish, and multiple years for toppredator fish (12, 23). Lower trophic levels (invertebratesand forage fish) were collected in both the spring and fall of2003 to capture seasonality in forage or prey items that toppredators were likely consuming during the active summerseason. Invertebrates [three composites of approximately30-120 individuals each (per species), except 4-12 for largercrayfish] and forage fish (12-24 individuals per species) werecollected during streamwater sampling visits. Most predatorfish were collected once in the second or third year of thestudy (summer or fall of 2003 or 2004) to allow the associationof fish Hg concentrations with preceding multiyear stream-water data. Size-age relationships developed by localresource-management agencies were used to guide thecollection of predator fish in a 3- to 4-year age range (6-12individuals per species). All biota were processed the day ofcollection (with no depuration period) and frozen untilanalysis. Forage fish were processed whole (minus head andgut tract), and top predator fish were filleted for analysis ofskinless axial muscle. Sagittal otoliths were removed andsubmitted to the U.S. Geological Survey (USGS) CooperativeWildlife Research Unit Laboratory at Clemson University inClemson, South Carolina, for age determination.
Invertebrate composites were freeze-dried, pulverized,and analyzed for MeHg by the USGS Wisconsin MercuryResearch Laboratory, Middleton, Wisconsin (15). Hg in fishtissue is predominantly MeHg [>95% (24)], so tissue samplesfrom individual fish were freeze-dried, pulverized, and
TABLE 1. Study Streams, Basin Characteristics (16), and Selected Chemistry [mean(coefficient of variation)] for All Stream Waterand Biological Samples Collected during 2002-2004a
a N represents numbers of individual samples for surface water (Nsw) and predator fish (Npf) and numbers of spatial/temporal composites for invertebrates (Ninv) and forage fish (Nff). Detailed stream water chemistry and species-specificbiological data (including % moisture for wet weight THg determinations) are presented in refs 22 and 27 and SupportingInformation Tables S1 and S2. b For streams with values of FMeHg < method detection limit (MDL), means were calculatedas maximum likelihood estimates (MLE; Supporting Information Table S3) (15), with the exception of Lookout Creek, OR,which had too few observations for the calculation of MLE. For Lookout Creek only, 0.5 MDL was substituted for values< MDL.
2734 9 ENVIRONMENTAL SCIENCE & TECHNOLOGY / VOL. 43, NO. 8, 2009

analyzed for THg by combustion and atomic absorption usinga direct Hg analyzer (Milestone DMA-80) at the Texas A&MUniversity Trace Element Research Laboratory, CollegeStation, Texas (25).
Subsamples of all freeze-dried and ground tissue weresent to the USGS National Research Program Isotopic TracersLaboratory (Menlo Park, CA) and analyzed for δ13C and δ15Nratios using a Carlo Erba 1500 elemental analyzer (to convertorganic C and N into CO2 and N2 gas) interfaced with anMicromass Optima continuous-flow isotope ratio massspectrometer (26). All samples were standardized againstPee Dee Belemnite (C) or N2 in air. Instrument precision was0.1‰ for C and 0.2‰ for N on the basis of replicate analysesof standard reference materials.
Stream Water. Stream water was sampled at each siteapproximately 18 times per year during 2002-2004 usingtrace-metal clean techniques. Samples were analyzed forfiltered THg and MeHg (FTHg and FMeHg), particulate THgand MeHg (PTHg and PMeHg), major ions, nutrients,suspended sediment, DOC concentration, specific UV ab-sorbance at 254 nm {SUVA, [L/(mg C ·m)]}, and otherconstituents. Detailed analytical methods and quality controldata are provided in ref 27.
Data Analysis. Invertebrate Hg concentrations are re-ported as MeHg (ng g-1, dry weight); forage fish and toppredator fish Hg concentrations are reported as THg (ng g-1,dry weight) (22). Because forage fish were oversampledrelative to invertebrates and predator fish, they were math-ematically pooled into three to four composites of four to sixrandomly selected individuals per species per collection date.Predator fish integrate lower trophic level prey over time, somost comparisons of Hg and stable isotopes in biota weremade across broad trophic categories (invertebrates, foragefish, predator fish). Summary statistics for Hg and for C andN isotope data are provided in Supporting Information TableS2. Statistical analyses were conducted in SAS 9.1.3 and Systat12. Hg concentrations in invertebrates and forage fish werecompared (by stream, taxa, and collection date) usingKruskal-Wallis and Mann-Whitney tests on ranks. Cor-relations among concentrations of Hg in biota and ecologicaland environmental variables were conducted using bothnonparametric and parametric tests, including Spearman’sRho (F) and linear regression. Regressions of log[Hg] versusδ15N for biota (trophic enrichment) were tested for homo-geneity of slopes among sites using PROC GLM in SAS.Correlations between mean Hg values for each trophiccategory and mean values for other environmental param-eters were tested using Kendall’s Tau (τ) (28). Spearman andKendall rank correlation analyses were performed on rawdata; simple and multiple linear regressions used base-10logarithm-transformed data for both Hg in biota and waterchemistry parameters. All statistical tests were performed ata significance level of p < 0.05 unless otherwise stated.
Hg concentrations in biota from lower trophic levels werecompared to streamwater Hg concentrations (FTHg, FMeHg)averaged over restricted time intervals: 60 days immediatelypreceding sampling for invertebrates and 1 year for foragefish. Top predator fish were collected only once and werecompared to streamwater data for the period of study(2002-2004). These intervals were selected on the basis ofthe average ages of forage fish (1.1 years) and predator fish(3.2 years) collected, and on literature-based estimates oftissue turnover times (23).
Because FMeHg concentrations sometimes fell below themethod detection limit (MDL; 0.04 ng L-1), FMeHg meanswere calculated as maximum likelihood estimates (MLE) forall streams except Lookout Creek, Oregon (SupportingInformation Table S3). It was not possible to calculate MLEsfor FMeHg at Lookout Creek because of the large number of
nondetects at this site, and 0.5 MDL was substituted for allvalues below the MDL.
For log[Hg] versus δ15N in food webs, regressions wereconducted on two data sets: (1) all data for all streams and(2) data restricted to samples that fell within food webs thatwere operationally defined by dietary dependence amongtop predator fish, forage fish, and invertebrates within eachstream using measurements of δ13C and δ15N. Because δ13Cis a relatively conservative natural tracer [typically expressing<1‰ enrichment for each trophic level (TL) increase] (29),it serves as a good indicator of dietary carbon. The upperand lower bounds of potential contributing forage or preywere calculated using
δ13Cconsumer)[δ13Cforage + (1‰ × TL)] (1)
In addition, δ15N is frequently used to calculate a consumer’strophic position above the food web base and discrete TLs(1-4, primary producers through tertiary consumers) becauseit expresses relatively consistent fractionation with increasingTL (typically ≈ 3.4 ‰ enrichment per TL) (30, 31):
TL)∆δ15N ÷ 3.4 (2)
where
∆δ15Nconsumer)δ15Nconsumer - δ15Nbase (3)
In this study, invertebrates with the lowest combined Hgand δ15N (glossosomatid and hydropsychid caddisfly, baetidmayfly, and chironomid larvae and amphipods; SupportingInformation Figure S2) were used to establish δ15Nbase foreach stream. Autotrophic production is generally consideredto be the base of aquatic food webs; however, invertebratesare frequently used as a proxy because of the difficulty inobtaining pure algal samples and the high degree of variabilityin algal MeHg concentrations and stable isotopic signaturesover small temporal and spatial scales (32).
Predators may integrate prey across large ranges of carbonand nitrogen isotope values, and some prey items may nothave been sampled. For these reasons, the ranges of δ13C forforage or prey linked to top predator fish in each streamwere conservatively estimated using the most 13C-depletedindividual top predator fish (lower bound), the most 13C-enriched individual (upper bound), and the most 15N-enriched individual to establish ∆δ15N (Supporting Infor-mation Figure S1).
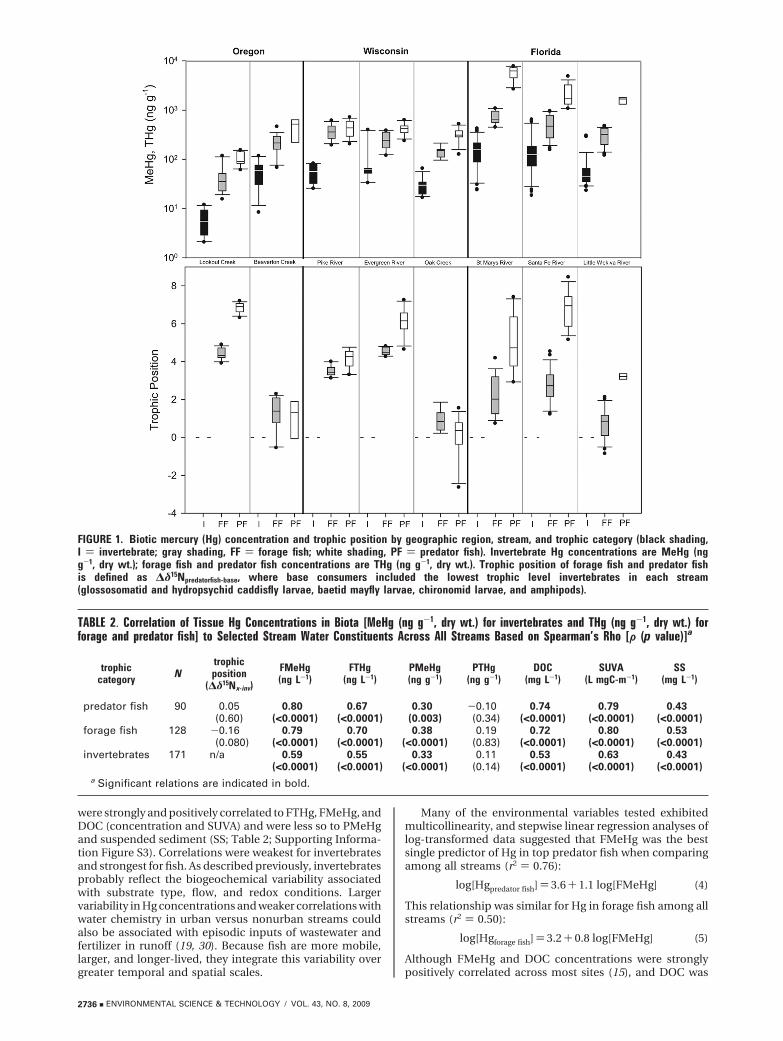
Results and DiscussionHg in Stream Biota. For most streams, variability of Hg acrosstrophic categories was generally higher for invertebrates (alltaxa, all dates; CV ) 40.8-114) than for forage fish (CV )24.3-68.4) or predator fish (CV ) 24.7-51.2; Table 1). Thishigher variability is due in part to seasonality: for example,in Florida streams, temporal differences in both Hg and δ15Nwere significant for several taxa (grass shrimp, amphipods,net-spinning cadisfly larvae, and midges). Even whenanalyzed by feeding strategy (e.g., herbivore, omnivore,invertivore) and collection date, variability was still greaterfor invertebrates (CV) 27.0-115) than for forage or predatorfish in most streams. Across all sites, Hg concentrationsranged from 2.08 to 644 ng g-1 MeHg for invertebrates, 15.6to 1090 ng g-1 THg for midtrophic level forage fish, and 61.3to 7810 ng g-1 THg for top predator fish (22). Although therewas no consistent geographic pattern in Hg concentrationfor specific trophic categories among streams, concentrationsfor all three categories were significantly different acrossbroad geographic regions: Florida > Wisconsin > Oregon(Table 1; Figure 1; Supporting Information Figure S2).
Role of Water Chemistry in Hg Bioaccumulation. Hgconcentrations in the tissue of all three trophic categories
VOL. 43, NO. 8, 2009 / ENVIRONMENTAL SCIENCE & TECHNOLOGY 9 2735
were strongly and positively correlated to FTHg, FMeHg, andDOC (concentration and SUVA) and were less so to PMeHgand suspended sediment (SS; Table 2; Supporting Informa-tion Figure S3). Correlations were weakest for invertebratesand strongest for fish. As described previously, invertebratesprobably reflect the biogeochemical variability associatedwith substrate type, flow, and redox conditions. Largervariability in Hg concentrations and weaker correlations withwater chemistry in urban versus nonurban streams couldalso be associated with episodic inputs of wastewater andfertilizer in runoff (19, 30). Because fish are more mobile,larger, and longer-lived, they integrate this variability overgreater temporal and spatial scales.
Many of the environmental variables tested exhibitedmulticollinearity, and stepwise linear regression analyses oflog-transformed data suggested that FMeHg was the bestsingle predictor of Hg in top predator fish when comparingamong all streams (r2 ) 0.76):
log[Hgpredator fish]) 3.6+ 1.1 log[FMeHg] (4)
This relationship was similar for Hg in forage fish among allstreams (r2 ) 0.50):
log[Hgforage fish]) 3.2+ 0.8 log[FMeHg] (5)
Although FMeHg and DOC concentrations were stronglypositively correlated across most sites (15), and DOC was
FIGURE 1. Biotic mercury (Hg) concentration and trophic position by geographic region, stream, and trophic category (black shading,I ) invertebrate; gray shading, FF ) forage fish; white shading, PF ) predator fish). Invertebrate Hg concentrations are MeHg (ngg-1, dry wt.); forage fish and predator fish concentrations are THg (ng g-1, dry wt.). Trophic position of forage fish and predator fishis defined as ∆δ15Npredatorfish-base, where base consumers included the lowest trophic level invertebrates in each stream(glossosomatid and hydropsychid caddisfly larvae, baetid mayfly larvae, chironomid larvae, and amphipods).
TABLE 2. Correlation of Tissue Hg Concentrations in Biota [MeHg (ng g-1, dry wt.) for invertebrates and THg (ng g-1, dry wt.) forforage and predator fish] to Selected Stream Water Constituents Across All Streams Based on Spearman’s Rho [G (p value)]a
trophiccategory N
trophicposition
(∆δ15Nx-inv)
FMeHg(ng L-1)
FTHg(ng L-1)
PMeHg(ng g-1)
PTHg(ng g-1)
DOC(mg L-1)
SUVA(L mgC-m-1)
SS(mg L-1)
predator fish 90 0.05 0.80 0.67 0.30 -0.10 0.74 0.79 0.43(0.60) (<0.0001) (<0.0001) (0.003) (0.34) (<0.0001) (<0.0001) (<0.0001)
forage fish 128 -0.16 0.79 0.70 0.38 0.19 0.72 0.80 0.53(0.080) (<0.0001) (<0.0001) (<0.0001) (0.83) (<0.0001) (<0.0001) (<0.0001)
invertebrates 171 n/a 0.59 0.55 0.33 0.11 0.53 0.63 0.43(<0.0001) (<0.0001) (<0.0001) (0.14) (<0.0001) (<0.0001) (<0.0001)
a Significant relations are indicated in bold.
2736 9 ENVIRONMENTAL SCIENCE & TECHNOLOGY / VOL. 43, NO. 8, 2009

strongly correlated to predator fish Hg among all streams (r2
) 0.71), DOC did not substantially improve either regressionmodel. When regressions excluded extreme end-memberstreamssLookout Creek (mean DOC ) 0.94 mg L-1) and St.Mary’s River (mean DOC ) 37 mg L-1)sHg in predator fishremained strongly correlated to FMeHg (r2 ) 0.51) but notto DOC (r2 ) 0.19). Given the strong positive correlation ofFMeHg with DOC across most streams (15), this lack of aconsistent response of Hg in fish to these variables highlightsthe complexity of Hg bioaccumulation processes. Severalrecent studies have demonstrated the importance of not onlyDOC quantity (33) and quality [complexity (34); specificorganic compounds (35)] to Hg bioavailability, but also mostlikely Hg speciation and partitioning in the water column(15).
Role of Food Web Processes in Hg Bioaccumulation.The basic relations between trophic level, δ15N, and Hgaccumulation for stream biota were consistent with previousstudies conducted in lakes and other aquatic ecosystems.Hg in biota increased with increasing trophic level for biotain all streams (Figure 2), with the exception of Oak Creek.Trophic position (∆δ15Npredator-base) for top predator fish wassimilar among nonurban sites (ranging from 4.2-6.8) andwas lower for all urban streams (0.02-3.2). For all streams,slopes of Hg in biota versus trophic position (i.e., trophictransfer efficiency for Hg) ranged from 0.14 to 0.27 (Table 3);however, these slopes were not significantly different for sixof the eight streams (p < 0.122), the exceptions beingEvergreen River and Oak Creek. Regression slopes for moststreams in this study were similar to slopes described formany other freshwater and marine food webs worldwide(5, 36).
Because of habitat heterogeneity in streams and localizedfeeding habits of some aquatic biota, δ15N in consumers maybe influenced by spatial differences in redox conditions aswell as trophic level. Although the raw data (Table 3a; Figure2) illustrate the ranges of all δ15N values and tissue Hgconcentrations sampled during the study, an operationallydefined food web (i.e., trophically linked; Table 3b) shouldprovide a more accurate representation of the actual trophictransfer of Hg. This approach removed high-leverage outliersand improved correlation coefficients for several sites(compare Table 3b to 3a). However, removing probablenondietary prey did not improve all regressions. Operationallydefined regressions decreased the sample size and p valuefor Pike River (only 1 of 15 predator fish collected from thisstream was apparently associated by diet to the preyorganisms collected), but did not change the regression slopefor Evergreen River, which was still significantly lowercompared to all other streams. Reasons for the lower trophictransfer efficiency in Evergreen River are not apparent. Themuch lower slope for this stream could reflect unsampledprey or predators, the presence of migrating predators, lagsin assimilation of Hg derived from rarely ingested orseasonally available prey, or a difference in trophic transferefficiency associated with local geochemical and biologicalinfluences (37, 38). Bioaccumulation models for streamsystems could be further improved by refining samplecollections and employing more complex mixing models toestimate trophic relationships (39, 40).
Across the broad ranges of environmental conditionsincluded in this study, Hg contamination in top predatorfish was not strongly correlated to apparent trophic positionamong streams (Table 2; Spearman’s F) 0.05, p) 0.60). Thissuggests that, among these systems, the supply of MeHg tothe base of the food web is the strongest determinant of Hgin top-level predators (7), rather than differences in trophictransfer efficiency or trophic position. This is plausibleconsidering that FMeHg concentrations vary over severalorders of magnitude among streams, and given that biom-
agnification of MeHg from water to algae (105-106) is severalorders of magnitude larger than from algae to successivelyhigher trophic levels (<10 to 101 per trophic level) (41). Whencomparing streams among geographic regions, Hg in bothforage and predator fish was positively correlated to trophicposition only in Wisconsin (Spearman’s F) 0.48, p) 0.0024),where FTHg and FMeHg vary by an order of magnitude orless among streams. These results suggest that differencesin community composition, feeding relationships, andtrophic transfer efficiencies are relatively more important toMeHg bioaccumulation in streams when evaluating long-term temporal trends within a specific stream or watershed,or when comparing across similar environmental settingswith similar Hg loadings (8).
Local, Regional, and Geographic Influences. Hg con-centrations in biota were evaluated relative to integrated
FIGURE 2. Trophic enrichment of Hg in Oregon, Wisconsin, andFlorida streams. Data points are species means for MeHg inmultiseason collections of all invertebrates (O) and for THg inforage fish (0) and top predator fish (∆); regression lines arebased on data from individual samples. Symbol shadingrepresents nonurban streams: white (Pike River, St. MarysRiver); gray (Lookout Creek, Evergreen River, Santa Fe River);and urban streams, black (Beaverton Creek, Oak Creek, andLittle Wekiva River).
VOL. 43, NO. 8, 2009 / ENVIRONMENTAL SCIENCE & TECHNOLOGY 9 2737

streambed sediment MeHg production potential (42), at-mospheric depositional Hg loading (15, 43) (not shown), andwetland abundance as a percent of the watershed area in thestream basin (16). Mercury in biota was not significantlycorrelated to either in-stream MeHg production potential or
depositional loading (τ < 0.5, p > 0.1); however, Hgconcentrations in invertebrates, forage fish, and predatorswere significantly and positively correlated to percent wetland(Figure 3). These results are not unexpected, given that (1)wetlands have been identified as important sources of MeHgand DOC (44), (2) FMeHg and DOC are highly correlated topercent wetland in the current study (15), and (3) Hgconcentrations in biota are highly correlated to all of thesevariables (Table 2). The relationships between Hg in biotaand wetland area may provide an expedient way to establisha preliminary characterization of potential MeHg contami-nation for a given stream.
AcknowledgmentsThis study was supported by the National Water-QualityAssessment and Toxic Substances Hydrology Programs ofthe USGS. We thank the following for important contribu-tions: the staff at H.J. Andrews Experimental Research Forest,the Menomonie Indian Tribe of Wisconsin (site access andfield support), and the Florida Fish and Wildlife ConservationCommission (field support). This manuscript benefitedgreatly from the comments and suggestions of David W. Evans(NOAA/NMFS, Beaufort Island), James S. Kuwabara andDennis A. Wentz (USGS), and Edward B. Swain (MinnesotaPollution Control Agency).
Supporting Information AvailableAdditional supporting figures and data tables are presented.This information is available free of charge via the Internetat http://pubs.acs.org.
Literature Cited
(1) Hall, B. D.; Rosenberg, D. M.; Wiens, A. P. Methyl mercury inaquatic insects from an experimental reservoir. Can. J. Fish.Aquat. Sci. 1998, 55, 2036–2047.
(2) Harris, R. C.; Bodaly, R. A. Temperature, growth, and dietaryeffects on fish mercury dynamics in two Ontario lakes. Bio-geochemistry 1998, 40, 175–187.
(3) Hill, W. R.; Stewart, A. J.; Napolitano, G. E. Mercury speciationand bioaccumulation in lotic primary producers and primaryconsumers. Can. J. Fish. Aquat. Sci. 1996, 53, 812–819.
(4) Moye, H. A.; Miles, C. J.; Phlips, E. J.; Sargent, B.; Merritt, K. K.Kinetics and uptake mechanisms for monomethylmercurybetween freshwater algae and water. Environ. Sci. Technol. 2002,36, 3550–3555.
(5) Atwell, L.; Hobson, K. A.; Welch, H. E. Biomagnification andbioaccumulation of mercury in an arctic marine food web:Insights from stable nitrogen isotope analysis. Can. J. Fish. Aquat.Sci. 1998, 55, 1114–1121.
TABLE 3. Trophic Enrichment of Mercury in Streams As Illustrated by the Slope of log[Hg] versus δ15N for Biotaa
a. general food web b. operationally defined food web
N ∆δ15N (‰) slope ( 95% CI SE r2 p slope ( 95% Cl SE r2 p
Lookout Creek, OR 40 6.8 0.21 (0.19-0.24) 0.012 0.90 <0.0001 0.20 (0.17-0.24) 0.017 0.90 <0.0001Beaverton Creek, OR 39 1.1 0.24 (0.15-0.32) 0.042 0.46 <0.0001 0.27 (0.20-0.33) 0.029 0.83 <0.0001Pike River, WI 39 4.2 0.26 (0.21-0.28) 0.017 0.87 <0.0001 0.22 (0.06-0.38) 0.076 0.39 0.0124Evergreen River, WI 38 6.2 0.14 (0.11-0.17) 0.015 0.70 <0.0001 0.15 (0.13-0.18) 0.013 0.84 <0.0001Oak Creek, WI 33 0.02 n/a n/a 0.01 0.553 n/a n/a 0.08 0.265St. Marys River, FL 57 4.9 0.23 (0.20-0.27) 0.026 0.63 <0.0001 0.24 (0.19-0.30) 0.026 0.63 <0.0001Santa Fe River, FL 74 6.8 0.21 (0.18-0.23) 0.012 0.79 <0.0001 0.20 (0.17-0.22) 0.013 0.82 <0.0001Little Wekiva River, FL 70 3.2 0.16 (0.09-0.23) 0.036 0.22 <0.0001 0.24 (0.15-0.33) 0.045 0.47 <0.0001
a Regressions include composites of invertebrates and forage fish, and individual predator fish. N represents the totalnumber of observations in each regression, and SE is the standard error of the slope estimate. Community complexity ischaracterized by ∆δ15N ) (δ15Npredator - δ15Ninvertebrates), which is an estimate of the difference in trophic position between top(predator fish) and base (herbivorous/detritivorous invertebrates) consumers. Regressions include (a) all data and (b) datarestricted to biota operationally defined as nutritionally dependent [δ13Cpredator ( (∆δ15N/3.4); Supporting Information FigureS1].
FIGURE 3. Mean Hg in biota versus wetland abundance.Symbol shading represents geographic area: white, Oregon;gray, Wisconsin; and black, Florida. Symbol shape representsland use: nonurban, ∆ (Pike River, St Marys River) and 0(Lookout Creek, Evergreen River, Santa Fe River); and urban, O(Beaverton Creek, Oak Creek, and Little Wekiva River).
2738 9 ENVIRONMENTAL SCIENCE & TECHNOLOGY / VOL. 43, NO. 8, 2009

(6) Wong, A. H. K.; McQueen, D. J.; Williams, D. D.; Demers, E.Transfer of mercury from benthic invertebrates to fishes in lakeswith contrasting fish community structures. Can. J. Fish. Aquat.Sci. 1996, 54, 320–1330.
(7) Gorski, P. R.; Cleckner, L. B.; Hurley, J. P.; Sierszen, M. E.;Armstrong, D. E. Factors affecting enhanced mercury bioac-cumulation in inland lakes of Isle Royale National Park, USA.Sci. Total Environ. 2003, 304, 327–348.
(8) Vander Zanden, M. J.; Rasmussen, J. B. A trophic position modelof pelagic food webs: Impact on contaminant bioaccumulationin lake trout. Ecol. Monogr. 1996, 66 (4), 451–477.
(9) Stewart, A. R.; Saiki, M. K.; Kuwabara, J. S.; Alpers, C. N.; Marvin-DiPasquale, M.; Krabbenhoft, D. P. Influence of planktonmercury dynamics and trophic pathways on mercury concen-trations of top predator fish of a mining-impacted reservoir.Can. J. Fish. Aquat. Sci. 2008, 65 (11), 2351–2366.
(10) Brumbaugh, W. G.; Krabbenhoft, D. P.; Helsel, D., R.; Wiener,J. G.; Echols, K. R. A national pilot study of mercury contamina-tion of aquatic ecosystems along multiple gradients: Bioaccu-mulation in fish; Biological Science Report, U.S. GeologicalSurvey, USGS/BRD/BSR-2001-009, 2001. Available at http://www.cerc.usgs.gov/pubs/center/pdfdocs/BSR2001-0009.pdf (ac-cessed Feb 2009).
(11) Rypel, A. L.; Arrington, D. A.; Findlay, R. H. Mercury inSoutheastern U.S. Riverine Fish Populations Linked to WaterBody Type. Environ. Sci. Technol. 2008, 42 (14), 5118–5124.
(12) McCutchan, J. H., Jr.; Lewis, W. M., Jr. Seasonal variation instable isotope ratios of stream algae. Verh. Int. Ver. Theor. Angew.Limnol. 2001, 27, 3304–3307.
(13) Cabana, G.; Rasmussen, J. B. Comparison of aquatic food chainsusing nitrogen isotopes. Proc. Natl. Acad. Sci. U. S. A. 1996, 93(20), 10844–10847.
(14) Jardine, T. D.; Kidd, K. A.; Fisk, A. T. Applications, considerations,and sources of uncertainty when using stable isotope analysisin ecotoxicology. Environ. Sci. Technol. 2006, 40 (24), 7501–7511.
(15) Brigham, M. E.; Wentz, D. A.; Aiken, G. R.; Krabbenhoft, D. P.Mercury cycling in stream ecosystems. 1. Water columnchemistry and transport. Environ. Sci. Technol. 2009, 43, 2720-2725.
(16) Bell, A. H.; Lutz, M. A. Environmental settings of selected streamssampled for mercury in Oregon, Wisconsin, and Florida, 2002-2006; Open-File Report 2008-1277; U.S. Geological Survey, 2008.Available at http://pubs.usgs.gov/of/2008/1277/ (accessed Feb2009).
(17) Hobbs, F.; Stoops, N. Census 2000 Special Reports; United StatesCensus Bureau: Washington, DC, 2002.
(18) Stewart, A. R.; Luoma, S. N.; Schlekat, C. E.; Doblin, M. A.; Hieb,K. Food web pathway determines how selenium affects aquaticecosystems: A San Francisco Bay case study. Environ. Sci.Technol. 2004, 38, 4519–4526.
(19) Anderson, C.; Cabana, G. Does δ15N in river food webs reflectthe intensity and origin of N loads from the watershed. Sci.Total Environ. 2006, 367, 968–978.
(20) McCutchan, J. H., Jr.; Lewis, W. M., Jr.; Kendall, C.; McGrath,C. C. Variation in trophic shift for stable isotope ratios of carbon,nitrogen, and sulfur. Oikos 2003, 102 (2), 378–390.
(21) Scudder, B. C.; Chasar, L. C.; DeWeese, L. R.; Brigham, M. E.;Wentz, D. A.; Brumbaugh, W. G. Procedures for collecting andprocessing aquatic invertebrates and fish for analysis of mercuryas part of the National Water-Quality Assessment Program;Open-File Report 2008-1208; U.S. Geological Survey, 2008.Available at http://pubs.usgs.gov/of/2008/1208/ (accessed Feb2009).
(22) Chasar, L. C.; Scudder, B. C.; Bell, A. H.; Wentz, D. A.; Brigham,M. E. Total mercury, methylmercury, and carbon and nitrogenstable isotope data for biota from selected streams in Oregon,Wisconsin, and Florida, 2002-2004; Data Series Report 349;U.S. Geological Survey, 2008. Available at http://pubs.usgs.gov/ds/349/ (accessed Feb 2009).
(23) Hesselein, R. H.; Hallard, K. A.; Ramlal, P. Replacement of sulfur,carbon, and nitrogen in tissue of growing broad whitefish(Coregonus nasus) in response to a change in diet traced byδ34S, δ13C, and δ15N. Can. J. Fish. Aquat. Sci. 1993, 50, 2071–2076.
(24) Bloom, N. S. On the chemical form of mercury in edible fishand marine invertebrate tissue. Can. J. Fish. Aquat. Sci. 1992,49, 1010–1017.
(25) USEPA SW-846 Method 7473: Mercury in solids and solutionsby thermal decomposition, amalgamation, and atomic absorp-tion spectrophotometry; U.S. Environmental Protection Agency:
Washington, DC, 1998. Available at http://www.epa.gov/osw/hazard/testmethods/sw846/pdfs/7473.pdf (accessed Feb 2009).
(26) Kendall, C.; Silva, S. R.; Kelly, V. J. Carbon and nitrogen isotopiccompositions of particulate organic matter in four large riversystems across the United States. Hydrol. Process. 2001, 15, 1301–1346.
(27) Brigham, M. E.; Duris, J. W.; Wentz, D. A.; Button, D. T.; Chasar,L. C. Total mercury, methylmercury, and ancillary water-qualityand streamflow data for selected streams in Oregon, Wisconsin,and Florida, 2002-2006; Data Series Report 341; U.S. GeologicalSurvey, 2008. Available at http://pubs.usgs.gov/ds/341/ (ac-cessed Feb 2009).
(28) Helsel, D. R.; Hirsch, R. M. Statistical methods in water resources.Techniques of Water-Resources Investigations Report; U.S.Geological Survey: Reston, VA, 2002; Book 4, Chapter A3.
(29) Finlay, J. C. Stable-carbon-isotope ratios of River Biota: impli-cations for energy flow in lotic food webs. Ecology 2001, 82 (4),1052–1064.
(30) Anderson, C.; Cabana, G. Estimating the trophic position ofaquatic consumers in river food webs using stable nitrogenisotopes. J. N. Am. Benthol. Soc. 2007, 26 (2), 273–285.
(31) Vander Zanden, M. J.; Hulshof, M.; Ridgway, M. S.; Rasmussen,J. B. Application of stable isotope techniques to trophic studiesof age-o smallmouth bass. Trans. Am. Fish. Soc. 1998, 127, 729–739.
(32) Kidd, K. A.; Hesselein, R. H.; Fudge, R. J. P.; Hallard, K. A. Theinfluence of trophic level as measured by δ15N on mercuryconcentrations in freshwater organisms. Water, Air, Soil Pollut.1995, 80, 1011–1015.
(33) Gorski, P. R.; Armstrong, D. E.; Hurley, J. P.; Krabbenhoft, D. P.Influence of natural dissolved organic carbon on the bioavail-ability of mercury to a freshwater alga. Environ. Pollut. 2008,8.
(34) Haitzer, M.; Aiken, G. R.; Ryan, J. N. Binding of mercury (II) toaquatic humic substances: Influence of pH and source of humicsubstances. Environ. Sci. Technol. 2003, 37, 2436–2441.
(35) Schaefer, J. K.; Morel, F. M. M. High methylation rates of mercurybound to cycteine by Geobacter sulfurreducens. Nat. Geosci.2009 [Online].
(36) Campbell, L. M.; Norstrom, R. J.; Hobson, K. A.; Muir, D. C. G.;Backus, S.; Fisk, A. T. Mercury and other trace elements in apelagic Arctic marine food web (Northwater Polynya, BaffinBay). Sci. Total Environ. 2005, 351-352, 247–263.
(37) Luoma, S. N.; Rainbow, P. S. Why is metal bioaccumulation sovariable? Biodynamics as a unifying concept. Environ. Sci.Technol. 2005, 39 (7), 1921–1931.
(38) Veltman, K.; Huijbregts, M. A.; Van Kolck, M.; Wang, W.-X.;Hendriks, A. J. Metal bioaccumulation in aquatic species:Quantification of uptake and elimination rate constants usingphysicochemical properties of metals and physiological char-acteristics of species. Environ. Sci. Technol. 2008, 42, 852–858.
(39) Phillips, D. L.; Gregg, J. W. Source partitioning using stableisotopes: coping with too many sources. Oecologia 2003, 136,261–269.
(40) Phillips, D. L.; Newsome, S. D.; Gregg, J. W. Combining sourcesin stable isotope mixing models: alternative methods. Oecologia2005, 144 (Stable Isotopes Issue), 8.
(41) Wiener, J. G.; Krabbenhoft, D. P.; Heinz, G. H.; Scheuhammer,A. M. Ecotoxicology of mercury. In Handbook of Ecotoxicology,2nd ed.; Hoffman, D. J., Rattner, B. A., Burton, G. A., Jr., Cairns,J., Jr., Eds.; CRC Press: Boca Raton, FL, 2003.
(42) Marvin-DiPasquale, M.; Lutz, M. A.; Brigham, M. E.; Krabbenhoft,D. P.; Aiken, G. R.; Orem, W. H.; Hall, B. D. Mercury in streamecosystems. 2. Benthic methylmercury production and bedSediment—pore water partitioning. Environ. Sci. Technol. 2009,43, 2726-2732.
(43) Wiener, J. G.; Bodaly, R. A.; Brown, S. S.; Lucotte, M.; Newman,M. C.; Porcella, D. B.; Swain, E. B. Monitoring and evaluatingtrends in methylmercury accumulation in aquatic biota. InEcosystem Responses to Mercury Contamination: Indicators ofChange; Harris, R. C., Krabbenhoft, D. P., Mason, R. P., Murray,M. W., Reash, R. J., Saltman, T., Eds.; CRC Press: Boca Raton,FL, 2007.
(44) St. Louis, V. L.; Rudd, J. W; M, Kelly, C.; Beaty, K. G.; Bloom,N. S.; Flett, R. J. Importance of wetlands as sources of methylmercury to boreal forest ecosystems. Can. J. Fish. Aquat. Sci.1994, 51, 1065–1076.
ES8027567
VOL. 43, NO. 8, 2009 / ENVIRONMENTAL SCIENCE & TECHNOLOGY 9 2739