lessons learned from successful rail …onlinepubs.trb.org/onlinepubs/tcrp/tcrp_rpt_62-b.pdf77...
TRANSCRIPT

77
CHAPTER 5
LESSONS LEARNED FROM SUCCESSFUL RAIL SYSTEMS
OVERVIEW
Chapter 4 summarized the results of a review of 14 suc-cessful airport ground access systems, each of which was ableto capture more than 20 percent of the market of air travelersto public transportation. Chapter 5 examines the attributesachieved in the implementation of the successful system thatcan be of use to the U.S. practitioner considering the develop-ment of systems with both rail and bus services. This chapterexamines the characteristics of the rail component of the totalground access strategies used in the 14 successful systems. Thefocus of the chapter is on the attributes of rail service that areassociated with high mode shares to rail systems. The actualmethod by which these attributes can be achieved in the U.S.experience may be different from the methods used in Europeand Asia.
A REVIEW OF THE RAIL MARKET SHARES
The market share gained by rail service for the 14 suc-cessful services is presented in Table 5-1. The criterion forthe selection, as reviewed in Chapter 4, was the role of therail services in a public transportation system that attainedmore than a 20 percent share of the market. Reference wasalso made in Chapter 4 to systems for which there is not yeta market survey but whose overall share to public transporta-tion will clearly meet the established criterion: the new railsystems at both the Copenhagen and Stockholm airports. Asshown in Table 5-1, the ranking of the 14 rail services can-not be explained by measures as simple as the location or thesize of the airport. Almost identical market shares are reportedfor the airport located closest to the downtown (Geneva) andlocated furthest from the downtown (Tokyo Narita). Nor canthe size of the airport be used to forecast rail market share: thelargest airports, Heathrow and Frankfurt International, are inthe mid ranks in terms of ground access market share; thesmaller airports rank both higher and lower than the largest.This chapter will examine the role of rail services of the 14 suc-cessful ground access systems in terms of four major elementsof a total strategy, each of which can help to define the key“lessons learned” for the U.S. practitioner considering theimplementation of a fixed guideway element of an airportground access system.
FOUR ELEMENTS IN A SUCCESSFUL AIRPORTRAIL SYSTEM
This chapter will focus on the rail projects that form theprincipal mode of most of the successful systems describedin Chapter 4 by describing the characteristics associated withthe success of these rail projects. This chapter will explorethe importance of four elements of a total strategy, drawingexamples from the systems described in Chapter 4. These fourelements are:
1. Service to downtown and the metropolitan area;2. Service to national destinations beyond the metropoli-
tan area;3. Quality of the rail connection at the airport, or the
airport–railway interface; and4. Baggage-handling strategies and off-site facilities.
BASIC DEFINITIONS
Metropolitan Services versus National Services
The link from the airport to the downtown is just a part ofa larger transportation system to move the user to his or heractual trip destination. This chapter examines the characteris-tics of service for (1) airport users with local destinations inthe metropolitan area and (2) airport users with destinationsbeyond the metropolitan area. In the European experience, thelonger-distance ground access trips tend to be accommodatedby national rail systems and are referred to in this report as“national” services. In the U.S. experience, destinations beyondthe metropolitan area might be referred to as “statewide” or“exurban” destinations.
For each of the two geographic service categories, twostrategies of service are documented: dedicated and shared.
Dedicated versus Shared
Rail services to airports can be categorized as either a ded-icated service or a shared service. With dedicated service,services and vehicles designed specifically for the needs of theairline passenger are provided. With shared service, airlinepassengers use the same vehicles as other public transportation

passengers in the corridor of service. In London, both theGatwick Express and the Heathrow Express rail services areexamples of dedicated service, with vehicles designed for theairline passenger. Service to Heathrow Airport on LondonTransport’s Piccadilly Line and other commuter rail servicesstopping at Gatwick Airport are examples of shared service.
Many dedicated services market their high-quality line-haul times with fast service to only one terminal. Most sharedservices, such as the Piccadilly Line to Heathrow, providerelatively slow speeds into the city, but with distribution tomany points in downtown. In many cases, the dedicated service(e.g., Gatwick Express, Heathrow Express) utilizes a vehicledesigned to accommodate checked baggage. In most sharedservices, such as Munich’s S-Bahn service, no specializedvehicle is used, resulting in vehicles that may not serve travel-ers’ need for extra baggage space. Of the 14 ground access sys-tems, 6 can be described as using a dedicated-service strategy.The other systems have chosen to provide service that isdesigned primarily for the commuters and the rest of the sys-tem. A characteristic of the dedicated-service strategy is theability to provide minimized travel times between the airport
78
and the downtown. However, the most successful overall modeshare is gained by airports that offer a variety of strategies.Table 5-2 presents a categorization of the services offered ateach airport.
ELEMENT 1: SERVICE TO DOWNTOWN AND THE METROPOLITAN AREA
In the case studies of successful rail services to downtown,two strategies for service design emerge: (1) focusing on theline speed to the terminal or on the quality of distribution ser-vices, and (2) minimizing the headway that comes from jointoperation with regularly scheduled services. Both strategiesseek to produce a door-to-door travel time that is competitivewith the taxi and the private vehicle. In the comparison ofthe two strategies, the Oslo Airport Express can be used as aprototype of the high-speed, dedicated strategy; Munich’sstandard S-Bahn can be a prototype of the lower-speed,shared strategy. In the last year, service was improved inOslo by decreasing the line time, while service in Munichwas improved by doubling the number of trains, thus lower-ing the waiting time by 50 percent.
Dedicated Express Service to Downtown
Until recently, trains dedicated to the needs of airport usersoperated only to London Gatwick and Tokyo Narita Airports.In 1998 and 1999, there has been a significant expansion ofthe application of the dedicated train, with exclusive serviceto the downtown terminals. In these 2 years, new dedicatedservices opened in Hong Kong, Oslo, London (at HeathrowAirport), Milan, and Stockholm. In addition, new rolling stock,with new branding, is being introduced at London’s Gatwickand Stansted Airports. During this period, plans for such ded-icated express services were announced for Paris, Berlin, andKuala Lumpur.
Rank insample
City/airport Rail modeshare (percent)
Airportdistance (miles)
1 Oslo 43 302 Narita 36 423 Geneva 35 34 Zurich 34 85 Munich 31 186 Frankfurt 27 67 Stansted 27 348 Amsterdam 25 99 Heathrow 25 1510 Hong Kong 24 2111 Gatwick 20 2812 de Gaulle 20 1513 Brussels 16 1014 Orly 14 8
TABLE 5-1 Ranking of rail system performance
Rail mode Dedicated train Shared trainAirport share CBD National CBD National
Oslo 43 Yes Yes Yes YesTokyo Narita 36 Yes Yes Yes NoGeneva 35 No No Yes YesZurich 34 No No Yes YesMunich 31 No No Yes NoFrankfurt 27 No No Yes YesAmsterdam 27 No No Yes YesLondon Heathrow 25 Yes No Yes NoLondon Stansted 25 Yes No Yes YesHong Kong 24 Yes No Yes NoLondon Gatwick 20 Yes No Yes YesParis de Gaulle 20 No No Yes YesBrussels 16 No No Yes YesParis Orly 14 No No Yes No
TABLE 5-2 Categorization of line-haul services
The Role of High-Speed, Dedicated Service: Oslo,Hong Kong, London Heathrow, and Milan Malpensa
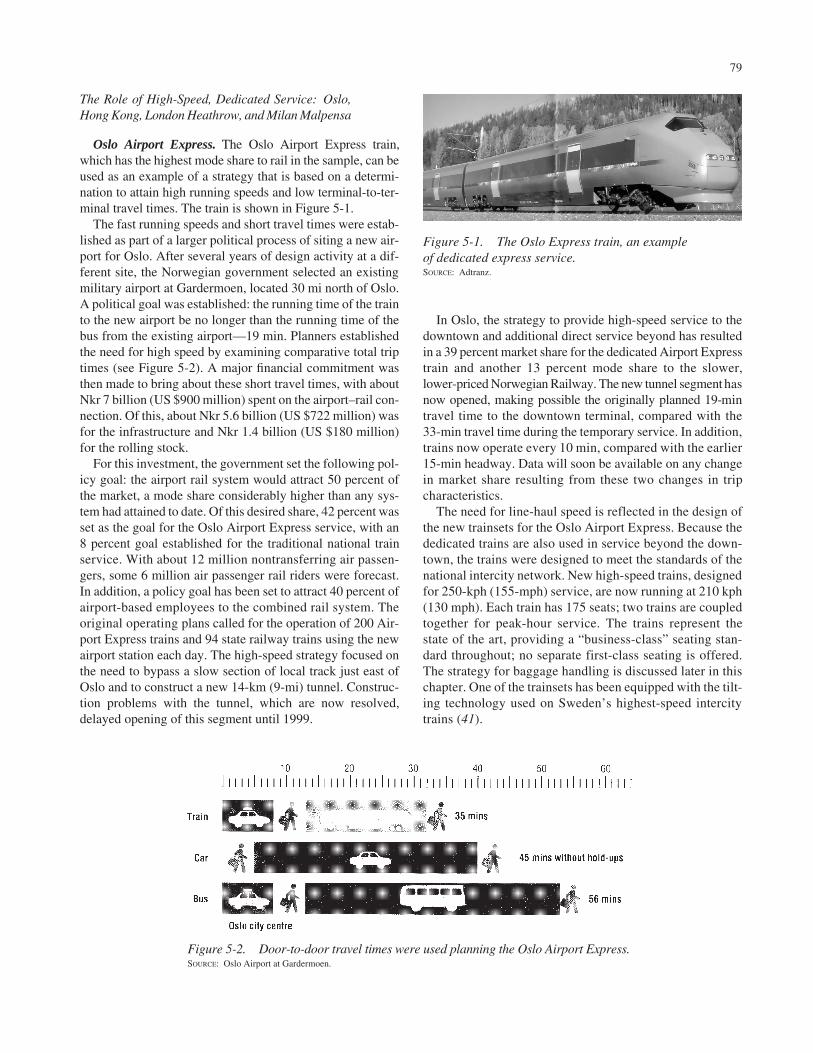
Oslo Airport Express.The Oslo Airport Express train,which has the highest mode share to rail in the sample, can beused as an example of a strategy that is based on a determi-nation to attain high running speeds and low terminal-to-ter-minal travel times. The train is shown in Figure 5-1.
The fast running speeds and short travel times were estab-lished as part of a larger political process of siting a new air-port for Oslo. After several years of design activity at a dif-ferent site, the Norwegian government selected an existingmilitary airport at Gardermoen, located 30 mi north of Oslo.A political goal was established: the running time of the trainto the new airport be no longer than the running time of thebus from the existing airport—19 min. Planners establishedthe need for high speed by examining comparative total triptimes (see Figure 5-2). A major financial commitment wasthen made to bring about these short travel times, with aboutNkr 7 billion (US $900 million) spent on the airport–rail con-nection. Of this, about Nkr 5.6 billion (US $722 million) wasfor the infrastructure and Nkr 1.4 billion (US $180 million)for the rolling stock.
For this investment, the government set the following pol-icy goal: the airport rail system would attract 50 percent ofthe market, a mode share considerably higher than any sys-tem had attained to date. Of this desired share, 42 percent wasset as the goal for the Oslo Airport Express service, with an8 percent goal established for the traditional national trainservice. With about 12 million nontransferring air passen-gers, some 6 million air passenger rail riders were forecast.In addition, a policy goal has been set to attract 40 percent ofairport-based employees to the combined rail system. Theoriginal operating plans called for the operation of 200 Air-port Express trains and 94 state railway trains using the newairport station each day. The high-speed strategy focused onthe need to bypass a slow section of local track just east ofOslo and to construct a new 14-km (9-mi) tunnel. Construc-tion problems with the tunnel, which are now resolved,delayed opening of this segment until 1999.
79
In Oslo, the strategy to provide high-speed service to thedowntown and additional direct service beyond has resultedin a 39 percent market share for the dedicated Airport Expresstrain and another 13 percent mode share to the slower,lower-priced Norwegian Railway. The new tunnel segment hasnow opened, making possible the originally planned 19-mintravel time to the downtown terminal, compared with the33-min travel time during the temporary service. In addition,trains now operate every 10 min, compared with the earlier15-min headway. Data will soon be available on any changein market share resulting from these two changes in tripcharacteristics.
The need for line-haul speed is reflected in the design ofthe new trainsets for the Oslo Airport Express. Because thededicated trains are also used in service beyond the down-town, the trains were designed to meet the standards of thenational intercity network. New high-speed trains, designedfor 250-kph (155-mph) service, are now running at 210 kph(130 mph). Each train has 175 seats; two trains are coupledtogether for peak-hour service. The trains represent thestate of the art, providing a “business-class” seating stan-dard throughout; no separate first-class seating is offered.The strategy for baggage handling is discussed later in thischapter. One of the trainsets has been equipped with the tilt-ing technology used on Sweden’s highest-speed intercitytrains (41).
Figure 5-1. The Oslo Express train, an example of dedicated express service.SOURCE: Adtranz.
Figure 5-2. Door-to-door travel times were used planning the Oslo Airport Express.SOURCE: Oslo Airport at Gardermoen.

Hong Kong Airport Express.The Hong Kong Airport Ex-press Line (Figure 5-3) is one element of a larger plan to pro-vide two categories of service on one rail infrastructure. A newcommuter train for general-purpose use has been developed forLantau Island, the location of the new Hong Kong Airport. Theinterior of the commuter train looks very similar to the high-volume service offered by MTRC throughout Hong Kong. Allseating on the commuter train is on long, unupholstered benchseats, which are used by rapid transit systems around the worldto maximize room for standees. Ticket pricing is consistentwith the costs of other mass transit services in the area.
Superimposed on this infrastructure is an elaborate “skipstop” operation, in which the express trains are routed ontoshort bypass tracks at each of the local stations. Although thebypass tracks are in operation at the local stations, the funda-mental infrastructure—particularly in expensive tunnel andbridge segments—is that of a two-track railroad. In effect, twocomplete systems must be dispatched simultaneously, result-ing in a precisely managed rail operation. Little toleranceexists in either system for failure or delay in the other system.
The result of this skip stop operation is an imaginativemarketing concept, in which two classes of service—aimedat two very different submarkets—are operated over a com-mon infrastructure. The users of the local train never see theelaborate check-in stations in Central Station or KowloonStation, because those users are routed into standard stations.The users of the Airport Express are, generally speaking, notaware that the same rail company is operating a second ser-vice to the airport complex at a fare one-third to one-quarterof what the Airport Express users are paying.
The creation of a high-speed service with a higher ticketprice is the result of a marketing plan to provide a servicewith a high level of amenity for the airport user, while shar-ing infrastructure investment with the commuter system runby MTRC. The rail line to Lantau Island cost more than HK$34 billion (US $4.5 billion). The express service offers a 23-min travel time from the airport to the downtown.
80
Heathrow Express.The Heathrow Express, shown inFigure 5-4, was designed to provide a high-speed alternativeto the existing rail transit service to Heathrow Airport. Apolitical review in 1983 of the future of Heathrow deter-mined the further growth of the airport should be contingenton the creation of a high-speed rail link. From PaddingtonStation, the existing intercity tracks are shared with other railoperators for 19 km (12 mi), at which point a new flyoverleads to a new right-of-way, which tunnels into Heathrow’scentral terminal area. At this location, the front of the plat-form leads to escalators for Terminals 2 and 3, while the backof the platform connects to Terminal 1. A single-track tunnelcontinues on to Terminal 4, which has two platforms.
The express train project was built for £422 million(approximately US $675 million). Nonstop service is pro-vided between Paddington Station and Heathrow’s centralterminal area, at an advertised time of 15 min.
Milan Malpensa Express.Service to Milan’s MalpensaAirport is being phased in incrementally. When the airportopened in 1998, few ground access services were available byany mode. In 1999, the initial phase of the Malpensa Expresswas inaugurated with constrained service levels caused by along, one-track segment. Service to downtown Milan, nowoffered every 30 min, will improve when the full double-tracked right-of-way is constructed. The major airline, Alitalia,operates one of the train cars and offers “flight” attendant ser-vice to those with Alitalia tickets (42).
Planned Services with the Dedicated-ExpressConcept: Berlin Brandenburg, Kuala Lumpur,and Charles de Gaulle
Berlin Brandenburg. In 1999, German Railways an-nounced its decision to develop a dedicated train to operate
Figure 5-3. The Hong Kong Airport Express.SOURCE: Mass Transit Railway Corporation, Hong Kong. Figure 5-4. The Heathrow Express at Paddington Station.
Pho
to:
Mat
thew
A. C
ooga
n

express service to the new Berlin Brandenburg InternationalAirport, which will consolidate and replace the existing airportsin Berlin. An S-Bahn suburban rail line already serves the sitefor the new airport, currently called Schonefeld Airport, with a25-min service to downtown.
The S-Bahn division of German Railways will develop anew dedicated express line that will connect with Berlin’snew central rail station—called Berlin-Lehrter Bahnhof—with only two intermediate stations. The specially designedtrains will be capable of 100-mph service and will reduce therunning time to downtown to 18 min. Some dedicated trainswill continue beyond the CBD to serve the suburb of Potsdam,to the west. Adtranz will build the trains, which will have allseats facing a baggage-storage area, as originally developedfor the Oslo Airport Express train. As shown in Figure 5-5, thenew German service will be branded as the “Airport Express.”
Kuala Lumpur. In Malaysia, Kuala Lumpur trains will runevery 15 min, making the 57-km (35-mi) service to downtownless than 30 min. Slower, cheaper commuter trains will also beoperated along the line to downtown Kuala Lumpur. Calledthe Express Rail Link (ERL), it is a high-quality, high-amenityservice, designed to appeal to air travelers. The proposed bag-gage strategy for the Kuala Lumpur system is the most ambi-tious in the world and will be discussed later in this chapter.
Charles de Gaulle.For years, the access strategy betweenCharles de Gaulle Airport and downtown Paris has been basedon the use of standard regional rail services, which are sharedwith commuters. No use of specialized service to the down-town was planned.
Now, French National Railways (SNCF) and Aeroports deParis are developing a new dedicated, high-speed service toa downtown terminal—either Gare du Nord, terminal of theEurostar train from London, or the immediately adjacentGare d’Est. Thus, Charles de Gaulle Airport will soon havetwo services available to the customer, at two separate pricepoints. Reportedly, the new trains will be similar in market-
81
ing concept to the existing TGV, although the actual distancesmay not require true high speeds.
Specialized Airport Access Design: Informationto the Passenger
Many of the new dedicated trains incorporate innovativeinformation systems to help the passenger on the airport trip.An early example of such information is the use of map graph-ics on the Narita Express, which show the traveler the locationof the train on the map, the actual time, and the expectedarrival time at the airport. At all times, the rail rider has a senseof orientation and is (presumably) reassured that the airporttime connections can be met. In the Hong Kong AirportExpress, an arcing space at the ceiling over the center aisle isused to show an electronic map that has the downtown on theleft and the airport on the right. As the train proceeds throughthe journey, its location is shown on the electronic map.
The Hong Kong railcar is unique in its use of seat-backtelevisions for every rider, as shown in Figure 5-6. These tele-vision screens offer several channels of content, ranging fromstock-market summaries, to airport information, to comic silentmovies. At present, airline schedule information is provided;there are no plans to add real-time information about airlineflights. The televisions are heavily used, and, according to anunscientific survey, most riders select the silent movies.
The Heathrow Express and Oslo Express vehicles bothplace standard television screens near the doors (Figure 5-7).The layout of the Oslo train allows the television to be placedin the storage bin located in the center of the aisle, a highlyvisible location for the television. Immediately before depar-ture and arrival, the television displays information about thedeparture and arrival times. During the journey, the HeathrowExpress presents the BBC world news. The content of thetelevision program is sequenced by trackside radio beacons:for example, the message “We are about to arrive at Heathrow”is triggered when the train passes the appropriate point.
The Hong Kong system is based on silent images through-out; the Heathrow Express pipes the soundtrack of the tele-vision content throughout the vehicle. Users of cell phonescompete with the sound of the television service. To deal
Figure 5-5. Concept design for the Berlin Airport Express train.SOURCE: Adtranz.
Figure 5-6. Hong Kong Airport Express televisions arelocated on each seat back.
Pho
to:
Mat
thew
A. C
ooga
n

with the conflict, a “silent zone” is offered in both first-classand standard compartments, in which occupants are asked torefrain from using cell phones. (U.S. application of televisionsystems for essential information may need to incorporatesound to comply with the Americans with Disabilities Act[ADA] regulations.)
Shared Local Service to Downtown
The Role of Low-Speed Shared Service: Munich
Although several cities have chosen to create dedicated,express airport services, most of the airports in the sample areserved by rail lines, which are also used by daily commuters.Munich can be used as an example of a local strategy, because,as shown in Figure 5-8, the airport station is served only byconventional metropolitan railway equipment, with no directnational service. Recently, the Munich S-Bahn system madea major improvement to airport service with the addition of asecond local rail line, making no change in the basic strategyto serve the airport with the existing metropolitan rail system.
In 1998, the Munich system doubled the amount of serviceto the airport, with standard local equipment providing ser-vice that is shared with the other users of the system. A newline has been extended for 7 km (4 mi) from an existing route,the S-1 (shown at the left end of the dotted line on Figure 5-9),at a cost of DM 220 million (US $121 million). In the firstmonths of the new service, ridership from the airport stationincreased by 7 percent, with air passenger mode share risingfrom 28 to 31 percent. This increase in ridership is notable,in that the actual travel time by either of the two lines to down-town remains about 40 min, which is similar to that of theLondon Underground from Heathrow Airport but worse thanthat of most other local airport services.
The managers of the Munich S-Bahn system developed ahighly innovative method of providing the extra service to the
82
airport. Because there was no room in the schedule of theS-1 line for additional trains, the decision was made to serve twodestinations with one line by splitting each train into two trainsat Neufarm Station, as shown in Figure 5-9. The front cars ofthe train continue on to the airport, and the back cars of the traincontinue on the existing service to its terminal at Freising. Inthe opposite direction, the procedure takes about 4 min.
With the combined services of the two lines, the airport getsa combined 10-min headway, with no change of vehicle serviceto 9 downtown stations and immediate connections to 10 localrail lines and the national rail system at the central station.
The choice of shared service has led to problems. Initially,the airport opened with a check-in center located at the centralrailroad station. However, there was no way for the standardcommuter equipment to accommodate the baggage becausespace onboard was needed for use by passengers. The baggagewas placed on the airport bus, which operates to the central railstation. However, the downtown baggage check-in service wasabandoned for lack of use.
Characteristics of Low-Speed Shared Service:Interconnections with the Local System
The provision of airport services shared with the local railsystem has the potential of providing multiple points of trans-fer with other elements of the metropolitan system. Althoughthe multiple stops associated with most local rail services pro-vides for slower line-haul speeds, these stops allow for morepoints of interconnection than are provided by an expressservice to one or two terminal locations.
Between Munich Airport and Hauptbahnhof Station (thecentral station), there are 13 intermediate stations, makingconnections with 14 separate connecting rail lines (see Fig-ure 5-8). Planners estimate that 80 percent of S-Bahn userstake a second train to get to their destination.
Figure 5-7. Heathrow Express televisions are locatednear the doors.
Figure 5-8. The two Munich airport lines operate withstandard S-Bahn trainsets.SOURCE: Munich S-Bahn.
Pho
to:
Mat
thew
A. C
ooga
n

Figure 5-9. The dotted line shows the extension of a branch of the S-1 line (left) to the S-8 line (right) at theMunich airport.SOURCE: Diagram adapted from MVV brochure.
Between Heathrow Airport and Kings Cross Station, theLondon Underground’s Piccadilly Line has 23 stations andconnections to 12 separate routes. Thus, service is available tovirtually all of central London with only one rail transfer, asshown in Figure 5-10. The Piccadilly Line of London Trans-port uses standard rapid transit rolling stock, with low-speedoperation, and captures about 14 percent of the market fromHeathrow Airport. See Figure 5-11.
Germany and France have developed a hybrid metropoli-tan transit train that incorporates the higher speeds of com-muter rail with the downtown distribution characteristics ofrapid transit systems. Both the Frankfurt S-Bahn and the ParisRER (electrified suburban rail network) (Figure 5-12) sys-tems are designed to maximize the quality of transfer throughthe rest of the system. The Frankfurt system captures about21 percent of the market; the Paris RER captures 16 percentof the Charles de Gaulle Airport market.
The primary market for all these shared local services,however, is not the airport user, and the systems tend to oper-ate at capacity during rush hours. Finding room for baggagebecomes an annoyance to the air traveler and to the com-
83
muter alike. The physical design of many commuter transferstations does not accommodate the needs of travelers whohave baggage.
Lessons Learned: Successful Systems to Downtown
Express Service versus Multistop Service:The Role of Distribution
In each of these examples, the line-haul travel speeds fromthe airport to the center city are slow, but the service is wellintegrated with local distribution systems. In each of theseairports, the local rail service, with its shared services, cap-tures more of the market than does any other service.
An example can be observed in London: service on theHeathrow Express takes about 17 min to Paddington Station,leaving every 15 min. Piccadilly Line service to downtowntakes about 40 min, leaving every 4 min. The express train userwaits an average of 7.5 min and travels 17 min, for a totaltravel time to Paddington Station of about 25 min. The walk

Figure 5-11. The London Underground is poorlyconfigured for passengers with baggage.
Figure 5-12. The rail station at Charles de Gaulle Airportis served by the RER System.
Pho
to:
Mat
thew
A. C
ooga
n
84
Pho
to:
Mat
thew
A. C
ooga
n
Figure 5-10. The Piccadilly Line from Heathrow Airport offers direct connections to most of London’s rapid transit system.SOURCE: London Transport.

from the express rail platform, through the Paddington sta-tion complex, to the specific underground platform takes about7 min. The headway of the connecting service may add another5 min of waiting time. Examination of total trip times showsthat there are only a small number of Underground stations(the immediately adjacent stations on lines connecting fromPaddington) at which the total travel times for the HeathrowExpress plus Underground are superior to the Undergroundplus Underground travel times. (This analysis is based onunweighted transfer times; it is customary in the analysis oftransit times to weight the time spent waiting for a vehicle asat least two times that of the time spent on the moving vehicle.With such an assumption, the 4-min headway of the slowertrain results in a perceived travel time to downtown that iscompetitive with that of the faster train with the 15-minheadway.
Two markets are revealed: when the journey is to be com-pleted by taxi, the benefits of the express train to one terminalare obvious; when the journey is to be completed by localtransit, much of the travel time superiority is lost when the userhas to make the transfer onto the local transit system.
Even with significant differences in line-haul times, formany air passengers the modal decision may be less drivenby in-vehicle travel times than by the convenience of the trip.
85
Shared services make the air traveler endure whatever levelof overcrowding exists on the rail vehicle during rush hour,which, in London, can be a serious problem. Dedicated ser-vices provide guaranteed quality of service on the line-haulsegment, leaving the user with the need to find adequate dis-tribution from the rail terminal.
The Emergence of New Services: Fast LineHaul, Good Distribution
Officials at BAA, which owns the Heathrow Express, arenow developing service concepts that address the problem ofintegration into the rest of the transportation system. Withinthe next 3 years, another Heathrow Express service will beadded to St. Pancras Station, with stops at intermediate stationsto the north and west of London, as shown in Figure 5-13.In this service concept, Heathrow Express service to bothPaddington Station and St. Pancras Station would be offeredevery 15 min. A rider simply seeking the first line haul into thedowntown system would have service available every 7.5 min.
As an interim step to this improvement in distributionquality for the Heathrow Express, a new express service toPaddington Station that stops at intermediate rail stations willsoon be inaugurated. Stops at these transfer stations will allow
Figure 5-13. In the future, the Heathrow Express will be integrated into the suburban rail network.SOURCE: BAA (formerly British Airports Authority), Heathrow Airport Transportation Policy—Factfile, internal document, 1997.

rail passengers arriving from the west to intercept the HeathrowExpress trains earlier and to reduce their travel times. One ofthese stations—Ealing Broadway Station (see Figure 5-13)—will provide transfer to the London Underground rapid tran-sit lines, creating more options for distribution throughout thenetwork.
A Case Study: Fast Service versus Slower,More Direct Service
Planners at the Hong Kong MTRC have been examiningthe competitive market position of the fast rail and the slowerbus services available to the air passenger. High-quality, air-conditioned buses, which are often double-decked (see Fig-ure 5-14), provide direct service to many urban destinations.
Looking only at travel from the airport to downtown (Cen-tral Station), the fast train provides service in 23 min, atHK $70 (US $9.05). The Airbus A route takes 48 min andcharges HK $40 (US $5.15), while the standard city bus takes53 min and charges HK $21 (US $2.70). The rail gained 21 per-cent of the market, the airbus took 16 percent, and the citybus took 20 percent.
The factors that result in this high mode share to bus seemto include more than price minimization, because MTRC pro-vides good lower-priced service to the airport complex. Fromthe beginning, planners designed the rail system to operatewith two price points. While the Airport Express Line trainto downtown operates directly from the passenger terminalfor HK $70 (US $9.05), a second train, reachable by shuttlebus, operates from a nearby station. The entire trip (shuttle plustrain) on the standard train costs only HK $23 (US $3), whichis directly comparable with the cost of the city buses. In fact,the user of this connection can get to Central Station in only39 min, compared with 53 min on the city bus. But for thisprice-sensitive market, the shuttle bus-to-rail connection iscapturing only 3 percent of air passengers; the direct city bus
86
captures 20 percent. The bus system serves many area desti-nations directly, with no change of mode required for the trip.For the air traveler, directness of service may be more impor-tant than price minimization or line-haul speed to the termi-nal point (43).
In order to understand the motivation for mode choice—and to explore the attribute of directness of service—MTRCmanagers undertook some market research. Of those riderson the direct bus routes, an expected 55 percent said that thelower fare was a reason for choosing the bus; importantly, 51percent stated that directness of service (i.e., no need to trans-fer) was a reason for their choice of mode. Directness ofservice was considered a factor by only 18 percent of rail rid-ers, presumably those with destinations convenient to theterminals.
Of those riders on the Airport Express, an expected 63 per-cent stated that speed was the reason for choosing the rail.Some 13 percent of the rail users mentioned the fare as thereason, which is lower than the fare for either taxi or airportdoor-to-door bus service.
In an important conclusion, one of the original architectsof the Hong Kong Airport Express writes:
“It is apparent that even with a good design and well-integrated railway service, the Airport Express does nothave inherent advantages over more direct single mode bustravel. In other words, the speed advantage of rail versussingle mode road competitors when traveling over dis-tances of only up to 34 km [21 mi] do not result in signif-icant enough time savings to compensate for the necessarytransfer.” (44)
Lessons Learned: The Importance of Line-Haul Speed
Comparative Line-Haul Travel Times
The examination of relative line-haul speeds in the data-base of successful international airport rail operations hasseveral key implications for the U.S. practitioner.
The first implication, and by far the most important, is thedifference that exists in the basic travel-time conditions, largelyassociated with the existence of fast highway connections inthe United States. Four of the airports in the sample offer ser-vice to downtown that is twice as fast as automobile service.Table 5-3 shows that automobile travel times in Oslo are two-and-a-half times as long as the rail line-haul time. Table 5-3shows many examples in which the automobile travel timesare significantly higher than the rail travel times. Given theextent of roadway investment in the United States, attainingsimilar relative travel- time advantages for rail services will bedifficult in most U.S. applications.
The second implication is that the rankings of services byrelative travel times to downtown do not correlate linearly withthe rankings by mode share performance. The data reveal that
Figure 5-14. Hong Kong International Airport is servedby buses offering direct services to many local destinations.
Pho
to:
Mat
thew
A. C
ooga
n

it is the comparative travel time on a door-to-door basis thatseems to influence choice. The data presented in Table 5-3show that the focus on travel time to one point may be un-productive. There are many points in central London wherethe slower mode (i.e., the Underground) gets the traveler tothe destination without the negative experience of the trans-fer. There are many points in Hong Kong where the slowermode (i.e., the direct bus) serves the traveler more directly thanthe faster mode.
The third implication is that the travel-time characteristicsto downtown may not be a good surrogate for the travel-timecharacteristics to the actual destinations of the users. Thetravel time to downtown Geneva is an interesting piece ofinformation, but 75 percent of those leaving the Geneva Air-port are not going to the city of Geneva. The ratios of com-parative travel times to Lausanne or to Bern are considerablymore favorable to rail. The service must be designed basedon the understanding of the needs of the users and mustreflect the actual spatial distribution of trip-end destinations.
ELEMENT 2: SERVICE TO NATIONALDESTINATIONS BEYOND THE METROPOLITAN AREA
In 1980 in Zurich, the Swiss National Railways imple-mented the first airport–rail connection designed to link to afull national network rather than to just the immediate down-town and surrounding area. Before this time, other early raillines, such as that serving Brussels Airport, were basicallystub-ended terminals of local suburban railways. Even themost advanced connection—British Rail to Gatwick Airport—was marketed primarily to downtown London. But the Swisssystem was marketed as a direct path to all major nationaldestinations.
Twenty years later, airports throughout Europe are con-nected to national systems. Overwhelmingly, these national
87
connections are not provided by specialized dedicated ser-vices but feature integration with traditional national rail ser-vices. However, a few examples of dedicated services forareas beyond the downtown have been operated and are sum-marized below. These services include the early efforts byLufthansa to provide national rail service exclusively for airpassengers.
Dedicated National Service
Lufthansa Airport Express
The earliest example of the use of specially built equip-ment for national intercity connections was the LufthansaAirport Express (Figure 5-15), which started service betweenFrankfurt and Düsseldorf International Airports in March1982. In 1990, service was inaugurated to Stuttgart. Signifi-cantly, the dedicated service was replaced with a shared-rail
Rank insample City/airport
Rail modeshare:percent
Car timeto CBD:minutes
Rail timeto CBD:minutes Ratio
Airportdistance:miles
1 Oslo 43 50 19 2.6 302 Narita 36 90 55 1.6 423 Geneva 35 10 10 1.0 34 Zurich 34 20 10 2.0 85 Munich 31 35 40 1.1 186 Frankfurt 27 20 12 1.7 67 Stansted 27 70 40 1.7 348 Amsterdam 25 30 17 1.8 99 Heathrow 25 15
Heathrow Express 11 45 15 3.0 15Piccadilly Line 14 45 45 1.0 15
10 Hong Kong 24 35 23 1.5 2111 Gatwick 20 80 30 2.7 2812 de Gaulle 20 45 35 1.3 1513 Brussels 16 20 14 1.4 1014 Orly 14 25 35 0.7 8
TABLE 5-3 Comparisons of line-haul time, by modes and distance
Figure 5-15. The Lufthansa Airport Express was an earlyexample of a dedicated service to national destinations.SOURCE: German Railways.

service, which accommodated air passengers on regularlyscheduled national trains.
Between 1982 and 1990, ridership on the line to Colognegrew from 62,000 passengers to 216,000. However, an exam-ination of the markets for which there was also air service(to either Cologne/Bonn or Düsseldorf Airports) reveals thatmore than 600,000 passengers per year chose the plane and200,000 passengers per year chose the train. It is estimatedthat the dedicated train captured 28 percent of the airlinemarket to Bonn, 37 percent of the market to Cologne, and 35percent of the market to Düsseldorf (45).
On the line from Cologne, baggage check-in occurred onthe train, with agents accepting bags at the traveler’s seat. Onthe line from Stuttgart, check-in occurred at the train station.Airline through-tickets were available for train stations inDüsseldorf, Cologne, Bonn, and Stuttgart.
By the mid-1990s, the Lufthansa Airport Express was oper-ating in competition with many national rail services. LufthansaExpress operated only 4 trains per day toward Cologne; thenational system operated 21 trains per day in the same corri-dor. The net result was that a ticket holder on the dedicatedLufthansa Express might wait on the platform, watchingnumerous fast trains go to his or her exact destination.
With the introduction of 185-mph ICE trains on four routesout of Frankfurt Airport, it became clear that utilizing thenational rail network made more sense than continuing opera-tion of specialized trains just for airport passengers. Lufthansaabandoned the separate train service and began a program toreserve certain seats on the standard national rail train.
Narita Express
JR East Railway’s Narita Express operates dedicated airportrail service to six additional destinations beyond the CBD.However, most passengers use only the segment from Tokyo’sCentral Station to the Narita airport (see Figure 5-16). Ingeneral, connections between Tokyo Narita Airport and thenational rail destinations are made by transferring at CentralStation.
88
Oslo Airport Express
Although most dedicated services do not go beyond theprimary metropolitan area, the Oslo Airport Express is de-signed to provide specialized airport-oriented rail equipmenton longer-distance connections. Of the six trains per hour thatserve Oslo’s Central Station, three continue toward the southand west.
Summary
In general, rail services from airports to destinations beyondthe primary downtown area are provided by the national inter-city rail network and are not dedicated to the air passenger. Thecase of the Lufthansa Airport Express demonstrates the diffi-culty of providing such services to a limited market over longdistances. However, the success of the Oslo Airport Express,which is offered to several cities, is an example of the use ofdedicated equipment to serve markets beyond the CBD.
Shared National Service
Integration with the National Rail System:Copenhagen
In Switzerland, the Netherlands, and Denmark, there aregood examples of the integration of airports into nationalrail networks. A good example of national integration was theopening in 1998 of national rail services to a new station atCopenhagen Airport. The rail station at the airport is expectedto attract about 4 million passengers in 2000 and 5 million by2005. It is forecast that 1.4 million passengers from Swedenwill use the new cross-sound rail service to the Copenhagenairport (46).
Swedish air passengers will access Copenhagen Airportover a new 18-mi bridge-and-tunnel connection between Den-mark and Sweden (depicted in Figure 5-17). The combinedhighway-and-rail connection will cost about Skr 34 billion(US $4 billion). The new rail trains for the binational servicewill cost Skr 2.3 billion (US $270 million). Service across thechannel to Sweden will operate every 20 min.
A proposed timetable from Copenhagen Airport showssix trains per hour departing for Danish destinations and fourtrains per hour departing for Swedish destinations. Seventrains a day would proceed to Stockholm, and five trains aday would connect the Danish airport with Gothenburg. It iscalculated that a train will either arrive or leave every 4 minin rush-hour service. The combined departures will make theairport rail station one of the busiest in the world.
The air passenger boarding a train at Copenhagen Airportwill be able to purchase an integrated public transportationticket, covering all public modes needed to reach his or herdestination. A single tariff system has been designed, whichhas 7 fare zones on the Danish side and 10 fare zones on the
Figure 5-16. The Narita Express offersdedicated airport rail services to sixstations beyond the CBD.SOURCE: JR East website (www.jreast.co.jp/nex/index.htm).

Swedish side of the sound, that serves all combinations of busand rail travel within the newly united region. Through fareswill be designed so that the integrated ticket will always becheaper than the sum of the separate tickets. The associatedcompanies are spending Skr 0.5 billion (US $61 million) tobring about the integrated fare collection system (47).
Rejection of Dedicated Service for Air Passengers
Although dedicated express airport services are being devel-oped in many areas around the world, managers of the Dan-ish and Swedish rail systems are taking the opposite approach.No attempt is being made to offer separate services to air pas-sengers. Rather, the Danish rail system serving the airport isbeing restructured to offer passengers the kind of amenitiesassociated with a dedicated express concept. Most Europeanrailways offer two classes of service; Danish Railway hasoffered a third—“super first class.” Called “Business Plus,”the service includes a meal and often a compartment con-taining business equipment. In a highly unusual marketingscheme, Danish Railway charges a fixed price without regardto the distance of the trip.
Danish rail officials are now implementing a program ofjoint ticketing in which the price of the rail journey is includedin the airline ticket. A pricing system based on four zones isbeing used for the unified air–rail ticket. This new kind of
89
ticket will supplement the existing national program of inte-grated rail and bus tickets. The ground access system servingCopenhagen Airport provides a good case study for the inte-gration of air and rail services, because at all times it servesthe air passenger with services primarily designed for thenational intercity market.
National Systems: Standard Speed Intercity Rail
Switzerland.The connection of the Zurich airport to theSwiss National Railway system in 1980 has resulted in signif-icant passenger growth for the airport rail service. Between1981 and 1989, rail traffic from the airport grew by 74percent, while air traffic as a whole (including connecting air-line passengers) increased by 67 percent (48). In 1987,Geneva Airport opened its rail station to complete the system.
It is estimated that 33 percent of Zurich Airport air passen-gers using the rail system come from the city of Zurich andanother 8 percent come from the rest of the metropolitan area.Thus, some 59 percent are coming from outside the metro-politan area. For Geneva, only about 25 percent of the air pas-sengers using the rail come from the city of Geneva, and 75 per-cent come from the rest of Switzerland and from France (49).
Currently, the Zurich airport is served by more than 170trains per day, and the Geneva airport is served by 130 trainsper day. Service is provided every hour on the main east–westline linking Zurich and Geneva.
Amsterdam.Like both Zurich and Geneva, the rail stationat Amsterdam’s Schiphol Airport is located on the nationaleast–west trunk line and has direct service to most of theNetherlands. The airport is served by 550 trains per day.
Oslo. In addition to the operation of dedicated service tothree corridors, Oslo Airport is served by traditional Nor-wegian State Railways services, as part of a national pro-gram to upgrade the railways’ intercity network to the stan-dard of 125-mph service. Figure 5-18 shows the travel-timedifference that the national upgrading program will provideto the users of the new airport—as much as 50 min of travel-time savings.
National Systems: High-Speed Rail
France and Germany have established airport access con-cepts that are fundamentally different from those adopted inmost other airport access systems; both countries are build-ing new, dedicated rights-of-way for high-speed rail into theirlargest national airports. Amsterdam’s Schiphol Airport isserved by the Thaylis trains, which currently achieve 180-mphservice only between Brussels and Paris.
Germany. Germany is now building rail infrastructure,which will take the new ICE train directly to airports in
Figure 5-17. Copenhagen Airport is served by a newnational and international rail system.SOURCE: We Are Linking the Øresund Region Together: A Fixed Link to the Future:Trains and Buses in an Integrated Public Transport Network with a Single Tariff andTicket System. Danish State Railways, Statens Järnvägar, and HovedstadensTrafikselkab, Copenhagen, 1977.

Frankfurt, Cologne/Bonn, and Leipzig/Halle and to a newAirRail station connected to the Düsseldorf Airport via apeople mover. The first of these stations designed specificallyfor high-speed rail services opened in 1999 at the Frankfurt air-port. The Frankfurt investment is the cornerstone of anational policy to expand Frankfurt Airport (and implicitlythe role of the national airline) for international traffic.
Frankfurt Airport is developing an ambitious program toreplace short-distance airline feeder services with improvedrail connections. Only a limited number of slots are availablefor use at the Frankfurt airport; airport officials believe thatthe overall productivity of the airport can be increased byreallocating these slots for longer-distance flights.
90
The long-term plans for the expansion of Frankfurt Airportcall for an increasingly important role for high-speed rail. In1991, fewer than 10 percent of air travelers used the vari-ous national services, with about 19 percent using the localS-Bahn metropolitan railway. By 2010, airport forecastscall for 28 percent of air travelers to access the airport bythe national railway and 15 percent by local railway. Thus, thegoals of the airport call for nearly a three-fold increase ofthe present role for intercity rail to destinations beyond themetropolitan area.
France. SNCF is investing heavily in a new rail systemto serve Charles de Gaulle Airport. A new circumferential railline has been built bypassing Paris, allowing trains from thenorth (from Lille, London, or Brussels) direct service to thesouth (such as to Lyons and Nice). The new TGV servicepromises a travel time from Charles de Gaulle Airport toBrussels of 1.5 hr and to Lyons of 2 hr. Ultimately, full imple-mentation of the high-speed rail service in England wouldallow for a 3-hr travel time to London. At the present, the mar-ket for these services is building slowly, with about 3 percentof airport passengers using the TGV services.
Extension of the French–British “Eurostar” Chunnel trainto Heathrow Airport is under preliminary discussion.
Lessons Learned: Integration with the National System
In the examples above, whether the integration is with high-speed technology (France and Germany) or intercity rail ser-vice (Denmark, Switzerland, and the Netherlands), the air-port strategy takes advantage of a capital investment decisionalready made for the rest of the national network. It is impor-tant to emphasize the scale of the national rail networks intowhich the airports have been integrated, because the lack ofsuch rail networks in the United States will make similar strate-gies infeasible at most U.S. airports.
The travel times from the four high-speed lines serving thenew Frankfurt Airport ICE station will provide service that isactually competitive with the short-distance air trips that air-port officials are trying to discourage. A 1-hr travel time fromFrankfurt Airport to downtown Bonn is directly competitivewith, and probably better than, the same trip by commuter air-craft. The traveler in western parts of Belgium may be inducedto make an international trip through Charles de Gaulle Airportrather than through the Brussels airport, because of the railtravel times created by the TGV.
Whether the rider chooses a service with a fast line-hauljourney with very few stops or a service with a slow line-hauljourney with many points for transfer, the subject of distri-bution to the final destination needs to be addressed. Whilethe top speed of the train is always of interest, it is the overalltravel time of the entire journey that the customer considers
Figure 5-18. Norway is improving its intercity railtravel times to serve the new airport.SOURCE: Norwegian Railways.

in choosing a travel mode. The designers of the system serv-ing Copenhagen Airport have set a precedent for future sys-tems integrating airport rail services into a national systemwhose overall quality is designed to meet the needs of the busi-ness traveler so often sought by the airlines.
ELEMENT 3: THE IMPORTANCE OF THE RAILCONNECTION AT THE AIRPORT
This chapter reviews the importance of the quality of ser-vice provided by the train, the quality of the experience ofboarding the train, and the quality of the experience of con-necting to the rest of the transportation system in order toreach a final destination. For the potential rail customer arriv-ing at an airport, key issues are the ease of locating the railplatform and the seamlessness of the connection to that railplatform. The creation of a high-quality, intermodal trans-fer facility often requires a high degree of cooperationbetween the airport designer and the rail system designer.To clarify the nature of the task of designing the transferbetween rail and air, this section is presented in two parts:first, the task of designing a rail transfer facility at a new air-port is reviewed; second, the issues of designing a rail trans-fer facility for an existing airport are reviewed. In each part,the difficulty of providing direct rail access is related to theconfiguration of the airport’s passenger terminals.
Rail Connections at New Airports
Hong Kong
Few designers get the opportunity to plan an optimal inter-modal system—a system characterized by the simultaneousdesign of the airport and the ground access services and viewedas one larger system. New airports have been built from theground up in Paris, Dallas/Fort Worth, and Denver withoutachieving the integration of aviation and rail systems. Paris’Charles de Gaulle Airport was originally designed as a highlydecentralized airport, with rail service to a town center but notto any of the terminals. By contrast, in both Oslo Airport andHong Kong Airport, the designers were given the task of opti-mizing the relationship between the air and rail facilities.Hong Kong’s airport can be viewed as one of the most aggres-sive attempts to date to integrate the rail station with the air-port terminal structure.
Terminal Concept.From its earliest conceptualization inthe Hong Kong airport master plan, the rail station wasdesigned as a two-story structure (see Figure 5-19). For theenplaning cycle, the arriving train platform is located at thecheck-in level; for the deplaning cycle, the departing trainplatform is located at the baggage-claim level. The passengeris provided a free baggage cart from the baggage-claimcarousel to the door of the train and does not change levels orexperience any fare collection equipment.
91
The passenger flows in the air terminal have been designedto distribute passengers evenly over the cars of the train. Al-though the air terminal is more than 1,000 ft in length, the railplatform has been configured to be parallel to (as opposed toperpendicular to) the length of the airport. On the deplaninglevel, the airport passenger exits either at the northern arrivalhall or at the southern arrival hall several hundred feet away.For each half of the airport, there is a simple, direct path tothe train. Those passengers from the southern arrival hall aredirected to the southern segment of the train, those from thenorthern arrival hall to the northern segment—this arrange-ment evenly distributes passengers through the length of thetrain. This pattern of locating the long, linear rail platform ofthe train parallel to the linear form of the air terminal was firstapplied in the Frankfurt airport, which has three points ofaccess to the platform. The rail platforms at most airports, suchas in Oslo and Munich, are configured perpendicular to theterminal; with just one point of access, passengers tend to“bunch” onto the nearest cars.
Having all the trains leave from one terminal station hascertain operating advantages. Like the Gatwick Express, theHong Kong station is operated so that there is always a trainwaiting at the platform. From the moment the passengerenters the rail station platform, he or she may start selectinga seat, stowing baggage, and so forth. Large electronic signsstate exactly how many minutes remain before the departureof the train. In general, the task of providing simple graphicdirections to the passenger is easier when there is only onerail station.
The Seamless Connection.MTRC has succeeded in mak-ing the path from the baggage claim to the train as seam-less as possible. Personnel representing the Airport ExpressLine are located at the doorway between the customs clear-ance hall and the arrivals hall. Ticket booths and automatedmachines are located in the arrivals hall on the path from cus-toms clearance to the rail platform.
Figure 5-19. In Hong Kong, enplaning passengersconnect from the rail on the upper bridge, while deplaningpassengers connect to rail on the lower bridge.
Pho
to:
Mat
thew
A. C
ooga
n

The airport rail station has been designed without any farecollection equipment, even though entrance to every otherstation in the rail transit system requires that a ticket be insertedinto a turnstile. The passenger merely uses the ticket to get outof the station when he or she has reached his or her destina-tion. Every passenger is expected to have a ticket, but thereis a fail-safe procedure in the event that a passenger does nothave a ticket. Any passenger approaching the outbound turn-stiles at the destination station without a ticket is forced topay the highest fare on the system, which is the fare to theairport. Staff at all stations are trained to be polite to any-one who looks like an airline passenger and to arrange for aticket sale at that point. Thus, there are no impedimentsbetween the arrival hall and boarding the train. The on-boardstaff members do not sell tickets.
Just before the arrival of the trains from downtown, thestaff of the Airport Express distribute empty baggage cartsalong the length of the platform. Thus, when the doors of thetrain open, the rider sees a supply of available, free baggagecarts immediately on his or her path into the air terminal.
92
Dealing with Expansion.The air terminal serving the first40 gates of the Hong Kong airport is located immediately tothe east of the two-level rail station. When the number of air-port gates has more than doubled, a second air terminal will bebuilt immediately to the west of the rail station. When the air-port is fully built out, the walking distance from the train,through the check-in, and down to the underground peoplemover will be the same for both terminals. Thus, all 100 gatesof the ultimate build-out will be served by a single rail station.
Oslo
In terms of an architectural concept for an airport–rail con-nection, the layout of Oslo’s airport is more traditional, with therail platforms located immediately below the arrivals hall. Fig-ure 5-20 shows the walk from the arrival hall (labeled 2 ) toescalators and elevators (labeled 1 ) that serve the train plat-forms immediately below. All trains depart from these plat-forms, including the dedicated Oslo Airport Express, the
Figure 5-20. Escalators and elevators connect the arrival hall to the trains below.SOURCE: Oslo Airport at Gardermoen.

national intercity rail, and local trains. The direct distance be-tween the arrival hall and the rail platform is actually shorter atthe Oslo airport than in the Hong Kong airport. However, interms of ease of access, each change of level is a matter of someconcern to those passengers with baggage, whether they havea baggage trolley or not. Similar “basement” locations at a cen-tralized terminal are used in most European air rail stations.
The layout for the rail station is highly unusual, making theconnection to the train as seamless and unencumbered aspossible. The four tracks are laid out so that the passenger wait-ing for a departing Oslo Express train waits only on one cen-ter platform, which is served by two tracks. In a layout usedin most airport people-mover shuttle configurations, each ofthe two arriving trains is also served by a separate outside plat-form. In this configuration, the arriving train always opensthe outer doors first, sending the exiting passengers onto theexterior platforms; then the inner doors are opened for thenew passengers to board the empty train. Although this isa common design for people movers, most rail stationdesigns allow only one platform per track. The flow fromterminal arrival hall to departing train is accomplished withabsolutely minimized interference, with the luxury of pro-viding separate graphic content for enplaning and deplaningpassengers.
The expansion plan for Oslo Airport calls for the creation ofa new midfield concourse, which will be served by the exist-ing landside terminal.
New Airports with Difficult Connections:Charles de Gaulle
Not all airports that are built from a “green field” have easyconnections for major rail investment. The original conceptfor Charles de Gaulle Airport proposed a series of terminals,architecturally modeled after Terminal 1, located in a highlydecentralized format around a town center, where the origi-nal rail station is located. A people-mover loop would haveconnected as many as eight of these unit terminals. In the1990s, a new vision was developed: Terminal 2 is directly adja-cent to the new rail terminal, which provides service to bothlocal and national lines. As shown in Figure 5-21, the long-term plan of the airport calls for the construction of two sep-arate people movers: one to connect the new rail center withthe original Terminal 1, and a second to connect the new railcenter to the new boarding areas within Terminal 2.
Although the ultimate introduction of the automated peo-ple mover will help the transfer process from Terminal 1 tothe TGV rail station, the connection is highly indirect, givinga distinct travel advantage to travelers using automobiles.
Adding the Rail Station to Older Airports
Retrofitting an Existing Airport: Zurich
Most public transportation planners, whether within or out-side the United States, do not get the luxury of starting from a
93
clean slate with the simultaneous implementation of a new air-port and a new transit line. In most cases, the design challengeis to take a rail line into an airport that is largely developed,which is a different challenge than that experienced in Oslo orHong Kong. The airport rail station in Zurich can be used asan example, as it was built into a working airport and is nowbeing rebuilt to provide higher standards for the rail user. Therail alignment on the upper right of Figure 5-22 shows how the
Figure 5-21. Two separate people-mover systems will berequired to connect the Charles de Gaulle air terminalswith the primary airport rail station.SOURCE: Matthew A. Coogan.
Figure 5-22. A new connection to the air terminalcomplex will be built in Zurich.SOURCE: Zurich Airport, 1999.

alignment missed the older portion of the airport (the terminalstructure on the left) and was coordinated with the construc-tion of a new terminal (on the right side of the diagram). In thepresent facility, the pedestrian connections from the arrivalhall to the basement rail line cause the traveler to walk up,over, and down, using a path over the airport access road, thendown several stories to reach the lower level of the platform.
The needs of the rail user have guided the development ofthe expansion of the airport and the development of a mid-field airside concourse. Specifically, the mezzanine level ofthe rail station is being extended directly under the accessroad to allow direct access to the adjacent main terminal anda new air passenger departure center being constructed. Anew set of escalators from the mezzanine level will replacethe up-over-and-down path over the access road. A peoplemover connecting with the new midfield concourse will leavefrom the same level as the mezzanine of the rail station. Toserve the rail user better, 60 new airline check-in positionswill be built on the mezzanine level of the rail station, mini-mizing the need for changes of level for those passengers car-rying baggage.
Zurich Airport officials have committed to a public policygoal of 50 percent mode share to public transportation for airpassengers and a 40 percent mode share for employees.
94
Retrofitting the Multiple Terminal Airport:Heathrow
Airports with multiple landside terminals will continue tobe a challenge to the ground access designer. At present, boththe London Underground and the Heathrow Express centralterminal area stations are located in a plaza between Termi-nals 1, 2, and 3. The passenger gains access to the rail stationsby long, poorly lit underground walkways.
The future layout of Heathrow poses a greater challenge,as the new Terminal 5 is not contiguous with any other ter-minal. Plans call for the Heathrow Express trainset to split intwo at the first station, with the front section proceeding toTerminal 5 and the back section proceeding to Terminal 4.To accomplish a similar function, half of the Piccadilly Lineservice will be routed to Terminal 4 and half to Terminal 5,as shown in Figure 5-23.
Alternative Locations for Check-In at the Airport
Auxiliary Locations Within the Airport
In some cases, the connection between the airport termi-nal and the rail line will pose new design challenges. Even in
Figure 5-23. Heathrow Airport will have three major terminal areas, making rail access a challenge.SOURCE: Matthew A. Coogan.

the case in which the rail has been well integrated into a newterminal at the airport, there may be long walking distancesinvolved in getting to the plane. At Copenhagen Airport, thenew Terminal 3 complex is directly connected to the new railline, but walking distances to the other terminals are still aproblem. To address the needs of the rail user with cum-bersome baggage approaching the airport, an additionalcheck-in facility that serves all the flights of the airport hasbeen placed in the lobby of the rail station (Figure 5-24).Since the airport’s opening in 1982, Munich travelers depart-ing with Lufthansa have had the benefit of a special check-inarea located immediately in the mezzanine lobby of the railstation. Now, with Lufthansa providing check-in services forall airlines of the Star Alliance, other airlines are offeringcheck-in services at the mezzanine lobby of the rail station.As noted above, the reconstruction of the Zurich airport willadd some 60 check-in positions at the mezzanine level of therail station.
The Check-In Facility in the Airport Rail Station
Each of these auxiliary check-in locations is located withinthe airport in order to improve service for the passenger con-tinuing to the gate on foot. The concept is being applied on alarger scale with people movers in several new projects atGerman airports. In Frankfurt, a second airport rail stationserving the ICE high-speed rail system has been constructed.Because of the complexity of routing four new high-speedrail lines, it was impossible to expand the existing station,which is located in the basement of Terminal 1. The new railstation is located across a major expressway, which is notconvenient for the air passenger who is going to either Ter-minal 1 or Terminal 2. The new rail station location requiredan extensive program to improve the quality of access to theair terminals. In the final design, a people mover will connectthe new station and adjacent hotel and convention center com-
95
plex with the new Terminal 2; moving walks over bridges willconnect the new station to the original Terminal 1.
To aid the provision of the seamless transfer, the GermanRailway has built a significant complex within the rail sta-tion itself. This includes the construction of a frequent trav-eler lounge immediately above the tracks and a full-scaleairline check-in facility as part of the rail station complex(Figure 5-25). In a highly unusual design strategy, airlinepassengers with through-tickets on the rail system will claimtheir airline baggage at the rail station; customs clearance islocated there.
The concept of a major check-in facility located at the pointof transfer for the rail passenger is a common theme in devel-oping plans for AirRail terminals in Germany. At DüsseldorfAirport, it was determined that it would not be cost-effectiveto reroute the major high-speed rail line off of its alignmentand into the airport terminal area, a distance of 1 mi. Instead,a new people mover is being built to connect the air terminalwith the existing alignment of the high-speed rail system.Figure 5-26 shows the point of transfer between the high-speed rail service and the airport people mover, where a full-scale airline check-in facility will be built at the mezzaninelevel of the train station.
Moving the Air Terminal to the Airport Rail Station
In the examples of the Frankfurt and Düsseldorf Airports,the designers have added a second, or auxiliary, check-in facil-ity that is convenient for those passengers who access the air-port by rail. A more aggressive strategy is being implementedat the Leipzig /Halle airport, in the former East Germany.Here, all landside terminal functions (check-in, baggage claim,etc.) will be relocated to the mezzanine level of the new high-speed rail station (described as the “Central building” in Fig-ure 5-27).
Figure 5-24. A check-in station (left) is located in the railstation at Copenhagen Airport.
Figure 5-25. The new rail station in Frankfurt InternationalAirport has airline check-in services in the rail station lobby.SOURCE: Frankfurt Airport.
Pho
to:
Mat
thew
A. C
ooga
n

The existing airport complex is located to the south of therail line; the next phase of development will occur on thenorth side of the rail line. The landside services of the exist-ing airport are being moved to a “bridge” over the high-speedrail line, which will become the central element of the newairport. The architectural expression of this multimodal ter-minal, located over the rail and highway, is shown in Fig-ure 5-28.
Leipzig is not the only airport to propose relocating the airterminal complex to the main line rail station. The long-termplan for London Luton Airport, to the west of London, callsfor the landside functions of the existing airport to be re-located approximately 1 mi away to a new intermodal terminalthat will be built over the main line tracks to London. A peo-ple mover would then connect the new landside air terminalwith the airside concourses. The plan has a series of phases;initially, the check-in functions at the rail station will belinked to the existing airport terminals by bus.
96
Because Luton Airport is located on a main commuter railline, existing express service links the Luton train station withLondon’s Kings Cross Station in about 20 min. Kings CrossStation will become a critical international interchange pointwhen both the “Eurostar” Chunnel service and a new HeathrowExpress service are routed there later in the decade.
Lessons Learned: Alternative Check-In Locationsat the Airport
For many U.S. airports, it will be difficult to develop railservice to all airport passenger terminals—a design charac-teristic of most of the successful airports in this study. ManyU.S. airports plan some form of people mover to link the ter-minals with rail services. Others are considering the creationof “ground transportation centers,” from which all forms ofpublic transportation would be dispatched. The emerging pat-tern of auxiliary check-in services in Germany and in othercountries is relevant to the design and planning of these U.S.transfer facilities. With the reconstruction of Reagan NationalAirport, US Airways has added an auxiliary check-in positionat the terminal entrance serving the pedestrian bridge connect-ing from both the WMATA Metro station and the principalparking garage. Placement of this check-in desk at the bridgelevel of the terminal eliminates the need for the rail transituser to proceed up one level to the main check-in area and thenproceed back down to the departure concourse. In HartsfieldAtlanta Airport, Delta Air Lines has opened a check-in facil-ity at the level of the rail station.
At the present time, the potential of baggage check-in ser-vices at Jamaica Station is being explored to support the newrail connector service to JFK Airport. Designers of Miami’sIntermodal Center are examining the option of a second loca-tion for airline baggage claim, inside the new intermodaltransfer facility; this facility is similar in concept to the facil-ity being built as part of the new Frankfurt Airport ICE railstation. The option of adding check-in service at Newark Air-
Figure 5-27. The airport passenger terminal atLeipzig/Halle Airport will be relocated to the new high-speed rail station.SOURCE: Leipzig /Halle Airport.
Figure 5-28. An architectural rendering of the Leipzig/Halle air terminal at the high-speed rail station.SOURCE: Düsseldorf International Airport website (www.duesseldorf-international.de/).
Figure 5-26. Airline check-in functions occur in the newDüsseldorf International Airport rail station.SOURCE: Düsseldorf International Airport website (www.duesseldorf-international.de/).

port’s new rail station serving New Jersey Transit rail ser-vices has been preserved in the existing designs.
In the successful rail systems, a wide variety of strategiesare being developed to help the user who accesses the airportby rail. From the 60 new check-in stations at the ZurichAirport rail station, to the ambitious plans for airline baggageclaim and customs clearance at the Frankfurt Airport rail sta-tion, to the plans to move airport terminal functions to therail stations in Leipzig and Luton, the successful rail systemsare using alternative check-in strategies to provide seam-less transfer.
The Role of Airport Configuration
Some forms of airport configuration are easier to servedirectly by rail than are other forms of configuration. At theextreme ends of the spectrum, the relationship between air-port configuration and ground access systems can be observed.There are currently no plans to take any form of rail serviceto Charles de Gaulle Airport’s existing Terminal 1, which wasoriginally conceived as an element of a highly decentralizedairport. London’s Heathrow Airport will operate five sepa-rate terminals, clustered as 1, 2, 3, (the central terminal area)and 4 and 5. In the United States, New York’s JFK Airportwill require nine stations in order to serve adequately all theairport activity areas.
At the other end of the spectrum, all services from OsloAirport and Hong Kong Airport leave from one transferpoint, which is located next to baggage claim or customsclearance. Airports with highly centralized landside facilitiesappear in Zurich, Geneva, Oslo, Stansted, Hong Kong, andMilan. Most airports built from the ground up are now beingplanned to utilize a single landside terminal rather thanmultiple unit terminals; the new Berlin Brandenburg Inter-national Airport is an example of this.
As shown in Table 5-4, most of the airports with the high-est mode shares to rail are characterized by direct rail con-
97
nections to a single, centralized point of transfer to a compactairport landside terminal. Of the top 10, only Tokyo Naritaand Heathrow Airports have adopted a two-station strategy.Within our sample of 14 airports, only 2 rely on either a busor a people mover to get from the train to major air terminals;both airports are in Paris, and both rank near the lowest inmode share attracted to rail.
Lessons Learned: Quality of the RailConnection at the Airport
The Importance of the Seamless Connection
The successful rail systems provide a wide variety of con-cepts of value to the U.S. practitioner seeking to design aneffective connection between the airport terminal and the railplatform. Perhaps more than any other transfer facility in theworld, the Hong Kong Airport rail station demonstrates theattention to detail desired by the air passenger. The path frombaggage claim to the rail vehicle should be as direct as pos-sible, even if this is difficult to accomplish. The level of facil-ity integration at the Hong Kong airport can be considered agoal to be sought by designers in the future. The rider, carry-ing baggage, walks from the customs clearance point to thetrain without changing levels and without ever using turn-stiles or any form of impediment. Similarly, the simplicity ofthe pedestrian path from the Oslo airport’s arrival hall to thecommon departure platform represents a design attribute tobe emulated.
The available data reveal that good integrated connectionsat the airport are correlated with successful mode share, butthat good connections are a necessary but not sufficient ele-ment of a total strategy. The terminal design with the highestquality for the rail user—that of the Hong Kong airport—cap-tures about 21 percent of its market, placing the airport in thetop 10 in terms of market share, but lower than the top 5, eachof which attracts more than 30 percent mode share.
The case studies presented in Chapter 4, however, suggestthat many airports have neither the centralized characteristicsof the Hong Kong airport nor the decentralized characteris-tics of Dallas /Fort Worth Airport. Most can be categorizedas somewhere in the middle. Expanded air traffic has causedthe creation of multiple landside air terminals in airports orig-inally designed to operate from one terminal, including TokyoNarita, London Gatwick, and Frankfurt Airports. Most air-ports in the sample grew incrementally, with one rail facilitynow expected to serve several terminal buildings, as in theBrussels and Copenhagen airports. For each of these incre-mentally developed configurations, solutions have to be de-signed to help the passenger connect with the rail vehicle asseamlessly as possible.
ELEMENT 4: THE IMPORTANCE OF A STRATEGY FOR BAGGAGE
Creating a strategy to deal with the problem of baggage isa challenge for all designers of airport ground access systems.
Airport
Railmodeshare
Numberof stopsat airport
Compactterminalcomplex
Oslo 43 One YesTokyo Narita 36 Two NoGeneva 35 One YesZurich 34 One YesMunich 31 One YesFrankfurt 27 Two OneStansted 27 One YesAmsterdam 25 One YesLondon Heathrow 25 Two NoHong Kong 24 One YesLondon Gatwick 20 One PartialBrussels 16 One PartialParis de Gaulle 15 Two NoParis Orly 6 No direct No
TABLE 5- 4 Single-terminal versus multiterminalairports

The responses to the problem range from doing nothing todeveloping elaborate, full-service off-site check-in facilities.However, a variety of lower-cost options are being testedaround the world. To explore the issue in some detail, the solu-tions for baggage handling can be examined in terms of twomajor categories: (1) full-service downtown check-in centersand (2) national schemes to deal with many off-site check-inopportunities.
Full-Service Downtown Check-In Centers
The downtown check-in center at London’s PaddingtonStation can be used as a best case practice for off-site check-in facilities. The Paddington Station check-in system is thenewest in the field and can be compared with the experienceat London Gatwick Airport and in Hong Kong.
Heathrow
At Paddington Station, a new airport check-in center, com-plete with food services and concessions, has been built aspart of the Heathrow Express project (see Figure 5-29).
The Heathrow Express operates on two tracks, tracks 6and 7, located in the center of Paddington Station. A total of28 check-in stations have been built as shown in Figure 5-30.Bags must be checked in 120 min before flight time, whichis the same time as is required at the airport for internationalflights, but somewhat longer than is required for domesticflights.
Baggage is routed onto a conveyor belt running under theplatform. Between the baggage check-in facility and the frontof the train, a long secure tunnel has been built (see Fig-ure 5-31).
At a secure location at the front of the train, the baggagebelt rises to the level of the platform, where each bag has its
98
bar code read and is entered into the tracking system (Figure5-32). Bags are placed in a container, of which there is onefor each of the four terminals at Heathrow Airport. The con-tainer is then padlocked (Figure 5-33). At this point, the com-puter system has tracked the placement of each bag into eachcontainer.
The container system is not automated, and the containeris pushed by the attendant onto the baggage car, which islocated immediately behind the cab of the airport-bound train(Figure 5-34). As each container leaves the handling area atHeathrow Airport, it is scanned into the system, which thenhas a record of the time when each bag has been transferredfrom the rail system. Containers are carried to each of the fourterminals by four airport trucks. At the specific terminal, thebags are entered into the terminal baggage system with otherbags being checked in at the terminal.
Figure 5-29. London’s Paddington Station is the newestdowntown check-in center.
Figure 5-30. The bag is checked in.
Figure 5-31. The bag is sent on a conveyor belt under theplatform to the head of the train.
Pho
to:
Mat
thew
A. C
ooga
n
Pho
to:
Mat
thew
A. C
ooga
nP
hoto
: M
atth
ew A
. Coo
gan
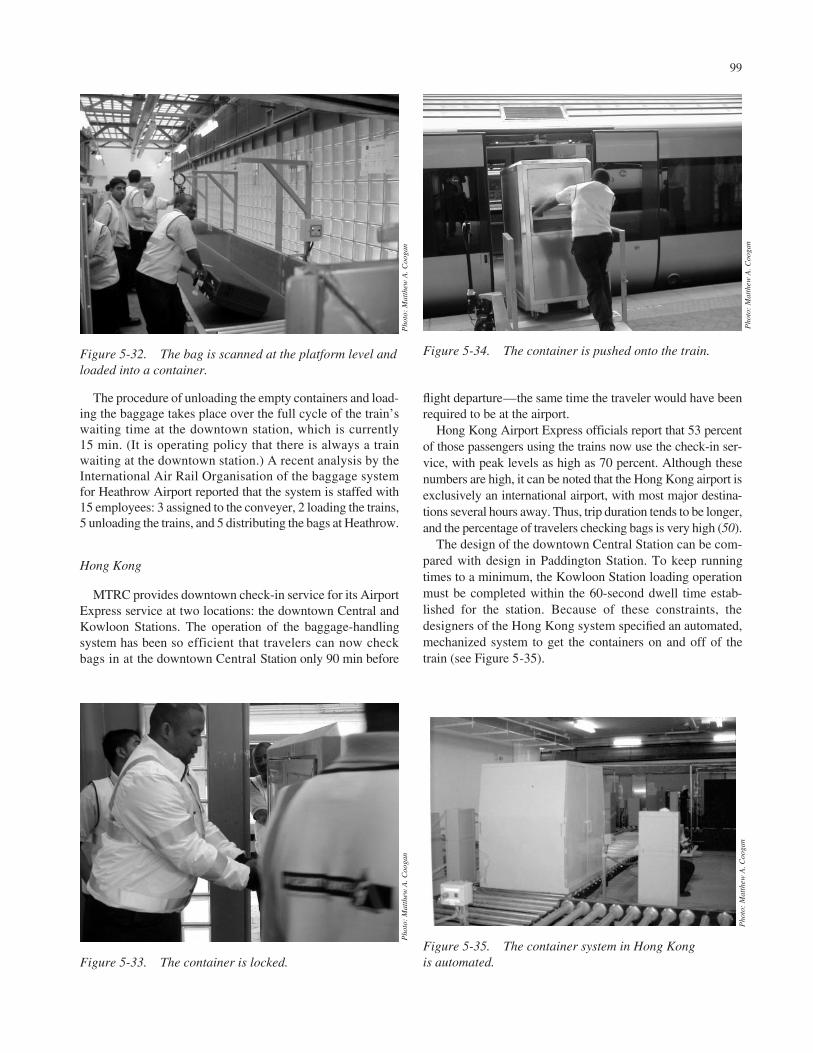
The procedure of unloading the empty containers and load-ing the baggage takes place over the full cycle of the train’swaiting time at the downtown station, which is currently15 min. (It is operating policy that there is always a trainwaiting at the downtown station.) A recent analysis by theInternational Air Rail Organisation of the baggage systemfor Heathrow Airport reported that the system is staffed with15 employees: 3 assigned to the conveyer, 2 loading the trains,5 unloading the trains, and 5 distributing the bags at Heathrow.
Hong Kong
MTRC provides downtown check-in service for its AirportExpress service at two locations: the downtown Central andKowloon Stations. The operation of the baggage-handlingsystem has been so efficient that travelers can now checkbags in at the downtown Central Station only 90 min before
99
flight departure—the same time the traveler would have beenrequired to be at the airport.
Hong Kong Airport Express officials report that 53 percentof those passengers using the trains now use the check-in ser-vice, with peak levels as high as 70 percent. Although thesenumbers are high, it can be noted that the Hong Kong airport isexclusively an international airport, with most major destina-tions several hours away. Thus, trip duration tends to be longer,and the percentage of travelers checking bags is very high (50).
The design of the downtown Central Station can be com-pared with design in Paddington Station. To keep runningtimes to a minimum, the Kowloon Station loading operationmust be completed within the 60-second dwell time estab-lished for the station. Because of these constraints, thedesigners of the Hong Kong system specified an automated,mechanized system to get the containers on and off of thetrain (see Figure 5-35).
Figure 5-32. The bag is scanned at the platform level andloaded into a container.
Figure 5-33. The container is locked.
Figure 5-34. The container is pushed onto the train.
Figure 5-35. The container system in Hong Kong is automated.
Pho
to:
Mat
thew
A. C
ooga
nP
hoto
: M
atth
ew A
. Coo
gan
Pho
to:
Mat
thew
A. C
ooga
nP
hoto
: M
atth
ew A
. Coo
gan

The layout of Hong Kong’s Central Station is funda-mentally different than that of the Heathrow Express atPaddington Station. Because the Hong Kong designers werestarting from scratch as opposed to retrofitting an historicstructure, the design of Central Station allows for the pas-senger check-in hall to be located immediately above thefront end of the train on the platform below. Thus, baggagechecked in at ground level is sent on two spiral ramps to thebaggage transfer room immediately below (Figure 5-36). Atthe baggage transfer room, bags are placed in containers,which are designed to be automated. During the first monthsof operation, Hong Kong Express management decided topostpone the startup of the automated system. Staff atten-dants pushed the containers on and off the baggage car in amanner similar to the permanent system for Heathrow.
The baggage transfers at the Heathrow and Hong Kongdowntown stations occur at a secure point on the platform, anarea where the public cannot gain access. Systems operatingin Switzerland and for the Gatwick Express must transfer thebaggage on a working platform.
Gatwick
The baggage car of the Gatwick Express is located onthe first car of the train on the inbound direction. Thus, allpassengers gaining access to the train must pass by the load-ing operation, as shown in Figure 5-37. Heathrow Expressavoided this configuration with the construction of the con-veyor belt tunnel under the platforms.
Passenger check-in occurs at a second-story location forBritish Airways and at the platform level for American Air-lines. The upper level check-in facility, which is dedicatedto British Airways, has 16 desks and is served by an elabo-rate taxi drop-off/pick-up area that is conveniently locatedoff of the street. Some 300,000 Gatwick passengers use the British Airways facility at Victoria Station. Bags must
100
be checked in 120 min prior to plane departure. See Fig-ure 5-38.
Because those passengers checking in at the AmericanAirlines platform level have direct contact with the departingtrain, this platform-level location is seen by local officials asthe model for later alterations to the station. Officials are nowexamining plans to consolidate the operations at a platform-level location.
Gatwick officials report that about 25 percent of rail trav-elers making long-distance flights use the downtown check-in service, but few of the domestic flyers use the service.
Osaka’s Kansai
Another example of downtown check-in services is the ser-vice from Kansai International Airport to the Namba down-town air terminal in Osaka, the only airport check-in rail sta-
Figure 5-36. The Hong Kong transfer facility is directlyunder the downtown check-in area.
Figure 5-37. A traditional baggage car is used in theGatwick Express.
Figure 5-38. American Airlines uses a rolling containerat Victoria Station.
Pho
to:
Mat
thew
A. C
ooga
n
Pho
to:
Mat
thew
A. C
ooga
nP
hoto
: M
atth
ew A
. Coo
gan

tion in Japan. Express service is operated every 1⁄2 hr, utilizingboth dedicated-express and local express services.
Kuala Lumpur
Of all the airport off-site check-in schemes being devel-oped, only Malaysia’s Kuala Lumpur International Airport isproposing off-site baggage claim for their downtown termi-nal, located at the Kuala Lumpur City Air Terminal at KLSentral Station. The project proposes to establish the City AirTerminal at Sentral as a separate three-letter InternationalAir Transport Association (IATA) code, allowing passen-gers to check their baggage to the city rather than to the air-port. This concept was examined in depth in the developmentof the Hong Kong system and again for the HeathrowExpress. One factor of concern to the Hong Kong designerswas the amount of space needed by a full-scale baggage-claimarea. Another concern has been the possibility that travelerswill inaccurately specify the actual destination, whether atthe time of ticket purchase or at the moment of check-in. Asnoted earlier in this section, bags checked to rail stations inGermany will be routed to the auxiliary baggage-claim areain the new Frankfurt Airport high-speed rail station, whichpresents something of precedent for the ambitious KualaLumpur proposal. (A similar concept is under considerationfor the through routing of bags in the Miami IntermodalCenter.)
Munich
Initially, planners of the new Munich Airport had hoped tointegrate a downtown check-in concept with the major pub-lic ground access mode, the S-Bahn. Toward this end, a check-in station operated by Lufthansa Airlines was inaugurated inHauptbahnhof Station. However, there was no agreement onthe question of who would pay for the baggage-handlingspace for each of the S-Bahn trains serving the airport. Thetransit agency took the position that it needed the capacityfor its primary function—serving passengers. A compro-mise was reached, and the baggage was carried to the air-port on the airport bus, which was routed to HauptbahnhofStation. The check-in facility was small, with only twocheck-in desks (see Figure 5-39). Lufthansa abandoned theoperation in the mid- 1990s, replacing it with an automatedcheck-in machine for those passengers with only carry-onbaggage.
Lessons Learned: Full-Service Downtown Check-In Centers
Many U.S. cities, including St. Louis, Atlanta, Chicago, andNew York, have considered the construction of major down-
101
town check-in terminals. So far, in the international experi-ence, only London, Osaka, and Hong Kong have made theconcept work for rail systems. Using buses, there is a longtradition in Scandinavia of downtown check-in; Tokyo NaritaAirport is served by a downtown check-in center for luxurybus operations.
This full-service downtown check-in strategy is based onthe concept that the airlines will provide full services at theoff-site location, in addition to staffing the check-in site at theairport. As discussed below, alternative concepts are nowbeing developed in which third parties who are not employedby the airlines are authorized to check baggage through to itsfinal destination and, in some but not all cases, to provide air-line boarding passes.
The key element in adopting a full-service check-in opera-tion is the effective cost allocation of providing the service.At the Hong Kong airport, little progress was made in devel-oping the concept until a financial deal was reached with thedominant carrier for the airport. Then, the competing airlinesrealized they had to provide similar services. Even with thisleadership from a major airline, the cost negotiations betweenthe transit agency and the airlines proved to be particularlydifficult. Ultimately, it was determined that the transit agencyhad the most to gain from the operation, and it became a finan-cial contributor to the success of the operation.
At Heathrow Airport, a compromise was reached in whichthe airlines pay rent (to the landlord of the building) for theircheck-in stations (Figure 5-40) and provide distribution ser-vices at the airport. The cost of handling bags on and off thetrain is considered part of the operating cost of the HeathrowExpress. The U.S. practitioner should not underestimate thecomplexity of the operation, based on the elaborate mecha-nism developed for the Heathrow Express. Issues of securityand the tracking of baggage location through bar code veri-fications resulted in a significant cost for both capital andoperation of the service.
Figure 5-39. Lufthansa offered downtown baggage check-in at Munich’s Central Station.
Pho
to:
Mat
thew
A. C
ooga
n

Requirements of the Downtown Check-In Terminal
The design of the downtown terminal must address the spe-cialized needs of the air traveler. The Heathrow Express ter-minal at Paddington Station and Central Station and KowloonStation terminals for the Hong Kong Airport Express providededicated buses to distribute passengers to local hotels. Allthree terminals have active programs to maximize the effi-ciency of the transfer to taxis.
Of those passengers arriving at Paddington Station, 50 per-cent of rail passengers proceed on by taxi; 45 percent byUnderground; and 5 percent by other means, including walk-ing. The ridership on the dedicated hotel distributor bus hasbeen a problem. In order to appeal to the business market, agood taxi connection has been a high priority. At peak hours,primarily with the arrival of business passengers in the morn-ing, there was a problem with taxi availability, so the man-agers of the Heathrow Express established a shared-ride sys-tem in cooperation with the taxicab operators. The taxipick-up area is shown in Figure 5-41.
The designers of the Hong Kong Express have paid con-siderable attention to the quality of transfer between the railplatform and the taxi. At Central Station, the taxi deposits thedeparting traveler at ground level, immediately in front of thecheck-in desks. The arriving passenger arrives one levelbelow, where the taxi pick-up lane is located immediatelyacross from the train platform level. The passengers waitinside the terminal at individual gates for the taxis to arrive,without ever waiting outdoors.
The design for the taxi interface at the downtown KowloonStation is shown in Figure 5-42. As shown in the diagram, eachof the two “finger piers” of the station is designed to support10 taxi-loading locations at once, all from one air-conditioned
102
waiting and queuing area. This taxi loading facility is uniquein the world.
The managers of the Oslo Express have developed a jointticket, which is good both for the train and then for the com-pletion of the journey by taxi. Thus, the user buying an air-line ticket can purchase a multimodal ticket with a singleintegrated fare. Such a program is also under development insupport of the Arlanda Express train in Stockholm.
Strategies for National Off-Site Check-In
While full-service downtown check-in facilities staffed byairport personnel are in operation in two cities, alternativestrategies that encourage off-site check-in at smaller termi-nals are being developed in Switzerland, France, and Germanyand are under exploration in the Netherlands.
Figure 5-41. The taxi stand at Paddington Station candispatch eight cabs at a time.
Figure 5-42. This Hong Kong taxi dispatching pointcould dispatch 20 taxis at a time, with all riders waiting inthe air-conditioned space.SOURCE: Mass Transit Railway Corporation.
Pho
to:
Mat
thew
A. C
ooga
n
Figure 5-40. The airlines pay rent to Railtrack, the ownerof Paddington Station.
Pho
to:
Mat
thew
A. C
ooga
n

National Baggage Check-In: The Swiss Fly-RailBaggage System
The concept of a national system for off-site baggage check-in is fundamentally different from the three existing downtowncheck-in centers serving Heathrow, Gatwick, and Hong KongAirports or the luxury bus service serving Tokyo Narita Air-port. Each of these downtown check-in terminals is staffed byairline representatives who take the responsibility for accept-ing baggage and issuing boarding passes. When the concept isexpanded to dozens—or in the case of Switzerland, hundreds—of off-site locations, it becomes impossible to expect multipleairline companies, or even one airline company, to provide thestaff at each of the off-site locations. Alternatively, a partner-ship with the railroads has to be built, in which the railroadsare empowered to take certain actions in the name of the air-lines. The Swiss Fly-Rail Baggage system has been in placefor two decades; recent developments in Germany and Franceare refining the concept for wider application.
As described in Chapter 4, the Swiss Fly-Rail Baggage sys-tem is provided by the national railway rather than by thedominant airline. The Swiss Federal Railway charges Fr 20(US $13) for each bag. Although the nationwide system oper-ates from 116 locations to both Zurich and Geneva, about80 percent of the bags are transferred through Zurich. It hasbeen estimated that about 6 percent of the air passengersleaving Zurich Airport have made use of the system. In 1990,275,000 bags were checked in for departure from Zurich Air-port, and 100,000 bags were checked through to rail stationsupon arrival at Zurich Airport. These incoming bags use acustoms declaration tag that is signed when the bag is checkedfor its flight to Switzerland.
Although most of the examples described in the sectionabove concerned a dominant central city check-in center,the opposite seems to be true in Switzerland. Of those bagschecked through Zurich Airport, fewer than 5 percent camefrom the Zurich rail station. By contrast, 17 percent of the bagsat Zurich came from Bern, the capital city. More than 10 per-cent of the bags came from major resort areas.
Mechanically, the process uses the conventional baggagesystem of the Swiss Federal Railways and uses the same bag-gage cars as other carried cargo. Each bag is taped shut witha distinctive reflective tape or sealed in a plastic bag to dis-courage tampering.
The German Approach to Integrated Baggage
In the context of the integration of airport access serviceswith national rail systems, baggage strategy is just a part ofa larger commitment between the German Railways andLufthansa Airlines to replace certain local airline flights withhigh-quality integrated rail connections. In July 1998,
103
Deutsche Bahn and Lufthansa Airlines signed a Memoran-dum of Understanding that stated that the airline will termi-nate feeder flights to Frankfurt from Düsseldorf, Cologne,and Stuttgart, but only if certain standards of seamless oper-ation have been attained. The basic attribute agreed upon isthat actual travel times by rail will be no longer than the pre-sent times by feeder aircraft. The memorandum calls for “fullcheck-in from the train station of departure through to thedestination airport, and uninterrupted baggage transfer fromthe train station of departure to the destination airport.”
Yet to be resolved is the fact that, at present, the Germanrail high-speed equipment—the ICE train—does not have sep-arate baggage-storage capacity.
In order to test the integrated baggage concept, a trial oper-ation was started in June 1998 at the city of Saarbrücken.Check-in and boarding pass operations occur at the rail sta-tion, and the Deutsche Bahn rail staff place baggage in a con-tainer, which is then locked. The container is removed fromthe train by Frankfurt airport staff who place it into the air-port’s internal baggage distribution system. Lufthansa looksat the Saarbrücken experiment as a test case for wider appli-cations throughout Germany.
In another limited application test, travelers near the rail sta-tions at Düsseldorf, Cologne, Bonn, Würzburg, and Nurembergcan check their bags at the local station through Frankfurt Air-port between the hours of 7 P.M. and 9 P.M.
Other Approaches to Baggage Handling
For most passengers accessing the airport by rail, baggage iscarried on board, even when elaborate alternatives are offeredin London and Switzerland. (The Hong Kong experience maybe the exception.) For those passengers carrying their bags ontothe rail vehicle, the availability of adequate storage areas isa key factor. The Heathrow Express has large storage areas atcentrally located doors. The storage bins are built out of trans-parent plastics, allowing the traveler to see the bags in the stor-age area (see Figure 5-43). The bins are visible from someseats, but not from all.
The designers of the Oslo Airport Express, while still hop-ing for downtown check-in, have incorporated an unusualdesign feature in the new trainsets. A major baggage-storagearea is placed in the center of the aisle, at the entry doors. Allthe seats on the vehicle are designed to allow viewing ofbaggage, as shown in Figure 5-44. Norwegian rail researchersfound that fear of losing baggage was a major concern of pas-sengers and designed this unusual solution.
For many years, several Scandinavian cities have offereda variety of off-site check-in services. At the present time, airtravelers in business class are offered hotel check-in servicesat many SAS Radisson Hotels. For these users, baggage ismanually placed in the airport bus and manually taken off thebus at the airport. Other hotel chains provide similar services.

Likewise, many cruise ship lines have developed innovativeoff-site airline check-in strategies.
Lessons Learned: Handling Baggage
Baggage-handling strategies designed to improve the tripquality for users of public transportation services to the air-port remain one of the most controversial aspects of the sub-ject of airport ground access.
Table 5-5 shows that, while the existence of off-site check-in is a positive attribute in Hong Kong and London, many ofthe successful systems have achieved high market share with-out the use of an off-site baggage strategy. Many rail systemsuse standard intercity rail equipment, which is designed toaccommodate baggage in its normal service.
104
An off-site baggage strategy should be structured aroundthe needs of the market. Historically, most passengers flyingout of Hong Kong have been going to far distant locations,with “domestic” flights a contradiction in terms until the recentreunification with China. Long distances often correlate withlonger trip duration, which correlates with more baggage.Similarly, the trip from distant towns in Switzerland may in-volve several train transfers and complex moves with largebaggage, such as skis.
Other markets have other characteristics. At London’sGatwick Airport, use of the off-site baggage check-in fordomestic flights in the United Kingdom is rare, even thoughthe system is well used for international flights. Of those pas-sengers accessing Zurich Airport by rail, four of five haveselected not to use the extra cost baggage-handling service.
The provision of full baggage services at off-site locationsis expensive for the airlines. A British Airways official esti-mated that an off-site check-in center would not make sensewith fewer than 100,000 users a year. In both of the two newmajor downtown check-in centers, financial arrangements havebeen worked out to split the costs between the airline (whichis providing a desired service to their customers) and the railcompany (which is charging a high fare with the intent ofmaking a profit on the operation). Similarly, when the Munichtransit agency was asked, in effect, to donate space on boardits transit vehicles, the transit agency refused.
The German model for off-site check-in is also of interest.Although the issuing of boarding passes is done by automatedequipment owned by the airlines, transporting baggage is theresponsibility of the railroads and is undertaken by their em-ployees. The test run of the German system at Saarbrückenuses containers that are very similar to those used in the Heath-row Express. A key concept, according to German plannersinvolved in the implementation of their program, is the accep-tance of third parties to process the baggage from the originpoint to the airport. The shared use of employees who are al-ready in place with established work assignments could lower
Figure 5-44. All seats face the baggage-storage racks on the Oslo Airport Express trains.SOURCE: Adtranz.
AirportRail
mode shareOff-site
baggage aidOn vehicleprovision
Oslo 43 No YesTokyo Narita 36 Bus only YesGeneva 35 Yes IntercityZurich 34 Yes IntercityMunich 31 No NoFrankfurt 27 No Yes/NoStansted 27 No YesAmsterdam 27 No IntercityLondon Heathrow 25 Yes Yes/NoHong Kong 24 Yes YesLondon Gatwick 20 Yes YesParis de Gaulle 20 No NoBrussels 16 No YesParis Orly 14 No No
TABLE 5-5 Strategies for handling baggage
Figure 5-43. Baggage racks on the Heathrow Expressare transparent.
Pho
to:
Mat
thew
A. C
ooga
n

the incremental cost of managing baggage shipments. In thisconcept, the total cost for smaller operations might be signif-icantly lower than for airline-managed operations.
Finally, the approach taken in Oslo, which will be repeatedin Berlin, of providing specialized support facilities to thetraveler who does carry baggage on the vehicle is worthy ofnote. Designers of the Oslo system, by way of example, worked
105
extensively on the design of new, lighter baggage trolleys capa-ble of operating safely on escalators. Managers of GatwickAirport allow baggage trolleys on board the people mover thatconnects the baggage-claim area of the new North Terminalwith existing rail station at the original terminal. In short, awide variety of strategies to deal with baggage are used in thesuccessful airport rail services.

106
CHAPTER 6
NEW AND EMERGING TECHNOLOGIES FOR AIRPORT ACCESS
This chapter presents a review of recent transit industrydevelopments that could affect the longer term options avail-able for resolving airport ground access issues. The six areasin which the technologies of the transit industry and the avi-ation sector combine to enhance airport ground access are sum-marized below:
1. Advanced Traveler Information Systems (ATIS),2. Technology for ride matching3. Emerging bus technology,4. Emerging rail technology,5. Automated people-mover technology, and6. Alternative strategies for off-site airport check-in.
ATIS: APPLICABILITY TO AIRPORT GROUND ACCESS
A key issue for the providers of airport ground access ser-vices is the dissemination of information about the services.A key issue for the traveler is to learn about the transit optionsavailable. A discussion of recent developments in the field ofATIS that can play an important role in providing such infor-mation about services to the potential user is provided in thissection.
Three Phases of Information Dissemination
Recent literature on ATIS for the longer-distance trip hasdefined three time frames for dissemination of information:(1) at the time of trip planning, (2) at the time of trip com-mencement, and (3) while en route. Importantly, the traveler’sneed for information varies significantly as a function of thetiming of the information request, as summarized below:
1. At the time of trip planning. Information about publicground access services could be made available to thetraveler when the airline segment of the total trip is pur-chased. Because the airline ticket is usually reserved sev-eral days before commencement of the trip, the userneeds to be provided with static information, usuallyabout routes, schedules, and costs. Information for thisphase is usually provided to the user by the airlines andtravel agents.
2. At the time of trip commencement. In preparationfor starting the trip, the traveler has a need for infor-
mation about conditions that would affect the circum-stances of the trip. While route and schedule data areneeded at the time of trip planning, real-time or dynamicinformation is needed at the time of trip commencement.At this phase, information about accidents or unusualchanges in expected travel time is made available to theuser. Information about a bad traffic jam in Boston, forexample, might convince the user to take rapid transitrather than to drive through the Sumner Tunnel to accessBoston-Logan Airport. News of an accident in theQueens Midtown Tunnel could be of value to a Man-hattan traveler who had expected to take a taxi to JFKAirport; he or she now chooses to take the train toJamaica Station. Information for this phase is usually pro-vided via radio, telephone, and the Internet by regionalinformation providers.
3. While en route. Once the longer-distance, intercitytrip has begun, the traveler needs information along theway—usually in transfer terminals, but also within themoving vehicles. At this point, the needs of the trav-eler require highly accurate information, specific to agiven gate, platform, or minute of departure. The roleof transfer terminal management is key here. Travelersseeking information on connecting modes have a needfor dynamic, real-time information about the timing andlocation of the public transit service. Information forthis phase is usually provided by the operators of the ter-minals and the providers of the transportation services.See Figure 6-1.
Developments in information technology, organized interms of these three categories of information needed by thetraveler, are discussed below.
Information at the Time of Trip Planning
At the time of trip planning, the intercity traveler needsinformation about ground transportation options simultane-ously with selection of the airline trip. A traveler going to theLos Angeles region, for example, may want ground connec-tion information when selecting among the Los Angeles–areaairports. The traveler is in need of information about the optionsavailable to a particular destination. In many cases, the trav-eler is offered essentially a list or compilation of scheduleinformation, which is not enough information for travelers

107
unfamiliar with the location of the destination or the trans-portation system.
At present, the information available to the traveler aboutground transportation services at the destination end of thetrip is often sporadic and incomplete. Currently, several imple-mentation activities are under way for a wide variety of strate-gies to disseminate ground transportation information to pas-sengers. These activities range from total integration of bothinformation and ticketing to early attempts to provide infor-mation on local routes and schedules to travelers in a user-friendly format. In Germany and Denmark, the integration ofairline tickets with connecting rail tickets is a mature program;in the United States, United Airlines has a successful programof through-ticketing for selected bus trip segments.
Integration of Ground Access Information with Airline Information
Several levels of integration of airline and connecting tran-sit mode information are currently in operation. The mostthorough integration of information incorporates the con-necting mode data into the actual reservation system used bythe airlines, called the computer reservation system (CRS).Much of the pioneering activity in this area has been under-taken over the past decades by Lufthansa German Airlinesand Deutsche Bahn, the national railway. The first use ofintegrated information systems occurred when Lufthansabegan operating rail service between Frankfurt Airport andDüsseldorf Airport, with service to Cologne and Bonn alongthe way. In this instance, Lufthansa was responsible for bothair and rail operations. However, over time, the airline deter-mined that it was more cost-effective to buy tickets on the reg-ularly scheduled national railroad lines than to operate trainsdedicated to airline passengers. In 1998, Lufthansa andDeutsche Bahn announced an agreement to widen the conceptof through-ticketing between air and rail.
Under the new relationship, information about travel tomany German rail stations from connecting Lufthansa flightsappears on the CRS in a form virtually identical to connectingflight information. Figure 6-2 shows a portion of a computerscreen displaying options for a trip between Boston-LoganAirport and the rail station in Cologne, Germany.
Targets for the integrated system in the joint agreementinclude (51):
• Full check-in from the train station of departure throughto the destination airport;
• Joint ticketing between airlines and railroad operators;
Figure 6-1. Both interactive itinerary planning and “nextbus” schedule information are available at the Geneva airport rail station.
Figure 6-2. The airline reservation system can issue tickets with a ground transportationsegment.SOURCE: US Airways Priority Travel Works.
Pho
to:
Mat
thew
A. C
ooga
n
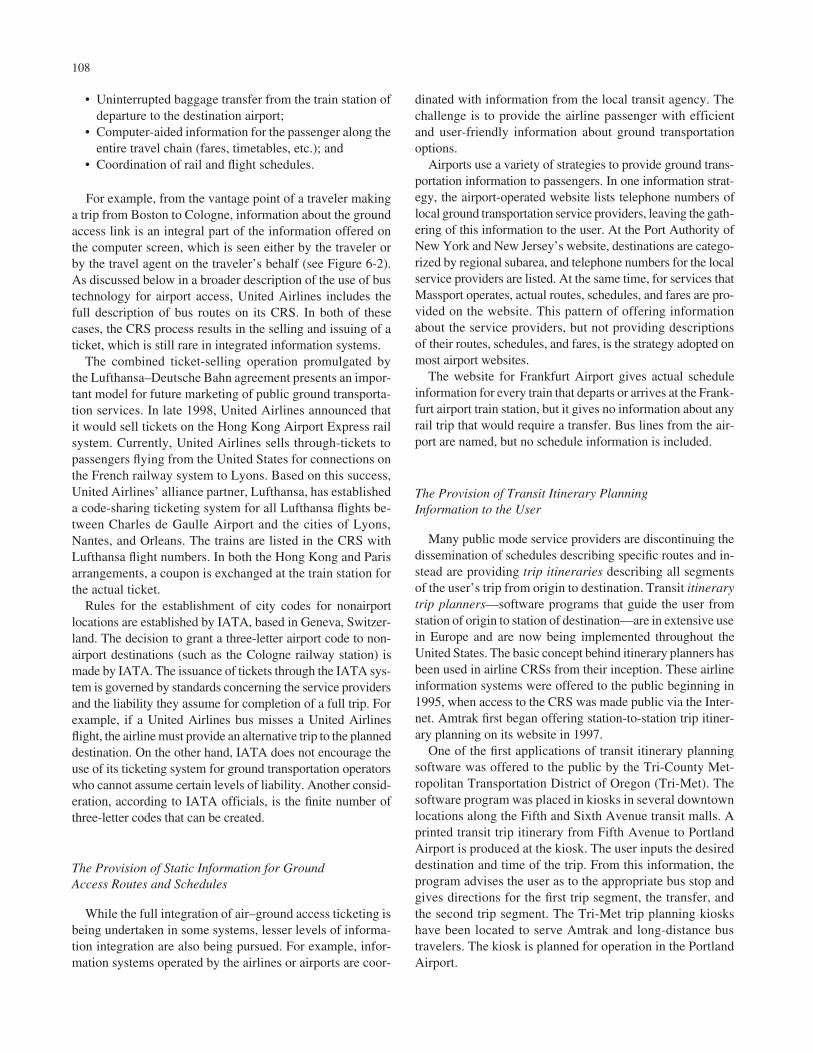
108
• Uninterrupted baggage transfer from the train station ofdeparture to the destination airport;
• Computer-aided information for the passenger along theentire travel chain (fares, timetables, etc.); and
• Coordination of rail and flight schedules.
For example, from the vantage point of a traveler makinga trip from Boston to Cologne, information about the groundaccess link is an integral part of the information offered onthe computer screen, which is seen either by the traveler orby the travel agent on the traveler’s behalf (see Figure 6-2).As discussed below in a broader description of the use of bustechnology for airport access, United Airlines includes thefull description of bus routes on its CRS. In both of thesecases, the CRS process results in the selling and issuing of aticket, which is still rare in integrated information systems.
The combined ticket-selling operation promulgated bythe Lufthansa–Deutsche Bahn agreement presents an impor-tant model for future marketing of public ground transporta-tion services. In late 1998, United Airlines announced thatit would sell tickets on the Hong Kong Airport Express railsystem. Currently, United Airlines sells through-tickets topassengers flying from the United States for connections onthe French railway system to Lyons. Based on this success,United Airlines’ alliance partner, Lufthansa, has establisheda code-sharing ticketing system for all Lufthansa flights be-tween Charles de Gaulle Airport and the cities of Lyons,Nantes, and Orleans. The trains are listed in the CRS withLufthansa flight numbers. In both the Hong Kong and Parisarrangements, a coupon is exchanged at the train station forthe actual ticket.
Rules for the establishment of city codes for nonairportlocations are established by IATA, based in Geneva, Switzer-land. The decision to grant a three-letter airport code to non-airport destinations (such as the Cologne railway station) ismade by IATA. The issuance of tickets through the IATA sys-tem is governed by standards concerning the service providersand the liability they assume for completion of a full trip. Forexample, if a United Airlines bus misses a United Airlinesflight, the airline must provide an alternative trip to the planneddestination. On the other hand, IATA does not encourage theuse of its ticketing system for ground transportation operatorswho cannot assume certain levels of liability. Another consid-eration, according to IATA officials, is the finite number ofthree-letter codes that can be created.
The Provision of Static Information for GroundAccess Routes and Schedules
While the full integration of air–ground access ticketing isbeing undertaken in some systems, lesser levels of informa-tion integration are also being pursued. For example, infor-mation systems operated by the airlines or airports are coor-
dinated with information from the local transit agency. Thechallenge is to provide the airline passenger with efficientand user-friendly information about ground transportationoptions.
Airports use a variety of strategies to provide ground trans-portation information to passengers. In one information strat-egy, the airport-operated website lists telephone numbers oflocal ground transportation service providers, leaving the gath-ering of this information to the user. At the Port Authority ofNew York and New Jersey’s website, destinations are catego-rized by regional subarea, and telephone numbers for the localservice providers are listed. At the same time, for services thatMassport operates, actual routes, schedules, and fares are pro-vided on the website. This pattern of offering informationabout the service providers, but not providing descriptionsof their routes, schedules, and fares, is the strategy adopted onmost airport websites.
The website for Frankfurt Airport gives actual scheduleinformation for every train that departs or arrives at the Frank-furt airport train station, but it gives no information about anyrail trip that would require a transfer. Bus lines from the air-port are named, but no schedule information is included.
The Provision of Transit Itinerary PlanningInformation to the User
Many public mode service providers are discontinuing thedissemination of schedules describing specific routes and in-stead are providing trip itineraries describing all segmentsof the user’s trip from origin to destination. Transit itinerarytrip planners—software programs that guide the user fromstation of origin to station of destination—are in extensive usein Europe and are now being implemented throughout theUnited States. The basic concept behind itinerary planners hasbeen used in airline CRSs from their inception. These airlineinformation systems were offered to the public beginning in1995, when access to the CRS was made public via the Inter-net. Amtrak first began offering station-to-station trip itiner-ary planning on its website in 1997.
One of the first applications of transit itinerary planningsoftware was offered to the public by the Tri-County Met-ropolitan Transportation District of Oregon (Tri-Met). Thesoftware program was placed in kiosks in several downtownlocations along the Fifth and Sixth Avenue transit malls. Aprinted transit trip itinerary from Fifth Avenue to PortlandAirport is produced at the kiosk. The user inputs the desireddestination and time of the trip. From this information, theprogram advises the user as to the appropriate bus stop andgives directions for the first trip segment, the transfer, andthe second trip segment. The Tri-Met trip planning kioskshave been located to serve Amtrak and long-distance bustravelers. The kiosk is planned for operation in the PortlandAirport.

109
A transit itinerary planning program was implementedupon the opening of Munich Airport in 1992, where the sys-tem was put in place by the regional transit operator, MunichTransport Alliance (MVV).
Off-Line Computerized Public Mode TripItinerary Planning
In the early 1990s, the Dutch National Railways beganproviding station-to-station itinerary planning software to thepublic for use on off-line personal computers. Every 6 months,when the schedules of the national railways change, users canpurchase a 31⁄2-in floppy disk for a nominal charge; this allowsthe program to be continuously updated. A trip scheduled fromAmsterdam’s Schiphol Airport to a suburb of Utrecht is shownin Figure 6-3. The stand-alone program presents the user withmap-based graphics, which are not used on the Internet systembecause of the amount of processing time needed. Station-to-station itinerary planning software that does not require con-nections to any central database is available on CD-ROM forGermany, the Netherlands, and Sweden.
A Case Study in Passenger Information Systems:Amsterdam’s Schiphol Airport
Integration with Station-to-Station Trip Planning. Higherlevels of integration of information have been attempted atAmsterdam’s Schiphol Airport. Here, the airport website pro-vides the user with station-to-station itinerary trip planning,for either the domestic rail or the international rail system.The system is dynamic in that last-minute route, schedule, orfare information is immediately made available to the inquir-ing passenger. This system does not provide real-time dataabout accidents or other incidents that cause delay in the railsystem. When the user of the Schiphol Airport website seeksto plan an itinerary from the airport to the final destination, thewebsite offers connecting train information, which is providedby the national railroad information system and connected bya hyperlink. For the user of the Schiphol Airport website, aseamless connection has been made, providing full itineraryplanning to the destination rail station. The user specifies theorigin (in this case, Schiphol Airport), the destination, and thedesired time and date of travel. The program returns with a
Figure 6-3. Map-based graphics are used to give the traveler station-to-station trip planning from Schiphol Airport in thisoff-line computer program from the Netherlands Railways.SOURCE: Reisplanner, from Netherlands Railways.

screen showing the variety of rail connections for the requestedtrip at the requested hour. Integration of the systems is improv-ing; at the website for the Geneva airport, the user needs onlyto specify the origin of the trip to the airport or the destinationof the trip from the airport.
Multimodal Door-to-Door Trip Planning from SchipholAirport. Recently, Schiphol Airport management has beenexploring the use of a more precise itinerary planning strat-egy. Management is attempting to determine the best mannerfor the airport user to gain access to the OVR, which is thenationwide, door-to-door transit itinerary trip planning sys-tem in the Netherlands. The national rail system describedabove provides the traveler with a public transportation itin-erary from railroad station to railroad station; the OVR sys-tem provides this information from door to door.
The OVR system in the Netherlands was the first compre-hensive passenger information system in national operation.The air traveler needing specific instructions on how to use pub-lic transit modes from any airport in the Netherlands can accessthe OVR system, which will provide public transportationoptions to every street address or landmark in the nation. Fig-ure 6-4 shows the results of a query for a trip from Schiphol Air-port to the Museumplein, a square in downtown Amsterdam.The program has given the traveler a choice of four differentways to make the trip by public transportation. This screenshows that the trip could be made using a single bus, a regionalbus, a train and a tram, or a train with both a tram and a bus.
The OVR system was developed to give passengers multi-modal information by telephone. One common phone num-
110
ber throughout the Netherlands serves more than 9 millioncustomer phone inquiries per year. The user is charged aboutG0.75 (US $0.50) for the service, which is provided through a1-900-number. The system uses nine regional call centers, atwhich some real-time information is presented if significantdeviations occur from the travel times for most important linksin the system. In 1998, the OVR system was adapted for useon the Internet; because OVR system managers have not deter-mined a cost-effective way to charge for this service, it is cur-rently offered for free. A program to make the service avail-able to users at Schiphol Airport is still under development.
At the request of the Netherlands government, the OVRdatabase is being released in a stand-alone CD-ROM format,which also includes door-to-door route planning capabilityfor automobiles. In this concept, trip-making options by pri-vate vehicle and by public transit will be available from onecombined software program. The CD-ROM system will pro-vide unprecedented ability to analyze and compare traveloptions across several transit modes; however, last-minuteschedule changes by the public mode operators will not befully integrated into the stand-alone product.
Combining Itinerary Planning with Joint Ticketingin Sweden
The managers of the airport rail service in Stockholm arebenefiting from the development of integrated, multimodalticketing procedures that have been built up in Sweden overthe past 20 years. The new Arlanda Express rail line, which
Figure 6-4. Door-to-door traveler information from Schiphol Airport is availablefrom the multimodal Dutch OVR system.SOURCE: Netherland Railways website (www.ovr.nl).

opened in November 1999, offers combined ground accessticketing to all destinations in Sweden. The joint ticketing pro-gram is based on the development of a state-of-the-art passen-ger information system in Sweden.
Swedish National Railways has established a nationwidesystem to give multimodal origin-to-destination itinerary plan-ning services to a large portion of the population. Called the“Tag Plus” system, the database includes both bus and rail air-port access modes (see Figure 6-5). The system covers rail andregional bus services for more than 2,000 cities and towns.The system is available to the public through multiple venues:on a CD-ROM that is updated every 6 months, on the Inter-net, through travel agents, and through an innovative programin which integrated public mode tickets can be purchased atlocal vendors who can sell and print tickets. The system sharesits ticketing infrastructure with the national lottery and thushas access to thousands of terminals at tobacconists and news-stands. The lottery vendor’s printer is used to print the publictransportation tickets.
A traveler to the airport from anywhere in Sweden can planthe trip, either by using a CD-ROM or by logging onto the ser-vice on the Internet. The purchase of the through ticket cantake place wherever a lottery machine is available. Travelagents access the Tag Plus system via the SMART system,which is a major Scandinavian reservation systems owned bySAS and Swedish National Railways.
The Arlanda Express will also offer joint ticketing with theairlines’ reservations systems. Guided by SMART, the travelagent will first establish the flight into or out of Stockholm’sArlanda Airport. Then, with the touch of only one key, a jointthrough-ticket to downtown Stockholm is created. The system
111
works in cooperation with all airlines that use travel agents.When SAS ticket agents use their proprietary reservation sys-tem, the Arlanda Express options will appear on the screen andcan be jointly ticketed. Users of various forms of SAS travelpasses can use these cards on board the train, with SAS re-imbursing the rail company for the full cost of the fares.
At the present time, the managers of the Arlanda Expressare working to create a joint ticket that would include a taxiride at the Stockholm-end of the trip. This would be based ona zone system and would provide a major step to truly inter-modal seamless ticketing.
Joint Ticketing in Oslo
A ticket can be purchased on the Oslo Airport Expresswith connecting service to all destinations served by theNorwegian Railways. The accounting procedures are sim-plified because the Oslo Express is a company wholly ownedby the national railways. However, the Oslo Airport Expressmanagers have not established the same ability for through-ticketing with airlines as that which has been accomplishedin Stockholm. Oslo Airport Express tickets are sold by travelagents, but the mechanics of through-ticketing with airlinesare still under development.
Of the passengers now using the Oslo Airport Express train,30 percent have received their train tickets at the time of pur-chase of the airline ticket from their travel agents. Only abouthalf of the Oslo Airport Express riders buy tickets at the sta-tions. About 20 percent of the riders use a unique credit card—the Eurobonus—developed for the service that provides direct
Figure 6-5. Tag Plus, the multimodal Swedish itinerary trip planner,shows a trip from Stockholm’s Arlanda Airport to a suburb ofGothenburg by bus, rail, foot, and local bus.SOURCE: TagPlusGuiden, from Swedish Railways, 1998.

billing for the train ride. The new hybrid credit card–smart cardis now used for 20 percent of rail ticket sales and is currentlyissued by Diners Club and SAS. The standard magnetic stripestablishes the credit–payment mechanisms; a microchip con-tains information about the actual reservation, the holder’sfrequent flyer status, and so forth. One swipe of the Eurobonuscard presents the airlines with all the information needed to complete an electronic ticket with multimodal content. InStockholm, the ticket will be used on board the train, bypass-ing the normal time for the “handshake” transaction that is nor-mally needed to check the credit of the customer. The infor-mation contained on the card is sufficient documentation tobypass this time consuming step. At first, the system requiredthe prepayment of a stored value, but it now has evolved toallow later billing to the subscribing company.
Joint Ticketing: Other Examples in AirportGround Access
In Denmark, a system of through-ticketing was developedbetween Danish Railways and SAS; now that system is beingused for other airline carriers. Outside of Scandinavia, how-ever, the experiences with advanced ticket sales have provedmore problematic. Different rail operators are trying differentmarketing strategies to accomplish advance ticket sales. Mar-ket schemes have focused on the creation of one-to-one dealswith specific airlines, who will market the rail ticket them-selves, bypassing the need to use the wider services of the CRSor the global distribution systems (GDS), in which fees canadd up to DKr 21 (US $3) per segment of the trip. Arrange-ments have been established between Heathrow Express andboth Virgin and British Midlands Airlines. The Star Allianceis temporarily offering free Heathrow Express tickets as a mar-keting scheme. In these arrangements, there is no charge fromthe GDS because specific reservations are not made.
An example of best case practice outside of full integrationwith the computer systems is the flights of Ryan Air at Lon-don Stansted Airport. On planes arriving at Stansted Airport,the flight attendants walk through the cabin selling tickets onthe Stansted Express rail service to London. The flight atten-dants have incentive to do this, as they gain some of the com-mission from the ticket sales.
The EUSpirit Project
The concept of door-to-door intercity itinerary planningcapability has been applied nationwide in the Netherlands,Sweden, and other European countries. Now, the EuropeanUnion is proposing to provide for door-to-door intercity tripplanning capability across national borders, ultimately cover-ing the entire European Union. In December 1998, the project,named EUSpirit, was launched by a consortium of agenciesunder the leadership of Deutsche Bahn. In its present format,the program is designed to provide itinerary planning from any
112
specific address to any specific address, using the national rail-roads for the long-distance trip segment. The technology ofintegrating the long-distance routes and schedules with theappropriate local information would be equally applicable toairline schedules.
In such a scenario for airline trips, the traveler would use acomputer to access the travel options between cities and thetravel options at both the city of origin and the city of destina-tion. The functionality of such a system would rival the qual-ity of trip information now available for connections with long-distance trains in Germany and with the bus system operatedby United Airlines. Joint ticketing over the many service oper-ators remains a longer-term goal, awaiting implementation ofautomated fare payment technology.
Dynamic Itinerary Planning Services in the United States
Itinerary planning programs for public transit are beingdeveloped under several separate technical and institutionalmodels. Many transit agencies are adapting the software usedfor telephone operator–based information services for key-board interaction in kiosks and through the Internet. Others arebuilding new, regional software programs. Transit itineraryplanning on the Internet began in 1999 by WMATA, based onits well-developed program of providing trip information bytelephone operator (see Figure 6-6). In the New York Metro-politan Area, new programs are being established based onsoftware previously unused in that region.
Southern California Association of Governments. Thesystem with the highest multiagency coverage was first de-veloped by the Southern California Association of Govern-ments (SCAG). Based on its experience in matching rides forcarpools, SCAG developed the TranStar program (see Fig-ure 6-7). Similar to most passenger information systems, theprogram was originally developed to be used by trained tele-phone operators. However, the program has been availablefor several years to Internet users through the Ventura County,California, ATIS program.
The SCAG TranStar technology was adopted in northernCalifornia, as part of a wide-reaching program by the Metro-politan Transportation Commission in the development of itsmultimodal TravInfo™ program. Users call a common tele-phone number (common over several area codes) to accesslocal operators using the TranStar database. Translation of thisoperator-oriented system into a user-operated system (whetherthrough the kiosk keyboard or via the Internet) is now underway in several metropolitan areas.
The New York–Area Model Deployment Initiative Project.The United States Department of Transportation (U.S. DOT)encouraged the further development of multimodal itineraryplanning capability in its Model Deployment Initiative

(MDI). Of the cities selected for the program, New YorkCity and the surrounding area proposed the most far-reach-ing attempt to bring multimodal itinerary planning to theconsumer. After considerable effort to start the contract,Transcom—the independent management organization man-aging the MDI project for the participating agencies—selected the SCAG TranStar program as the base of its am-bitious program of developing multimodal, multiagency,and multijurisdiction trip information. The comprehensiveprogram to provide door-to-door transit itinerary planningthroughout the New York Metropolitan Area (including partsof New Jersey and Connecticut) would, when applied to theNew York–area airports, significantly improve the quality oftransit directions available to the intercity user planning a tripfrom the arrival airport to the user’s actual destination.
Lessons Learned: Provision of Transit Informationto the Passenger
The challenge for any system on which travelers rely is theaccuracy of the route and schedule information used, throughwhatever technology, in the development of itineraries. A busschedule input into the computer for the winter timetable maybe totally inaccurate for the spring timetable. Therefore, itwould appear necessary for airport operators to rely on sys-tems that tie into a larger database, managed and updated by
113
other information providers. For all systems, however, thedissemination of inaccurate or out-of-date information is pos-sible. The challenge is for the airport to offer the public tran-sit user access to a database that is certified by some agencywith a wider client base than those airport users choosing pub-lic transit modes.
Information at the Time of Trip Commencement
State of the Art
The previous section described developments by the pub-lic transportation industry, including national railroads, toprovide the transit user with accurate descriptions of routes,schedules, and fares for use when planning a trip. The infor-mation is either static (not continuously updated) or dynamic(continuously updated, but not in real time). At the time ofdeparture for the beginning of a multimodal trip, accurate,real-time information about actual conditions is necessary.Accurate information about the travel-time characteristics ofthe regional transit system is difficult to assemble and is prob-ably beyond the institutional responsibility of either the tran-sit agency or the airport operator to manage. In many U.S.cities, real-time information about the status of the regionaltransportation system is being made available to the traveler.
Information at the time of trip commencement is suppliedby radio, automated telephone, and the Internet. Several U.S.cities have begun programs to provide customized informa-tion to the transit user. In Seattle, Microsoft test-marketed aprogram to send e-mail messages describing traffic condi-tions about a given location at a fixed time everyday. In 1999,Microsoft dropped the Trafficview program in Seattle andother cities. Now, Seattle travelers can sign up for a warningservice for weather-related changes in routes or schedules forthe bus and ferry systems (52).
ATIS designed to provide congestion-related informationto the traveler are in operation throughout the United States.Some of these systems, such as the SmarTraveler® system,allow the user to ask the status of congestion at the major air-port or on the key regional roadway links. Information aboutthe level of congestion and travel-time delay on that roadwaylink is provided to the customer via automated phone line orthe Internet. For transit services, however, the program oper-ates on a different principle: only under the most unusual cir-cumstances are delays in the transit system reported.
A good example of the use of real-time information to aidtransit riders destined for the airport is the Busview programincluded in the comprehensive Seattle MDI, which is entitled“Smart Trek.” The Busview program, developed at the Uni-versity of Washington, allows the user to track the locationof all buses in the region, or, more logically, a specified busroute of interest to the user. Figure 6-8 shows a scenario fora user wishing to board a bus to Seattle-Tacoma Airport atthe bus stop at South Spokane Street. The user specified thatan alarm should sound on his or her computer when the buspassed a given point on the line, in this case a point located
Figure 6-6. In 1999, door-to-door transit itinerarytrip planning was introduced in Washington, D.C., by WMATA.SOURCE: Washington Metropolitan Area Transit Authority website(www.wmata.com).

1.35 mi from the bus stop. When the bus passes this point, awarning is sent to the user to proceed to the bus stop. The pro-gram is also map based, allowing the user to visually estab-lish the location of each bus on a map.
Real-Time Information for the Intercity Traveler
Currently, very few sources of information are designed forthe intercity traveler. There is currently no national program toprovide comprehensive local ground access public mode travelinformation to the intercity traveler. The Business Plan of theI-95 Corridor Coalition calls for origin–destination itineraryplanning for intercity trips throughout the 12 states of theNortheast Corridor. Organizations such as the Airport GroundTransportation Association are currently working with websitedevelopers to increase the visibility of their member operators.Other programs under development to link the traveler with
114
selected ground transportation options include Ridesource.comand QuickAid, which will be discussed below.
Implications for Public Transit Modes
In theory, traffic congestion around U.S. airports couldserve as an incentive for the traveler to choose public trans-port modes with separate right-of-way, including rail, ferry,and HOV-lane systems. The extent to which the traveleractually alters his or her transit mode at the time of trip com-mencement is unclear from the available data. For recurringcongestion, the expected travel times are known in advance.For nonrecurring congestion (e.g., from accidents), programsto monitor roadway conditions could be used to warn airport-bound travelers to allocate more time or, when possible, toswitch to a public transit mode. At the present time, however,these programs are not specifically aimed at the needs of thetraveler seeking a ground access connection.
Figure 6-7. Door-to-door passenger trip itinerary planning from Los AngelesInternational Airport is provided using the TranStar software program.SOURCE: Ventura County Transportation Commission website (www.goventura.org).

Information While En Route
The intercity traveler experiences a succession of trip seg-ments to get from origin to destination. While on each seg-ment of the trip, the traveler is in need of information aboutthe next segment. Obtaining information en route is espe-cially important for the user of public airport access services.
Many programs have been designed to improve the qual-ity of information at the traveler’s point of transfer. Reliable,real-time information has to be accurate to the minute andinclude exact information about the status and location ofthe connecting mode. Although accurate information aboutdeparture gate and flight status is a basic assumption withinairports, information to aid the transit user has been slowerto develop. With worldwide interest in intelligent transporta-tion systems (ITS), efforts are increasing to provide en-routeinformation to the public transit user.
Provision of Scheduled Departure Information to the Transit Rider
For several decades, transit operators have been working toprovide information about the scheduled arrival and departuretimes of their services. An early example of this commitmentis the development of the passenger information system at
115
major bus stops in Portland, Oregon. Carefully designed,vandal-proof television monitors were placed in each shelterin major areas, such as the Fifth Avenue transit mall. The wait-ing passenger is told the current time and is given a list of busesthat are scheduled to depart during the next half hour. Officialsat Tri-Met are working on the implementation of real-timeinformation for the shelters.
At London’s Heathrow Airport, which serves as one of thelargest bus stations in the United Kingdom, a computerizedinformation system has been installed. Television monitorsare in operation at 22 bus departure platforms. The programlists departure times for all national and local bus destina-tions. At the present time, Heathrow Airport is adding theability to provide real-time information about bus operatingconditions for the public.
Currently, the provision of such basic public transit infor-mation is rare at U.S. airports. Until recently, a television mon-itor provides scheduled bus departure times at Bush Intercon-tinental Airport/Houston. In most cases, the arriving passengeris referred to an information booth, which then distributes aschedule for a specific company, but not a combined timetableof any form. Many airports list the telephone numbers of pri-vate companies: the user first must determine which companyis most appropriate for the planned ground access trip and thenmust call for a pickup time and location.
Figure 6-8. The user’s computer sounds an alarm when Metro’s Route 194 bus to Seattle-Tacoma International Airport is5 min from the user’s bus stop in this program from Seattle’s Smart Trek.SOURCE: Smart Trek website (www.smarttrek.org).

Provision of Real-time Information to the TravelerEn Route
In general, most U.S. airports have not provided even staticground transportation information of a quality provided bytransit agencies such as Portland’s Tri-Met, which has offeredwaiting passengers both schedule information and station-to-station trip planning information for more than a decade. Withthe increased interest in ITS technology, this is changing insome airports. Programs to create high-quality, real-time infor-mation about local transportation have begun at the Seattle-Tacoma Airport and in transit systems around the world.
Seattle MDI Program. In Seattle, Washington, MDI hasdeveloped the MyBus system to provide computer-baseddisplays of the real-time schedules of buses serving Seattle-Tacoma Airport and selected transit transfer centers (seeFigure 6-9). The computer-based monitors that are beingimplemented at the Seattle airport provide real-time infor-mation to air travelers waiting for Seattle Metro buses goingto downtown Seattle. At present, transit managers have noplans to provide information about privately owned busesserving the downtown from the same departure location. Thetransit buses will be equipped with global positioning system(GPS) devices, which will allow management to know thebuses’ location anywhere on the system; operators of the pri-vate buses do not use such location devices. Access to a com-puter screen with real-time highway congestion informationis also available at the Seattle-Tacoma Airport.
Gothenburg, Sweden’s GoTic. The first city to monitor itsentire transit operations, including buses, for real-time travelconditions was Gothenburg, Sweden, through a city operationcalled “GoTic.” The monitoring program originally wasundertaken to deal with traffic flow and signal preemption;program information was made available to waiting pas-sengers in the 1980s. Passengers at key transfer points aregiven the exact time of the next four departures from that plat-form; passengers on board the buses and trams are informed
116
of the types of any delays from a centralized control center.Figure 6-10 shows a typical departure sign at a tram shelter.
London’s Countdown Project. Although Gothenburg wasthe first city to provide vehicle location information over itsentire fleet, the largest implementation of the concept is Lon-don Transport’s Countdown project. The Countdown proj-ect was based on a program that was initially undertaken toannounce the actual time before the next train departure; Lon-don Transport tested the concept of giving passengers theactual time before the next bus and is now implementing theproject throughout its system. London Transport extensivelystudied the market reaction to the project and found that theusers believed that waiting times had decreased, even thoughactual times had not changed.
Kiosks
Significant research has been undertaken on the effective-ness of kiosks in providing transit information, particularly atpoints of transfer such as airports. The use of kiosks as a meansof providing transit information has been tested throughoutthe country, with one of the largest tests undertaken by theLos Angeles County Metropolitan Transportation Authority.More than 75 kiosks were sited in a variety of test locations,including office buildings, retail centers, and transit stations.Findings of the research evaluation program suggested thatthe strongest market was for trips other than the daily trip towork (53).
QuickAid. The Quick ATM Corporation has developed aprogram that provides ground transportation information, invarious degrees of detail, for 31 U.S. airports. Development
Figure 6-9. The Seattle MDI’s “MyBus” Programsupplies real-time information about local bus departuresto monitors at Seattle-Tacoma International Airport and tothe Internet.SOURCE: MyBus website (www.its.washington.edu/mybus).
Figure 6-10. This passenger information sign inGothenburg, Sweden, was part of the first system to providereal-time information for bus passengers.
Pho
to:
Mat
thew
A. C
ooga
n

of the QuickAID program was encouraged in 1993, when theDivision of Aeronautics of the California Department of Trans-portation (Caltrans) undertook a demonstration program toshowcase the potential of passenger information systems.Kiosks were built in airports in Oakland, San Jose, Sacra-mento, and Burbank. Outside of the Caltrans demonstration,50 additional kiosks were installed at Los Angeles Airport. Aspart of the Caltrans program, an evaluation of the project wasundertaken by the Institute of Transportation Studies at theUniversity of California at Berkeley (54). Surveys revealedthat about 30 percent of the passengers arriving at the airportsstudied had a need for information, with about 15 percent seek-ing information about ground transportation options. Need forinformation varied among terminals, with the passengers onthe shorter-distance Southwest Airlines flights having the leastneed for information.
The QuickAid system is an example of a “text-based” ATIS.Every question from the user sets in motion a narrowingprocess that leads to a prepared text describing directions tothe destination. The system “looks up” the appropriate pre-pared text and does not compute any new information in theprocess.
Implications for Airport Ground Access Programs. Kiosksalso provide the user with an alternative to the staffed infor-mation booth. Whether information is disseminated through a booth or through a kiosk, the key element is the existence ofaccurate, up-to-date, systemwide information based on cur-rent schedules and timetables. In many cases, achieving thisaccuracy will require the development of specific methods ofaccessing regional information maintained and developed byother information providers. The database that will be pre-pared for the New York MDI project, for example, could beused by trained staff and at kiosks. The kiosk, although linkedto the MDI database, could be designed to respond to the spe-cific needs of the airport passenger. Airport operators may findit beneficial to link up with larger-scale, metropolitan effortsto implement ATIS, while still focusing on the specific needsof the air traveler.
En-Route Information: The Promise of AutomatedVehicle Identification
Automated vehicle identification (AVI) systems are used atairports (1) to control the operations of taxicabs, buses, andother commercial vehicles; (2) to control vehicular access torestricted areas; (3) to assist in the dispatching and control ofairport-operated shuttle buses; and (4) to provide a basis forcharging activity-based user fees. From the point of view ofairport management, AVI systems offer the ability to track thebehavior of each licensed airport vehicle to ensure that airportregulations are being followed. Now, several U.S. airports areconsidering the use of vehicle location systems (such as AVI)to provide accurate real-time information about the actual de-
117
parture times of connecting ground transportation. This infor-mation could be provided in interior waiting areas to users ofthe connecting bus services.
Implications for Airport Ground Access: En-RouteTraveler Information Technology
The traveler who has arrived at the airport and must choose,locate, and pay for a public ground transportation service is astrong candidate for assistance from the en-route category ofU.S. DOT’s ATIS program. Travelers need to learn quicklywhat public transportation service options they have, when theservices are departing, and from where the services are depart-ing. Programs already in place in transit systems around theworld, such as London Transport’s Countdown program andSeattle’s Smart Trek program, could help provide that publictransportation information to connecting ground transporta-tion passengers at U.S. airports.
TECHNOLOGY FOR RIDE MATCHING
A key goal for airport managers and regional transpor-tation planners is to increase overall vehicle occupancy toand from the airport. Airport managers and transit agenciesaround the world have followed many strategies to “match”trips, increase the number of parties in a single vehicle, andimprove efficiency.
Examples of Strategies To Match Trips
Currently, FTA’s Advanced Public Transit Systems pro-gram includes research about automated scheduling (in whichthe path of the bus is established) and automated dispatching(in which the orders are sent to the bus). Research programson the use of flexibly routed and dispatched buses are beingundertaken in Richmond Hill, Ontario, and in the WestlakeMacArthur Park region of Los Angeles. Transit industryimprovements in the efficient scheduling and dispatching ofshared-ride services could be used to improve an airport’sability to provide efficient shared-ride services (55).
Transit planners are examining the concept of route devia-tion, in which the bus has a fixed origin and fixed destinationpoint. Along the line, some stops would always be served, andthe operator could deviate from that route for requested extrastops. In Prince William County, Virginia, a route deviationbus has been operating since April 1995. Originally, requestsfor special service had to be received between 24 and 48 hr inadvance. Improvements in the scheduling and dispatchingprocess have decreased that timing to 2-hr advance notice.Similar experimental services are in operation in York, Penn-sylvania, and South-central Los Angeles (56).
Good examples of efforts to increase taxi occupancy ratesexist in Linz, Austria, and throughout the Netherlands. In Linz,

transit operators found that the operation of late-night buseswas highly inefficient, but that demand did exist for ser-vice. The transit agency provides taxis to serve the bus routeevery 30 min from 8 P.M. to midnight, and every hour frommidnight to 4 A.M. Passengers pay 150 percent of the bus fareand must request the service at least 30 min ahead of thedesired pickup time. The transit agency estimates that it savessignificant amounts of subsidy per year from operation of theprogram. Similar shared-taxi operations to replace fixed-routeand scheduled services exist in France (at La Rochelle andSaint-Bieuc) and in Germany (Tübingen) (57).
One of the strongest precedents for use of matched tripsat U.S. airports is the Treintaxi program organized by DutchNational Railways. The program was originally designed toincrease intercity rail ridership by providing lower-cost taxi ser-vice to and from the main train stations. The service is offeredin 81 cities, but not in Amsterdam or the Hague. From the trainstation, the rider is asked to wait about 15 min to enable the dis-patcher to find a matching ride; then, the taxi is dispatched withor without the matching ride. From a residence, the trip must berequested at least 30 min in advance. The program accommo-dates 3.6 million riders per year with an average vehicle occu-pancy of 2 riders per trip. At present, customers are not requiredto show a rail ticket to use the taxi service. Figure 6-11 showsthe operation at Utrecht Central Station.
The SAMPO Project: Advanced Application of Automated Dispatching
In the European Union, tests were performed as part of a wide-ranging program called the System for AdvancedPublic Transport Operations (SAMPO). The SAMPO programincluded a series of demonstrations of methods developed tomatch riders in order to achieve higher overall occupancy ratesfor buses in Italy, Finland, Belgium, and Sweden. Each ofthese projects was intended to improve the efficiency of pro-
118
viding specialized transit services to areas with low-densitytrip endings—a pattern common to that of U.S. airports. Withinthe SAMPO program, the Flexline project in Sweden is par-ticularly relevant to U.S. airports.
The Flexline Project
The Flexline project in Gothenburg, Sweden, is a success-ful example of a way to increase the ground transportationsystem throughput. The system is a route-deviation model inthat the bus always leaves from the same point and arrives atthe same point but takes a different route depending on therides that are matched. This operating format parallels thatundertaken by many airport van operators, who dispatch tripsto a given corridor on a regular basis.
The project is important to this research in the transit indus-try in that the new software program—PLANET—combinesboth automated ride-matching software and automated dis-patching techniques. In one aspect of the project, the traveleruses an identification card with home address and relevantbooking information. At the town center, the traveler swipesthe card into a telephone-based connection that transmits theuser’s destination to the central computer (see Figure 6-12).The automated software then determines which bus trip theuser should be assigned to and sends a dispatching orderdirectly to the driver on the bus (see Figure 6-13). All of thisoccurs without the intervention of a telephone operator orstaff. The project has resulted in an overall vehicle-occupancyratio of six passengers per vehicle, which is much higher thanthe occupancy ratios for the series of specialized services thatwere replaced by the new system (58).
Implications for Airport Access
The SAMPO automated dispatching project has manyimplications for improving overall vehicle-occupancy levels at
Figure 6-11. Shared-ride taxi systems have beensuccessfully implemented in the Dutch National Railways’Treintaxi program.
Figure 6-12. This card reader triggers a program thatautomatically schedules and dispatches a shared-ride busin Gothenburg, Sweden.
Pho
to:
Mat
thew
A. C
ooga
n
Pho
to:
Mat
thew
A. C
ooga
n

airports. SAMPO represents an important initial application ofthe concept of automated shared-ride scheduling and trip dis-patching. This concept could be applied at several levels ofcomplexity and different price points within the airport groundaccess system. The same technology could be used to place 2 parties in one taxi or 10 parties in a medium-sized bus. Thekey element is that the task of matching and dispatching is cen-tralized and operated by the public sector and is not left to pri-vate operators.
EMERGING BUS TECHNOLOGY
As was discussed in Chapter 2, the primary public transitmode to U.S. airports is some type of bus. With rare exception,the bus service departs from some exterior waiting area wherepassengers are expected to wait in the cold, heat, rain, or snow.Although these conditions are common for bus passengersaround the world, FTA has taken the lead in examining alter-native strategies to address these and other concerns, such asaccessibility for the disabled traveler. Extensive research hasbeen undertaken around the world, including the developmentby German engineers of the “guided bus” shown in Figure 6-14.The results of this examination of urban transportation ser-vices could have major application at U.S. airports. This sec-tion summarizes areas of recent research in the developmentof higher-performance bus systems. Examples of advancedbus system designs are then provided, as well as a discussionof airline operation of bus systems.
Bus Rapid Transit
FTA has undertaken a national program to improve the per-formance and productivity of bus systems, and several ele-ments of that program have direct and immediate applicationto airport ground access services. The total program includes
119
concepts such as bus lanes, bus streets, busways, signal pref-erence, traffic management, fare prepayment and all-doorboarding, high-quality amenities, and integration with land-use policy. Each of these concepts is applicable to the task ofimproving the quality of public transit services to airports. Inaddition to experience in the United States and Canada, theFTA program highlights the highly innovative bus system inCuritiba, Brazil. The basis of this Brazilian system is knownas “bus rapid transit,” characterized by the use of “high-level”platforms for getting on and off the bus and resulting in a typ-ical bus station dwell time of only 15 to 19 sec (59).
The Level-Entry Bus Concept
The airport passenger nearly always carries baggage,whether on board the plane or for through-checking. The needto accommodate such baggage creates a challenge in design-ing a successful public transit system. The potential to designa vehicle that can be entered and exited without steps hasimplications for every passenger carrying baggage, as well asfor compliance with ADA. The concept of level entry is a keyelement in the bus rapid transit strategy. This concept has beenexamined and developed over the past 2 decades, in both theUnited States and Europe, for operation in transit systems andfor airport access.
Level-entry boarding is a characteristic of many rail systems.In the United States, transit vehicles that operate only on pri-vate rights-of-way, such as the light rail service to Lambert-St. Louis Airport, are typically designed to provide level-entry boarding; those transit vehicles that operate on publicstreets, such as the light rail service to Baltimore-WashingtonAirport, typically require passengers to climb steps to boardthe vehicle. San Francisco Municipal Railway light rail vehi-cles are designed with a convertible system, which uses on-board steps for street operations and level-boarding in thetunnel under Market Street in downtown San Francisco. Over
Figure 6-13. Revised routes and passenger requirementsare dispatched automatically to the driver of the shared-ride bus in Gothenburg, Sweden.
Figure 6-14. German guided-bus technology has beenexamined for use in airport access.SOURCE: Daimler Benz.
Pho
to:
Mat
thew
A. C
ooga
n

the past decades, significant research and product develop-ment have been conducted to enable buses to have level-entryboarding similar to rail systems. Conceptual research wasundertaken at Boston-Logan Airport on a system of level-entry buses to be used for on-airport circulation as well as theoff-airport access system.
In the late 1980s, the Curitiba bus was brought to LowerManhattan for a demonstration. The Manhattan demonstrationused a prepayment system, in which riders enter the station ata sidewalk-level turnstile and then take a ramp up to the busfloor–level platform. Prepayment allows the use of both thefront and back doors of the bus. (An honor-system pass madethe back door usable by the majority of bus riders in the Halm-stad experiment, which will be discussed below.) Followingthe example of the Halmstad bus, the Brazilian Curitiba busused a bridge-extension concept. Figure 6-15 shows how thebridge appears from within the bus.
This brief review of the development of the level-entry bussuggests that the technology exists to enable airport users,
120
many of whom have bags or strollers, to gain access to thefloor level of a bus without using steps. The ADA complianceimplications of the level-entry bus are another major reasonfor exploring the potential of this technology.
Options for Bus Rapid Transit: The Guided Bus
For about 20 years, the transit industry has been examiningthe type of guidance needed to ensure safe level-entry board-ing of buses. Two-sided, one-sided, and electronic guidancetechnologies have been developed.
Two-Sided Guidance. Initially, research focused on aconcept developed in Germany, in which the bus operates ona guideway that provides lateral guidance on both sides of thevehicle. The earliest proposal for a bus with two-sided guid-ance in the United States was for the Seattle, Washington,bus tunnel. In the 1980s, studies were undertaken by a Ger-man research consortium for the Seattle Metro. These stud-ies proposed a bus with dual-platform capabilities. All doorson the right side of the bus would be designed for low-levelboarding, with steps leading to the curb. All doors on the leftside of the bus would be at the floor level of the bus. In thedowntown tunnel, center-platform stations would be servedby the high-platform doors on the left side of the bus.
Buses with two-sided guidance use a guider wheel on theright and left sides of the bus, operating in a trough betweenthe two guidance walls (see Figure 6-16). Demonstrations oftwo-sided guidance buses were undertaken in Essen, Germany.The two-sided guidance concept was developed by DaimlerBenz as the O-Bahn System and was implemented in Adelaide,Australia. The O-Bahn System is now under consideration inEugene, Oregon.
Ultimately, Seattle chose a low-platform system for thedowntown bus tunnel and did not pursue the high-platform
Figure 6-15. The Halmstad technology was refined with theuse of a simple bridge in the Curitiba bus system in Brazil.SOURCE: Oliver Gilham.
Figure 6-16. Two-sided guidance allowed precise dockingat platforms, a key goal of the bus rapid transit concept.
Pho
to:
Mat
thew
A. C
ooga
n

concept any further. Seattle did implement the first U.S. sys-tem to use dual-propulsion vehicles, which allowed electrifiedservice in the tunnel portion of the trip and diesel-poweredservice on the streets and highways. Currently, the SeattleMetro operates articulated, dual-propulsion buses from thedowntown bus tunnel directly to the Seattle-Tacoma Airport(see Figure 6-17).
One-Sided Guidance. A second form of guidance strat-egy, developed in Germany, relies on guidance from one sideof the bus rather than from two. Both systems use a rollinghorizontal guider wheel connected to the steering system ofthe front axle of the bus. The concept of one-sided guidanceis based on the driver (or automated feature) biasing thewheel to one side, where contact is made with the guider rail.With this technology, a highly accurate approach can bemade to the high platform, resulting in a minimized gapbetween the platform and the bus floor. Early prototypes ofthis bus were built and operated in Utrecht, the Netherlands.The development of what is now known as the Curitiba busevolved out of Swedish efforts to design an electronic guid-ance system to approach the platform area.
Electronic Guidance. The Swedish government undertooka major demonstration of the concept of the level-entry bus inHalmstad, in central Sweden. In this demonstration, the VolvoCorporation developed a new prototype for an urban city buswith a lower floor than was previously available. Throughoutthe city, 24-in platforms were developed, often with land-scaping. Each door was equipped with a bridging device thatextended out from the bus to make contact with the raised plat-form at the curb (see Figure 6-18). Each right-hand door wasequipped with a detection device to “read” whether the stopwas to be made at a high or low platform. Initially, the VolvoCorporation linked the project with an automated steering sys-
121
tem, designed to bring the bus to the optimal location at the sta-tion. However, drivers resisted giving control of the vehicle tothe automated system, and this aspect of the research projectwas dropped.
From the Halmstad demonstrations, it became clear that thebus could approach the right curb within a tolerance of a fewinches, with some form of bridge making the final connectionto the raised platform. With the cooperation of the Volvo Cor-poration, the concept was then developed on an island nearOslo, Norway, the location of a large population of wheel-chair-bound transit users. After Halmstad, the Norwegianapplication had the highest in-service use of high-platformbuses until Curitiba, Brazil.
Examples of Advanced Bus System Design
Massport’s Experience with Developing Bus Technology
Level-Entry Buses at Boston-Logan International Airport.In the 1980s, the use of low-floor technology for bus andlight rail transit increased rapidly. The Cross Harbor andRegional Transportation Study, undertaken by Massport incooperation with Boston’s Central Artery/Tunnel Project,concluded that two-sided bus guidance was not appropriatefor the airport context. Massport focused on solutions thatbrought the bus to the platform, with or without a guidancewheel. Plans were explored for the use of a level-entry bus atthe point of transfer between the rapid transit airport stationand Massport’s shuttle bus (see Figure 6-19). The assumedbus technology was the same as that ultimately chosen forCuritiba. The Massport team examined the concept of thehigh-platform bus providing service to terminals with doorsconnecting the bus to interior heated or air-conditioned wait-ing areas. Much as the people mover provides service frominterior space to interior space, the bus rapid transit concept
Figure 6-17. The Seattle Metro operates a dual-propulsion, articulated bus from Seattle’s downtown tunnelto the Seattle airport.
Figure 6-18. Level-entry capability was accomplished inHalmstad, Sweden, without use of guidance technology.
Pho
to:
Mat
thew
A. C
ooga
n
Pho
to:
Mat
thew
A. C
ooga
n

would allow travelers to make their trip without experiencingoutdoor weather conditions.
At present, the proposal for a cross platform–level connec-tion with the rapid transit system has been abandoned. Workon an advanced bus system continues in Boston, with a dual-propulsion bus tunnel planned to connect with Boston-Logan.
Reversible Lane Technology: The Zipper Lane Project.Boston’s Central Artery/Tunnel Project incorporates thenation’s first roadway to be used exclusively for bus and com-mercial vehicle operations; the roadway connects the TedWilliams Tunnel and the Southeast Expressway. The projectalso included a reversible bus lane on the Southeast Express-way to Braintree, using a movable concrete barrier knownlocally as “the Zipper.” Because the Ted Williams Tunnel istemporarily operating for bus and commercial-vehicle traf-fic only, the Massport Logan Express bus can operate fromBoston-Logan Airport to Braintree with exclusive, managedlanes for almost all of the trip. The Braintree service increasedfrom an average daily ridership of 835 to 1,290 shortly afterthe inauguration of the new radial bus lane and the commercial-vehicles-only Ted Williams Tunnel. This increase in ridershipresulted from the coordinated HOV policy, the use of zipper-lane technology, and various other factors.
Pittsburgh’s Airport Corridor Busway
A state-of-the-art example of how airport access planningcan be integrated into a larger strategy for access and mobilityin the region is being developed in Pittsburgh. In 1990, the PortAuthority of Allegheny County, in association with the Penn-sylvania DOT, completed the Parkway West Multi-ModalCorridor Study and the Airport Busway Transitional Analysis.The transitional analysis included a comparison of light rail,
122
busway, and other HOV strategies. Light rail transit was elim-inated from consideration because, compared with a busway,it was found (1) to cost two to three times more to construct,(2) to cost significantly more to operate and maintain, (3) tooperate at essentially the same speed, and (4) to attract no morepassengers. The report noted that light rail transit could not bestaged incrementally, and the busway could (60).
The Southwest Pennsylvania Regional Planning Commis-sion forecast that the current travel time of 46 min fromdowntown Pittsburgh to the airport would increase to 90 minby 2010. The travel-time savings forecast to result from thebusway project are substantial. For example, the travel timefrom the airport to downtown in 2005 is expected to decreasefrom 55 min to 29 min. The Final Environmental ImpactStatement (FEIS) for the project estimated that service qual-ity would improve and significant numbers of additional rid-ers would be attracted, resulting in a reasonable cost per addi-tional rider.
The Phase One Airport Busway/Wabash Project is an8.1-mi, two-lane roadway from Parkway West to downtownPittsburgh. Of that distance, 7 mi would be used exclusivelyby buses, 0.7 mi would be shared with HOVs, and the last0.4 mi would use a new HOV bridge over the MonongahelaRiver. Between the Parkway West highway entrance andStation Square, there would be seven stations, which couldbe bypassed by an express bus service. As stated in the FEIS,the project is expected to cost $307.8 million, with busescosting an additional $9.6 million.
The busway project essentially provides the option of avoid-ing a highly congested section of I-279. How often the airportbus would use this routing is not yet clear, as the busway align-ment is somewhat longer than the general-purpose highwaythat it bypasses. The airport buses will use general-purposelanes between the airport and the intersection of Parkway Westand the busway to the borough of Carnegie. Although the cor-ridor is labeled “Airport Busway,” the actual number of airporttravelers expected to use the service is not set forth in the FEIS.To encourage commuter riders to travel into downtown, a 600-car park-and-ride facility will be in operation at the abandonedairport terminal.
Only a relatively small number of airport ground accesssystems use bus-priority treatments, such as exclusive bus-ways and HOV lanes. The Seattle Metro operates an airportbus over the HOV lanes of I-5. Morning peak-hour busesfrom Newark International Airport benefit from the bus lane,which leads to the entrance of the Lincoln Tunnel. Duringsome hours of the day airport buses from LaGuardia Air-port make use of a peak-hour lane that gives priority into theMidtown Tunnel to Manhattan. A good example of the useof bus priority treatment is the use of a shared bus and lightrail right-of-way through the center of Gothenburg, Sweden(see Figure 6-20). These buses avoid general-purpose traf-fic, while distributing passengers directly to the major CBDdestinations.
Figure 6-19. The high-platform level-entry bus wasproposed for this cross platform connection at Boston-Logan Airport.SOURCE: Computer-aided drawing prepared by the Central Artery/Third HarborCrossing Project, Boston, Massachusetts, 1989.

Airline Operation of Bus Service
In a model related to the through-ticketing between airlinesand railways in Europe, several airlines operate bus connec-tions that use a through-ticketing system. From Frankfurt,Lufthansa German Airlines runs buses to Heidelberg, Mann-heim, and Talheim, Germany. Japan Airlines runs a bus ser-vice from Frankfurt Airport to Düsseldorf.
Early examples of airline-operated buses in the United Statesincluded America West Airlines’ service between Phoenix andScottsdale, Arizona. The service was unusual in that the buswas driven onto the tarmac of the airfield and met the pas-sengers before they entered the terminal building. Baggagewas through-checked in both directions. The service was dis-continued during a cost-cutting period. American Airlinesoperated bus service from several locations in the Dallas/FortWorth area with full baggage check-in, but this service hasalso been discontinued.
Currently, Frontier Airlines operates bus service betweenBoulder, Colorado, and Denver Airport. Continental Expressoperates bus service between Newark and Lehigh Valley Inter-national Airports. Through-baggage check-in is offered in bothdirections.
United Airlines has made the largest commitment to busservice operated by an airline. The airline’s Ground Link pro-gram is subtitled “One Reservation, One Ticket.” Each bus trippurchased accrues 500 Mileage Plus miles. The off-site pickupareas are usually hotels, and no through-baggage check-in isprovided. United Airlines currently provides through-ticketingservice to 18 cities.
EMERGING RAIL TECHNOLOGY
A wide variety of rail services have been used for airportaccess in the last decade. These services range in level of spe-cialization from the use of rapid transit equipment with vir-tually no accommodation for the baggage needs of the airline
123
passengers to the development of totally new equipment withautomated baggage-container operations. The following con-cepts in rail technology are discussed below:
• Traditional rapid transit vehicle design,• Commuter and standard intercity rail technology,• High-speed rail technology, and• Magnetic levitation (maglev) technology.
Traditional Rapid Transit Vehicle Design
Systems that use traditional rapid transit vehicle configu-rations include those serving Boston; Chicago; Washington,D.C.; Cleveland; and Atlanta. Each of these “heavy rail” sys-tems operates with full high-platform format and uses third-rail power supply. Planned operations with rapid transitdesign include the Bay Area Rapid Transit (BART) systemextension to San Francisco Airport. “Light rail” technology,with overhead catenary power supply, is currently in oper-ation in systems serving airports in Baltimore and St. Louis(see Figure 6-21). An extension of the low platform, catenary-powered light rail system to serve Portland Airport is currentlyin design.
Systems in Europe that use traditional rapid transit designvehicles include the Piccadilly Line to Heathrow Airport inLondon. The RER in Paris and the S-Bahn in Munich andFrankfurt provide longer-distance regional services (similarto commuter rail) with major downtown distribution (similarto rapid transit).
Commuter and Standard Intercity Rail Technology
The most prevalent technology for airport rail access is theuse of traditional commuter rail trains that are designed for useon a common track with freight and long-distance passenger
Figure 6-20. This airport bus uses exclusive bus/tramlanes throughout downtown Gothenburg, Sweden.
Figure 6-21. Air travelers in St. Louis are served withconventional light rail equipment.
Pho
to:
Mat
thew
A. C
ooga
n
Pho
to:
Mat
thew
A. C
ooga
n

rail trains. These commuter trains are designed with a heavierbody than rapid transit trains, which are not designed to beused on the same track as traditional commuter rail trains.Commuter rail car design considerably constrains the abilityof these systems to negotiate small-radius turns in comparisonwith light rail and people movers. The larger turning radiusaffects the extent to which commuter rail can be architecturallyintegrated with existing airport facilities.
In the United States, standard electrified rail technology isused only in service to Philadelphia International Airport (seeFigure 6-22). The new service to Newark Airport will be oper-ated with standard New Jersey Transit commuter rail equip-ment. Similar rail equipment is used by the Maryland RailCommuter service (MARC) system serving Baltimore-Wash-ington Airport. Other propulsion systems for airport access arediesel multiple-unit trains as proposed in Denver. Early con-sideration is now being given to the possibility of servingRaleigh-Durham International Airport with diesel multiple-unit commuter rail technology.
High-Speed Rail Technology
The operators of two European airports are investing heav-ily in new high-speed rail services, while other European oper-ators are offering rail service that uses high-speed rights-of-way for a portion of their operation. In this concept, the airlinepassenger shares the same equipment provided for the nationalrail service. The French TGV, which operates in excess of180 mph, was Europe’s first high-speed rail service. Servicewas inaugurated to Paris’ Charles de Gaulle Airport in 1996.As was discussed in Chapter 5, a new high-speed rail stationhas opened at Frankfurt Airport as part of an entirely new lineconnecting to Cologne. This high-speed rail service will havea travel time of 1 hr, compared with the current 2-hr travel timeof the regular rail.
In the United States, the Baltimore-Washington Airport(and possibly in the future, Newark Airport) will be served
124
by Amtrak’s new 150-mph rolling stock, to be inauguratedin 2000. The Newark rail station will be connected to the airterminals by an automated people mover; the Baltimore-Washington Airport rail station is currently connected to theair terminals by shuttle bus.
Maglev Technology
Initial proposals for use of maglev technology—in whichtrains are magnetically propelled and float in a magnetic fieldabove the guideway—for airport access projects in Orlando,Pittsburgh, and Los Angeles have not been developed fur-ther. An early use of maglev technology to link the airport inBirmingham, England, with a parking facility has been aban-doned. Similarly, maglev-technology systems had been pro-posed for the expansion of Frankfurt Airport, but they werealso abandoned.
The most highly developed plans for maglev technology inU.S. airport access were proposed in Orlando, Florida. Exten-sive designs were developed for a maglev system betweenthe landside terminal at Orlando Airport and a new terminalat International Drive, near, but not adjacent to, the DisneyWorld complex. Extensive market forecasts indicated that thesystem would mainly be used as a tourist attraction rather thanas a method of airport access. Even with fully developed useas an attraction, the capital costs could not be justified. Plansfor the link had developed so far that a subsidy of more than$90 million was included in the Intermodal Surface Trans-portation Efficiency Act of 1991 (ISTEA) to purchase theright-of-way for the project.
A group of industry leaders in Pittsburgh proposed thatthe federal government fund a maglev demonstration projectbetween Pittsburgh Airport and the downtown. However,U.S. DOT scaled back the National Maglev Initiative to asmaller program, with less emphasis on actual demonstra-tions.
AUTOMATED PEOPLE-MOVER TECHNOLOGY
Automated people-mover technology is used at many air-ports for internal circulation rather than for regional airportground access. At a limited number of airports, these internalsystems are used to transport ground access passengers to con-necting facilities. In a smaller number of cases, the peoplemover is used off airport property to make important regionalconnections.
Use of Automated People Movers as Circulationto Regional Ground Services
On-airport people movers are used at several airports toassist in connecting travelers with ground transportation ser-vices. In Chicago, users of the new international facility accessthe CTA airport station via the internal people mover, while allother users walk to the transit station in the central garage.
Figure 6-22. Electrified commuter rail equipment is usedto serve the Philadelphia International Airport.
Pho
to:
Mat
thew
A. C
ooga
n
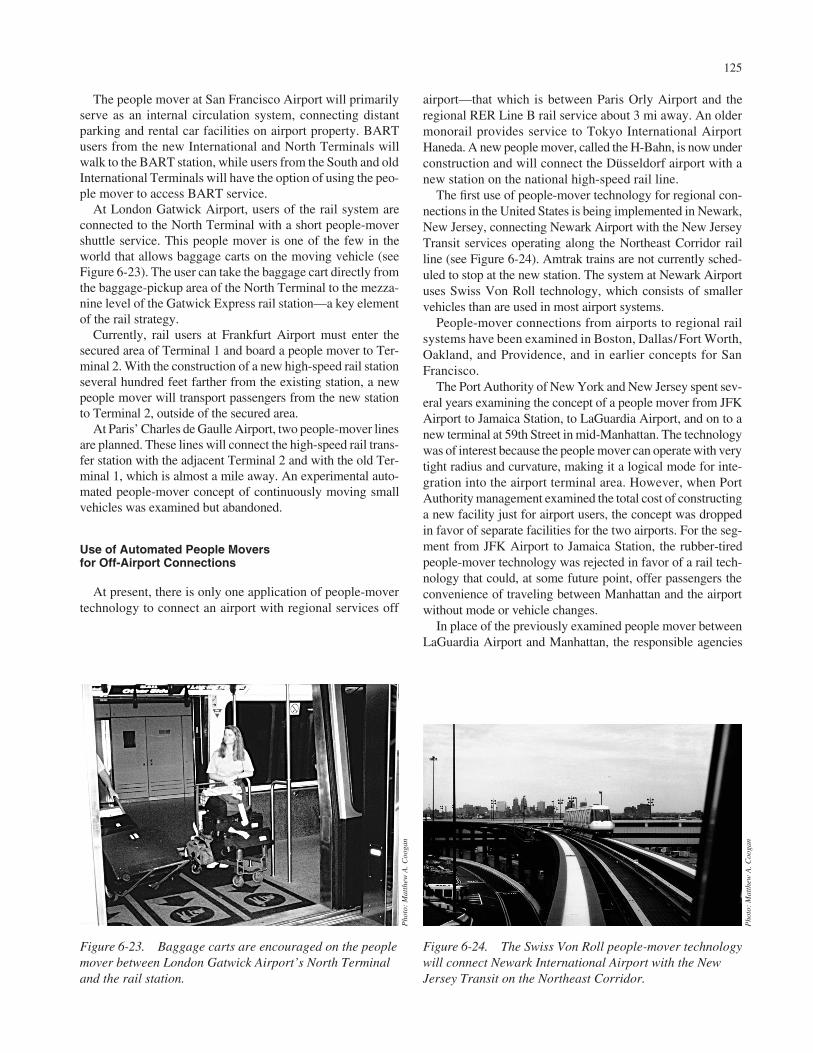
The people mover at San Francisco Airport will primarilyserve as an internal circulation system, connecting distantparking and rental car facilities on airport property. BARTusers from the new International and North Terminals willwalk to the BART station, while users from the South and oldInternational Terminals will have the option of using the peo-ple mover to access BART service.
At London Gatwick Airport, users of the rail system areconnected to the North Terminal with a short people-movershuttle service. This people mover is one of the few in theworld that allows baggage carts on the moving vehicle (seeFigure 6-23). The user can take the baggage cart directly fromthe baggage-pickup area of the North Terminal to the mezza-nine level of the Gatwick Express rail station—a key elementof the rail strategy.
Currently, rail users at Frankfurt Airport must enter thesecured area of Terminal 1 and board a people mover to Ter-minal 2. With the construction of a new high-speed rail stationseveral hundred feet farther from the existing station, a newpeople mover will transport passengers from the new stationto Terminal 2, outside of the secured area.
At Paris’ Charles de Gaulle Airport, two people-mover linesare planned. These lines will connect the high-speed rail trans-fer station with the adjacent Terminal 2 and with the old Ter-minal 1, which is almost a mile away. An experimental auto-mated people-mover concept of continuously moving smallvehicles was examined but abandoned.
Use of Automated People Movers for Off-Airport Connections
At present, there is only one application of people-movertechnology to connect an airport with regional services off
125
airport—that which is between Paris Orly Airport and theregional RER Line B rail service about 3 mi away. An oldermonorail provides service to Tokyo International AirportHaneda. A new people mover, called the H-Bahn, is now underconstruction and will connect the Düsseldorf airport with anew station on the national high-speed rail line.
The first use of people-mover technology for regional con-nections in the United States is being implemented in Newark,New Jersey, connecting Newark Airport with the New JerseyTransit services operating along the Northeast Corridor railline (see Figure 6-24). Amtrak trains are not currently sched-uled to stop at the new station. The system at Newark Airportuses Swiss Von Roll technology, which consists of smallervehicles than are used in most airport systems.
People-mover connections from airports to regional railsystems have been examined in Boston, Dallas/Fort Worth,Oakland, and Providence, and in earlier concepts for SanFrancisco.
The Port Authority of New York and New Jersey spent sev-eral years examining the concept of a people mover from JFKAirport to Jamaica Station, to LaGuardia Airport, and on to anew terminal at 59th Street in mid-Manhattan. The technologywas of interest because the people mover can operate with verytight radius and curvature, making it a logical mode for inte-gration into the airport terminal area. However, when PortAuthority management examined the total cost of constructinga new facility just for airport users, the concept was droppedin favor of separate facilities for the two airports. For the seg-ment from JFK Airport to Jamaica Station, the rubber-tiredpeople-mover technology was rejected in favor of a rail tech-nology that could, at some future point, offer passengers theconvenience of traveling between Manhattan and the airportwithout mode or vehicle changes.
In place of the previously examined people mover betweenLaGuardia Airport and Manhattan, the responsible agencies
Figure 6-23. Baggage carts are encouraged on the peoplemover between London Gatwick Airport’s North Terminaland the rail station.
Figure 6-24. The Swiss Von Roll people-mover technologywill connect Newark International Airport with the NewJersey Transit on the Northeast Corridor.
Pho
to:
Mat
thew
A. C
ooga
n
Pho
to:
Mat
thew
A. C
ooga
n
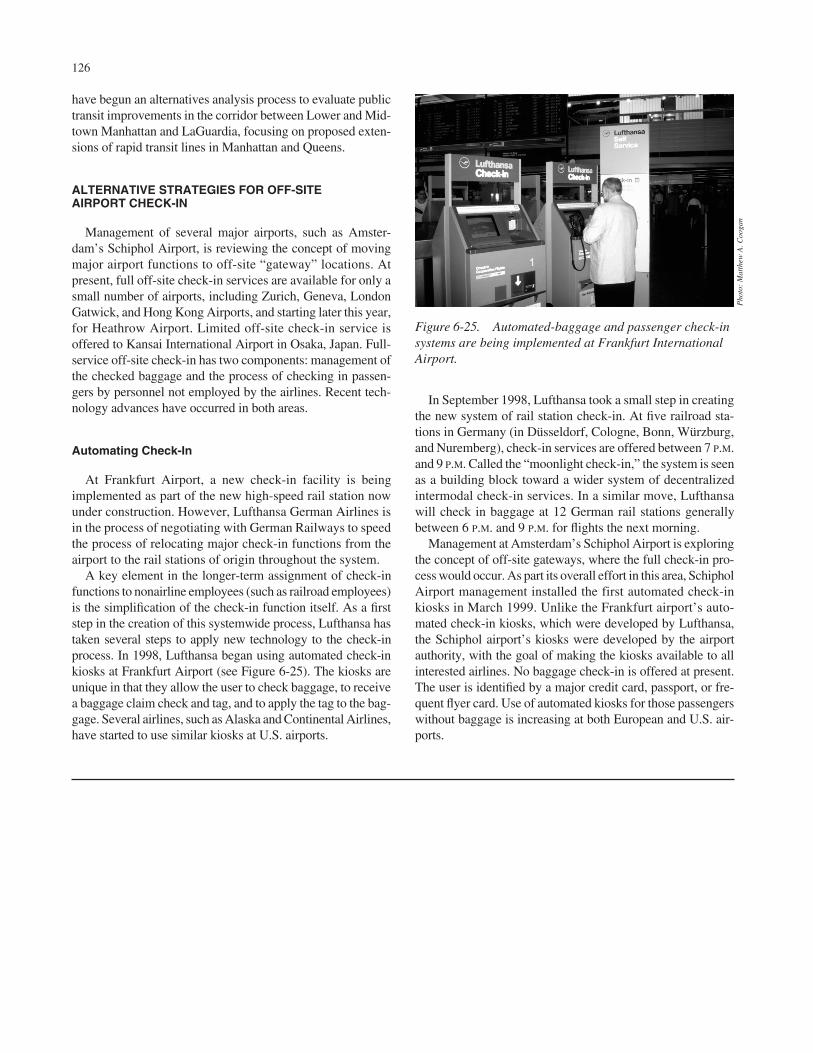
have begun an alternatives analysis process to evaluate publictransit improvements in the corridor between Lower and Mid-town Manhattan and LaGuardia, focusing on proposed exten-sions of rapid transit lines in Manhattan and Queens.
ALTERNATIVE STRATEGIES FOR OFF-SITEAIRPORT CHECK-IN
Management of several major airports, such as Amster-dam’s Schiphol Airport, is reviewing the concept of movingmajor airport functions to off-site “gateway” locations. Atpresent, full off-site check-in services are available for only asmall number of airports, including Zurich, Geneva, LondonGatwick, and Hong Kong Airports, and starting later this year,for Heathrow Airport. Limited off-site check-in service isoffered to Kansai International Airport in Osaka, Japan. Full-service off-site check-in has two components: management ofthe checked baggage and the process of checking in passen-gers by personnel not employed by the airlines. Recent tech-nology advances have occurred in both areas.
Automating Check-In
At Frankfurt Airport, a new check-in facility is beingimplemented as part of the new high-speed rail station nowunder construction. However, Lufthansa German Airlines isin the process of negotiating with German Railways to speedthe process of relocating major check-in functions from theairport to the rail stations of origin throughout the system.
A key element in the longer-term assignment of check-infunctions to nonairline employees (such as railroad employees)is the simplification of the check-in function itself. As a firststep in the creation of this systemwide process, Lufthansa hastaken several steps to apply new technology to the check-inprocess. In 1998, Lufthansa began using automated check-inkiosks at Frankfurt Airport (see Figure 6-25). The kiosks areunique in that they allow the user to check baggage, to receivea baggage claim check and tag, and to apply the tag to the bag-gage. Several airlines, such as Alaska and Continental Airlines,have started to use similar kiosks at U.S. airports.
126
In September 1998, Lufthansa took a small step in creatingthe new system of rail station check-in. At five railroad sta-tions in Germany (in Düsseldorf, Cologne, Bonn, Würzburg,and Nuremberg), check-in services are offered between 7 P.M.and 9 P.M. Called the “moonlight check-in,” the system is seenas a building block toward a wider system of decentralizedintermodal check-in services. In a similar move, Lufthansawill check in baggage at 12 German rail stations generallybetween 6 P.M. and 9 P.M. for flights the next morning.
Management at Amsterdam’s Schiphol Airport is exploringthe concept of off-site gateways, where the full check-in pro-cess would occur. As part its overall effort in this area, SchipholAirport management installed the first automated check-inkiosks in March 1999. Unlike the Frankfurt airport’s auto-mated check-in kiosks, which were developed by Lufthansa,the Schiphol airport’s kiosks were developed by the airportauthority, with the goal of making the kiosks available to allinterested airlines. No baggage check-in is offered at present.The user is identified by a major credit card, passport, or fre-quent flyer card. Use of automated kiosks for those passengerswithout baggage is increasing at both European and U.S. air-ports.
Figure 6-25. Automated-baggage and passenger check-insystems are being implemented at Frankfurt InternationalAirport.
Pho
to:
Mat
thew
A. C
ooga
n
127
CHAPTER 7
INSTITUTIONAL ENVIRONMENT AND FACTORS AFFECTING PUBLIC TRANSPORTATION ACCESS TO LARGE U.S. AIRPORTS
This chapter provides an overview of the key legal, finan-cial, institutional, and jurisdictional factors affecting publictransportation to airports. Three major areas of institutionaldeterminants to financing airport access projects are reviewed:(1) federal funding and oversight, specifically FAA policiesrelated to the financial support of airport ground transporta-tion projects; (2) funding of surface transportation projects byFHWA and FTA and by state governments; and (3) contrac-tual agreements between airport operators and airlines that limitthe use of airport funds. FAA’s policies with regard to use ofairport revenue now allow greater flexibility in funding airportaccess projects (this funding flexibility will be discussed laterin this chapter).
OVERVIEW—AIRPORT LEGAL STRUCTUREAND FINANCIAL OPERATIONS
This section provides an overview of the legal structure ofmost U.S. airports, a discussion of the factors governing U.S.airport financial operations, and a discussion of the sources offunding for projects at U.S. airports.
Legal Structure of U.S. Airports
Most U.S. airports are operated as either independent not-for-profit entities with oversight by a politically appointedauthority or as self-sustaining enterprise funds of a govern-mental entity such as a county, city, or state government. Theform of governance for the 100 busiest airports (in terms ofpassengers) in the U.S. is as follows (61):
Authority 4%City 40%Regional 23%County 15%State 9%Other 9%
100%
Airports operated as enterprise funds of governmentalentities may be overseen by boards or commissions struc-tured as decision-making entities, operating within the legaland political framework of the sponsoring jurisdiction.
Airport authorities exist in a variety of forms, and theirspecific powers and responsibilities are established by theirenabling legislation. Some airport authorities are independentpublic bodies created by state legislation; others are munic-ipal corporations or agencies created by one or more localjurisdictions under general state statutes governing the estab-lishment of independent authorities. Many airport authoritiessponsored by state or local legislation operate relatively inde-pendently of their governmental sponsors, while remainingresponsive to political concerns and priorities. In other cases,the sponsoring jurisdiction retains some oversight of airportoperation, such as approval of operating budgets and bondissues.
Factors Governing Airport Financial Operations
Most of the sources of capital available to finance airportimprovements have either direct or indirect external restric-tions on their use (e.g., federal or contractual restrictions). Thissection describes those external restrictions and provides thecontext for airport access funding from different sources, whichwill be discussed later.
Figure 7-1 reflects the typical factors that govern airportfinancial operations. Those factors include (1) federal regula-tions and policies and grant assurances made by airport spon-sors, (2) the airport operator’s authorizing legislation, (3) thebond indenture for the airport, and (4) the airport’s airline use-and-lease agreements. The airport’s concession agreement(s)also affect the airport operator’s net revenue and financialcapacity.
Federal Regulations and Policies
The U.S. Congress has passed various legislation since1982 establishing the Airport Improvement Program (AIP)grant funding and the authority for airport operators (1) to levypassenger facility charges (PFCs) and (2) to govern how air-port revenue is generated and used. The most recent legislationwas the Wendell H. Ford Aviation Investment and Reform Actfor the 21st Century, also known as the FAA Reauthorization,or AIR-21. The act was signed into law on April 5, 2000. U.S.DOT and FAA have established regulations and issued pol-icy guidance to provide specific direction to airport operators

128
regarding eligibility and use of AIP funds, PFC revenue, andairport revenue. U.S. DOT and FAA regulations and policiesregarding airport rates and charges, which relate to how airportrevenue is generated, have also been issued.
Authorizing Legislation
Airport operators that are independent entities or enterprisefunds of a city, county, or state government typically are gov-erned by authorizing legislation or a local charter that estab-lishes the airport operator’s organizational structure, responsi-bilities, and powers. The authorizing legislation may specifyfacilities, such as airport access roads, that the airport operatoris responsible for developing or maintaining, or both.
Bond Indenture
The bond indenture—also called a bond resolution or bondordinance—provides the legal basis for issuing airport revenuebonds and defines the terms under which additional bondsmight be issued, including the need for revenue-generatingprojects. The bond indenture defines what may or may not beincluded in the definition and computation of airport revenuesand expenses. The indenture establishes various funds andaccounts for the payment of interest and principal on the bondsfrom airport revenues; establishes the priority of payments for
all of the airport operator’s obligations; and sets forth variouscovenants between the issuing entity and the bondholders, in-cluding a rate covenant requiring the airport operator to setrates and charges to produce specified levels of revenues. Someairport bond indentures may also include principles to guidethe establishment of rates and charges for the use of airportfacilities.
Airline Agreement
An airport–airline agreement generally stipulates the rights,privileges, and obligations of the airport operator and the air-lines serving the airport and sets forth the manner in which therentals, fees, and charges paid by the airlines for use of theairport are calculated and adjusted. Parties to use-and-leaseagreements are called “signatory airlines.”
Many airline agreements contain provisions that require acertain number or percentage of the signatory airlines toapprove or disapprove certain decisions of the airport opera-tor, most often those decisions involving airport capital expen-ditures. These provisions are known as “Majority-in-Interest”provisions (MII) and are designed to give the signatory air-lines some control over the long-term financial obligationsundertaken by the airport operator.
Some airports, however, are not governed by such agree-ments; instead, rates are established by ordinance or regula-tion. In those instances, the airport operator typically adopts
• Congress• FAA/DOT• NTSB• EPA• OSHA
FederalRegulationsand Policies
Airport Operator
Bond Indenture
Airline Use-and-Lease Agreement
General Public
SponsorAssurances
AuthorizingLegislation
ConcessionAgreement
• State Government• County or Local Government• Governing Board or Authority
• Merchants/Vendors• Car Rental Franchises• Taxi/Limo Operators• Hotel Operators• Parking Garage Operators• Fixed-Base Operators
• Signatory Air Carriers• Nonsignatory Air Carriers• Air Cargo Carriers
• Bondholders • Rating Agencies • Credit and Liquidity Providers
Capital
Figure 7-1. Factors governing airport financial operations.NOTES: FAA/DOT—Federal Aviation Administration /Department of Transportation
NTSB—National Transportation Safety BoardEPA—Environmental Protection AgencyOSHA—Occupational Safety and Health Administration

129
2. Bond proceeds. Four basic types of bonds are issued tofund airport capital improvements, including (1) generalairport revenue bonds (GARBs) secured by the revenuesof the airport and other revenues as may be defined in thebond indenture; (2) bonds backed either solely by PFCrevenues or by PFC revenues and airport revenues gen-erated by rentals, fees, and charges; (3) special facilitybonds backed solely by revenues from a facility con-structed with proceeds of those bonds; and (4) generalobligation bonds supported by the overall tax base of theissuing entity (the airport sponsor).
3. PFC revenues. Subject to authorization by FAA, com-mercial service airports are allowed to impose a $1, $2,$3, $4, or $4.50 PFC per enplaning passenger. The $4and $4.50 PFC amounts are pursuant to the AIR-21 FAAreauthorization, and FAA guidance was issued in draftform in September 2000. PFC revenues may be used asthey are received (on a pay-as-you-go basis) to directlypay for approved capital projects, or they may be used topay debt service on bonds backed by PFC revenues.
4. Federal grants. Federal AIP grants administered byFAA are funded by aviation-user taxes. AIP grantsare made available to airport operators in two forms:(1) entitlement funds, which are apportioned to airportsbased on levels of passenger traffic and landed weight(for cargo entitlement funds); and (2) discretionaryfunds, which are distributed based on the ranking ofthe airport’s projects in relation to other projects deemedmost important for improving the national air trans-portation system. Federal funding is also occasionallyprovided for airport surface transportation projects byFHWA and FTA.
5. State and local grants. State funding for airportand aviation-related projects comes from a variety ofsources—outright grants, matching share for federal AIPgrants, registration and licensing fees, and dedicated orspecial taxes such as fuel taxes. Support from localgovernment generally takes the form of general taxes.State or local grants may be provided to fund capital im-provements at an airport, such as roadway and accessprojects.
The distribution of funding sources for large- and medium-hub airports nationwide in 1996, the most recent year for whichsuch information is available, is summarized in Table 7-1.
As shown in the table, airport revenue bonds constitute themost significant source of funding, accounting for 62.1 percentof total funding for airport capital projects in 1996. In that year,PFCs accounted for 18.0 percent, and AIP grants accountedfor 10.6 percent of the total; airport-retained earnings, specialfacility bonds, and state and local grants each provided lessthan 5 percent of total funding for airport capital projects.
In developing any strategy for funding off-airport accessprojects, it is important to recognize the hurdles uniquely asso-ciated with each funding source, and to recognize the exter-
a policy setting forth the procedures to be used in calculat-ing user rentals, fees, and charges and applies those proce-dures consistently from year to year in enacting the rate ordi-nance and calculating airport charges. The FAA’s PolicyRegarding Airport Rates and Charges broadly governs air-port rate-setting in the absence of an airline agreement anddispute resolution (62).
Concession Agreements
Many airport operators also enter into various agreementswith providers of nonaeronautical services, such as parkinggarage operators; rental car agencies; and merchants and ven-dors of food, news items, and gifts. These agreements are oftenthe largest source of nonairline revenues at most airports. Theagreements do not, however, govern how an airport operatorcan use those revenues.
Sources of Funding
Major airports in the United States are required to be finan-cially self-sustaining under the FAA grant assurances. Rentals,fees, and charges at these airports must be set so that revenuesare sufficient to cover all operating and capital costs, includ-ing retirement of debt. The capital requirements of airports aresignificant today and are expected to increase in the future. Thecapital needs of airports are primarily driven by
• Traffic growth and the associated need to expand facil-ities;
• Normal wear and tear of facilities as a result of use andage; and
• Changing technology, particularly aircraft technology,rendering existing facilities functionally obsolete.
All the assessments of the future airport capital needsthat have been conducted in recent years (e.g., by the Gen-eral Accounting Office, Airports Council International, andAir Transport Association) indicate that growing capitalinvestments will be required for airports to keep pace withtheir traditional roles. The main sources of funds to buildairport projects include the following:
1. Internally generated capital resulting from retainedairport revenues. Airport operators charge and collectrentals, fees, and charges for the lease and use of facili-ties to passenger and cargo airlines, concessionaires, andothers providing airport support services. The operatingand maintenance costs and portions of the capital costsof projects at major airports are recovered through therentals, fees, and charges collected from airlines, conces-sionaires, and other tenants of the airport. Rentals, fees,and charges collected from tenants of airport facilitiesare also often the primary source of funds for repaymentof principal and interest on bonds.

130
nal approvals required for each, if any. Also, certain fundingsources, such as internally generated airport revenue, may notrequire external approval but are subject to sanction-orientedafter-the-fact reviews by external parties, namely FAA. Fed-eral funding and oversight and contractual agreements betweenairport operators and airlines that limit the use of airport fundsare discussed below.
FEDERAL FUNDING AND FINANCIALOVERSIGHT OF AIRPORTS
This summary of federal funding and financial oversightof airports focuses specifically on AIP grants, PFCs, and useof airport revenue.
AIP Grants
Federal Legislation
Congress enacted the following legislation that makes fed-eral grants available to fund airport capital projects and thatgoverns grant eligibility.
Airway Revenue Act of 1970. This act established theAirport and Airway Trust Fund, which provides the revenuesused to fund the federal (AIP) grant program that was subse-quently established in 1982. The trust fund is funded fromtaxes or user fees, including the airline ticket tax, a tax on air-freight waybills, an international departure fee, and a tax ongeneral aviation gasoline and jet fuel.
Airport and Airway Improvement Act of 1982 (AAIA), asamended. AAIA established AIP. In 1994, AAIA was recod-ified at Chapter 471 of Title 49, United States Code. Section505(a) of AAIA authorizes the FAA Administrator to makegrants to assist in the development of public-use airportsserved by air carriers, commuters, and general aviation. AAIAauthorized funding levels, specified eligible airport sponsorsand projects, and provided the formula for distributing AIPfunds. AIP authorization amounts for single-year or multiyear
periods have subsequently been specified in legislation enactedin 1983, 1987, 1990, 1994, 1996, 1997, 1999, and 2000.
U.S. DOT and FAA Implementation
U.S. DOT and FAA have issued orders and advisory cir-culars to provide guidance and to establish policies and pro-cedures to be used in the administration of AIP grants. Spe-cific eligibility is described below.
Eligible access roads. Access roads and related facilitiesare eligible for AIP grants provided that
• The access road may extend only to the nearest publichighway of sufficient capacity to accommodate airporttraffic.
• The access road must be located on the airport or withina right-of-way acquired by the airport sponsor.
• The access road must exclusively serve airport traffic.Any section of the roadway that does not exclusivelyserve airport traffic is ineligible.
• More than one access road is eligible if the airport sur-face traffic is of sufficient volume to require more thanone road.
• Related facilities such as acceleration and decelerationlanes, exit and entrance ramps, street lighting, and busstops are also eligible when they are a necessary part ofan eligible road.
The AIR-21 FAA reauthorization contains a provisionthat if a large- or medium-hub airport operator applies forand is granted approval to charge a $4 or $4.50 PFC, then thatairport operator must forego 75 percent of its passenger-based entitlements.
Ineligible access roads. Access roads and related facili-ties that are not eligible for AIP funding include
• Roads necessary to maintain FAA facilities installedunder the Facilities and Equipment Program (which isbudgeted separately from AIP);
• Roads exclusively serving industrial or non-aviation-related areas or facilities; and
• Roads exclusively used for connecting parking facilitiesto an access road.
Eligible rapid transit facilities. Facilities within the air-port boundary that are necessary to provide a connection to arapid transit system may be eligible if they will primarily servethe airport. Such projects are evaluated on a case-by-casebasis by the Program Guidance Branch of the FAA Officeof Airport Planning and Programming. In PFC decisions onfixed guideway access projects that involve construction ofrail or guideway segments, FAA has relied on the access roadguidance for reestablishing eligibility. Moreover, FAA has
Funding sourceAmount
(millions) Share
Airport revenue bonds $3,468 62.1%Passenger facility charges 1,005 18.0Federal AIP grants 592 10.6Airport retained earnings 257 4.6Special facility bonds 167 3.0State and local grants 95 1.7
Total $5,584 100.0%
TABLE 7-1 1996 funding sources for large- and medium-hubU.S. airports
SOURCE: General Accounting Office. Airport Financing, Comparing FundingSources with Planned Development. GAO: Washington, D.C. (1998).
131
made it clear that where an on-airport facility would have bothairport and general use, AIP and PFC funding could not beused for any component of the project that would be subjectto general use because the project would not be for exclusiveairport use.
Sponsor Assurances
Airport sponsors and operators must give certain assurancesto FAA in order to receive federal grants. There are 37 assur-ances that must be certified by the sponsor as a condition ofgrant approval depending on the type or scope of the projectfor which the grant is being sought. An airport operator cannotdischarge its commitment to abide by these grant assurancessimply by repaying all of the federal grants received. Exam-ples of assurances that directly affect the legal and financialstructure of airports follow.
Assurance of consideration of local interest. Considera-tion of local interest assures that the sponsor has given fairconsideration to the interests of local communities in whichthe project may be located.
Assurance that public hearings have been held. Holdingpublic hearings assures that, in projects involving the locationof an airport, an airport runway, or a major runway extension,the airport operator has afforded the opportunity for publichearings for the purpose of considering the economic, social,and environmental effects of the project on the communityand the consistency of the project with the planning goals andobjectives of the community.
Assurance of consultation with users. Consulting usersassures that affected parties using the airport facilities areafforded a reasonable opportunity to provide input.
Assurance of economic nondiscrimination. Economicnondiscrimination assures that the airport will be operatedfor public use on fair and reasonable terms and that thoseentities engaged in aeronautical activities at the airport areproviding services on a fair, equal, and not unjustly discrim-inatory basis and are charging fair, reasonable, and not unjustlydiscriminatory prices for those services.
Assurance of nonexclusive right of use. Nonexclusiveright of use assures that the airport operator will not permitexclusive use of its aeronautical facilities by those entitiesproviding aeronautical services.
Assurance of fee rental structure. Fee rental structureassures that the airport fee and rental structure will be set so that that they make the airport a self-sustaining operatingentity.
Assurance of nondiversion of airport revenues. Nondi-version of airport revenues assures that all revenues generatedby the airport and local taxes on aviation fuel will beexpended on the operating and capital costs of the airport orother facilities that are directly and substantially related toaeronautical activity and that are owned or operated by theoperator of the airport.
Passenger Facility Charges
Federal Legislation
In 1990, the U.S. Congress enacted legislation to provideairports with an additional source of funding for capital proj-ects, subject to FAA approval, in the form of PFCs. The Avi-ation Safety and Capacity Expansion Act of 1990 (recodifiedat §40177 of Title 49, United States Code) required U.S.DOT to issue regulations under which a public agency maybe authorized to impose a PFC of $1, $2, or $3 per enplanedpassenger at commercial airports it controls. Under this act,the airport-related projects that are eligible preserve or en-hance safety, capacity, or security of the national air trans-portation system; reduce noise from an airport that is part ofthe system; or furnish opportunities for enhanced competi-tion between or among air carriers.
The AIR-21 FAA reauthorization allowing airports to col-lect $4 and $4.50 PFC amounts includes certain additionaleligibility requirements on the amounts that are more than$3. Large- and medium-hub airport operators must demon-strate that (1) a project will make significant contribution toimproving safety and security, to increasing competition, toreducing current or anticipated congestion, or to reducing theimpact of noise; and (2) the project cannot otherwise be paidfrom AIP. For surface or terminal projects, airport operatorsmust have already made adequate provision for financing ofairside needs.
U.S. DOT and FAA Implementation
In 1991, FAA issued a final rule regulating implementa-tion of the Aviation Safety and Capacity Expansion Act of1990. According to the final rule, ground transportation proj-ects are eligible for PFC funding if the public agency ownsor acquires the right-of-way and any necessary land. Underthe rule, eligibility for ground transportation projects is iden-tical to AIP eligibility (ownership is also necessary for proj-ect eligibility under AIP).
The final rule does not set any eligibility restrictions on themode of transportation for airport access projects, nor does itimpose any requirements on the geographical proximity ofthe project to the airport. The final rule states that these issueswill be reviewed on a case-by-case basis as part of the FAAAdministrator’s review and approval of an application to usePFC revenue.

132
FAA had issued draft guidance regarding implementationof AIR-21 as of September 2000, so specific policies regard-ing applicability of the legislation to ground transportationprojects were not available.
Use of Airport Revenues
Four federal statutes govern the use of airport revenue:
1. Airport and Airway Improvement Act of 1982, asamended. Section 511(a)(12) of AAIA established thegeneral requirement for use of airport revenue, directingairport operators to “use all revenues generated by theairport for the capital or operating costs of the airport,the local airport system, or other local facilities whichare owned or operated by the owner or operator of theairport and directly related to the actual transportationof passengers or property.”
2. Airport and Airway Safety and Capacity ExpansionAct of 1987. Among other provisions, this act narrowedthe permitted uses of airport revenues to non-airportfacilities that are “substantially” as well as directly relatedto actual air transportation.
3. FAA Authorization Act of 1994. This act strengthenedenforcement of revenue-use requirements and requiredannual reporting of airport finances and amounts paid toother units of government. Section 110 added a policystatement concerning the preexisting requirement thatairports be as self-sustaining as possible.
4. FAA Authorization Act of 1996. This act codifiedthe preexisting grant assurance–based revenue use re-quirement and expanded the application of the revenue-use restriction to any airport that has received federalassistance.
U.S. DOT and FAA Implementation
On February 16, 1999, FAA issued its final policy, PolicyRegarding Airport Rates and Charges, concerning the use ofairport revenue. The final policy clarifies a number of proce-dural and substantive rules that have been in effect over thelast 17 years. Key provisions of the final policy include thefollowing.
Ground access capital costs. Airport revenue may be usedfor the capital costs of an airport ground access project or forthe part of a local facility that is owned or operated by the air-port owner or operator and is directly and substantially relatedto the air transportation of passengers or property, includinguse by airport visitors and employees.
As an example, the final policy summarizes FAA’s deci-sion regarding the use of airport revenue to finance con-struction of the rail link between San Francisco Airport andthe BART rail system extension running past the airport. Inthat decision, FAA approved the use of airport revenues topay for the actual costs of construction and equipment asso-
ciated with an airport BART station at the terminal buildingand a rail connector between the airport station and theBART extension. The structures and equipment (1) are to belocated entirely on airport property, (2) are owned by the air-port sponsor, (3) are necessary to connect the airport to alocal transit system, and (4) are directly and substantiallyrelated to the air transportation of passengers (which FAAdefines to include airport visitors and employees) or prop-erty. Whereas the costs of a facility that is only partly airport-related are generally ineligible for use of AIP or PFC fund-ing, the airport-related portion of the costs may be eligible forthe use of airport revenues on a prorated basis. In the BARTcase, since the terminal building and rail connector were tobe exclusively used by airport passengers, the total costs ofthese could be paid with airport revenues.
Ground access operating costs. Airport revenue may alsobe used to pay the operating costs of an airport ground accessproject that can be considered an airport capital project or, asis the case for capital costs, the operating costs of the part of alocal facility that is owned or operated by the airport owner oroperator and is directly and substantially related to the airtransportation of passengers or property. Allowing airport rev-enues to be used to pay the operating costs of a ground accessproject represents a change in FAA policy.
Use of property for publicly owned transit projects.Airport property can be made available at less than fair marketvalue for public transit terminals, rights-of-way, and relatedfacilities without being considered a violation of federal statutesgoverning airport finances if (1) the transit system is publiclyowned and operated (or operated by contract on behalf of thepublic owner) and (2) the facilities are directly and substan-tially related to the air transportation of passengers or property.A lease of nominal value would be consistent with the require-ment for airports to be self-sustaining.
Use of property for private transit projects. The final pol-icy states that, generally, private ground transportation ser-vices are comparable to private taxicab and limousine servicesand are charged fees for the nonaeronautical use of the airport.These private entities are commercial enterprises that operatefor profit, that are not supported by general taxpayer funds, andthat are a significant source of revenue for the airport. How-ever, in cases in which publicly owned transit services are lim-ited and in which a private transit service (bus, rail, or ferry)provides the primary source of public transportation, the air-port operator may make airport property available at less thanfair market value.
FEDERAL AND STATE FUNDING FOR AIRPORT ACCESS PROJECTS
Certain airport projects are also eligible for federal grantsand credit assistance that are available for surface transporta-

133
tion projects through FHWA and FTA. However, there istremendous demand for those grants. Airport projects mustbe given high enough priority on a State’s Transportation Im-provement Program (STIP) to actually receive funding.Because airport projects are often lower in priority, given thenumber of other funding sources upon which airport operatorscan draw, it is unusual for airport projects to receive federalgrants for surface transportation projects.
The federal-aid highway program transfers highway fund-ing raised in federal gas taxes from the Highway Trust Fundback to the states. Unlike most federal programs, which autho-rize and appropriate funds for a single-year only, federal-aidhighway funding is distributed in multiyear authorizationacts. The most recent bill authorizing funding was the Trans-portation Equity Act for the 21st Century (TEA-21), enactedJune 9, 1998.
Generally federal-aid highway funds are apportioned tostates by predetermined formulas dictated by legislation. Theseapportioned funds are further divided into fund categories, eachwith specific eligibility and matching requirements. A muchsmaller proportion of funds is administratively allocated byFHWA to specific states or projects, or both. Congress some-times reduces the amount available to interested project spon-sors by earmarking the allocated funds.
Federal Grants for Surface Transportation Projects
Two factors affect whether federal-aid funds can be usedfor airport access:
1. Underlying funding eligibility—For what kinds ofprojects can the funds be used? In most cases, this isdetermined by the legislation.
2. Funding availability—Will the entity that controls useof the funds choose to use the funds on airport-accessprojects?
When airports are interested in seeking federal-aid fundingfor surface transportation projects, there are three possiblepoints of contact:
1. The MPO in the metropolitan area in which the airportis located. The relevant MPO usually has the best handleon the local funding picture and on the potential eligibil-ity of highway funding. Any area with a population of50,000 or more is likely to have an MPO. The MPOdevelops the local Transportation Improvement Pro-gram (TIP) that is incorporated into the STIP. The STIPidentifies all federal-aid projects for 3 fiscal years at aminimum.
2. The DOT in the state in which the airport is located. Thestate DOT will program all apportioned federal-aid high-way funds that are not set aside for metropolitan areasor otherwise encumbered; however, depending on the
point in the STIP process, many of these funds will havealready have been earmarked for other projects.
3. FHWA, and possibly U.S. DOT, for any allocated fundcategories. An example of these categories is the TEA-21 border infrastructure program that sets aside fundsfor a limited number of border improvement projects.
Specific information on several of the federal funding pro-grams and projects that provide funds for surface transportationprojects is shown in Table 7-2, which is based on informationprovided by FHWA’s Office of Program Administration. Thelist of programs and projects is not intended to be all-inclusive,but is meant to identify those programs that are applicable tosurface transportation in and around airports. All programsand projects are part of the Highway Trust Fund. The amountsin the “Funding” column were authorized by TEA-21. The pro-gram offices listed in the “Comments and additional informa-tion” column should be consulted for further information.
Major Funding Categories
The major funding categories are as follows:
• The Surface Transportation Program (STP) is the mostflexible category of funding. STP contains mandatoryset-asides for safety, as well as set-asides for areas withpopulations of more than 200,000. The latter set-asidescannot be spent without approval of the local MPO;
• The Congestion Mitigation and Air Quality ImprovementProgram (CMAQ);
• The National Highway System (NHS) program; and• The Bridge Discretionary Program.
Eligibility and other information about these and otherfunding categories can be found in FHWA’s Guide to Federal-Aid Programs and Projects (online at www.fhwa.dot.gov/infrastructure/progadmin/covert21.htm).
In addition to FHWA funding sources, FTA provides grantmoneys for eligible transit-related access projects. A largeportion of FTA funds are dedicated to bus and rail transitprojects aimed at alleviating highway congestion in andaround major metropolitan areas.
TEA-21 has authorized the distribution of FTA funds thatare allocated to states through the following:
• Formula Program—available for all transit purposesincluding planning, the purchase of bus and railcars, facil-ity repair and construction, maintenance, and operatingexpenses.
• Capital Program—available for new transit projects, busand bus-facility investments, the modernization of fixedguideway systems, and metropolitan planning. (The capi-tal funds are largely earmarked by the Congress throughannual appropriations.)

Coordination Comments and additional
Program project Funding Eligible projects State MPO Other information
SurfaceTransportationProgram (STP) (a)
Apportionment($33.3 billion forFYs 1998-2003)
Construction,rehabilitation, resurfacing,traffic and otherimprovements forhighways and bridges
x x x (b) STP funds apportioned accordingto a formula: 25% based on theratio of state lanes to U.S. lanemiles, 35% based on the ratio ofstate tax payments to U.S taxpayments into Highway TrustFund, 40% based on the ratio ofstate vehicle miles traveled to allU.S miles traveled. Contact theOffice of Metropolitan Plan-ning (HEMP) or the Office ofProgram Administration (HIPA)
STP Set-Aside forSafety Improvements
10% of STPapportionments
Safety improvements onany public road includingrail and highway cross-ings and hazardelimination projects
x x Contact the Office of HighwaySafety Infrastructure (HMHS) orthe Office of ProgramAdministration (HIPA)
STP Set-Aside forTransportationEnhancements
10% of STPapportionments
Pedestrian facilities, land-scaping, environmentalmitigation, control ofoutdoor advertising, etc.
x Contact the Office of HumanEnvironment (HEHE)
Congestion Mitiga-tion and Air QualityImprovementProgram
$8.1 billion author-ized for FYs 1998-2003 (based oncounty air quality)
Control measures forClean Air Act projects,traffic management,intermodal freightprojects, fare/fee subsidyprograms
x x If a state has no ozone or carbonmonoxide problems, the fundsmay be used for STP eligiblepurposes. Contact the Office ofNatural Environment (HENE)
MetropolitanPlanning Funds
Apportioned tostates based on thesize of urbanpopulation
Inventories or routes forcondition and capacity,predictions of employ-ment, population, andgrowth to assess currentand future transportationneeds
x x MPOs are responsible for devel-oping a long-range transporta-tion plan and transportationimprovement plan. Contact theOffice of Metropolitan Planning(HEMP)
National CorridorPlanning andDevelopmentProgram
$140 million for eachof FYs 1999-2003
Feasibility studies, corri-dor planning and design,location and routingstudies, environmentalreview and construction
x x Contact the Office of Intermodaland Statewide Programs (HESP)
Intelligent Trans-portation SystemsIntegration (c)
$679 million forFYs 1998-2003
In metropolitan areas,funds are for integratingsystems; outside metro-politan areas, funds maybe used for installationcosts
x At least 10% of the funding willbe directed toward rural areas
SurfaceTransportationResearch
$592 millionauthorized forFYs 1998-2003 (d)
R&D and technologytransfer activities relatedto motor carrier trans-portation, transportationplanning and develop-ment, and the effect ofstate laws on the above
x x An Advanced Research Pro-gram has also been establishedaddressing longer-term, higher-risk research. Contact the Officeof Infrastructure Research andDevelopment (HRDI)
State and Commu-nity Highway SafetyGrants
$932.5 millionauthorized for FYs1998-2003
Funds apportioned tostates to pay for non-construction costs ofhighway safety pro-grams aimed at reducinginjury, death, and prop-erty damage from motorvehicle accidents
x x At least 40% of the apportion-ments to each state must beused for local traffic safetyproblems. Contact the Office ofNational and InternationalSafety Programs (HMSP)
High PriorityProjects
$9 billion author-ized for FYs 1998-2003
Studies, engineering,construction, etc.
x x 1,850 projects have beenapproved for funding. Contactthe Office of ProgramAdministration (HIPA)
NOTES: (a) A separate STP program has been established for urban areas with more than 200,000 people. The funds in this program are distributed on the basis of population unless other criteria are approved by the Secretary of Transportation.
(b) Certain projects applied for by urban areas with a population of more than 200,000 are subject to FHWA approval.(c) ITS Program includes a separate program for R&D with authorized funds of $603.2 million for FYs 1998-2003.(d) Funding for the Surface Transportation Research Program also includes funding for the Surface Transportation–Environment
Cooperative Research Program.
TABLE 7-2 Federal-aid programs and projects
SOURCE: FHWA Office of Program Administration. A Guide to Federal-Aid Programs and Projects. FHWA: Washington, D.C. (1999).

135
• Research and Technology Program—available forresearching transportation methods and for developingtechnologies that improve air quality, reduce traffic con-gestion, increase safety, and so forth.
The majority of the recent apportionments of federal mon-eys have been to the Formula and Capital Programs. The fundsare apportioned to state governors by a statutory formula, andthe governors are responsible for allocating the moneys.
The Formula Program is further divided into UrbanizedArea and Nonurbanized Area Programs, an Over-the-RoadBus Accessibility Program, an Alaska Railroad Program, andthe Elderly and Persons with Disabilities Formula Program.
The Capital Program is composed of three programs: theBus Program, the Fixed Guideway Modernization Program,and the Major Capital Investments (“New Starts”) Program.The Bus Program provides funding for acquisition of bus androlling stock and ancillary equipment and for construction ofbus facilities. The Fixed Guideway Modernization Programprovides funding for repair and rehabilitation of existing fixedguideway systems. The New Starts Program provides fundingfor construction of new fixed guideways and rail extensions:subways, light rail, commuter rail, and busways. It is the NewStarts Program that is the most important source of potentialFTA funding for rail transit to airports. However, currentdemand for these New Starts funds greatly exceeds availableresources. As of spring 2000, of the approximately 190 pro-posed projects in the New Starts pipeline that are candidatesfor FTA funding, nearly 30 feature a potential fixed guide-way connection to an airport.
The Research and Technology Program is divided into theMetropolitan Planning and State Planning and ResearchPrograms, both of which receive funds apportioned by astatutory formula to governors, who in turn allocate thesefunds to MPOs in urban areas or to state representatives inrural areas. The Rural Transit Assistance Program is the pro-gram in the Research and Technology Program responsible forall research transportation initiatives.
Two new (as of 1999) FTA funding programs are the JobAccess and Reverse Commute Program to provide transporta-tion services for welfare reform initiatives and the Clean FuelsFormula Program (part of the Formula Program) to assist withair quality improvement and pollution prevention.
Information on FTA funding sources can be found online(www.fta.gov/).
Federal Credit Assistance
The Transportation Infrastructure Finance and InnovationAct (TIFIA), created as part of TEA-21, established a directfederal credit program. TIFIA authorizes the U.S. DOT to pro-vide direct loans, standby lines of credit, and loan guaranteesto public and private sponsors of large surface transportationprojects that meet certain eligibility criteria. Project sponsors
of highway, mass transit, passenger rail, and intermodal facil-ities must submit an application to U.S. DOT for approval offunding assistance. TIFIA funding is limited and projects areselected on a competitive basis. U.S. DOT has established aSteering Committee and Working Group composed of repre-sentatives from the Office of the Secretary of Transportation,FHWA, FTA, U.S. DOT, and other agencies to coordinatethe program. Coordination includes evaluating applications,selecting projects, obligating funds, and negotiating creditarrangements.
The program authorizes funds to be disbursed in the formof loans, loan guarantees, and lines of credit. The budgetarycost to the federal government is based on the estimated pres-ent value of default losses associated with federal creditinstruments. For federal fiscal year 1999, TIFIA provided forapproximately $80 million to fund the subsidy costs associ-ated with a total of $1.6 billion of direct loans, loan guaran-tees, and lines of credit. The assistance is provided to eitherpublic or private sponsors, but the projects must be “ofnational significance.” A credit rating or preliminary opinionletter from a rating agency indicating that the project’s seniordebt obligations have the potential of being investment gradeis required with an application. Eligibility and other infor-mation about these and other funding categories can be foundin the FHWA’s Guide to Federal-Aid Programs and Proj-ects (online at www.fhwa.dot.gov/infrastructure/progadmin/covert21.htm).
To be eligible to receive TIFIA credit assistance, a projectmust meet the following five criteria:
1. The project must be included in a state transportationplan; before an agreement is made for federal creditassistance, the project must be in an approved STIP.
2. The entity undertaking the project must submit a proj-ect application to the U.S. Secretary of Transportation.
3. Eligible project costs must equal and exceed the lesserof $100 million or 50 percent of the amount of federal-aid highway funds apportioned to the states for the mostrecently completed fiscal year.
4. Project financing must be repayable in part or in wholefrom tolls, user fees, or other dedicated revenue sources.
5. If the project is not undertaken by a state or local gov-ernment or an agency or instrumentality of a state orlocal government, the project must be included in boththe state transportation plan and an approved STIP.
More information about TIFIA eligibility and credit productscan be found on the TIFIA website (tifia.fhwa.dot.gov/tifia).
State-Based Credit Assistance Programs
All of the following programs are state-directed programsenabled through federal-aid funding. The best point of contactis the relevant state DOT.

136
State Infrastructure Bank (SIB) Program
The National Highway System Designation Act of 1995(popularly known as the NHS Act) enabled states to capital-ize transportation credit assistance banks modeled on waste-water State Revolving Loan Funds. The SIB program pro-vides loans, credit enhancement, and other forms of assistance(such as bond banks) to eligible surface transportation proj-ects. Thirty-nine states have participated in the NHS pilot.In TEA-21, Congress allowed only four states—Missouri,Florida, Rhode Island, and California—to use new TEA-21funding for capitalization. Since program implementation andcapitalization levels vary from state to state, the best sourceof information about SIB assistance is the relevant state DOT.Information about general SIB programs is available online(www.fhwa.dot.gov/innovativefinance/sib.htm).
Section 129 Loan (Formerly Section 1012 Loan)
The NHS Act codified a pilot program under the previousauthorization that permitted state DOTs to loan federal-aidhighway funds to projects with dedicated revenue sources.Projects must be eligible for surface transportation funding.Once repaid to the state DOT, funds can be used for any eligi-ble surface transportation project and do not have to follow fed-eral requirements. Guidance for this lending program is avail-able online (www.fhwa.dot.gov/innovativefinance/ifg.htm).
GARVEE Bonds and Transit GARVEEs
The NHS Act also permits federal-aid funds to be used fordebt-service and debt-issuance costs. This permits states toraise funds for current projects by issuing bonds backed byfuture federal-aid highway funds. At least four states haveissued highway bonds backed by future federal-aid fundingsince June 1998. More information about GARVEEs, includ-ing descriptions of past and current transactions, can be foundin FHWA’s Innovative Finance Quarterly (available online atwww.fhwa.dot.gov/innovative finance/ifpubs.htm).
Environmental Implications of Federal Fundingfor Airport Access Projects
Funding for airport access projects is subject to the provi-sions of both the National Environmental Policy Act (NEPA)and the Clean Air Act Amendments of 1990 (CAAA). NEPAis the basic national charter for the protection of the environ-ment and establishes policies, sets goals, and provides meansto carry out the policies. For certain types of federally fundedor federally permitted transportation projects, NEPA willrequire the preparation of an environmental impact state-
ment. Moreover, certain types of transportation projects willrequire the determination of air quality conformity pursuantto CAAA (ensuring that the proposed project will not impedeefforts to reduce air pollution in the metropolitan area).
For airport access projects, the responsibility for oversee-ing the environmental process may require the cooperationof FAA, FHWA, or FTA, or all three. The environmental pro-cess must be completed before federal funding can be used.In instances in which FHWA is the lead federal agency forNEPA compliance, it can delegate its NEPA responsibilitiesto the state.
AIRPORT– AIRLINE CONTRACTUALAGREEMENTS
Although federal statutes, regulations, and policies allowairport operators to use airport revenues for certain groundaccess projects, some airport operators have entered intoagreements with airlines that give the airlines the right toapprove or disapprove the use of airport revenue for capitalprojects. The reasons for entering into airline agreementsand the status of those agreements at certain major airportsare discussed below.
Framework for Airline Agreements
Most airport operators have entered into agreements withthe airlines serving their airports. Airport operators enter intoairline agreements for a variety of reasons:
• Capital investment programs. Airport operators devel-oping and financing major capital improvement programstypically prefer airline financial support and commitmentto relocate in order to improve the airport’s creditworthi-ness in the financial community. Improving airport credit-worthiness is one of the primary historical motivations forairline agreements.
• Airport hubbing and airline market share. Operatorsof airports served by major hubbing airlines that have highmarket share generally favor airline agreements becauseof (1) the more airline-specific nature of facility designand use and (2) the greater reliance on that airline’s pay-ments to cover airport operating expenses and pay debtservice on bonds. Airports that primarily serve origin anddestination passengers and at which more airlines providecompetitive service tend to be less dependent on airlineagreements.
• Market growth. Airports whose air transportation mar-kets exhibit strong growth tend to be less dependent onairline agreements than airports with flat or decliningmarket growth.
• Market type. Airports that serve air transportation mar-kets driven substantially by tourism or conference activ-

137
ities tend to be (1) more focused on business partnershipswith all supporting service providers, including airlines;and (2) more interested in airline agreements.
• Airline tenant stability. Airports with a significant por-tion of traffic served by financially healthy airlines tendto be less dependent on airline agreements than airportswhose primary air service is provided by financiallytroubled airlines.
• Facility availability. Airports with facilities that exceedcurrent demand tend to be more dependent on airlineagreements than airports with excess demand for facilities.
• New entrant potential. Airports that have potentialnew entrant airlines tend to avoid restrictive agreementsthat may limit the airports’ abilities to accommodatenew entrants.
• Airport economics. The more dependent an airport ison airline revenue as a percent of total revenue, thegreater the need for a structured relationship with theairlines. Airports with relatively high levels of nonair-line revenue (e.g., more than 60 percent of total revenue)and high levels of annual cash flow are less vulnerableto airline revenues.
• Political environment. The higher the actual or desiredpolitical involvement of local governments in the air-port, the more airport operators tend to prefer airlineagreements. The airline agreements insulate the airportagainst political micromanagement and minimize theairlines’ ability to use political mechanisms to affectdecisions regarding the airport.
• Historical airline relations. Airport operators whohave a history of more reasonable or cooperative rela-tions with airlines that serve the airport tend to supportfuture agreements; those airport operators with moredifficult historical relations tend to prefer not to enterinto future airline agreements.
• Federal policy. FAA’s Policy Regarding Airport Ratesand Charges is not generally applicable to rates andcharges established by agreement for those parties sig-natory to the agreement. An agreement provides insula-tion for the airport from complaints to FAA by signatoryairlines. However, nonsignatory airlines may registercomplaints with FAA. Airport operators and airlinescannot agree to use airport revenue in a manner that vio-lates FAA’s policy concerning the use of such revenue.
Although most recent airline agreements have shorter 5- or10-year terms, many airline agreements are long-term agree-ments lasting 20 or 30 years. Many of the factors that origi-nally caused a particular airport operator to enter into anagreement may change during the term of the agreement. Itis very difficult to terminate an agreement, however, becausethe very factors that may cause an airport operator to want toterminate the agreement may reinforce the signatory airlines’
desire to continue the agreement, so the signatory airlines arenot likely to vote to approve termination.
Status of Airline Agreements
Table 7-3 presents an inventory of airline agreements atselected large- and medium-hub airports. The table indicateswhether each airport has an airline agreement and the agree-ment’s date of expiration, if applicable.
In all cases in which an airline agreement is in place, theairlines have some control over airport capital investmentdecision making. The airlines typically do not favor signifi-cant investment in transit projects or even in certain roadwayprojects; instead, the airlines prefer that available cash flowbe invested in facilities the airlines use, such as terminal andairfield facilities, and prefer to keep debt service low to min-imize their cost per enplaned passenger.
In some cases, an MII of the signatory airlines must affir-matively approve investment in capital projects funded withbonds whose debt service affects the airline rate base and incapital projects funded with nondiscretionary cash flow. Thisis the case at Chicago-O’Hare, Dallas/Fort Worth, Seattle-Tacoma, Miami, and Minneapolis-St. Paul InternationalAirports and at Detroit Metropolitan (Wayne County) Airport.At San Francisco Airport, an affirmative MII vote isrequired, but a capital project can proceed without suchapproval after a 6-month deferral period.
In other cases, a capital project can proceed unless an MIIof the signatory airlines disapproves the project, such as atPhiladelphia Airport and the commercial service airports inHawaii.
At airports that have airline agreements and at those thatdo not, the airport operator must support investment in aground access project for it to proceed. Unlike the airlines,airport operators have a stake in reducing roadway and curbcongestion by managing existing facilities and investing inroadway and transit projects. However, ground access proj-ects compete with other airport capital projects for limitedavailable funding and may not always be among the airportoperator’s priorities.
Examples of Airport Operator Support for Airport Transit Projects
Examples of specific projects in which airport operators haveprovided financial support for transit projects are discussed inthe following paragraphs.
San Francisco International Airport
The San Francisco airport’s project (known locally as“BART SFO”) consists of construction of an extension of the

138
BART system from the station at Colma to a new station inMillbrae, with a spur to the airport. A new consolidated sta-tion will be constructed at the airport to serve both the on-airport people mover (Airtrain) and the BART spur. TheAirtrain is a closed-system people mover that will connectairport terminals, the consolidated rental car facility, andparking. The total cost of BART SFO, including the exten-sion and stations but excluding Airtrain, is $1.2 billion. TheBART SFO project is expected to be completed in 2002. Thecity of San Francisco will contribute up to $200 million tothe project, of which $113 million will be paid by the airlinesthrough airport rates and charges to fund the on-airport stationand guideway facilities. The city will contribute an additional$87 million from other airport funds that are not in the airlinerate base. The $87 million will fund BART’s on-airport oper-
ating systems, traction power, computers, and other equip-ment. FTA has committed $750 million in capital New Startsfunds for the BART SFO projects.
John F. Kennedy International Airport
The airport’s light rail system, called Airtrain, will connectall of the airport terminals with Jamaica Station and the air-port’s network of rail, subway, and bus lines, as well as withthe station at Howard Beach. The project is expected toreduce travel time to Manhattan by half an hour, comparedwith existing subway, bus, or private automobile travel times.Airtrain will also link the airport terminals with long-termparking and rental car areas. The total cost of this project is
Airport Airline Agreement Expiration Date
Boston-Logan International Airport No n.a.Hartsfield Atlanta International Airport No n.a.John Wayne Airport (Orange County, California) No n.a.Los Angeles International Airport No n.a.Phoenix Sky Harbor International Airport No n.a.
Miami International Airport Yes Month-to-monthMinneapolis-St. Paul International Airport Yes Month-to-month
Honolulu International Airport Expired & extended QuarterlyJohn F. Kennedy International Airport (a) Yes QuarterlyLaGuardia Airport (a) Yes Quarterly
Newark International Airport (a) Yes QuarterlyNew Orleans International Airport Yes December 31, 2004Portland International Airport (Oregon) Yes June 30, 2001Seattle-Tacoma International Airport Yes December 31, 2001San Diego International Airport (Lindbergh Field) Yes June 30, 2002Chicago Midway Airport Yes December 31, 2002McCarran International Airport (Las Vegas) Yes 2003
Philadelphia International Airport Yes June 30, 2006Orlando International Airport Yes October 2008Detroit Metropolitan Wayne County Airport Yes January 1, 2009Dallas/Fort Worth International Airport Yes September 30, 2009
San Francisco International Airport Yes June 30, 2011Fort Lauderdale-Hollywood International Airport Yes September 30, 2011Ronald Reagan Washington National Airport Yes September 30, 2014Pittsburgh International Airport Yes May 8, 2018
O’Hare International Airport (Chicago) Yes May 11, 2018Miami International Airport (b) Yes September 30, 2020Denver International Airport Yes
United Airlines February 28, 2025Other airlines 2000 – 2005
NOTES: n.a. = Not applicable.
(a) Mostly short-term leases, although some airlines have long-term leases. For example,Continental’s long-term lease at Newark International Airport expires in 2018, and some leases at Terminal 4 at JFK International Air Terminal expire in 2018.
(b) Agreement expires after completion of the “Program 70’s,” estimated to be September 30, 2020.
TABLE 7-3 Airline agreements at selected airports
SOURCE: Transit Cooperative Research Program, Transportation Research Board.
139
which will connect the airport with the existing 33-mi sys-tem; and (2) construction of the light rail station at the airportterminal. The $141.3 million light rail program costs will beshared by the Port of Portland ($43.0 million), the CascadeStation Development Company ($3.2 million), the city ofPortland ($31.6 million), and Tri-Met ($63.5 million) underthe 1998 Framework and Rail Financing Agreement. Theport is financing its $43-million share from PFC bond pro-ceeds and PFC pay-as-you-go revenue. The Port received aRecord of Decision from FAA approving the use of PFC rev-enues for the project in June 1999. The project is expected tobe completed in fall 2001.
estimated to be $1.5 billion, and the project is expected to becompleted by 2002. The Port Authority of New York andNew Jersey will provide $300 million for the project from itscapital funds, and $1.2 billion will be paid with PFC revenues.
Portland International Airport
The Portland airport’s project (known locally as the “Air-port MAX project”) involves construction of an extension ofthe light rail system to the airport. The project consists of twomajor elements: (1) construction of a terminal segment track,

140
CHAPTER 8
IMPLICATIONS FOR FURTHER RESEARCH
OVERVIEW
This report covers the first phase of the research programbeing undertaken for TCRP Project B-18, including workundertaken in 1999. Based on a decision by the TCRP Over-sight and Project Selection (TOPS) Committee in October1999, the program will be extended for a second phase. Forthis reason, this chapter will focus primarily on work con-tained in this report that impacts the formulation of a researchscope for the second phase of TCRP Project B-18. The sec-ond phase, designated Project B-18A, is entitled “ImprovingPublic Transportation Access to Large Airports: Phase II.”The results of the Phase II research will be published in theTCRP report series.
In the following sections, each chapter of the report is exam-ined in terms of areas in which the originally planned workwas completed, areas in which work was postponed, areas thatrequire further analysis, and areas in which ongoing progressshould be monitored to ensure that the final product for ProjectB-18A is accurate and up-to-date.
Implications of Chapter 1 for Further Research
Overview
Chapter 1, along with the Executive Summary, summarizesthe research results for the first phase of the project (ProjectB-18). The outline of the report clearly reveals the redirectionof emphasis taken by the project panel in June 1999. At thistime, a chapter not initially contemplated in the Working Planwas added at the direction of the panel: the new chapter, Chap-ter 5, examines the characteristics of successful fixed guide-way systems around the world and documents the attributes ofsuccessful services for the benefit of U.S. practitioners con-sidering fixed guideway investment. As a result of this reallo-cation of project resources, the chapter originally proposed inthe Working Plan that described improved management strate-gies for rubber-tired services was deferred to a later stage ofthe project.
Implications for Further Research
The examination of the management of innovative strate-gies for improving rubber-tired transportation services is a
key element in the overall research effort. Examples of issuesto be examined in the analysis of rubber-tired services are asfollows.
At the curb. What can be done to better manage for the con-sumer? What can the airport operator do to provide a higherpriority for the high-occupancy user? What are the tools forbetter curb management, such as AVI? What are the principlesfor the allocation of scarce curb space? What are the beststrategies to provide connecting mode information to the arriv-ing passenger?
Beyond the curb. How can airport operators coordinatewith regional HOV and high-occupancy toll (HOT) lanesprograms and strategies? Why are there so few examples ofHOV projects serving major airports? Lessons can be learnedfrom Seattle and New York and New Jersey.
Managing the supply of services. How do airports usefranchising options to improve service to the consumer?How did Sacramento and Los Angeles respond to the needfor competition and the need to balance demand with supplyfor a specific service?
Potential for new institutional relationships. What is theexperience of major U.S. airports in creating and encourag-ing new services where needed? What is the role of the air-port operator in setting standards for taxis, limousines, andother transportation services? What are the regulatory con-straints to new services? What happens when there is anoverlap between the taxi industry and other providers? Whatare the problems in the initiation of new services?
Implications of Chapter 2 for Further Research
Overview
Chapter 2 examined the airport ground access patterns of25 of the largest U.S. airports and described the key factorsaffecting airline-passenger use and airport-employee use ofpublic transportation access modes. The factors were deter-mined through (1) a review of service at U.S. and inter-national airports with rail service and (2) surveys of U.S. air-port operators. Two areas in which additional analysis seemsrequired are the orientation to the CBD and the role of em-

ployees as a market for public transportation services. Theproposed research concerning the geographic distribution oftrips (including the CBD) is described below in the reviewof the implications of Chapter 3.
Implications for Further Research
The survey undertaken for this project asked each airportto report on the availability of data concerning the geographicdistribution of trip ends and data concerning employee modeshares. The response to the survey revealed a lack of imme-diately available data in both of these important areas. Thequality of data concerning employee access patterns mayrequire a significant data-analysis effort. There is a clear needfor further examination of the challenge of improving publicmode share for employees. Such a research effort would haveto do the following.
Define the problem. Where do the airport employeeswork? Are their jobs located near the passenger terminalcomplex or in multiple remote locations of the airport? Someemployees working for airport-based companies may notwork on the airport. Where do the employees live? Are theyevenly dispersed around the metropolitan area or in clustersalong corridors adjacent to the airport?
Review the adequacy of data. Airport-based surveys ofemployees represent the most desirable source of data. But,in some cases, the U.S. Census Journey to Work Data maybe for use as a supplement that is appropriate for aggregateobservation. In other cases, local MPOs may have trip tablesthat present the airport as a single employment zone.
Undertake the analysis. The proposed research effort,subject to the availability of appropriate data sources, woulddocument existing distribution of origins and existing modeshares. The research should document present price conditionsfor employee transport options and should explore the impactof subsidized (or free) parking provided on the airport.
Examine alternative strategies for specialized employeeservices. Based on an understanding of the needs of employ-ees, this element of the work program would define candidatestrategies for specialized services. Issues of implementationwould be documented, including an analysis of methods ofcross subsidization among revenue sources.
Document the experience of U.S. airports with special-ized employee services. A small set of examples of success-ful specialized services for employee transportation would bedescribed and documented. Parallel programs in Europe,such as the FreeFlow Heathrow employee program, will bedocumented as relevant.
141
Implications of Chapter 3 for Further Research
Overview
Chapter 3 presented the reasons for a user-based marketresearch basis for ground access planning. In this approach,a variety of services is crafted to serve a variety of marketneeds. One of the most important determinants of an airport’sground access market is the geographic distribution of the air-line passengers and airport employees traveling to and fromthe airport. It is also important to know the classification of air-line passengers by market segment because airports will differin the proportional distribution of these market segments.
Implications for Further Research
Based on comments from members of the panel, the re-search team has concluded that the examination of the geo-graphic implications of the airport trip ends needs furtherdocumentation. Although the work program described in thisreport was often able to differentiate between CBD and non-CBD travel patterns in the existing data, further examinationof variations in the non-CBD trip ends is needed. Such a con-tinuation of the market research element of the project wouldexamine and document the following.
Airport trip-end densities associated with successfulfixed-route and scheduled services. This task would docu-ment the trip-end density associated with successful tradi-tional services, including both bus and rail. The quantifieddensity of CBD trips would be documented, as well as thecharacteristics of services to higher-density suburban subcen-ters. Examples of non-CBD high-density destinations, includ-ing universities, hospitals, and military installations, would bereviewed in terms of their propensity to support fixed-routeand scheduled services from major airports.
Airport trip-end densities associated with flexibly routeddoor-to-door services. The demographics of areas in whichdoor-to-door services have succeeded in creating highervehicle occupancy will be documented, including both theland-use characteristics and density of airport-oriented trips.The role of door-to-door services in high-density areas thatare often in competition with fixed-route and scheduled ser-vices will be documented. The characteristics of residentialpick-up services and the challenges of low vehicle occupan-cies in lower-density situations will be examined.
Airport trip-end densities associated with express modes.Areas characterized by low airport trip-end densities pose aparticular challenge to U.S. ground access planners. Fromthese areas, longer-distance modes usually do not operatedoor-to-door and rely on some form of collection service.This section would examine trends in longer-distance service

and would document strategies currently used by the privatesector to respond to lower-density origins.
Implications of Chapter 4 for Further Research
Overview
Chapter 4 examined 14 successful systems through obser-vations about four elements of the total service. The chapterreviewed the experience of the 14 successful airport accesssystems in terms of four key factors, which together influencethis cumulative experience. The international experiences doc-umented in Chapter 4 serve to underscore the idea that there isno monolithic market for public transportation that can beserved by a single modal solution. There are a series of sub-markets, each of which requires the creation of services de-signed to meet the needs of that market segment. From TokyoNarita Airport, the user has a choice of at least six differentprice levels from three separate rail operations. At London’sHeathrow Airport, high-priced express rail service has beenadded to the airport’s successful low-priced multistop rail ser-vice. At Paris’ Charles de Gaulle Airport, a new high-pricedexpress rail service to downtown will soon be offered in addi-tion to current inexpensive multistop rail service. Oslo Air-port offers low-priced multistop service, high-priced expressservice, and long-distance national service, all from the sameplatforms. The exceptional overall mode share to publictransportation from the Hong Kong International Airport wasaccomplished with a combination of high-priced express rail,low-priced multistop rail, and low-priced direct buses.
Implications for Further Research
The major conclusion from the examination of the most suc-cessful international systems serves to support the themes putforward above (concerning the implications of Chapter 3) thata successful strategy must provide a variety of services that aredesigned around the needs of identifiable submarkets. A majortheme in the study of European systems is the role of nationalmarkets or markets beyond the metropolitan area in which theairport is located. Although in many European systems thesemarkets are served by the existing national rail system, theproblem of capturing the exurban or rural trip maker parallelsdirectly the issue faced in the U.S. experience. It is anticipatedthat examples of the European experience of serving chal-lenging markets outside of the immediate metropolitan areacan be incorporated into the market research described abovefor Chapter 3.
Implications of Chapter 5 for Further Research
Overview
Chapter 5 examined the attributes achieved in the imple-mentation of the successful system that can be of use to the
142
U.S. practitioner considering the development of systemswith both rail and bus services. The chapter shows that theability of the systems to carry the customer (and his or herbaggage) from door-to-door as compared with the private-vehicle alternative determines the market response to the ser-vice offered. The quality of the line-haul segment (be it railor bus) must be considered in combination with the difficultyof getting to that vehicle and from that vehicle. In rare exam-ples from Oslo and Hong Kong, designers were able todesign the airport, rail line, distribution services, and bag-gage strategies as one integrated system. The actual methodby which these attributes can be achieved in the U.S. experi-ence may be different from the strategies used in Europe andAsia.
Implications for Further Research
Chapter 5 reviewed a series of characteristics of the suc-cessful systems and identified strategies from around the worldthat deal with key design and operational issues. These issues,such as integrated facility designs and baggage-handlingmechanisms, were summarized in the chapter. Because of therapidly developing attention to these issues in the UnitedStates, design and operating strategies are now being devel-oped at a significant rate. To complete the examination ofdesign and operational strategies that support advanced airportaccess systems, the U.S. experience should be documented inthe following areas.
Completed examples of integrated design at transfer facil-ities. Recent design and architectural experience at Washing-ton, D.C.’s Reagan National and at San Francisco’s airportshould be documented, as well as examples of integrated facil-ity design in airports such as Hartsfield Atlanta and Lambert-St. Louis.
Work in progress for intermodal transfer facilities.Design activity at airports in Newark, Miami, Seattle, NewYork (at JFK), and at other airports should be documented forinclusion in the examination of innovative strategies.
Examination of baggage-handling strategies. Recentlyimplemented check-in facilities at Hartsfield Atlanta and thoseunder consideration at Newark, JFK, and Miami Airportswould be documented.
Baggage strategies for specialized bus service. The U.S.experience with baggage handling associated with specializedbus services, including those services operated by airlines andby the cruise industry, should be documented.
Institutional constraints. The challenges associatedwith FAA security regulations, liability and lost-baggage con-cerns, and integration of schedules (e.g., connect times)should be documented.

Update data on new systems in operation. Recent expe-riences from the first 2 years of operation of advanced sys-tems should be documented for use by U.S. practitioners.Such a review could include examination of issues of cost,liability, and customer utilization.
Implications of Chapter 6 for Further Research
Overview
Chapter 6 examined certain advances in technology in thetransit and aviation industries that may affect the future of air-port ground access programs. The six areas in which the tech-nology of the transit industry combines with that of the avia-tion industry to improve the quality of airport ground accesswere (1) ATIS, (2) technology for ride matching, (3) emerg-ing bus technology, (4) emerging rail technology, (5) auto-mated people-mover technology, and (6) alternative strategiesfor off-site airport check-in.
Implications for Further Research
Several of the technologies discussed in Chapter 6 are cur-rently being advanced as part of both national and local pol-icy commitments. Information systems that will offer groundtransportation routes, schedules, and information are beingdeveloped and examined by such groups as the ATIS Com-mittee of ITS America. These information systems should bemonitored to ensure that the needs of airport ground accesssystems are considered in their development. The report forPhase II (Project B-18A) should provide updated descriptionsof recent activities in such areas as the following.
Metropolitan passenger information programs. Ongo-ing progress in metropolitan initiatives, such as the inter-modal passenger information system in the New York–NewJersey–Connecticut Model Development Initiative, shouldbe documented.
Multistate initiatives for passenger information. The pro-ject should provide updated information on the role of nationaland multistate initiatives, such as the I-95 Corridor Coalitionprogram to develop traveler information systems for provid-ing local public transportation information to long-distance airand rail travelers.
Private-sector role in airport ground transportation infor-mation. The role of the private sector in providing informa-tion and ticketing for ground access modes, such as Ride-
143
source.com. and totheairport.com, should be included in theanalysis.
International experience in intermodal passenger infor-mation. The implications of recent international experi-ences to provide multimodal traveler information for long-dis-tance travelers, such as through the EU Spirit of the EuropeanUnion, should be documented in the report.
Automating the check-in process. Progress in the imple-mentation of programs that could potentially improve the off-site airport check-in process, such as the implementation ofcommon-use terminal equipment (CUTE) technology and theuse of microchip-based smart cards, should be documented.
Implications of Chapter 7 for Further Research
Overview
Chapter 7 examined a series of recent changes in fundingsources available for airports and the administrative flexibilityinherent in certain airport financial management structures toaccommodate changes in priorities. The chapter provided anoverview of the key legal, financial, institutional, and jurisdic-tional factors affecting public transportation to airports. Threemajor areas of institutional determinants to financing airportaccess projects were reviewed: (1) federal funding and over-sight, specifically FAA policies related to the financial supportof airport ground transportation projects; (2) funding of sur-face transportation projects by FHWA and FTA and by thestates; and (3) contractual agreements between airport opera-tors and airlines that limit the use of airport funds. The chap-ter documented how FAA’s policies with regard to use of air-port revenue have recently changed to allow greater flexibilityin funding airport access projects.
Implications for Further Research
Over the past year, significant changes have been made inthe flexibility of several funding sources and in the guidanceprovided by FAA. Local managers should become aware ofthe programs described in this chapter. Given the extent ofchange that has occurred, the current need may be to widen theunderstanding of the new regulations, rather than to conductresearch into further regulatory change. The report on Phase IIshould present updated examples of how the new rules havebeen applied and include whatever updates and modificationsmay have taken place by the time of publication.

144
REFERENCES
1. Chicago Transit Authority, Planning Division. Orange LineTravel Survey, May 1994, and Midway Airport Ground TravelSurvey, January 1995.
2. Metropolitan Atlanta Rapid Transit Authority. Station surveys. 3. Metropolitan Atlanta Rapid Transit Authority, Division of Plan-
ning and Policy Development. 1990 Rail Passenger Study, p. 14. 4. Chicago Transit Authority, Strategic Planning Department.
O’Hare Airport Ground Travel Survey, June 1990.5. Massachusetts Port Authority and the Central Transportation
Planning Staff. 1997 Massport Survey, Boston. 6. Rickard, D. “Challenges in Developing an Airport Employee
Commute Program: Case Study of Boston Logan InternationalAirport.” Transportation Research Record 1506, TransportationResearch Board, National Research Council, Washington, D.C.(1995); pp. 70–81.
7. Charles River Associates. Logan International Airport GroundAccess Study, 1987.
8. Cuyahoga County (Ohio). Cleveland Hopkins Airport AccessStudy: Survey Results, U.S. DOT, Washington, D.C. (1970); and“Ridership Trends, Cleveland Transit System.” In Gosling, G., A. Kanafani, A. Bender, and V. Evmolpidis. Off Airport Pas-senger Terminals. UCB-ITS-RR-77-16. Institute of Transporta-tion Studies, University of California, Berkeley (1977).
9. Wilson, Hewitt & Associates. Philadelphia International AirportGround Transportation Passenger Survey, Interpretation ofSurvey Results, 1986.
10. Harvey, G. Ground Access to San Francisco International Air-port. San Francisco Airports Commission, Berkeley, CA(1988).
11. Pacific Transit Management. Analysis of Ground Transportationat San Francisco International Airport, May 1999.
12. Personal communication from the management of Baltimore-Washington International Airport, 1997.
13. Massachusetts Port Authority. Internal documents and personalcommunication from M. Richardson, Massport Ground Op-erations Manager, 1997.
14. Massachusetts Port Authority. Internal documents based on the1996 Logan Airport Ground Access Survey.
15. Charles River Associates, Logan International Airport GroundAccess Study, 1987; Massachusetts Port Authority, internaldocuments; and M. A. Coogan.
16. Personal communication from D. Ricard, Cambridge System-atics, 1997.
17. Harvey, G. Ground Access to San Francisco International Air-port. San Francisco Airports Commission, Berkeley, CA(1988). In 1988, a 23 percent mode share for Airporter use inMarin County in 1985 was reported.
18. Port Authority of New York and New Jersey. Airport AccessStudy, 1992, and Airport Access Study, New York, 1997.
19. Access to Denver International Airport: A Detailed Look atPassenger and Employee Travel to Denver’s New Airport in
1995 and 1996. Denver Regional Council of Governments,Denver, CO (1997).
20. Sources for employee data:– O’Hare Airport: Based on an estimate of 4,800 employee
boardings and 48,000 total workers.– Boston Logan Airport: Rickard, D. “Challenges in Developing
an Airport Employee Commute Program: Case Study ofBoston Logan International Airport.” Transportation ResearchRecord 1506, Transportation Research Board, NationalResearch Council, Washington, D.C. (1995); pp. 70–81.
– Newark, LaGuardia, and JFK Airports: Port Authority ofNew York and New Jersey. Surveys as cited in Airport Ac-cess Planing Guide. Phase I Draft, December 1995. Preparedfor the Federal Highway Administration and the FederalAviation Administration by BMI in association with LeighFisher and M. A. Coogan.
– Denver Airport: Access to Denver International Airport: ADetailed Look at Passenger and Employee Travel to Den-ver’s New Airport in 1995 and 1996. Denver Regional Coun-cil of Governments, Denver, CO (1997).
– Schiphol, Cologne, Frankfurt, Hamburg, and ManchesterAirports: Pearson, M., quoted in the International Air RailOrganisation Database. London: BAA Heathrow, HeathrowAirport Transportation Policy—Factfile. Internal document,1997.
21. Examples of such projects include TCRP Project B-08, Ef-fective Methods of Marketing Transit Services to Business (seealso TCRP Report 51); TCRP Project B-09, Market Segmenta-tion Strategies to Increase Transit Ridership (see also TCRPReport 36); and TCRP Project B-20, Enhancing the Visibilityand Image of Transit (see also TCRP Report 63).
22. Blakenship, A. B., and G. E. Breen. State of the Art of MarketResearch. American Marketing Association, Chicago, IL(1996), p. 121.
23. Massachusetts Port Authority. 1996 Logan International AirportAir Passenger Survey, Appendix B: Survey Methodology, p. B-2-3.
24. Blakenship, A. B., and G. E. Breen. State of the Art of MarketResearch. American Marketing Association, Chicago, IL (1996),pp. 168–169.
25. A complete description of market segmentation as it applies topublic transportation is provided in TCRP Report 36, “A Hand-book: Using Market Segmentation to Increase Transit Rider-ship,” Transportation Research Board, National ResearchCouncil, Washington, D.C. (1998). This handbook providesmany useful examples of market segmentation for public trans-portation across the United States.
26. Elmore-Yalch, R. TCRP Report 36, “A Handbook: Using Mar-ket Segmentation to Increase Transit Ridership,” TransportationResearch Board, National Research Council, Washington, D.C.(1998), p. 66.

145
27. Elmore-Yalch, R. TCRP Report 36, “A Handbook: Using Mar-ket Segmentation to Increase Transit Ridership,” TransportationResearch Board, National Research Council, Washington, D.C.(1998), p. 74.
28. Massachusetts Port Authority. Logan Airport Access SurveyReport, April 1984. Survey revised January, 1985, p. 25.
29. Massachusetts Port Authority. A Review of Logan Airport’sGround Transportation Alternatives—Report on QualitativeResearch, Massport, October 1984, p. 2.
30. Massachusetts Port Authority. A Review of Logan Airport’sGround Transportation Alternatives—Report on QualitativeResearch, pp. 5–9.
31. Massachusetts Port Authority. Final Report, Behavioral Re-search and Marketing Analysis for the Logan Airport GroundAccess Study, Massport, January 1987, p. 23.
32. Massachusetts Port Authority. Final Report, Behavioral Re-search and Marketing Analysis for the Logan Airport GroundAccess Study, Massport, January 1987, p. 29.
33. Massachusetts Port Authority for the Massachusetts ExecutiveOffice of Transportation & Construction. Feasibility Study:Expansion of the Logan Express Remote Bus System to LoganAirport, June 30, 1994, p. 18.
34. Soo, E. “Determining Passenger Demands and Customer Ser-vice Requirements.” Paper presented at the Air Rail East WestConference, Hong Kong, 1998.
35. Pavaux, J. Rail/Air Complimentarity in Europe: The Impact ofHigh Speed Train Services. Institute of Air Transport, Paris(1991).
36. Bolland, S., P. Ndoh, and N. Ashford. An Investigation of GroundAccess Mode Choice for Departing Passengers. Department ofTransport Technology, Loughborough University of Technology,Loughborough, UK (1992).
37. Bayman, R. “Positioning Commuter Rail Services to ServeAirports: Who Needs the Metro?” Paper presented at the AirRail East West Conference, Hong Kong, 1998.
38. Harding, B. “Heathrow Express—the First Three Months.” Paperpresented at the Air Rail 98 Conference, Frankfurt, Germany,1998.
39. Zurich Airport. Untersuchung des Landseitigen Verkehrs,Herbst 1989. Zurich, Switzerland.
40. Civil Aviation Authority. CAP 677, Passengers at Birmingham,Gatwick, Heathrow, London City, Luton, Manchester, andStanstead Airports in 1996. London, November 1997.
41. International Air Rail Organisation. Air Rail Express. IARO,London, 1999.
42. International Air Rail Organisation. Air Rail Express. IARO,London, 1999.
43. Noble, R., and the Mass Transit Railway Corporation. “HongKong’s Airport Express: Lessons from the First Two MonthsOperations,” Paper presented at the Air Rail 98 Conference,Frankfurt, Germany, 1998.
44. Noble, R., and the Mass Transit Railway Corporation. “HongKong’s Airport Express: Lessons from the First Two MonthsOperations,” Paper presented at the Air Rail 98 Conference,Frankfurt, Germany, 1998.
45. Pavaux, J. Rail/Air Complimentarity in Europe: The Impact ofHigh Speed Train Services. Institute of Air Transport, Paris(1991).
46. We Are Linking the Øresund Region Together: A Fixed Link tothe Future: Trains and Buses in an Integrated Public TransportNetwork with a Single Tariff and Ticket System. Danish StateRailways, Statens Järnvägar, and Hovedstadens Trafikselkab,Copenhagen, 1997.
47. We Are Linking the Øresund Region Together: A Fixed Link tothe Future: Trains and Buses in an Integrated Public TransportNetwork with a Single Tariff and Ticket System. Danish StateRailways, Statens Järnvägar, and Hovedstadens Trafikselkab,Copenhagen, 1997.
48. Pavaux, J. Rail/Air Complimentarity in Europe: The Impact ofHigh Speed Train Services. Institute of Air Transport, Paris(1991).
49. Pavaux, J. Rail/Air Complimentarity in Europe: The Impact ofHigh Speed Train Services. Institute of Air Transport, Paris(1991).
50. Personal communication from G. Lee, Mass Transit RailwayCorporation, Hong Kong, 1999.
51. Scholch, M. “Intermodality at Frankfurt Airport.” In Proceedingsof the Air/Rail Conference, Frankfurt, Germany, 1998.
52. Smart Trek website (www.smarttrek.org). 53. Giuliano, G., R. Hall, and J. Golob. Los Angeles Smart Traveler
Field Operational Test Evaluation. California PATH ResearchReport, UCB-ITS-PRR-95-41. University of Southern California,Berkeley (1995).
54. Gosling, G., and S. Lau. Evaluation of a California Demon-stration of an Automated Airport Ground Transportation In-formation System. Research Report UCB-ITS-RR-95-3. In-stitute of Transportation Studies, University of California,Berkeley (1995).
55. Crain & Associates and Multisystems for the National Transit In-stitute. “Reinventing Transit Using Information Technology.”Seminar at Rutgers, the State University of New Jersey, 1998.
56. Crain & Associates and Multisystems for the National Transit In-stitute. “Reinventing Transit Using Information Technology.”Seminar at Rutgers, the State University of New Jersey, 1998.
57. Crain & Associates and Multisystems for the National Transit In-stitute. “Reinventing Transit Using Information Technology.”Seminar at Rutgers, the State University of New Jersey, 1998.
58. Personal communication from PLANit, Sweden, AB. Interviewsundertaken in Gothenburg, Sweden, 1998.
59. Volpe National Transportation Systems Center. Bus Rapid Tran-sit Demonstration Program. Federal Transit Administration,Washington, D.C. (1998).
60. Port Authority of Allegheny County in association with Penn-sylvania Department of Transportation. Phase 1 AirportBusway/Wabash HOV Facility in Allegheny County, Pennsyl-vania: Final Environmental Impact Statement. Federal TransitAdministration, Washington, D.C. (1994).
61. Airports Council International-North America. 1997 GeneralSurvey.
62. Federal Aviation Administration. Policy Regarding AirportRates and Charges. Vol. 61, No. 121. U.S. Department ofTransportation, Washington, D.C. (1996).

GLOSSARY
ABBREVIATIONS AND ACRONYMS
AAIA Airport and Airway Improvement Act of 1982ADA Americans with Disabilities ActAIP Airport Improvement ProgramAPTA American Public Transportation AssociationATIS Advanced Traveler Information SystemAVI automated vehicle identificationBAA British Airports Authority (formerly)BART Bay Area Rapid Transit (San Francisco)BTS Bureau of Transportation StatisticsCAAA Clean Air Act Amendments of 1990Caltrans California Department of TransportationCBD central business districtCMAQ Congestion Mitigation and Air Quality
Improvement ProgramCRS computer reservation systemCTA Chicago Transit AuthorityCTPS Central Transportation Planning Staff
(Chicago CTA)currency DKr Danish kroner
DM German deutschemarkF French francFr Swiss francFR Belgian francG Dutch guilderHK $ Hong Kong dollar£ British poundNkr Norwegian kronerSkr Swedish kronaUS $ United States dollar¥ Japanese yen
CUTE common-use terminal equipmentDeutsche
Bahn German Federal RailroadDOT department of transportationEPA Environmental Protection AgencyERL Express Rail Link (Kuala Lumpur)FAA Federal Aviation AdministrationFEIS final environmental impact statementFHWA Federal Highway AdministrationFTA Federal Transit AdministrationGARBs general airport revenue bondsGDS global distribution systemGPS global positioning systemHOT high-occupancy tollHOV high-occupancy vehicle
146
IARO International Air Rail OrganisationIATA International Air Transport AssociationICE InterCity Express (Frankfurt)ISTEA Intermodal Surface Transportation Efficiency
Act of 1991ITS intelligent transportation systemsLAWA Los Angeles World Airportsmaglev magnetic levitationMARC Maryland Rail Commuter serviceMARTA Metropolitan Atlanta Rapid Transit AuthorityMassport Massachusetts Port AuthorityMBTA Massachusetts Bay Transportation AuthorityMDI Model Deployment InitiativeMII Majority-in-Interest provisionMPO metropolitan planning organizationMTRC Mass Transit Railway Corporation (Hong Kong)MVV Munich Transport AllianceNEPA National Environmental Policy ActNHS National Highway SystemNTSB National Transportation Safety BoardOAG Official Airline GuideOSHA Occupational Safety and Health AdministrationOVR the Netherland’s transit itinerary trip planning
systemPFC passenger facility chargePTRC Planning and Transport Research and Compu-
tation International AssociationRATP Paris’ local public transit operatorRER electrified suburban rail network (Paris)RTD Regional Transportation District (Denver)SAMPO System for Advanced Public Transport
OperationsSAS Scandinavian Airlines SystemSCAG Southern California Association
of GovernmentsSIB State Infrastructure BankSNCF French National RailwaysSTIP State Transportation Improvement ProgramSTP Surface Transportation ProgramTCRP Transit Cooperative Research Program (TRB)TEA-21 Transportation Equity Act for the 21st CenturyTIFIA Transportation Infrastructure Finance
and Innovation ActTIP Transportation Improvement ProgramTOPS TCRP Oversight and Project Selection
(TRB committee)TRB Transportation Research Board

Tri-Met Tri-County Metropolitan Transportation District of Oregon
U.S.DOT United States Department of TransportationWMATA Washington Metropolitan Area Transit
Authority
AIRPORTS CITED
Asia and the Pacific Rim
Hong KongHong Kong International Airport
JapanKansai International Airport, OsakaNew Tokyo International Airport Narita (Tokyo Narita)Tokyo International Airport Haneda
MalaysiaKuala Lumpur International Airport
Europe
BelgiumBrussels International Airport
DenmarkCopenhagen Airport
FranceCharles de Gaulle Airport, ParisParis Orly Airport (Orly)
GermanyBerlin Bradenburg International AirportDüsseldorf International AirportFrankfurt International AirportHamburg AirportCologne/Bonn International Airport, CologneLeipzig/Halle AirportMunich Franz Josef Strauss Airport (Munich)Schonefeld Airport, Berlin
ItalyMalpensa Airport (Milan)
the NetherlandsSchiphol Airport, Amsterdam
NorwayOslo Airport, Gardermoen
SwedenArlanda Airport, Stockholm
147
SwitzerlandGeneva International Airport, CointrinZurich Airport
United KingdomHeathrow Airport, LondonLondon Gatwick Airport (Gatwick)London Luton Airport (Luton)London Stansted Airport (Stansted)Manchester Airport
United States and U.S. Territories
ArizonaPhoenix Sky Harbor International Airport
CaliforniaBurbank-Glendale-Pasadena AirportJohn Wayne Airport, Orange CountyLos Angeles International AirportMetropolitan Oakland International Airport (Oakland)Sacramento International AirportSan Diego International AirportSan Francisco International AirportSan Jose International Airport
ColoradoDenver International Airport
FloridaFt. Lauderdale-Hollywood International AirportMiami International AirportOrlando International AirportTampa International Airport
GeorgiaWilliam B. Hartsfield Atlanta International Airport
(Hartsfield Atlanta)
HawaiiHonolulu International Airport
IllinoisChicago Midway Airport (Midway)Chicago-O’Hare International Airport (O’Hare)
IndianaIndianapolis International Airport
LouisianaNew Orleans International Airport
MarylandBaltimore-Washington International Airport

MassachusettsBoston General Edward Lawrence Logan International
Airport (Boston-Logan)
MichiganDetroit Metropolitan (Wayne County) Airport, Detroit
MinnesotaMinneapolis-St. Paul International Airport
MissouriLambert-St. Louis International Airport
NevadaLas Vegas McCarran International Airport
New JerseyNewark International Airport
New YorkJohn F. Kennedy International Airport, New York City
(JFK)New York LaGuardia Airport, New York City
(LaGuardia)
North CarolinaRaleigh-Durham International Airport
148
OhioCleveland Hopkins International Airport
OregonPortland International Airport
PennsylvaniaLehigh Valley International Airport, AllentownPhiladelphia International AirportPittsburgh International Airport
Puerto RicoLuis Munoz Marin International Airport, San Juan
TexasBush Intercontinental Airport /HoustonDallas/Fort Worth International Airport (Dallas/Fort Worth)Dallas Love Field
UtahSalt Lake City International Airport
WashingtonSeattle-Tacoma International Airport
Washington, D.C.Ronald Reagan Washington National Airport
(Reagan National)Washington Dulles International Airport (Dulles)