keisuke sadamori director of energy markets and …eneken.ieej.or.jp/data/6326.pdf · keisuke...
TRANSCRIPT
© OECD/IEA 2015 © OECD/IEA 2015
Keisuke Sadamori Director of Energy Markets and Security, IEA
The 88th IEEJ Energy Seminar, 5th October 2015
IEEJ: October 2015, All Rights Reserved.
© OECD/IEA 2015
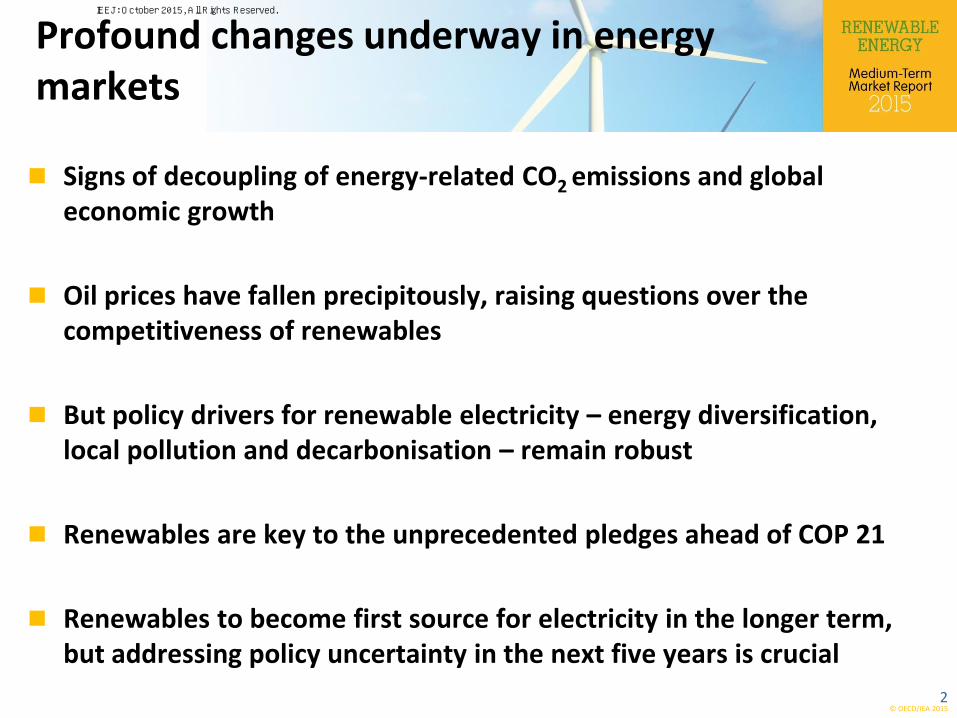
Profound changes underway in energy markets
Signs of decoupling of energy-related CO2 emissions and global economic growth
Oil prices have fallen precipitously, raising questions over the competitiveness of renewables
But policy drivers for renewable electricity – energy diversification, local pollution and decarbonisation – remain robust
Renewables are key to the unprecedented pledges ahead of COP 21
Renewables to become first source for electricity in the longer term, but addressing policy uncertainty in the next five years is crucial
2
IEEJ: October 2015, All Rights Reserved.
© OECD/IEA 2015
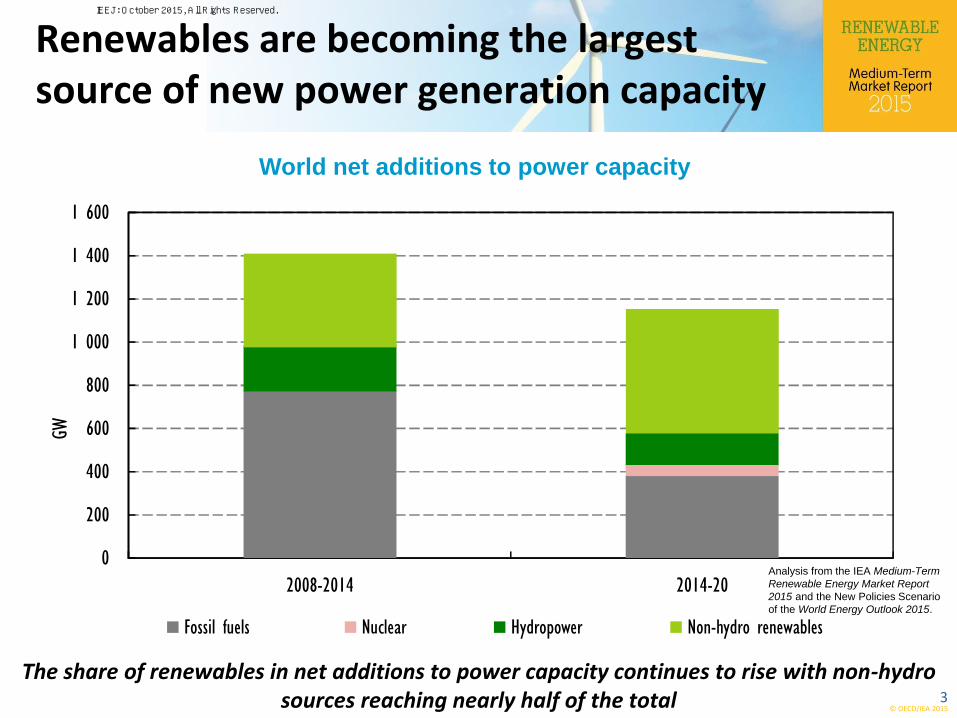
The share of renewables in net additions to power capacity continues to rise with non-hydro sources reaching nearly half of the total
Renewables are becoming the largest source of new power generation capacity
World net additions to power capacity
Analysis from the IEA Medium-Term
Renewable Energy Market Report
2015 and the New Policies Scenario
of the World Energy Outlook 2015.
0
200
400
600
800
1 000
1 200
1 400
1 600
2008-2014 2014-20
GW
Fossil fuels Nuclear Hydropower Non-hydro renewables
3
IEEJ: October 2015, All Rights Reserved.
© OECD/IEA 2015
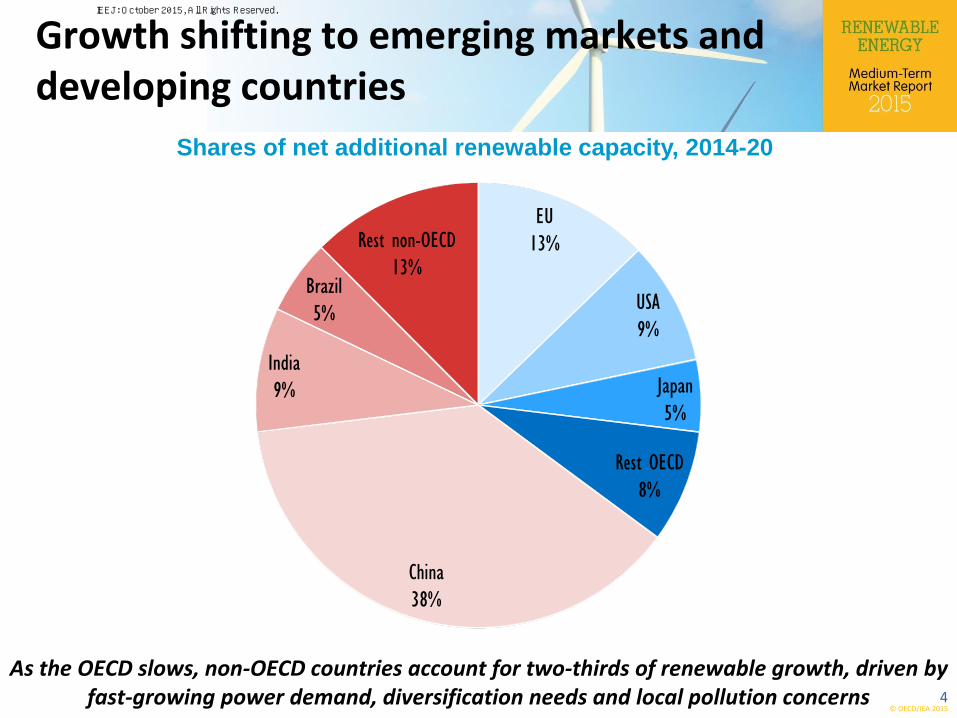
As the OECD slows, non-OECD countries account for two-thirds of renewable growth, driven by fast-growing power demand, diversification needs and local pollution concerns
Growth shifting to emerging markets and developing countries
Shares of net additional renewable capacity, 2014-20
EU
13%
USA
9%
Japan
5%
Rest OECD
8%
China
38%
India
9%
Brazil
5%
Rest non - OECD
13%
4
IEEJ: October 2015, All Rights Reserved.
© OECD/IEA 2015
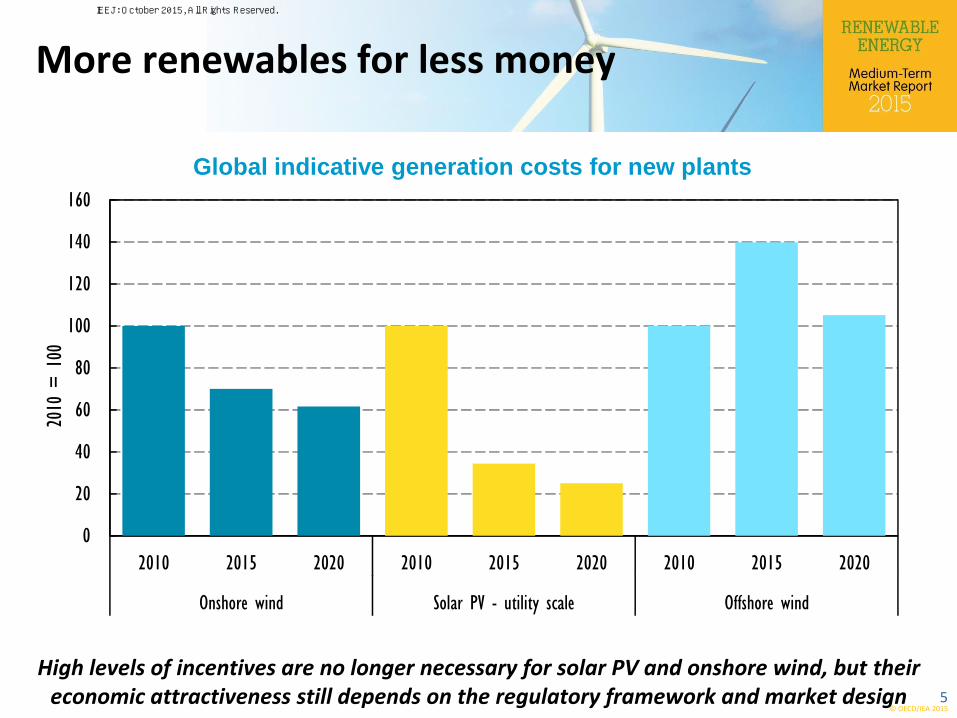
More renewables for less money
High levels of incentives are no longer necessary for solar PV and onshore wind, but their economic attractiveness still depends on the regulatory framework and market design
Global indicative generation costs for new plants
0
20
40
60
80
100
120
140
160
2010 2015 2020 2010 2015 2020 2010 2015 2020
Onshore wind Solar PV - utility scale Offshore wind
2010
= 1
00
5
IEEJ: October 2015, All Rights Reserved.
© OECD/IEA 2015
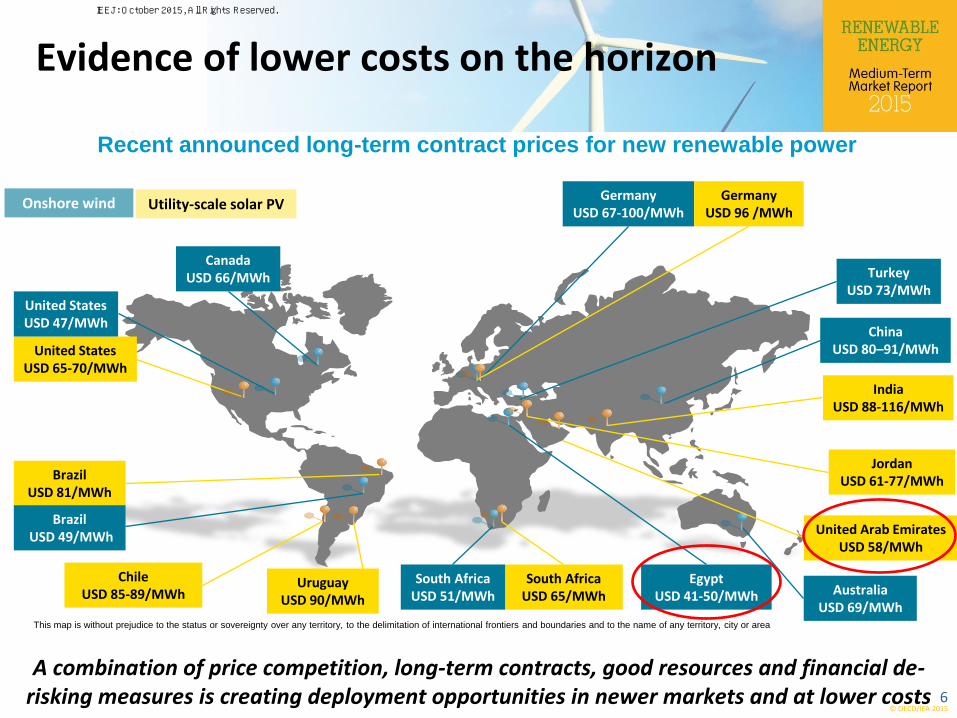
Evidence of lower costs on the horizon
A combination of price competition, long-term contracts, good resources and financial de-risking measures is creating deployment opportunities in newer markets and at lower costs
Recent announced long-term contract prices for new renewable power
Utility-scale solar PV Onshore wind
Chile USD 85-89/MWh
Brazil USD 81/MWh
United States USD 65-70/MWh
India USD 88-116/MWh
United Arab Emirates USD 58/MWh
South Africa USD 65/MWh
United States USD 47/MWh
Brazil USD 49/MWh
South Africa USD 51/MWh Australia
USD 69/MWh
Turkey USD 73/MWh
China USD 80–91/MWh
Germany USD 67-100/MWh
Egypt USD 41-50/MWh
Jordan USD 61-77/MWh
Uruguay USD 90/MWh
Germany USD 96 /MWh
Canada USD 66/MWh
This map is without prejudice to the status or sovereignty over any territory, to the delimitation of international frontiers and boundaries and to the name of any territory, city or area
6
IEEJ: October 2015, All Rights Reserved.
© OECD/IEA 2015
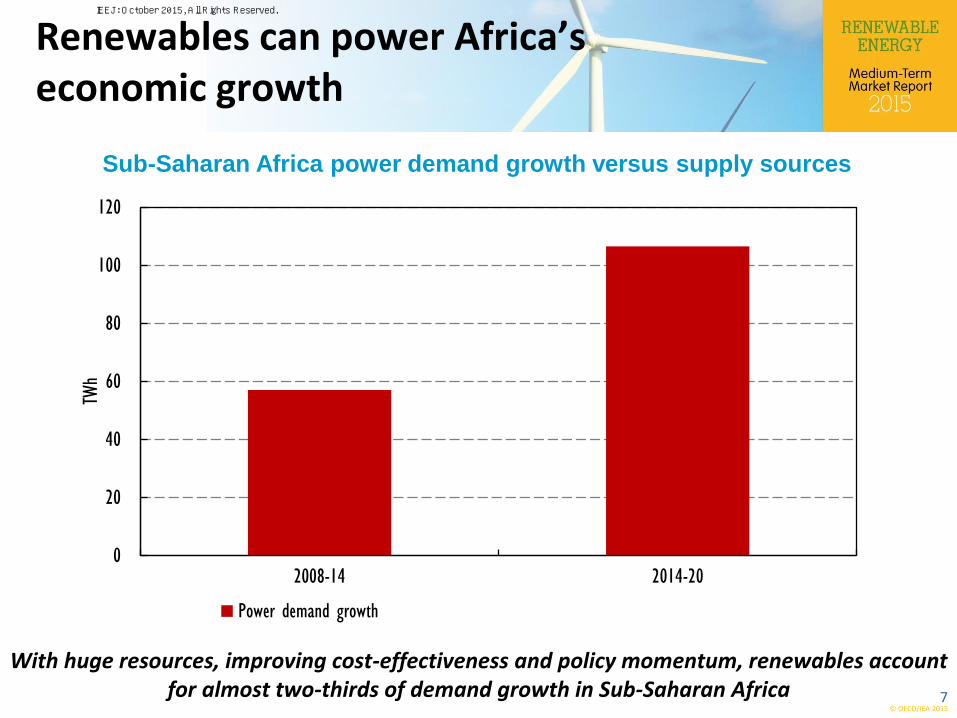
Renewables can power Africa’s economic growth
With huge resources, improving cost-effectiveness and policy momentum, renewables account for almost two-thirds of demand growth in Sub-Saharan Africa
Sub-Saharan Africa power demand growth versus supply sources
0
20
40
60
80
100
120
2008-14 2014-20
TWh
Power demand growth
7
IEEJ: October 2015, All Rights Reserved.
© OECD/IEA 2015
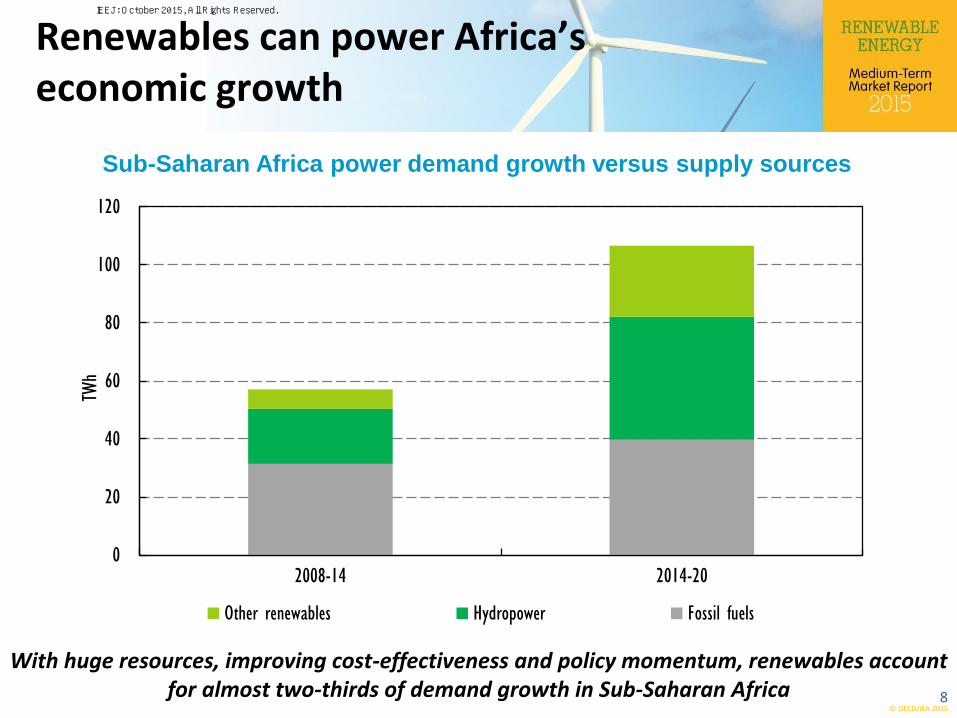
Renewables can power Africa’s economic growth
With huge resources, improving cost-effectiveness and policy momentum, renewables account for almost two-thirds of demand growth in Sub-Saharan Africa
Sub-Saharan Africa power demand growth versus supply sources
0
20
40
60
80
100
120
2008-14 2014-20
TWh
Other renewables Hydropower Fossil fuels
8
IEEJ: October 2015, All Rights Reserved.
© OECD/IEA 2015
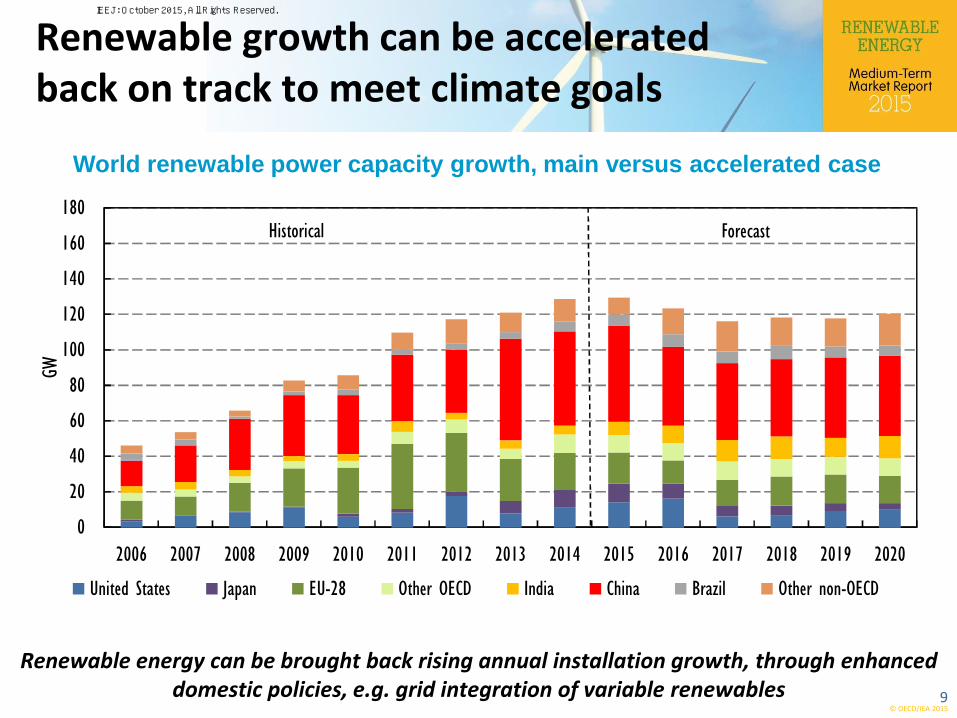
Renewable growth can be accelerated back on track to meet climate goals
Renewable energy can be brought back rising annual installation growth, through enhanced domestic policies, e.g. grid integration of variable renewables
World renewable power capacity growth, main versus accelerated case
0
20
40
60
80
100
120
140
160
180
2006 2007 2008 2009 2010 2011 2012 2013 2014 2015 2016 2017 2018 2019 2020
GW
United States Japan EU-28 Other OECD India China Brazil Other non-OECD
Historical Forecast
9
IEEJ: October 2015, All Rights Reserved.
© OECD/IEA 2015
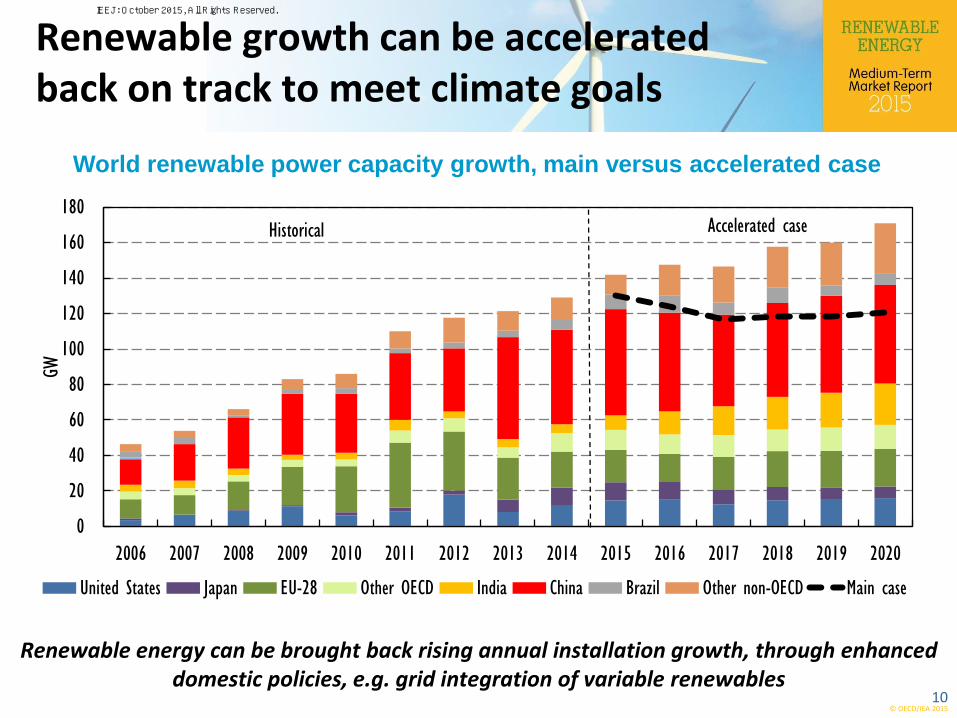
Renewable growth can be accelerated back on track to meet climate goals
Renewable energy can be brought back rising annual installation growth, through enhanced domestic policies, e.g. grid integration of variable renewables
World renewable power capacity growth, main versus accelerated case
0
20
40
60
80
100
120
140
160
180
2006 2007 2008 2009 2010 2011 2012 2013 2014 2015 2016 2017 2018 2019 2020
GW
United States Japan EU-28 Other OECD India China Brazil Other non-OECD Main case
Historical Accelerated case
10
IEEJ: October 2015, All Rights Reserved.
© OECD/IEA 2015
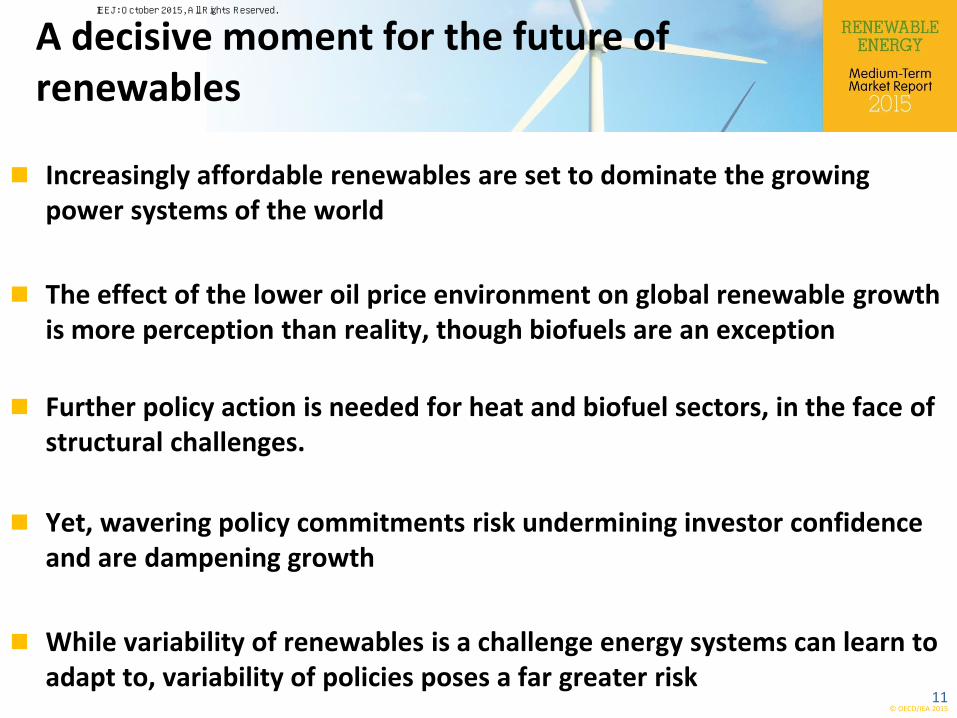
A decisive moment for the future of renewables
11
Increasingly affordable renewables are set to dominate the growing power systems of the world
The effect of the lower oil price environment on global renewable growth is more perception than reality, though biofuels are an exception
Further policy action is needed for heat and biofuel sectors, in the face of structural challenges.
Yet, wavering policy commitments risk undermining investor confidence and are dampening growth
While variability of renewables is a challenge energy systems can learn to adapt to, variability of policies poses a far greater risk
IEEJ: October 2015, All Rights Reserved.
© OECD/IEA 2015
Global Renewable Technologies
12
IEEJ: October 2015, All Rights Reserved.
© OECD/IEA 2015
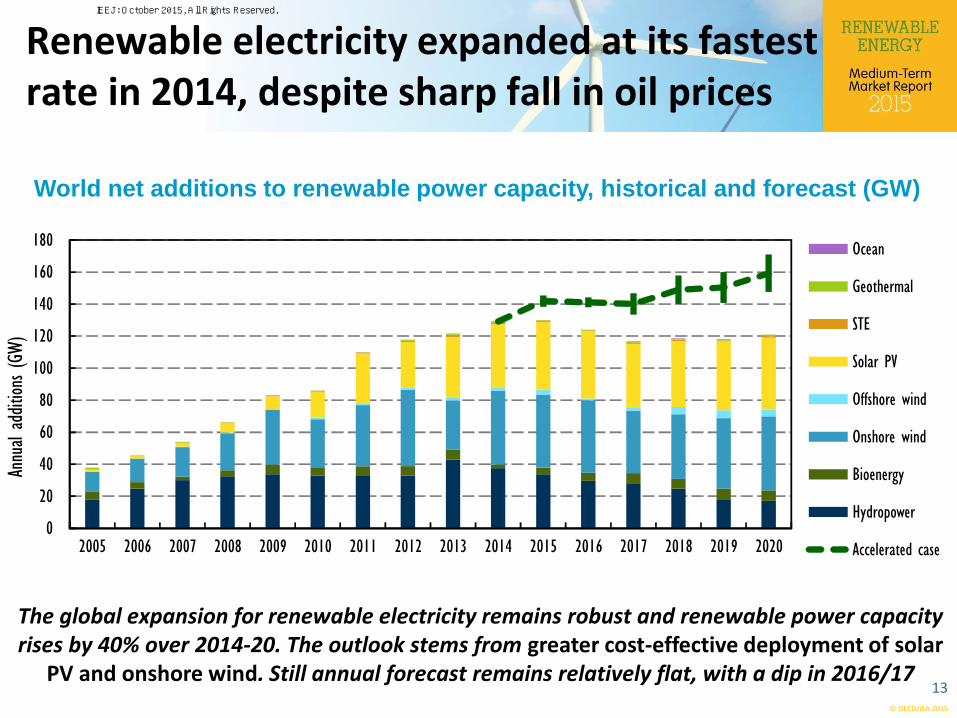
Renewable electricity expanded at its fastest rate in 2014, despite sharp fall in oil prices
World net additions to renewable power capacity, historical and forecast (GW)
The global expansion for renewable electricity remains robust and renewable power capacity rises by 40% over 2014-20. The outlook stems from greater cost-effective deployment of solar
PV and onshore wind. Still annual forecast remains relatively flat, with a dip in 2016/17 13
0
20
40
60
80
100
120
140
160
180
2005 2006 2007 2008 2009 2010 2011 2012 2013 2014 2015 2016 2017 2018 2019 2020
Annu
al a
ddition
s (GW)
Ocean
Geothermal
STE
Solar PV
Offshore wind
Onshore wind
Bioenergy
Hydropower
Accelerated case
IEEJ: October 2015, All Rights Reserved.
© OECD/IEA 2015
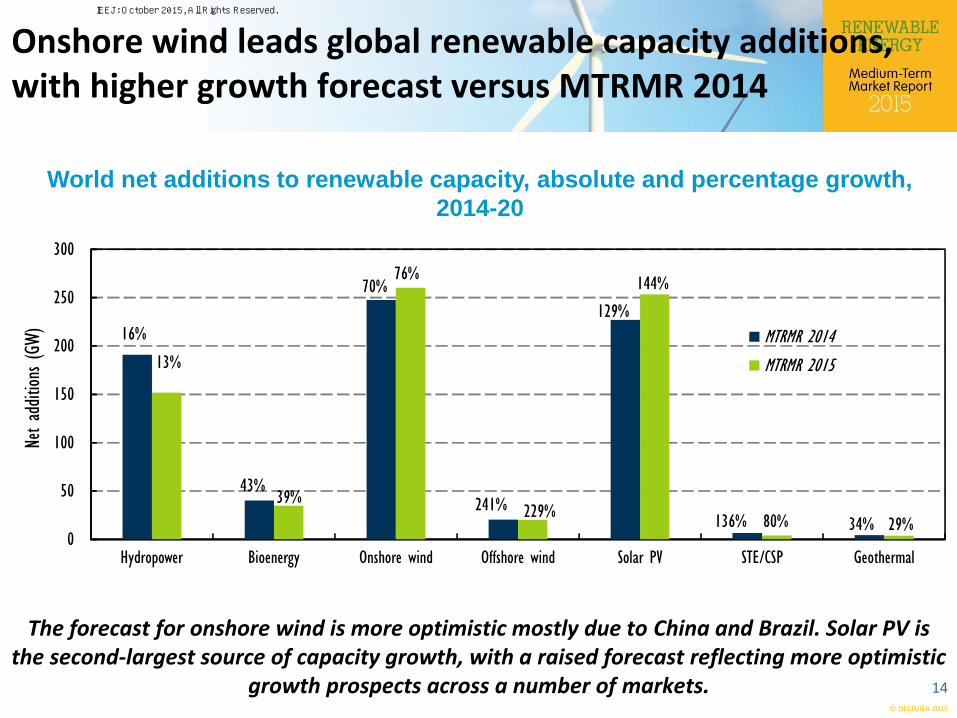
Onshore wind leads global renewable capacity additions, with higher growth forecast versus MTRMR 2014
World net additions to renewable capacity, absolute and percentage growth,
2014-20
The forecast for onshore wind is more optimistic mostly due to China and Brazil. Solar PV is the second-largest source of capacity growth, with a raised forecast reflecting more optimistic
growth prospects across a number of markets. 14
0
50
100
150
200
250
300
Hydropower Bioenergy Onshore wind Offshore wind Solar PV STE/CSP Geothermal
Net ad
ditio
ns (GW
) 16%
43%
70%
241%
129%
136% 34%
MTRMR 2014
13%
39%
76%
229%
144%
80% 29%
MTRMR 2015
IEEJ: October 2015, All Rights Reserved.
© OECD/IEA 2015
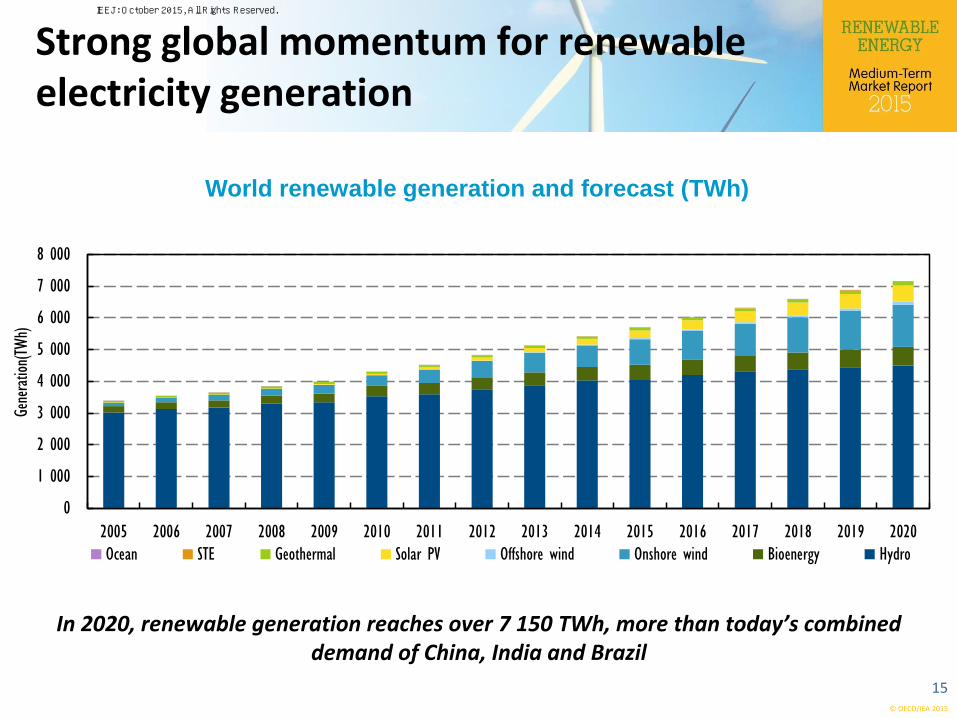
Strong global momentum for renewable electricity generation
0
1 000
2 000
3 000
4 000
5 000
6 000
7 000
8 000
2005 2006 2007 2008 2009 2010 2011 2012 2013 2014 2015 2016 2017 2018 2019 2020
Generatio
n(TW
h)
Ocean STE Geothermal Solar PV Offshore wind Onshore wind Bioenergy Hydro
World renewable generation and forecast (TWh)
In 2020, renewable generation reaches over 7 150 TWh, more than today’s combined demand of China, India and Brazil
15
IEEJ: October 2015, All Rights Reserved.
© OECD/IEA 2015
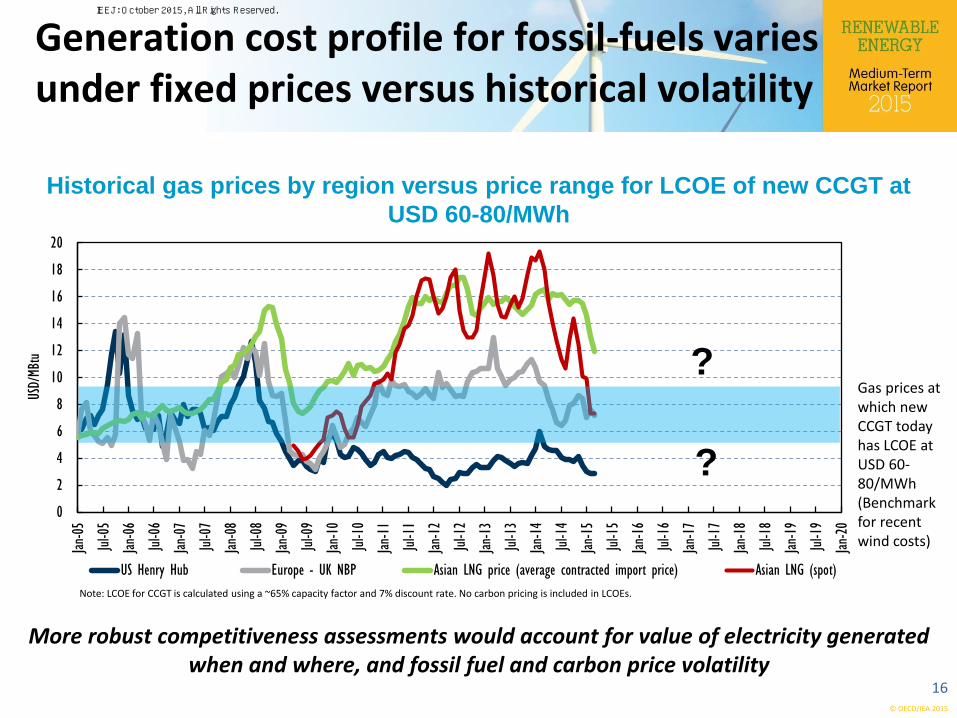
Note: LCOE for CCGT is calculated using a ~65% capacity factor and 7% discount rate. No carbon pricing is included in LCOEs.
0
2
4
6
8
10
12
14
16
18
20
Jan-05
Jul-0
5
Jan-06
Jul-0
6
Jan-07
Jul-0
7
Jan-08
Jul-0
8
Jan-09
Jul-0
9
Jan-10
Jul-1
0
Jan-11
Jul-1
1
Jan-12
Jul-1
2
Jan-13
Jul-1
3
Jan-14
Jul-1
4
Jan-15
Jul-1
5
Jan-16
Jul-1
6
Jan-17
Jul-1
7
Jan-18
Jul-1
8
Jan-19
Jul-1
9
Jan-20
USD/
MBtu
US Henry Hub Europe - UK NBP Asian LNG price (average contracted import price) Asian LNG (spot)
?
?
Generation cost profile for fossil-fuels varies under fixed prices versus historical volatility
Historical gas prices by region versus price range for LCOE of new CCGT at
USD 60-80/MWh
More robust competitiveness assessments would account for value of electricity generated when and where, and fossil fuel and carbon price volatility
16
Gas prices at which new CCGT today has LCOE at USD 60-80/MWh (Benchmark for recent wind costs)
IEEJ: October 2015, All Rights Reserved.
© OECD/IEA 2015
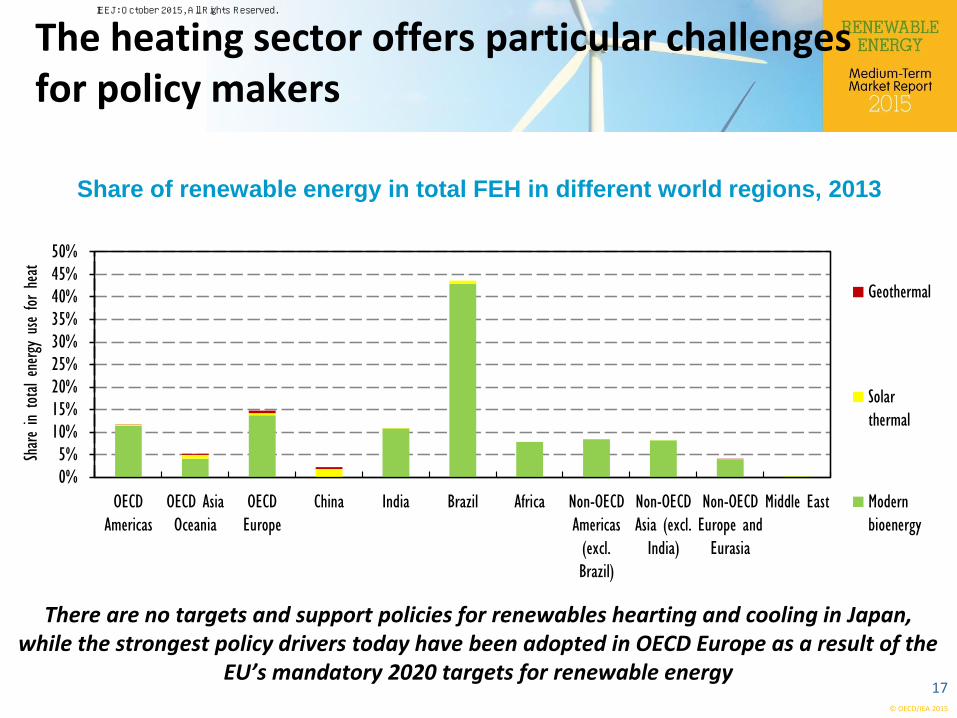
The heating sector offers particular challenges for policy makers
Share of renewable energy in total FEH in different world regions, 2013
There are no targets and support policies for renewables hearting and cooling in Japan, while the strongest policy drivers today have been adopted in OECD Europe as a result of the
EU’s mandatory 2020 targets for renewable energy 17
0%5%
10%15%20%25%30%35%40%45%50%
OECD
Americas
OECD Asia
Oceania
OECD
Europe
China India Brazil Africa Non-OECD
Americas
(excl.
Brazil)
Non-OECD
Asia (excl.
India)
Non-OECD
Europe and
Eurasia
Middle East
Share in total energy use for heat
Geothermal
Solar
thermal
Modern
bioenergy
IEEJ: October 2015, All Rights Reserved.

© OECD/IEA 2015
Focus on Japan
18
IEEJ: October 2015, All Rights Reserved.
© OECD/IEA 2015
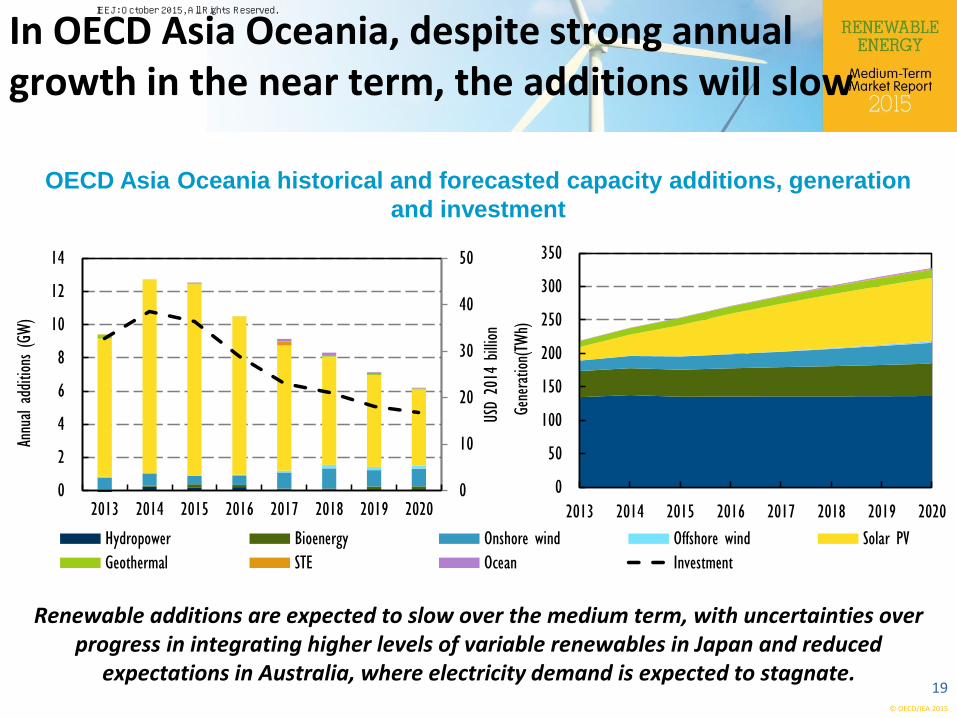
In OECD Asia Oceania, despite strong annual growth in the near term, the additions will slow
Renewable additions are expected to slow over the medium term, with uncertainties over progress in integrating higher levels of variable renewables in Japan and reduced
expectations in Australia, where electricity demand is expected to stagnate.
OECD Asia Oceania historical and forecasted capacity additions, generation
and investment
19
0
50
100
150
200
250
300
350
2013 2014 2015 2016 2017 2018 2019 2020Ge
neratio
n(TW
h)
0
10
20
30
40
50
0
2
4
6
8
10
12
14
2013 2014 2015 2016 2017 2018 2019 2020US
D 20
14 billion
Annu
al a
ddition
s (GW)
Hydropower Bioenergy Onshore wind Offshore wind Solar PV
Geothermal STE Ocean Investment
IEEJ: October 2015, All Rights Reserved.
© OECD/IEA 2015
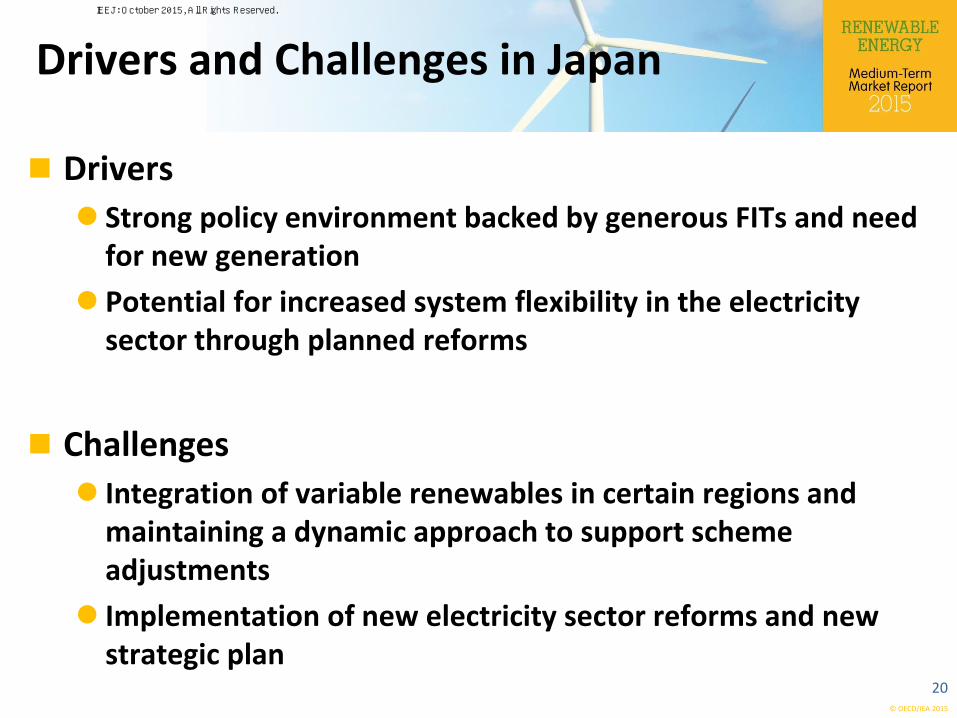
Drivers and Challenges in Japan
Drivers
Strong policy environment backed by generous FITs and need for new generation
Potential for increased system flexibility in the electricity sector through planned reforms
Challenges
Integration of variable renewables in certain regions and maintaining a dynamic approach to support scheme adjustments
Implementation of new electricity sector reforms and new strategic plan
20
IEEJ: October 2015, All Rights Reserved.
© OECD/IEA 2015
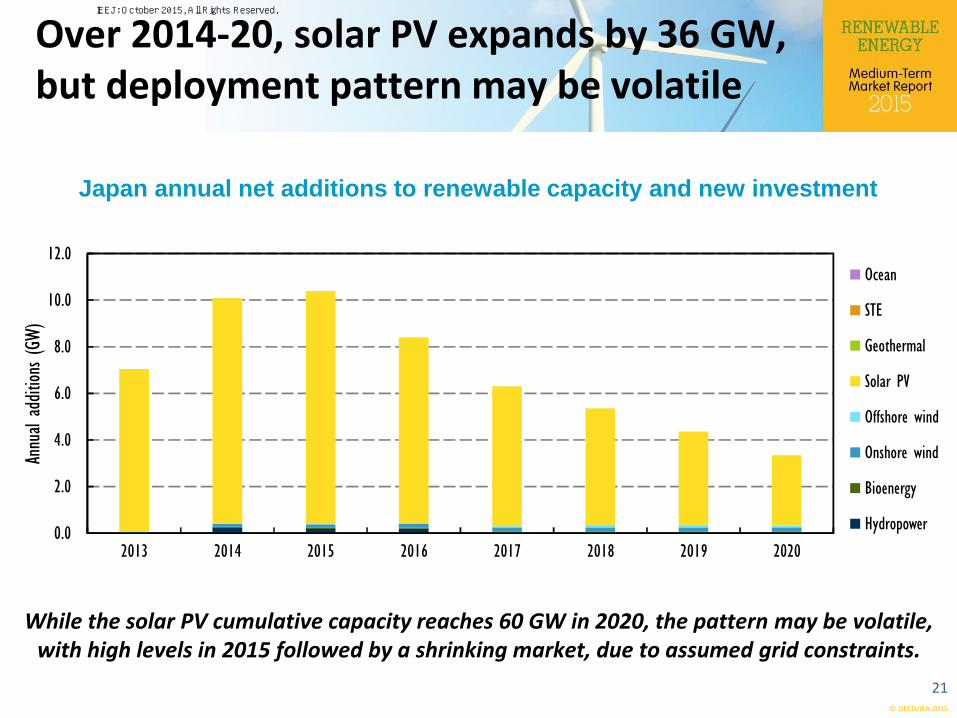
Over 2014-20, solar PV expands by 36 GW, but deployment pattern may be volatile
While the solar PV cumulative capacity reaches 60 GW in 2020, the pattern may be volatile, with high levels in 2015 followed by a shrinking market, due to assumed grid constraints.
Japan annual net additions to renewable capacity and new investment
21
0.0
2.0
4.0
6.0
8.0
10.0
12.0
2013 2014 2015 2016 2017 2018 2019 2020
Annu
al a
ddition
s (GW)
Ocean
STE
Geothermal
Solar PV
Offshore wind
Onshore wind
Bioenergy
Hydropower
IEEJ: October 2015, All Rights Reserved.
© OECD/IEA 2015
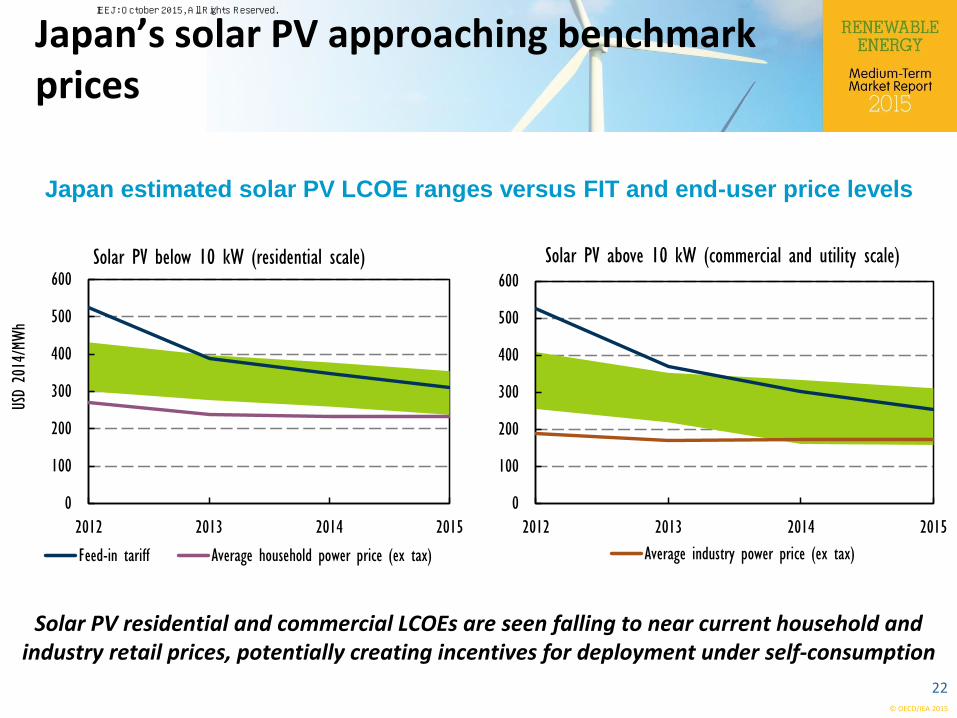
Japan estimated solar PV LCOE ranges versus FIT and end-user price levels
Solar PV residential and commercial LCOEs are seen falling to near current household and industry retail prices, potentially creating incentives for deployment under self-consumption
Japan’s solar PV approaching benchmark prices
0
100
200
300
400
500
600
2012 2013 2014 2015
USD
2014
/MWh
Solar PV below 10 kW (residential scale)
Feed-in tariff Average household power price (ex tax)
0
100
200
300
400
500
600
2012 2013 2014 2015
Solar PV above 10 kW (commercial and utility scale)
Average industry power price (ex tax)
22
IEEJ: October 2015, All Rights Reserved.
© OECD/IEA 2015
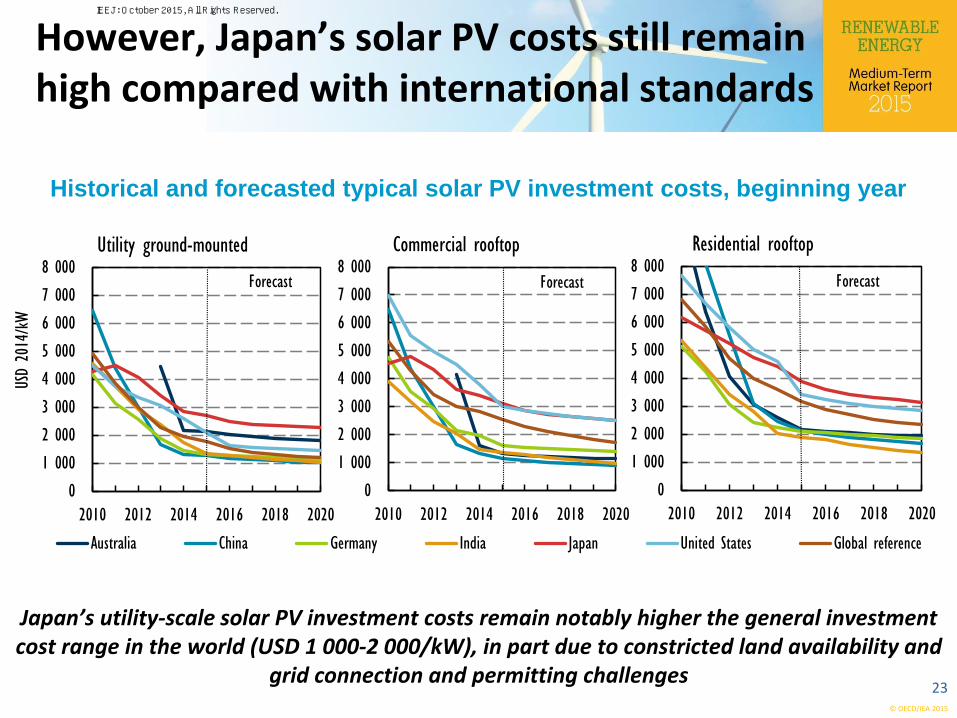
However, Japan’s solar PV costs still remain high compared with international standards
Japan’s utility-scale solar PV investment costs remain notably higher the general investment cost range in the world (USD 1 000-2 000/kW), in part due to constricted land availability and
grid connection and permitting challenges
Historical and forecasted typical solar PV investment costs, beginning year
0
1 000
2 000
3 000
4 000
5 000
6 000
7 000
8 000
2010 2012 2014 2016 2018 2020
USD
2014
/kW
Utility ground-mounted
Australia China Germany India Japan United States Global reference
0
1 000
2 000
3 000
4 000
5 000
6 000
7 000
8 000
2010 2012 2014 2016 2018 2020
Commercial rooftop
0
1 000
2 000
3 000
4 000
5 000
6 000
7 000
8 000
2010 2012 2014 2016 2018 2020
Residential rooftop
Forecast Forecast Forecast
23
IEEJ: October 2015, All Rights Reserved.
© OECD/IEA 2015
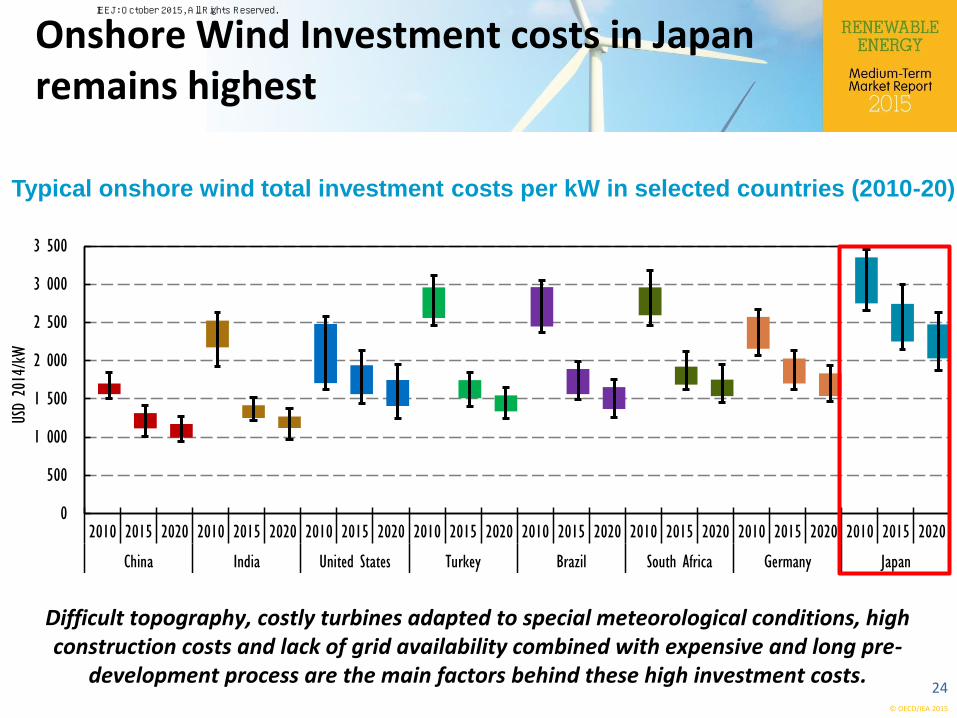
Onshore Wind Investment costs in Japan remains highest
Typical onshore wind total investment costs per kW in selected countries (2010-20)
Difficult topography, costly turbines adapted to special meteorological conditions, high construction costs and lack of grid availability combined with expensive and long pre-
development process are the main factors behind these high investment costs.
0
500
1 000
1 500
2 000
2 500
3 000
3 500
2010 2015 2020 2010 2015 2020 2010 2015 2020 2010 2015 2020 2010 2015 2020 2010 2015 2020 2010 2015 2020 2010 2015 2020
China India United States Turkey Brazil South Africa Germany Japan
USD
2014
/kW
24
IEEJ: October 2015, All Rights Reserved.
© OECD/IEA 2015
Priorities for Renewables in Japan
Objective should remain to foster a well-balanced portfolio of renewable energy technologies
Proceed in the power system reforms
Strengthen interconnections and enlarge balancing areas
Allow for fair and equal grid access conditions
Policies on Solar PV should be adapted to reduce unit costs as much as possible and rapidly align with international benchmarks prices
For development of renewable heating and cooling policy, need to obtain reliable data on production, utilisation and costs 25
IEEJ: October 2015, All Rights Reserved.
© OECD/IEA 2015
For further insights and analysis…
The Medium-Term Renewable Energy Market Report 2015 was launched on 2nd October and can be purchased online at:
http://www.iea.org/
Thank you for your attention!
26
IEEJ: October 2015, All Rights Reserved.
Contact:[email protected]