sna+mc 2010 pnst paper template -...
TRANSCRIPT

Progress in Nuclear Science and Technology
Volume 6 (2018) pp. xxx-yyy
© 2018 Atomic Energy Society of Japan. All rights reserved.
ARTICLE
A method for the prediction of the dose rate distribution in a primary containment vessel of
the Fukushima Daiichi Nuclear Power Station
Keisuke Okumuraa*, Eka Sapta Riyanaa, Wakaei Satoa, Hirobumi Maedaa, Jun-ichi Katakurab, So Kamadac, Malcolm J. Joyced and Barry Lennoxe
aJapan Atomic Energy Agency, 790-1 Motooka, Ohtsuka, Tomioka-machi, Futaba-gun, Fukushima-ken, 979-1151, Japan; bNagaoka
University of Technology, 1603-1 Kamitomioka-machi, Nagaoka-shi , Niigata-ken, 940-2188, Japan; cNational Maritime Research
Institute, 6-38-1 Shinkawa, Mitaka-shi, Tokyo, 181-0004, Japan; dLancaster University, Bailrigg, Lancaster, United Kingdom, eThe University of Manchester, Oxford Rd, Manchester, United Kingdom
We propose a method to predict the dose rate distribution in a primary containment vessel of Unit 1 of the
Fukushima Daiichi Nuclear Power Station (1F) using numerical calculations and measured data.
Keywords: Fukushima Daiichi; dose rate; primary containment vessel; fuel debris; decommissioning; severe accident; fuel burnup; activation; photon transport; Monte Carlo; PHITS; PCV investigation
1. Introduction1
In order to accelerate the retrieval of fuel debris at the
Fukushima Daiichi Nuclear Power Station (1F), it is
important to know the dose rate distribution in the
primary containment vessel (PCV). To grasp the current
situation inside a PCV, severe accident (SA) analyses
and PCV investigations using robots have been carried
out by the International Research Institute for Nuclear
Decommissioning (IRID) [1]. However, the prediction
accuracy of the SA analyses is still not sufficient and the
measured dose rates by the investigations are limited to
local areas. Therefore, we developed a method to predict
the dose rate distribution in a PCV by combining various
numerical calculations with the measured results, and
this was applied to the Unit 1 of 1F.
2. Estimation of radiation sources in PCV
There are mainly three kinds of radiation sources in
the PCV of 1F. They are 1) radioactive nuclides in fuel
debris, 2) inner structural materials activated during
normal operations before the accident, 3) all wall
surfaces and water in the PCV contaminated with
cesium (Cs) released from fuels at the time of accident.
These radiation sources were estimated in the following
ways.
2.1. Fuel debris
Figure 1 shows the calculation scheme to generate
the composition of fuel debris. First, a three-dimensional
fuel inventory calculation was carried out considering
*Corresponding author. Email: [email protected]
axial void and burnup distributions by using the reactor
analysis code system MOSRA [2] and its nuclear data
library based on JENDL-4.0 [3]. Separately, activation
calculations for the structural materials of a fuel
assembly were carried out in consideration of impurities
using ORLIBJ40 (ORIGEN2 and its revised library with
JENDL-4.0) [4].
9x9B
3-dimensional fuel inventory
calculation considering burn-up
and void distributions
Activation calculation
of structural materials
considering impurities
・ fuel claddings
・ water rods
・ channel boxes
・ spacers
・ upper and lower
tie plates
(2) FP release
(3) Decay to
evaluation time
(1) Mixing of all
nuclides
(about 1560)6 6 6 6 6
6 4 3 2 4 36 5 1 2 4 3 5
6 4 3 2 4 3 1 5
6 5 3 2 4 3 1 4 26 4 3 2 4 3 1 3 2 1
6 5 1 2 4 3 5 5 2 1 5
6 3 2 4 3 1 5 5 1 3 5
6 2 4 3 1 3 2 1 3 4 16 4 3 1 4 2 1 3 4 4 26 3 5 5 2 1 5 5 1 2 5
MOSRA with
JENDL-4.0 ORIGEN2 with
JENDL-4.0
vo
id d
istr
ibu
tio
n
Bu
rnu
p d
istr
ibu
tio
n
FA
(25
no
des
)
¼ core
Core averaged fuel debris composition
Figure 1. Calculation scheme of fuel debris composition.
After the all nuclides obtained from the above
calculations were mixed, fission products (FPs) of noble
gases and volatile elements were removed to simulate
the release of these gases from the mixture. Two
extreme FP release models were employed, as shown in
Table 1, with references to the assay result of the TMI-2
fuel debris [5] and a result of FP release behavior tests
[6]. Subsequently, for all radionuclides, the decay up to
the time of the dose rate estimation was considered. In
the present study, this was April 2015 as this is when the
dose rate measurement in the PCV of Unit 1 was
performed for the first time by a robot (so called “B1
investigation”) [7].
The number of photon sources emitted from
radionuclides in fuel debris is more than 10,000 in line
Progress in Nuclear Science and Technology, Volume 6, 2018 2
spectra. Since such line spectra are inconvenient for
subsequent photon transport calculations, the photon
source of fuel debris was represented by a photon source
having the 18-energy-group structure of ORIGEN2 [8]
which is conventionally used for spent nuclear fuels.
The group-wise photon source of fuel debris was
calculated based on the JENDL decay data file 2015 [9].
Figure 2 shows the photon spectra of fuel debris at
the time of the B1 investigation. The difference of two
spectra is mainly due to the release amount of Cs (134Cs
and 137Cs).
Table 1. Two FP release models.
Classification ElementHigh release
model (%)
Low release
model (%)
Noble gas He, Ne, Ar, Kr, Xe, Rn 99 90
High volatile
FPCs, I, Te, Sb 99 60
Middle volatile
FPRu, Mo, Sr, Ba, Pd, Rh 99 0
1.E+06
1.E+07
1.E+08
1.E+09
1.E+10
1.E+11
1.E+12
1.E+13
1.E+14
1.E+15
1.E+16
1.E+17
1.E+18
0.01 0.1 1 10
Inte
nsi
ty (p
ho
ton
s/s)
Photon energy (MeV)
Low release model
High release model
Figure 2. Photon spectra of fuel debris in April 2015.
2.2. Activated structural materials
As radiation sources of structural materials by
long-term reactor operations, we considered shroud,
upper grid plate and lower core support plate, close to
the core.
The neutron flux of the shroud was approximated by
that at core peripherals calculated by MOSRA with a
two-dimensional horizontal core model shown in the left
of Figure 1. As for the upper grid plate and lower core
support plate, a continuous-energy Monte Carlo
calculation code MVP-II [10] was used to estimate
neutron fluxes at the top and bottom parts of a fuel
assembly with horizontally reflective boundary
conditions. Using the obtained neutron fluxes and the
reactor operation history [11] of Unit 1 shown in Figure 3,
ORIGEN2 calculations were carried out to estimate the
amount of activation products in each material. The
irradiation period is about 9 years and 4 months from
November 2001 when the reactor was restarted after
shroud exchange, until March 2011 when the accident
occurred. The capacity factor of Unit 1 in this period is
low as about 48%.
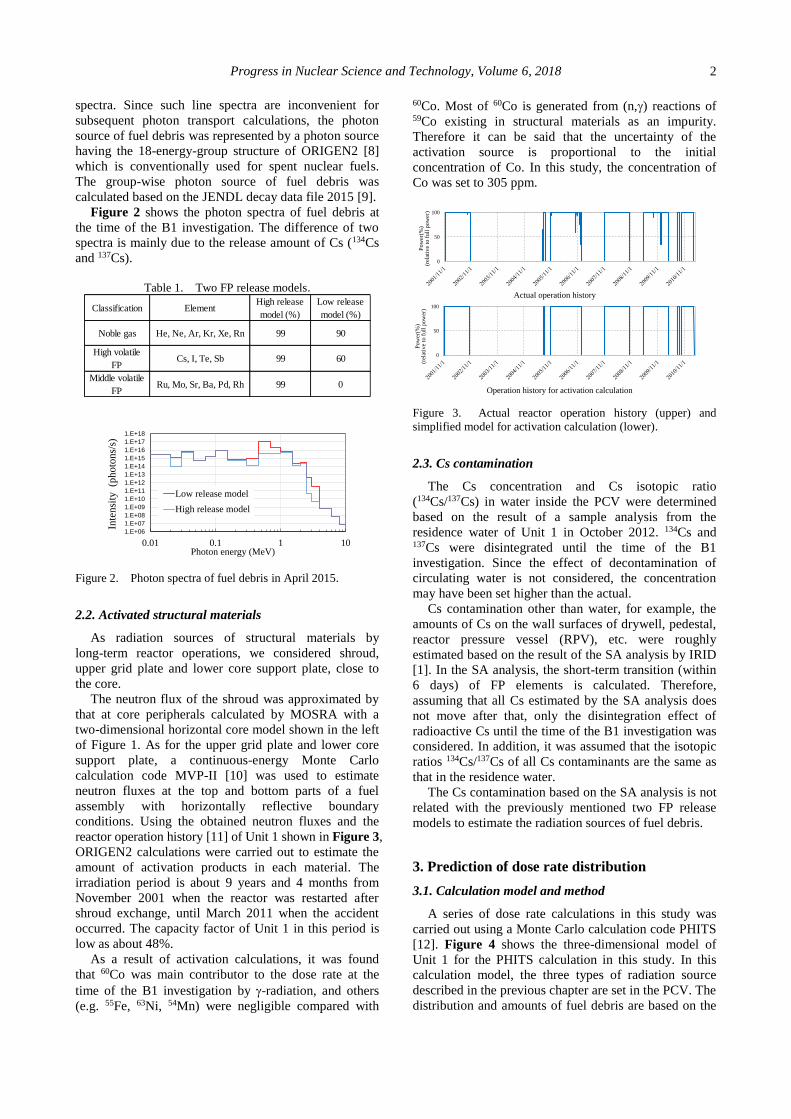
As a result of activation calculations, it was found
that 60Co was main contributor to the dose rate at the
time of the B1 investigation by -radiation, and others
(e.g. 55Fe, 63Ni, 54Mn) were negligible compared with
60Co. Most of 60Co is generated from (n,) reactions of 59Co existing in structural materials as an impurity.
Therefore it can be said that the uncertainty of the
activation source is proportional to the initial
concentration of Co. In this study, the concentration of
Co was set to 305 ppm.
0
50
100
Operation history for activation calculation
Po
wer
(%)
(rel
ativ
e to
fu
ll p
ow
er)
0
50
100
Actual operation history
Po
wer
(%)
(rel
ativ
e to
fu
ll p
ow
er)
Figure 3. Actual reactor operation history (upper) and
simplified model for activation calculation (lower).
2.3. Cs contamination
The Cs concentration and Cs isotopic ratio
(134Cs/137Cs) in water inside the PCV were determined
based on the result of a sample analysis from the
residence water of Unit 1 in October 2012. 134Cs and 137Cs were disintegrated until the time of the B1
investigation. Since the effect of decontamination of
circulating water is not considered, the concentration
may have been set higher than the actual.
Cs contamination other than water, for example, the
amounts of Cs on the wall surfaces of drywell, pedestal,
reactor pressure vessel (RPV), etc. were roughly
estimated based on the result of the SA analysis by IRID
[1]. In the SA analysis, the short-term transition (within
6 days) of FP elements is calculated. Therefore,
assuming that all Cs estimated by the SA analysis does
not move after that, only the disintegration effect of
radioactive Cs until the time of the B1 investigation was
considered. In addition, it was assumed that the isotopic
ratios 134Cs/137Cs of all Cs contaminants are the same as
that in the residence water.
The Cs contamination based on the SA analysis is not
related with the previously mentioned two FP release
models to estimate the radiation sources of fuel debris.
3. Prediction of dose rate distribution
3.1. Calculation model and method
A series of dose rate calculations in this study was
carried out using a Monte Carlo calculation code PHITS
[12]. Figure 4 shows the three-dimensional model of
Unit 1 for the PHITS calculation in this study. In this
calculation model, the three types of radiation source
described in the previous chapter are set in the PCV. The
distribution and amounts of fuel debris are based on the

K. Okumura et al.
3
result of the SA analysis by IRID [1]. However, the
erosion of concrete by fuel debris at the bottom of PCV
was ignored for simplicity.
Fuel debris distribution
based on the SA analysis
by IRID
Photon sources based on
• fuel burnup calculation
• Activation calculation
• FP release
• Decay
• Water level,
• Cs concentration,
• Cs-134/Cs-137 isotope ratio
based on the PCV investigation
by IRID
Cs distribution in PCV/RPV
based on the SA analysis by
IRID
Co-60 source from
activation calculations for
• upper lattice plate
• shroud,
• lower core support plate
Figure 4. Dose rate calculation model by PHITS (Unit 1).
The uncertainty of the radiation sources is still large,
and it is thought that it will be changed by future
improvement of the SA analysis and progress of the
PCV investigations. Therefore, all the radiation sources
in PCV were divided into N pieces, and the response to
the dose rate distribution di(r) from each unit source i
was calculated by PHITS. Using the intensity Si of the
i-th source, the dose rate distribution D(r) in the PCV is
expressed by the following equations.
,)()( N
i
iidSD rr (1)
,),()()( 10* dEEEHd ii rr (2)
where, H*10(E) is the flux-to-dose equivalent rate
conversion coefficient based on ICRP-74 [13], and i(E)
is a photon spectrum calculated by PHITS for the i-th
source.
Although the number of radiation sources (N) can be
arbitrarily determined from the number of sensitivities
of the radiation sources we want to know, it is limited
from the amount of information available from the
results of SA analysis and PCV investigations. In this
study, we set as N=63, they are two fuel debris
distributed inside and outside RPV, three activated
structural materials in the RPV (shroud, upper grid plate
and lower core support plate) and 58 of Cs
contaminations, in which 134Cs and 137Cs with different
half-lives are separately considered because it is
convenient to predict the time change of D(r).
We assumed that the walls and floor under the water
were contaminated with the Cs with the same
concentration to that on the lower drywell in the air,
although the actual situation is unknown.
In the Monte Carlo calculation by PHITS, 200 million
photons were traced to get di(r) for each radiation
source.
3.2. Results and discussions
Figure 5 shows the typical results of the
contributions (Si di(r)) to the dose rate distribution in
PCV. The predicted dose rate obtained by Eq.(1) is
shown in Figure 6.
Shield plug
clearance
Well head
top surface
Pedestal
outer surface
Steam separator Fuel debris
D/W top
surface
D/W lower
surface
Cs in waterPedestal
inner surface
Steam dryer
Figure 5. Source-wise dose rate distribution.
Radial (cm)
Ax
ial
(cm
)
Water level : about 3 m
Submerged
fuel debris
Grating used in
B1 investigation
Fuel debris
exposed in air
Dose
rat
e (m
Sv
/h)
Figure 6. Predicted dose rate distribution of Unit-1 in Apr.
2015 (without adjustment to the measured dose rate in the B1
investigation).
In the B1 investigation, the dose rates were measured
by a robot at 11 points on the grating shown in Figure 6.
The measured dose rates range from 4.7 to 9.7 Sv/h,
with an average of 7.2 Sv/h (1=1.4). On the other hand,
the dose rate near the grating in Figure 6 is about 1.4
Sv/h.
The difference between the measured and calculated
dose rates is considered to be mainly due to the amounts
of Cs contaminations by the SA analysis. As shown in
Figure 5, the dose rate near the grating position is
sensitive to the Cs contaminations on the lower drywell
(D/W) and on the outer surface of pedestal, and not so
sensitive to other radiation sources. Therefore, the
amounts of Cs outside the RPV were adjusted so that the
dose rate at the grating position matched the measured
average value. In this procedure, the values of Si in
Eq.(1) corresponding to Cs contaminations on the all
wall surfaces outside the RPV were multiplied by the
same adjustment factor (=7.2/1.4). The modified dose
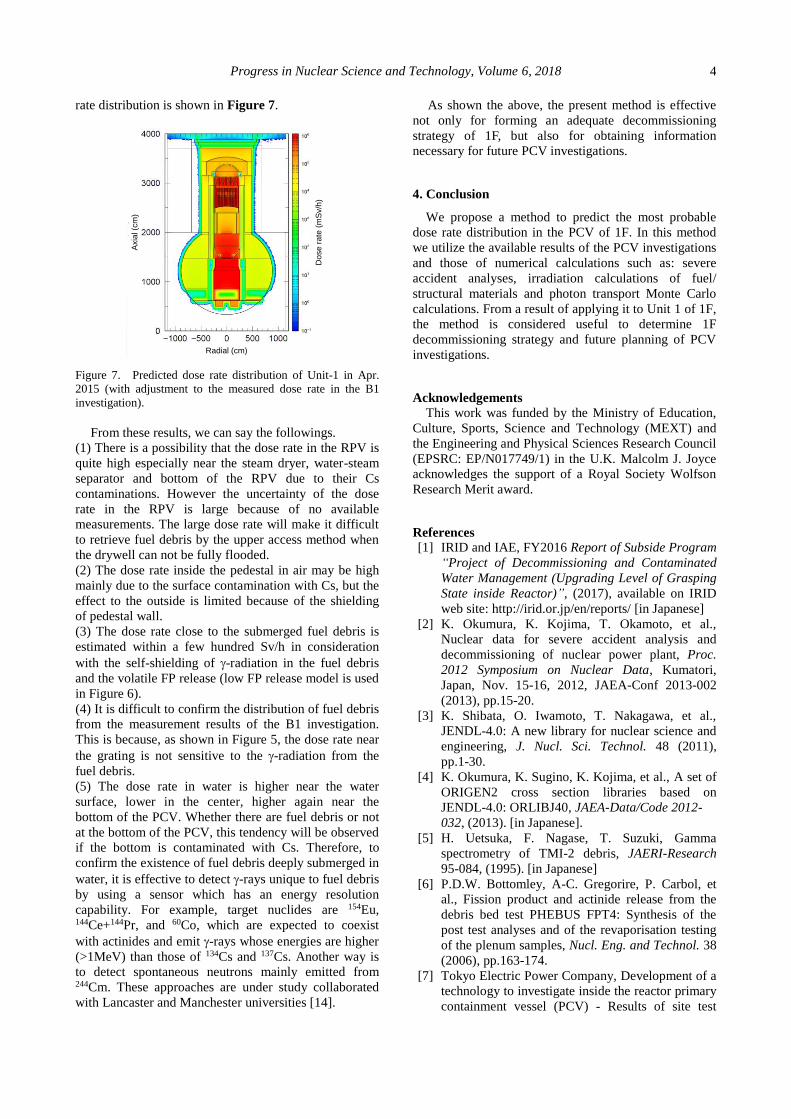
Progress in Nuclear Science and Technology, Volume 6, 2018 4
rate distribution is shown in Figure 7.
Do
se
ra
te (
mS
v/h
)
Radial (cm)
Axia
l (c
m)
Figure 7. Predicted dose rate distribution of Unit-1 in Apr.
2015 (with adjustment to the measured dose rate in the B1
investigation).
From these results, we can say the followings.
(1) There is a possibility that the dose rate in the RPV is
quite high especially near the steam dryer, water-steam
separator and bottom of the RPV due to their Cs
contaminations. However the uncertainty of the dose
rate in the RPV is large because of no available
measurements. The large dose rate will make it difficult
to retrieve fuel debris by the upper access method when
the drywell can not be fully flooded.
(2) The dose rate inside the pedestal in air may be high
mainly due to the surface contamination with Cs, but the
effect to the outside is limited because of the shielding
of pedestal wall.
(3) The dose rate close to the submerged fuel debris is
estimated within a few hundred Sv/h in consideration
with the self-shielding of -radiation in the fuel debris
and the volatile FP release (low FP release model is used
in Figure 6).
(4) It is difficult to confirm the distribution of fuel debris
from the measurement results of the B1 investigation.
This is because, as shown in Figure 5, the dose rate near
the grating is not sensitive to the -radiation from the
fuel debris.
(5) The dose rate in water is higher near the water
surface, lower in the center, higher again near the
bottom of the PCV. Whether there are fuel debris or not
at the bottom of the PCV, this tendency will be observed
if the bottom is contaminated with Cs. Therefore, to
confirm the existence of fuel debris deeply submerged in
water, it is effective to detect -rays unique to fuel debris
by using a sensor which has an energy resolution
capability. For example, target nuclides are 154Eu, 144Ce+144Pr, and 60Co, which are expected to coexist
with actinides and emit -rays whose energies are higher
(>1MeV) than those of 134Cs and 137Cs. Another way is
to detect spontaneous neutrons mainly emitted from 244Cm. These approaches are under study collaborated
with Lancaster and Manchester universities [14].
As shown the above, the present method is effective
not only for forming an adequate decommissioning
strategy of 1F, but also for obtaining information
necessary for future PCV investigations.
4. Conclusion
We propose a method to predict the most probable
dose rate distribution in the PCV of 1F. In this method
we utilize the available results of the PCV investigations
and those of numerical calculations such as: severe
accident analyses, irradiation calculations of fuel/
structural materials and photon transport Monte Carlo
calculations. From a result of applying it to Unit 1 of 1F,
the method is considered useful to determine 1F
decommissioning strategy and future planning of PCV
investigations.
Acknowledgements
This work was funded by the Ministry of Education,
Culture, Sports, Science and Technology (MEXT) and
the Engineering and Physical Sciences Research Council
(EPSRC: EP/N017749/1) in the U.K. Malcolm J. Joyce
acknowledges the support of a Royal Society Wolfson
Research Merit award.
References
[1] IRID and IAE, FY2016 Report of Subside Program
“Project of Decommissioning and Contaminated
Water Management (Upgrading Level of Grasping
State inside Reactor)”, (2017), available on IRID
web site: http://irid.or.jp/en/reports/ [in Japanese]
[2] K. Okumura, K. Kojima, T. Okamoto, et al.,
Nuclear data for severe accident analysis and
decommissioning of nuclear power plant, Proc.
2012 Symposium on Nuclear Data, Kumatori,
Japan, Nov. 15-16, 2012, JAEA-Conf 2013-002
(2013), pp.15-20.
[3] K. Shibata, O. Iwamoto, T. Nakagawa, et al.,
JENDL-4.0: A new library for nuclear science and
engineering, J. Nucl. Sci. Technol. 48 (2011),
pp.1-30.
[4] K. Okumura, K. Sugino, K. Kojima, et al., A set of
ORIGEN2 cross section libraries based on
JENDL-4.0: ORLIBJ40, JAEA-Data/Code 2012-
032, (2013). [in Japanese].
[5] H. Uetsuka, F. Nagase, T. Suzuki, Gamma
spectrometry of TMI-2 debris, JAERI-Research
95-084, (1995). [in Japanese]
[6] P.D.W. Bottomley, A-C. Gregorire, P. Carbol, et
al., Fission product and actinide release from the
debris bed test PHEBUS FPT4: Synthesis of the
post test analyses and of the revaporisation testing
of the plenum samples, Nucl. Eng. and Technol. 38
(2006), pp.163-174.
[7] Tokyo Electric Power Company, Development of a
technology to investigate inside the reactor primary
containment vessel (PCV) - Results of site test

K. Okumura et al.
5
“Investigation B1” on grating around the pedestal
inside Unit 1 PCV -, available on the website of
TEPCO, April 30, (2015).
[8] A.G. Croff, ORIGEN2: A versatile computer code
for calculating the nuclide compositions and
characteristics of nuclear materials, Nucl. Technol.
62 (1983), pp.335-352.
[9] J. Katakura and F. Minato, JENDL Decay Data
File 2015, JAEA-Data/Code 2015-030 (2016).
[10] Y. Nagaya, K. Okumura, T. Mori, M. Nakagawa,
MVP/GMVP II: General purpose Monte Carlo
codes for neutron and photon transport calculation,
JAERI 1348 (2005).
[11] JNES, Nuclear Facility Operation Management
Annual Report, (2000~2012). [in Japanese]
[12] T. Sato, K. Niita, N. Matsuda, et al., Particle and
heavy ion transport code system PHITS, Version
2.52, J. Nucl. Sci. Technol. 50 (2013), pp.913-923.
[13] ICRP, Conversion coefficients for use in
radiological protection against external radiation,
ICRP Publication 74, Ann. ICRP 26 (3-4), (1996).
[14] M. Nancekievill, A.R. Jones, M.J. Joyce, B.
Lennox, S. Watson, et al., A remote-operated
system to map radiation dose in the Fukushima
Daiichi primary containment vessel, Proc. Int.
Conf. on Advancements in Nuclear Instrumentation
Measurement Methods and their Applications
(ANIMMA2017), June 19-23, 2017, Liege, Belgium
(2017). ANIMMA-2095 [electric file]