investor presentation · million run rate, and achieve 7.5 million dau. before spotify, teymour...
TRANSCRIPT

Investor PresentationSeptember 2019

Forward Looking Statements
To the extent that statements contained in this presentation are not descriptions of historical facts regarding Tapinator, they are forward-looking statements reflecting the current beliefs and expectations of management made pursuant to the safe harbor provisions of the Private Securities Litigation Reform Act of 1995.
Words such as “targeted,” “may,” “will” “expect,”
“anticipate,” “estimate,” “intend,” “forecast,” and
similar expressions (as well as other words or
expressions referencing future events,
conditions or circumstances) are intended to
identify forward-looking statements. Examples of
forward-looking statements contained in this
presentation include, among others, financial
guidance, statements regarding the quoting and
trading of our common stock and our
expectations regarding our development and
monetization plans for our mobile games and
apps. Forward-looking statements in this release
involve substantial risks and uncertainties that
could cause the development and monetization
of our mobile games, future
results, performance or achievements to differ
significantly from those expressed or implied by
the forward-looking statements. Such risks and
uncertainties include, among others, the
uncertainties inherent in the hits nature of the
mobile gaming business and whether apps will
achieve mainstream adoption. Tapinator
undertakes no obligation to update or revise any
forward-looking statements, including any
financial guidance included herein, except as
required by applicable securities laws. The
quoting and trading of the company’s common
stock on the OTC QB Marketplace is often thin
and characterized by wide fluctuations in trading
prices, due to many factors that may have little
to do with the company’s operations or business
prospects. As a result, there may be volatility in the market
price of the shares of the company’s common stock for reasons
unrelated to operating performance. Moreover, the OTC QB
Marketplace is not a stock exchange, and trading of securities
on it is often more sporadic than trading of securities listed on a
national exchange. Accordingly, stockholders may have
difficulty re-selling any of their sahres. For a further description
of the risks and uncertainties that could cause actual results to
differ from those expressed in these forward-looking
statements, as well as risks relating to the business of
Tapinator, please see Tapinator's disclaimers, which are
available here: http://www.tapinator.com/disclaimers as well as
the discussion under “Risk Factors” set forth in our latest
Annual Report on Form 10-K and Quarterly Reports on Form
10-Q as filed with the Securities and Exchange Commission.
1
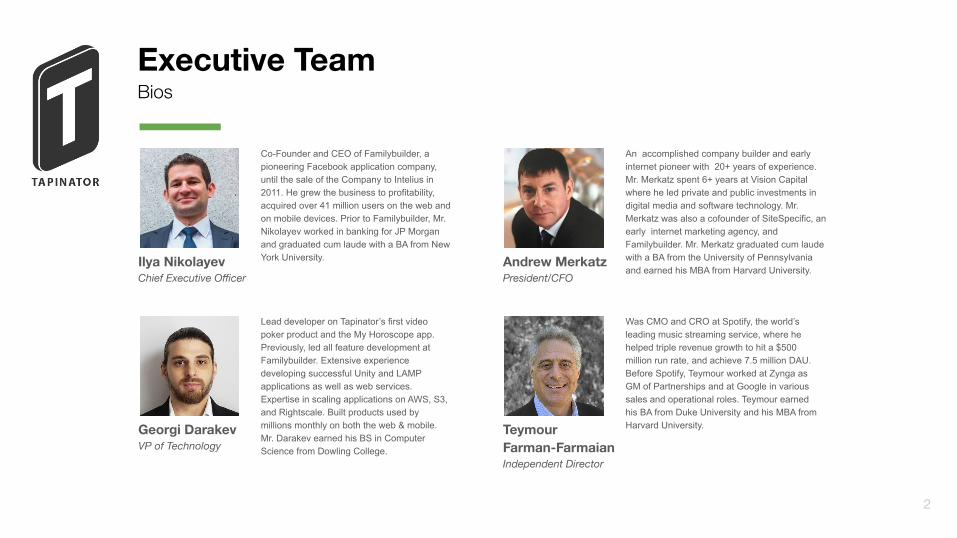
Executive Team
2
Bios
Ilya NikolayevChief Executive Officer
Co-Founder and CEO of Familybuilder, a pioneering Facebook application company, until the sale of the Company to Intelius in 2011. He grew the business to profitability, acquired over 41 million users on the web and on mobile devices. Prior to Familybuilder, Mr. Nikolayev worked in banking for JP Morgan and graduated cum laude with a BA from New York University. Andrew Merkatz
President/CFO
An accomplished company builder and early internet pioneer with 20+ years of experience. Mr. Merkatz spent 6+ years at Vision Capital where he led private and public investments in digital media and software technology. Mr. Merkatz was also a cofounder of SiteSpecific, an early internet marketing agency, and Familybuilder. Mr. Merkatz graduated cum laude with a BA from the University of Pennsylvania and earned his MBA from Harvard University.
Georgi DarakevVP of Technology
Lead developer on Tapinator’s first video poker product and the My Horoscope app. Previously, led all feature development at Familybuilder. Extensive experience developing successful Unity and LAMP applications as well as web services. Expertise in scaling applications on AWS, S3, and Rightscale. Built products used by millions monthly on both the web & mobile. Mr. Darakev earned his BS in Computer Science from Dowling College.
TeymourFarman-FarmaianIndependent Director
Was CMO and CRO at Spotify, the world’s leading music streaming service, where he helped triple revenue growth to hit a $500 million run rate, and achieve 7.5 million DAU. Before Spotify, Teymour worked at Zynga as GM of Partnerships and at Google in various sales and operational roles. Teymour earned his BA from Duke University and his MBA from Harvard University.

Mission
Become one of the leading mobile gaming and social casino companies in the world.
3
Where We Are Going

Snapshot
4
Category Leading Mobile Apps
* Bookings and Adjusted EBITDA are non-GAAP, unaudited financial measures. A reconciliation between GAAP and the non-GAAP measures presented herein have been provided in the appendix to this presentation.
● For H1 2019, our Category Leading Apps Bookings* grew by 120% year-over-year.
● Debt-free, with a clean capital structure, and positive Adjusted EBITDA* every year since inception.
● We develop and publish a portfolio of “Category Leading Apps” that are evergreen and have top grossing potential with a focus on social casino games.
● We generate revenues via: (i) app store transactions, including in-app purchases & subscriptions, and (ii) branded advertisements.
● Our Revenue and Adjusted EBITDA* in 2018 was $2.9mm and $132k, respectively.

Significant Market Opportunity
5
Mobile Gaming is Large and Highly LucrativeSocial Casino is Evergreen, Growing, & Recession Resistant
Mobile Gaming Market
$85 billion
21
74%
3h 35m
Global mobile and tablet gaming market in 2019. (1)
Mobile games that have generated over $1 billion of lifetime revenue. (2)
Percentage of app store spend driven by games in 2018. (3)
Spent per day on mobile devices by the average American in 2018. (6)
(1) IDC Worldwide Mobile and Handheld Gaming Forecast, 2019-2023. (2) PocketGamer, 09/19. (3) AppAnnie. (4) AppAnnie. (5) Eilers & Krejcik Gaming. (6) Source: eMarketer.
(5)

Strategic Evolution
6
Category Leading Apps Focused on Social Casino
Rapid-LaunchGames
2013 - 2017
Category LeadingMobile Apps
2017 - Present
● Historicallypredictable returns.
● Advertising monetization.
● High volume, low cost. 350+ games; 450mm downloads.
● Repeatable,stackable revenue.
● In-app purchase + subscription monetization.
● Category leadership + homerun potential.

Winning Strategy
7
Established Casino Gameplay + “Special Sauce”
Leverage established casino gameplay to derisk player adoption. Add our proprietary IP to create differentiation via unique combinations of:
(1) Metagame and engagement systems.(2) Targeted themes and corresponding graphics.(3) Third party licenses.

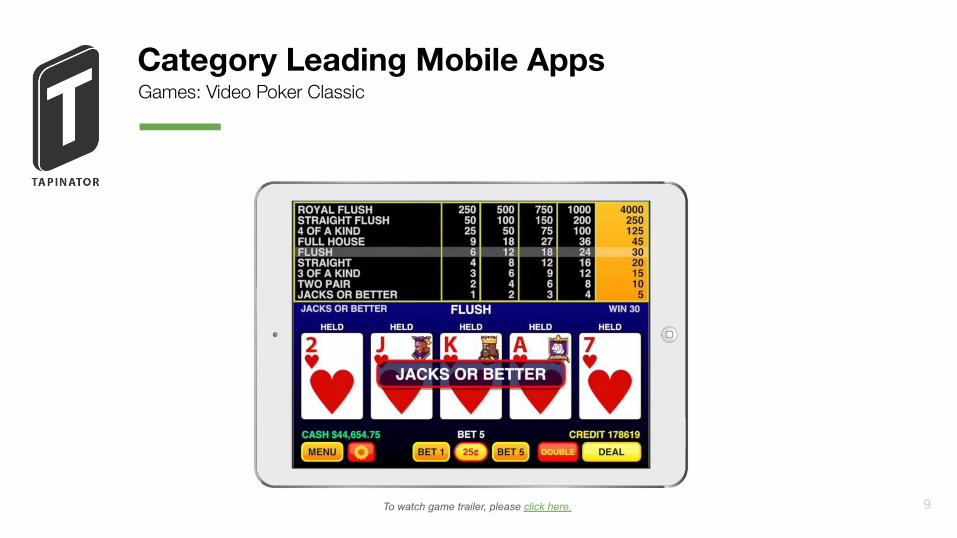
Category Leading Mobile Apps
8
Games: Video Poker Classic
● Video Poker Classic is the top monetizing video poker game on iOS and Google Play as of September 24, 2019.*
● On iOS alone, the game has over 30,000 reviews with an average rating of 4.7 out of 5.0.
● Video Poker Classic is currently a seven-figure revenue game and we are seeing significant growth in 2019 as we continue to invest in this evergreen product.
*According to AppAnnie.
Category Leading Mobile Apps
9
Games: Video Poker Classic
To watch game trailer, please click here.
Category Leading Mobile Apps
10
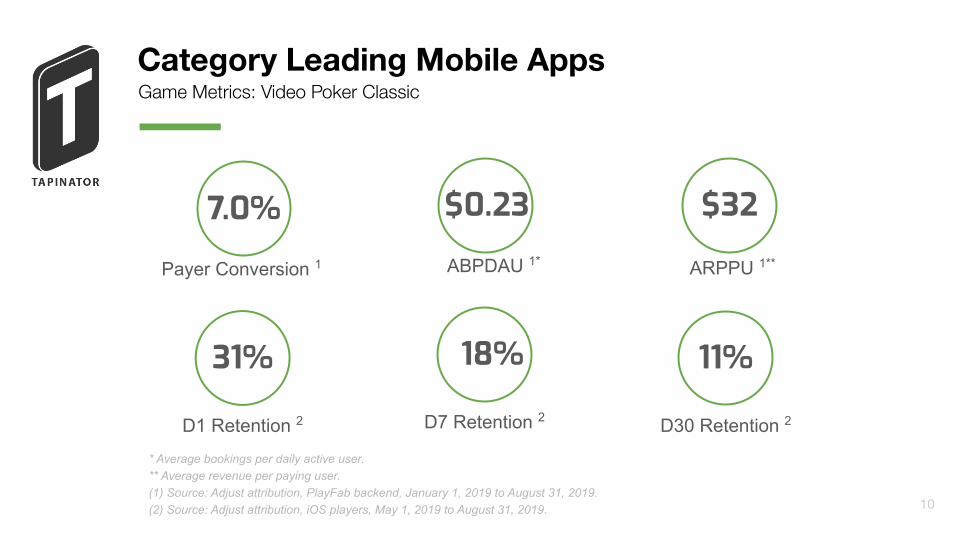
Game Metrics: Video Poker Classic
Payer Conversion 1
D1 Retention 2
* Average bookings per daily active user.** Average revenue per paying user.(1) Source: Adjust attribution, PlayFab backend, January 1, 2019 to August 31, 2019. (2) Source: Adjust attribution, iOS players, May 1, 2019 to August 31, 2019.
$0.23
ABPDAU 1*
31% 18% 11%
D7 Retention 2 D30 Retention 2
7.0% $32
ARPPU 1**

Category Leading Mobile Apps
11
Incremental Marketing Opportunity: Video Poker Classic(1)
(1) Forecast based on internal player lifetime value model which relies on limited past results and certain management assumptions. Actual results could vary significantly based on future market conditions.
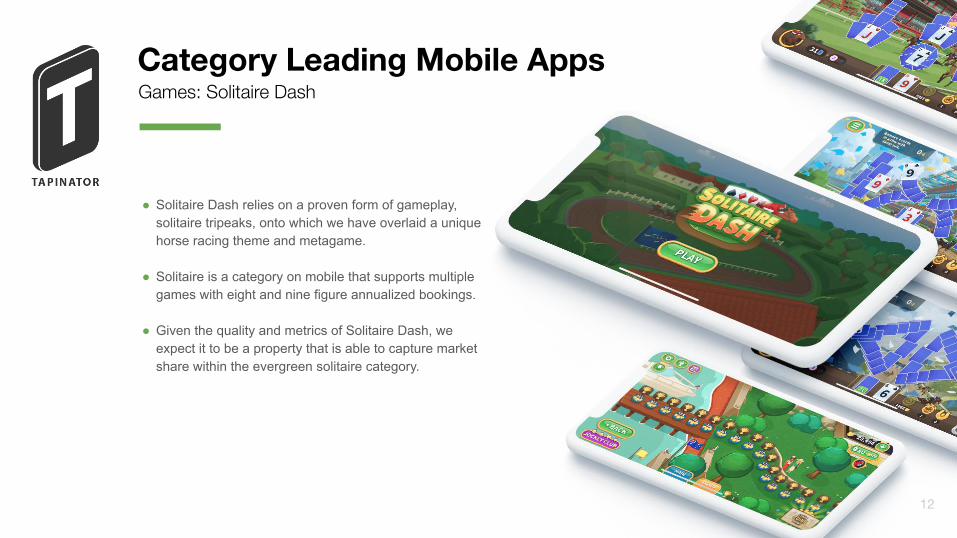
Category Leading Mobile Apps
12
Games: Solitaire Dash
● Solitaire Dash relies on a proven form of gameplay, solitaire tripeaks, onto which we have overlaid a unique horse racing theme and metagame.
● Solitaire is a category on mobile that supports multiple games with eight and nine figure annualized bookings.
● Given the quality and metrics of Solitaire Dash, we expect it to be a property that is able to capture market share within the evergreen solitaire category.

Category Leading Mobile Apps
13
Games: Solitaire Dash
To watch game trailer, please click here.

Category Leading Mobile Apps
14
Game Metrics: Solitaire Dash
D1 Retention 2
* Average bookings per daily active user.** Average revenue per paying user.(1) Source: Adjust attribution, PlayFab backend, January 1, 2019 to May 31, 2019. (2) Source: Adjust attribution, June 14, 2018 to August 14, 2018.
41% 23% 11%D7 Retention 2 D30 Retention 2
Payer Conversion 1
$0.34
ABPDAU 1*
4.7% $15.3
ARPPU 1**

Category Leading Mobile Apps
15
Incremental Marketing Opportunity: Solitaire Dash(1)
(1) Forecast based on internal player lifetime value model which relies on limited past results and certain management assumptions. Actual results could vary significantly based on future market conditions.
Category Leading Mobile Apps
16
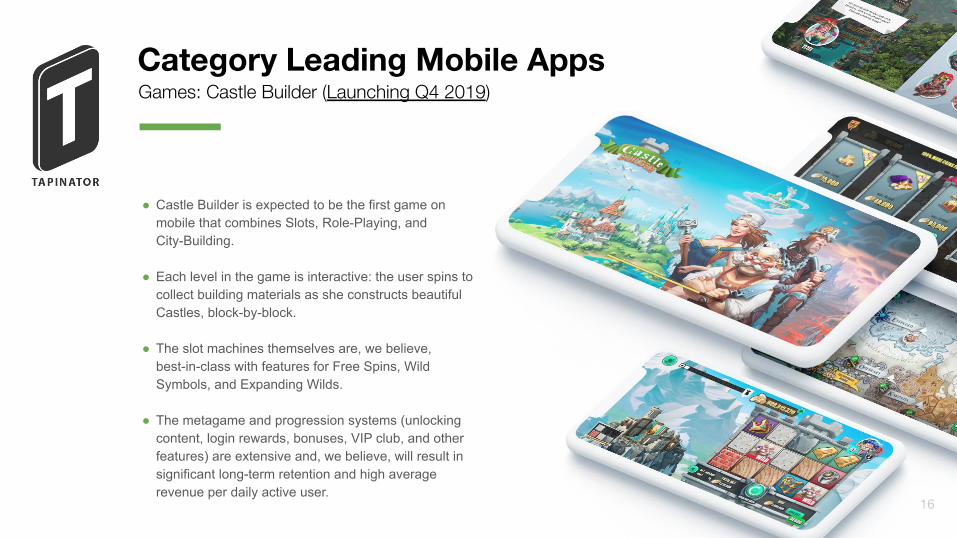
Games: Castle Builder (Launching Q4 2019)
● Castle Builder is expected to be the first game on mobile that combines Slots, Role-Playing, and City-Building.
● Each level in the game is interactive: the user spins to collect building materials as she constructs beautiful Castles, block-by-block.
● The slot machines themselves are, we believe, best-in-class with features for Free Spins, Wild Symbols, and Expanding Wilds.
● The metagame and progression systems (unlocking content, login rewards, bonuses, VIP club, and other features) are extensive and, we believe, will result in significant long-term retention and high average revenue per daily active user.

Category Leading Mobile Apps
17
Games: Castle Builder (Launching Q4 2019)
To watch game trailer, please click here.
Category Leading Mobile Apps
18
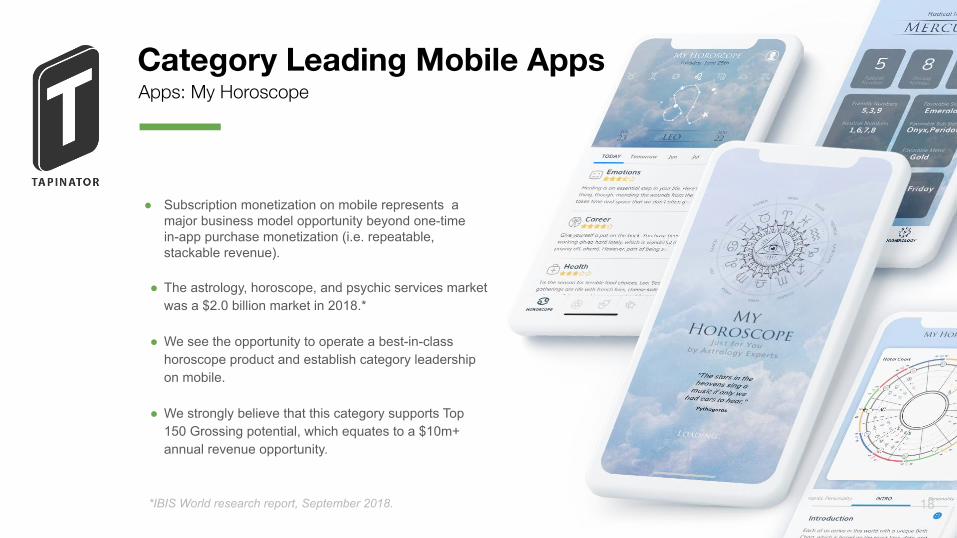
Apps: My Horoscope
● Subscription monetization on mobile represents a major business model opportunity beyond one-time in-app purchase monetization (i.e. repeatable, stackable revenue).
● The astrology, horoscope, and psychic services market was a $2.0 billion market in 2018.*
● We see the opportunity to operate a best-in-class horoscope product and establish category leadership on mobile.
● We strongly believe that this category supports Top 150 Grossing potential, which equates to a $10m+ annual revenue opportunity.
*IBIS World research report, September 2018.

19To watch app trailer, please click here.
Category Leading Mobile AppsApps: My Horoscope
To watch game trailer, please click here.

Player Value Proposition
20
Why Consumers Play Our Games
Our social casino games simulate and enhance the gameplay that a player would find in a casino (for example, slots and video poker) but feature virtual currency instead of real money winnings.
Consumers download and play our games to have a good time; specifically, our games are:
● Authentic - our games provide an experience that reflects and improves upon the features and designs of land-based or online machines.
● Engaging - our games are deeply engaging and use best-in-class systems to bring players back and create an immersive experience including bonuses, minigames, login rewards, VIP clubs, and more.
● Fun & Accessible - our titles are built on top of gameplay that has proven itself to be fun, both short-term and long-term, and our products are accessible anytime, anywhere.
Player reviews of Video Poker Classic

Player & App Metrics
21
Proven Ability to Achieve Scale
Metrics as of Q2 2019
● Average Daily Active Users (DAU) – 173,000
● Average Monthly Active Users (MAU) – 3.0 million
● Average Bookings Per Daily Active User (ABPDAU) – $0.05
● Cumulative Player Downloads – 472 million
● App Library – 371 active titles (113 titles have achieved > 1.0 million downloads)

Category Leading Mobile Apps
22
Player Demographics
Primarily female players, overwhelmingly based in the US.
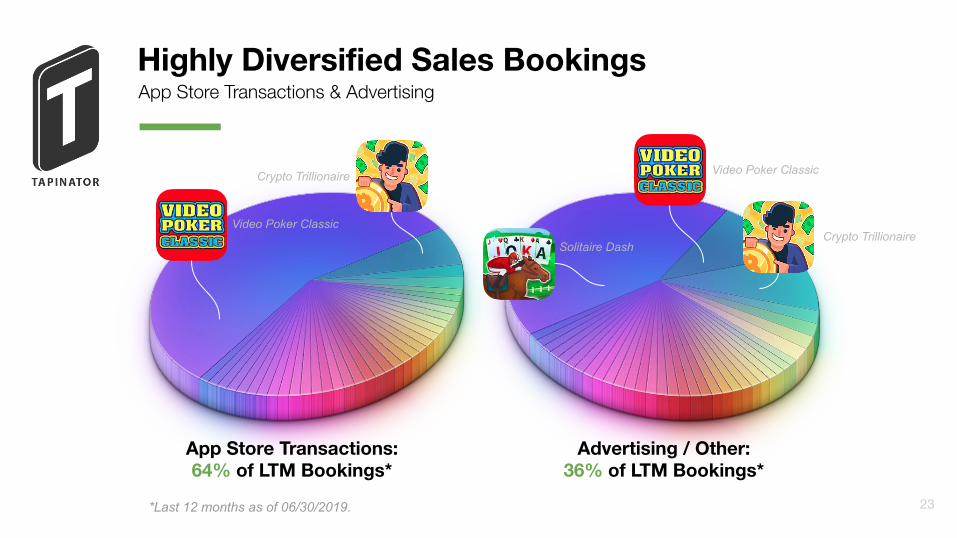
Highly Diversified Sales Bookings
23
App Store Transactions & Advertising
App Store Transactions:64% of LTM Bookings*
Advertising / Other:36% of LTM Bookings*
Video Poker Classic
Video Poker Classic
Solitaire Dash
*Last 12 months as of 06/30/2019.
Crypto Trillionaire
Crypto Trillionaire

Operational Excellence
24
Creating Barriers to Entry
● Strategic data-driven approach to launching new games and optimizing existing properties.
● Scalable and reusable technology stack.
● Strong platform relationships including dedicated business/editorial contacts. Fourteen “New Games We Love” on Apple’s iOS platform.

Financial Highlights
25
Category Leading Apps Bookings* Grew 120% in H1 2019
($ in thousands)2018
AuditedSix Months
Ended 06/30/18Six Months
Ended 06/30/19Y-O-Y
Change
Revenue $2,872 $1,622 $2,159 33%
Bookings* $3,341 $1,600 $1,752 10%
Category Leading App Bookings* $1,700 $550 $1,211 120%
Net Loss -$2,996 -$1,473 -$925 -37%
Adjusted EBITDA* $133 $170 $226 33%
Total Debt $0 $0 $0
Cash $871 $1,340 $510
* Bookings and Adjusted EBITDA are non-GAAP, unaudited financial measures. A reconciliation between GAAP and the non-GAAP measures presented herein have been provided in the appendix to this presentation.

Future Opportunities
26
A Clear Path for Continued Growth
Scale daily active users and revenue via marketing. Continue to grow retention rates and average revenue per daily active user.
Launch new leading mobile franchises that can be #1 or #2 within their categories.
Re-engage users and maximize revenue with personalized offers, gameplay and communication.
Strategic growth opportunities beyond organic growth.
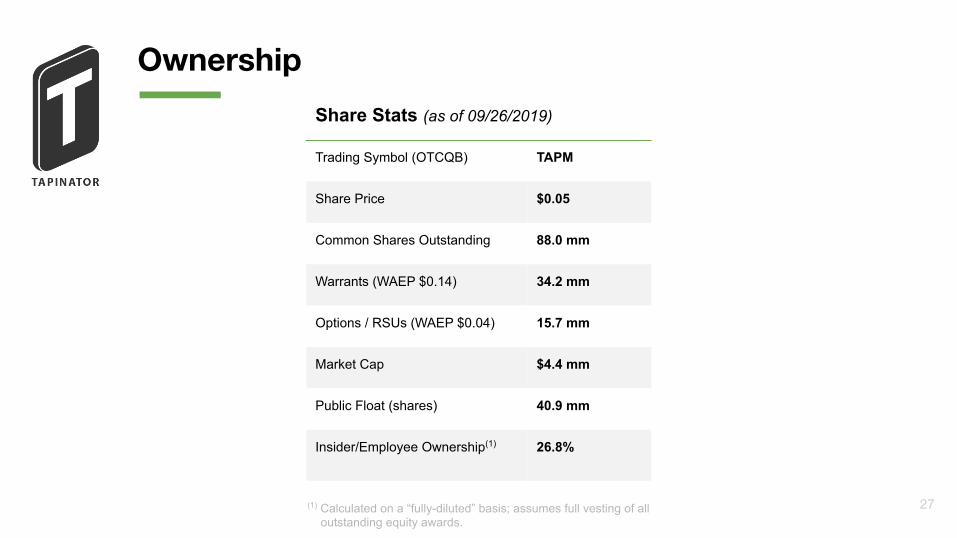
Ownership
27
Share Stats (as of 09/26/2019)
Trading Symbol (OTCQB) TAPM
Share Price $0.05
Common Shares Outstanding 88.0 mm
Warrants (WAEP $0.14) 34.2 mm
Options / RSUs (WAEP $0.04) 15.7 mm
Market Cap $4.4 mm
Public Float (shares) 40.9 mm
Insider/Employee Ownership(1) 26.8%
(1) Calculated on a “fully-diluted” basis; assumes full vesting of all outstanding equity awards.
Investment Highlights
28
Why We’re Going to Win
Large and growing market
Best-in-class, diversified portfolio
Highly efficient studio model
Strong growth and projected performance
Experienced management team
Highly scalable products
1| 2| 3|
4| 5| 6|

Thank You
29
For more information, go to:
http://tapinator.com/investors

Appendix
30
Reconciliation of GAAP to Non-GAAP results
($ in thousands, unaudited) 2018Six Months
Ended 06/30/18Six Months
Ended 06/30/19
Revenue $2,872 $1,622 $2,159
Change in Deferred Revenue 469 -22 -406
Bookings $3,341 $1,600 $1,752
Category Leading Apps Revenue $1,230 $570 $1,616
Change in Deferred Revenue 470 -20 -405
Category Leading Apps Bookings $1,700 $550 $1,211

Appendix
31
Reconciliation of GAAP to Non-GAAP results
($ in thousands, unaudited) 2018Six Months
Ended 06/30/18Six Months
Ended 06/30/19
Net Income (Loss) -$2,996 -$1,473 -$925
Interest Expense, net 132 135 -2
Tax Expense 7 4 -
Amortization of Capitalized Software Development 614 271 341
Depreciation and Amortization of Other Assets 10 5 3
Impairment of Capitalized Software 320 - -
Amortization of Debt Discount 188 188 -
Stock-Based Compensation Expense 1,857 1,040 809
Adjusted EBITDA $132 $170 $226