international scientific publications...any paper submitted to the journal of international...
TRANSCRIPT

JOURNAL OF
International Scientific Publications:
Economy & Business, Volume 6, Part 4
Peer-Reviewed Open Access Journal
Published at:
http://www.scientific-publications.net
Published by Info Invest Ltd
www.sciencebg.net
ISSN 1313-2555, 2012, European Union

Journal of International Scientific Publication: Economy & Business, Volume 6, Part 4
ISSN 1313-2555, Published at: http://www.scientific-publications.net
2 Published by Info Invest, Bulgaria, www.sciencebg.net
Advisory Editor
Marijan Cingula, Croatia
Co–Editor in Chief
Mirela Cristea, Romania
Executive Secretary
Ekaterina Kodenko, Hungary
Editorial Board
Ambuj Gupta, India
Ahmet Kara, Turkey
Alenka Kavkler, Slovenia
Dimitrios Maditinos, Greece
Efstathios Dimitriadi, Greece
Eva Borszeki, Hungary
Laura Vasilescu, Romania
Ljerka Cerovic, Croatia
Mart Sorg, Estonia
Manoranjan Sharma, India
Nikolai Raskov, Russia
Nikolaos Theriou, Greece
Oana Gherghinescu, Romania
Pavel Foltin, Czech Republic
Journal of International Scientific Publication: Economy & Business, Volume 6, Part 4
ISSN 1313-2555, Published at: http://www.scientific-publications.net
3 Published by Info Invest, Bulgaria, www.sciencebg.net
Soeren Dressler, Germany
Sorin Domnisoru, Romania
Rustem Nureev, Russia
Renata Novakova, Slovakia
Toma Sorin, Romania
Yerlan Abil, Kazakhstan
Vladan Holcner, Czech Republic
Zeman Zoltan, Hungary
Journal of International Scientific Publication: Economy & Business, Volume 6, Part 4
ISSN 1313-2555, Published at: http://www.scientific-publications.net
4 Published by Info Invest, Bulgaria, www.sciencebg.net
Published in Association with Science & Education Foundation.
Any paper submitted to the Journal of International Scientific Publications:
Economy & Business - should NOT be under consideration for publication at
another journal. All submitted papers must also represent original work, and
should fully reference and describe all prior work on the same subject and
compare the submitted paper to that work.
All research articles in this journal have undergone rigorous peer review, based
on initial editor screening and anonymized refereeing by at least two referees.
Recommending the articles for publishing, the reviewers confirm that in their
opinion the submitted article contains important or new scientific results.
The authors of the articles bear the responsibility for their content.
When quoting the articles their author and edition should be mentioned.
It is not allowed the edition of the scientific articles to be copied, multiplied and
distributed with the purpose of trade without the permission of the editor.

Journal of International Scientific Publication: Economy & Business, Volume 6, Part 4
ISSN 1313-2555, Published at: http://www.scientific-publications.net
5 Published by Info Invest, Bulgaria, www.sciencebg.net
SSESSMENT OF THE CONDITION OF PRIMARY HEALTH CARE IN BULGARIA
Tihomira Zlatanova1, Ralitsa Zlatanova-Velikova2, Tsvetelina Petrova-Gotova3
1Medical University – Sofia, Faculty of Public Health, Department of Health Economics,
1527 Sofia, Bulgaria, E-mail: [email protected] University – Sofia, Faculty of Public Health, Department of Health Policy and
Management, 1527 Sofia, Bulgaria, E-mail: [email protected] University – Sofia, Faculty of Public Health, Department of Health Economics,
1527 Sofia, Bulgaria, E-mail: [email protected]
Abstract
The article presents and analyzes four key characteristics necessary for the proper functioning ofprimary health care: accessibility, continuity, complexity and coordination. Accessibility is consideredin three aspects - geographic, organizational and financial, as are the particulars of the Republic ofBulgaria and analyzed legal documents related to the problem. Continuity is discussed based onexisting regulations in the country. As regards the other two key features is showed on the viewpoint ofthe authors and their current status in primary care.
Key words: assessment, primary health care, accessibility, continuity, complexity, coordination
The features of the primary health care in the various countries are different. There are many differentdefinitions of the components of the primary healthcare assistance. Regardless of this the entire andgood developed system of the Primary health care should meet the following requirements:
The primary health care is at the level of the healthcare system, on which there is done the primarycontact of all new needs and problems related to the health of the patient, it ensures orientatedtowards the patient (and not only for the disease) care for a long period of time, it providescooperation with most of the diseases, with the exception of very rare and unusual situations, and thisis the level, on which one coordinates and integrates the given cares, with the other levels of thesystem of the healthcare by other experts, too (Starfield, B.,1998).
The scheme of assessment of the primary health care (Figure 1) on grounds of which one develops thetools for evaluation, includes four functions of the healthcare system /management, generation ofresources, funding and providing help/, combined with four key features of the primary healthcareservices, which are part of the set of services, which is to be seen from the above provided definition.
We are going to present a short analysis of the four key features necessary for the proper functioningof the primary health care and we are going to give examples for the performance of these features inBulgaria.

Journal of International Scientific Publication: Economy & Business, Volume 6, Part 4
ISSN 1313-2555, Published at: http://www.scientific-publications.net
6 Published by Info Invest, Bulgaria, www.sciencebg.net
Fig. 1. Scheme to assess the status of primary health care
Availability of services
In fact the access to healthcare services could be defined on grounds of how easily one could getmedical assistance (Kelley E, Hurst J.,2006). In another way it could be determined as "ability for thepatient to get assistance where and when this is necessary". There are different obstacles – withphysical, mental, social and cultural or financial nature, which limit the availability. In the scheme oftools for assessment of the primary health care /PHC/ there are also included:
geographical limitations (Distance to the medical institutions-ambulatories or distribution ofthe general practice = geographical access),
factors, related to the organization of PHC (hours of work, remote consulting – on phone, duetime = organizational access),
as well as for costs, made by the patient (for sharing of the costs, mutual payment = financialaccess).
According to data from the Ministry of Healthcare /from January 2011/ 582 809 Bulgarian citizenslive at places, where there is shortage of general practitioners. This is the population of the townsand villages, to which there is not enough interest from the part of the general practitioners. In factthese patients are not left without a general practitioner, they have usually chosen doctors from otherpractices, but actually they are deprived of quick access to medical services, because the doctorvisits the village in particular days or the patients should travel long, in order to reach the doctor’scabinet. This situation puts the question about the equal rights of the patients - one of the biggestvalues of the European Union, which our healthcare system also should observe and provide for.
Journal of International Scientific Publication: Economy & Business, Volume 6, Part 4
ISSN 1313-2555, Published at: http://www.scientific-publications.net
7 Published by Info Invest, Bulgaria, www.sciencebg.net
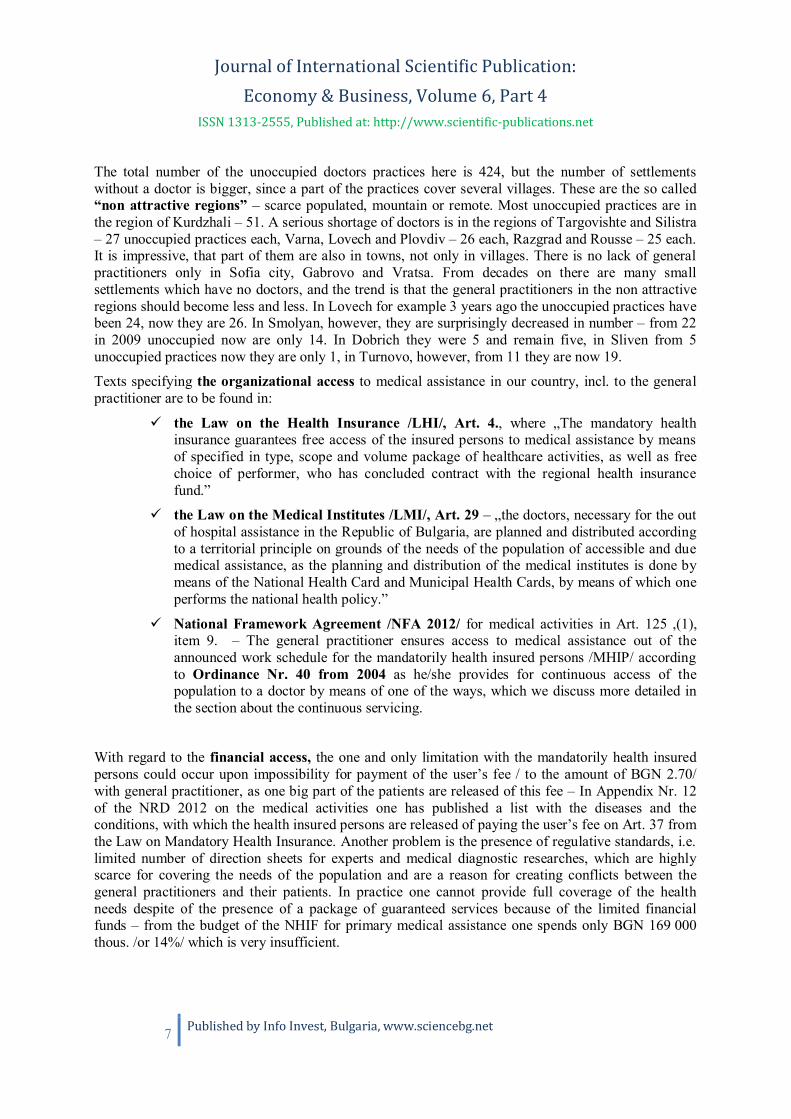
The total number of the unoccupied doctors practices here is 424, but the number of settlementswithout a doctor is bigger, since a part of the practices cover several villages. These are the so called“non attractive regions” – scarce populated, mountain or remote. Most unoccupied practices are inthe region of Kurdzhali – 51. A serious shortage of doctors is in the regions of Targovishte and Silistra– 27 unoccupied practices each, Varna, Lovech and Plovdiv – 26 each, Razgrad and Rousse – 25 each.It is impressive, that part of them are also in towns, not only in villages. There is no lack of generalpractitioners only in Sofia city, Gabrovo and Vratsa. From decades on there are many smallsettlements which have no doctors, and the trend is that the general practitioners in the non attractiveregions should become less and less. In Lovech for example 3 years ago the unoccupied practices havebeen 24, now they are 26. In Smolyan, however, they are surprisingly decreased in number – from 22in 2009 unoccupied now are only 14. In Dobrich they were 5 and remain five, in Sliven from 5unoccupied practices now they are only 1, in Turnovo, however, from 11 they are now 19.
Texts specifying the organizational access to medical assistance in our country, incl. to the generalpractitioner are to be found in:
the Law on the Health Insurance /LHI/, Art. 4., where „The mandatory healthinsurance guarantees free access of the insured persons to medical assistance by meansof specified in type, scope and volume package of healthcare activities, as well as freechoice of performer, who has concluded contract with the regional health insurancefund.”
the Law on the Medical Institutes /LMI/, Art. 29 – „the doctors, necessary for the outof hospital assistance in the Republic of Bulgaria, are planned and distributed accordingto a territorial principle on grounds of the needs of the population of accessible and duemedical assistance, as the planning and distribution of the medical institutes is done bymeans of the National Health Card and Municipal Health Cards, by means of which oneperforms the national health policy.”
National Framework Agreement /NFA 2012/ for medical activities in Art. 125 ,(1),item 9. – The general practitioner ensures access to medical assistance out of theannounced work schedule for the mandatorily health insured persons /MHIP/ accordingto Ordinance Nr. 40 from 2004 as he/she provides for continuous access of thepopulation to a doctor by means of one of the ways, which we discuss more detailed inthe section about the continuous servicing.
With regard to the financial access, the one and only limitation with the mandatorily health insuredpersons could occur upon impossibility for payment of the user’s fee / to the amount of BGN 2.70/with general practitioner, as one big part of the patients are released of this fee – In Appendix Nr. 12of the NRD 2012 on the medical activities one has published a list with the diseases and theconditions, with which the health insured persons are released of paying the user’s fee on Art. 37 fromthe Law on Mandatory Health Insurance. Another problem is the presence of regulative standards, i.e.limited number of direction sheets for experts and medical diagnostic researches, which are highlyscarce for covering the needs of the population and are a reason for creating conflicts between thegeneral practitioners and their patients. In practice one cannot provide full coverage of the healthneeds despite of the presence of a package of guaranteed services because of the limited financialfunds – from the budget of the NHIF for primary medical assistance one spends only BGN 169 000thous. /or 14%/ which is very insufficient.

Journal of International Scientific Publication: Economy & Business, Volume 6, Part 4
ISSN 1313-2555, Published at: http://www.scientific-publications.net
8 Published by Info Invest, Bulgaria, www.sciencebg.net
Continuity of the services
An important feature of the primary medical insurance is the fact, that the interventions directedtowards protection of the health of the patient should be in a long-term plan and they should beunderstood as successful treatment/ healing. The generic term of the continuity is “agreed managementof the patient from one visit to another” (Starfield B et al., 1976). WHO /the World HealthOrganization/ offers a broader definition, which takes into consideration also (a possible) participationof different parties, supplying the healthcare services. The continuity is described as “the possibility toengage the corresponding parties which provide services, in order to propose incentives, which shouldbe continuous in a short-term plan, regardless of the fact whether they are available for one and thesame group of persons or for various groups of persons (cross-linked succession), there should be acontinuous series of contact for a long period of time (long-term succession) "( www.euro.who).
There have been distinguished the various levels of continuity of the cares (Saultz JW, 2003):
First level – Continuity of information, related with the performance of medical and social history forthe diseases of each patient, at hand for every person working in the field of healthcare, taking part inhis/her treatment. This could be done by means of building a single information system in thehealthcare system, which in Bulgaria is still not available.
The second level refers to the long-term succession, specifies the place, where the patient continuouslyreceives medical cares from the part of the organization in an accessible and well known environment.
The third level – interpersonal succession which is determined as the continuous personal relationsbetween the patient and the person, providing the services, is characterized with trust and respect(Saultz JW.,2003).
Besides in their work (Reid et al.) (Reid, R., Haggerty, J, McKendry, R., 2002), the authors suggestanother level, called continuity of the reference: provisioning of duly and supplementary serviceswithin a plan for management. The scheme of the tools for evaluation of the PHC /primary medicalassistance/ includes information, long-term and interpersonal continuity of the medical assistance.
In Bulgaria the continuity of the services, provided by the general practitioners, is regulated by theNational Framework Agreement, the Law on the Health Insurance. According to NFA 2012 formedical activities in art. 125,(1), item 9. the general practitioner provides access to medical assistanceout of the announced work schedule for MHIP according to Ordinance Nr. 40 from 2004, as he/sheprovides access of the population to doctor by means of one of the following ways:
by means of a cabinet on duty of the group practice for primary out of hospital medicalassistance, in which it is co-founder;
on contract with another medical institute according to art. 8 from the LMI, which has openeda cabinet on duty and which is not more than 35 km away from the location of the practice ofthe general practitioner;
individually by means of 24-hour provisioning of advice on the phone, in the ambulatory or inthe home of the patient upon decision of the general practitioner himself;
for the municipalities, which are in the rural and mountainous regions
Coordination of servicesAs far as the PHC is main point of the medical services, often the general practitioners are engagedwith the distribution of the flow of patients towards other levels of care. The coordination of the
Journal of International Scientific Publication: Economy & Business, Volume 6, Part 4
ISSN 1313-2555, Published at: http://www.scientific-publications.net
9 Published by Info Invest, Bulgaria, www.sciencebg.net
primary medical assistance is an important factor and element of the efficiency of the healthcareservices and the entire system. Potential coordination problems could be typical with the coordinationbetween the primary and secondary cares or between the treatment and the non medical services(public health), directed towards the promotion of healthy way of life (Boerma WGW, 2006).
As a whole the coordination could be defined as “method of social cooperation between the differentprocesses and is directed towards provisioning of maximum benefit for all"(9). In particular it could bespecified as “characterization of the services, providing continuous planned treatment for the separatepatients. Each plan should include clear targets and appropriate and efficient interventions.
In Bulgaria in fact there is no coordination of the services and the link between the various levels ofthe healthcare assistance is broken /it is done only by means of direction sheets/.
ComplexityThe complexity could be determined as provisioning of a full set of medical services directly by adoctor from the primary medical assistance or by other persons, providing services or a specificorganization for such services at another place (Starfield B., 1991). In the PHC the complexityincludes the service from therapeutic, rehabilitation and supporting measures, focuses on thepromotion of the health and the prophylaxis of the diseases (Boerma WGW, 2006, 2003). Thecomplexity of the service is not only a specific set of services, but also the conditions, equipment andfacilities, as well as the level of skills and the professional expertise of the persons, providing medicalservices. Despite this there is important also the social orientation of the working in the primarymedical assistance. All these parameters are taken into consideration when developing the tools forassessment of PHC.
In Bulgaria the complexity of the services, provided by the general practitioners, is regulated inOrdinance Nr. 40 for specifying the main package of healthcare activities, guaranteed by the budget ofthe national health insurance fund /NHIF/. This package includes the following main types ofactivities:
Health and information activities
Health promotion
Prophylaxis of the diseases
Dispanserization
Control of the infectious diseases
Diagnostic and treatment activity
Other activities related to the diagnostics and treatment
Activity of Medical Expertise
Providing of access to medical assistance out of the announced work schedule
In conclusion we could say, that even though they are presented in different normative documents, thefour key features needed for the proper functioning of the primary health care: availability, continuity,complexity and coordination, it is necessary that they should be more detailed investigated andpresented in the Bulgarian conditions, in order for the biggest part of the healthcare problems to besolved at the level of PHC still in the earliest stage of the disease, with which one shall avoid the

Journal of International Scientific Publication: Economy & Business, Volume 6, Part 4
ISSN 1313-2555, Published at: http://www.scientific-publications.net
10 Published by Info Invest, Bulgaria, www.sciencebg.net
costly hospital treatment and shall achieve more complete satisfaction of the patients from the primarymedical assistance.
REFERENCES
1. Boerma WGW. Coordination and integration in European primary care. In: Saltman RB, RicoA, Boerma WGW, eds. Primary Care in the Drivers Seat? Organizational reform inEuropean primary care. Maidenhead, Open University Press, 2006(http://www.euro.who.int/Document/E87932_chapt1.pdf, accessed 8 September 2008).
2. Boerma WGW. Profiles of general practice in Europe. An international study of variation inthe tasks of general practitioners. Utrecht, NIVEL, 2003 (http://www.nivel.nl/pdf/profilesof-general-practice-in-europe.pdf, accessed 5 September 2008).
3. Health Evidence Network. What are the arguments for community-based mental health care?Annex 2. Key principles for balanced community-based mental health services [web site].Copenhagen, WHO Regional Office for Europe, 2004
(http://www.euro.who.int/HEN/Syntheses/mentalhealth/20030903_1, accessed 12 December2008).
4. Kelley E, Hurst J. Health care quality indicators project. Conceptual framework paper. Paris,Organisation for Economic Co-operation and Development, 2006 (OECD Health Workingpapers no. 23) (http://www.oecd.org/dataoecd/1/36/36262363.pdf, accessed 8 September2008).
5. Reid, R., Haggerty, J, McKendry, R. Defusing the confusion: Concepts and measures ofcontinuity of healthcare. Ottawa, Canadian Health Services Research Foundation, 2002(http://www.chsrf.ca/funding_opportunities/commissioned_research/projects/pdf/defusing_e.pdf, accessed 10 December 2008).
6. Saultz JW. Defining and measuring interpersonal continuity of care. Annals of FamilyMedicine, 2003, 1:134-143 (http://www.annfammed.org/cgi/content/full/1/3/134, accessed 10December 2008).
7. Starfield B et al. Continuity and coordination in primary care: their achievement and utility.Medical Care, 1976, 14:625-636.
8. Starfield B. Primary care and health. A cross-national comparison. Journal of the AmericanMedical Association, 1991, 266:2268-2271.
9. Starfield, B. Primary Care. Balancing health needs, services and technology. New York,Oxford University Press, 1998.
10. Todorova D., Negotiating care package in outpatient primary care. Dissertation, Sofia, 2005
11. http://www.euro.who.int/__data/assets/pdf_file/0017/91610/E92661R.pdf
12. http://www.mh.government.bg/
Journal of International Scientific Publication: Economy & Business, Volume 6, Part 4
ISSN 1313-2555, Published at: http://www.scientific-publications.net
11 Published by Info Invest, Bulgaria, www.sciencebg.net
OPTIMIZED APPROACH TO FUNDING PRIMARY OUTPATIENT HEALTH CARE
IN REPUBLIC OF BULGARIATsvetelina M. Petrova-Gotova, Tihomira Zl. Zlatanova
Medical University – Sofia, Faculty of Public Health, Department of Health Economics,
1527 Sofia, Bulgaria, E-mail: [email protected]
Abstract
The choice of model for financing of healthcare system in a country does not directly affect the qualityand the patient’s satisfaction by healthcare system. It depends to a greater degree of organization ofthe system and its ability to meet user’s needs.
In recent years the condition of outpatient healthcare model continuously gets worse. Main reasonsfor that are insufficient funds and lack of changes in regulations and operating rules. Changed manythings of general practitioner’ work. Along with the usual treatment, general practitioners have todeal with management, accounting as well must be familiar with regulations related to their work.
Key words: financing, general practitioners, primary outpatient health care.
The choice of model for financing of healthcare system in a country does not directly affect the qualityand the patient’s satisfaction by healthcare system. It depends to a greater degree of organization ofthe system and its ability to meet user’s needs.
There is a steady trend of distrust in the healthcare system among people and alienation from it.Bulgarians are not yet convinced that true reform can only be carried out with their participation andthat health is their greatest asset. And yet many of them see it more as an obligation of the state, not asa priority or as their own capital which increases the number of their days in healthy condition andthus their ability to work and earn more.
The Bulgarian Industrial Association insists on carrying out a preliminary analysis of the effectivenessof the operation of the entire healthcare system and on the basis of its results to proceed with a reform,which covers the whole system.
For the past five years the expenditure on healthcare in Bulgaria has increased about 1.5 times andfrom approximately BGN 2 billion it has reached BGN 3.5 billion, whereas the Gross DomesticProduct (GDP) percentage actually decreases [10].
The Primary Outpatient Health Care (POHC) is the basic health care based on practical, scientificallysound and socially acceptable methods and technologies that are universally available to any person,family and the society.
In recent years, its condition has been steadily deteriorating. The main reasons are insufficient fundsand lack of changes in regulations and operating rules stipulated in the National Framework Contract(NFC) and the decisions of the Management Board of the National Health Insurance Fund (NHIF).
Changed many things of general practitioner’ work. The hospitals and the medical practices havebecome companies and along with the traditional treatment, the General Practitioners (GPs) also have

Journal of International Scientific Publication: Economy & Business, Volume 6, Part 4
ISSN 1313-2555, Published at: http://www.scientific-publications.net
12 Published by Info Invest, Bulgaria, www.sciencebg.net
to deal with management, accounting, as well as they should be familiar with the regulations related totheir work (such as National Framework Contract, Health Insurance Act, Health Act, Medical-Treatment Facilities Act, etc.). Computerization has been incorporated in their work; in addition,modern medicine is developing quite rapidly and requires that a doctor should constantly specialize inorder to offer their patients best quality and treatment.
A part of the budget earmarked for primary outpatient health care, in the opinion of many GPs, isunlawfully reserved for capitation which is to be paid in case the health uninsured persons restore theirhealth insurance rights. This number of uninsured persons is constantly growing without prospects fordownward trend. In 2007 it comes to 1.2 million citizens and at the end of December 2011 - about1.62 million (according to a survey of 94 medical practices in nine districts carried out by the NationalAssociation of GPs) [7].
Currently, the treatment of this population is covered by the budget of the medical institutions and thehealth insured persons. Therefore, the opinion of doctors, patients and employers states that theuninsured persons should be entered in a special public register [9].
They constitute a huge figure and it is imperative to think over the reasons that make these people notpay their health insurance contribution. We should realize that some of them probably do so becausethey are not confident that the health system is able to offer really good medical services [10].
According to the GPs, the funds provided for the uninsured have become a hidden “reserve” or“balance” within the budget of POHC. The result is that in 2007 POHC implements its activity withina budget framework of 113 million as it was in 2003-2004, and despite the announced increase by 5%,there is in fact a decrease in the budget by 11%. The POHC budget as a percentage of the NHIFbudget for 2007 is 7.48%, and for 2008 - 7.46% [2; 4].
The share of costs for POHC in the total public health expenditure is as follows: for 2007 - 4.8%, 2008- 4.6%, 2009 - 5.1% [7]. The disbursement for POHC in 2008 is BGN 131 162 889, in 2009 – BGN134 724 896. BGN 169 million has been provided for POHC for 2012.
For the period 2003 - 2008 there is no year in which the POHC budget has been increased bypercentage greater than or equal to the growth of inflation or to the growth of minimum wage. In 2004the growth of POHC budget is 0, and in the subsequent years it substantially falls behind comparedwith that of other types of medical services. For the period 2003 - 2008 the growth rate is 22% at rateof inflation over the same period equal to 50.2% and minimum wage above 63% (Figure 1).
Taking into account the unapproachable funds blocked in the aforementioned hidden "balance", therising costs of electricity, heating, consumables, equipment, fuel and insurance burden which are at theexpense of the GPs, there is a bright tendency to form a significant shortfall in the funding of POHC[3]. Such financial policy is unacceptable against the manifested shortage of GPs (inactive practices inmany areas of the country), the need to improve the necessary equipment and to enhance thequalification [3].
The review of international practice shows that almost all European countries use a combination of thethree main components of remuneration in the sector of primary care in different proportions.Similarly, in Bulgaria the payment for POHC is based on a combination of capitation, performanceand user fees.

Journal of International Scientific Publication: Economy & Business, Volume 6, Part 4
ISSN 1313-2555, Published at: http://www.scientific-publications.net
13 Published by Info Invest, Bulgaria, www.sciencebg.net
Figure 1. Growth of the inflation and the budget to POHC for period 2003-2008
Figure 2. Payment per capita as a percentage of the total remuneration of GPs

Journal of International Scientific Publication: Economy & Business, Volume 6, Part 4
ISSN 1313-2555, Published at: http://www.scientific-publications.net
14 Published by Info Invest, Bulgaria, www.sciencebg.net
Table 1. Volumes and prices of activities in Primary health care for 2012
In many cases the revenues of GPs depend on the number of health insured persons (sometimes givenfor granted, rather than choice, as is the situation in rural areas) and on the reported documents ratherthan on the actual performance. The payment per capita as a percentage of the total remuneration ofGPs decreased from 2003 until now, but remains the main method of getting funds.
It forms about 60% of the total structure of the costs for the primary health care (Figure 2, Table 1) [1,5]. This type of payment largely discourages GPs and reduces their capabilities, which in turn lowersthe quality of medical treatment.
The remaining 40% covers payment for services provided by GPs (including the prevention andmonitoring of patients with chronic diseases). The number of completed activities for the year (thisincludes all activities carried out by GPs – general examinations of the obligatory health insuredpersons (OHIP), prevention, immunizations, maternal health care, dispensary observation, occasional

Journal of International Scientific Publication: Economy & Business, Volume 6, Part 4
ISSN 1313-2555, Published at: http://www.scientific-publications.net
15 Published by Info Invest, Bulgaria, www.sciencebg.net
visits) has significantly reduced - from 31 659 151 in 2007 to 26 073 499 in 2009. The same applies tothe average monthly number of examinations within the year - from 2 878 105 in 2007 to 2 172 792 in2009 (Table 2) [8].
Capitation’s key aspect is that payment is not connected with the resources used by the providers orthe volume of services offered by them. Consequently particular financial risk for the loss occurrenceis transferred from the funding institution to the medical aid provider. The share of doctors who haveto do more activities with less money because the expenses are running the practices continue to growat a faster pace than revenues.
Table 2. Main indicators of activities and workload of the General practitioners for the period 2007-2009

Journal of International Scientific Publication: Economy & Business, Volume 6, Part 4
ISSN 1313-2555, Published at: http://www.scientific-publications.net
16 Published by Info Invest, Bulgaria, www.sciencebg.net
Other factors that should be taken into consideration and exacerbate the financial situation of the GPsinclude the large number of people exempted from user fees and the greatly inflated and complicatedvolume of preventive medical examinations of people aged over 18 (which makes the examinationinefficient in terms of economics and time). For example, in a GP’s patient list about 65% of theexaminations are of patients exempted from user fees, i.e. the largest part of health services areprovided to not working - people aged over 65 and children, for whom mandatory services areallocated. They are health insured by the state which guarantees them the right to use medical services.Statistics show that these groups, especially people aged over 65, consume 3.5 to 6 times moremedical services, which in many cases exceeds the funds provided for them and does not generateincome but a negative financial result for the contractor.
It should be noted that health insurance contributions for workers come to the average BGN 53 permonth, whereas for people insured by the state - only BGN 19 [6].
I.e. 67% of the funds received in the NHIF come from health insurance contributions (or in most casesthese are employers' contributions), while the state pays only 33% for health insurance for pensionersand children [9].
The Association of GPs in Bulgaria indicates that the introduction of user fee ten years ago defined itsfunction - to regulate the use of medical services and to form a co-financing arm for outpatientpractices and hospitals and for this reason they demand that the exempted amounts be refunded by theinstitution which has granted this privilege.
All this places the GPs in constantly deteriorating financial conditions and microclimate of workingenvironment, and as the results of several surveys show it results in impossibility to release funds forinvestment and reinvestment in:
- Material-technical base (advanced outpatient centres, equipment, etc.);
- Post-graduate specialization and participation in maintaining and increasing the level ofqualification of doctors and their associates - nurses, midwives and other staff;
- Inability to increase the amount of remuneration of the employees in the team of the GPs and theformation of extended teams (more than one nurse, for example social worker, technical secretary,etc.). Often a problem arises even with the appointment of the nurse required pursuant to the NationalFramework Contract.
- Financial instability and inability to use loans (e.g. for the purchase of new equipment) in thebackground of constantly declining revenues and lack of options for return on investment andrealization of additional revenues.
CONCLUSION
We can say that the mixed system of financing of POHC, combining payment based on performanceand payment for registered health insured persons most adequately reflects the specificity of primarymedical care, which has been confirmed by the surveys carried out, the results of which indicate thatthe highest percentage of GPs approve this method of financing. Therefore, it is appropriate that thissystem be maintained in the future and in order to optimize its financing we offer the followingapproaches:
Journal of International Scientific Publication: Economy & Business, Volume 6, Part 4
ISSN 1313-2555, Published at: http://www.scientific-publications.net
17 Published by Info Invest, Bulgaria, www.sciencebg.net
To increase the payment burden with respect to:
Activities covering the priority national health programs (e.g. child health care, maternalhealth care);
Preventive and dispensary medical activity;
Payment for home visits - here we offer the following payment options:
fixed medical examination fee + cost of transport;
price, determined by the market;
fee equal to about 10% of the minimum wage.
Thus, the GPs will be better motivated to visit their patients.
Payment based on the length of service and on the acquired qualification;
More streamlined funding of preventive medical check-ups of the OHIP (ECG-paper, tests ofblood sugar using glucometer, urine test strips, test for occult haemorrhage are at the expense of theGPs);
Introduction of financial incentives for work in group practices;
Increase in the wages for work in practices with adverse work environment;
Payment for information and administrative medical services;
For patients with severe disabilities and numerous illnesses;
This would stimulate the GPs to increase the quantity and quality of their work.
Allocation of a larger percentage of the NHIF budget for outpatient health care;
Increase in the amount of payments from the National Health Insurance Fund or the POHCbudget to include certain benchmarks as a percentage of the total NHIF budget (e.g. 15-20%), as it isin other countries or 10-15% of the state healthcare budget.
Establishment of at least one competitive Health Insurance Fund;
Providing a statutory option for the GPs to conclude contracts with voluntary health insurancefunds to serve their customers;
Provision of additional financing from the state;
Provided that the doctors have the necessary qualifications for certain services not included inthe package, they should be given the right to carry out them in return for a fee. Thus, on the one hand,they will be able to increase their revenues and will be more satisfied, and on the other hand, they willmaintain and develop their professional competence. Only GPs are banned (pursuant to the provisionsof the NFC) to provide services outside of the POHC, which makes them restricted within the saidPOHC budget. The NHIF budget for 2007 includes provisions prohibiting the transfer of unused fundsto another item which means that they could be distributed among GPs. However, such bonusesshould be provided outside the resources required for the implementing and development of theservices, but not savings previously imposed in the budget, according to the National Association ofGPs. It is necessary that the additional payment, needed in the cases when the annual POHC budget isnot utilized, should be linked to the quality of the performance. The fact is that the POHC budget is
Journal of International Scientific Publication: Economy & Business, Volume 6, Part 4
ISSN 1313-2555, Published at: http://www.scientific-publications.net
18 Published by Info Invest, Bulgaria, www.sciencebg.net
funded by a large percentage of priority actions in each healthcare system: prevention of sociallysignificant diseases, continuity of medical care, monitoring and treatment of patients with chronicdiseases, medical prevention of children and immunization of children and adults, etc. [2; 3].
In addition, it would be better if the accountability of the POHC contractors is simplified andfacilitated, and one of the possibilities is the introduction of completely electronic reporting (not onlyXML format, but also of specifications and the introduction of electronic invoices).
Another possibility for increasing the utilization of the POHC budget offered by the NationalAssociation of GPs is the introduction of more diseases to the dispensary services covered by thePOHC, introduction of coefficients to evaluate the services provided to the chronically ills (dispensaryservices), evaluation of qualification, costing of recommended vaccinations, increase of fees for theservices provided by the GPs.
REFERENCES
1. Contract for adoption of volumes and prices of medical assistance 2012 between NationalHealth Insurance Fund and Bulgarian medical union.
2. Petrova-Gotova Ts., Approaches to optimize the funding of the Primary Outpatient HealthCare in Bulgaria, dissertation 2009.
3. Project of budget 2008 for health insurance payments in Primary Outpatient Health Care, june2007, National association of General Practitioners in Republic of Bulgaria.
4. Project of budget 2009 for health insurance payments in Primary Outpatient Health Care,National association of General Practitioners in Republic of Bulgaria.
5. Zlatanova T., The role of the “cost-effectiveness” analysis in the management of PrimaryHealth Care in the Republic of Bulgaria, Journal of International Scientific Publication:Economy & Business, Volume 5, Part 3, 2011, ISSN 1313-2555, p. 303-310.
6. http://www.dnes.bg/obshtestvo/2011/05/10/nad-1-900-000-sa-zdravnoneosigurenite-unas.118258.
7. http://www.dnevnik.bg/bulgaria/2011/12/14/1445575_lichnite_lekari_prebroiha_nad_16_miliona_zdravno/.
8. http://rlkpd.com/pdf/analiz_prognozni_obemi_izvynbolnichna_pomosht.pdf.
9. http://www.tvevropa.com/bg/news/bulgaria/view/60406.
10. http://www.zdrave.net/Portal/WeekGuest/Default.aspx?evntid=cC4yVFx8FE8%3d.
Journal of International Scientific Publication: Economy & Business, Volume 6, Part 4
ISSN 1313-2555, Published at: http://www.scientific-publications.net
19 Published by Info Invest, Bulgaria, www.sciencebg.net
VARIABLES USED BY THE PALESTINIAN BANKS' MANAGERS TO MEASURE THEIR
BANK PERFORMANCESuleiman M. Abbadi, Nour Abu-Rub
Faculty of Administrative & Financial Science, Arab American University , Jenin , Palestine
Email: [email protected], [email protected]
Tel: +972599653688; Fax:+97242510810
Abstract
This paper tries to find the variables that banks managers in Palestine use to evaluate their bankperformance. We used Balanced Scorecard method developed by Kaplan and Norton( 1992) whichuses 4 groups of measures: Financial , customer satisfactions, innovation of product and services, andmeasures to judge commitment, learning, and growth of the employees. We applied these measures toPalestinian Banks using a sample representing 43% of the banks and branches in the West Bank. Aquestionnaire was distributed and filled by both bank managers of head office and branch. The ratiopercentages and independent t-test where used. It was found that Palestinian banks use differentmeasures than banks in other countries. Palestinian Banks use share price and net income as the mostimportant financial measure, number of new customers for customer satisfaction, number of newproducts and services for innovation of product and services and number of seminars, lectures andtraining for judging the commitment, learning and growth of employees. The paper also tested theexistence of statistical differences between foreign and local banks and between head offices andbranches . The hypothesis testing results show mixed results between foreign and local banks andreject most hypothesis between head office and branch, which agrees with the agency problems andthe concentration differences between head office manager and branch manager
Key words: balanced scorecard, customer satisfaction, innovation of products and services, netincome, profit per client, innovation of products and services, return on investment.
1. INTRODUCTION:
Traditionally industrial firms and financial institutions used financial variables to measure themanagement performance, in which management compensation and bonuses depend on thesemeasures. Soon it was discovered that financial measures are temporary and can be manipulatedthough "window – dressing " techniques in favor of the management. For example several banksextended loans at a high rate to unqualified customers, which results in a high profit for the year. Soonmany of those customers default on their borrowings and the bank become obliged to increase its loan/loss provisions, or might go bankrupt. Firms started using additional non-financial measures tosustain their growth and remain in the market, such as: customer satisfaction, credit risk management,motivation to customers such as services after sale, credit, discount….etc ,innovations, new markets tosustain growth. Improvement in product, ……etc. Due to the limitations of financial measurementsystem, several attempts have developed to overcome these limitations. Among these attempts wherethe ( Keegan , et. al. 1989 ) who developed a measurement matrix adding other non-financialmeasures. ( Lynch and Cross 1991 ) developed a SMART Pyramid including other non-financial
Journal of International Scientific Publication: Economy & Business, Volume 6, Part 4
ISSN 1313-2555, Published at: http://www.scientific-publications.net
20 Published by Info Invest, Bulgaria, www.sciencebg.net
variables. The most important is a pioneer article published by the Harvard Business Review in1992 by Robert Kaplan and David Norton called Balanced Scorecard Measures that Drive thePerformance. The model tracks the key elements of a company's strategy from continuousimprovement and partnership to teamwork and global scale. These measure give the managerscomplex information at glance, including financial and operational measures. The Financial measurestell the results of actions already taken and complements it with operational measures on customersatisfaction, internal process, and the organization's innovation and improvement activities. Theseoperational measures are drivers of future financial performance( Kaplan and Norton 1992).
More specifically, the balanced scorecard allows managers to look at their business from four differentangles " perspectives":
1.1."Customer perspective, which measures how customers see us.
1.2.Internal perspective, which emphasize on how can we do better than others.
1.3.Innovation learning perspective, this emphasize on continuing improvement and crating value.
1.4.Financial perspective, which tells us how can we look to shareholders".
If the management have information about the four perspectives then they can improve theirbusinesses, increase their competition , sustain a long term growth and decrease failure( Kaplan andNorton 1992 ).Several firms started using the balanced scorecard techniques to improve theperformance of their businesses. By the end of last century about 50% of American organizations and40% of European firms moved to the new performance measurement system( Frigo and Krumwiede1999 ). Several other studies found almost the same results when they applied their models to top 100firms in the U.S or Europe. Due to the changes in information technology, capital requirements byBasil I and then Basil II, changes in laws and regulations and globalization, financial institutionsstarted using the new techniques to measure and improve their performance. They selected thevariables that affect their business most. ( Rahat, et. al. ) proposed a framework that can be used toexamine changes in performance measurement system in organizations in general and in the bankingindustry in particular. ( Cobb, et. al. 1995 ) developed a model of organizational change and theyincluded the significance of individuals in the change process within their extended model.
Despite these changes traditional performance system are still being used by banks such as Japanesebanks( Hussain and Hoque 2002 ). Another study used the traditional measures is the one by (Alkhatib and Harsheh 2012 ) on the performance of Palestinian banks . They used financial measuressuch as ROA, ROE, Price/Book value, and economic value added. ( Khrawish 2011 ) also usedtraditional financial measures in evaluating the performance of Jordanian banks. Very few studiesexamined the use of the new performance measures in Middle-East banks, among the most recent onesis the study by ( Ahmad et. al. 2011 ), they examined the performance measures used by thecommercial banks in Pakistan within the four perspectives of Balanced Scorecard.
The aim of this study is to examine the performance of Palestinian banks using the four BalancedScorecard model developed by Kaplan and Norton, and to find out to what extant the Palestinianbank managers are aware of these measures and if they use them in evaluating their performance, andwhat are the main variables they mostly use. The paper also aims at testing the differences betweenlocal and foreign banks and between head offices and branches regarding the above measures. The restof the paper is organized as follows: Section 2 discusses the development of the Palestinian financialsector, section 3 overviews the related literature , section 4 discusses the methodology used in ourresearch and then the analysis of the results in section 5, and finally section 6 is a concluding remarks.

Journal of International Scientific Publication: Economy & Business, Volume 6, Part 4
ISSN 1313-2555, Published at: http://www.scientific-publications.net
21 Published by Info Invest, Bulgaria, www.sciencebg.net
2. DEVELOPMENT OF THE BANKING SECTOR IN PALESTINE:
Before the Israeli occupation of the West Bank in 1967, there were 11 banks in Palestine of which 8 inthe West Bank and 3 in Gaza with 30 branches of which 26 were in the West Bank and 4 in Gaza andwas distributed in almost all cities of the West Bank and Gaza ( ESCWA 1987 ) . In 1967 after Israeloccupation of the West Bank, Israeli government closed all banks and frozen all their assets andtransferred all their cash to the Bank of Israel . This sector was one of the most affected by theoccupation during 1967-1993 as their were 180 military orders that aimed at restricting the activitiesof the financial system and closely control it . Soon after the occupation military orders allowed IsraeliBanks to open branches in the West Bank and Gaza which caused to eliminate all financial relationswith Arab Countries. By 1986 there were four Israeli Banks working in the West Bank and Gaza with22 branches (ESCWA 1987). The Israeli banks remained working alone in the West Bank and Gazauntil the Israeli court of justice allowed Bank of Palestine to reopen its two branches in Gaza in 1981.
Israeli banks' activities were very limited as their credit were less than 8% of their assets and theirfunctions were mostly to finance trade, or overdraft for some merchants . Very few Palestinians werewilling to deal with Israeli Banks and their credit facilities were very limited to facilitate trade betweenWest Bank and Israel such as letters of credit or letters of guarantees which were issued to Palestiniansto fulfill their commitment to Israeli firms or merchants at a very high cost (Harris Laurence 1988).This situation remained until 1987 when all Israeli banks were closed because of the Intifada. Thecountry remained without banks during 1987-1993 except Bank of Palestine and Cairo-Amman Bankwhich was allowed to reopen one branch in Nablus in 1986. After the Oslo agreement in September1993 and Paris economic agreement in 1994 and the Israeli – Jordanian agreements in Wadi – Arabain 1994 , Jordanian banks were allowed to reopen their branches closed in 1967. The PalestineMonetary Authority( PMA ) was established in 1995 which was authorized to give licenses toestablish new banks and open new branches and started regulating the Palestinian banks in both WestBank and Gaza . This caused the number of banks to increase gradually to 18 banks with more than200 branches in 2010 , of the 18 banks, 10 are foreign banks( mainly branches of Jordanian banks)with 102 braches and 8 are local banks with 100 branches . In addition there are 154 money changers106 micro finance companies( PMA 2011).
The activities of Palestinian banks have been developing from traditional banking services ofaccepting deposits and giving loans to giving almost all services offered by modern banks. Theiractivities were spread aver all cities and villages of the West Bank and Gaza. Total assets has beengrowing rapidly from less than $500 million in1993 to over $8.5 billion in 2010, and their customersdeposits were growing in the same way from $300million to about $6.8 billion during the same period.
The growth of deposits has caused an improvement in the credit facilities that reached $2.9 billionrepresenting 42.4% of total deposits last year, directed mostly to the private sector to finance trade,construction, and other sectors. Net profits of the banking sector has been also improving to reachabout $140 million in 2010. return on average equity(ROE) has increased to 17.5%, while ROAincreased to 2.1% in 2010. these ratios are acceptable and within the range of regional returns of thebanks in the area. Despite the instability that has characterized both West Bank and Gaza during thepast decade, Palestinian banking sector also showed improvement in the area of non-performing loanswhich has been declining to 3.1% of total loans in 2010. these are below the average in neighboringcountries The improvement in the banking sector has been reflected in banks' net equity whichincreased to $1.1 billion, part of which was due to the PMA law to increase the minimum bank capitalfrom $10 to $2o to $50 million which was enforced recently in order for the banks to comply withBasil III.( PMA 2011).

Journal of International Scientific Publication: Economy & Business, Volume 6, Part 4
ISSN 1313-2555, Published at: http://www.scientific-publications.net
22 Published by Info Invest, Bulgaria, www.sciencebg.net
3. LITERATURE REVIEW:
finance and bank management texts told us that in order to understand how well a bank is doing weneed to start looking at the bank financial variables such as operating income and operating expensesto get net income. But sometimes net income does not give us an idea of how well the bank is doing,because it does not adjust for the bank size, thus it makes it hard to compare between banks. So agood measure of bank profitability that correct for the size of the bank is the return on assets(ROA).But bank owners are concerned more of the return on their equity investment so a better measure forthem is the (ROE). In addition there are several financial measures such as net interest margin, netoperating margins, earnings per share, asset utilization ratio……etc. for more details see ( Rose andHudgins PP171-180). All these measures can be summed into a single variable called financialmeasures. Several writers used these measures to find out the performance of the banking sector intheir countries. For example ( Tarawneh 2006) used the financial measures to compare theperformance of Omani banks and he found out that profitability performance is not a result of highercapital or larger deposits, credit or total assets. (Khrawish 2011) used internal and external factors, ofwhich all financial factors to find the performance of Jordanian banks. He found that there is asignificant and positive relationship between ROE and the bank size, total liability to total assets, netinterest margin, exchange rate, and loans to total assets. And a negative relationship between ROE andannual growth rate of GDP and inflation rate. Finally (Alkhatib and Harsheh 2012) used internalmeasures such as ROA, market measures such as price to book value, and economic measures such aseconomic value added to measure the financial performance of Palestinian banks. They found thatthere is an effect(statistically significant) of the size of bank, credit risk, operational efficiency andasset management on the financial performance of Palestinian commercial banks.
Several other studies used the financial performance to compare between banks in the same countrysuch as the study of(Hanif et. al.2012) who compare the performance of conventional banks andIslamic banks in Pakistan. He used internal and external factors. The external factors include consumerbehavior and perception about both Islamic and conventional banks. While internal factors includeprofitability, liquidity, credit risk and solvency. He finds that conventional banks were better thanIslamic banks in terms of profitability and liquidity, while Islamic banks were better in credit riskmanagement and solvency. Customers motivation factor are the location and shari'a compliance whilein case of conventional banks is the wide range of product and services. Another study tested therelationship among corporate governance, risk management, and bank performance in Indonesianbanking sector using a Triangle Gap Model. They found that the relationship between corporategovernance and bank performance are sensitive to the type of ownership. They also found that foreignbanks have better implemented good corporate governance than have joint-venture owned banks, state– owned banks and private domestic – owned banks. Finally they found an interrelationship betweenrisk management and bank performance (Tendelilin et. al. 2007). A more recent study tested theeffect of capital structure on the performance of Palestinian banks found that there is a goodrelationship between ROA and market value and between ROA and efficiency, and a weak correlationbetween loans and return on equity and loans and market value. (Abbadi and Abu-Rub 2012)
Even though financial measures are still widely used to measure the performance of banks andfinancial institutions ,but due to the development in information technology, capital requirements,changes in laws and regulations and globalization, financial measures become insufficient to measurethe performance of banks and other firms. New measurement performance systems were developedduring the last two decades, the most famous was the Balanced Scorecard Measures developed byKaplan and Norton. They used four measures in four different areas, namely, from the point of view ifthe customer, internal perspective , innovation and learning perspective and finally financial

Journal of International Scientific Publication: Economy & Business, Volume 6, Part 4
ISSN 1313-2555, Published at: http://www.scientific-publications.net
23 Published by Info Invest, Bulgaria, www.sciencebg.net
perspective( Kaplan and Norton 1992 ). Several studies used this model to test the performance offirms and banks, while some other studies started developing their own model to include relevantvariables to evaluate their businesses or banks .
(Ahmed et. al.2011)used the Balanced Scorecard to evaluate the commercial banks in Pakistan. Theyused to test the four perspectives of the model and they found out that commercial banks in Pakistanuse return on investment, growth in revenues and profit per account as the main financial measures.They use the number of complaints number of new customers, and customer appreciations to judgethe level of customers satisfaction. Measurement of internal process they use improvement in responsetime to customer quarries, new products and services and reduction in waiting time . finally measuresused to judge the commitment, learning and growth of the employees are the feedback fromemployees, suggestions offered by employees , overhead turnover and employees training. Severalstudies tried to tackle a certain element of the banking sector and use non financial measures such as(Lin P and Mei A. K. 2006) who tried in their study to solve the problems of overdue loans and baddebts. Their research establishes the internal performance measures to monitor and enhance theoperational quality of the employees in lending department. The research utilizes the value-addedapproach to analyze the lending production process and derive the internal performance measures toadd value to the lending activities. The internal performance proposed in their article would be moreeffective for evaluating the job performance of employees in lending activities which will ease thelending operational risk.
Standard profit measures are affected by tax laws and regulations ( Gilbert and Wheelock 2007)studies the effect of subchapter S of the Federal tax code on the performance of small banks and foundthat these banks who applies for subchapter S (more than 2000 banks by 2006) performed better interms of the financial returns than those banks who did not apply. This caused some authors toevaluate banks on pre-tax earnings. The article shows that different tax treatments of S and C bankshas a quantitatively large impact on comparison of mean after-tax profit rates across banks. They alsofound that s banks tend to have higher rate of return than C banks of same size even when S banksrates are adjusted for the Federal Tax. This is because of lower expenses and higher ratios of net non –interest income to assets.
The effect of modern development in information technology has been studied. ( Al-Smadi and Al-Wabel 2011) studies the impact of E. Banking on the performance of Jordanian banks. They usedaccounting data to measure the bank performance and their results show that E. banking has asignificant negative impact on banks performance. Cost associated with the adaptation of the E.banking technology is higher than revenues of electronic services. Another study on Bangladesh aboutthe relationship between service quality and customer satisfaction in using E. Banking found thatreliability, responsiveness and assurance have more contribution to satisfy the customer of E. Banking( Nupur 2010 ).
4. RESEARCH METHODOLOGY:
To achieve the previous mentioned research objective ,the researchers used descriptive analysisapproach ,using the appropriate questionnaire to gathering the data, which contain four sections:section one concentrates on the Financial Measures which include 8 variables, section two focuses onCustomer Satisfaction which include 6 variables , section three designed for Innovation of Productsand Services which have 9 variables; and finally measures to judge Commitments, Learning andGrowth of the Employees include 7 variables. In order to achieve the study goals , the questionnaire

Journal of International Scientific Publication: Economy & Business, Volume 6, Part 4
ISSN 1313-2555, Published at: http://www.scientific-publications.net
24 Published by Info Invest, Bulgaria, www.sciencebg.net
was conducted at the managers level in the Palestinian banks. Foreign and local head offices andbranches managers were interviewed. The instrument used (questionnaire) was developed and utilizedby Norton and Kaplan(1992) but the researchers modified it slightly to fit the Palestinian context.
4.1. Study Population:
The Study Population include all banks operating in the Palestinian Authority Territory, Whichcontain, ten foreign banks having 68 branches, and 8 national banks having 70 branches scattered inthe West Bank and Gaza strip.
4.2. Study Sample:
Due to difficulties of transportation and communication with Gaza strip, and the difficulty in coveringall banks in the West Bank: a sample contains 47 banks managers representing 43% of the populationin the West Bank was chosen. The sample was selected randomly but represent both local andforeign banks. Table (1) shows the sample distributed among foreign and local banks and among headoffice and branch.
Table (1): Sample description.
As the table shows the sample include 21 national banks of which 15 are branch manager and 6 headoffice manager and 26 foreign banks of which 21 branch manager and 5 regional manager.
5. Statistical results:
The study used SPSS package to analyze the data using two kinds of statistical analyses:
5.1. Ratio Percentages: The Ratio Percentage of the variables were used in the foursections of the measures. In which Participant were asked to sort the criteria’s of measuring thefinancial performance in general by giving 1 to the most important variable, 2 to the next andso on. The variable that get the least mean is the most important and the one which get thehighest mean is the least important.
Banks Manager
Branch Head Office Total
National Number 15 6 21
Percent 71.4% 28.6% 100.0%
Foreign Count 21 5 26
Percent 80.8% 19.2% 100.0%
Total Count 36 11 47
Percent 76.6% 23.4% 100.0%

Journal of International Scientific Publication: Economy & Business, Volume 6, Part 4
ISSN 1313-2555, Published at: http://www.scientific-publications.net
25 Published by Info Invest, Bulgaria, www.sciencebg.net
First question: How do banks manager measure the financial performance of their banks? The resultsare shown in table no. 2 below:
Table (2): Financial Measures Used by the Banks Managers.
Looking at the table number 2 above we notice that the net income was considered the most importantfactor used by the banks managers to evaluate their performance: while Comparison of standard costwith actual cost was the least important measure . these findings are not consistent with other studiessuch as (Ahmad et. Al.2011) who found that Pakistani banks use return on investment, growth inrevenues, and profit per accounts their main financial variables.
Based on researchers opinion , since the majority of participating managers are branch managers ,their main concern focuses on maximizing profitability of their branches, so the net income and thetotal deposits and facilities were their top priority.
Question two: What measures you use to judge customer satisfaction of your bank? The results areshown in table 3 below.
Table (3): Measures to Judge Customer Satisfaction.
Variable No. of BanksManagers Mean
Number of new customers 47 1.72
Number of customers 47 2.74
Market share 47 3.02
Number of complaints 47 4.11
Average length of time of an account 47 4.43
Independent survey 47 5.45
Variable No. of banks managers Mean
Net Income 47 2.32
Total Deposits and Facilities 47 2.57
Profit per client 47 3.38
Return on Investment 47 3.60
Profit per account 47 4.06
Average cost per transaction 47 6.30
Share price 47 6.47
Comparison of standard cost with actual cost 47 7.21

Journal of International Scientific Publication: Economy & Business, Volume 6, Part 4
ISSN 1313-2555, Published at: http://www.scientific-publications.net
26 Published by Info Invest, Bulgaria, www.sciencebg.net
The table shows that the number of new customers is the most important and number of customers isthe second according to the opinion of the participants , this is also different from the findings ofAhmad et. Al. on Pakistani banks which concentrate on number of complaints and number of newcustomers. Average length of time of an account and Independent survey were the least importantindicators for the customers satisfaction.
The researchers might disagree with this direction of assessment . the customer surveys are the mostindependent and unbiased resource to measure their real satisfaction. An example may be many newcustomers will leave the bank totally or not activate their new account soon after they experience thebank services.
Question three: How do banks measure the Innovation of Products and Services of their banks. Theresults are summarized in the table 4 below.
Table (4): Measures for Innovation of Products and ServicesVariable No. of banks Mean
Number of new product and services 47 2.66
Improve in response time to serve customers 47 3.21
Improvement in space utilization 47 3.91
Provision of in time services 47 4.00
Improve in response time to answer customers about theirinquires.
47 4.23
Percentage of equipment maintained on schedule 47 4.64
Research and development expenses 47 5.96
Reduction in waiting time 47 8.17
Percentage of processes covered by IT 47 8.21
The above table shows that the Number of new products and services and Improve in response time tocustomers were the most critical factor to reflect the Measures for Innovation of Products and Servicesin the operating banks in West Bank ,which agrees with Pakistani banks while Percentage ofprocesses covered by IT and Reduction in waiting time, were the least important indicators.( the laterwas a priority for Pakistani banks).
Question four: How do banks measure the Commitment ,Learning , and Growth of the Employees ontheir banks. The results are shown in the table5 below.

Journal of International Scientific Publication: Economy & Business, Volume 6, Part 4
ISSN 1313-2555, Published at: http://www.scientific-publications.net
27 Published by Info Invest, Bulgaria, www.sciencebg.net
Table (5): Measures to Judge the Commitment ,Learning , and Growth of the Employees.
Variable No. of banks Mean
Number of seminars, lectures, and training 47 2.43
Number of trained employees 47 3.26
Labor turnover 47 3.40
Number of absences 47 3.74
Average years of services 47 3.81
Employees suggestions 47 5.30
Number of employees with advanced degrees 47 5.89
Looking at the table above we notice that the Number of seminars, lectures, and training wasconsidered the most important factor in determining the evaluation used by the banks managers, whichis also does not agree with Pakistani banks: while Employees suggestions and Number of employeeswith advanced degrees was the least important measure .
5.2.Independent t-test:
A t-test was used to analyze the difference between foreign and local banks and between head officeand branches. We used the following hypothesis:
H01 :There is no statistical inference at the level of indication ( = 0.05) on measuring the financialmeasures between national banks and foreign banks head offices.
H02:There is no statistical inference at the level of indication ( = 0.05) on measuring CustomerSatisfaction between national banks and foreign banks head offices
H03:There is no statistical inference at the level of indication ( = 0.05) on measuring the Innovationof Products and Services on their banks between national banks and foreign banks head offices.
H04:There is no statistical inference at the level of indication ( = 0.05) on measuring theCommitment ,Learning , and Growth of the Employees on their bank between national banks andforeign banks head offices.
H05 :There is no statistical inference at the level of indication ( = 0.05) on measuring the financialmeasures between branches managers and head office managers.
H06:There is no statistical inference at the level of indication ( = 0.05) on measuring CustomerSatisfaction between branches managers and head office managers
H07:There is no statistical inference at the level of indication ( = 0.05) on measuring the Innovationof Products and Services on their banks between branches managers and head office managers.

Journal of International Scientific Publication: Economy & Business, Volume 6, Part 4
ISSN 1313-2555, Published at: http://www.scientific-publications.net
28 Published by Info Invest, Bulgaria, www.sciencebg.net
H08:There is no statistical inference at the level of indication ( = 0.05) on measuring theCommitment ,Learning , and Growth of the Employees on their banks between branches managers andhead office managers .
In testing the hypothesis, the following tables below show the results distributed by kind of measuresand type of bank.:
Table (6):Financial Measures.
Variable Branch/HO National Foreign
Mean Sig. Mean Sig.
Return on Investment branch 4.00 .331 3.71 .001
Head Office 3.33 2.20
Net Income branch 3.00 .005 1.57 .635
Head Office 4.00 1.40
Profit per account branch 3.80 .013 3.86 .915
Head Office 5.67 3.80
Average cost per transaction branch 6.80 .838 5.86 .492
Head Office 6.67 6.20
Share price branch 7.20 .000 7.14 .426
Head Office 2.00 6.80
Profit per client branch 2.60 .193 4.00 .301
Head Office 3.67 2.80
Comparison of standard cost withactual cost
branch 6.60 .001 7.29 .141
Head Office 8.00 7.80
Total Deposits and Facilities branch 2.00 .361 2.43 .002
Head Office 2.67 4.80
The tables above summarize the results of T-test in both local and foreign banks and betweenbranches and head offices regarding the financial measures.
5.3. The table shows there is a significant statistical differences between local banks and foreign banksa in using financial measures, as well as between head offices and branches . Head offices in theLocal banks concentrate on the share price , while in foreign banks they use more net income,

Journal of International Scientific Publication: Economy & Business, Volume 6, Part 4
ISSN 1313-2555, Published at: http://www.scientific-publications.net
29 Published by Info Invest, Bulgaria, www.sciencebg.net
which is also the same in the foreign branches. While the national branches concentrate on totaldeposits and credit facilities rather than net income or share prices. So we reject the H01 and H05for local banks and accepted it for foreign banks. These result are normal and consistent with theagency problem theory .
Table (7): Measures to Judge Customer Satisfaction
Variable Branch/HO National Foreign
Mean Sig. Mean Sig.
Number of complaints branch 4.40 .595 3.43 .109
Head Office 4.83 5.20
Number of existing customersbranch 3.20 .068 2.71 .174
Head Office 2.17 2.20
Market share branch 2.80 .094 3.86 .000
Head Office 1.67 1.80
Number of new customers branch 1.40 .005 1.57 .002
Head Office 2.33 2.60
Average length of time of anaccount
branch 4.20 .614 4.57 .762
Head Office 4.50 4.40
Independent survey branch 5.00 .165 5.71 .269
Head Office 5.67 5.40
5.3.1. The table above shows there is no statistical differences regarding the customer satisfaction wefound at 5% level between local and foreign banks head offices, as they both use the market share as ameasure of customer satisfaction so we accept H02. But we reject H06 as the branch managers in bothlocal and foreign banks use the number of new customers as a measure of customer satisfaction.
Table (8): Measures for Innovation of Products and Services
Variable Branch/HO National Foreign
Mean Sig. Mean Sig.
Percentage of equipment maintained onschedule
branch 2.60 .002 5.57 .806
Head Office 5.83 5.40
Improvement in space utilization branch 4.60 .391 2.71 .019
Journal of International Scientific Publication: Economy & Business, Volume 6, Part 4
ISSN 1313-2555, Published at: http://www.scientific-publications.net
30 Published by Info Invest, Bulgaria, www.sciencebg.net
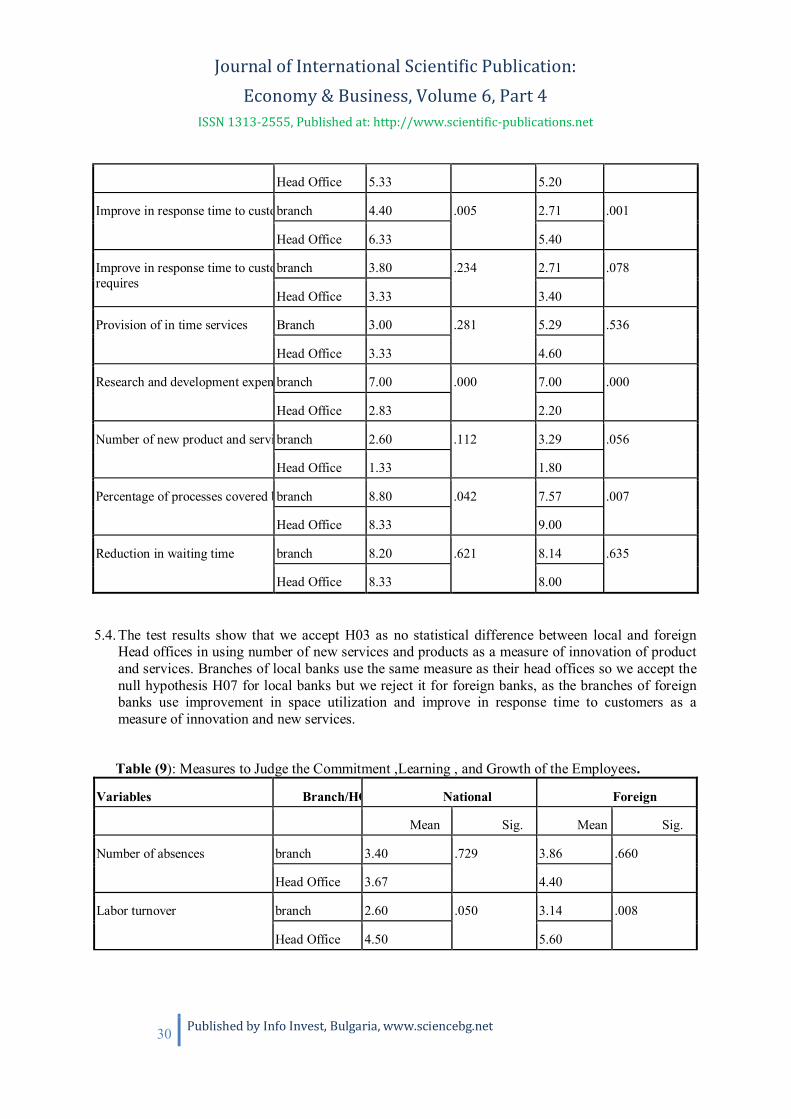
5.4. The test results show that we accept H03 as no statistical difference between local and foreignHead offices in using number of new services and products as a measure of innovation of productand services. Branches of local banks use the same measure as their head offices so we accept thenull hypothesis H07 for local banks but we reject it for foreign banks, as the branches of foreignbanks use improvement in space utilization and improve in response time to customers as ameasure of innovation and new services.
Table (9): Measures to Judge the Commitment ,Learning , and Growth of the Employees.
Variables Branch/HO National Foreign
Mean Sig. Mean Sig.
Number of absences branch 3.40 .729 3.86 .660
Head Office 3.67 4.40
Labor turnover branch 2.60 .050 3.14 .008
Head Office 4.50 5.60
Head Office 5.33 5.20
Improve in response time to customersbranch 4.40 .005 2.71 .001
Head Office 6.33 5.40
Improve in response time to customersrequires
branch 3.80 .234 2.71 .078
Head Office 3.33 3.40
Provision of in time services Branch 3.00 .281 5.29 .536
Head Office 3.33 4.60
Research and development expensesbranch 7.00 .000 7.00 .000
Head Office 2.83 2.20
Number of new product and servicesbranch 2.60 .112 3.29 .056
Head Office 1.33 1.80
Percentage of processes covered by ITbranch 8.80 .042 7.57 .007
Head Office 8.33 9.00
Reduction in waiting time branch 8.20 .621 8.14 .635
Head Office 8.33 8.00

Journal of International Scientific Publication: Economy & Business, Volume 6, Part 4
ISSN 1313-2555, Published at: http://www.scientific-publications.net
31 Published by Info Invest, Bulgaria, www.sciencebg.net
Number of seminars, lectures, andtraining
branch 2.60 .897 2.57 .024
Head Office 2.67 1.00
Average years of services branch 5.00 .247 2.86 .178
Head Office 4.33 3.60
Number of employees with advanceddegrees
branch 6.40 .372 5.57 .967
Head Office 6.00 5.60
Employees suggestions branch 5.60 .000 6.00 1.000
Head Office 1.50 6.00
Number of trained Employees branch 1.80 .000 4.00 .001
Head Office 5.33 2.00
5.4.1. Finally the hypothesis testing shows a statistical difference between local and foreign bankshead offices and between branches and head offices of local to judge the commitment, learning andgrowth of the employees, so we reject H04 and accept H08 as local banks head offices use employeessuggestions while local banks branches and foreign banks and their branches use number of seminarslectures and training.
6. SUMMARY AND CONCLUSION:6.1. This paper tries to find the variables that banks managers in Palestine use to evaluate theirperformance. We used the Balanced Scorecard method developed by Kaplan and Norton to dividethese variables into four measures: Financial; customer satisfaction; innovation of product andservices; and commitment, learning and growth of employees. Each measure is divided into severalquestions and a questionnaire was distributed on a sample of banks' managers representing 43% ofbanks and branches ( local and foreign ) in the West Bank , because of difficulties in reaching theGaza strip. The results was analyzed in two different methods. The first one we used the averageswhere 1 was given to the top priority and 2 to the second and so on. So the one with least average isthe best variable for the manager, and the highest mean is the least used variable. It was found that :6.1.1. Net income was the most important variable used by the banks managers to evaluate theirfinancial performance followed by total deposits and credit facilities.6.1.2. Number of new customers is the first variable used to measure customer satisfaction followedby total number of customers: while the least they use is to make a customer satisfaction survey.6.1.3. Number of new products and services is variable number one used to measure the innovationof product and services.6.1.4. Number of seminars lectures and training is the most important variable used to measure thecommitment, learning and growth of employees.
Journal of International Scientific Publication: Economy & Business, Volume 6, Part 4
ISSN 1313-2555, Published at: http://www.scientific-publications.net
32 Published by Info Invest, Bulgaria, www.sciencebg.net
6.2. The second method used in this study to compare the measures used by foreign and local banks ;and between head offices and branches of both local and foreign banks. The main findings of the studyare:6.2.1. There is a significant statistical differences between foreign and local banks head offices invariables used to evaluate their financial performance. Local banks use share prices while foreignbanks use net income .as their first measure. There is also a significant statistical differences betweenhead offices and braches of local banks as branches of local banks use total deposit and credit facilitiesas their top priority measure.6.2.2.There is no significant statistical differences between local and foreign banks head offices inmeasuring customer satisfaction as they both use market share as their first measure. But on the otherside there is a significant statistical differences between head offices and branches of both local andforeign branches as the later use number of new customers .6.2.3. There is no significant differences between local and foreign bank head offices in using numberof new services and products as a measure of innovation of products and services. The same is true forlocal branches, but foreign bank branches use improvement in space utilization and improve in time tocustomers.6.2.4.Number of seminars, lectures, and training is the first number variable used to measure thecommitment, learning and growth of employees used by both local and foreign head offices andbranches. While local head offices use employee suggestions.
REFERENCES1. Abbadi S. M and Abu Rub, N. (2012).”The Effect of Capital Structure on the Performance of
Palestinian Financial Institutions”, British Journal of Economics, Finance and ManagementSciences Vol. 3(2) January 2012.
2. Ahmad Z. Bowra Z.A, Ahmad I., Nawaz, M. and Khan, M. S.(2011). “Performance MeasuresUsed by the Commercial Banks in Pakistan within the Four Perspectives of BalancedScorecard”. Journal of Money, Investment and Banking, ISSN 1450-288X Issue 21.
3. Alkhatib A.and Harsheh M (2012). “Financial Performance of Palestinian CommercialBanks”. International Journal of Business and Social Science, Vol. 3 No. 3; February 2012.
4. Al-Smadi, M. and Al-Wabel, S. (2011). “The Impact of E- Banking on The Performance ofJordanian Banks”. Journal of Internet Banking and Commerce, vol. 16, no.2.
5. Cobb, I, Heller, C. and Innes, J. (1995). “Management accounting change in a bank”,Management Accounting Research, Vol. 6,pp. 155-175.
6. Economic and Social Commission for West Asia (ESCWA) ( 1987 ), Palestinian FinancialSector Under the Israeli Occupation,. Dec.. 1987 PP. 41-42.
7. Frigo, M.L. and Krumweiiede K.R. " Balanced Scorecard: a rising trend in strategicperformance measurement" Journal of Strategic Management, Vol.3 No. 1, pp. 42-44.
8. Gilbert, R.A and Wheelock, D.C( 2007 ), " Measuring the Commercial Bank Profitability:Proceed with Caution". Federal Reserve Bank St. Louis Review, 22: 515-532.
9. Hanif Muhammad, Mahvish Tariq Arshiya Tahir, and Wajeeh-ul-Momeneen. (2012),“Comparative Performance Study of Conventional and Islamic Banking in Pakistan”.International Research Journal of Finance and Economics, ISSN 1450-2887 Issue 83.
Journal of International Scientific Publication: Economy & Business, Volume 6, Part 4
ISSN 1313-2555, Published at: http://www.scientific-publications.net
33 Published by Info Invest, Bulgaria, www.sciencebg.net
10. Harris Laurence (1988). " Money and Finance with Undeveloped Banking in the OccupiedTerritories. In the Palestine Economy. Edited by Goerge Abed, Routledge. London, New York1988 PP. 52-54.
11. Hussain, M.M. and Hoque, Z. (2002). “Understanding non-financial performancemeasurement practices in Japanese banks: A New Institutional Sociology perspective”,Accounting, Auditing and Accountability Journal, Vol.15, No.2, pp 162-183.
12. Kaplan, R.S. and Norton, D.P. (1992). “The balanced scorecard - measures that driveperformance”, Harvard Business Review, Vol. 70, No.1, 71-79.
13. Keegan, D.P., Eiler, R.G. and Jones, C.R. (1989). “Are your performance measuresobsolete?”, Management Accounting, Vol. 71, 45-50.
14. Khrawish , H.A. (2011). “Determinants of Commercial Banks Performance: Evidence fromJordan” . International Research Journal of Finance and Economics -ISSN 1450-2887 Issue81.
15. Lin Peter Wei-Shong, and Mei Albert Kuo-Chung, (2006) "The internal performancemeasures of bank lending: a value-added approach", Benchmarking: An International Journal,Vol. 13 Issue 3, pp.272 - 289
16. Lynch, R.L. and Cross, K.F. (1991). Measure Up – The Essential Guide to MeasuringBusiness Performance . Mandarin - Blackwell, London.
17. Nupur Jannatul Mawa , (2010 ). “E-Banking and Customers’ Satisfaction in Bangladesh”.International Review of Business Research, Papers. Volume 6. Number 4. pp.145-156.
18. Rahat Munir, Kevin Baird, Sujatha Perera., Changes in the performance measurement systemin banking sector: an analytical framework.
19. Rose, P and Hudgins S. (2010). Bank Management & Financial Services. McGraw Hill NewYork., eighth ed. PP 168-181.
20. Palestine Monetary Authority(2011), “Annual report for the year 2010”. Ramallah, Palestine.21. Tarawaneh Medhat, (2006). "A comparison of financial performance in the banking sector ,
evidence from Omani "commercial banks" , International research journal of finance andeconomy , Issue 3 .
22. Tandelilin E., Kaaro H., Mahadwartha P. and Supriyatna (2007), “Corporate Governance,Risk Management, and Bank Performance: Does Type of Ownership Matter”. Eadn WorkingPaper No.34.

Journal of International Scientific Publication: Economy & Business, Volume 6, Part 4
ISSN 1313-2555, Published at: http://www.scientific-publications.net
34 Published by Info Invest, Bulgaria, www.sciencebg.net
BRANCH-AND-BOUND TECHNIQUE IN ECONOMICS
Velizar T. Pavlov1 , Ivan R. Georgiev2
1, 2Department of Numerical Analysis and Statistics, University of Ruse,
8 Studentska Str., Ruse 7017, Bulgaria
Abstract
Integer programming problems arise frequently because some or all of the decision variables must berestricted to integer values. These problems are more difficult than they would be without the integerrestriction. The present paper covers in step-by-step Branch-and-Bound Technique for two cases –minimizing and maximizing integer programming problems. There are two model problems inEconomics. In the first, maximum of the objective function is reached for the nearest to the continuousoptimal solution integer values (of course satisfying the system of restrictions), while in the second,the maximum is reached for values that are far from those of the continuous optimal solution. Acomputer code for solving any such problems in MATLAB is given.
Key words: operations research, integer programming, MATLAB
1. INTRODUCTION
In many practical problems of linear programming, the decision variables actually make sense only ifthey have integer values. For example, it is often necessary to assign people, machines, and vehicles toactivities in integer quantities. Then the mathematical model is simply the linear programming modelwith the one additional restriction that the all of variables must have integer values. In this case themodel is referred to as pure integer programming. If only some of the variables are required to haveinteger values, this model is referred to as mixed integer programming.
The simplest idea for solving integer programming problem is to be solved as a continuous problemand if it is necessary the optimal solution can be rounded to the nearest integer values. However, thereis no guarantee that the resulting approximate solution will satisfy the system restrictions.Furthermore, it is quite possible maximum or minimum of the objective function is achieved notclosest integer values of the continuous optimal solution. In this paper are presented two modelexamples in Economics. In the first, maximum of the objective function is reached for the nearestinteger values (of course satisfying the system of restrictions), while the second, the maximum isreached for values that are far from those of the continuous optimal solution.
Here we apply the algorithm that was developed by R. J. Dakin [2], based on a pioneering branch-and-bound technique by A. H. Land and A. G. Doig [7]. In the case of maximum and minimum thealgorithm is described step by step. Finally we give a computer code in MATLAB.
2. THE BRANCH-AND-BOUND TECHNIQUE FOR INTEGER PROGRAMMING
The branch-and-bound technique and variations of it have been applied with some success to avariety of operations research problems, but it is especially well known for its application to integerprogramming problems. The basic idea of this technique is the following.
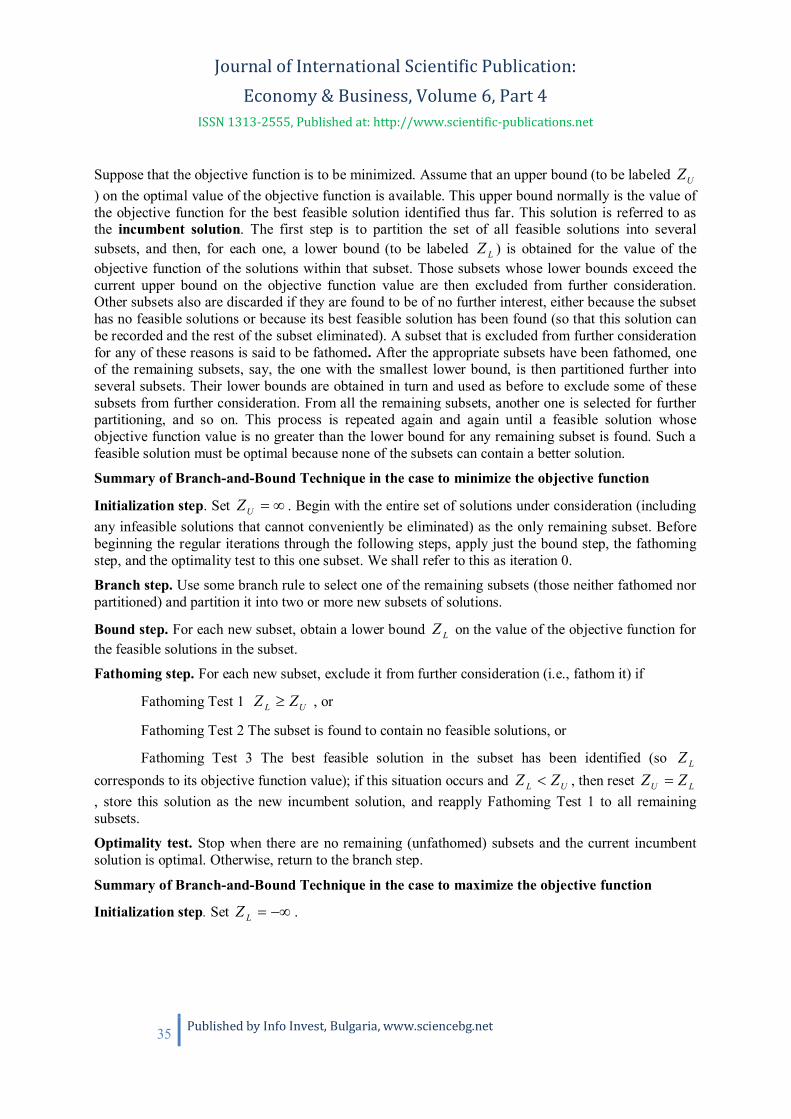
Journal of International Scientific Publication: Economy & Business, Volume 6, Part 4
ISSN 1313-2555, Published at: http://www.scientific-publications.net
35 Published by Info Invest, Bulgaria, www.sciencebg.net
Suppose that the objective function is to be minimized. Assume that an upper bound (to be labeled UZ) on the optimal value of the objective function is available. This upper bound normally is the value ofthe objective function for the best feasible solution identified thus far. This solution is referred to asthe incumbent solution. The first step is to partition the set of all feasible solutions into severalsubsets, and then, for each one, a lower bound (to be labeled LZ ) is obtained for the value of theobjective function of the solutions within that subset. Those subsets whose lower bounds exceed thecurrent upper bound on the objective function value are then excluded from further consideration.Other subsets also are discarded if they are found to be of no further interest, either because the subsethas no feasible solutions or because its best feasible solution has been found (so that this solution canbe recorded and the rest of the subset eliminated). A subset that is excluded from further considerationfor any of these reasons is said to be fathomed. After the appropriate subsets have been fathomed, oneof the remaining subsets, say, the one with the smallest lower bound, is then partitioned further intoseveral subsets. Their lower bounds are obtained in turn and used as before to exclude some of thesesubsets from further consideration. From all the remaining subsets, another one is selected for furtherpartitioning, and so on. This process is repeated again and again until a feasible solution whoseobjective function value is no greater than the lower bound for any remaining subset is found. Such afeasible solution must be optimal because none of the subsets can contain a better solution.
Summary of Branch-and-Bound Technique in the case to minimize the objective function
Initialization step. Set UZ . Begin with the entire set of solutions under consideration (includingany infeasible solutions that cannot conveniently be eliminated) as the only remaining subset. Beforebeginning the regular iterations through the following steps, apply just the bound step, the fathomingstep, and the optimality test to this one subset. We shall refer to this as iteration 0.
Branch step. Use some branch rule to select one of the remaining subsets (those neither fathomed norpartitioned) and partition it into two or more new subsets of solutions.
Bound step. For each new subset, obtain a lower bound LZ on the value of the objective function forthe feasible solutions in the subset.
Fathoming step. For each new subset, exclude it from further consideration (i.e., fathom it) if
Fathoming Test 1 UL ZZ , or
Fathoming Test 2 The subset is found to contain no feasible solutions, or
Fathoming Test 3 The best feasible solution in the subset has been identified (so LZcorresponds to its objective function value); if this situation occurs and UL ZZ , then reset LU ZZ, store this solution as the new incumbent solution, and reapply Fathoming Test 1 to all remainingsubsets.
Optimality test. Stop when there are no remaining (unfathomed) subsets and the current incumbentsolution is optimal. Otherwise, return to the branch step.
Summary of Branch-and-Bound Technique in the case to maximize the objective function
Initialization step. Set LZ .
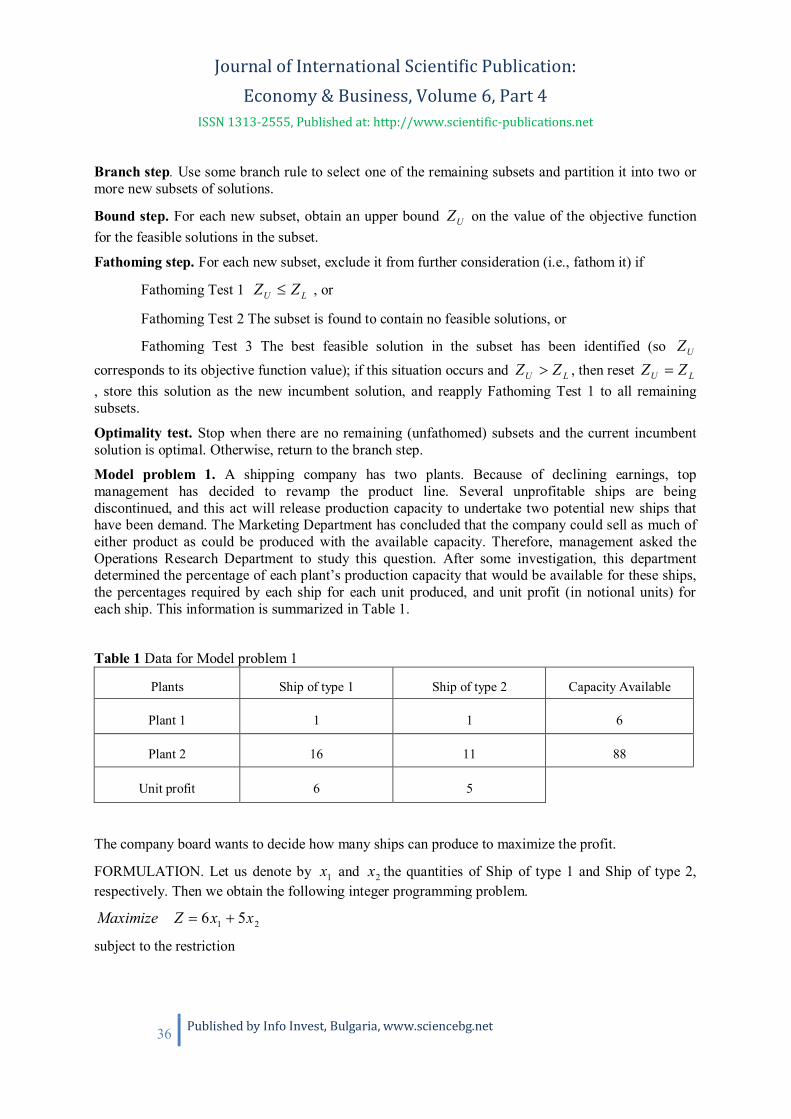
Journal of International Scientific Publication: Economy & Business, Volume 6, Part 4
ISSN 1313-2555, Published at: http://www.scientific-publications.net
36 Published by Info Invest, Bulgaria, www.sciencebg.net
Branch step. Use some branch rule to select one of the remaining subsets and partition it into two ormore new subsets of solutions.
Bound step. For each new subset, obtain an upper bound UZ on the value of the objective functionfor the feasible solutions in the subset.
Fathoming step. For each new subset, exclude it from further consideration (i.e., fathom it) if
Fathoming Test 1 LU ZZ , or
Fathoming Test 2 The subset is found to contain no feasible solutions, or
Fathoming Test 3 The best feasible solution in the subset has been identified (so UZcorresponds to its objective function value); if this situation occurs and LU ZZ , then reset LU ZZ, store this solution as the new incumbent solution, and reapply Fathoming Test 1 to all remainingsubsets.
Optimality test. Stop when there are no remaining (unfathomed) subsets and the current incumbentsolution is optimal. Otherwise, return to the branch step.
Model problem 1. A shipping company has two plants. Because of declining earnings, topmanagement has decided to revamp the product line. Several unprofitable ships are beingdiscontinued, and this act will release production capacity to undertake two potential new ships thathave been demand. The Marketing Department has concluded that the company could sell as much ofeither product as could be produced with the available capacity. Therefore, management asked theOperations Research Department to study this question. After some investigation, this departmentdetermined the percentage of each plant’s production capacity that would be available for these ships,the percentages required by each ship for each unit produced, and unit profit (in notional units) foreach ship. This information is summarized in Table 1.
Table 1 Data for Model problem 1
Plants Ship of type 1 Ship of type 2 Capacity Available
Plant 1 1 1 6
Plant 2 16 11 88
Unit profit 6 5
The company board wants to decide how many ships can produce to maximize the profit.
FORMULATION. Let us denote by 1x and 2x the quantities of Ship of type 1 and Ship of type 2,respectively. Then we obtain the following integer programming problem.
21 56 xxZMaximize
subject to the restriction

Journal of International Scientific Publication: Economy & Business, Volume 6, Part 4
ISSN 1313-2555, Published at: http://www.scientific-publications.net
37 Published by Info Invest, Bulgaria, www.sciencebg.net
621 xx
881116 21 xx
,01x 02x
21 , xx are integers.
Figure 1 shows the points of space solutions of the integer programming problem. The space ofsolutions of the continuous problem (without restrictions for integer values of unknown variables
21, xx ) is OABC.
Fig. 1 A graphic interpretation of the solution of Model problem 1
For iteration 0, the optimal solution for the LP-relaxation of this problem is found to be ,4.41x,6.12x .4.34Z Therefore iteration 1 begins by partitioning to 1x the entire set of solutions into
the two subsets:
1. Solutions in which 41x
2. Solutions in which 51x
For this first subset, its LP-relaxation has the optimal solution, ),2,4(),( 21 xx which is integervalued, so this subset is fathomed by Test 3 and this solution becomes the first incumbent solution
34LU ZZ .
2
4
5
A
7
8
0 1 2 3 4 5 6 7 x1
B (4.4, 1.6)
(4, 2)
2
1
3
C
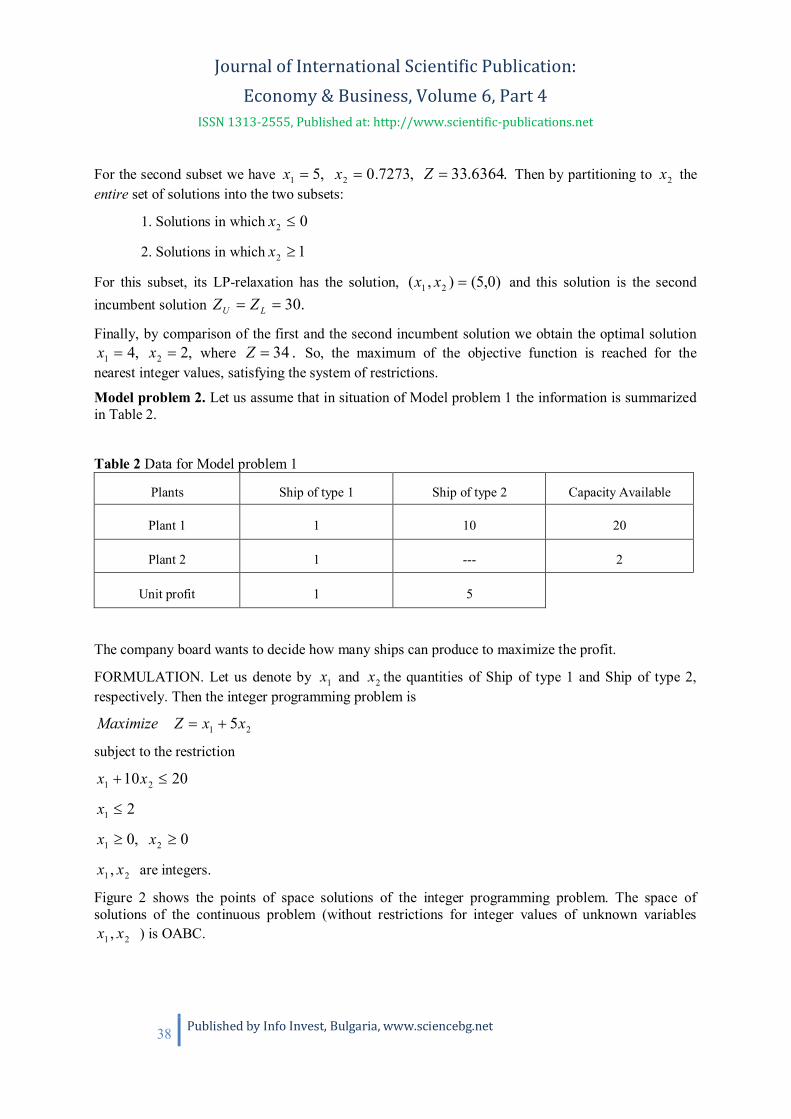
Journal of International Scientific Publication: Economy & Business, Volume 6, Part 4
ISSN 1313-2555, Published at: http://www.scientific-publications.net
38 Published by Info Invest, Bulgaria, www.sciencebg.net
For the second subset we have ,51x ,7273.02x .6364.33Z Then by partitioning to 2x theentire set of solutions into the two subsets:
1. Solutions in which 02x
2. Solutions in which 12x
For this subset, its LP-relaxation has the solution, )0,5(),( 21 xx and this solution is the secondincumbent solution .30LU ZZ
Finally, by comparison of the first and the second incumbent solution we obtain the optimal solution,41x ,22x where .34Z So, the maximum of the objective function is reached for the
nearest integer values, satisfying the system of restrictions.
Model problem 2. Let us assume that in situation of Model problem 1 the information is summarizedin Table 2.
Table 2 Data for Model problem 1
Plants Ship of type 1 Ship of type 2 Capacity Available
Plant 1 1 10 20
Plant 2 1 --- 2
Unit profit 1 5
The company board wants to decide how many ships can produce to maximize the profit.
FORMULATION. Let us denote by 1x and 2x the quantities of Ship of type 1 and Ship of type 2,respectively. Then the integer programming problem is
21 5xxZMaximize
subject to the restriction
2010 21 xx
21x
,01x 02x
21 , xx are integers.
Figure 2 shows the points of space solutions of the integer programming problem. The space ofsolutions of the continuous problem (without restrictions for integer values of unknown variables
21 , xx ) is OABC.

Journal of International Scientific Publication: Economy & Business, Volume 6, Part 4
ISSN 1313-2555, Published at: http://www.scientific-publications.net
39 Published by Info Invest, Bulgaria, www.sciencebg.net
For iteration 0, the optimal solution for the LP-relaxation of this problem is found to be)8.1,2(),( 21 xx . Therefore, iteration 1 begins by partitioning the entire set of solutions into the two
subsets:
1. Solutions in which 12x
2. Solutions in which 22x
Fig. 2 A graphic interpretation of the solution of Model problem 2
For this first subset, its LP-relaxation has the optimal solution, )1,2(),( 21 xx , which is integervalued, so this subset is fathomed by Test 3 and this solution becomes the first incumbent solution
7LU ZZ . For the second subset its LP-relaxation has only one feasible solution,)2,0(),( 21 xx , but it is integer valued, so this subset is also fathomed by Test 3. Furthermore, this
solution is better ( UL ZZZ 10 ) than the incumbent solution, so it becomes the new incumbentsolution (reset 10UZ ). However, there now are no unpartitioned subsets left that have beenfathomed, and )2,0(),( 21 xx must be optimal. So, the maximum is reached for values that are farfrom those of the continuous optimal solution.
Now we give a computer code in MATLAB for solution of integer programming problem.
function [x,z,lag]=intprog(f,A,b,Aeq,beq,lb,ub,s)
nub=length(ub);
nlb=length(lb);
nf=length(f);
if nub==0
ub=ones(nf,1)*inf;
B (2, 1.8) (0, 2)
0 1 2 10 20 x1
x2
2 2
1 11
2
3
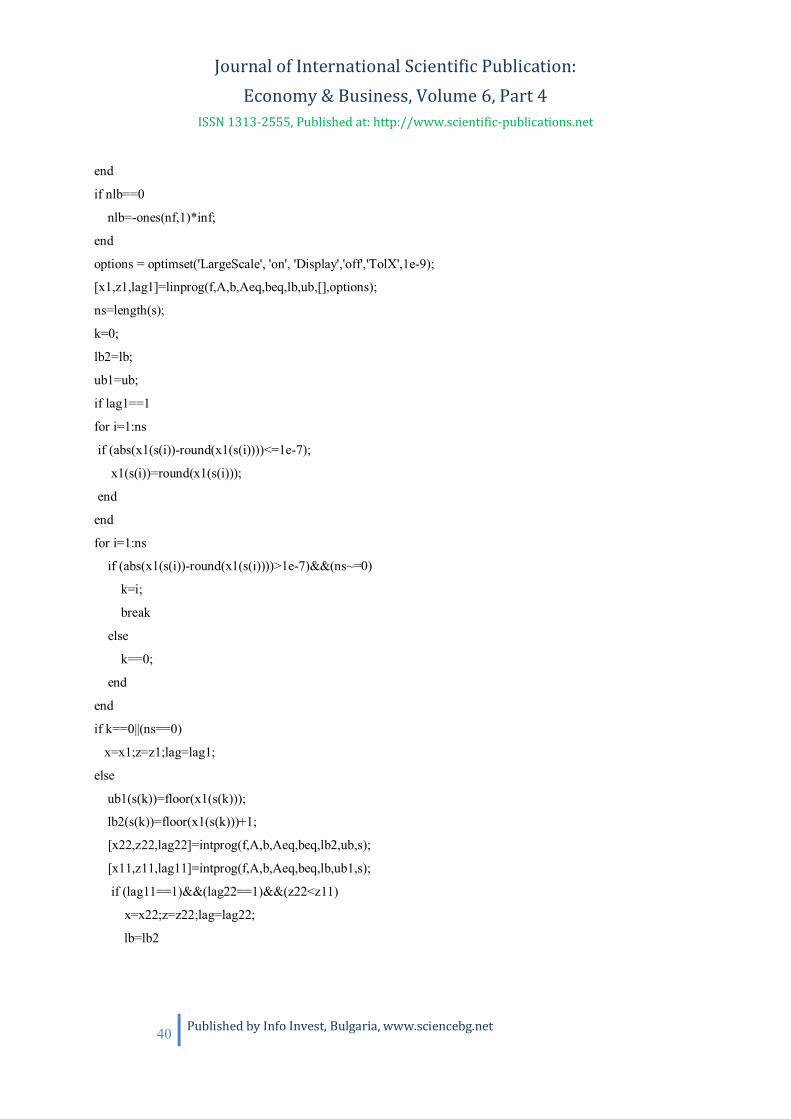
Journal of International Scientific Publication: Economy & Business, Volume 6, Part 4
ISSN 1313-2555, Published at: http://www.scientific-publications.net
40 Published by Info Invest, Bulgaria, www.sciencebg.net
end
if nlb==0
nlb=-ones(nf,1)*inf;
end
options = optimset('LargeScale', 'on', 'Display','off','TolX',1e-9);
[x1,z1,lag1]=linprog(f,A,b,Aeq,beq,lb,ub,[],options);
ns=length(s);
k=0;
lb2=lb;
ub1=ub;
if lag1==1
for i=1:ns
if (abs(x1(s(i))-round(x1(s(i))))<=1e-7);
x1(s(i))=round(x1(s(i)));
end
end
for i=1:ns
if (abs(x1(s(i))-round(x1(s(i))))>1e-7)&&(ns~=0)
k=i;
break
else
k==0;
end
end
if k==0||(ns==0)
x=x1;z=z1;lag=lag1;
else
ub1(s(k))=floor(x1(s(k)));
lb2(s(k))=floor(x1(s(k)))+1;
[x22,z22,lag22]=intprog(f,A,b,Aeq,beq,lb2,ub,s);
[x11,z11,lag11]=intprog(f,A,b,Aeq,beq,lb,ub1,s);
if (lag11==1)&&(lag22==1)&&(z22<z11)
x=x22;z=z22;lag=lag22;
lb=lb2

Journal of International Scientific Publication: Economy & Business, Volume 6, Part 4
ISSN 1313-2555, Published at: http://www.scientific-publications.net
41 Published by Info Invest, Bulgaria, www.sciencebg.net
elseif (lag11==1)&&(lag22==1)&&(z22>=z11)
x=x11;z=z11;lag=lag11;
ub=ub1;
elseif (lag11==1)&&(lag22~=1)
x=x11;z=z11;lag=lag11;
ub=ub1;
elseif (lag22==1)&&(lag11~=1)
x=x22;z=z22;lag=lag22;
lb=lb2;
else
lag=0;
error('there is not solution')
end
end
else
x=x1;z=z1;lag=lag1
end
NOTE. If the integer programming problem is:
xfZMinimize t
bAx
eqeq bxA
ubxlb
si when ix is integer,
then the input data are: f – vector of coefficients from the objective function ( tf - transposed vector);A – matrix of coefficients from the system of liner inequalities of type “ “ and b – vector (right handside); eqA - matrix of coefficients from the system of linear equations and eqb - vector (right handside); lb – vector of lower bounds; up – vector of upper bounds; s – vector of index numbers of integervariables. The output data are: Z – the optimal value of the objective function, x – the optimal solution,lag – indicator for existence of the solution (if lag = 1, then there is a solution, if lag = 0, then there isnot a solution).
In the case of maximizing integer programming problem in the input data we have f = – f and in theoutput data we obtain the optimal value Z = – Z.
Journal of International Scientific Publication: Economy & Business, Volume 6, Part 4
ISSN 1313-2555, Published at: http://www.scientific-publications.net
42 Published by Info Invest, Bulgaria, www.sciencebg.net
3. CONCLUSIONS
From the mathematical point of view we see that it is possible to reach maximum of the objectivefunction for as the nearest to the continuous optimal solution integer values and as for values that arefar from those of the continuous optimal solution.
From the practical point of view it is strange to obtain an optimal solution )2,0(),( 21 xx , i.e. theprofit is maximum when the company produced only ships of type 2. It is easy to correct the solutionif there are the following restrictions 01x and 02x .
REFERENCES
1. Anderson, D., D. Sweeney, T. Williams (2003), Management Science, West PublishingCompany, Minnesota, USA.
2. Dakin, R., A tree Search Algorithms for Mixed Integer Programming Problems, ComputerJournal, 8 (3): 250-255, 1965.
3. Farlow, S. and Haggard, G. (1991), Applied Mathematics for Management, life Sciences andSocial Sciences, Random House, New York, USA.
4. Fletcher, R. (1998) Practical Methods of Optimization, John Wiley & Sons, USA.
5. Hiller, F. and Lieberman, G. (1986) Introduction to Operations Research, Holden – Day, Inc.,Oakland, California, USA.
6. Kremer, N. (2004) Operations Research in Economics, Unity, Moscow, Russia.
7. Land, A., A. Doig, An Automatic Method of Solving Discrete Programming Problems,Econometrica, 28: 497-520, 1960.
8. Taha, H, (1992) Operations Research, An Introduction, New York, J. Wiley and Sons, USA.
9. Vukan, V. (2005) Operations Planning & Economics, Hardback, Paris, France.
Journal of International Scientific Publication: Economy & Business, Volume 6, Part 4
ISSN 1313-2555, Published at: http://www.scientific-publications.net
43 Published by Info Invest, Bulgaria, www.sciencebg.net
ENTERPRISE SIZE DISTRIBUTION IN THE CROATIAN SOFTWARE INDUSTRY
Ksenija Vukovi
Faculty of Organization and Informatics, University of Zagreb
Pavlinska 2, Varaždin, Croatia, [email protected]
Abstract
Enterprise size is decreasing in recent 20 years. The emergence of large number of micro enterprisesis the consequence of the different factors facilitating entry and survival of small and medium sizedenterprises (SMEs) as well as the SME policy support in the European Union. In this paper weanalyse the firm size distribution in the Croatian software industry. The aim of the paper is to find outif enterprise size distribution varies by age. We analyse several cohorts of enterprises differing by ageand we compare their size distribution. Number of employees is used as a size proxy.
Key words: enterprise size distribution, enterprise age, software industry, Croatia
1. INTRODUCTION
Since the appearance of pioneering works of Pareto and Gibrat , the distribution of enterprise sizehas been deeply studied both in the statistical and in the economic literature (Cirillo, 2009). Gibrat'sLaw (Gibrat, 1931), very popular among researchers, is the first attempt to explain in stochastic termsthe systematically skewed pattern of the distributions of enterprise size within industry (Aitchison andBrown, 1957) . Stohastic models indicates that enterprise size distribution is a result of the randomwalk. Emprical works on the evolution of the enterprise size distribution lead to the conclusion thatthe inital size distribution of new enterprises is particularly right-skewed but the log-size distributiontends to become more symmetric as enterprises become older (Coad, 2007).
Cabral and Mata (2003) present the facts on enterprise size distribution among Portuguesemanufacturing enterprises which support significant right-skeweness evolving over time toward alognormal distribution. Instead of selection argument affecting market structure, they empahasize therole of financing constraints. Angelini and Generale (2003) confirm the finding of Cabral and Matathat size distrubition of the enterprises is highly skewed to the right at birth and the skewenessdiminishes with enterprise age.
Botazzi et al. (2009) explore firm size distribution of French manufacturing enterprises at theaggregate and disaggregate levels and find out that there is a significant enterprise size distributionsheterogeneity across industries. Cirillo (2009) analysis the size distribution of Italian enterprises byage and finds out that it is skewed for both young and old enterprises but clearly shifts to the right astime goes by.
In the late 1980s large enterprises started to lose their dominance as a business organization model(Thurik, 2009). Verheul et al. (2002) emphasize the demand side and supply side of entrepeneurship intheir eclectic theory of entreprenurship. Both sides are determined by the factors influencing creatingand survival of SMEs. Demand side factors such as economic development, technologicaldevelopment, demand diversity, industrial structure and globalization could explain the appereance ofentrepreneurial opportunity and entry of many SMEs in the market. Supply side factors also have its
Journal of International Scientific Publication: Economy & Business, Volume 6, Part 4
ISSN 1313-2555, Published at: http://www.scientific-publications.net
44 Published by Info Invest, Bulgaria, www.sciencebg.net
important role in creating new opportunities (population growth, population density and urbanizationrate, age structure of the population, immigration, participation of women, income levels andunemployment, income disparity). Both demand and supply side factors give help in explainingdynamic processes in new, SMEs dominated ICT service industries, particularly software industry.
Fast growing ICT sector can make a large contribution to economic growth, employment andproductivity . Moreover, having a strong ICT sector may help firms that wish to use technology sincethe close proximity of producing firms might have advantages when developing ICT applications forspecific purposes. Effective diffusion and use of technology is a key factor in broad-based growth,particularly when combined with organisational change and effective human resource strategiesinvolving education and training. Future Croatian membership in the EU places emphasis on theimportance and need to further develop the information society.
New technologies have reduced the significance of scale economies. Even micro enterprises thatsuccessfully implement innovations or are capable to retain their clients can thrive in the growingmarket. Structural changes, which account for a higher share of services in economies, have opened upnew possibilities for entrepreneurship in the service sector.
Considering all the indicators supporting the fact of transition to entrepeneurial economy (Thurik,2009) the question of the factors influencing the firm size distribution in software industry can be aninteresting one.
2. THE CHARACTERISTICS OF THE SOFTWARE INDUSTRY
Nambisan (2002) states that the software industry can be considered „the prototypical high technologyindustry characterized by innovation-driven market growth, rapidly shrinking product and technologylife cycles, high knowledge intensity, and global markets“.
The software and software-based services market in EU27 area was about respectable 231 billionEuros in 2009 but European software products are characterized by large economies of scale placingEuropean software vendors at a disadvantage (Rönkkö et al, 2011). As Rönkkö et al. (2010) argue theglobal software industry is characterized by large variation in enterprise size. There are two reasonsfor the heterogeneity in software enterprise size distributions: the first one is the absence of entrybarriers (supporting micro and small enterprise entry) and the second one is the existence ofeconomies of scale and scope favoring larger enterprises.
Software industry can be devided into two branches: professional services activities and softwareproduct activities. Hoch et al. (2000) argue that the scarcity of the talented, competent people is crucialin the software industry. It is also known that the production of information goods characterize lowand constant marginal cost (Shapiro and Varian, 1999), but the first copy cost is very high so it couldlead to the conclusion that domestic market is small for the software enterprises. In the same time,there is a need for customization because the software product has to be integrated in the specificcustomer's information systems. ICT service providers are necessary when enterprises need local skillsand advice to implement ICT-related changes which could have important role in supportingenterprise growth.
While analysing Croatian ICT sector it was noticed that service industries in ICT sector have no entrybarrier regarding minimum efficeient size. Software industry (software supply and softwareconsultancy) and data processing activity have the smallest minimum efficient size among ICTservices (Kova evi and Vukovi , 2006). The minimum efficient size is usually taken in research as a
Journal of International Scientific Publication: Economy & Business, Volume 6, Part 4
ISSN 1313-2555, Published at: http://www.scientific-publications.net
45 Published by Info Invest, Bulgaria, www.sciencebg.net
measure of scale economies or a measure of sunk cost. It can negatively affect entry if a huge outputis required for potential entrants to reap the benefits from economies of scale. A small minimumefficient size in most industries in the ICT sector speaks in favour of the conclusion that a smallerminimum efficient size of an industry increases the survival chances of the enterprises in thatparticular industry.
If small enterprises or mico enterprises constitute a dominant share in the industrial population, newenterprises have better chances for survival. Industries in the ICT sector are not capital intensive.Instead, , it can be said that ICT industries are human capital intensive (Vukovi and Kova evi , 2010)if we take into account average salary as a proxy for human capital. Li et al.(2010) find out in theirresearch that the firms that persist and survive over the long term in the dynamic software industry areable to capitalize on their competitive actions because of their greater capabilities, and particularlyoperation capabilities.
As entry rates are high, many enterprises start a software business but many of them fail.Hoch et al.(2000) also mention that very few of persons that start a business can run it and most never lead it tothe initial public offering. There should be many obstacles to growth: high risk of growth, lack offinance, lack of self-confidence, lack od managerial and entrepreneurial skills, bureacreacy burden,strategical decisions of maintaining the current size of the enterprise.
3. ENTERPRISE SIZE DISTRIBUTION IN THE CROATIAN SOFTWARE INDUSTRYIn our research we use Financial agency database which contains longitudinal dana on the panel of allCroatian enterprises in the software industry. Croatian enterprises are required to submit regularfinancial reports each year. Our analyes is restricted to the software industry. The data for our studyrelate to the period from 2002-2007 because of the statistical consistency. We consider, first of all, thecontinuing firms over this period.
We assume that all enterprises, or at least the vast majority of them, have submitted the financialreports regularly so that the sample covers the vast majority of businesses registered for activities inthe software industry.
As ICT has only been recognised as a major source of economic and social change, official statisticson ICT are still under development. International organisations, such as the OECD and Eurostat, haveworked together to develop common definitions, common methods and common surveys of ICT. TheNational Classification of Economic Activities up to the group level (the third level of aggregation)ensures the compatibility with the International Standard Industrial Classification of All EconomicActivities ( ISIC Rev. 3.1). We use for our purposes activity 72.2 – software supply and softwareconsultancy as a proxy for software industry.
Our sample of enterprises for which we detected the year of establishment and the number ofemployees can be traced to the period 2002 to 2007. The total number of enterprises in 2002 was 764and in 2007 it increased to 1430 (see Table 1). The total number includes both employer enterprises(with at least one employee) and the non-employer enterprises (enterprises without employers).

Journal of International Scientific Publication: Economy & Business, Volume 6, Part 4
ISSN 1313-2555, Published at: http://www.scientific-publications.net
46 Published by Info Invest, Bulgaria, www.sciencebg.net
Year Number of enterprises
2002 764
2003 892
2004 995
2005 1125
2006 1278
2007 1430Table 1. Number of enterprises in the Croatian software industry in the period 2002-2007
Source: Financial agency databaseThe oldest enterprises in our sample were founded in 1989. Late 1980s are the time that we couldmark as the beginning of a transition from a planned to a market economy. But the number ofbusinesses established in 1989 which survived to date is small, only 5 of them. The second oldestcohort is the cohort 1990 that counts 27 surviving enterprises. Table 2 provides an overview ofsurviving enterprises by age cohort. Since we do not know the entry rate in the year of establishment itis difficult to make conclusions about the success of the cohort in terms of survival. However, nearlydoubled number of enterprises in the period 2002 to 2007 confirms the previously mentioned claims ofa small efficient size in the software industry in Croatia, absence of entry barriers, human capitalintensity and probably the increase in demand for software applications and services.
Year of foundation Number of survivedenterprises in 2007
1989 51990 271991 271992 551993 541994 631995 151996 261997 201998 361999 282000 152001 512002 39
Table 2. Number of survived enterprises
Source: Financial agency database
We analyse enterprise size distribution as well as the evolution of the enterprise size distribution intwo ways. Firstly we can analyse enterprise size distribution in different years. The second way is to
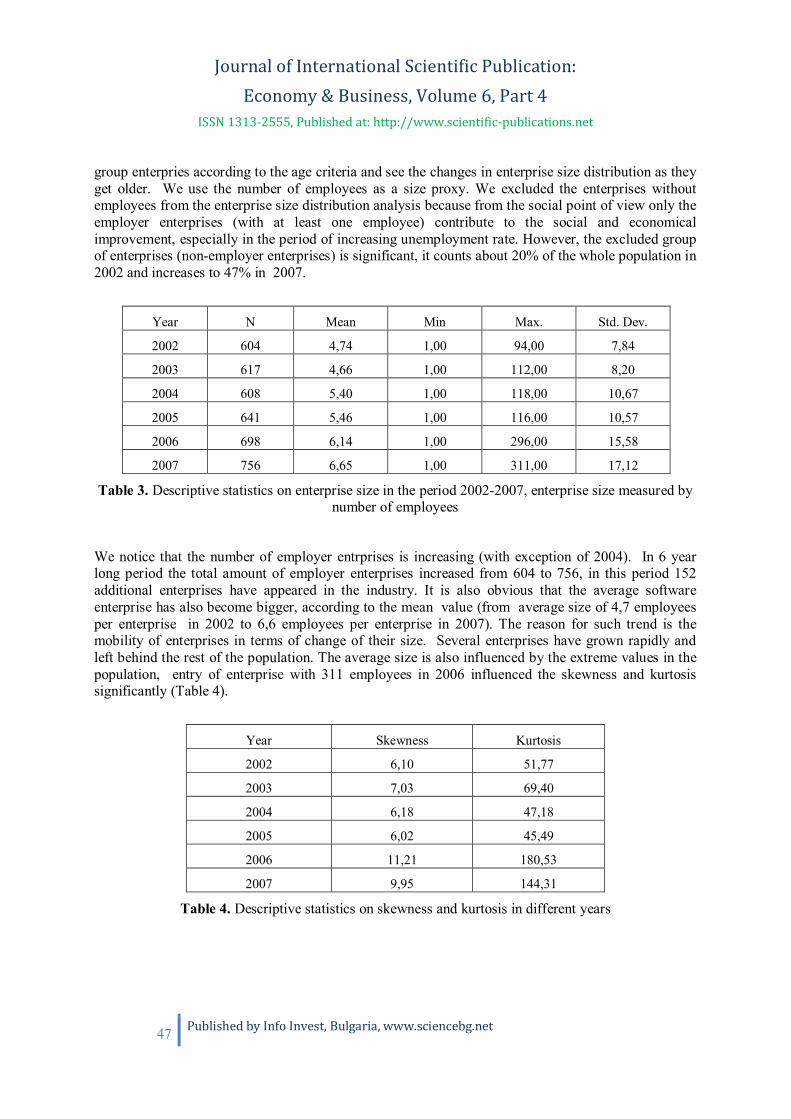
Journal of International Scientific Publication: Economy & Business, Volume 6, Part 4
ISSN 1313-2555, Published at: http://www.scientific-publications.net
47 Published by Info Invest, Bulgaria, www.sciencebg.net
group enterpries according to the age criteria and see the changes in enterprise size distribution as theyget older. We use the number of employees as a size proxy. We excluded the enterprises withoutemployees from the enterprise size distribution analysis because from the social point of view only theemployer enterprises (with at least one employee) contribute to the social and economicalimprovement, especially in the period of increasing unemployment rate. However, the excluded groupof enterprises (non-employer enterprises) is significant, it counts about 20% of the whole population in2002 and increases to 47% in 2007.
Year N Mean Min Max. Std. Dev.
2002 604 4,74 1,00 94,00 7,84
2003 617 4,66 1,00 112,00 8,20
2004 608 5,40 1,00 118,00 10,67
2005 641 5,46 1,00 116,00 10,57
2006 698 6,14 1,00 296,00 15,58
2007 756 6,65 1,00 311,00 17,12
Table 3. Descriptive statistics on enterprise size in the period 2002-2007, enterprise size measured bynumber of employees
We notice that the number of employer entrprises is increasing (with exception of 2004). In 6 yearlong period the total amount of employer enterprises increased from 604 to 756, in this period 152additional enterprises have appeared in the industry. It is also obvious that the average softwareenterprise has also become bigger, according to the mean value (from average size of 4,7 employeesper enterprise in 2002 to 6,6 employees per enterprise in 2007). The reason for such trend is themobility of enterprises in terms of change of their size. Several enterprises have grown rapidly andleft behind the rest of the population. The average size is also influenced by the extreme values in thepopulation, entry of enterprise with 311 employees in 2006 influenced the skewness and kurtosissignificantly (Table 4).
Year Skewness Kurtosis
2002 6,10 51,77
2003 7,03 69,40
2004 6,18 47,18
2005 6,02 45,49
2006 11,21 180,53
2007 9,95 144,31
Table 4. Descriptive statistics on skewness and kurtosis in different years

Journal of International Scientific Publication: Economy & Business, Volume 6, Part 4
ISSN 1313-2555, Published at: http://www.scientific-publications.net
48 Published by Info Invest, Bulgaria, www.sciencebg.net
Enterprise size distribution in observed industry is strongly right- skewed. It is indicated by thepositive values of the skewness parameter. High values of the kurtosis indicators provide evidence ofthe existence of fat or heavy tails.
Figure 1 presents the kernel denisty estimate (following Silverman, 1986) of enterprise sizedistribution in the Croatian software industry in 2005. We use log values of enterprise size (measuredby number of employees). Kernel density estimate is a smoothed version of the histogram. Figurereveals the existence of many micro- and small enterprises and just a few medium and large sizedenterprises.
Figure 1. Kernel estimates of the density of enterprise size in 2005
The following analysis refers to the enterprise size related to the enterprise age. Population ofenterprises that survived from 2002 to 2007 are grouped according to the age criteria (Table 4). It canbe generally observed that average enterprise size increases with enterprise age. Since we excludedfrom our observation enterprises without employees, the smallest enterprises in our sample are thosewith at least one employed person. The prevalence of enterprises with one employee indicates thepersistance of micro-enterprises category in the population of enterprises in the observed industry.

Journal of International Scientific Publication: Economy & Business, Volume 6, Part 4
ISSN 1313-2555, Published at: http://www.scientific-publications.net
49 Published by Info Invest, Bulgaria, www.sciencebg.net
Age groupN Mean Mode
Frequency ofMode Min Max
Std.Dev.
All enterprises 755 6,64 1 270 1,00 311,00 17,13
Age 1 171 5,24 1 89 1,00 311,00 24,48
Age 2-4 171 7,40 1 55 1,00 110,00 16,82
Age 5-9 127 7,08 1 42 1,00 80,00 11,83
Age 10-15 226 6,09 1 74 1,00 134,00 12,90
Age 16 60 9,58 1 10 1,00 120,00 16,09
Table 4. Enterprise size distribution by age cohort, 2007.
Statistical dana on skewness (Table 5) confirm previously mentioned claims that the inital sizedistribution of new enterprises is particularly right-skewed.
Age group Skewness
Age 1 9,56
Age 2-4 4,66
Age 5-9 3,80
Age 10-15 6,45
Age 16 5,69
Table 5. Descriptive statistics on skewness and kurtosis according to the enterprise age group
Generally, statistical dana confirm right-skeweness of enterprise distribution and the existence of fator heavy tails in the case of the Croatian software industry.
CONCLUSIONS
Analysis of the population of enterpries in the software industry in Croatia shows that the sector ispredominantly made up of micro enterprises. Micro-size is a pesistant category, we notice that onlyone group of enterprises over 16 years is approaching the average size of 10 employees per enterprise.It is the group of enterprises aged 16 years and older. The study supports previous empirical researchon the stochastic distribution related to enterprise size. Also in line with research is the existence ofright-skewness and fat tails.
Since the distribution is analyzed based on enterprise size measured by only one measure: the numberof employees, in the next step of research we should definitely make an analysis of the sizedistribution measured in total sales and profits.
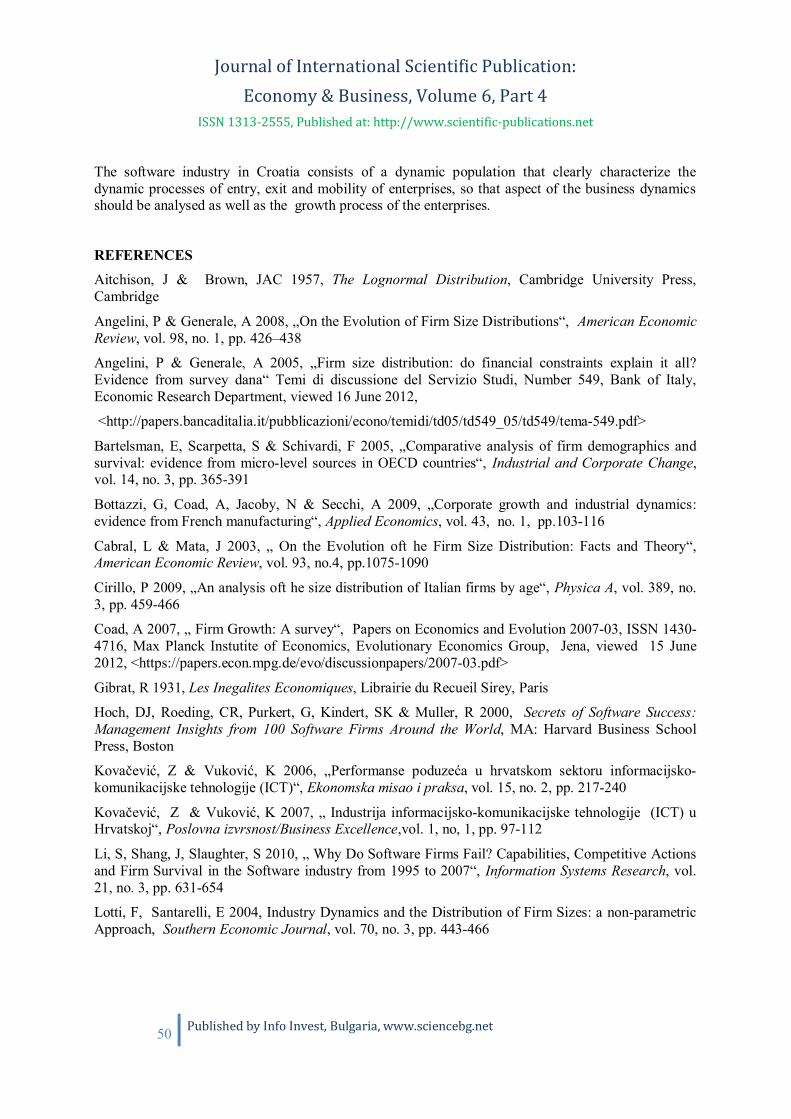
Journal of International Scientific Publication: Economy & Business, Volume 6, Part 4
ISSN 1313-2555, Published at: http://www.scientific-publications.net
50 Published by Info Invest, Bulgaria, www.sciencebg.net
The software industry in Croatia consists of a dynamic population that clearly characterize thedynamic processes of entry, exit and mobility of enterprises, so that aspect of the business dynamicsshould be analysed as well as the growth process of the enterprises.
REFERENCESAitchison, J & Brown, JAC 1957, The Lognormal Distribution, Cambridge University Press,Cambridge
Angelini, P & Generale, A 2008, „On the Evolution of Firm Size Distributions“, American EconomicReview, vol. 98, no. 1, pp. 426–438
Angelini, P & Generale, A 2005, „Firm size distribution: do financial constraints explain it all?Evidence from survey dana“ Temi di discussione del Servizio Studi, Number 549, Bank of Italy,Economic Research Department, viewed 16 June 2012,
<http://papers.bancaditalia.it/pubblicazioni/econo/temidi/td05/td549_05/td549/tema-549.pdf>
Bartelsman, E, Scarpetta, S & Schivardi, F 2005, „Comparative analysis of firm demographics andsurvival: evidence from micro-level sources in OECD countries“, Industrial and Corporate Change,vol. 14, no. 3, pp. 365-391
Bottazzi, G, Coad, A, Jacoby, N & Secchi, A 2009, „Corporate growth and industrial dynamics:evidence from French manufacturing“, Applied Economics, vol. 43, no. 1, pp.103-116
Cabral, L & Mata, J 2003, „ On the Evolution oft he Firm Size Distribution: Facts and Theory“,American Economic Review, vol. 93, no.4, pp.1075-1090
Cirillo, P 2009, „An analysis oft he size distribution of Italian firms by age“, Physica A, vol. 389, no.3, pp. 459-466
Coad, A 2007, „ Firm Growth: A survey“, Papers on Economics and Evolution 2007-03, ISSN 1430-4716, Max Planck Instutite of Economics, Evolutionary Economics Group, Jena, viewed 15 June2012, <https://papers.econ.mpg.de/evo/discussionpapers/2007-03.pdf>
Gibrat, R 1931, Les Inegalites Economiques, Librairie du Recueil Sirey, Paris
Hoch, DJ, Roeding, CR, Purkert, G, Kindert, SK & Muller, R 2000, Secrets of Software Success:Management Insights from 100 Software Firms Around the World, MA: Harvard Business SchoolPress, Boston
Kova evi , Z & Vukovi , K 2006, „Performanse poduze a u hrvatskom sektoru informacijsko-komunikacijske tehnologije (ICT)“, Ekonomska misao i praksa, vol. 15, no. 2, pp. 217-240
Kova evi , Z & Vukovi , K 2007, „ Industrija informacijsko-komunikacijske tehnologije (ICT) uHrvatskoj“, Poslovna izvrsnost/Business Excellence,vol. 1, no, 1, pp. 97-112
Li, S, Shang, J, Slaughter, S 2010, „ Why Do Software Firms Fail? Capabilities, Competitive Actionsand Firm Survival in the Software industry from 1995 to 2007“, Information Systems Research, vol.21, no. 3, pp. 631-654
Lotti, F, Santarelli, E 2004, Industry Dynamics and the Distribution of Firm Sizes: a non-parametricApproach, Southern Economic Journal, vol. 70, no. 3, pp. 443-466

Journal of International Scientific Publication: Economy & Business, Volume 6, Part 4
ISSN 1313-2555, Published at: http://www.scientific-publications.net
51 Published by Info Invest, Bulgaria, www.sciencebg.net
Nambisan, S 2002, Software firm evolution and innovation-orientation, Journal of Engineering andTechnology Management, vol. 19, no. 2, pp. 141-165
Rönkkö, M, Peltonen, J & Pärnänen, D 2011, Software Industry Survey 2011, ISBN: 978-952-248-171-9, Aalto University, School of Science and Technology, viewed 20 June 2012, <http://softwareindustrysurvey.fi/ReportFinland2011.pdf>
Rönkkö, M, Ylitalo, J, Peltonen, J, Parkkila, K, Valtakoski, A, Koivisto, N, Alanen, L & Mutanen, O2010, Software Industry Survey 2010, ISBN: 978-952-248-171-9, Aalto University, School of Scienceand Technology, viewed 20 June 2012, <http://software industrysurvey.fi/ReportFinland2010.pdf>
Silverman, BW 1986, Density Estimation for Statistics and Data Analysis, Chapman and Hall, London
Shapiro, C & Varian, HR 1999, Information Rules, Harvard Business School Press, Boston,MassachusettsThurik, R 2009, „Entrepreneurship, Economic Growth and Policy in Emerging Economies“, UnitedNations University, World Institute for Development Economies Research, Research Paper No.2009/12, ISBN 978-92-9230-181-4
Verheul, I , Wennekers, S, Audretsch, D, Thurik, R 2002, An Eclectic Theory of Entrepreneurship:Policies, Institutions and Culture, in Audretsch, D, Thurik, R, Verheul, I & Wennekers, ARM (eds),Entrepreneurship: Determinants and Policy in a European-US Comparison, Kluwer AcademicPublishers, Boston-Dordrecht, pp. 11-81
Vukovi , K & Kova evi , Z 2010, „ Economic Impact of Information and CommunicationsTechnology – Identifying Its Restraints and Exploring Its Potential“, in M J Er, (ed.), New Trends inTechnologies: Devices, Computer, Communication and Industrial Systems, Sciyo, Rijeka, pp. 119-134

Journal of International Scientific Publication: Economy & Business, Volume 6, Part 4
ISSN 1313-2555, Published at: http://www.scientific-publications.net
52 Published by Info Invest, Bulgaria, www.sciencebg.net
CHALLENGES OF THE EU AND THE NATIONAL SME POLICY:
BETWEEN ADMINISTRATING, MANAGING AND GOVERNINGKsenija Vukovi
Faculty of Organization and Informatics, University of Zagreb
Pavlinska 2, Varaždin, Croatia, [email protected]
Abstract
Due to the evident fact that the SME sector has become a dominant part of the EU economy, the SMEpolicy is increasingly gaining importance. The complexity of the SME policy measures indicates thedifficulties in implementing, controlling and managing the SME policy. This paper provides anoverview and analysis of the measures and programs to support SMEs at an EU level and at the levelof the Croatian economy. While governments in advanced economies are undergoing a period of rapidreform aimed at enhancing its efficiency and effectiveness, the Croatian government has to create theframework conditions for the development of the SME sector.
Key words: SME policy, European Union, Croatia
1. INTRODUCTION
European politicians have recognized the importance of the social role of the entrepreneurs (owners ofsmall and medium-sized enterprises). Therefore it is not strange that the policies supporting small andmedium-sized enterprises (SMEs) began with the first elections in the European Parliament.Politicians are aware that entrepreneurs perform an important economic and social role: employmentand self-employment, contribution to innovation, dynamic efficiency (as opposed to static efficiencyof large firms) and competitiveness.
Policy support for small and medium-sized enterprises is not easy to create, and it also very difficult tocontrol its implementation. Dannreuther (2007) also emphasizes the problem of the EU SME policygovernance. The SME sector is heterogeneous, even in terms of enterprise size. The European SMEdefinition is important for at least two reasons. The first one is to identify the micro, small andmedium-sized enterprises interested in applying for grants or loans aimed at the SMEs, and the secondone is to provide the appropriate information on which criteria are to be satisfied in order to benefitfrom specific legislative provisions for the SMEs (European Commission, 2005). Although there is adefinition of micro, small and medium-sized enterprises, sectorial differences make small companiessmall in one sector or industry, and large in another sector or industry (due to the differences inminimum efficiency size, capital intensity, sunk costs, etc.). In addition, firms themselves havedifferent motives and strategies, some companies are guided by a lifestyle strategy, some are focusedon survival, and there are also those that implement innovation and growth strategy, use moderntechnology, boost growth (slower or faster) or have the intention to achieve growth. The need forreproducing the population of the firms through entry of new firms (in order to compensate for therelatively high failure rates of new businesses) requires effort and active participation of the policy.
According to the report of the European Commission for SMEs (Wymenga et al., 2011), in theEuropean Union more than 19 million enterprises operate in the non-financial sector. SMEs make up

Journal of International Scientific Publication: Economy & Business, Volume 6, Part 4
ISSN 1313-2555, Published at: http://www.scientific-publications.net
53 Published by Info Invest, Bulgaria, www.sciencebg.net
99.8%, while large enterprises make a minor part of the population: 0.2% (Table 1). It is evident thatthe typical company in the EU is a micro-enterprise. The number of micro-enterprises has a share of92.1%, while small businesses make up 6.6% and medium-sized enterprises only 1.05% of the totalnumber of enterprises. The average size of a micro-enterprise, measured by the number of employees,shows that micro-enterprises in the EU employ an average of 2 employees, indicating a decrease in theaverage size of micro-enterprises in relation to the previous reports. Aggregated data for the SMEsector shows that this sector employs two-thirds of the employees in the non-financial sector: 87, 5million employees were in SMEs, where the micro-enterprises employ nearly 30% of total employees.
Micro Small Medium SME Large Total
Number ofenterprises (1000)
19.200 1.380 220 20.800 40 20.840
Number ofemployees(1000)
38.910 26.610 21.950 87.460 43.260 130.720
Employeessper enterprise(1)
2 19 100 4 1.005 6
Table 1. The number of enterprises, number of employees, total sales and added-value in the EUeconomy
Source: De Kook et al. (2011, p. 28.)
At the same time, the productivity increases with the size of the enterprise. The lowest productivitymeasured in added-value is in micro-enterprises (Wymenga et al., 2011). The reasons for lowerproductivity of small and medium-sized enterprises could be lower capital investments, higher fixedlabor costs and using less skilled labor compared to large enterprises.
2. WHAT DOES EU ACTUALLY DO AND WHAT HAS BEEN DONE UP TO NOW FORTHE SME SECTOR?The EU adopts and implements horizontal and vertical measures to encourage SMEs. Horizontalmeasures are aimed at improving the general business environment, while the vertical measures focuson specific problems such as finance, education, etc. Since 2000, the EU has adopted severalimportant documents related to SMEs. These are:
• the Lisbon strategy as a process that directs the SME policy,
• the European Charter on SME from Santa Feira,
• The Small Business Act (SBA) from 2008 based on the “Think small” principle.
The Lisbon Strategy is a process that gives guidelines to the European SME policy. The recentEuropean strategy, Europe 2020, is the continuation of the Lisbon strategy. The European Charter onSME from Santa Feira has been accepted as a determinant for the development of small and medium-

Journal of International Scientific Publication: Economy & Business, Volume 6, Part 4
ISSN 1313-2555, Published at: http://www.scientific-publications.net
54 Published by Info Invest, Bulgaria, www.sciencebg.net
sized enterprises. It consists of ten main principles: education and training for entrepreneurship,cheaper and faster start-up, better legislation and regulation, availability of skills, improving onlineaccess, getting more out of the Single Market, taxation and financial matters, strengthening thetechnological capacity of small enterprises, successful e-business models and top-class businesssupport, stronger development, more effective representation of small enterprises’ interests in the EUand on the national level (European Commission, 2001). Policy makers were expected to becomeaware of the special interests and needs of small businesses.
The EU recognized knowledge, technology and the creation of added-value as an advantage before thelow-wage economies, and also documents the capacity of the SMEs for the growth and innovations asa way to prosperity. The Small Business Act which proclaims the principle “Think small first” isbased on the needs of strengthening the SME sectors and has defined the following important tasks: tocreate an environment in which entrepreneurs and family businesses can succeed and in which theyare rewarded for their success, to secure that honest entrepreneurs who are facing bankrupt quickly getanother chance, to apply the “Think small first” principle means to take into consideration thecharacteristics of small and middle-sized businesses when designing laws and to simplify the currentregulation, to make the public administrations a support for the needs of the SME, and particularly bypromoting the e-government and one-stop-shop solutions, to adapt the tools of the public policy to theneeds of the SME, to support the access to SME finances, especially risk capital, micro-loans andmezzanine financing and to develop a legal and business environment that supports the timelypayment in commercial transactions, to stimulate SMEs to take advantage of the opportunities whichare offered to them by the Single Market, to promote the improvement of the skills of the employeesin SMEs and all forms of innovation, to enables the SMEs to turn ecological challenges intoopportunities, to support and encourage SMEs to use the market growth outside the EU (EuropeanCommission, 2008).
Since it is difficult to establish a strict line between SMEs and entrepreneurship, we will mention theGreen paper on Entrepreneurship in Europe, an important strategic document whose aim is tostimulate the growth and development of small and medium-sized businesses and to create a positiveenvironment for entrepreneurship (European Commission, 2003). It has been pointed out in thisdocument that solutions to encourage more people to become entrepreneurs have to be offered, and tocreate the conditions for the growth of companies.
In addition to the strategic guidance and writing of important documents to support the SMEs, the EUis, in practical terms, providing the SME sector with specific support. We will name some of the mostimportant programs carried out by the EU: The Competitiveness and Innovation Program, knownunder the abbreviation CIP, was passed by the European Parliament and Council in October of 2006,for the period from 2007-2013 With the budget of approximately 3,6 billion Euros (European Union,2006). The purpose of the program is to support innovational activities (including eco-innovations), toprovide small and medium-sized businesses with a better access to finances, to secure the services forsupport of the business operations in the region, to encourage the better use of information andcommunication technologies, to help the development of the information society, to promote anincreased use of renewable energies and the energy efficiency. The Entrepreneurship and InnovationProgram (EIP) is the first component of the Framework Program for Competitiveness and Innovationwith a budget of 2,17 billion Euros for the period from 2007-2013 (European Union, 2006). The targetgroup for this part of the program are the SMEs in the start-up and in the development phase, and theaim is to ease their access to financial resources (the funds for the venture and seed capital, micro-loans for up to 25 000 Euros, loans, guarantees), to encourage them to implement entrepreneurship andinnovation culture, to use innovative and ecological technologies, to coordinate their business with the
Journal of International Scientific Publication: Economy & Business, Volume 6, Part 4
ISSN 1313-2555, Published at: http://www.scientific-publications.net
55 Published by Info Invest, Bulgaria, www.sciencebg.net
environmental policy and to use renewable energy sources, to improve their business with the use ofICT systems, to form clusters, to form public-private partnerships. Inside the CIP the High Growth andInnovative SME Facility (GIF) was launched. The funds are used to facilitate the launch (GIF 1) or todevelop the business operation (GIF 2) of fast-growing innovative small and medium-sizedbusinesses, as an indirect support for loan guarantees of small and medium-sized businesses – theSME guarantee mechanism - SMEG (European Union, 2007). In the framework of the cohesion policyinstruments in the period from 2007-2013, the JEREMIE (Joint European Resources for Micro toMedium Enterprises) initiation was launched by the European Commission (The Directorate-Generalfor Regional Policy) for the promotion of better financing in the development of micro, small andmedium-sized businesses in the regions of the European Union (European Investment Fund, 2009)The JEREMIE initiation offers the EU member states the opportunity to use a part of the structuralfounds of the European Union (the European Regional Development Fund - ERDF).
The new Program for the Competitiveness of enterprises and SMEs, called COSME, has a budget of2.5 billion Euros and its implementation is planned for the period from 2014-2020 (EuropeanCommission, 2011). It is actually the continuation of the CIP program. The objectives of the COSMEprogram are: facilitating access of the SMEs to the finances, creating an environment favorable tobusiness creation and growth, encouraging an entrepreneurial culture, increasing the sustainablecompetitiveness of EU enterprises and helping small businesses to operate outside their homecountries and to improve their access markets. The excepted outcomes of the program are: an easieraccess to finances for entrepreneurs and small businesses, higher rates of self-employment andbusiness development as important sources of job creation. At the national level, it expects to achievemore competitive industries, a higher number of entrepreneurs and higher employment rates.
3. HOW TO MEASURE THE PERFORMANCE OF THE SME POLICY?
The SME policy is made and carried out in the EU, as well as on the national level. Besides, the SMEpolicy is linked to other policies: the employment policy, the social policy, the innovation policy, theindustrial policy, and the entrepreneurship policy. At the same time, the SME policy is a collection ofdifferent measures. It can be a general support policy or a policy for rapidly growing businessessupport and this can be also set up as the government’s trade-off (Lilischkis, 2011). How to controlthe SME policy, then?
Even though the principles of the industrial policy and the support policy to the SMEs are different, asmeasures and instruments, it cannot be said that there is no link between them and that small andmedium-sized businesses cannot feel the effects of the industrial policy. The industrial policy on theEU level acts on a sector by sector basis (eg. metal industry, automobile industry , shipbuilding,textiles industry, ICT industry). The industrial policy encompasses all government interventions thatare focused on the economy (firms, industries, sectors) and influence the industrial structure of theeconomy and / or its change (Kandžija and Cve i , 2010). The basic instruments of this policy aresubsidies and tax facilities. The policies of SME support and the entrepreneurial policy helps theentrepreneurs to achieve competitiveness and flexibility, it gives him direct support throughinstitutions, but there is also the ever present risk for the entrepreneurs and the possibility of failure.Through the industrial policy the risks brought by competition are spread across the whole society (theproblem of the shipbuilding industry in Croatia and two decades of discussions whether it makes senseto separate so much money from the state budget in order to subsidy shipbuilding). The problem of theindustrial policy is that it is uncertain whether all businesses deserve to be subsidized.

Journal of International Scientific Publication: Economy & Business, Volume 6, Part 4
ISSN 1313-2555, Published at: http://www.scientific-publications.net
56 Published by Info Invest, Bulgaria, www.sciencebg.net
Different policies can operate simultaneously in one area. As an example we can mention the sectorialEU policy linked to information and communication technologies. Even though the sectorial policy,because of the distribution of businesses in favor of the micro, small and medium-sized businesses,inevitably in this policy enters the support policy for the SMEs, with the added feature of innovationpolicy characteristic due to the nature of the sector, but also with a special emphasis on businesseswith high growth rates.
Also, there is a close connection and a partial overlapping of the SME policy and the entrepreneurshippolicy. Aernoudt (Table 2) gives a brief comparison of the SME policy and the entrepreneurshippolicy with the difference in causes of the formation of the policy, objectives, target groups, resourcesand focuses of the policies.
Policy SME Entrepreneurship
Legitimating Market failure Lack of entrepreneurs
Objectives To help SMEs with theirrelative disadvantages(compared to largeenterprises)
Be undertaking (start abusiness, grow, mentality)
Target group Businesses Entrepreneurs
Resources Financial (subsidies) Mainly non-financial
Focus on Business environment Entrepreneurial culture
Table 2. SME and entrepreneurship policy: a comparison
Source: Aernoudt, R., European enterprise policy, according to Aernoudt (2007),http://www.oecd.og/dataoecd/1/56/39745299.pdf
According to Aernoudt, the SME policy would be more efficient in an entrepreneurial environment.Every level of society would have their task and thereby function:
- individuals – to consider entrepreneurship as a career option,
- enterprises – to adapt to change in order to survive and seize new opportunities
- society – to create a supportive environment where the entrepreneurial initiative and risk-taking istreated as valuable as well as the contribution of enterprises to society.
Since the effects or outcomes of the public sector are realized by a number of organizations, thegovernment performance should not be measured on an organizational level but on the level of policy.The concept of efficiency in the public sector is based on a generally accepted "logic model" ofperformance in nonprofit and public organizations (Berman, 2006, p. 147), which, in its simplest form,can be showed through a logical sequence:
input activity output outcome goals.

Journal of International Scientific Publication: Economy & Business, Volume 6, Part 4
ISSN 1313-2555, Published at: http://www.scientific-publications.net
57 Published by Info Invest, Bulgaria, www.sciencebg.net
This model seems to be a linear type function, but the reality is more complex than such a simplefunction. The outcomes and the effects are subject to influences that come with changes in the politicalenvironment. The first problem arises from the output-outcome relationship.
The disrupted relationship output-outcome stems from a number of reasons: the lack of marketmechanisms, the politicians who overestimate or underestimate the outcomes, and citizens who inhibitachieving outcomes because of their reactions to government measures. Outcomes or effects are themost important criteria in assessing government performance (Bouckaert and Halligan, 2008). Thetype and level of outcomes are influenced by the social needs (in the moment of the economic crisis:unemployment and lack of growth). Needs of the society are the base for creating strategic andoperational objectives of specific policies.
There are three levels on which it is necessary to analyze and provide support for the SMEs andentrepreneurs (Autio et al., 2007):
- micro-level (the entrepreneur and enterprise) with a focus on the motivation and skills of theentrepreneurs and to help enterprises overcome their resource disadvantages: capital, social capital,reputation, business expertise, technological expertise, innovation on the enterprise level,infrastructure,
- mezzo level (sector/industry): networks (innovation clusters, business networks, financial networks);opportunities (growing markets, new markets, international markets and public markets),
- macro level (national and EU level/environment): creating entrepreneurial culture, innovation andresearch programs and regulations (bureaucracy, bankruptcy laws).
Outputs are never an end in itself for the government. The most important goal is to achieve the trustof the citizens in all institutions and organizations, especially in public institutions and organizations.The relationship between the effects/outcomes and trust provides the second problem in thegovernment policy (Bouckaert and Halligan, 2008).
The government has a limited amount of resources that it can spend on the SME policy and it attemptsto achieve the economic and social welfare. The benefits from the SME policy could even be negativeif the funds spent do not have a positive effect on the performance of the enterprise, if the enterprisewould have behaved in the same way without the subsidies – the substitution effect (Lilischkis, 2011).The maximum return of the investment can be less than the total amount spent on incentives forSMEs, for example, due to the inefficiency of the administration. An effective but inefficient policy isinadequate, the effectiveness is considered to be the most important measures of performance.
4. THE CROATIAN SME POLICY
Figures show that the Croatian economy, as well as the EU economy, has become a micro-economyand that the “Think Small First” principle also makes sense in the case of Croatia. Table 3 shows thatthe share of SME enterprises has increased from 99% to 99.5% in nine years.

Journal of International Scientific Publication: Economy & Business, Volume 6, Part 4
ISSN 1313-2555, Published at: http://www.scientific-publications.net
58 Published by Info Invest, Bulgaria, www.sciencebg.net
2001. 2010.
Number ofenterprises
% Number ofenterprises
%
Small enterprises 54.213 95.004
Mediumenterprises
2.203 1.379
SME sector 56.416 99 96.383 99.5
Large enterprises 571 1 375 0.5
Total 56.987 100 96.758 100
Table 3. The enterprise size distribution in the Croatian economy: 2001 and 2010
Source: CEPOR (2011), p. 13, http://www.cepor.hr/SME%godišnjak_final.pdf>
Economic indicators (Table 4) show that the SME sector accounts for about half of the total Croatianoutput. It also employs about 2/3 of all employees (as in the EU). The crisis has probably affected theSME sector as the share of SMEs in the Croatian GDP has decreased by almost 2% from 2009 to2010. The export share of large enterprises (almost 60%) is an obvious indicator that it is necessary togive support to the internationalization of the SME sector.
Indicator Enterprise size
Small Medium Large
2009. 2010. 2009. 2010. 2009. 2010.
GDP (mil.EURO)
27.511.012 26.573.176 15.740.035 14.604.100 38.101.932 38.581.047
GDP (%) 33,8% 33,3% 19,3% 18,3% 46,8% 48,4%
Employment 417.979 415.320 166.916 157.147 300.394 287.341
Employment (%) 47,2% 48,3% 18,9% 18,3% 33,9% 33,4%
Export (mil.EURO)
2.034.310 2.409.751 2.335.603 2.527.198 6.405.218 7.084.360
Export (%) 18,9% 20,1% 21,7% 21,0% 59,4% 58,9%
Table 4. Enterprise size, GDP, employment and export in 2009 and 2010
Source: CEPOR (2011), p. 14, http://www.cepor.hr/SME%godišnjak_final.pdf
The Croatian government, faced with difficult economic conditions, adopts a strategy and set ofmeasures in 2012 to give support to the SME sector and entrepreneurship. An amount of 100 millionEuros will be delivered through the following programs: competitive entrepreneurship, loans and

Journal of International Scientific Publication: Economy & Business, Volume 6, Part 4
ISSN 1313-2555, Published at: http://www.scientific-publications.net
59 Published by Info Invest, Bulgaria, www.sciencebg.net
guarantees, education for entrepreneurship, improvement of entrepreneurial infrastructures, EUprograms and projects, institutional support to entrepreneurship development (Government of theRepublic of Croatia, 2012a).
The strategy presents the general and the specific objectives as well as the expected outputs and effectsover the three-year period (Government of the Republic of Croatia, 2012b). The final goal is toenhance the competitiveness of the Croatian entrepreneurship by supporting the creation ofcompetitive, innovative and growing entrepreneurships. Specific goals, presented as animplementation of the Entrepreneurial impulse measure, can be achieved at a micro, mezzo and macrolevel. Micro-level measures are aimed at facilitating access to finances by loans and other forms offinancing, education for entrepreneurship in the form of a formal educational system as well as in theform of life-long learning, effective entrepreneurial infrastructure, implementation of the investmentsupporting law. The mezzo-level goal is to enhance the international competitiveness. The goal of themacro-level is to improve the entrepreneurial culture and business environment.
The main problems of the all governments' strategies and measures up to now:
• problems of implementation and control,
• the lack of consistency and long-run planning.
Outputs that can be a proximate measure of the success of the program are: an increase in the numberof enterprises, an increase in the share of entrepreneurs, increasing the TEA index(TotalEntrepreneurial Activity index which presents the number of “nascent” and new entrepreneurs as apercentage of the population between 18 and 65 years of age), the number of loans, grants,investments, projects, number of participants in educational programs, etc. The outcomes of thegovernment program are easy to detect: employment, self-employment, competitiveness, innovationand growth.
Despite all the previous failures of the government policy, there is a vital part of the economy thatsurvives and exploits opportunities on the market. Survey evidence from countries in transitionsuggest that many enterprises are set up, survive and sometimes even grow despite the government,because of the creativity of individuals in mobilizing resources and their flexibility in adapting tohostile external environments (Smallbone and Welter, 2001).
5. CONCLUSIONS
To achieve the EU economy competitiveness, as well as in the Croatian economy, it is important tofocus on a few things:
• facilitate the entry of new firms, but also allow the honest entrepreneurs in bankruptcy to recover assoon as possible and to start a new entrepreneurial venture,
• facilitate a position for growing businesses,
• provide support for the internationalization of SMEs.
It could be argued that the complementary policies aimed at small and medium-sized enterprises(SMEs general policy support, support for emerging companies, entrepreneurial policy) are necessaryto empower the EU economy. Also, the policy should not be taken as a principle for favoring SMEs.Large companies also have an important function in the economy and its advantages.

Journal of International Scientific Publication: Economy & Business, Volume 6, Part 4
ISSN 1313-2555, Published at: http://www.scientific-publications.net
60 Published by Info Invest, Bulgaria, www.sciencebg.net
It is not easy to find a model that would generate the highest innovation rates and the highest growthrates. Many factors influence innovation and growth: the size of the market, the stages of marketdevelopment, the industries in which enterprises operate, etc. If all relevant factors are not studied andnot monitored, policies that favor certain types of enterprises may have poor or no effects to theeconomy.
The role of the European Union, taking into account the relationship between centralization andsubsidiarity, should be to resolve the problems that should be resolved at an EU level, such as jointventure capital market or enhancing opportunities for the internationalization of SMEs, creating acommon market and placing a greater emphasis on the Enterprise Europe Network. Member Statesshould find themselves the most appropriate policy in order to address the needs of their SME sectorin the most acceptable way (Lilischkis, 2011).
REFERENCES
Aernoudt, R 2007, From SME policy to entrepreneurship policy, OECD Workshop, viewed on 29May 2012, <http://www.oecd.og/dataoecd/1/56/39745299.pdf>
Autio, E, Kronlund, M & Kovalainen, A 2007, High-Growth SME Support Initiatives in NineCountries: Analysis, Categorization and Recommendations, MTI Publications, Helsinki
Bouckaert, G & Halligan, J 2008, Managing Performance: International comparisons, Routledge,Taylor & Francis Group, London and New York
Berman, EM 2006, Performance and productivity in public and nonprofit organizations, 2nd edition,M.E. Sharpe, Armonk, New York
CEPOR - Centar za politika razvoja malih i srednjih poduze a i poduzetništva 2011, Izvješ e omalim i srednjim poduze ima u Hrvatskoj – 2011, viewed on 29 May 2012,
<http://www.cepor.hr/SME%godišnjak_final.pdf>
Dannreuther, C 2007, EU SME policy: on the edge of governance, CESifo Forum, 2/2007, pp.7-13, viewed on 25 May 2012, <http://www.cesifo-group.de/portal/pls/portal/docs/1/1191656.PDF>
De Kok, J, Vroonhof, P, Verhoeven, W, Timmermans, N, Kwaak, T, Snijders, J & Westhof, F 2011,Do SMEs create more jobs?, EIM Business & Policy Research, Zoeltermeer, 2011, viewed on 6 June2012, <http://ec.europa.eu/enterprise/policies/sme/facts-figures-analysis7performance-review/files/supporting-documents/2012/do-sme-create-more-jobs_en.pdf>
European Commisssion 2001, European Charter for Small Enterprises, viewed on 3 March 2012,<http://ec.europa.eu/enterprise/policies/sme/documents/charter/index_en.htm>
European Commisssion 2003, Green Paper – Entrepreneurship in Europe, COM (2003), 27
European Commission 2005, The new SME definition, User guide and model declaration, Enterpriseand Industry Publications, , viewed on 6 June 2012,
<http://ec.europa.eu/enterprise/policies/sme/files/sme-definition/sme_user_guide_en.pdf>
European Commisssion 2008, „Think Small First“ – a „Small Business Act“ for Europe, COM(2008) 394 final, viewed on 3 March 2012,
<http://eur-Lex.Europa.eu/LexUriServ/LexUriServ.do?uri=COM:2008:0394:FIN:en:PDF
Journal of International Scientific Publication: Economy & Business, Volume 6, Part 4
ISSN 1313-2555, Published at: http://www.scientific-publications.net
61 Published by Info Invest, Bulgaria, www.sciencebg.net
European Commission 2011, Programme for the Competitiveness of enterprises and SMEs(COSME) 2014-2020, viewed on 15 June 2012, <http://ec.europa.eu/cip/cosme/index_en.htm>
European Investment Fund 2009, Executive Summaries on Evaluations Studies on SME Access toFinance in EU Member States carried out by EIF int he Context of the JEREMIE (Joint EuropeanResources for Micro to Medium Enterprises), viewed on 16 June 2012,
<http://ec.europa.eu/regional-policy/sme/archive/funds /2007/jjj/doc/pdf/jeremie_sme_access.pdf>
European Union 2006, Decision No 1639/2006/EC of the European Parliament and of the Councilestablishing a Competitiveness and Innovation Framework Programme (2007 to 2013), OfficialJournal of the European Union, L 310/15
European Union 2007, Notice of implementation oft he SME Guarantee Facility under theCompetitiveness and Innovation Framework Programme (2007-2013), Official Journal of theEuropean Union, 2007/C 226/02
Government of the Republic of Croatia, Ministry of Entrepreneurship and Crafts, 2012a, Strateškiplan za razdoblje od 2012.-2014., viewed on 6 June 2012,
<http://www.minpo.hr/userDocsImages/MINPO%20STRATEŠKI%PLAN%202012%20DO%202014.pdf>
Government of the Republic of Croatia, Ministry of Entrepreneurship and Crafts, 2012b,Poduzetni ki impuls, Plan poticanja poduzetništva i obrta za 2012. godinu, viewed on 6 June 2012,<http://www.minpo.hr/userDocsImages/PODUZETNICKI%20IMPULS.PDF>
Kandžija, V & Cve i , I 2010, Ekonomika i politika Europske unije, Ekonomski fakultet Sveu ilišta uRijeci, Rijeka
Lilischkis, S. 2011, Policies for high-growth innovative SMEs, INNO-Grips Policy Brief No. 2,European Commisssion, viewed on 20 May 2012, <http://www.eban.org/resource-center/news/267-inno-grips-policy-brief-no-2>
Smallbone, D & Welter, F 2001, „The Role of Government in SME Development in TransitionEconomies“, International Small Business Journal , vol. 19, no. 4, pp. 63-77
Wymenga, P., Spanikova, V, Derbyshire, J & Barker, A 2011, Are EU SMEs recovering? AnnualReport on EU SMEs 2010/2011, Rotterdam, Cambridge
Journal of International Scientific Publication: Economy & Business, Volume 6, Part 4
ISSN 1313-2555, Published at: http://www.scientific-publications.net
62 Published by Info Invest, Bulgaria, www.sciencebg.net
INTEGRATION OF FINANCIAL MARKETS: PROBLEMS AND OPPORTUNITIES
Zhanna D. Serikbayeva
International Academy of Business, Almaty, Rozybakiyeva st., 227, Kazakhstan
Abstract
At the present stage of globalization and increasing of competition is necessary to solve problems ofthe integration of financial markets. The goal of the paper consist in investigation of the mechanism ofintegration of national financial market to the global market and suggestion significant challenges inthe current environment and the scheme of integrated financial market.
Key word: financial market, stock exchange, globalization, CIS, EurAsEC, securities markets, theintegration of financial markets
1. INTRODUCTION
The global financial market is undergoing major changes. This is associated with the development ofnew markets, introduction of new instruments, consolidation, and consolidation of stockexchanges, changes in business principles. One of the main trends of financial institutionsdevelopment lies in their internationalization.
The reasons for these processes are seen in the sharply increased globalization and consolidation of thefinancial business in context of increased competition. This article seeks to throw light on thisrelationship by first discussing the major problems that prevent the integration of financial markets,including the scheme of integrated financial market, as well as suggestions for their solution.
In spite of some economic and political differences, episodically arising between post-sovietscountries, integration processes are gaining momentum. It is created Anticrisis Fund of theEurasian Economic Community. Authorities and economic counterparts of the CIS countries aretrying to work out common approaches to overcome the crisis. From this perspective, the crisis hasgiven additional impetus to integration processes. No wonder in 2009 were signed theofficial agreement on the Common Customs Tariff and Customs Code. Also in April 2000 inMoscow, it was established the International Association of CIS Exchanges (IAE CIS) in orderto coordinate efforts to the development of organized financial markets in accordance withinternational standards.
It is noted that certain infrastructure and legal basis of integration processes in CIS/EurAsEC hasalready been created. At the same time, the degree of integration of financial and currencymarkets does not meet the level of interaction between economies, capital flows and the populationof the CIS countries. Particular attention is paid to the development of stock markets priorities, to theinteraction of CIS Exchanges and to the prospects of the national currencies trading.
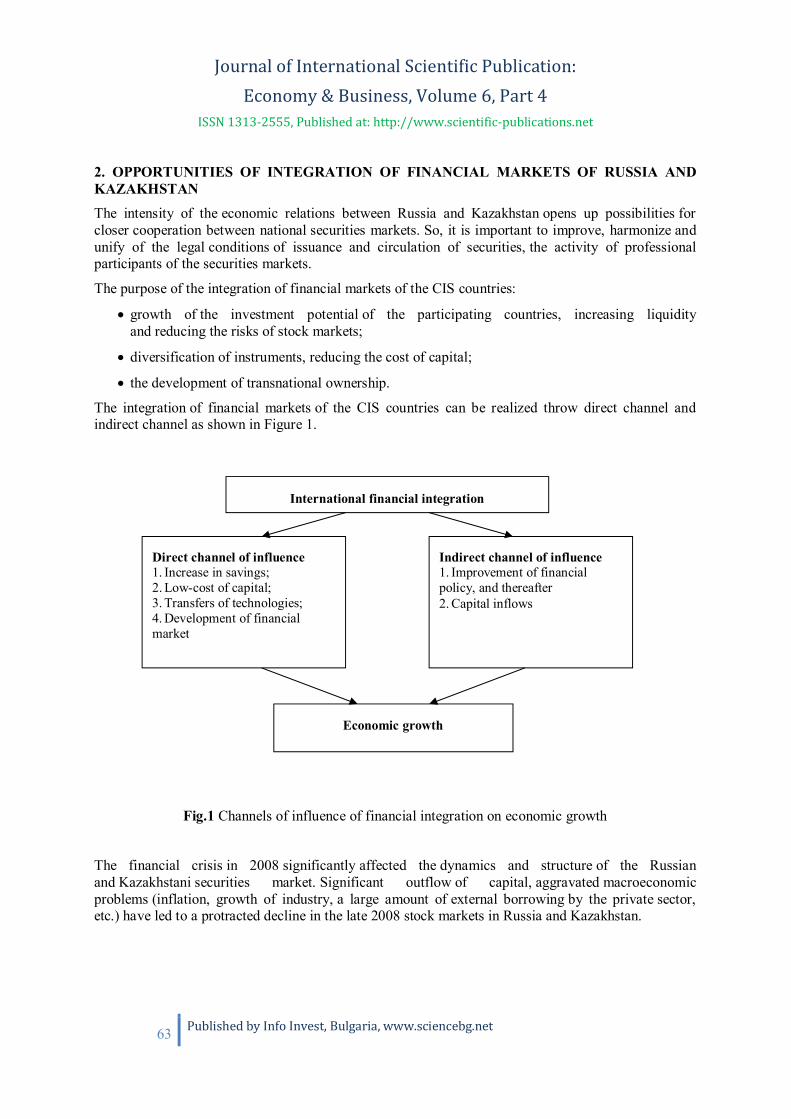
Journal of International Scientific Publication: Economy & Business, Volume 6, Part 4
ISSN 1313-2555, Published at: http://www.scientific-publications.net
63 Published by Info Invest, Bulgaria, www.sciencebg.net
2. OPPORTUNITIES OF INTEGRATION OF FINANCIAL MARKETS OF RUSSIA ANDKAZAKHSTANThe intensity of the economic relations between Russia and Kazakhstan opens up possibilities forcloser cooperation between national securities markets. So, it is important to improve, harmonize andunify of the legal conditions of issuance and circulation of securities, the activity of professionalparticipants of the securities markets.
The purpose of the integration of financial markets of the CIS countries:
growth of the investment potential of the participating countries, increasing liquidityand reducing the risks of stock markets;
diversification of instruments, reducing the cost of capital;
the development of transnational ownership.
The integration of financial markets of the CIS countries can be realized throw direct channel andindirect channel as shown in Figure 1.
Fig.1 Channels of influence of financial integration on economic growth
The financial crisis in 2008 significantly affected the dynamics and structure of the Russianand Kazakhstani securities market. Significant outflow of capital, aggravated macroeconomicproblems (inflation, growth of industry, a large amount of external borrowing by the private sector,etc.) have led to a protracted decline in the late 2008 stock markets in Russia and Kazakhstan.
International financial integration
Direct channel of influence1. Increase in savings;2. Low-cost of capital;3. Transfers of technologies;4. Development of financialmarket
Indirect channel of influence1. Improvement of financialpolicy, and thereafter2. Capital inflows
Economic growth
Journal of International Scientific Publication: Economy & Business, Volume 6, Part 4
ISSN 1313-2555, Published at: http://www.scientific-publications.net
64 Published by Info Invest, Bulgaria, www.sciencebg.net
Formation of the securities markets of Russia and Kazakhstan happened almost simultaneously withthe process of market economy formation. Fundamentals of the securities market were laid in the 90s,when under the influence of denationalization and privatization processes were set up joint-stockcompanies, brokerage firms, stock exchanges.
Almost simultaneously in both states has been developed legislation regulating the securities markets,and created the appropriate infrastructure, including stock exchanges, depositories and clearingorganizations. Under the influence of various factors, including institutional building, introductionof legislation, carrying out social and economic reforms, the markets of these countries, subsequently,in addition common features, acquired its own characteristics and peculiarities.
Also, decline in the proportion of nonresidents' transactions, the share of privateinvestors, decreased the activity of other categories of investors, including investment funds. Stockmarkets in Russia and Kazakhstan are leaders in the region, well ahead of absolute figures for otherCIS states. In Belarus there is functioning the government securities market, but there is no substantialprogress in the development of the corporate securities market. In Central Asia, organized securitiesmarket is underdeveloped, although in recent years demonstrates a positive trend.
Now the level of development of securities markets in Russia and Kazakhstan is still characterized byweak investor base. Many legal issues of the market are at discussion stage or elaboration, andtherefore securities market participants are less protected than in developed markets. There is notdeveloped derivatives market allowing risks insuring.
In Kazakhstan, the most active agents of the securities market, as well as in Russia, arethe banks. They act as issuers of their own stocks, bonds, bills, depositary certificates andother securities, as well as investors, buying securities and carrying with them brokerage operations.Companies working in the retail sector and in the sphere of collective investments do not hidethat they are focused on attraction in Kazakhstan free financial resources and further invest thismoney abroad. This approach does not carry the benefits of Kazakh economy, but createsa competitive environment, increasing the efficiency of the market.
Financial institutions of the CIS countries are increasing their presence in the markets of eachother. The most active in foreign expansion in the CIS banks in Russia and Kazakhstan. The largest ofthem Russian - VTB, Sberbank and Alfa-Bank and Kazakhstan - BTA Bank, Kazkommertsbankand Halyk Bank. Unlike banks and investment companies, mutual presence of the stockmarket infrastructure institutions is still limited.
Kazakhstan organizations are interested in the Russian financial market, primarily as a mechanism toattract capital. Russian business is considering Kazakhstan's capital market more as a "bridge", whichprovides access to natural resources of the RK. Accordingly, if a significant part of Kazakhstanorganizations interested in the withdrawal of its securities on the Russian market, Russian companiesare not willing to provide.
For Kazakhstan's securities market’s professional participants’ priority sectors for investment areextraction of natural resources, financial institutions, energy and telecommunications. Russian marketparticipants limit the scope of its interest in Kazakhstan, so they demonstrate interest to naturalresource extraction and financial institutions.
Having said that, securities of Russian issuers are purchased not on Russian stock exchanges, but oninternational exchanges in the form of GDR and ADR. In current situation Kazakh issuers arenot interested in the withdrawal of its securities on the Russian market - most of them listed on the
Journal of International Scientific Publication: Economy & Business, Volume 6, Part 4
ISSN 1313-2555, Published at: http://www.scientific-publications.net
65 Published by Info Invest, Bulgaria, www.sciencebg.net
LSE. Immediate circulation of foreign securities on the Russian securities market is severelyrestricted by high level of requirements established by the law.
Pension funds, which before the crisis were the largest group of domestic investors, by virtue of therules of investing have reduced their activity in the domestic securities market. Money of privatepension funds or asset of executive companies can be considered as a potential source ofRussian portfolio investment in securities of Kazakhstan organizations. However, to realize theopportunities provided by Russian law, it is necessary to form the corresponding mutual funds,including securities of Kazakhstani issuers. This is unlikely to happen soon, while the capitalmarket of the RK is recovered from the effects of the global financial crisis or until the securities ofthe RK issuers will not be withdrawn on the Russian stock market capable of providing them withadequate liquidity.
Accumulative pension funds (APF) are active investors in the Kazakh financial market and foreigncountries. However, in the near future we should not expect substantial investments to foreigncountries, including in Russian securities. In the current period investing strategy of pensionassets was changed in favor of increasing the share of government securities of the RK whilesimultaneously reducing investment in securities of foreign issuers.
From the three stock exchanges in the context of investment to the economy of another countryRussian Stock Exchange (RTS) is most active. Today it only has a subsidiary in Kazakhstan (JSC"Commodity Exchange" ETS ").
Russian securities markets are showing interest in cooperation with Kazakh partners and would liketo expand the list of tradable instruments on their facilities due to foreign securities.
Although a significant burden to facilitate interaction between members of an organized trade of bothcountries is entrusted to the stock exchanges, an important role in this process is given to thelegislature. For example, both the stock exchanges and capital market professionals need to be anacceptable mechanism of nominal holding for foreign investors, the relevant legislation of bothcountries, as well as in the developed clearing obligations, including centralized.
An important element of the technology integration process should be recognized development andapplication of common technologies of electronic documents that would standardize and accelerateinformation exchange both between stock exchanges and between trading participants.
With this project, in fact, project for the Eurasian exchanges of agricultural products, raw materialsand food being prepared at the initiative of the EurAsEC Integration Committee with the participationof Russian and Kazakh partners competes. As a base for the project is selected OJSC"Belarusian Universal Commodity Exchange".
Over the past 10 years, both countries had done a lot of organizational work, but there is no efficiencyintegration, and a joint exchange area.
3. PROBLEMS OF INTEGRATION OF FINANCIAL MARKET OF THE CIS COUNTRIES
In search of an answer to a question about the causes of low financial integration, which occurs on thebackground of trade cooperation, inter-connected infrastructure and close historical and culturalrelations between the two countries can address to experience of Asian region. It is known, Asiancountries are closely linked in trade, but the stock markets at the same time hardly interact. Bank forInternational Cooperation has analyzed the integration of stock markets in Asia. In the study, four
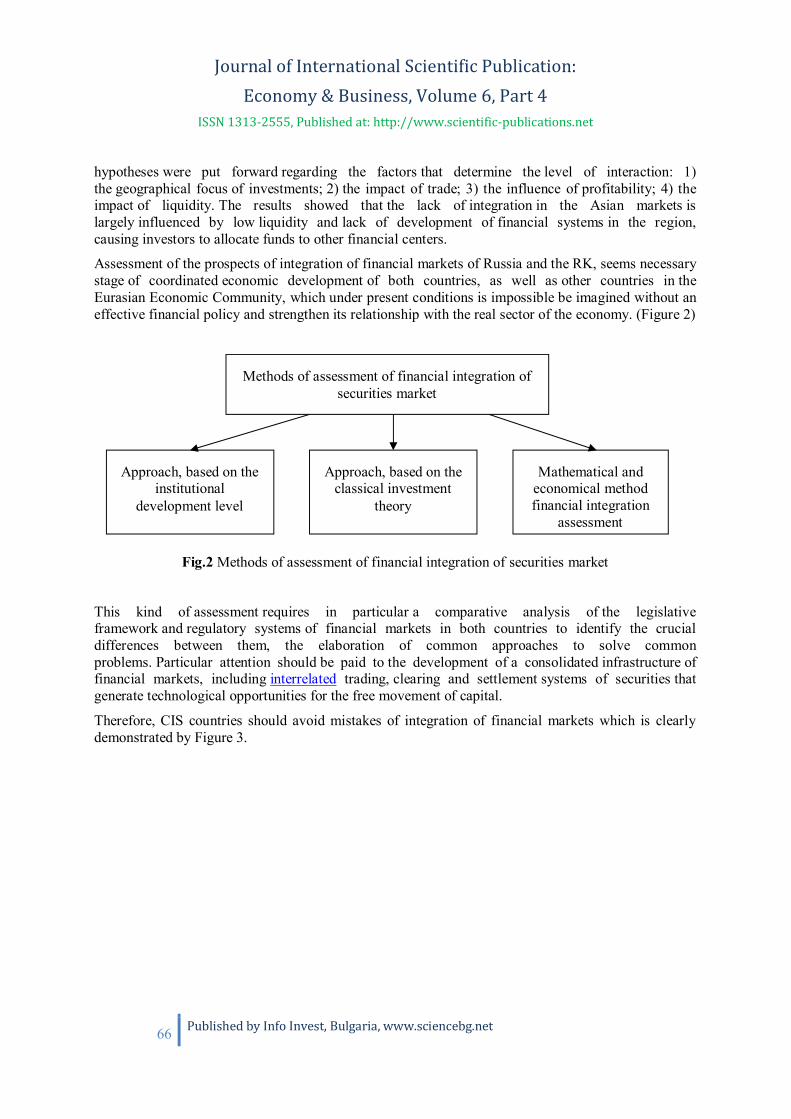
Journal of International Scientific Publication: Economy & Business, Volume 6, Part 4
ISSN 1313-2555, Published at: http://www.scientific-publications.net
66 Published by Info Invest, Bulgaria, www.sciencebg.net
hypotheses were put forward regarding the factors that determine the level of interaction: 1)the geographical focus of investments; 2) the impact of trade; 3) the influence of profitability; 4) theimpact of liquidity. The results showed that the lack of integration in the Asian markets islargely influenced by low liquidity and lack of development of financial systems in the region,causing investors to allocate funds to other financial centers.
Assessment of the prospects of integration of financial markets of Russia and the RK, seems necessarystage of coordinated economic development of both countries, as well as other countries in theEurasian Economic Community, which under present conditions is impossible be imagined without aneffective financial policy and strengthen its relationship with the real sector of the economy. (Figure 2)
Fig.2 Methods of assessment of financial integration of securities market
This kind of assessment requires in particular a comparative analysis of the legislativeframework and regulatory systems of financial markets in both countries to identify the crucialdifferences between them, the elaboration of common approaches to solve commonproblems. Particular attention should be paid to the development of a consolidated infrastructure offinancial markets, including interrelated trading, clearing and settlement systems of securities thatgenerate technological opportunities for the free movement of capital.
Therefore, CIS countries should avoid mistakes of integration of financial markets which is clearlydemonstrated by Figure 3.
Methods of assessment of financial integration ofsecurities market
Approach, based on theinstitutional
development level
Approach, based on theclassical investment
theory
Mathematical andeconomical methodfinancial integration
assessment
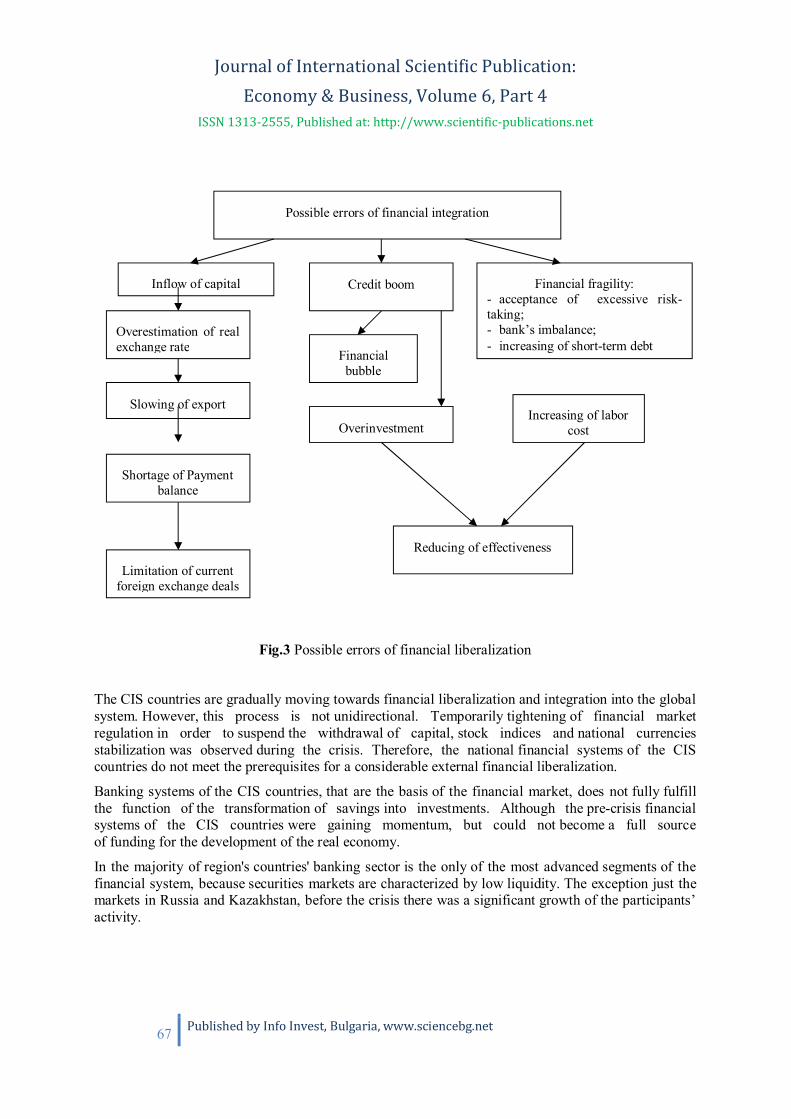
Journal of International Scientific Publication: Economy & Business, Volume 6, Part 4
ISSN 1313-2555, Published at: http://www.scientific-publications.net
67 Published by Info Invest, Bulgaria, www.sciencebg.net
Fig.3 Possible errors of financial liberalization
The CIS countries are gradually moving towards financial liberalization and integration into the globalsystem. However, this process is not unidirectional. Temporarily tightening of financial marketregulation in order to suspend the withdrawal of capital, stock indices and national currenciesstabilization was observed during the crisis. Therefore, the national financial systems of the CIScountries do not meet the prerequisites for a considerable external financial liberalization.
Banking systems of the CIS countries, that are the basis of the financial market, does not fully fulfillthe function of the transformation of savings into investments. Although the pre-crisis financialsystems of the CIS countries were gaining momentum, but could not become a full sourceof funding for the development of the real economy.
In the majority of region's countries' banking sector is the only of the most advanced segments of thefinancial system, because securities markets are characterized by low liquidity. The exception just themarkets in Russia and Kazakhstan, before the crisis there was a significant growth of the participants’activity.
Possible errors of financial integration
Inflow of capital Credit boom Financial fragility:- acceptance of excessive risk-taking;- bank’s imbalance;- increasing of short-term debt
Overestimation of realexchange rate Financial
bubble
Slowing of export
Shortage of Paymentbalance
Limitation of currentforeign exchange deals
OverinvestmentIncreasing of labor
cost
Reducing of effectiveness

Journal of International Scientific Publication: Economy & Business, Volume 6, Part 4
ISSN 1313-2555, Published at: http://www.scientific-publications.net
68 Published by Info Invest, Bulgaria, www.sciencebg.net
Foreign institutional investors are reluctant to work in the securities markets of the CIS countries,believing that the infrastructure in emerging markets is built mainly by short-term speculative andnoninvestment operations.
Technological capabilities and the competition pressure make the stock exchanges go to internationalfinancial markets. Compared with Russia, Kazakhstan's securities market characterized by lowsecondary market liquidity of financial instruments, related mainly to the lack of suchtools, underdeveloped market of derivative securities and the limited development of the stockmarket. Many Kazakh issuers have not yet willing to disclose financial information and prevent theexecutive company of external shareholders. These problems are inherent in thesecurities markets of CIS countries, which together with the legislative barriers have a negativeimpact on integration processes in the region.
As noted previously, that integration of currency markets does not correspond to the degreeof integration of economies, capital flows and the population of the CIS countries. Today in nationalcurrencies of CIS countries the number of calculations is not to amount to much and use dollar andeuro as world currency leads to increased costs of foreign trade activities, the deterioration of themutual settlement of financial transactions, forcing economic entities of the CIS countries to keepadditional amount in foreign currencies that connected with currency risk.
During the crisis, the need to abandon this practice has become even more vivid. Connectivity and thesimilarity of the economies of the CIS countries led to synchronization of economic cycles andcomparability of impact of external shocks to their financial systems. So, fluctuations in the nationalcurrencies of CIS countries to each other were significantly less than their fluctuations against the U.S.dollar or the euro.
From a comparative analysis of the regulatory framework for counter movement of capital of theRussian Federation (RF) and the Republic of Kazakhstan (RK) in the form of securitiesmarket instruments implies that there are no insurmountable legal obstacles. Moreover, certain legalprerequisites for such a movement have already been created. However, the financial instability andthe lack of embeddedness of capital markets of Russia and the RK into the global financial market inthe form of a joint international financial center (IFC), they remain unclaimed.
So, exactly in these countries of EurAsEC - Russia and Kazakhstan - there are no explicit political andother obstacles to the integration of capital markets.
4. THE CONCLUSIONSThe processes of globalization and modern trends in the internationalization of the financialinfrastructure have a significant influence on the activity of financial institutions in the CIScountries. The existence of modern electronic stock exchanges facilities and the use of Internettechnology greatly simplify the process of integration. Creating of alliances increases the liquidityof securities markets, and provides cost savings. The experience of the interaction of organizedmarkets of CIS countries shows that their effective development requires serious improvement tradepayment infrastructure.
However, some effort on the stock exchanges of technological standardization and harmonization oftrade settlement is not enough consistent rules for admission of non-resident participants inthe ethnic markets are needed. The successful implementation of integration projects is impossiblewithout the active participation of the central national banks and other financial market regulators
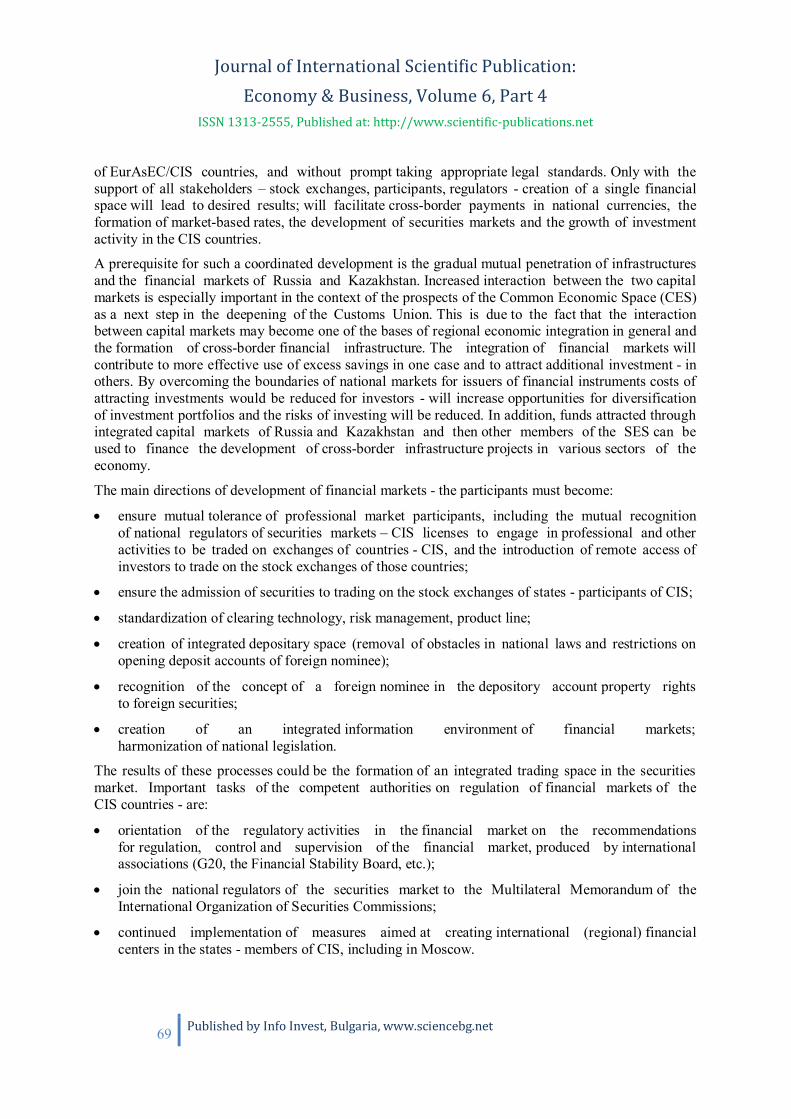
Journal of International Scientific Publication: Economy & Business, Volume 6, Part 4
ISSN 1313-2555, Published at: http://www.scientific-publications.net
69 Published by Info Invest, Bulgaria, www.sciencebg.net
of EurAsEC/CIS countries, and without prompt taking appropriate legal standards. Only with thesupport of all stakeholders – stock exchanges, participants, regulators - creation of a single financialspace will lead to desired results; will facilitate cross-border payments in national currencies, theformation of market-based rates, the development of securities markets and the growth of investmentactivity in the CIS countries.
A prerequisite for such a coordinated development is the gradual mutual penetration of infrastructuresand the financial markets of Russia and Kazakhstan. Increased interaction between the two capitalmarkets is especially important in the context of the prospects of the Common Economic Space (CES)as a next step in the deepening of the Customs Union. This is due to the fact that the interactionbetween capital markets may become one of the bases of regional economic integration in general andthe formation of cross-border financial infrastructure. The integration of financial markets willcontribute to more effective use of excess savings in one case and to attract additional investment - inothers. By overcoming the boundaries of national markets for issuers of financial instruments costs ofattracting investments would be reduced for investors - will increase opportunities for diversificationof investment portfolios and the risks of investing will be reduced. In addition, funds attracted throughintegrated capital markets of Russia and Kazakhstan and then other members of the SES can beused to finance the development of cross-border infrastructure projects in various sectors of theeconomy.
The main directions of development of financial markets - the participants must become:
ensure mutual tolerance of professional market participants, including the mutual recognitionof national regulators of securities markets – CIS licenses to engage in professional and otheractivities to be traded on exchanges of countries - CIS, and the introduction of remote access ofinvestors to trade on the stock exchanges of those countries;
ensure the admission of securities to trading on the stock exchanges of states - participants of CIS;
standardization of clearing technology, risk management, product line;
creation of integrated depositary space (removal of obstacles in national laws and restrictions onopening deposit accounts of foreign nominee);
recognition of the concept of a foreign nominee in the depository account property rightsto foreign securities;
creation of an integrated information environment of financial markets;harmonization of national legislation.
The results of these processes could be the formation of an integrated trading space in the securitiesmarket. Important tasks of the competent authorities on regulation of financial markets of theCIS countries - are:
orientation of the regulatory activities in the financial market on the recommendationsfor regulation, control and supervision of the financial market, produced by internationalassociations (G20, the Financial Stability Board, etc.);
join the national regulators of the securities market to the Multilateral Memorandum of theInternational Organization of Securities Commissions;
continued implementation of measures aimed at creating international (regional) financialcenters in the states - members of CIS, including in Moscow.
Journal of International Scientific Publication: Economy & Business, Volume 6, Part 4
ISSN 1313-2555, Published at: http://www.scientific-publications.net
70 Published by Info Invest, Bulgaria, www.sciencebg.net
On this basis, organizes its work and the Council of heads of government on regulation of thesecurities markets of the CIS countries, whose main task is to develop a harmonized approachand coordination of joint activities on the formation and development of an effective system of the CIScountries.
REFERENCES
1. AFS (2009) Annual Report. Available at: http://afn.kz/attachments/9/20/publish20-4523791.pdf.
2. Dontsov S. (2010) The stock market of Kazakhstan and its major institutional investors. SecuritiesMarket, 18, pp. 10-19.
3. EBR (2010) Prospects for integration of stock markets in Russia and Kazakhstan. Almaty,pp. 30 -56
4. Garcia-Herrero A. et al. (2008) Why is there so little regional financial integration in Asia?Regional financial integration in Asia: present and future. BIS Papers. 42.
5. Golovnin M. (2008a) Prospects for Financial Integration in the CIS region. Information andanalytical bulletin IE RAS, 1 (13), pp. 16–18.
6. Golovnin M. (2010b) Interaction of the financial systems of the CIS countries. St. Petersburg:Aletheia. 10, pp. 32-39.
7. Heifetz, B. (2009) Russian direct investments in the EEC and their role in the development ofenergy and transport infrastructure in Eurasia. Eurasian economic integration. 1 (2).
8. Karagusova G. (2008) Why are underdeveloped stock market in Kazakhstan. Liter. August 24.
9. Klotsvog F.N., Sukhotin A.B., Chernova L.S. (2009) Prediction of economic development ofRussia, Belarus, Kazakhstan and Ukraine within the framework Common Economic Space. Theproblems of prediction. 4, pp. 15-23.
10. Liebman, A. (2010) Integration of stock markets in the former Soviet Union. Interaction of thefinancial systems of the CIS countries. St. Petersburg: Aletheia. 3, pp. 8-17.
11. Medvedeva T., Filimoshin P. (2010) Legal regulation of placement and circulation of foreignfinancial instruments in the Russian Federation. Depositarium. 4 (86).
12. Mishina V. (2009) Background monetary integration and the role of the ruble operations in the CIScountries. Exchange Review. 12 (72), pp.13-18.
13. Tararuev M. (2010) Foreign securities on the Russian stock market. Chief Financial Officer. 2, pp.19 – 24.

Journal of International Scientific Publication: Economy & Business, Volume 6, Part 4
ISSN 1313-2555, Published at: http://www.scientific-publications.net
71 Published by Info Invest, Bulgaria, www.sciencebg.net
HISTORICAL REVIEW AND INFLUENTIAL FACTORS OF THE ELECTRICITY PRICE
MOVEMENT FOR SELECTED COUNTRIES OF THE EUROPEAN UNION AND THEREPUBLIC OF CROATIA1
Ljerka Cerovic2, Dario Maradin2, Ivan Markovi 2
2University of Rijeka, Faculty of Economics Rijeka, 51000 Rijeka, Croatia
E-mail: [email protected]
Abstract Research in this paper is focused on the historical review and comparison of the price movement ofelectricity for households in selected countries of the European Union and the Republic of Croatia. Inthis respect, especially are considered influential factors on the price movement of electricity ofselected countries, such as the impact of liberalization of electricity market, the impact of specificcharacteristics of individual countries, the impact of electricity consumption, and other influentialfactors.
Key words: electricity price, households, historical review, influential factors, European Union,Republic of Croatia
1. INTRODUCTIONThe energy sector is the foundation of almost all economic activities, which gives it an exceptionalstrategic importance, and electricity is one of its most important forms. By technical-technologicalprogress is imposed a daily requirement of using electricity as an irreplaceable energy source in a widespectrum of human activity and life. Electricity is used in households, industry, services, transport,agriculture, and other. Security of electricity supply is the basic prerequisite of economic growth anddevelopment and improvement of living standard of a modern human. Its utilization affects the growthof national economy and conversely, the economy induces the level of demand for electricity.
One of the mechanisms of influence of the electric-power sector on economy and society as a wholeare prices of electricity. From the aspect of consumer, they represent an integral part of productioncosts, for the industry sector, but also the living costs, for households. Price of electricity directlyaffects the electricity demand for needs of households, and for production needs of goods and servicesof numerous economic branches. Multiplicative activity of electricity price reflects on all activities ofhuman work, causing major changes within the entire society.
1 This article is the result of the scientific project Economic Impacts of Regulatory Reforms in Electricity SectorNo. 081-0361557-1455, financed by the Croatian Ministry of Science, Education and Sport

Journal of International Scientific Publication: Economy & Business, Volume 6, Part 4
ISSN 1313-2555, Published at: http://www.scientific-publications.net
72 Published by Info Invest, Bulgaria, www.sciencebg.net
2. SIGNIFICANCE AND CHARACTERISTICS OF THE ELECTRIC-POWER MARKETAND PRICE AS ITS BASIC DETERMINANTNecessary assumption of normal functioning of the modern society and economy as a whole makes,among other things, but primarily, exactly the electricity. It appears as the main energy product in theindustrialized society and a large number of human activities depend on its use, both at the householdlevel and the economy (Li, Flynn, 2004).
Electric-power sector, as a subsystem of the entire energy sector, represents one of the most complextechnical-technological systems in which different processes of electricity management take place(Udovi i , 2005). This relates to the core activities which are performed in the electric-power sector,which are generation, transmission, distribution and supply of electricity. The technological process inthe electric-power sector begins with the use of available quantities (mostly natural forms) of energysuch as coal, natural gas, biomass, water-power, wind energy or solar energy. Such forms of energyare transferred into electrical energy, and it is then from the producer, via transmission and distributionnetworks, lead to the end consumers. Finally, the electricity supply regulates relationships betweensuppliers and end users, or consumers.
Efficient and well developed electric-power sector makes possible the growth and incentive toeconomy, competitiveness of national economy, impacts on improving the living standard ofpopulation and development of society. Therefore, the fundamental purpose and objective of theelectric-power sector is to ensure the quality delivery of electricity to end consumers, whether businesssubjects or individual customers, with optimal and acceptable electricity price for each of these twogroups of consumers.
In determining the price of electricity and all other delivered forms of energy, it is deemed that shouldbe met the following criteria (Kale, 2007):
- it is necessary to ensure the effectiveness and efficiency of business of (electric)power sector;
- end consumers, where are particularly significant economic entities, due to higher level of pricesof individual forms of energy, should have a rational choice and the ability of more efficientenergy usage;
- by variable relation of prices is necessary to avoid reorientation from one to another form ofenergy;
- it is necessary to enable an increase in own production and supply of energy;
- energy prices, or energy costs must not reduce the competitive ability of national economy inthe world market.
As a dynamic category, like other products in the market such as oil, coffee or gold, the price ofelectricity is subject to daily changes. These changes relate, primarily, to the perception of marketparticipants (producers, traders, suppliers of electricity) in relation to the supply and demand of thisspecific good. Since electricity cannot be stored, but the demanded quantity of electricity must becurrently adjusted with the appropriate amount of the offered quantity, many factors influence theformation of equilibrium price and quantity. They may be different, such as current or future economicsituation, change in prices of related products such as oil or coal, short-term and long-term weatherconditions or tempests, natural disasters, the impact of policy on the pricing of electricity, and other(EDF Energy, 2009).
Journal of International Scientific Publication: Economy & Business, Volume 6, Part 4
ISSN 1313-2555, Published at: http://www.scientific-publications.net
73 Published by Info Invest, Bulgaria, www.sciencebg.net
In general, volatility relates to the unpredictable fluctuations of various phenomena and processesobserved during period in everyday life (Zareipour et al., 2007). Observing the volatility of electricityprice, researches have shown that it usually decreases when the electricity markets get wider anddevelop, and when is increasing the market competition (Bask, Widerberg, 2009). The mentioned isoften a result of deregulation and other comprehensive reforms of the electricity sector, and asconfirmation of the same is emphasized the example of Nordic countries. Today, Finland, Denmark,Norway and Sweden are forming common electricity market where the electricity price is significantlymore stable than it was the case before the integration processes, which means that today the Nordicelectricity market is less price-sensitive to strong changes of the global economy.
3. INFLUENTIAL FACTORS OF THE ELECTRICITY PRICE MOVEMENT FORHOUSEHOLDS IN SELECTED COUNTRIES OF THE EUROPEAN UNION AND THEREPUBLIC OF CROATIA
In the Member States of the European Union, there is very clear and pronounced inequality in somebasic categories and aspects of human life. The above is also reflected in electricity prices forhouseholds, such as the difference between the electricity price in France and Belgium or Spain, butalso in those countries which are potential candidates for EU membership. This imposes the question,what is the major cause of inequalities of electricity prices: is it the cause the liberalization process,whether are certain specific features of each Member State, whether is the price movement of otherenergy sources from which the electricity is produced directly, or something else? Surely there is aspecific causal connection between these factors and unequal electricity prices in the Member States ofthe European Union and in the Republic of Croatia as its future member, which interdependence isfurther analyzed in the continuation of paper.
First electricity markets in the EU have been established in the 1990s, but since there were significantdifferences in terms of ownership and functioning of the electricity sector, occurred a need forrestructuring and harmonizing the electric-power industry. The result was the introduction of Directive96/92 EC, by which were established common rules for generation, transmission, distribution andsupply of electricity. Thus began the process of liberalization of electricity market of the thenEuropean Community. Basics of liberalization of the electricity market are based on the establishmentof competition in generation and supply, and the free access to transmission and distribution network,with the aim of creating an internal market of electrical energy (Tominov, 2008). However, theliberalization of electric-power sector had not been developed by the expected pace. Due to theexcessive number of modifications and amendments of existing Directive, 2003 was adopted the newDirective 03/54 EC which supposed to contribute to the dynamics of market opening, network access,the obligation of separation of operators of electric-power system, and other. Mentioned did not resultin significant changes, as assumed, in general, nor in prices of electricity, among other things due toopposition of some Member States which did not want to relinquish control over their electricityprices. Countries which had been most resisted to the full opening of electricity market were Franceand Spain. France because it had a much favorable price of electricity, thanks to the large number ofnuclear power plants and hydro power plants, than other EU countries, so French consumers did notwant that free market, which would be achieved by full opening of electricity market, displace thecheap electricity. On the other side, the Spanish government brought a decision for a period of 14years in which are prescribed favorable prices of electricity for their own (Spanish) consumers, due towhich the Directorate General for Competition of the European Commission opened an investigationabout the validity of that decision and discrimination that it causes, because it is considered that the
Journal of International Scientific Publication: Economy & Business, Volume 6, Part 4
ISSN 1313-2555, Published at: http://www.scientific-publications.net
74 Published by Info Invest, Bulgaria, www.sciencebg.net
same violates free market competition (Tominov, 2008). In any case, it can be concluded that theprocess of liberalization of the electricity market is a long-term process which still in most countries isnot completed. Different approaches of liberalization show great diversity in the implementation ofelectric-power reforms, and which differences arise from the intention to protect the economic andother interests of each Member State. Therefore, results of conducted reforms by no means cannot besatisfactory, as evidenced the fact that consumers have not yet received (promised) lower prices, butthe opposite, creating of energy monopolies, prices rise from year to year, and is forming an increasingdiversity of electricity prices among the EU Member States.
The price of electricity is greatly dependent on the location and living conditions of population of eachcountry, on the degree of economic development, on the availability of other energy sources fromwhich is possible to produce electricity, on ecologic awareness of electricity consumers, their level ofeducation, but also on income level and many other influential factors.
In order to closer show and clarify the differences between prices of electricity, in the continuation ofpaper is showed the trend of electricity prices for households in selected Member States of theEuropean Union and the Republic of Croatia since 1985 to 2011.
In Table 1 are shown the electricity prices for households (excluding taxes and other fees) forBelgium, Denmark, Luxembourg, France, United Kingdom, Spain, as members representing the EU,and the Republic of Croatia, as a future member of that integration. It should be noted that for France,Spain and the UK, electricity prices are available since 1991, while for the Republic of Croatia areavailable since 2005. Electricity prices are shown in euros per kilowatt hours, while the trend ofelectricity prices is shown in chain indexes (C.I.). Furthermore, for 2011, and since 1985 to 1990, theprices are shown only for the first half year, while since 1991 onward is calculated an average price ofelectricity based on two semesters of a year. Also, until 2007 was used the old methodology whichwas related to the ranking of the electricity consumption of households in the following way(http://appsso.eurostat.ec.europa.eu/nui/setupModifyTableLayout.do):
- annual consumption of electricity of household - 600 kWh
- annual consumption of electricity of household – 1.200 kWh
- annual consumption of electricity of household – 3.500 kWh
- annual consumption of electricity of household – 7.500 kWh
- annual consumption of electricity of household – 20.000 kWh.
Since 2008 onward is using the new methodology (except for Luxembourg and Croatia, where the newmethodology was also used in 2007), which contains the following classes of electricity consumptionfor households (http://appsso.eurostat.ec.europa.eu/nui/setup ModifyTableLayout.do):
- household consumption less than 1000 kWh
- household consumption that is greater than 1000 kWh, but less than 2500 kWh
- household consumption that is greater than 2.500 kWh, but less than 5.000 kWh
- household consumption that is greater than 5.000 kWh, but less than 15.000 kWh
- household consumption greater than 15000 kWh.
In Table 1, when showing electricity prices for households, were selected prices for consumptiongreater than 2500 kWh, but less than 5000 kWh by new methodology, and prices for annual electricity
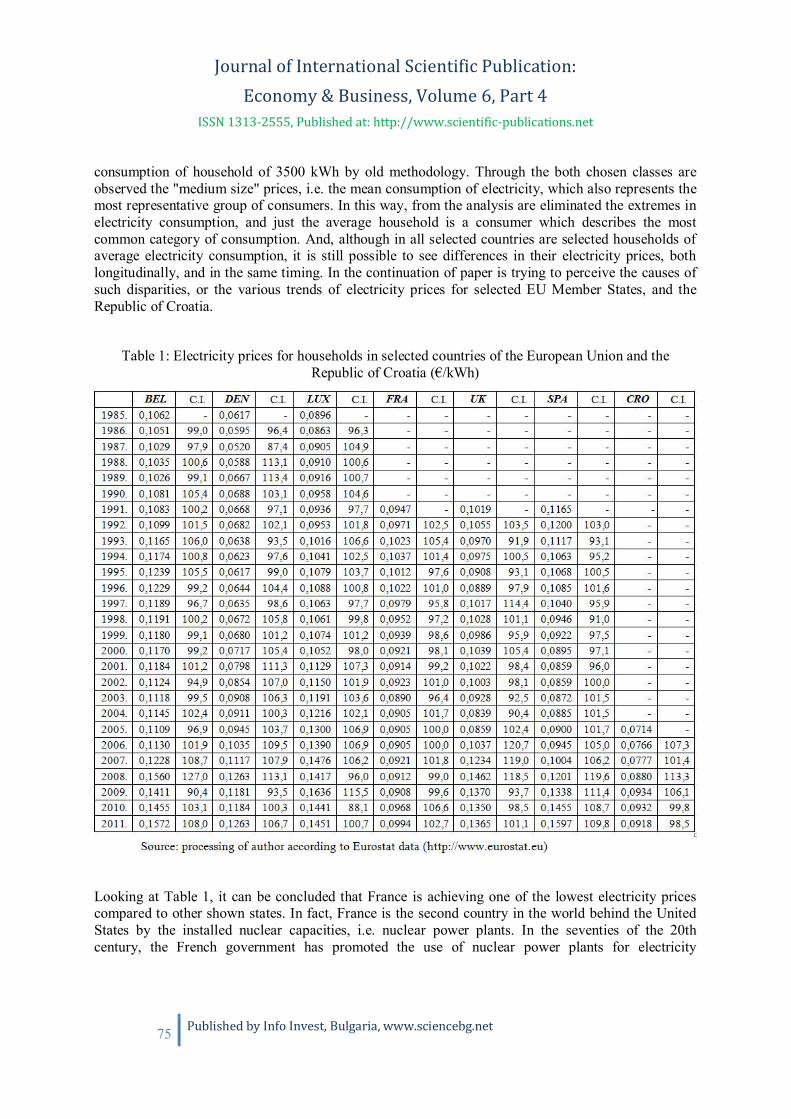
Journal of International Scientific Publication: Economy & Business, Volume 6, Part 4
ISSN 1313-2555, Published at: http://www.scientific-publications.net
75 Published by Info Invest, Bulgaria, www.sciencebg.net
consumption of household of 3500 kWh by old methodology. Through the both chosen classes areobserved the "medium size" prices, i.e. the mean consumption of electricity, which also represents themost representative group of consumers. In this way, from the analysis are eliminated the extremes inelectricity consumption, and just the average household is a consumer which describes the mostcommon category of consumption. And, although in all selected countries are selected households ofaverage electricity consumption, it is still possible to see differences in their electricity prices, bothlongitudinally, and in the same timing. In the continuation of paper is trying to perceive the causes ofsuch disparities, or the various trends of electricity prices for selected EU Member States, and theRepublic of Croatia.
Table 1: Electricity prices for households in selected countries of the European Union and theRepublic of Croatia (€/kWh)
Looking at Table 1, it can be concluded that France is achieving one of the lowest electricity pricescompared to other shown states. In fact, France is the second country in the world behind the UnitedStates by the installed nuclear capacities, i.e. nuclear power plants. In the seventies of the 20thcentury, the French government has promoted the use of nuclear power plants for electricity

Journal of International Scientific Publication: Economy & Business, Volume 6, Part 4
ISSN 1313-2555, Published at: http://www.scientific-publications.net
76 Published by Info Invest, Bulgaria, www.sciencebg.net
production in order to replace the electricity from import. In 2003 in France from nuclear power plantswas produced 78% of the total electricity produced (http://www.nuclearcounterfeit.com/?p=11607). Itshould be emphasized that the French nuclear industry is characterized by low costs and highefficiency and low fees and taxes, which makes it competitive compared to other EU Member States,and thus enables it the low price of electricity. It should be noted that France is also the world's largestexporter of electricity with 18% of its total electricity produced, which is mostly exported to Germany,Holland, Italy and Great Britain. It is interesting to point out, that the price of electricity in Francesince 1991 to 2011 grew by only 4.9%, which further confirms the competitiveness of electricity pricein France.
On the other side, the price of electricity in Denmark is heavily influenced by very high fees and taxes,which make up 56% price of electricity (which cannot be seen from Table 1, since electricity pricesare shown excluding taxes and other fees), and that is the main cause of very high electricity prices inDenmark (http://www.lovemoney.com/news/household-bills/gas-and-electricity/12993/the-cheapest-energy-in-europe). Using renewable-energy sources, Denmark produces 20% electricity of the totalelectricity generation through wind power plants, and when weather conditions are ideal proportionrises to 40% (http://www.eecroatia.com/obnovljivi-izvori/energija-iz-vjetra/u-danskoj-nikada-dovoljno-vjetroelektrana/). Costs of electricity production through wind power plants are predictableas opposed to variable prices of fossil fuels, which significantly affect the reduction of electricityprice, and increased competitiveness of the Danish electric-power system.
If we considered the United Kingdom, it may be seen a large increase in electricity price in the periodsince 2006 to 2008, somewhat surprising because it is known that the United Kingdom is one of thoseEU countries which is the furthest progressed in the process of liberalization of electricity market.However, it seems that the restructuring and reforming of electricity sector, which is based on themarket liberalization and privatization of electric-power companies, and the existence of greatercompetition and market openness, to their consumers has not brought the prosperity in the form oflowering prices of electricity. What is considered a major cause of increasing of electricity prices arehigh margins of six leading energy suppliers in the United Kingdom and inefficient tariff system forconsumers, due to which was launched an investigation in 2011 (http://www.energetika-net.com/vijesti/energetsko-gospodarstvo/ogroman-rast-cijena-energije-u-britaniji-12697).
The cause of increase of electricity prices in Spain is primarily in the so-called tariff deficit.Specifically, in the 1990s was carried out the regulation of electricity tariffs in Spain, by introductionof abnormally low tariffs, which led to a large decline in the price of electricity, while on the otherside, the costs of electricity production were ignored. This situation has created a huge imbalance,because electric-power companies had to sell the electricity at a price that was considerably lower thanthe cost of production, creating a cumulative deficit of 14 billion euros. Recognizing this problem, forstop the further increasing of deficit, it was decided to increase electricity prices by 20%. However, inorder to repay the accumulated tariff deficit, the price of electricity should be much higher in the next15 years, i.e. should increase by approximately 35% (http://www.economist.com/node/11632852).
By examining the reasons which influence the imbalance between electricity prices of individual EUMember States, it can be concluded that electricity prices are primarily influenced by the specificcharacteristics of the electric-power sector of each Member State.
Finally, if we considered the electricity price trend of in the Republic of Croatia, although Table 1provides significantly shorter time range of observation, it can be noticed that the price of electricity,with the significant increase in 2008, by decision to liberalize electricity sector (on July 1, 2008), isstill significantly lower compared to prices of selected EU Member States. It is in rank with those in

Journal of International Scientific Publication: Economy & Business, Volume 6, Part 4
ISSN 1313-2555, Published at: http://www.scientific-publications.net
77 Published by Info Invest, Bulgaria, www.sciencebg.net
France, which is unacceptable and unrealistic by all aspects of the competitiveness of this sector ofeconomy. The reasons for such a low price of electricity should be sought in the underdeveloped andunstable Croatian electric-power market, lack of incentive for substantial investments, the unreadinessof consumers on demands of competitive market, and other.
4. TREND OF THE TOTAL ELECTRICITY CONSUMPTION IN SELECTED COUNTRIESOF THE EUROPEAN UNION AND THE REPUBLIC OF CROATIA
Although usually the electricity price affects its consumption, it should be emphasized that also theelectricity consumption can reversibly affect the electricity price trend. While electricity consumptionrepresents the demand for electricity, the supply of electricity is determined by production costsresulting, primarily, from the price of production factors, i.e. energy resources. If we take into accountthat electric energy is largely produced from non-renewable sources of energy such as oil, natural gasor coal, whose prices are increasing due to less and less availability of energy resources, but also dueto political conflicts, it is clear that electricity price is also rising. Increased consumption (demand) ofelectricity further implies an increase in electricity price. To meet the increased demand, it isnecessary to build new power plants to produce additional quantities of electricity, which requireslarge capital investments and additional costs which are shifted on consumers, thus causing a furtherincrease in electricity price. Considering above, the electricity consumption can indirectly affect thegrowth of electricity price.
Table 2: Movement of the total energy consumption in selected countries of the European Union andthe Republic of Croatia (GWh)

Journal of International Scientific Publication: Economy & Business, Volume 6, Part 4
ISSN 1313-2555, Published at: http://www.scientific-publications.net
78 Published by Info Invest, Bulgaria, www.sciencebg.net
In the continuation of paper, Table 2 shows the trend of the total electricity consumption, both at thehousehold level, and those for industrial consumers, in selected countries of the European Union andthe Republic of Croatia (in gigawatt hours) since 1990 to 2010 year, and using chain indexes (C.I.)shows the relative changes in consumption trend in the current period compared to previous period.
According to data reported in Table 2, it can be seen that electricity consumption was growing in allcountries in the observed period, except individual deviations and deviations in 2008 and 2009 due tothe global economic crisis. Since it was increasing the electricity consumption, thereby was increasingits production and that indirectly affected on increasing the price of electricity for households.
How much the increase in electricity price in the observed period and for observed countries wasaffecting the change in consumption, or how much was the increased consumption (demand) ofelectricity contributed to the increase in electricity price, it cannot be accurately determined, but in thecontinuation of paper, from Table 3, it is possible to perceive a particular interdependence betweenthese appearances.
Table 3: Comparative illustration of the increase in electricity price for households and total electricityconsumption in selected countries of the European Union and the Republic of Croatia
Countries Increase in electricity price forhouseholds (1990-2010)*
Increase in total electricityconsumption (1990-2010)
Belgium 34,6% 43,7%
Denmark 72,1% 13,1%
Luxembourg 50,4% 59,1%
France 2,2% 46,9%
United Kingdom 32,5% 19,6%
Spain 24,9% 107,1%
Croatia 30,5% 10,0%
Source: processing of author according to data in Table 1 and Table 2
Note: For France, United Kingdom and Spain is shown the increase in electricity price since 1991 to2010, while for Croatia is shown the increase of electricity price since 2005 to 2010.
Clearly there is some correlation between the electricity price for households and total electricityconsumption in selected countries of the European Union and the Republic of Croatia, and although itappears that the increase in electricity consumption has affected the electricity prices, and not viceversa and as expected, that the electricity price contributed to the change in its consumption, it is clearthat increase in electricity price, besides increased consumption, is influenced by a number ofvariables, among which are dominant costs of producing electricity and others, and also that on thechange in electricity consumption does not affect only the electricity prices, but also a number ofadditional variables such as consumer income, prices of related goods, such as substitutes likerenewable-energy sources, and other.
Journal of International Scientific Publication: Economy & Business, Volume 6, Part 4
ISSN 1313-2555, Published at: http://www.scientific-publications.net
79 Published by Info Invest, Bulgaria, www.sciencebg.net
The correlation between variables in Table 3 certainly exists, since both the price and consumption ofelectricity has a tendency to rise, but the above should be taken with caution given the previouslyemphasized limitations. With these limitations, approximately the same tendency of increase inelectricity price conditioned by an increase of consumption are indicating Belgium and Luxembourg,while more pronounced differences between consumption and price of electricity show France orSpain, but of the same direction, i.e. the sensitivity of less than one. Finally, the United Kingdom, theRepublic of Croatia and Denmark, are showing trends of opposite tendency of sensitivity, so theincrease in electricity consumption in these countries has caused, respectively, 2 times, 3 times, andeven 6 times greater increase in electricity price in relation to growth of consumption. Withoutintention of further analysis of described phenomena, by this thesis and this work is opening up a hugearea worthy of research and further study.
5. CONCLUSION
By comparison of electricity prices for households between particular states of the European Unionand the Republic of Croatia, it can be concluded that electricity prices are not identical, nor uniform,but vary depending the degree of development of electric-power sector of particular country, anddepend on a number of specific characteristics of an individual country as well as other factors such asthe openness of electricity market, liberalization of the electricity sector, usage of renewable-energysources, level of electricity consumption, and other. Price movement, as well as consumption, ofelectricity show large variations between countries and time periods.
In the Republic of Croatia price, as well as consumption, of electricity are also achieving a growth inthe observed period, although prices are still below the level of electricity price of selected countriesof the European Union. Of course, with a further convergence of Croatia to the European Union, weshould expect a further increase in electricity price, which is not surprising given the demands ofcompetitiveness and the necessity of compliance with the trends of large economies.
REFERENCES
1. Bask, M., Widerberg, A. Market structure and the stability and volatility of electricity prices.Energy Economics, 2009, vol. 31, issue 2, pp. 278-288.
2. http://appsso.eurostat.ec.europa.eu/nui/setupModifyTableLayout.do
3. http://www.economist.com/node/11632852, Electricity in Spain
4. http://www.edfenergy.com/products-services/large-business/PDF/MBC-FS-EPV-003-0609.pdf,EDF Energy, 2009, Electricity price volatility
5. http://www.eecroatia.com/obnovljivi-izvori/energija-iz-vjetra/u-danskoj-nikada-dovoljno-vjetroelektrana/, U Danskoj nikada dovoljno vjetroelektrana
6. http://www.energetika-net.com/vijesti/energetsko-gospodarstvo/ogroman-rast-cijena-energije-u-britaniji-12697, Ogroman rast cijena energije u Britaniji
7. http://www.eurostat.eu
8. http://www.lovemoney.com/news/household-bills/gas-and-electricity/12993/the-cheapest-energy-in-europe, The cheapest energy in Europe
Journal of International Scientific Publication: Economy & Business, Volume 6, Part 4
ISSN 1313-2555, Published at: http://www.scientific-publications.net
80 Published by Info Invest, Bulgaria, www.sciencebg.net
9. http://www.nuclearcounterfeit.com/?p=11607, Water shortages threatening France's nuclearreactor complex
10. Kalea, M. Elektri na energija. Edited by Kigen d.o.o. Zagreb: 2007. ISBN 953-6970-39-1.
11. Li, Y., Flynn, P.C. Deregulated power prices: comparison of volatility. Energy Policy, 2004, vol.32, issue 14, pp. 1591-1601.
12. Tominov, I. Liberalizacija tržišta elektri ne energije – ispunjava li o ekivanja? Energija, 2008,vol. 57, no. 3., pp. 256-299.
13. Udovi i , B. Elektroenergetski sustav. Edited by Kigen d.o.o. Zagreb: 2005. ISBN 953-6970-18-x.
14. Zareipour, H., Bhattacharya, K., Canizares, C.A. Electricity market price volatility: The case ofOntario. Energy Policy, 2007, vol. 35, issue 9, pp. 4739-4748.

Journal of International Scientific Publication: Economy & Business, Volume 6, Part 4
ISSN 1313-2555, Published at: http://www.scientific-publications.net
81 Published by Info Invest, Bulgaria, www.sciencebg.net
THE PERCEPTIONS OF HOSPITALITY SECTOR EMPLOYEES TOWARD EURASIAN
TOURIST NATIONS’ ATTITUDES AND BEHAVIOUR IN THE ANTALYA REGIONErkan Sezgin and R dvan Kozak,
Faculty of Tourism, Faculty of Economics, Yunus Emre Kampusu, Anadolu University
Eskisehir, Turkey
Abstract
A consideration of the attitudes and behaviour of tourists is now more important than ever for tourismprofessionals. Identifying tourist profiles and therefore diversifying services according to touristprofiles is a topical issue nowadays. In formatting the features of hospitality properties or selectingthe types of tourism to be provided and even constructing the facilities of a tourist region, definingtourist profiles is essential. When considering holiday tourism, Antalya is seen as a leading tourist-incoming city in both Turkey and Europe (with over 6 million incoming tourists in 2005). Theincoming tourists to Antalya are mainly from European and the former Soviet Union countries. Thisstudy focuses on the general attitudes and behaviour of tourists from Eurasian countries as perceivedby hospitality sector employees. The results of the study reveal significant differences among touristattitudes and behaviour.
Key words: Behaviour, Attitudes, Antalya, Hospitality, Marketing
1. INTRODUCTION
An understanding of tourist behaviour and attitudes is more important than ever these days for tourismprofessionals and academicians alike. The demand and consumption process of tourists are influencedby their attitudes and behaviour. Determining these attitudes and behaviour can be beneficial both formarketing purposes and the sustainability of tourism-related companies (Mohsin, 2005).
Marketing is not just attempting to sell a product to a market that does not have the capacity or interestto be stimulated (Coathup, 1999), but it is also important to study the market, the contemporaryattitudes and behaviour of the buyers and their interest in a product in order to estimate potentialdemand (Mohsin, 2005). Keeping this in mind, can tourist attitudes and behaviour be a resource formarketing and market segmentation? If so, how do they relate to the other variables of marketing?Furthermore, do the attitudes and behaviour of tourists show differences in relation to theirnationality? According to previous studies, cross-national differences do exist, and these have asignificant impact on the behaviour of both consumers and marketing decision-makers. Previoustourism and hospitality studies have shown that travellers from different countries may have differentpreferences for, and expectations of, tourism and hospitality services (Yuksel, Kilinc and Yuksel,2006). Nationality, social class, tourist role and benefit sought along with nationality are the mostcontroversial segmentation variables for marketing according to Pizam and Sussman (1995). Mok andArmstrong (1998) claim in their study that tourists from the UK, USA, Australia, Japan, and Taiwanhave different expectations of hotel services. Many researchers have found significant cross-nationaldifferences, not only on the general level of attitudes and behaviour, but also on the choice ofdestination. On the other hand, some researchers insist that nationality or country of residence cannot

Journal of International Scientific Publication: Economy & Business, Volume 6, Part 4
ISSN 1313-2555, Published at: http://www.scientific-publications.net
82 Published by Info Invest, Bulgaria, www.sciencebg.net
be a sole discriminating variable in explaining differences initiated in the behaviour of tourists (Dann,1993). It is clear that variables, such as gender, age, social class and revenue levels play an importantrole in regard to tourist attitudes and behaviour. However, the cultures and lifestyles of tourists atnationality and sometimes continental level may also be discriminators when considering theperceptions of tourist-incoming countries’ hospitality service employees in the point of touristattitudes and behaviour.
The purpose of this study (1) is to identify the perceptions of hospitality service employees concerningthe general attitudes and behaviour of tourists from different nations while on vacation, and (2)therefore, to identify the tendencies of tourists from different nations for future planning andmarketing purposes.
2. THEORETICAL FRAMEWORKTourist attitudes and behaviour in connection with certain variables have always been an importantaspect of tourism research. These variables include destination choice, gender and age, complaintbehaviour of tourist nations, customer satisfaction, and nationality itself. When considering destinationchoice related studies, some researchers (Baloglu and Uysal, 1996; Keng and Cheng, 1999; Kim andLee, 2000; You et al., 2000; Wickens, 2002; Becken and Gnoth, 2004; Mehmetoglu, 2004) havefocused on motivational factors and cultural differences as well as tourist typology while others(Debbage, 1991; Summers and Mc Coll-Kennedy, 1998; Ryan and Sterling, 2001; Mohsin, 2005;Nepal, 2008; Reichel et al., 2008) have chosen specific destinations and investigated tourist behaviourfor that region. To illustrate, Mohsin (2005) in his study examines west Malaysians and their motivesfor choosing the Northern Territory of Australia for a holiday. According to the results of the study,respondents, who are mostly family oriented, enjoy mental relaxation and exploration on theirvacations.
There are several studies based on gender and age on tourist attitudes and behaviour in the literature.The differences between the recreational preferences of men and women have an influence onmotivation and behaviour (Kinniard and Hall, 1994, p.5). Gibson (1996) on the other hand, suggeststhat motivation of young men and women to holiday are different. Frew and Shaw (1999) point out therelationship among personality, gender and tourism behaviour in their study. Using Holland’s theoryof personality type, they found significant associations between gender, personality type and tourismbehaviour of visiting tourists. Studying gender differences and young tourist behaviour, Carr (1999,2002) states that men and women engage in different leisure activities in their home environment. Healso claims that the leisure activities of young tourists show little differences when their genders areconsidered. Finally, Mehmetoglu (2006) implies in his study that independent and package tourvisitors to northern Norway differ significantly in terms of gender, age, annual household income, tripexpenditure and length of trip. Although gender and age based studies do exist in the literature withrespected results, Norris and Wall (1994) claim that researchers have generally failed to analyse andpresent gendered data meaningfully as most studies concerning tourist behaviour ask the respondent’sgender.
One other variable that correlates with attitudes and behaviour is complaint behaviour. Variouscategorisations on the complaint behaviour of tourists have been presented in the literature. In one ofthese, Rogers, Ross and Williams (1992) categorize consumer complaint behaviour alternatives intofive areas: change future behaviour, private complaining, vocal complaint, third party and doingnothing. Johns and Gyimothy (2002) taking visitors to the Danish Island of Bornholm as subjects, they
Journal of International Scientific Publication: Economy & Business, Volume 6, Part 4
ISSN 1313-2555, Published at: http://www.scientific-publications.net
83 Published by Info Invest, Bulgaria, www.sciencebg.net
identify two distinct tourist clusters as ‘active’ and ‘inactive’ in their study. The importantdifferentiating factors between these clusters are; the importance accorded to amenity provision,nationality, age, activity participation, planning behaviour, attraction visiting behaviour, autonomy andgender. Lam and Tang (2003); on the other hand, identify four complaint behaviour types: personaland urging, bad-mouthing, complaint to management and publicising. Finally, Yuksel et al. (2006)explore the complaint behaviour of 420 tourists from Turkey, the Netherlands, Britain and Israel intheir study. Taking the results into consideration, the authors claim that there are more differences thansimilarities in the complaint behaviour of hotel customers from the sample. Taking organized andsemi-organized charter tour travellers from Norway to Mediterranean countries as a sample, Jacobsen(2000) demonstrates in his study that some tourists expressed anti-tourist attitudes because theybelieved common tourists were being perceived as foreigners who might carry social stigma. At thispoint, using the Means End Chain method for understanding the subtleties of tourist behaviour and anysalient dimensions in their thinking can be useful as McIntosh and Thyne (2005) argue in their study.
Another variable that correlates with tourist attitudes and behaviours is customer satisfaction. Ryan(1995) points out that the attitudes, expectations, and perceptions of holidaymakers are significantvariables in setting goals, influencing behaviour and determining final satisfaction (p.47). Chadee andMattson (1996) identify cross-cultural differences when measuring customer satisfaction. Compared toEuropeans, Asian respondents were found to derive lower levels of satisfaction for some experiencesin their study.
Finally, Pizam examining the nationality variable of tourist nations in his several studies (Pizam andSussman, 1995; Pizam and Reichel, 1996; Pizam et al., 1997; Pizam et al., 2002) claim with hiscolleagues that nationality differences play an important role in tourist attitudes and behaviour byincluding tour guides and sometimes undergraduate students as subjects.
The tourist attitudes and behaviour related studies in the literature, which correlates with variables,such as destination choice, gender and age, complaint behaviour of tourist nations, customersatisfaction, and nationality have certain common characteristics. As indicated above, many studiesthat take tourists as subjects and analyse their responses are available in the literature. However, thispresent study differs from the previous research, as its subjects are not tourists but hospitality sectoremployees and their perceptions regarding different tourist nations’ attitudes and behaviour.Therefore, it seeks to explore observable general attitudes and behaviour of tourists from acrossEurasia.
3. METHODOLOGY
3.1. Sample
The subjects who participated in the present study were selected from the employees who worked inthe accommodation companies of Antalya city in 2005 summer. 247 participants were pre-questionedin order to eliminate the inappropriate department employees (normally back-office staff do notcommunicate with consumers). Finally, 111 participants were selected as the sample by using“purposive sampling” method (Balci, 2005).
The European nations in the survey scale about whom the participants supposed to mention theirperceptions were identified according to the number of visiting tourists to Antalya in year 2005.Statistically, more than six million foreign tourists visited Antalya in 2005 and only five countries’(Germany, Russia, Holland, Austria and Sweden) citizens represent almost five million out of the total
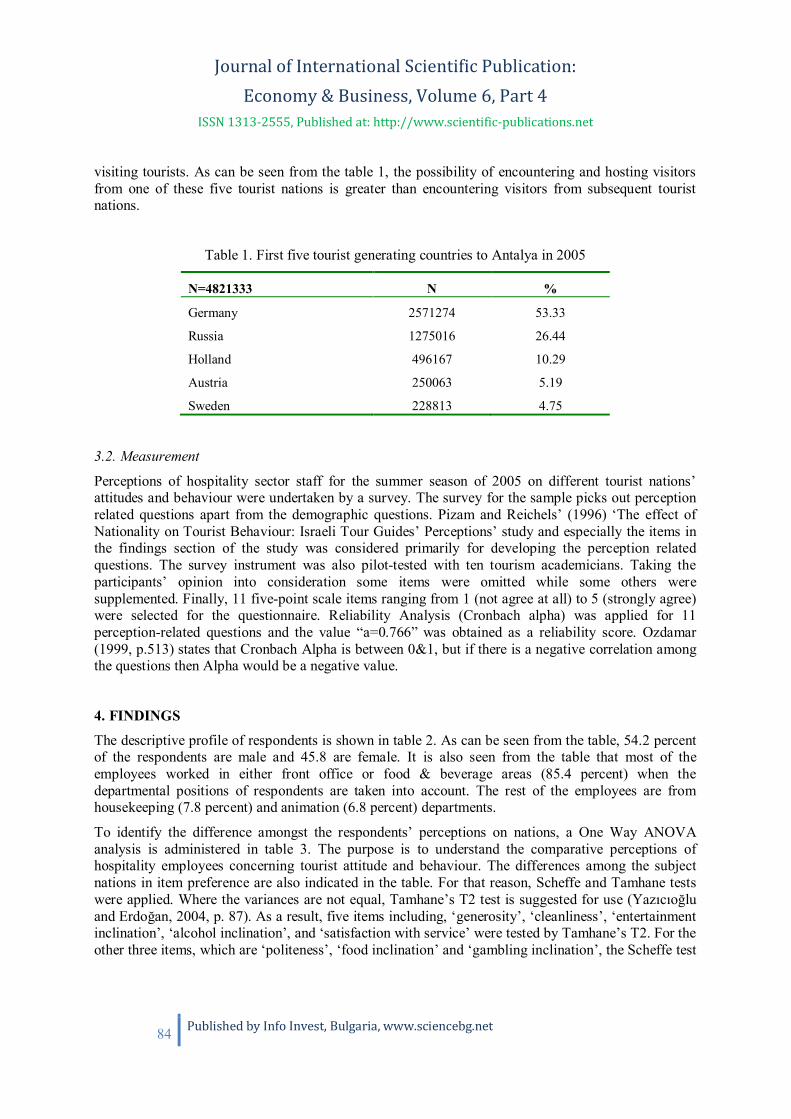
Journal of International Scientific Publication: Economy & Business, Volume 6, Part 4
ISSN 1313-2555, Published at: http://www.scientific-publications.net
84 Published by Info Invest, Bulgaria, www.sciencebg.net
visiting tourists. As can be seen from the table 1, the possibility of encountering and hosting visitorsfrom one of these five tourist nations is greater than encountering visitors from subsequent touristnations.
Table 1. First five tourist generating countries to Antalya in 2005
3.2. Measurement
Perceptions of hospitality sector staff for the summer season of 2005 on different tourist nations’attitudes and behaviour were undertaken by a survey. The survey for the sample picks out perceptionrelated questions apart from the demographic questions. Pizam and Reichels’ (1996) ‘The effect ofNationality on Tourist Behaviour: Israeli Tour Guides’ Perceptions’ study and especially the items inthe findings section of the study was considered primarily for developing the perception relatedquestions. The survey instrument was also pilot-tested with ten tourism academicians. Taking theparticipants’ opinion into consideration some items were omitted while some others weresupplemented. Finally, 11 five-point scale items ranging from 1 (not agree at all) to 5 (strongly agree)were selected for the questionnaire. Reliability Analysis (Cronbach alpha) was applied for 11perception-related questions and the value “a=0.766” was obtained as a reliability score. Ozdamar(1999, p.513) states that Cronbach Alpha is between 0&1, but if there is a negative correlation amongthe questions then Alpha would be a negative value.
4. FINDINGS
The descriptive profile of respondents is shown in table 2. As can be seen from the table, 54.2 percentof the respondents are male and 45.8 are female. It is also seen from the table that most of theemployees worked in either front office or food & beverage areas (85.4 percent) when thedepartmental positions of respondents are taken into account. The rest of the employees are fromhousekeeping (7.8 percent) and animation (6.8 percent) departments.
To identify the difference amongst the respondents’ perceptions on nations, a One Way ANOVAanalysis is administered in table 3. The purpose is to understand the comparative perceptions ofhospitality employees concerning tourist attitude and behaviour. The differences among the subjectnations in item preference are also indicated in the table. For that reason, Scheffe and Tamhane testswere applied. Where the variances are not equal, Tamhane’s T2 test is suggested for use (Yaz c o luand Erdo an, 2004, p. 87). As a result, five items including, ‘generosity’, ‘cleanliness’, ‘entertainmentinclination’, ‘alcohol inclination’, and ‘satisfaction with service’ were tested by Tamhane’s T2. For theother three items, which are ‘politeness’, ‘food inclination’ and ‘gambling inclination’, the Scheffe test
N=4821333 N %
Germany 2571274 53.33
Russia 1275016 26.44
Holland 496167 10.29
Austria 250063 5.19
Sweden 228813 4.75
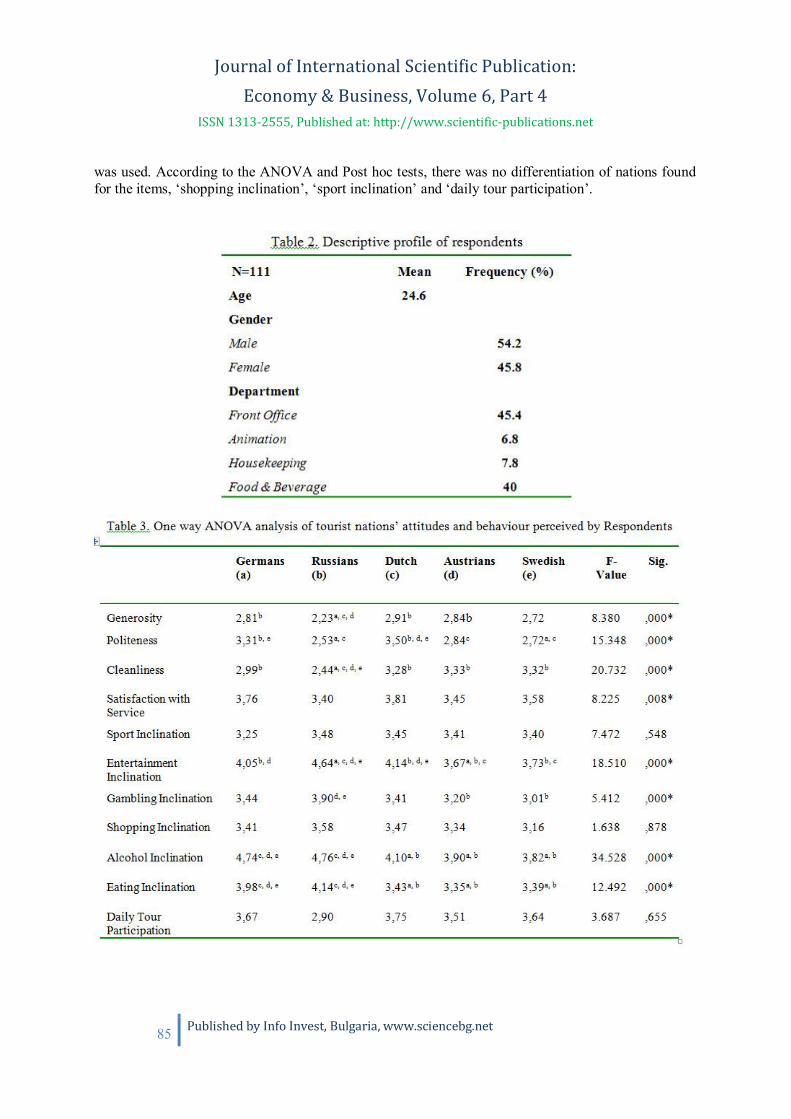
Journal of International Scientific Publication: Economy & Business, Volume 6, Part 4
ISSN 1313-2555, Published at: http://www.scientific-publications.net
85 Published by Info Invest, Bulgaria, www.sciencebg.net
was used. According to the ANOVA and Post hoc tests, there was no differentiation of nations foundfor the items, ‘shopping inclination’, ‘sport inclination’ and ‘daily tour participation’.
Journal of International Scientific Publication: Economy & Business, Volume 6, Part 4
ISSN 1313-2555, Published at: http://www.scientific-publications.net
86 Published by Info Invest, Bulgaria, www.sciencebg.net
When the Scheffe and Tamhane test results are considered, there are significant differences observedin Table 3. According to the results, German, Dutch and Austrian tourists are perceived as being more‘generous’ than Russian tourists. There are also significant differences among Dutch tourists andRussian, Austrian and Swedish tourists in the point of the subject item ‘politeness’. Dutch tourists areperceived as being politer than Russian, Austrian and Swedish tourists, while Russians are perceivedas being less polite than Austrian and Swedish tourists. For the item cleanliness, significant differencesare found between Russian tourists and German, Dutch, Austrian, and Swedish tourists. In the light ofthe results, German, Dutch, Austrian and Swedish tourists are perceived as being cleaner than Russiantourists. Another significant difference occurs when the ‘gambling inclination’ is considered. Russiansare perceived as being more inclined to gambling than Austrians and Swedish tourists. The finalsignificance is the ‘food inclination’ as well as the ‘alcohol inclination’. For these two items, Germanand Russian tourists are perceived as being food and alcohol lovers when compared with tourists fromthe other three nations by the hospitality sector employees.
It is possible to investigate the mean scores of the various nations’ attitudes and behaviour perceivedby respondents separately. When the highest mean scores of each item are measured, it could beclaimed that Dutch tourists are perceived as the cleanest (3.28), the most generous (2.91), and thepolitest (3.50) of the compared nations. They are also more satisfied with the service they receive(3.81) and they participate in daily tours (3.75) more than tourists from the other four nations. Therespondents are certain that the two items ‘alcohol inclination’ and ‘food inclination’ have the highestmean scores. In these high mean scores Russians have a 4.76 score for the ‘alcohol addiction’ andhave a 4.14 score for ‘food addiction”. Russian tourists also lead in ‘entertainment inclination’ (4.64),‘gambling inclination’ (3.90), ‘shopping inclination’ (3.58) and ‘sport inclination’ (3.48) when meanscores are considered.
5. CONCLUSIONS AND LIMITATIONS
Marketing and market segmentation terms for today’s tourism industry are turning out to bedeterminators at either micro level, such as hospitality companies’ marketing, or macro level, such asregional and even national level marketing. Tourism professionals, including investors, stateauthorities, and academicians have been trying to identify the needs, expectations and tendencies oftourists. The fierce competition, especially in the holiday tourism market, pushes professionals toconcentrate on specialization, such as investing in theme hotels, boutique hotels, and spa hotels. Animportant criterion for such a process is tourist attitudes and behaviour while on vacation. Asmentioned in the study, tourist attitudes and behaviour in relation to other variables (e.g., gender, age),have been examined by many researchers. The similar objectives of all this research were tounderstand tourist attitudes and behaviour, and therefore to suggest that tourism professionals shouldtake these into consideration when planning target markets.
As stated before in the study, Antalya is the leading holiday tourism city of Turkey. Approximately sixmillion Eurasian people visit Antalya every year, and stay in the same accommodation for a weekaverage. The tourist profile in Antalya, as well as in Turkey in general, has been changing in recentyears. As a result of external factors impacting on the Turkish tourism industry (economic and politiccrisis and suchlike), there have been fluctuations on the tourist arrivals from Western Europeancountries such as Germany and Britain. In order to have more stable and permanent customers,Turkish tourism professionals have offered a proportion of their hotel capacities to states of the formerSoviet Union. Although German tourist numbers are still higher than any other nation in Antalya, therate has been changing every year in favour of former Soviet Republicans, especially Russians.

Journal of International Scientific Publication: Economy & Business, Volume 6, Part 4
ISSN 1313-2555, Published at: http://www.scientific-publications.net
87 Published by Info Invest, Bulgaria, www.sciencebg.net
Moreover, the preference of the Turkish Riviera by Russian tourists is a kind of obligation. ManyEuropean countries have restricted the landing of Russian planes at their airports for the time being.With the technical improvement of Russian planes, such restriction at European airports may finishand that may negatively affect the demand by tourists for Turkey. On the other hand, the number ofRussian tourists in Antalya is increasing every year. This issue brings out the complaint of othervisiting tourists that German and British consumers no longer recommend Antalya hotels passionatelyin Trip Advisor , an important traveller review website.
Although classifying the general attitudes and behaviour of tourists according to their nations isrelative, previous studies show that nationality is an important variable for attitude and behaviour.However, respondent prejudice toward certain tourist nations is sometimes unavoidable. Taking thisinto account, it would be over optimistic to generalize the survey results. On the other hand,disregarding the limitations, suggestions for the Antalya region accommodation companies are asfollows:
* Tourist nations who have been observed to have similar attitudes and behaviour could be targeted inthe same market by hotel management.
* According to tourist behavioural results in such areas as eating and drinking, some hotelmanagements may modify their pension applications in order to improve results of a yieldmanagement.
* Finally, the long term tourism marketing policies have to be improved in the Antalya region in orderto provide comfortable holidays for all visiting tourist nations by the tourism professionals. It has beenobserved in the region that some hotels concentrate on the majority tourist nation in the establishmentsand they organize the activities (animation, kids club etc.) considering the related nation. This couldturn out to be a serious problem for a long period only because all tourist nations in resort hotels haveone primary reason; entertainment. Therefore, the hotel managements have to control and explore thedemand for entertainment, sport, shopping, and drinking interests of tourists from different nations;thus, vary the service offered for each tourist type.
This study is not without limitations. The number of German visitors is more than ten times greaterthan Swedish visitors (Table 1). It is clear that the respondents’ ideas concerning German touristswould be more realistic than their ideas about Swedish tourists since the chance of encountering aGerman tourist is ten times higher.
Involving highly experienced and may be managerial staff as subjects, would be helpful in furtherstudies. It could also be claimed that future studies measuring tolerance and gender-age variables,would contribute to the literature when they are utilized considering the limitations already mentioned.
REFERENCESBalci, A 2005, Sosyal bilimlerde arastirma. Pegema Yayincilik, Ankara.Baloglu, S & Uysal, M 1996 ‘Market segments of push and pull motivations: a canonical correlationapproach’, International Journal of Contemporary Hospitality Management, Vol. 8, no.3, pp.32 –38.
http://www.tripadvisor.com
Journal of International Scientific Publication: Economy & Business, Volume 6, Part 4
ISSN 1313-2555, Published at: http://www.scientific-publications.net
88 Published by Info Invest, Bulgaria, www.sciencebg.net
Becken, S & Gnoth, J 2004, ‘Tourist consumption systems among overseas visitors: reporting onAmerican, German, and Australian visitors to New Zealand’. Tourism Management, Vol. 25, no. 3,pp.375-385.Carr, N 1999, ‘A study of gender differences: young tourist behaviour in a UK coastal resort’, TourismManagement, Vol. 20, no. 2, pp.223-228.Carr, N 2002. ‘A comparative analysis of the behaviour of domestic and international young tourists’,Tourism Management, Vol. 23, no. 3, pp.321-325.Chadee, D D & Mattsson, J 1996, ‘An empirical assessment of customer satisfaction in tourism’, TheServices Industries Journal, Vol. 163, no.1, pp.305 –320.Cnnturk, 2006, ‘Antalya’ya Gelen Turist’ viewed 22 November 2006,<www.cnnturk.com.tr/YASAM/GEZI/haber_detay.asp?PID=303&haberID=145940>Coathup, DC 1999, ‘Dominant actors in international tourism’, International Journal of ContemporaryHospitality Management, Vol. 11, no.3, pp.69 –72.Dann, G 1993, Limitations in the use of nationality and country of residence variables. Critiques andChallenges, in Pearce, D., Butler, R., (eds), Tourism Research. Routledge, London, pp. 88-112.Debbage, K 1991, ‘Spatial behaviour in a Bahamian resort’, Annals of Tourism Research, Vol.18, no.2, pp.251 –268.Frew, EA & Shaw, RN 1999, ‘The relationship between personality, gender and tourism behaviour’,Tourism Management, Vol. 20, no.2, pp.193-202.Gibson, H 1996, ‘Patterns of leisure-based tourist role preference for men and women over the adultlife course’, WLRA Conference, Cardiff, Wales.Jacobsen, JKS 2000, ‘Anti-tourist attitudes: Mediterranean charter tourism’, Annals of TourismResearch, Vol. 27, no.2, pp.284-300.Keng, KA & Cheng, JLL 1999, ‘Determining tourist role typologies: An exploratory study ofSingapore vacationers’, Journal of Travel Research, Vol. 37, no.4, pp.382-390.Kim, C & Lee, S 2000, ‘Understanding the cultural differences in tourist motivation between Anglo-American and Japanese tourists’, Journal of Travel and Tourism Marketing, Vol. 9, no.2, pp.153 –170.Kinnaird, V H & Hall, D 1994, Tourism: a gender analysis, Wiley and Sons, West Sussex.Lam, T & Tang, V 2003, ‘Recognising customer complaint behaviour: the case of Hong Kong hotelrestaurants’, Journal of Travel and Tourism Marketing, Vol.14, no.1, pp.69–86.Mehmetoglu, M, 2004, ‘A typology of tourists from a different angle’, International Journal ofHospitality and Tourism Administration, Vol. 5, no. 3, pp.69–90.Mehmetoglu, M 2006, ‘Segmenting the nature-based tourists based on travel mode choice’, Journal ofHospitality and Leisure Marketing, Vol.14, no.4, pp.47-67.McIntosh, AJ & Thyne, MA 2004, ‘Understanding tourist behaviour: using means–end chain theory’,Annals of Tourism Research, Vol.32, no.1, pp.259-262.Mohsin, A 2005, ‘Tourist attitudes and destination marketing: the case of Australia’s NorthernTerritory and Malaysia’, Tourism Management, Vol.26, no.5, pp.723-732.Mok, C & Armstrong, WR 1998, ‘Expectations for hotel service quality: do they differ from culture toculture?’, Journal of Vacation Marketing, Vol.44, no.1, pp.381 –391.

Journal of International Scientific Publication: Economy & Business, Volume 6, Part 4
ISSN 1313-2555, Published at: http://www.scientific-publications.net
89 Published by Info Invest, Bulgaria, www.sciencebg.net
Nepal, SK, 2008, ‘Residents’ attitudes to tourism in Central British Colombia, Canada’, TourismGeographies, Vol.10, no.1, pp.42-65.Norris, J & Wall, G 1994, ‘Gender and tourism’, Progress in Tourism Recreation and HospitalityManagement, Vol.6, no.1, pp.57-81.Ntvmsnbc, 2006, ‘Ruslar Turkiye’yi Sevdi’, viewed 10 January 2007,< http://www.ntvmsnbc.com/news/396394.asp>.Ozdamar, K 1999, Paket programlar ile istatistiksel veri analizi-1, Kaan Kitabevi, Eskisehir.Pizam, A & Reichel, A 1996, ‘The Effect of nationality on tourist behaviour: Israeli tour-guides’perceptions’, Journal of Hospitality and Leisure Marketing, Vol.4, no.1, pp.23–49.Pizam, A, Reichel, A, & Uriely, N, 2002, ‘Sensation seeking and tourist behaviour’, Journal ofHospitality and Leisure Marketing, Vol.9, no.2, pp.17-33.Pizam, A & Sussmann, S 1995, ‘Does nationality affect tourist behaviour?’, Annals of TourismResearch, Vol.22, no.4, pp.901 –917.Pizam, A Verbeke, MJ & Steel, L 1997, ‘Are all tourists alike regardless of nationality? Theperception of Dutch tour guides’, Journal of International Hospitality, Leisure and TourismManagement, Vol.1, no.1, pp.19-39.Reichel, A Uriely, N & Shani, A 2008, ‘Ecotourism and simulated attractions: tourists’ attitudestowards integrated sites in a desert area’, Journal of Sustainable Tourism, Vol.16, no.1, pp.23-41.Rogers, JC Ross, SC & Williams, TG 1992, ‘Personal values and purchase dissatisfaction response’,Journal of Consumer Satisfaction, Dissatisfaction and Complaining Behaviour, Vol.5, no.1, pp.81–92.Ryan, C 1995, Researching tourist satisfaction: issues, concepts, problems, Routledge, London, NewYork.Ryan, C & Sterling, L 2001, ‘Visitors to Litchfield National Park, Australia: a typology based onbehaviours’ Journal of Sustainable Tourism, Vol.9, no.1, pp.61-75.Summers, J & Mc Coll-Kennedy, RJ 1998, ‘Australia as a holiday destination: young Americans’ vs.young Chinese Malaysians’ decision-making’, Journal of Hospitality and Leisure Marketing, Vol.54,no.1, pp.33 –55.Wickens E 2002, ‘The sacred and the profane; a tourist typology’, Annals of Tourism Research,Vol.29, no.3, pp.834-851.Yazicioglu, Y & Erdogan S 2004, SPSS uygulamali bilimsel arastirma yontemleri, Detay Yayincilik,Ankara.You, X O’Leary, J Morrison, A & Hong, G 2000, ‘A cross-cultural comparison of travel push and pullfactors: United Kingdom versus Japan’, International Journal of Hospitality and TourismAdministration, Vol.12, no.1, pp.1–25.Yuksel, A Kilinc, UK, & Yuksel, F, 2006, ‘Cross-national analysis of hotel customers’ attitudestoward complaining and their complaining behaviours’, Tourism Management, Vol.27, no.1, pp.11-24.
Journal of International Scientific Publication: Economy & Business, Volume 6, Part 4
ISSN 1313-2555, Published at: http://www.scientific-publications.net
90 Published by Info Invest, Bulgaria, www.sciencebg.net
INTERNAL AUDIT – INTERNAL CONTROL SYSTEM
AND ORGANIZATIONAL STRUCTURE RELATIONSHIPKadir Dabbagoglu
Halic University Business School
Bankalar Cad. Mektep Sk. 21, Sishane Istanbul Turkey
Abstarct
An effective internal audit can only be possible if an effective control system exists, because theinternal audit should work in affiliation with the management board. And an effective internal auditsystem is closely connected with the organization type and operation of the organizational structure.In an organization that meets transparency, accountability, responsibility and fairness principlesadopted by the OECD (Organization for Economic Co-operation and Development), and that adoptscorporate management, internal control and efficiency provided by the internal audit will beenhanced. Management is to conduct planning, organizing, coordination and control activities toenable an establishment to achieve its goal effectively. And this condition clearly shows that theeffectiveness of the management function will be affected by the organizational structure in whichmanagement activities are to be conducted. This study approaches management, organization,corporate management, internal audit and internal control conceptually, within the scope of theirobjectives and components; and intends to reveal the relationship between those factors, theoretically.
Key words: Internal Control, Internal Audit, Corporate Management
1. MANAGEMENT AND ORGANIZATION
Management practices arising from the activities devoted to ensure cooperation and coordination in agroup, to achieve objectives in an effective and efficient way, emerged with the communal living(Baransel 1993). Although government management goes back to ancient times, management ofestablishments is a new concept. Several definitions about the management are present, according toscientists. According to economists management is one of the production factors along with nature,labor force and capital.
Production, in this concept, is essential for the maintenance of life. As a consequence, management isdeemed to be successful to the extend it enhances the productivity and the ratability of theestablishment. Those concerned with management science state that management is an authoritysystem. Accordingly, the organization consists of two groups; managers and managed ones. Therelationship between these two groups is the authority relationship. Where sociologists are concerned,management is described as a class and prestige system. In today’s world, the success achievedthrough science and education is the basis for moving up in this class. The common point of theseapproaches is management’s achieving definite objectives with the efforts of other people. Theobjective is a result desired to be reached. The existence of an organized group can be mentionedthrough the path to this objective. When talking about management what springs to mind is the seniorlevel. But management is in question at several levels in each organization. In consideration of thesestatements, the following definitions can be presented. Management, in an establishment, is to arrange

Journal of International Scientific Publication: Economy & Business, Volume 6, Part 4
ISSN 1313-2555, Published at: http://www.scientific-publications.net
91 Published by Info Invest, Bulgaria, www.sciencebg.net
the works attempted to reach an objective and is a process of directing a group to a common objective.In addition to this, management is to establish cooperation and coordination of individual and groupstudies, to conduct a common objective (Alpugan 1997).
Management is to execute tasks through the agency of other people and is the fulfillment of planning,organizing, command, coordination and control activities by an organization, regardless of beingprofit-oriented or nonprofit, to reach its objectives effectively and efficiently (Ataman 2009).
Management is to plan, organize, conduct and audit activities to reach the organization objectiveseconomically and effectively (Alpugan 1997).
The organization concept is the second step of the management functions.
Organization addresses the tasks to be fulfilled in an organization, the persons who will fulfill thosetasks, and several relations; systematically directs those components to the objectives ofestablishment; and aims to establish an orderly and constantly operating system. By developingmanagement steps; authorities and responsibilities are assigned, relationships between statuses areorganized, organizational bodies and departments are determined and communication links areestablished. Several different definitions on organization have been introduced by scientists andwriters. According to Alvin Brown, organization is an organized and formed version of interdependentbranches, each of which has a special function, operation or relation in general meaning. However,according to Chester I. Bernard (1886-1961), organization, in general, is a system of consciousactivities or powers belonging to two or more people. Another definition defines organization as thestructure representing the relationships between groups and individuals holding some duties,responsibilities and authorities within a body of activities, and who leagued together to reach anobjective (Aytac 2004).
2. CORPORATE MANAGEMENT
Four main principles, which are introduced by the OECD (Organization for Economic Co-operationand Development) and are generally accepted, are available regarding corporate management(Ozyilmaz & Olcer 2008).
Transparency Principle:
Transparency is the disclosure of adequate and righteous information regarding the company to relatedparties, in due time. Such information is in relation to the performance, financial situation,management and status of ownership of the institution.
Accountability Principle
Accountability principle is to keep the interests of managers in parallel with and moving in the samedirection as the interests of the company and shareholders. Corporate management should ensurestrategic guidance for the company, as well as in time and effective audit of the management by themanagement board, and should ensure the management board to bear responsibility to account to thecompany and to the shareholders.
Responsibility Principle
The responsibility principle is the convenience of the activities of the management of theestablishment for the legislation, articles of incorporation and internal regulation. This principle alsocovers auditing in the same way.

Journal of International Scientific Publication: Economy & Business, Volume 6, Part 4
ISSN 1313-2555, Published at: http://www.scientific-publications.net
92 Published by Info Invest, Bulgaria, www.sciencebg.net
Fairness
Fairness is to have the corporate management treat all related right-holders equally regarding allprocedures conducted by the corporate management. This principle envisages that all shareholders,including the minorities and foreign shareholders, are treated equally; the rights of the shareholders arevindicated; and the losses of shareholders are compensated, in case of any violation of their rights.
There is no model describing the best way for corporate management. The basis for this concept isexpecting the establishments’ to be transparent to their shareholders and stakeholders, to reflect thecurrent situation of the establishment, to comply with the ethical principles and to be responsible(Kocel 2010).
Objectives of corporate management can be summarized as follows (Ozyilmaz & Olcer 2008):
To ensure that senior management uses its powers and authorities to increase the interests of thestakeholders
To protect the rights of the shareholders and satisfy the same at a high level,
To ensure that company shareholders are treated fairly and equally,
To protect and guarantee the rights of the stakeholders, directly related to the company, to protect therights of minorities,
To enlighten the public about the company activities and financial state of the company, to ensuretransparency,
To determine the responsibilities of the management board,
To ensure that senior management of the company is responsible for shareholders and otherstakeholders due to its decisions and actions,
To create an atmosphere of trust from the point view of the investors making long term investments, tolower the cost of capital,
To control the conflict of interests between the agent and shareholders.
The following points can be listed as the advantages gained by the companies adopting corporatemanagement (Ozyilmaz & Olcer 2008):
The companies, adopting corporate management, have more participatory and adaptable decisionmaking processes. Managers, shareholders and the management board participate in the decisionmaking process and this condition guarantees a more effective decision making process.
Through participation, the generation of new ideas is facilitated.
Corporate management is less dependent on individuals. The more reliable the process of placing thecorporate management mechanism, the more successful the surveillance process will be.
The risks of being exposed to failed company strategies and blunting the organizations, due tointroversion and collusions to drive benefits, decrease.
Corporate management makes an organization more accountable to its own markets.

Journal of International Scientific Publication: Economy & Business, Volume 6, Part 4
ISSN 1313-2555, Published at: http://www.scientific-publications.net
93 Published by Info Invest, Bulgaria, www.sciencebg.net
3. THE CONCEPT OF CONTROL AND INTERNAL CONTROL SYSTEM
Internal audit is defined by AICPA (American Institute of Certifies Public Accountants) - Committeeon Auditing Procedure as all kinds of precautions and methods accepted and put into practice toprotect the assets of an establishment, to guarantee the validity and reliability of financial information,to enhance the effectiveness of activities, and to encourage the commitment to establishedmanagement policies.
In general, the entire policies and regulations, likely to ensure an establishment to reach its objectives,are called control (Ataman, Hacirustemoglu & Bozkurt, 2001).
The control concept emphasized in the above-mentioned definition does not reflect an action, insteadit reflects a process which includes miscellaneous control points and which is defined by procedures.An internal audit system mediates the management function to be conducted, and has this function andensures this function is put into operation. It is an instrument used by management, not a componentsubstituting management.
The United States of America - COSO (Committee of Sponsoring Organizations of TreadwayCommission) defines the internal audit system as a process developed to provide a reasonableassurance with regard to activity effectiveness and efficiency in establishments, reliability in financialreporting, and conformity with the related legislation; and as a process operated by the managementboard, managers and all other personnel (Yilanci, 2006).
Five inter-related elements are necessary to reach the objectives included in the definition of internalcontrol. The five elements of the internal control system are control environment, risk appraisal,control-related activities, information and communication, and monitoring (Pehlivanli, 2010).
These elements are determined as follows by the COSO (Bozkurt, 2011).
Control Environment
Control environment, one of the main elements of internal audit, is about the organizational structure,modus operandi, and the method with which risks are approached.
Honesty and ethical values
These values are defined by management, and are the basic elements of the control environmenteffecting the design, management and surveillance of the other elements under the internal auditsystem. Ethical and honest behaviors in an organization represent that the values determined by anestablishment are implemented by and shared with personnel. Management of the establishmentshould remove incentive likely to direct personnel to dishonest and unethical or illegal activities and toensure obedience to such rules.
Expertise
The qualifications of personnel should comply with the qualifications necessary to conduct a task.Increasing numbers of unqualified personnel shows a defected control environment in anestablishment. Internal auditors should sometimes report qualification, competence, consistency andinconsistency. In accordance with those reports several measures are taken to enhance personnelqualifications.
Journal of International Scientific Publication: Economy & Business, Volume 6, Part 4
ISSN 1313-2555, Published at: http://www.scientific-publications.net
94 Published by Info Invest, Bulgaria, www.sciencebg.net
Management philosophy and operation type
Factors such as risk perception of the management and the management’s stand in terms ofinterpretations of tax and financial reporting rules are the outcomes of management philosophy andoperation type.
Organizational Structure
Planning ensures a framework for realizing plans, as well as control and monitoring activities, withwhich an establishment can reach its objectives. The structure of an organization may be classified ascentral and centrifugal in terms of product, activity and geographical factors, or as a matrix structure.Even though the organizational structure is a significant factor for control environment, no unaidedstructure can be assessed perfectly.
Diffusion of authority and responsibility by the management
To conduct the activities of the establishment in an effective and efficient way, the segregation ofduties principle should be taken into consideration while assigning authority and diffusingresponsibilities to personnel.
Risk AppraisalInstitutions and assets come under internal and external environmental based risks. These risks shouldbe defined and their possibilities and effects should be appraised.
Risk appraisal is to define and analyze the risks likely to prevent an establishment from reaching itsobjectives. In today’s world, establishments continue their operation in a dynamic environment whereeconomy, industry, regulatory authority and activity conditions are in a constant state of flux. As aresult of this, updating the risks regularly and when required is as important as defining them. Riskappraisal consists of three stages:
“Effect of the Risk” representing the loss caused by the risky act is estimated.
Possibility and frequency of risk is determined.
Methods likely to be used to manage the risk and measures likely to be taken are appraised.
Control-Related Activities
Control activities represent the measures taken for the risks likely to be faced before reaching theobjective. Control activities are not the activities solely conducted by senior management; suchactivities are in question for each level and each functional unit in an establishment.
Authorization, validation, verification, conformity of the accounts, reviewing the performance of theactivities and performance measures, conformity controls, assigning sequential numbers to documents,limiting the access to the sources and records and diffusing duties can be given as examples of controlactivities. Controls can be preventive or discloser in accordance with their qualifications.
Information and Communication
Information required for personnel to fulfill their responsibilities should be kept in a definite formatand should be ready to communicate. Maintenance and control of the activities of an establishment ispossible through the reports generated through the agency of the information system. Informationrequired for the personnel to make certain decisions is not solely establishment based, externalinformation is also required. Effective communication in an organization should not be unidirectional;

Journal of International Scientific Publication: Economy & Business, Volume 6, Part 4
ISSN 1313-2555, Published at: http://www.scientific-publications.net
95 Published by Info Invest, Bulgaria, www.sciencebg.net
it should be ‘top-down’, ‘bottom-up’, horizontal and vertical. Personnel fulfilling their responsibilitiesregarding control can only be possible with the clear and explicit control message of the seniormanagement. In this sense, personnel may come to understand their roles in the internal audit systemand how the system works in an interacting manner. Information and communication should not bedeemed to be solely internal; parties outside the establishment, such as customers, regulatory authorityand partners should not be ignored in this process. Annual activity reports and corporate managementcompliance reports are the most effective instruments in the communication with the parties outsidethe establishment.
MonitoringMonitoring is to review the design and functions of the performance, quality and controls of aninternal audit system, and to evaluate the measures required to be taken. The monitoring process canbe constant, separated and complex. Constant monitoring is performed while activities are beingconducted. Regular monitoring activities conducted by the management and consultant and othermonitoring activities conducted by the personnel working on the same task are two examples ofconstant monitoring. On the other hand, separated monitoring activities are the monitoring and controlactivities held generally by the internal audit unit or by people irrelevant to the personnel working onthe task. The scope of separated monitoring depends on reliable initial risk appraisal activities and onthe effectiveness of constant monitoring activities. Constant and separated monitoring types are usedtogether in practice.
4. MANAGEMENT AND ORGANIZATIONAL STRUCTURE – RELATIONSHIP BETWEENCORPORATE MANAGEMENT AND INTERNAL AUDIT SYSTEMCorporate management principles aiming for the ultimate success of an institute compose a generalapproach that corresponds to a series of fields, such as ethical rules, obeying the laws, environmentalprotection. As time progresses an inevitable gap come into existence between the legislation andpractices, no matter how developed the legal infrastructure is and how flexible and how sensitive theregulation process is to developments, and therefore corporate management is needed. Attempts aremade to close this gap with new legal regulations, but this process takes time. Corporate managementregulations have significant roles in shortening this gap. Corporate management, the main objective ofwhich is to observe the interests of all right-holders relevant to the company impartially, is a body ofprinciples that shapes the relationship between company and right-holders as well as otherbeneficiaries, and that enables the right-holders to optimize their interests acquired in the company.
5. CONCLUSION
An effective internal audit can only be possible if an effective control system exists. Internal auditunits subordinated to management board enhances the effectiveness of the internal audit.
Therefore, the effectiveness of an internal audit system is in close relationship with the establishment’sobedience with corporate management principles, along with its organizational structure. The moreeffective organized internal control system, the more enhanced the performance of internal audit willbe and risks likely to be faced will decrease proportionately.
Journal of International Scientific Publication: Economy & Business, Volume 6, Part 4
ISSN 1313-2555, Published at: http://www.scientific-publications.net
96 Published by Info Invest, Bulgaria, www.sciencebg.net
Internal control is a process required to be performed by everyone in an establishment. Internal controlis an instrument used by management, but does not substitute the management. Such a control systemshould be constructed in the infrastructure of an establishment and should be settled in this sense.
On the other hand, an internal audit is an independent and objective confidence and consultancyactivity that is implemented to develop and enrich the activities of an establishment. Internal auditassists an establishment to reach its objectives with a systematic and disciplined approach devoted toassess and develop the effectiveness of an establishment’s risk management, control and corporate riskmanagement processes. An internal audit should offer not only an independent and objective function,but also but also consultancy function.
Cornerstones of the ground on which an effective corporate management is to be constructed aresenior management, management board, internal auditors, and independent auditors. Internal auditactivity plays an important role in supporting a good corporate management. Risk management has aspecial position likely to assist in enhancing the establishment activities by assessing and developingthe effectiveness of control and management processes.
In conclusion, adopting, or in other words, applying a corporate management concept containing aninternal audit mechanism to be established within the scope of internal control system is in closerelationship with the organizational structure of the establishment. As a type, organization is based ondepartmentalization principle in accordance with the world-wide most common function basis. In thisorganization type, based on basic hierarchical structure, senior management is at the top of the schemeand medium-low managers are placed in the lower parts of the pyramid. Organization usually consistsof functional sub-units, such as engineering, research, production, accounting, management, financeand marketing. This organization type is based on the expertise, execution-consultation relations,control area, and authority and responsibility factors of the traditional organization concept. Experts’organization under the same leader is deemed to be easier, and managers are requested to bespecialized in one branch (Cummings &Worley 1993).
Advantages
Promotion opportunity for people with special abilities
Increasing scarce sources and enhancing optimized use of sources
Developing occupations for experts in bigger departments and enrichment
Due to this system, a manager is able to assign a task for junior personnel in other departmentswithout losing time for the operation of command system, and this accelerates the activities.
Disadvantages
Routine duties, narrow horizons
Encouraging a narrow perspective in managers
Reducing communication and cooperation between units
Several interdependence between units
Responsibility determined in detailed results
Unauthorization of those with commanding positions
Journal of International Scientific Publication: Economy & Business, Volume 6, Part 4
ISSN 1313-2555, Published at: http://www.scientific-publications.net
97 Published by Info Invest, Bulgaria, www.sciencebg.net
If one of the expert personnel leaves the job, this situation may cause some problems and a gap,because the works of expert personnel are embraced as principles.
Determining responsibilities and auditing may become difficult.
The power of such organizations is the centralization of similar sources. This, at the same time, is themain weakness of the organization. So as far as the multi-projects are concerned, competition andconflict at senior level become inevitable. As a result, a functional unit gives priority to its interestsand objectives, even if this situation is against the integrity of the organization. Internal audit may bedeemed as a type of effective organization.
REFERENCES
Alpugan Oktay, “Isletme Ekonomisi ve Yonetimi”, Beta, Istanbul, 1997
Ataman Goksel, “Isletme Yonetimi”, Turkmen, Istanbul, 2009
Ataman Umit, Hac rustemo lu Rustem, Bozkurt Nejat, “Muhasebe Denetimi Uygulamalari”, Alfa,Istanbul, 2001
Aytac Omer, “Orgutler Sosyolojik - Bir Perspektif”, Firat Üniversitesi Sosyal Bilimler Dergisi, Cilt14, Elaz g, 2004
Baransel Atilla, “Çagda Yonetim Dusuncesinin Evrimi”, Isletme Fakultesi Yayin No: 257, Istanbul,1993
Bozkurt Nejat, TURMOB Denetim Egitimi Notlar , Istanbul, 2011
Cummings G. Thomas and Worley Christopher, “Organization Development and Change”, WestPublishing Company, Newyork, 1993
Efil smail, “Isletmelerde Yonetim ve Organizasyon”, Dora, Bursa, 2010
Koroglu Ça r and Ucma Tu ba, “Isletmelerdeki Iç Kontrol Sisteminin Etkinligi ve Di DenetimdekiOnemi”, Mevzuat Dergisi, Say : 3, Istanbul, 2006
Pehlivanli Davut, “Modern Iç Denetim ve Güncel Iç Denetim Uygulamalar ”, Beta, Istanbul, 2010
Yilanc , Munevver, “Iç Denetim”, Nobel, Ankara, 2006

Journal of International Scientific Publication: Economy & Business, Volume 6, Part 4
ISSN 1313-2555, Published at: http://www.scientific-publications.net
98 Published by Info Invest, Bulgaria, www.sciencebg.net
PROBLEMS OF IMPLEMENTATION CORPORATE SUSTAINABILITY IN THE NEW EU
STATES ON THE EXAMPLE OF POLANDJacek Kami ski
Pope John Paul II State School of Higher Education in Bia a Podlaska
Institute of Economy and Management, Sidorska 95/97, 21-500 Bia a Podlaska, Poland
AbstractThe paper is devoted to the issue of implementation of the concept of sustainable development into theactivities of enterprises in new UE states on the example of Poland. Explains what is meant bysustainable development of the company and how it can be measured. Discusses the key drives ofsustainable development of enterprises.
Key words: sustainable development, sustainable development of enterprises, methods of enterprises’sustainable development assessment, factors of the sustainable development of enterprises
1. INTRODUCTION
Sustainable development, understood as a method of the societies harmonious development withoutcompromising the abilities of the future generations, has been described, on a rather large scale, fromdifferent perspectives. In most of the publications interpretation of the sustainable development is on aglobal or local scale (Kie czewski, 2008; Poskrobko, Dobrza ski, 2007). Significantly less attention isput to the sustainable development in enterprises. While, an enterprise is a fundamental business entitywhich manages production and services at its own expense, and the success of sustainabledevelopment introduction depends, to a high degree, on an enterprise. The interest in the sustainabledevelopment at the enterprises level is connected with public expectations towards companies. It iscommonly expected that at the present stage of the worlds economy, the aim of their existence will beconnected with activities directed at environment protection, respect for labour rights, development ofsocieties in which they act and other elements which contribute to a broad notion of corporate socialresponsibility. According to many experts, the ability of an enterprise to manage the issues notconcerned with finance such as: environment protection, human resources or human rights is currentlythe major indicator of the enterprise’s general management.
At present, the knowledge about level of enterprises’ sustainable development is important forrepresentatives of many environments, for example: investor who would like to put their money insuch companies, governments looking to attract companies that will contribute to building theirsocieties, managers who want to benchmark their company’s sustainability performance, consumersand groups of citizens wondering which global brands to buy and employees who want to work for aglobal company they can be proud about.
The presented text is devoted to issues concerning relations between the sustainable development andan enterprise. The most emphasis has been put on implementation of the sustainable development byenterprises. The major subjects of concern are enterprises from the new EU members, while an
Journal of International Scientific Publication: Economy & Business, Volume 6, Part 4
ISSN 1313-2555, Published at: http://www.scientific-publications.net
99 Published by Info Invest, Bulgaria, www.sciencebg.net
analysis concentrates on the example of Poland. The aim of this article is to give an answer to aquestion: what are the factors that determine the implementation of the sustainable development bythese enterprises and what are the most important conditionings of this process.
2. NOTION OF CORPORATE SUSTAINABILITYAs far as it is commonly know what the sustainable development means on the global or local scale,the enterprises sustainable development may seem not to be a very clear and precisely defined notion.
The sustainable development is a human idea of global development which assumes commonresponsibility and solidarity of the present and future generations. Its purpose is to improve lifeconditions and social well-being with limited natural resources and taking into account long-termindustrial development; however, the primary goal is the increase in social well-being. The purpose isto connect the economic and social development, as well as provide access to renewable and non-renewable sources with increase of life quality in clean environment. In theory, the notion ofsustainable development is based on paradigm reversal to neoclassical economy which assumes thatgoods such as soil, air, waters, woods are unlimited. That is why they are called free goods, and theycan be used in production process without limitations. According to the assumptions of the sustainabledevelopment, these goods became sparse goods, and they should be treated at least as the capitalgenerated by a human being. The economic growth should ensure better exploitation of the resourcesand other natural riches, rational energy, work and ecological technology consumption, as well asprotection of the natural and cultural heritage. The non-renewable resources should be exploited to alesser degree, whereas the renewable resources (animal and vegetable) in a rate that follows from thetime that is necessary for their reproduction. If we want to use a technical language, we can say thataccording to the notion of sustainable development, society can, to a certain extent, live from“interests” and not from “capital”. According to International Institute for Sustainable Developmentand World Business Council for Sustainable Development, sustainable corporations means adoption ofsuch action strategy which meets its current needs and interest group connected with it, and at thesame time protects, supports and strengthens human beings, as well as origin of resources which theywill need in the future (Business.., p.1). As a result, enterprises have to undertake various tasks. It isshown by acting in a innovative way, taking charge in initiatives concerning equivalent development,claiming social responsibility for the conducted activity, raising the efficiency of ecological processesand procedures, implementing partnership solutions and taking into consideration the customerspreferences (Adamczyk, Nitkiewicz, 2007). Therefore, the sustainable development meanscomprehensive operation with reference to the economy, society and environment; however, neither ofthese three areas is privileged in the enterprises activities. If a business puts too much attention to oneof these areas, this may be detrimental to the enterprise’s success.
3. PROBLEMS OF HOW MEASURE CORPORATE SUSTAINABILITY
Even though it is clear how the corporate sustainability should be understood, its assessment is not aneasy task. Difficulty of measuring the corporate sustainability results not only from problem of how toassess the activities that have been taken in account from the above mentioned areas, but also meetswith difficulties due to some other reasons.
- Firstly, it follows from the fact that the sustainable development is a notion that goes beyond the localenvironment and its effects can be considered in international or even global terms. Moreover, the

Journal of International Scientific Publication: Economy & Business, Volume 6, Part 4
ISSN 1313-2555, Published at: http://www.scientific-publications.net
100 Published by Info Invest, Bulgaria, www.sciencebg.net
notion is not assumed to be used to assess an enterprise, while the complexity of sustainabledevelopment aims go beyond the frames of company.
- Secondly, the effects of sustainable development are evaluated much longer in time perspective thenenterprise’s activity. The purpose of the sustainable development is to guarantee fairness betweengenerations, and its outcomes are supposed to be used by the future generations. In other words, theresults of ‘investment’ in the sustainable development are long-term. Meanwhile, most of an enterpriseassessment methods, even those conducted from the strategic perspective, take into considerationshorter time perspectives, while its activity is determined by primacy of the present over the future(Noga, 2007).
- Thirdly, the conduct of business activity requires operationalisation, while notion of the sustainabledevelopment cannot be formalised in an easy and universal way. Similarly to the changes inenvironment, the notion is fluent and changes with time by responding to new information, as well asto development of the social needs and priorities. That is why, for instance, Toyota, which markedfour foreign plants as model for sustainable development, had to elaborate specific activities for eachof them, taking into account peculiarity of each region and enterprise.
- Fourthly, the major obstacle for the assessment, and more specific the research of enterprises’sustainable development, is a difficulty to obtain broad data about significant group of enterprises.These data, especially in case of companies which operate in a very specific environment, are veryoften deliberately kept secret or disfigured in order not to allow them to be used against enterprise’sobjectives. Moreover, they are not so easily available as macroeconomic information which allowsresearchers to estimate the level of sustainable global economy. This information covers data oninvestment in clean energy projects, as well as governments expenditures on neutralization of carbondioxide, environment and energy hedge funds (On the basis of this information, Worldwatch Instituteprepared a report titled The World Situation.)
From the above mentioned reasons, assessment of the enterprises’ sustainable development degreepresents considerable difficulties. Most authors agree that there is still lack of universal and syntheticindicator which would allow people to specify level of the enterprises’ sustainable development. Theassessment is multidimensional, and in practice includes all aspects of running an enterprise.
3.1. Evaluation of the corporate sustainability based on efficiency measures
Among the methods of enterprises’ sustainable development assessment special attention should bepaid to the assess based on efficiency measurement. This notion refers to economic efficiency whichassumes comparison of inputs and outputs expressed in cash. With reference to the efficiencyunderstood in this way, the notion has been extended by extra economic and extra technical aspects.This also refers to influence of an enterprise on closer and further environment. In relation to thetraditional concept of efficiency, the notion loses its inner character and adopts more externaldimension. The notion is interpreted with reference to economic, social, ecological and technologicalstandards. With regard to difficulty to present all inputs and outputs from the above standards in theform of money, the notion assumes introduction of new non-financial indicators. The most popularmethod of the enterprises’ sustainable development assessment, devised on the basis of theseassumptions, is Data Envelopment Analysis (DEA), method used to measure Decision Making Unit(DMU) and based on measurement of inputs and outputs (Charnes et al., 1978).

Journal of International Scientific Publication: Economy & Business, Volume 6, Part 4
ISSN 1313-2555, Published at: http://www.scientific-publications.net
101 Published by Info Invest, Bulgaria, www.sciencebg.net
3.2. Evaluation of the corporate sustainability in accordance with the authors of Global 100
A list of the 100 most sustainable corporations in the world, called Global 100, was published for thefirst time during the World Economic Forum held in Davos, Switzerland. The authors of the list tookinto account company’s achievements in environment, society and corporate governance. The list wasinitiated by Global Knights, a media company, and Innovate Strategic Value Advisors a leadingresearch firm specializing in analyzing “non traditional” drivers of risk and shareholder valueincluding companies’ performance on social, environmental and strategic governance issues. TheGlobal 100 has been announced every year since it was published in 2005.
According to the authors of this list, the social, environmental and managing factors, to a high extent,are connected with enterprises’ financial results, and those companies which have higher managementlevel in these areas gain advantage over their competitors faster and that later turns into good resultswithin longer time. The enterprises from the Global 100 are recognised as sustainable because, incomparison to other companies, they are more capable to specify and manage environmental, socialand governance (ESG) factors, which in turn determine their possibility and aspects of business risk.The selection process includes companies which at the end of a previous year received AAA ratinggrade for non-current liabilities (www.global100.org).
3.3. Dow Jones Sustainability Index
The Index was created on the basis of cooperation and connection of skills and experience of threepartners: the author of Dow Jones Index, one of the most popular index in the world, STOXX Limited,leading provider of European indexes, and SAM Group, leading investment company for sustainabilityinvestments.
Dow Jones Sustainability Index is a classification of enterprises which include in their policies socialand environmental goals. The place on the index depends on Corporate Social Responsibility (CSR) inwhich a major source of information is a questionnaire completed by companies and later checked byan external auditor from PricewaterhouseCoopers. The auditor takes into account various criteria andweightings from the economic, social and environmental development for the eligible company.
The criteria are selected by systematic assessment of the socially responsible corporations worldwide.In a selection process, company’s documentation and media messages are analysed and, in the finalstage, there is individual consultation with a company’s representatives. The authors of DJSI intendedthat this index would provide the enterprises with economic assessment of their sustainabledevelopment strategy, management of the social responsibility and costs. It also connects enterprisesthat implement principles of sustainable development and investors that want to gain profits from thecompanies results (www.sustainability-index.com).
4. FACTORS WHICH DETERMINE DIFFERENTIATION LEVEL OF THE ENTERPRISES
FROM THE PERSPECTIVE OF SUSTAINABLE DEVELOPMENTIt is impossible to discuss all factors which determine level of the enterprises’ sustainabledevelopment. Whether an enterprise will manage to implement principles of the sustainabledevelopment, depends largely on business environment, and mostly on the industrial policy towardsenterprises. In general, the aim of such policy is to encourage the enterprises to implement the policyof sustainable development. On the one hand, such policy can encourage to implement principles ofthe sustainable development (to sustainable production and consumption), while on the other hand,
Journal of International Scientific Publication: Economy & Business, Volume 6, Part 4
ISSN 1313-2555, Published at: http://www.scientific-publications.net
102 Published by Info Invest, Bulgaria, www.sciencebg.net
this reduces its sustainability. The economic policy which supports sustainable development results innew companies and new business activities. If we analyse these issues with reference to new EUmember states, such as Poland, there are at least a few groups of problems which should be taken intoconsideration while analysing an implementation stage of the enterprises’ sustainable development.
Firstly, this is policy and strategy of the European Union: the general one oriented to needs of theUnion, both the old and the expanded, as well as the policy concerning the Union’s environment.This means the policy and strategy conducted in an international and global context, as well as theone oriented to new member states and consisting in unfurling “sustainable developmentumbrella” over the new EU member states.
Secondly, the EU members have their internal strategies, policies and activities, i.e. formulation ofthe sustainable industrial development principles.
Thirdly, these are activities undertaken in an enterprise level (Zacher, 2005).
Obviously, there is feedback between the above mentioned stages because the economic policy givesenterprises possibilities to operate, and they in turn, through their activities, have influence onregulatory policy both in the European Union and in the member states.
4.1. The European Union’s policy and strategy in the filed of formulating principles of the enterprises’sustainable development
The new approach of the EU towards the sustainable development was presented in „The FifthEnvironmental Action Programme” in 1993. This approach was based on the conviction thatenterprises are not only a source of most environmental problems, but they also have to take part insolving these problems (Rok, 2004). “The Sixth Environmental Action Programme” adopted in 2000by the European Council accepted series of detailed solutions such as: ecological tax, directives withinthe framework of good environmental management practices, or assumptions of integrated productpolicy which suppose that during designing, producing and recycling the environment should be takeninto consideration. “Commission Staff Working Paper on Sustainable Industrial Development” (SEC(199) 1729) was one of the first documents which described general conditions of interaction betweenareas of the sustainable development and the industrial policy. Special emphasis was put in thisdocument on a need to integrate three principles of the sustainable development, i.e. its economic,social and environmental aspects, as well as on the importance of economic and financial instrumentsin its implementation. In its attitude to principles of the sustainable development towards economicpolicy, the European Commission stated that this policy should be directed at the whole businessenvironment in order to enable the enterprises; regardless of their size, administration and legal form,trade or localization; growth and development in a way that is compatible with the aim of theEuropean Union, i.e. the sustainable development (Challenges…, 2000). Furthermore, this documentunderlines systematic representation of the economy and the role of an enterprise as its part. The majorissue towards enterprises is understanding the needs of the sustainable development as the global aimand the role of an enterprises as the smallest element responsible for its achievement.
“The Strategy for Sustainable Development of the European Union” adopted in Gothenburg in 2001assumes that many changes which are necessary to ensure the sustainable development can beeffective only if they are made at the EU level, and the idea of the sustainable development isexpressed in all sectoral policies (Strategia… 2001). Regardless of these type of regulations,connection of the sustainable development and policy towards enterprises still seems to be aconceptual challenge for the European Union. The major document in this field has become thestrategy of sustainable consumption and production prepared by the European Commission. It
Journal of International Scientific Publication: Economy & Business, Volume 6, Part 4
ISSN 1313-2555, Published at: http://www.scientific-publications.net
103 Published by Info Invest, Bulgaria, www.sciencebg.net
frequently happened that the Commission delayed publication of both strategies. It proves that theexecutive authority of the EU meets with difficulties to define its approach towards this complicatedissue. The difficulty with publication the strategy of sustainable industrial development was resultedfrom many reasons, and mostly from considerable diversity of the enterprises which are a specialcategory of business entities. Books which give answer to what is an enterprise and how it operates,include the major part of studies from economics and management, what is determined by varioustheoretical and practical reasons such as:
- different approach towards an enterprise which on the basis of various scientific disciplinesdisplays its other aspect, and mostly sets the enterprise different tasks;
- significant diversity of paradigms and theories of an enterprise which even if analysed within onefield of study, for instance economic science, would define its essence in a different way. Forexample, if we apply some simplification, the theories of an enterprise within the economicscience are as follows: economic theories about an enterprise and an enterprise theory are found inmanagement science (Gorynia, 2007). It is possible to mention a few different approaches onlywithin economics. For instance, neoclassical model of an enterprise presumes that in the first placeit is an entity which buys factors of production and changes them into goods or services for sale,while from the perspective of evolutionary economics enterprises try to adapt changing marketconditions, as well as the expected economic shock and fluctuations. In management, there arealso various ways of perceiving the enterprises, their aim, functions and tasks in management(Morgan, 2008).
- dissimilarity of an enterprise position depending on the country, despite of internal economicpolicy and the common European market. The distinctions appear between enterprises from theold and new EU member states.
- significant diversity of enterprises, when we talk about their size: sole enterprises and those thatemploy thousands of people, type: one- or multi-facility enterprises, status and form of ownership:(state-owned, private, collective and those that belong to local authorities, type of businessactivity: service oriented enterprises, including commercial, production and mixed;
- enterprises are dynamic organizations which are constantly changing as a result of various factors,from which the most important is the more significant role of service sector, broader marketfacilitation of the public sector, transfer of the ownership in the form of shareholder structure, aswell as increasing role of knowledge in the contemporary economy. All of this causes that theenterprises enter into new areas in which they have never been yet, or they were present in alimited scope, for example educational, health or pension fund enterprises. Moreover, theenterprises adapt new forms both when we talk about their ownership, joint stock company, andthe method of an enterprise’s operation, virtual enterprises.
16 July 2008 the European Commission presented a package of programs, which are a part of theSustainable Development Strategy designed to support products made in accordance with theprinciples set out in the Strategy, which is environmentally friendly and energy efficient throughouttheir lifecycle, and also increase awareness and demand potential recipients of such products. Thedocument present the vision of these programs and to justify their use is the Commission’sCommunication to the European Parliament, the Council, the European Economic and SocialCommittee and the Action Plan on Sustainable Consumption and Production and SustainableIndustrial Policy.

Journal of International Scientific Publication: Economy & Business, Volume 6, Part 4
ISSN 1313-2555, Published at: http://www.scientific-publications.net
104 Published by Info Invest, Bulgaria, www.sciencebg.net
Among the items on which the strategy of sustainable consumption and production in the EU candistinguish a group of policies and strategies, which include:
- Integrated Product Policy (IPP);
- Thematic Strategy on the Sustainable Use of natural Resources;
- Thematic Strategy on Waste Prevention and Recycling;
- Environmental Technologies Action Plan (ETAP);
- European Compliance Assistance Programme Environment & SMEs;
- Green Public Procurement (GPP);
- Eco-design of Energy Using Products;
- Eco-Management and Audyt Scheme (EMAS);
- Ecolabel Scheme (Communication… 2008).
Both strategies and tools included in the package “Sustainable consumption and Production” may bethe cause of beneficial changes in enterprises, because it will increase the market share of innovativetechnologies and products, while reducing negative environmental impact.
When taking about creating basis of the enterprises’ sustainable development it is necessary to assess,to a lesser degree, the role of project cofinaced by the European Union. If we take in to account allprojects: transport and environment protection investments, subsidies for enterprises and farmers,assistance for education, health care, tourism and help for the unemployed, the value of theircofinancing from the EU funds calculated on one Polish citizen, according to data from Ministry ofRegional Development, amounted 2363 PLN between 2004-2006 differing among regions. The LowerSilesian, West Pomeranian, Mazovia, Silesian and Pomeranian provinces received the biggest amountof more than 3.000 PLN, whereas the Opole, Podkarpacie, Malopolskie, Lubusz and Lublin provincesreceived only 1.700 PLN (Cie lak-Wróblewska, 2008). Therefore, one of the most important objectiveof the EU help was not achieved, i.e. reduction of gap between the richest and the poorest regions inPoland. On the contrary, the differences even deepened. This was a result of the money distributionmethod from which about 80 per cent was allocated by means of competition. In this situation, thestrong provinces had more chances because, having better employees, investment and financialpotential, they prepared better projects. It is also necessary to pay attention to the fact that due to thegovernment’s policy all the central investments passed the Central Poland.
4.2 Building of the enterprises’ sustainable development basis at the national level
In Poland, the sustainable development became a constitutional law even before Poland joined theEuropean Union. It can be found in Art.5 in the Constitution of the Republic of Poland (1997) whichsays: ”The Republic of Poland (...) ensures environment protection by acting in accordance with theprinciple of sustainable development”. The fact that the principle of sustainable development wasplaced in the Constitution of the Republic of Poland causes that it forms basis for the whole Polishlegal system, is superior to other legal acts and is taken into account while other laws are passed.Moreover, it sets policy for the public authority which point is an order to achieve the sustainabledevelopment. Apart from that, the Law of Environment Protection, which is in force in Poland, hasbeen amended several times to adapt to changing needs (Ustawa…, 2001), and is based on thesustainable development definition from Brundtland Report (Nasza…, 1991). This form of regulationensures cohesion between international resolutions and Polish legislation. The addressees of the

Journal of International Scientific Publication: Economy & Business, Volume 6, Part 4
ISSN 1313-2555, Published at: http://www.scientific-publications.net
105 Published by Info Invest, Bulgaria, www.sciencebg.net
provisions of the law are not only natural person and business units which do not run businessactivities, but also enterprises. The law places the Polish legal order on the system founding rules.Whereas, the law implements the environment protection on the basis of comprehensive assessmentprinciple, prevention principle, caution principle, “Contaminator pays” principle and sustainabledevelopment principle.
The notion of the sustainable development has been also written down in the following documents:
- “The Second National Environmental Policy” (II polityka…, 2000),
- Poland 2025. Long-term Sustainable Development Strategy (Polska 2025, 2000),
- National Strategy for Ecologically Sustainable Development for the years 2009-2012 with aview to the year 2016 (Polityka…, 2008).
In 2003-2007, thirty countries have developed national documents relating to the implementation ofsustainable production and consumption (the national framework strategies and actions programs). Inthe EU were Belgium, Czech Republic, Finland, France, United Kingdom and Poland. Some of themare updated, or is part of new or existing policies. Adopted in 2003, the National Strategy for changingproduction and consumption patterns to promote implementation of the principles of sustainabledevelopment indicated the directions of the necessary changes that contribute to the restructuring ofresource-intensive sector. In view on the fact that in every sector of economic activity there isuntapped potential for innovation to manage aspects of sustainable development throughout the “livecycle” it may help stimulate grass-roots industry initiatives, particularly those involving whole supplychain (Zrównowa ona…, 2011).
One of the major questions that can be asked with regard to building the sustainable industrialdevelopment at the national level, is a question about the sustainable condition of the Polish economy.If we assume that an indicator of the economy is dematerialization of production and consumption,then the Polish economy looks well enough. Comparative research concerning material input indicatorincluding Total Material Input and Direct Material Input in Poland and Germany shows much greaterconsumption of metal and mineral resources, fossil fuels and mineral-derived resources in buildingindustry in Germany than in Poland. This indicates that the Polish economy is much more sustainablethan the German.
March 25, 2011, the Ministry of Economy held a meeting open process to develop a Vision forSustainable Development of Polish Business (Vision 2050. The New Agenda for Business in Poland),whose objective is to determine the role that business has to play over the conditions forimplementation of the development aspirations of present and future generations (Wizja 2050, 2011).
4.3. Activities at enterprise level
From an enterprise perspective, involvement in the sustainable development takes form of severalstages:
1) At first, enterprises try to cope with emitted pollution and exploitation of natural resources bytreating them as operating costs;
2) Then, enterprises try to implement clean production programs in order to predict and avoidbearing these costs;
3) Finally, enterprises join improvement of the environment with economic benefits (eko-efficiency);

Journal of International Scientific Publication: Economy & Business, Volume 6, Part 4
ISSN 1313-2555, Published at: http://www.scientific-publications.net
106 Published by Info Invest, Bulgaria, www.sciencebg.net
4) The most important stage of enterprise’s involvement in the sustainable development is runningbusiness activity in such a way that an enterprise seeks for balance between three principles of thesustainable development: social, economic and ecological, assuming that sustainable managementwill include integrated activities in all these three areas.
In order to implement the above mentioned activities, enterprises can use various tools such as: audits,environmental, ICC’s Business Charter for Sustainable Development or environmental managementsystems standard. The involvement of enterprises in the sustainable development and use of thesetools will result in implementation of economic strategy, in which the sustainable development playsthe major role (Adamczyk, Nitkiewicz, 2007, p. 74-75).
From the perspective of the sustainable development implementation, very useful can be a proposedstrategy included in a report: “A New Mindset of Corporate Sustainability” and elaborated by expertsfrom the United Kingdom, the United States, Spain, China and Singapore (Grayson et. al, 2010).According to the authors of the report, the achievement of sustainability goals does not requireextensive re-engineering of the corporate structure. Instead, it requires conviction and vision at thevery highest levels of the organisation so that a set of values coherent with corporate responsibility andsustainability are instilled throughout. On the basis of experience of such companies as: Cemex,Marks&Spencer or Shenzhen Water, academics developed a new approach towards the sustainabledevelopment named S²AVE (Shareholders and Social Added Value with Environment Restoration).Effectiveness of its implementation should be guaranteed by the following 10 steps:
1. Make innovating for sustainability a part of your company’s vision.
2. Formulate a strategy with sustainability at its heart.
3. Embed sustainability in every part of your business.
4. Walk the talk: Staff and other stakeholders need to hear their leaders explain regularly whatresponsibility and sustainability mean for the business and the innovation possibilities they hold,and see the actual programs implemented.
5. Set up a body with the power to make sustainability matter. Findings show that the most effectivesustainability committees fulfil the following purposes: consider, review, evaluate and superviseintegrated environmental, social and ethical policies of the sustainable development, collaboratewith management and advise Board of Directors on responsibility and sustainability issues.
6. Set firm rules: Establish a code of conduct on sustainability covering both your employees andother stakeholders in your business..
7. Bring your stakeholders on board: Identify all the stakeholders in your business – shareholders,employees, suppliers, customers, the communities in which you operate – and engage with themon thinking about sustainability.
8. Use people power: Ensure that sustainability is a clearly stated value at every stage of your peoplemanagement process, whether it is advertising for staff, hiring, induction, performance appraisal,remuneration or promotion.
9. Join the networks: Keep contact with bodies dedicated to encouraging sustainable business such asWorld Business Council for Sustainable Development and other.

Journal of International Scientific Publication: Economy & Business, Volume 6, Part 4
ISSN 1313-2555, Published at: http://www.scientific-publications.net
107 Published by Info Invest, Bulgaria, www.sciencebg.net
10. Think beyond reporting: align all business systems with the company’s vision of sustainability:Sustainability should run through every core system, business systems, in an enterprise: evaluationof suppliers, customer relationship management – CRM or balanced scorecard.
The implementation of these 10 steps should guarantee that an organisation would become asustainability-driven innovator.
CONCLUSION
The purpose of this article was to show that the sustainable development depends onimplementation of its ideas at an enterprise level. From the conducted analysis, the followingconclusions can be drawn:
- There is close connection between progress in the sustainable development and conduct ofenterprises in this matter. That is why, one of the indicators of progress in the sustainabledevelopment implementation should be enterprise sustainability level. Furthermore, analysisshould include enterprises sustainability level in a given country, since it may be an informativeindicator about effectiveness of the policy;
- In the progress of the sustainable development implementation, it is very important to overcomean awareness barrier, and mostly a conviction that the sustainable industrial development iscontrary to the principles of effective management and implementation of the sustainabledevelopment principles does not allow enterprises to gain high profits. The exemplary enterprisesanalysed in the report titled “A New Mindset of Corporate Sustainability” and other works, showthat implementation of the sustainable development favours innovative solutions that help to gainhigher profits than before. That is why, the best measure of quality in an enterprise managementshould be the sustainable management;
- The status of the sustainable development implementation by the Polish enterprises requiresfurther analysis. It seems necessary to conduct research in this matter because from the perspectiveof the sustainable development the existing classifications of enterprises perform their functionsonly to some extent. The classifications include only the most sustainable enterprises, but they donot provide any other important information, among other things, about the average level ofsustainability. This may result in a dangerous situation that there will be ‘two ways’ in this matter.Since enterprises from the new EU member states, despite of making every effort, still will nothave chance to be on the list of the most sustainable enterprises for a long time. However, we canexpect improvement in this matter on the side of politics. The situation may improve due to biggersupport on the part of the EU political economy, as well as policies created by the governments ofthe member states. This should take into account the fact that the sustainable development is notonly an attractive idea solely for big corporations, but it should be moved to small and mediumenterprises because only this, considering the fact that they account for most enterprises,guarantees success of this idea;
- From analysis of documents concerning the sustainable development follows that this notion iscloser to political scientists, lawyers, economists and people who deal with environmentprotection than to specialists and advisers from the enterprise management. Very interestingresults may bring the conclusions from the report “A New Mindset of Corporate Sustainability,”transfer of research concerning the sustainable development on an enterprise level and undertakingan analysis of this problem from the management perspective;
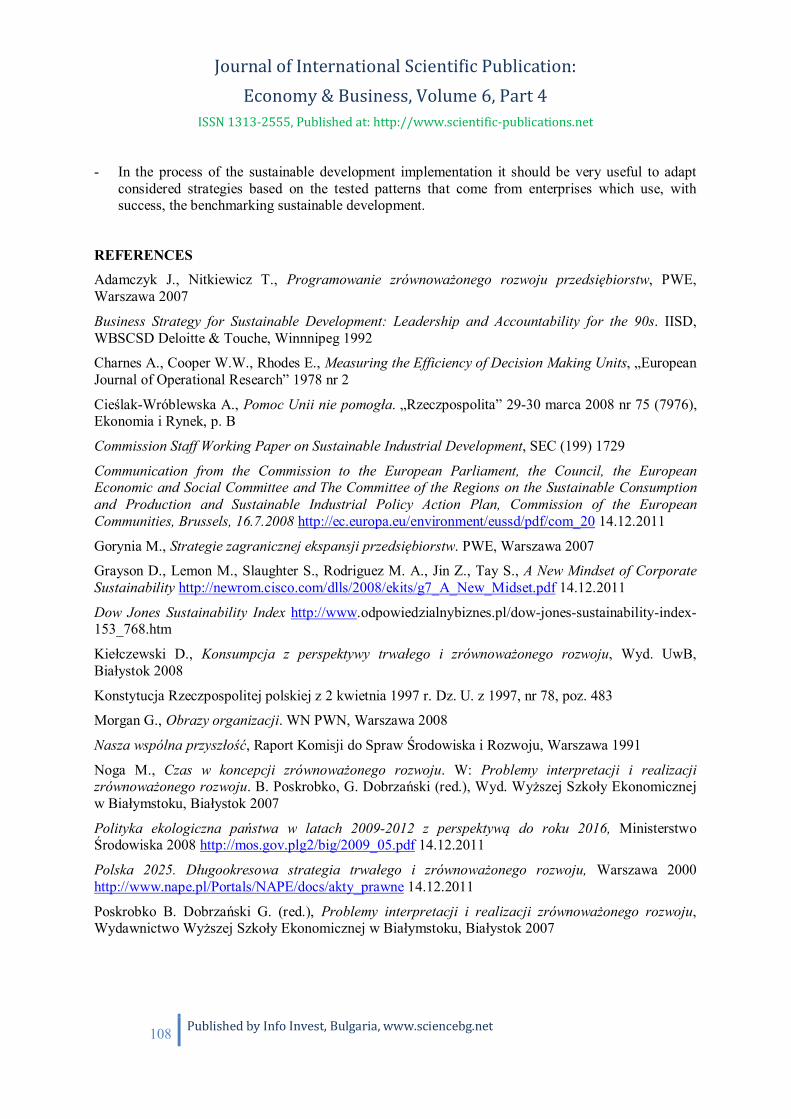
Journal of International Scientific Publication: Economy & Business, Volume 6, Part 4
ISSN 1313-2555, Published at: http://www.scientific-publications.net
108 Published by Info Invest, Bulgaria, www.sciencebg.net
- In the process of the sustainable development implementation it should be very useful to adaptconsidered strategies based on the tested patterns that come from enterprises which use, withsuccess, the benchmarking sustainable development.
REFERENCESAdamczyk J., Nitkiewicz T., Programowanie zrównowa onego rozwoju przedsi biorstw, PWE,Warszawa 2007
Business Strategy for Sustainable Development: Leadership and Accountability for the 90s. IISD,WBSCSD Deloitte & Touche, Winnnipeg 1992
Charnes A., Cooper W.W., Rhodes E., Measuring the Efficiency of Decision Making Units, „EuropeanJournal of Operational Research” 1978 nr 2
Cie lak-Wróblewska A., Pomoc Unii nie pomog a. „Rzeczpospolita” 29-30 marca 2008 nr 75 (7976),Ekonomia i Rynek, p. B
Commission Staff Working Paper on Sustainable Industrial Development, SEC (199) 1729
Communication from the Commission to the European Parliament, the Council, the EuropeanEconomic and Social Committee and The Committee of the Regions on the Sustainable Consumptionand Production and Sustainable Industrial Policy Action Plan, Commission of the EuropeanCommunities, Brussels, 16.7.2008 http://ec.europa.eu/environment/eussd/pdf/com_20 14.12.2011
Gorynia M., Strategie zagranicznej ekspansji przedsi biorstw. PWE, Warszawa 2007
Grayson D., Lemon M., Slaughter S., Rodriguez M. A., Jin Z., Tay S., A New Mindset of CorporateSustainability http://newrom.cisco.com/dlls/2008/ekits/g7_A_New_Midset.pdf 14.12.2011
Dow Jones Sustainability Index http://www.odpowiedzialnybiznes.pl/dow-jones-sustainability-index-153_768.htm
Kie czewski D., Konsumpcja z perspektywy trwa ego i zrównowa onego rozwoju, Wyd. UwB,Bia ystok 2008
Konstytucja Rzeczpospolitej polskiej z 2 kwietnia 1997 r. Dz. U. z 1997, nr 78, poz. 483
Morgan G., Obrazy organizacji. WN PWN, Warszawa 2008
Nasza wspólna przysz o , Raport Komisji do Spraw rodowiska i Rozwoju, Warszawa 1991
Noga M., Czas w koncepcji zrównowa onego rozwoju. W: Problemy interpretacji i realizacjizrównowa onego rozwoju. B. Poskrobko, G. Dobrza ski (red.), Wyd. Wy szej Szko y Ekonomicznejw Bia ymstoku, Bia ystok 2007
Polityka ekologiczna pa stwa w latach 2009-2012 z perspektyw do roku 2016, Ministerstworodowiska 2008 http://mos.gov.plg2/big/2009_05.pdf 14.12.2011
Polska 2025. D ugookresowa strategia trwa ego i zrównowa onego rozwoju, Warszawa 2000http://www.nape.pl/Portals/NAPE/docs/akty_prawne 14.12.2011
Poskrobko B. Dobrza ski G. (red.), Problemy interpretacji i realizacji zrównowa onego rozwoju,Wydawnictwo Wy szej Szko y Ekonomicznej w Bia ymstoku, Bia ystok 2007

Journal of International Scientific Publication: Economy & Business, Volume 6, Part 4
ISSN 1313-2555, Published at: http://www.scientific-publications.net
109 Published by Info Invest, Bulgaria, www.sciencebg.net
Rok B., Odpowiedzialny biznes w nieodpowiedzialnym wiecie. Akademia Rozwoju Filantropii wPolsce, Forum Odpowiedzialnego Biznesu, Warszawa 2004
Strategia zrównowa onego rozwoju Unii Europejskiej. Komisja Europejska 2001. COM (2001) 264final
Ustawa z dnia 27 kwietnia 2001 r., prawo ochrony rodowiska (Dz.U. 2001, nr 62, poz. 627, tekstjednolity Dz.U 2006, nr 129, poz. 902)
Wizja 2050, http://www.mg.gov.pl14.12.2011
Zacher L.W., Wdra anie koncepcji zrównowa onego i trwa ego rozwoju, Master of BusinessAdministration, 2005 no 5
Zalewski J., Unijne rozdro e, Puls Biznesu, 17.03.2008 nr 54 (2561), p. 2
Zrównowa ona produkcja i konsumpcja, http://www.mg.gov.pl14.12.2011
II polityka ekologiczna pa stwa, dokument przyj ty przez Rad Ministrów w czerwcu 2000 r. i SejmRP w sierpniu 2001 r. http://www.mmr.gov.pl/rozwój_regionalny/poziom_krajowy/polska_politykaprzestrzenna/zespó redakcyjny 14.12.2011
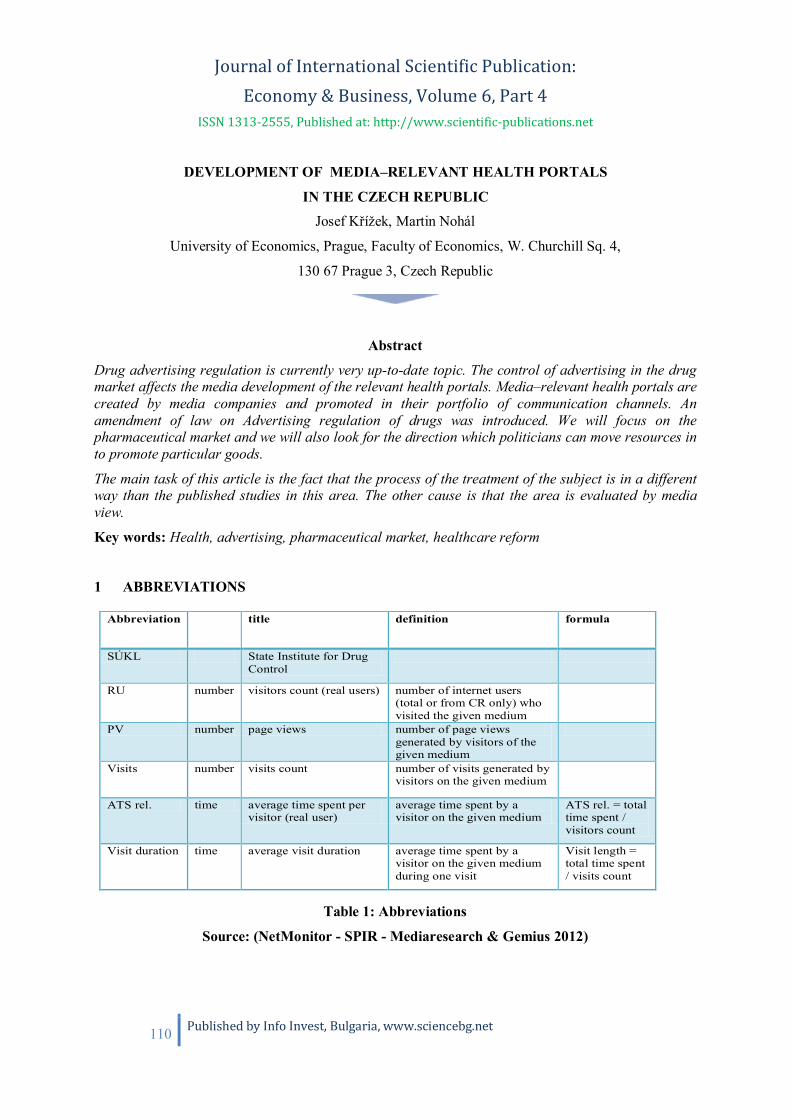
Journal of International Scientific Publication: Economy & Business, Volume 6, Part 4
ISSN 1313-2555, Published at: http://www.scientific-publications.net
110 Published by Info Invest, Bulgaria, www.sciencebg.net
DEVELOPMENT OF MEDIA–RELEVANT HEALTH PORTALS
IN THE CZECH REPUBLICJosef K ížek, Martin Nohál
University of Economics, Prague, Faculty of Economics, W. Churchill Sq. 4,
130 67 Prague 3, Czech Republic
Abstract
Drug advertising regulation is currently very up-to-date topic. The control of advertising in the drugmarket affects the media development of the relevant health portals. Media–relevant health portals arecreated by media companies and promoted in their portfolio of communication channels. Anamendment of law on Advertising regulation of drugs was introduced. We will focus on thepharmaceutical market and we will also look for the direction which politicians can move resources into promote particular goods.
The main task of this article is the fact that the process of the treatment of the subject is in a differentway than the published studies in this area. The other cause is that the area is evaluated by mediaview.
Key words: Health, advertising, pharmaceutical market, healthcare reform
1 ABBREVIATIONS
Table 1: Abbreviations
Source: (NetMonitor - SPIR - Mediaresearch & Gemius 2012)
Abbreviation title definition formula
SÚKL State Institute for DrugControl
RU number visitors count (real users) number of internet users(total or from CR only) whovisited the given medium
PV number page views number of page viewsgenerated by visitors of thegiven medium
Visits number visits count number of visits generated byvisitors on the given medium
ATS rel. time average time spent pervisitor (real user)
average time spent by avisitor on the given medium
ATS rel. = totaltime spent /visitors count
Visit duration time average visit duration average time spent by avisitor on the given mediumduring one visit
Visit length =total time spent/ visits count

Journal of International Scientific Publication: Economy & Business, Volume 6, Part 4
ISSN 1313-2555, Published at: http://www.scientific-publications.net
111 Published by Info Invest, Bulgaria, www.sciencebg.net
2 INTRODUCTION
One of the most important assumption of the society is the monitoring of the the development of theadvertising market and then predicts the situtation on the market in the future. Nowadays it is notenough to have the best product, but it is necessary to expand it to the target group. There is noexception on the Czech Republic pharmaceutical market.
Online advertising investment is affected by the drug advertising regulation. The government approvesthe next phase of healthcare reform, which should modify the current advertising drug market. Theproposed measures should lead to a new division of expenditure on communication activities realizedby pharmaceutical companies.
The control of advertising on the drug market affects the development of media–relevant healthportals, which are created by media companies and promoted in their portfolio of communicationchannels. We will focus on the pharmaceutical market and we will also try to look for the direction,where the politicians can move the resources on advertising, thanks to the novel of the Avertisingregulation Act. Nowadays, the PR activities are more preffered.
Theoretical rationales are focused on the media–relevant health portal in the part of segmentation andcommunication channels.
The analytical part is based on the pharmaceutical market in the Czech Republic. Segmentationdetermines 4 basic areas of the research. Media indicators are used for this analysis.
3 THEORETICAL RATIONALES
3.1 Media–relevant health portal
Media–relevant health portal is considered as a portal, which is included in the online environmentaudit of the project Netmonitor. The main task is to monitor attendance in the Czech Republic and isessential to evaluate online advertising market. Advertisers use it for making investment decisions.The portal, which is a part of the research, has more opportunity to be chosen by advertisers. Mediacorporations try to create these portals. They usually have a large number of portals in their portfolioand also other communication channels. They have occasions to promote particular portals for freeacross the portfolio and communication channels.
3.2 The target audience determining and positioning
The main task for the communication policy of the pharmaceutical companies is to define the targetaudience. We are in the field of international marketing, due to the structure of pharmaceuticalcompanies and markets. If we translate the practical application into the theoretical background, wewill have to primarily deal with the international segmentation of markets and identify groups ofconsumers, which will be targeted. As we can see later, the segmentation can be primarily defined by alegal environment.
Each company or more precisely the brand should be incorporated into the consumer memory with thebenefits of the products. Consumers have to know exactly, why to buy each brand.
Especially Kotler and Keller (2007), the American authors, and Machkova (2006), the Czech author ofthe international marketing, have enriched the theoretical background.

Journal of International Scientific Publication: Economy & Business, Volume 6, Part 4
ISSN 1313-2555, Published at: http://www.scientific-publications.net
112 Published by Info Invest, Bulgaria, www.sciencebg.net
3.3 Communication policy of pharmaceutical companies
The main area, we will focus on, is communication policy of pharmaceutical companies.
Primarily, it is important to look at the theoretical background of the communication channels a littlebit closer. We will take into the account the section advertising for our purpose. The name of thesubsection is called online advertising. The second category, which is crucial for this article, is markedas Public Relations.
Table 2: Communication channels
Source: (Machkova 2006)
4 THE PHARMACEUTICAL MARKET WORLDWIDE AND IN THE CZECH REPUBLIC
The analysis is situated to the Czech Republic. Metys and Balog (2006) performed the practicalresearch of pharmaceutical market and described the marketing in the pharmacy in the CzechRepublic. Kadlecová (2011) have presented the result of the communication policy in thepharmaceutical area focusing on one company. The research showed for example that the selectedpharmaceutical company has invested in congresses 38% of the communication budget.
First of all, we need to look at the context of the situation in the market in the Czech Republic. Thetable below contains the basic information relating to the Czech Republic and the pharmaceuticalmarket.
Advertising Sales promotion Public Relations Direct marketingtelevision point of sale press , tv, and radio
releasespersonal selling
print gifts and prizes internal communication Counter sales
radio trade fairs andexhibitions
publicity Door-to-door
outdoor samples, coupons andvouchers
press conference trade fairs andexhibitions
indoor Competition information services mail ordercinema Points sponsorships telemarketingdirect mail financial incentives public events teleshoppingonline advertising Tasting training direct mail
exhibition stand participation atconferences
online marketing
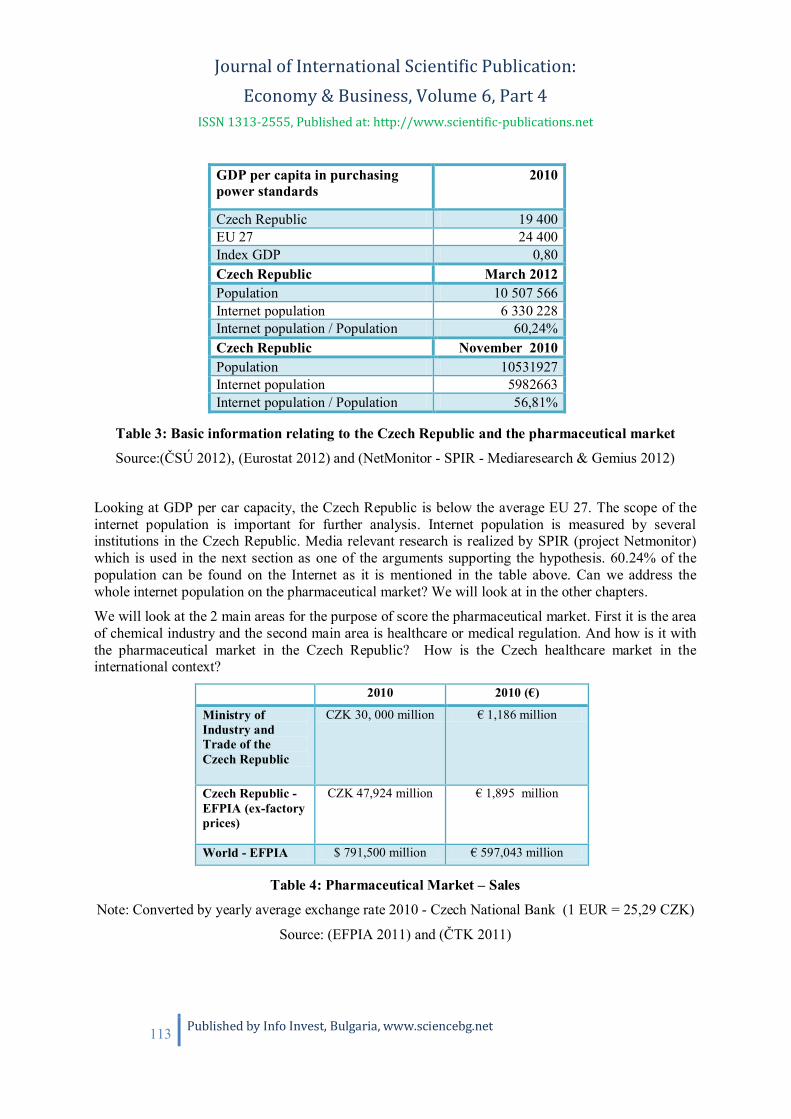
Journal of International Scientific Publication: Economy & Business, Volume 6, Part 4
ISSN 1313-2555, Published at: http://www.scientific-publications.net
113 Published by Info Invest, Bulgaria, www.sciencebg.net
Table 3: Basic information relating to the Czech Republic and the pharmaceutical market
Source:( SÚ 2012), (Eurostat 2012) and (NetMonitor - SPIR - Mediaresearch & Gemius 2012)
Looking at GDP per car capacity, the Czech Republic is below the average EU 27. The scope of theinternet population is important for further analysis. Internet population is measured by severalinstitutions in the Czech Republic. Media relevant research is realized by SPIR (project Netmonitor)which is used in the next section as one of the arguments supporting the hypothesis. 60.24% of thepopulation can be found on the Internet as it is mentioned in the table above. Can we address thewhole internet population on the pharmaceutical market? We will look at in the other chapters.
We will look at the 2 main areas for the purpose of score the pharmaceutical market. First it is the areaof chemical industry and the second main area is healthcare or medical regulation. And how is it withthe pharmaceutical market in the Czech Republic? How is the Czech healthcare market in theinternational context?
Table 4: Pharmaceutical Market – Sales
Note: Converted by yearly average exchange rate 2010 - Czech National Bank (1 EUR = 25,29 CZK)
Source: (EFPIA 2011) and ( TK 2011)
GDP per capita in purchasingpower standards
2010
Czech Republic 19 400EU 27 24 400Index GDP 0,80Czech Republic March 2012Population 10 507 566Internet population 6 330 228Internet population / Population 60,24%Czech Republic November 2010Population 10531927Internet population 5982663Internet population / Population 56,81%
2010 2010 (€)
Ministry ofIndustry andTrade of theCzech Republic
CZK 30, 000 million € 1,186 million
Czech Republic -EFPIA (ex-factoryprices)
CZK 47,924 million € 1,895 million
World - EFPIA $ 791,500 million € 597,043 million

Journal of International Scientific Publication: Economy & Business, Volume 6, Part 4
ISSN 1313-2555, Published at: http://www.scientific-publications.net
114 Published by Info Invest, Bulgaria, www.sciencebg.net
The Previous table shows us that the income in the pharmaceutical industry worldwide reached almost600 billion euros in 2010. According to the Ministry of Industry and Trade of the Czech Republicrecorded the income in the Czech Republic in the range of over 1.1 billion euros.
Pharmaceutical companies, who operates in the Czech Republic, are mostly international companiestherefore it is necessary to emphasize the international context and global distribution of incomediffers by region. It is an international marketing from the marketing perspective.
Figure 1: The income by the areas
Source: (EFPIA 2011)
This graph shows us that the largest share of the income on the pharmaceutical market was in NorthAmerica. This market reached to 42.3% of global income. Europe market with 29.2% share of incomewas on the second place in the ranking.
5 SEGMENTATION AND TARGET GROUP OF THE PHARMACEUTICAL MARKET INTHE CZECH REPUBLIC
Segmentation is the first step, which determines the subsequent advertising campaigns. Segmentationis performed in several ways, but we will focus on multi-dimensional segmentation in this case. Thepharmaceutical market is highly regulated in the Czech Republic, so it means that the regulation isvery important parameter in the segmentation. We will not concern on a specific company, but on alarger segment in this article. It means that we will consider the regulation as the main parameter forsegmentation of first Instance. Moreover, the drug advertising has to be complied with the sameadvertising legislation as other markets. We can find a different kind of limitations. A detailedoverview could be found in the instruction SÚKL (2011a), which prefers the legislation of advertisingin the Czech Republic.
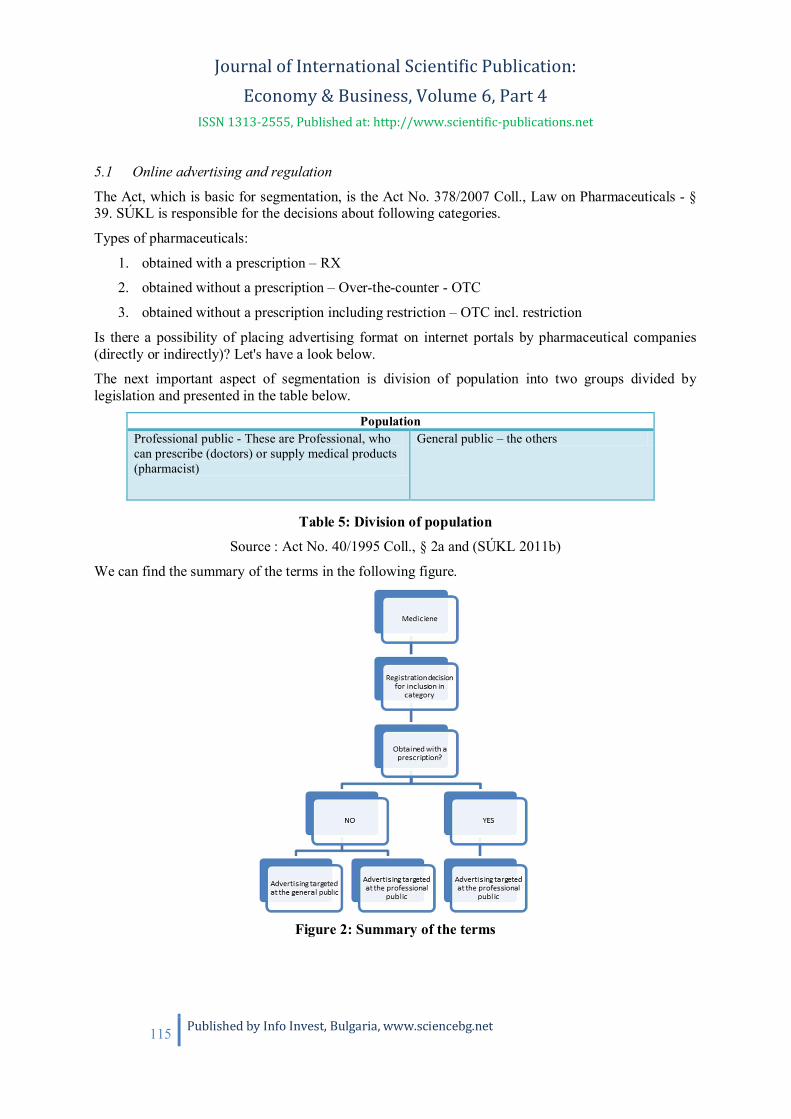
Journal of International Scientific Publication: Economy & Business, Volume 6, Part 4
ISSN 1313-2555, Published at: http://www.scientific-publications.net
115 Published by Info Invest, Bulgaria, www.sciencebg.net
5.1 Online advertising and regulation
The Act, which is basic for segmentation, is the Act No. 378/2007 Coll., Law on Pharmaceuticals - §39. SÚKL is responsible for the decisions about following categories.
Types of pharmaceuticals:
1. obtained with a prescription – RX
2. obtained without a prescription – Over-the-counter - OTC
3. obtained without a prescription including restriction – OTC incl. restriction
Is there a possibility of placing advertising format on internet portals by pharmaceutical companies(directly or indirectly)? Let's have a look below.
The next important aspect of segmentation is division of population into two groups divided bylegislation and presented in the table below.
Table 5: Division of population
Source : Act No. 40/1995 Coll., § 2a and (SÚKL 2011b)
We can find the summary of the terms in the following figure.
Figure 2: Summary of the terms
PopulationProfessional public - These are Professional, whocan prescribe (doctors) or supply medical products(pharmacist)
General public – the others
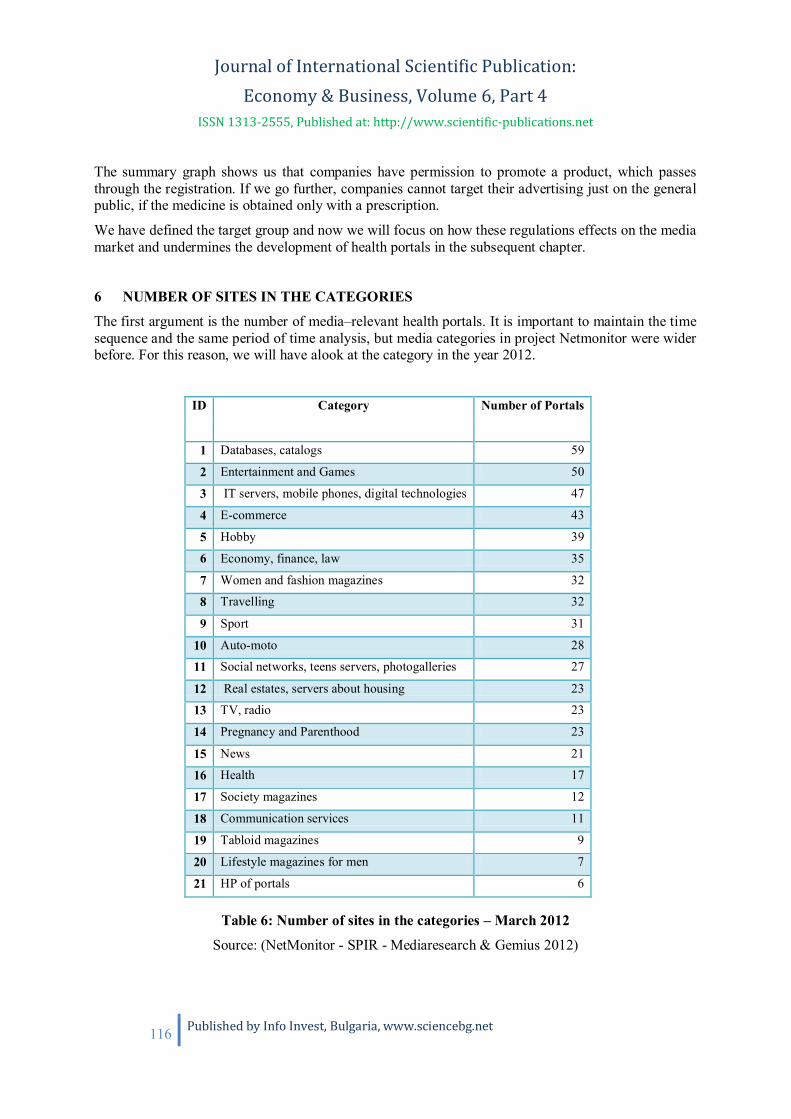
Journal of International Scientific Publication: Economy & Business, Volume 6, Part 4
ISSN 1313-2555, Published at: http://www.scientific-publications.net
116 Published by Info Invest, Bulgaria, www.sciencebg.net
The summary graph shows us that companies have permission to promote a product, which passesthrough the registration. If we go further, companies cannot target their advertising just on the generalpublic, if the medicine is obtained only with a prescription.
We have defined the target group and now we will focus on how these regulations effects on the mediamarket and undermines the development of health portals in the subsequent chapter.
6 NUMBER OF SITES IN THE CATEGORIES
The first argument is the number of media–relevant health portals. It is important to maintain the timesequence and the same period of time analysis, but media categories in project Netmonitor were widerbefore. For this reason, we will have alook at the category in the year 2012.
Table 6: Number of sites in the categories – March 2012
Source: (NetMonitor - SPIR - Mediaresearch & Gemius 2012)
ID Category Number of Portals
1 Databases, catalogs 59
2 Entertainment and Games 50
3 IT servers, mobile phones, digital technologies 47
4 E-commerce 43
5 Hobby 39
6 Economy, finance, law 35
7 Women and fashion magazines 32
8 Travelling 32
9 Sport 31
10 Auto-moto 28
11 Social networks, teens servers, photogalleries 27
12 Real estates, servers about housing 23
13 TV, radio 23
14 Pregnancy and Parenthood 23
15 News 21
16 Health 17
17 Society magazines 12
18 Communication services 11
19 Tabloid magazines 9
20 Lifestyle magazines for men 7
21 HP of portals 6
Journal of International Scientific Publication: Economy & Business, Volume 6, Part 4
ISSN 1313-2555, Published at: http://www.scientific-publications.net
117 Published by Info Invest, Bulgaria, www.sciencebg.net
According to the table above, we have 17 Media–relevant health portals. This category Health was16th in the ranking. We can not say that there are not any other portals, but we're talking about portals,which are audited and rellevant for us from media perspective.
6.1 Portals for the professionals
Advertising aimed for the professionals on the Internet need to contain, before a professional enter apage, a minimum of (SÚKL 2011a):
Declaration of professionalism
Confirmation that he / she is familiar with who is considered an expert
Confirmation that he / she is familiar with the risks
6.2 Portals for General public
The effort of the society is to provide educational information, but the authors must be careful herethat such activity should not fulfill the section § 1 § 2 and § 5, paragraph 1 of Law No. 40/195 Coll.Regulation of advertising and amending and supplementing Act No. 468/1991 Coll. If this sectionwould be fulfilled, the information could be the advertising. The using of indirect links is alsoprohibited. An indirect link such as ingredient, color, shape can identify the product and it is alsoprohibited.
The different and more detailed look at each category can be though the traffic. Health portals (theHealth category) had the third lowest attendance (number of real users) in the relevant portals. Thenumber of page views is the lowest at all categories. ATS was in the category also the lowest. Visitduration was the second lowest.
7 THE SPENDING ON THE ADVERTISINGThanks to the regulation and the previous paragraphs, it is clear, that investments to the onlineadvertising are lower than than the investments to the other categories. This happens despite the factthat it is considered as a very lucrative market.
In concrete terms, the pharmaceutical spend at the online advertising market got the 11th place of 15places in this research.
The portals and health information are regulated, but the medicines are prescribed by the doctors and itis possible to target themby the portals, which are focused on the professionals. What could happen, ifthe politicians would regulate more activities of the companies in the PR and the Internet conditionsremain the same?
8 WHAT WILL BRING THE NEW AMENDMENT TO THE SEGMENT?
There are sponsoring regulations and compensation of the experts as it is prescribed by SÚKL UST-16(SÚKL 2007). The Congress tourism is common these days. We could expect changes in theadvertising regulation since 2013 on the basis of currnet developments in the government. Thegovernment approved an amendment to the drug advertising in recent days. The amendment should beapproved in the next stage. For example Marketing & Media Server ( TK 2012) informed about theamendment. The main task is clearer definition of the relationship between doctors, pharmacists and
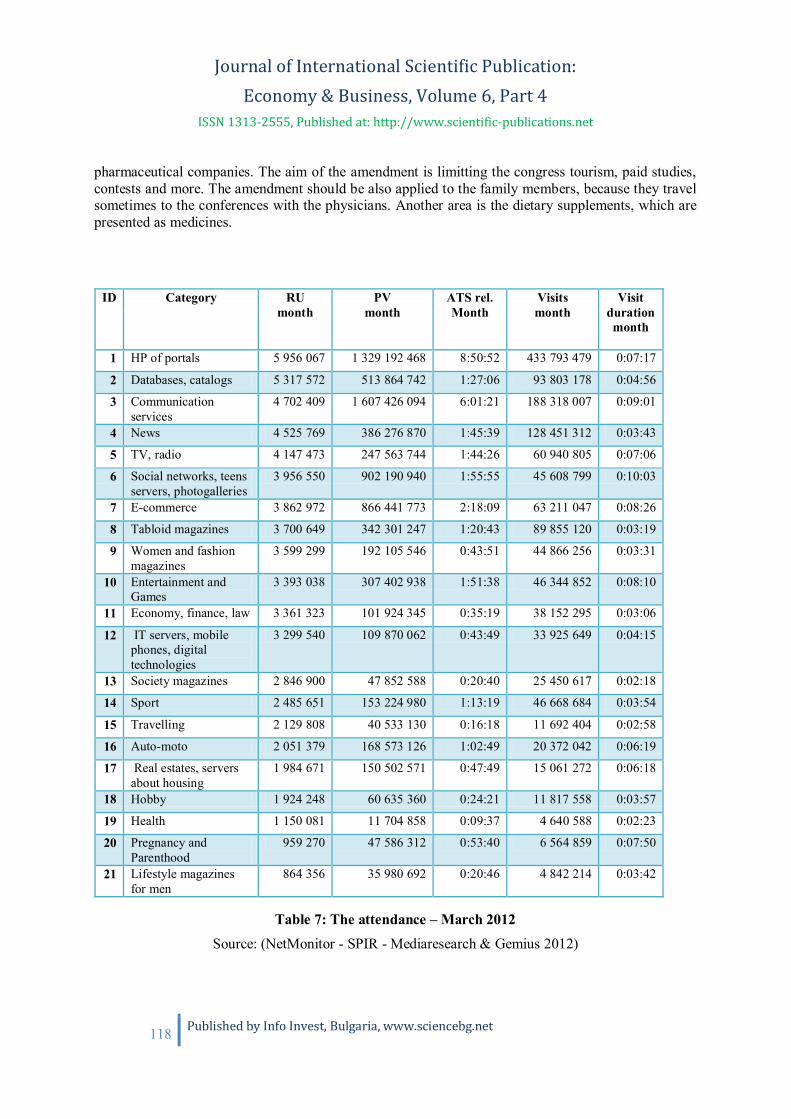
Journal of International Scientific Publication: Economy & Business, Volume 6, Part 4
ISSN 1313-2555, Published at: http://www.scientific-publications.net
118 Published by Info Invest, Bulgaria, www.sciencebg.net
pharmaceutical companies. The aim of the amendment is limitting the congress tourism, paid studies,contests and more. The amendment should be also applied to the family members, because they travelsometimes to the conferences with the physicians. Another area is the dietary supplements, which arepresented as medicines.
Table 7: The attendance – March 2012Source: (NetMonitor - SPIR - Mediaresearch & Gemius 2012)
ID Category RUmonth
PVmonth
ATS rel.Month
Visitsmonth
Visitdurationmonth
1 HP of portals 5 956 067 1 329 192 468 8:50:52 433 793 479 0:07:17
2 Databases, catalogs 5 317 572 513 864 742 1:27:06 93 803 178 0:04:56
3 Communicationservices
4 702 409 1 607 426 094 6:01:21 188 318 007 0:09:01
4 News 4 525 769 386 276 870 1:45:39 128 451 312 0:03:43
5 TV, radio 4 147 473 247 563 744 1:44:26 60 940 805 0:07:06
6 Social networks, teensservers, photogalleries
3 956 550 902 190 940 1:55:55 45 608 799 0:10:03
7 E-commerce 3 862 972 866 441 773 2:18:09 63 211 047 0:08:26
8 Tabloid magazines 3 700 649 342 301 247 1:20:43 89 855 120 0:03:19
9 Women and fashionmagazines
3 599 299 192 105 546 0:43:51 44 866 256 0:03:31
10 Entertainment andGames
3 393 038 307 402 938 1:51:38 46 344 852 0:08:10
11 Economy, finance, law 3 361 323 101 924 345 0:35:19 38 152 295 0:03:06
12 IT servers, mobilephones, digitaltechnologies
3 299 540 109 870 062 0:43:49 33 925 649 0:04:15
13 Society magazines 2 846 900 47 852 588 0:20:40 25 450 617 0:02:18
14 Sport 2 485 651 153 224 980 1:13:19 46 668 684 0:03:54
15 Travelling 2 129 808 40 533 130 0:16:18 11 692 404 0:02:58
16 Auto-moto 2 051 379 168 573 126 1:02:49 20 372 042 0:06:19
17 Real estates, serversabout housing
1 984 671 150 502 571 0:47:49 15 061 272 0:06:18
18 Hobby 1 924 248 60 635 360 0:24:21 11 817 558 0:03:57
19 Health 1 150 081 11 704 858 0:09:37 4 640 588 0:02:23
20 Pregnancy andParenthood
959 270 47 586 312 0:53:40 6 564 859 0:07:50
21 Lifestyle magazinesfor men
864 356 35 980 692 0:20:46 4 842 214 0:03:42
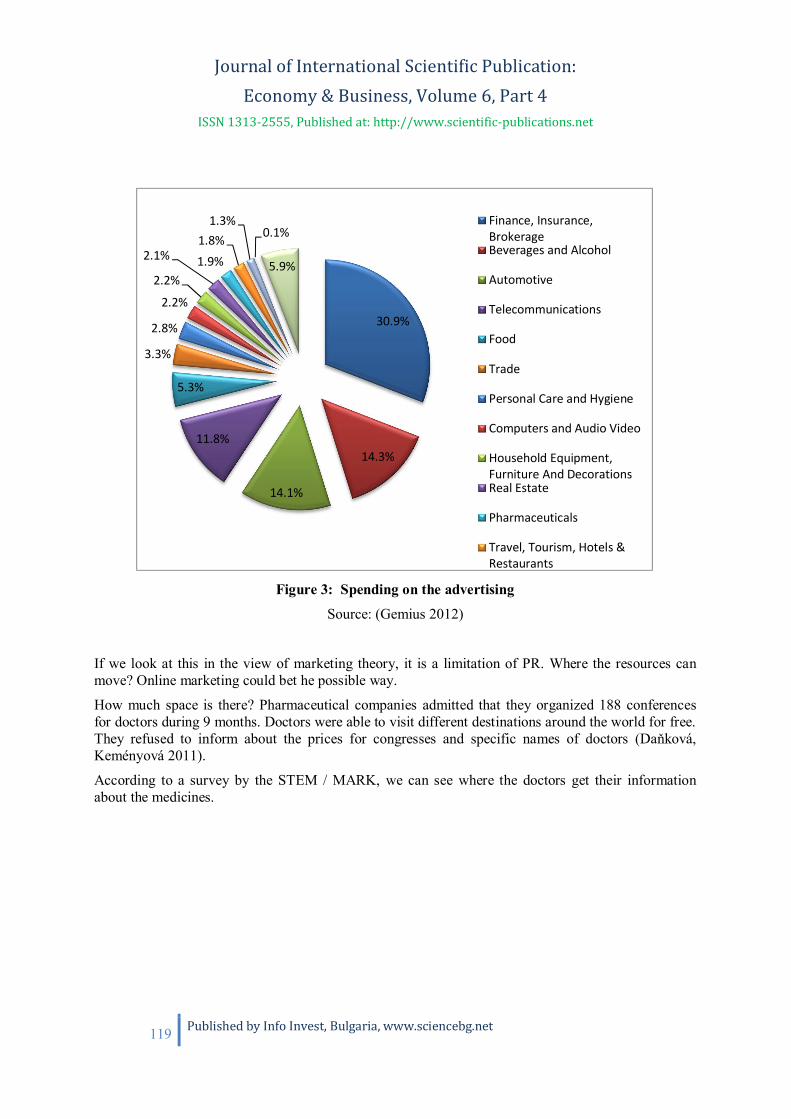
Journal of International Scientific Publication: Economy & Business, Volume 6, Part 4
ISSN 1313-2555, Published at: http://www.scientific-publications.net
119 Published by Info Invest, Bulgaria, www.sciencebg.net
Figure 3: Spending on the advertising
Source: (Gemius 2012)
If we look at this in the view of marketing theory, it is a limitation of PR. Where the resources canmove? Online marketing could bet he possible way.
How much space is there? Pharmaceutical companies admitted that they organized 188 conferencesfor doctors during 9 months. Doctors were able to visit different destinations around the world for free.They refused to inform about the prices for congresses and specific names of doctors (Da ková,Keményová 2011).
According to a survey by the STEM / MARK, we can see where the doctors get their informationabout the medicines.
30.9%
14.3%
14.1%
11.8%
5.3%
3.3%
2.8%
2.2%
2.2%
2.1% 1.9%1.8%
1.3%0.1%
5.9%
Finance, Insurance,BrokerageBeverages and Alcohol
Automotive
Telecommunications
Food
Trade
Personal Care and Hygiene
Computers and Audio Video
Household Equipment,Furniture And DecorationsReal Estate
Pharmaceuticals
Travel, Tourism, Hotels &Restaurants

Journal of International Scientific Publication: Economy & Business, Volume 6, Part 4
ISSN 1313-2555, Published at: http://www.scientific-publications.net
120 Published by Info Invest, Bulgaria, www.sciencebg.net
Figure 4: where the doctors get their information about the medicines.
Zdroj: (STEM/MARK 2011)
The survey showed us that the doctors use as the most frequent journals (73%), advices from the salesrepresentatives (43%), conferences (33%) and the Internet is dividend here in two parts (28% and15%). In conclusion, we could say that the PR and the Internet are the major categories based onresearch, as it was expected. It is good to mention that the professional journals tend to have a cloneon the Internet on the first place.
9 CONCLUSION
The article was built on the thesis that the advertising regulation on the pharmaceutical market affectsthe development of the media–relevant health portals.
Media–relevant health portals are created by media companies and are promoted in the portfolio ofcommunication channels.
73%
43%
33%
28%
16%
15%
14%
11%7%
5%
5%3%
2%7%
Professional journals,literature, publicationsSales representatives,producersSymposia, congresses,seminarsInternet -in general,Search enginesAISLP
Internet - companywebsites, productsLeaflets, Bulletins
Breviary
Consultation withanother expertSÚKL (State Institute forDrug Control)Software with Databases
Compedium
Farmindex
Other

Journal of International Scientific Publication: Economy & Business, Volume 6, Part 4
ISSN 1313-2555, Published at: http://www.scientific-publications.net
121 Published by Info Invest, Bulgaria, www.sciencebg.net
An amendment of Act on Advertising regulation of drugs was introduced. We have focused on thepharmaceutical market and we also look for the direction, where the politicians can move theresources in for promoting particular goods.
We divided the communication channels in the theoretical section, where we choose two basicchannels: online advertising and PR.
We introduced the pharmaceutical market, which had sales in the amount over EUR 1.1 billion in theCzech Republic in 2010. We set the possibilities of advertising, because it is important to separate thetypes of medical products and population. Regulation divides the population into the professionalpublic and general public. Advertising, which can be target on the professional public, is prohibitedunder the certain conditions for the general public. On this basis, we set out 4 main parts of theanalysis.
As the first area, we considered the number of media–relevant health portals. There were 17 healthportals which were included in particular category. This Health category was 16th in the ranking from21.
The second area was the number of real users of the portals of relevant health. The graph showed usthe third lowest value of all 21 categories. 1,150,081 of real users attended the relevant health portals.The lowest values were also achieved in the ATS and PV indicators. The Internet population was6,330,228 in the Czech Republic in March.
The third important area of the evaluation was the costs in each segment in the online area. The Studyof Gemius showed us that the pharmaceutical segment in the Czech Republic is at the 11th place outof the 15 places between other categories such as Food, Trade, Computers and Audio Video. Lowercost was on the markets with Travel, restaurants and Clothing and Accessories.
The last area of the interest was the analysis of the possible future of the development. Thegovernment has approved an amendment of the drug advertising regulation, which could come into theforce since 2013. The result should be higher regulation of the congress tourism. On the basis of theresearch by STEM / MARK, the doctors access the information about the medicines from 33% oncongresses. Internet reached the value of 28% (the general part) and 15% of websites of companiesand the products.
It will be interesting to wait the outcome of negotiations of the mentioned Act. We can say, that theregulation has contributed to the lower development of media–relevant health portals, but there is apossibility of the development in the future, thanks to the new regulation.
REFERENCES
1 SÚ. Obyvatelstvo. 2012. [citován 10 ervenec 2012]. Available from world wide web:<http://www.czso.cz/csu/redakce.nsf/i/obyvatelstvo_lide>.
2 TK. MaM.iHNed.cz : Média, marketingová komunikace a kreativita v reklam . erven 2012.[citován 1 ervenec 2012]. Available from world wide web: <http://mam.ihned.cz/c1-56318570-vlada-souhlasi-s-regulaci-reklamy-na-leky>.
3 TK. Tržby chemického pr myslu loni vzrostly o 18 procent - Finance.cz. kv ten 2011. [citován22 erven 2012]. Available from world wide web:

Journal of International Scientific Publication: Economy & Business, Volume 6, Part 4
ISSN 1313-2555, Published at: http://www.scientific-publications.net
122 Published by Info Invest, Bulgaria, www.sciencebg.net
<http://www.finance.cz/zpravy/finance/310848-trzby-chemickeho-prumyslu-loni-vzrostly-o-18-procent/>.
4 EFPIA. The Pharmaceutical Industry in figures - Edition 2011. 2011. Available from world wideweb: <http://www.efpia.eu/content/default.asp?PageID=559&DocID=11586>.
5 Eurostat. Makroekonomika. leden 2012. Available from world wide web:<http://www.google.cz/url?sa=t&rct=j&q=&esrc=s&source=web&cd=1&ved=0CE8QFjAA&url=http%3A%2F%2Fwww.olomouc.czso.cz%2Fcsu%2F2011edicniplan.nsf%2Fengt%2FA50020B4B6%2F%24File%2F1607110801.pdf&ei=SZX8T5i6BsjR4QSUmLly&usg=AFQjCNHQYJJRct7JahNnw9zVUIrali7T3Q&sig2=OGRAmOOKkICjG7m4AyNjBQ>.
6 Gemius. Bulgaria, Czech Republic, Hungary, Poland, Romania, Slovakia: the most popular andeffecGve display ads. kv ten 2012. Available from world wide web:<http://www.slideshare.net/Gemius_com/gemiusadmonitor-report-h2-2011>.
7 Julie Da ková, Zuzana Keményová. Farmaceutické firmy odtajnily, kam vzaly léka e nakongresy. Ceny a jména ne eknou | zpravy.ihned.cz - esko. íjen 2011. [citován 1 ervenec2012]. Available from world wide web: <http://zpravy.ihned.cz/c1-53162910-farmaceuticke-firmy-odtajnily-kam-vzaly-lekare-na-kongresy-ceny-a-jmena-nereknou>.
8 Kadlecová. Komer ní komunikace v eském farmaceutickém pr myslu. [Praha]: VSE, 2011.
9 Kotler, Philip, a Kevin Lane Keller. Marketing management. [Praha]: Grada, 2007.
10 Machková, Hana. Mezinárodní marketing. [Praha]: Grada, 2006.
11 Metys, Karel, a Peter Balog. Marketing ve farmacii. [Praha]: Grada, 2006.
12 NetMonitor - SPIR - Mediaresearch & Gemius. Výzkum návšt vnosti v eské republice. b ezen2012. Available from world wide web:<http://www.netmonitor.cz/sites/default/files/vvnetmon/2012_03_netmonitor_offline_report.xls>.
13 STEM/MARK. Lekari_2011 - Otázky lékové politiky, soubor typu pdf, (608,66 kB). b ezen2011. Available from world wide web: <http://www.sukl.cz/file/65348_1_1>.
14 SÚKL. Regulace reklamy na humánní lé ivé p ípravky a lidské tkán a bu ky. zá í 2011a.Available from world wide web: <http://www.sukl.cz/sukl/ust-27-verze-3>.
15 SÚKL. UST-16 verze 1. ervenec 2007.
16 SÚKL. UST-27 verze 3. zá í 2011b. Available from world wide web:<http://www.sukl.cz/file/69904_1_1>.
17 Act No. 378/2007 Coll., Law on Pharmaceuticals.
18 Act No. 40/1995 Coll., on Advertising Regulation

Journal of International Scientific Publication: Economy & Business, Volume 6, Part 4
ISSN 1313-2555, Published at: http://www.scientific-publications.net
123 Published by Info Invest, Bulgaria, www.sciencebg.net
POTENTIAL THREATS OF THE CZECH PENSION REFORM
Josef K ížek, Martin Nohál
University of Economics, Prague, Faculty of Economics, W. Churchill Sq. 4,
130 67 Prague 3, Czech Republic
Abstract
The annual regular deficit on the pension account of the Czech Republic has forced the Government toreform pension system and reduce the valorization of pensions. It is quite obvious that the main pillarpay-as-you-go financing is untenable with regards to demographic evolution. Therefore, thegovernment comes with successive parametric modifications and also possible opt-out to the fundedfinancing system which could seem to be suitable alternative because of its independency on the agingof the population and elongating lifespan. The proposed reform does not solve the problem ofmotivating middle-and high-income people in the first pillar. Moreover expenditure cuts will havedrastic impact on the generation of retirees. The paper analyzes the reform actions and seeks theinspiration for optimal reform outside the Czech Republic.
Key words: pension reform, retirement, pay-as-you-go, social security
1. INTRODUCTIONThe unfavorable demographic situation: the increase in the life expectancy and increasing proportionof elderly in total population, thus increase in the total number of pensioners and decrease ofeconomically active people adversely affect the balance on the pension account. In the current PAYGsystem number of contributors is dwindling whereas the number of recipients is growing. Theproposed pension reform moves the part of the social insurance to the second pillar - private fundedsavings for retirement.
Pension System of the Czech Republic should therefore newly consist of three pillars.
The first pillar is the basic pension insurance, defined benefit pay-as-you-go system guaranteed by thestate and mandatory for all economically active persons. In the current PAYG system workinggeneration pays social insurance contributions, which are immediately redistributed to currentpensioners. Contributions should be properly set up in order to avoid the deficiency of this system, butif this happens then must be cover from state budget, because the pensions are guaranteed by the state.
The highest possible social solidarity is applied in this method, because the tax burden rises with risingincomes and pension level in comparison with growing earnings declines. A worker with the above-average income pays more into the system, but receives relatively less than workers with lowerincomes.
The big advantage of this method is the immediate distribution of benefits, when it prevents the losscoming from the inflation and of course a certain security of each individual in the retirement age.Problems may occur due to the demographic and political development, when government can amendthe benefit calculation so that people have to rely on the current government promises that they doreceive at least any pension benefits.
Journal of International Scientific Publication: Economy & Business, Volume 6, Part 4
ISSN 1313-2555, Published at: http://www.scientific-publications.net
124 Published by Info Invest, Bulgaria, www.sciencebg.net
The second pillar, which is common in some EU Member States, is represented by private (employee)pension systems and its essence is in funding. Based on the voluntary decision between employer andemployees employer establishes employee´s pension fund. Both employee as well as employer thencontribute to the fund, creating financial resources that will then serve as employee pension benefitand the additional income supplement when reaches the retirement age. The transfer of funds from thestate pillar into the commercial sphere is called opt-out.
This pillar is characterized as voluntary, however, voluntary in terms of whether the additional systemwill be enabled or not. In some cases the emergence of the supplementary second pillar can bemandatory by the law. These are mainly countries with lower levels of basic pension insurance whereprivate sector is highly developed. On the contrary voluntary participation in the second pillar isusually allowed in countries where the satisfactory level of basic pension system is secured.
The main purpose of this pillar is to increase the income of individuals so that they closer to theincome level achieved during their working life. Another advantage, compared to the first pillar is theresistance against demographic influences, the independence on the state, each individualresponsibility and intergenerational justice as it does not burden next generations with additional costs.On the other hand side deposits can be depreciated by inflation, reduced by financial crisis, uninsuredfunds are being siphoned off etc. Last but not least there is a problem of low-income groups who areunable to save themselves up for retirement.
Because the first pillar is based primarily on the principle of social solidarity and guarantees only aminimal pension, private third pillar has been established in many countries in order to save up ownsavings and secure the living standard in the retirement age. It is a voluntary supplementary, definedcontribution and capital-funded pension pillar. Economically active citizens are creating personalaccounts of their own reserves to finance their future pensions by relatively small portion of theirearnings. Third pillar is characterized as a supplementary voluntary pension insurance with high statecontribution.
In addition this system can be supported by the state e.g. through the tax concessions. Voluntarypension savings is from the state point of view a suitable tool for the financial market because thefinancial capital from the deposits can be used for other investments. Therefore properly designedpension savings system may be substantially beneficial to the development of a country's economy.The disadvantage of this system is like the second pillar, the risk of negative effects of inflation onsavings. In addition, individual pension savings relationships are typically private relationships, so thestate can intervene while creating an appropriate legal framework only but cannot affect the actualbusiness policy of pension savings banks. This means that the system can negatively affected byfinancial market situation when the insurance providers can get into a difficult economic situationwhen will not be able to meet their obligations. In almost all the countries of Western Europe pensionreforms are now taking place some way. These are changes with varying intensity, depth and focus,differing from state to state. Often it is a long-term process, where radical changes may occur orsomewhere rather a political-smooth corrections of the current situation. The pension system may bechanged as a whole system by the amendment of pillars or only some of parameters are being beadjusted.
Czech pension reform moves a portion of the funds from first PAYG pillar and intends to set-up aplace them in the second pillar of private funded savings. Unfortunately this intention does not solvethe deficit of the current pension account, so the government comes also with other measuresparametric changes: retirement age shift, increase in the working period of required insurance, etc.

Journal of International Scientific Publication: Economy & Business, Volume 6, Part 4
ISSN 1313-2555, Published at: http://www.scientific-publications.net
125 Published by Info Invest, Bulgaria, www.sciencebg.net
In order to stabilize the current (deficient) account balance the government also imposed limitation onthe annual adjustment/increase of pensions in next three years. Thus decrease the current income ofpensioners. The paper analyzes the impact of reform and setup of its steps. It also searches for reforminspiration outside the Czech Republic. The paper evaluates the proposed system and parametricreform steps and their impact on seniors.
Decline in real pensions
By the approval of amendment to the Pension Insurance Act, affecting the annual increase of pensionsfrom 11 April 2012, Czech government decided to start saving more funds on the old generation -pensioners. Thus, the government is planning to save 9.5 billion CZK on pension denefits in 2013,approximately 16.1 billion CZK in 2014 and 22.1 billion CZK in 2015. In following three years, thisact should save a total of 47.7 billion. Whereas annual pension increase rate was setup on 100% CPIplus one third real wages growth in the past, from 2013 this should be about a third of real wagesgrowth and also one-third CPI only. The average state pension will be therefore increased only byCZK 156 CZK instead of 428 CZK in January 2013, by 90 CZK instead of 278 CZK in 2014 andfinally by 137 CZK instead of 303 CZK in 2015.
The message is straight forward the government is trying to save wherever they can. Nevertheless formost of the retirees this information can be formulated that it will be necessary to secure financiallythemselves and not rely on state pension only. Besides this the current main pillar pension system inthe Czech Republic, mandatory continuous financing, is regularly attacked by right-wing economistsfor its long-term financial unsustainability with regards to adverse demographic trends, which isexpected in the Czech Republic as well as in other European countries. The annual pension accountdeficit exceeding 30 billion CZK and according to the demographic prediction we can expect that theproportion of pensioners on the total population gets doubled by 2040 in comparison. The compulsoryretirement levy to the first pillar takes 28% of monthly gross salary of an employee, despite the highamount employee should not be relying on the state pension only.
The reform of motivation
E.g.Sweden encourages its citizens to save money for pension by hypothetical accounts where peoplecan track how much money is already in there, though hypothetical2. Once the pensioner reaches theretirement age the full balance is divided to the monthly benefit according to the life expectancy.Germany motivates people to save money for retirement by pension points, setting the pension benefitlevel on the merit basis or Slovakia by the possibility of radical opt-out from the mandatory PAYGpillar.
How should the successful pension system work?
The best functional pension systems rely on three basic pillars but there must be also expansion of thisthree pillars view. Since the meeting of statutory requirements for entitlement to the state pension isgetting harder, states provide also the social safety net to those who did not fully meet the statutoryrequirements. State should also stimulate people to retire without debts, house property and otherassets can also play an important role in financial security and stability in retirement. The very crucialpoint is that pension schemes must be flexible to change over the time in order to maintain theirsustainability.
2 PALMER E.: The Swedish Pension Reform Model: Framework and Issues, 2011, p.5

Journal of International Scientific Publication: Economy & Business, Volume 6, Part 4
ISSN 1313-2555, Published at: http://www.scientific-publications.net
126 Published by Info Invest, Bulgaria, www.sciencebg.net
Comparison of the world´s pension systems has been provided by Mercer´s study3. The result is in theindex evaluating the adequacy, sustainability and integrity of the pension system
The Dutch system has reached the highest value closely followed by Australia, Sweden and Canada.These four systems are based on a comparison much better than the pension systems in the UK, USA,Chile and Singapore. Australia has a well-functioning three-pillar system. Similarly, Canada has awell-integrated pension system, which is involved in both the public and private sector. Sweden is ontrack to transition from pay-as-you-go system to a fully defined-contribution system.
Table 1: The Melbourne Mercer Global Pension Index
Source: (Mercer4 2012)
The only real motivational factor of the Czech pension system is the third pillar where the number ofcontracts attacks the border of 5 million, half population of the Czech Republic. The reason can befound in the high state subsidy when participant receives CZK 50 state contribution from CZK 100monthly savings contribution, deposits over CZK 500 then the maximum contribution of CZK 150,which is relatively high motivation for people to save money and increase their savings. Neverthelessthis part of the system is set to a low amount and cannot substitute the first pillar.
3 Melbourne Mercer Global Pension Index4 The Melbourne Mercer Global Pension Index compares retirement income systems around the world and ratesthem based on their adequacy, sustainability and integrity, table p.6, 2011
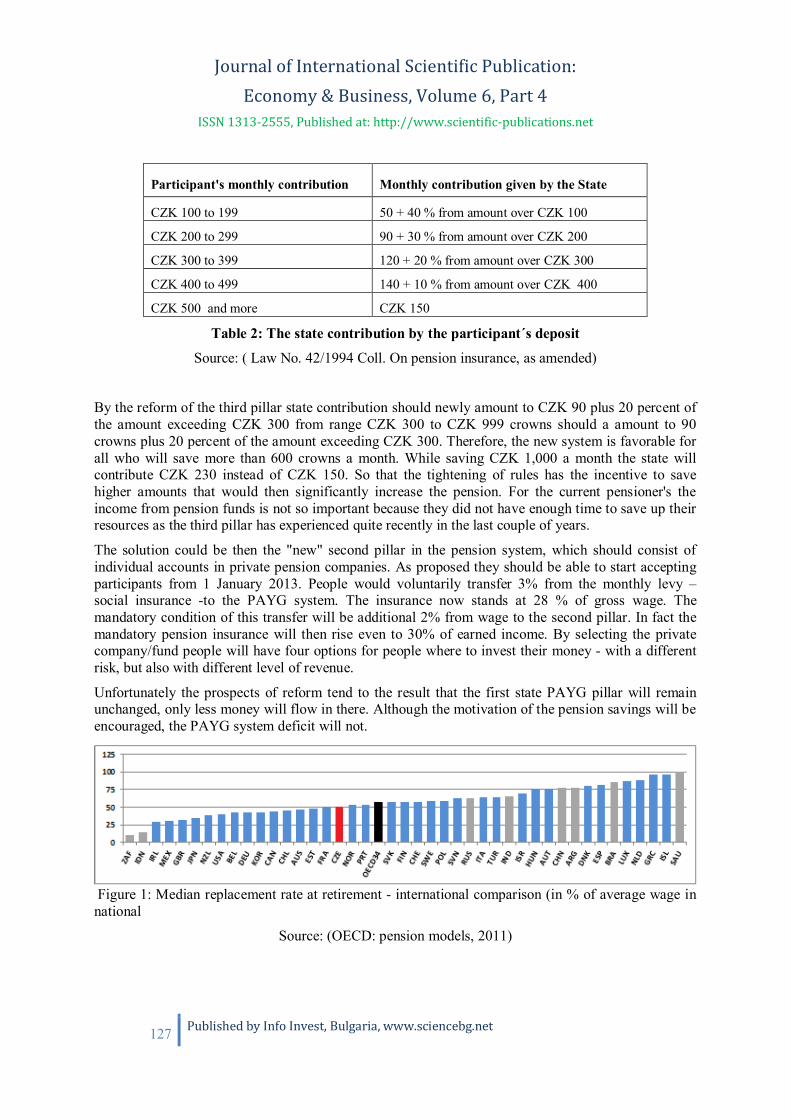
Journal of International Scientific Publication: Economy & Business, Volume 6, Part 4
ISSN 1313-2555, Published at: http://www.scientific-publications.net
127 Published by Info Invest, Bulgaria, www.sciencebg.net
Participant's monthly contribution Monthly contribution given by the State
CZK 100 to 199 50 + 40 % from amount over CZK 100
CZK 200 to 299 90 + 30 % from amount over CZK 200
CZK 300 to 399 120 + 20 % from amount over CZK 300
CZK 400 to 499 140 + 10 % from amount over CZK 400
CZK 500 and more CZK 150
Table 2: The state contribution by the participant´s deposit
Source: ( Law No. 42/1994 Coll. On pension insurance, as amended)
By the reform of the third pillar state contribution should newly amount to CZK 90 plus 20 percent ofthe amount exceeding CZK 300 from range CZK 300 to CZK 999 crowns should a amount to 90crowns plus 20 percent of the amount exceeding CZK 300. Therefore, the new system is favorable forall who will save more than 600 crowns a month. While saving CZK 1,000 a month the state willcontribute CZK 230 instead of CZK 150. So that the tightening of rules has the incentive to savehigher amounts that would then significantly increase the pension. For the current pensioner's theincome from pension funds is not so important because they did not have enough time to save up theirresources as the third pillar has experienced quite recently in the last couple of years.
The solution could be then the "new" second pillar in the pension system, which should consist ofindividual accounts in private pension companies. As proposed they should be able to start acceptingparticipants from 1 January 2013. People would voluntarily transfer 3% from the monthly levy –social insurance -to the PAYG system. The insurance now stands at 28 % of gross wage. Themandatory condition of this transfer will be additional 2% from wage to the second pillar. In fact themandatory pension insurance will then rise even to 30% of earned income. By selecting the privatecompany/fund people will have four options for people where to invest their money - with a differentrisk, but also with different level of revenue.
Unfortunately the prospects of reform tend to the result that the first state PAYG pillar will remainunchanged, only less money will flow in there. Although the motivation of the pension savings will beencouraged, the PAYG system deficit will not.
Figure 1: Median replacement rate at retirement - international comparison (in % of average wage innational
Source: (OECD: pension models, 2011)

Journal of International Scientific Publication: Economy & Business, Volume 6, Part 4
ISSN 1313-2555, Published at: http://www.scientific-publications.net
128 Published by Info Invest, Bulgaria, www.sciencebg.net
The average replacement rate at retirement (the ratio between pension and previous worker´s salary) ofthe Czech Republic is slightly below the OECD average, pension benefit is constructed from fixedbasic amount and variable percentage amount, based on the calculation:
Where SP = state pension
BA = basic amount (2270 CZK per month from 1.1.2012)
TIP = total insurance period from leaving school to the entitlement to a pension, in full calendar years
SAP = sum of additional periods of insurance (90 calendar days) - employment held after theentitlement to retirement pension
CB = calculation base, where the computational basis is taken into the consideration.
* Computional basis is sum of monthly earnings reduced by reducing borders.
Reduction Monthly Earnings 2011 2012 2013 2014
1. Reduction Bracket 0-44% AW5 100% 100% 100% 100%
2. Reduction Bracket 44-116% AW 29% 28% 27% 26%
3. Reduction Bracket 116-400% AW 13% 16% 19% 22%
4. Reduction Bracket more than 400% AW 10% 8% 6% 4%
Table 3: Reduction brackets for pension calcutationSource: ( Public Notice of Law 286/2011, Coll.)
However when we look at the replacement rate at retirement of middle and higher income classes, westart to realize the problem of motivation. Czech Republic is now situated on the bottom of thescoreboard (due to the excessive reduction - see Table 2). Unlike the aforementioned Sweden,Germany and Slovakia, the mandatory first pillar in the Czech Republic is very demotivating for itsresidents and does not fully reflect the principle of merit. Although this problem has already beenaddressed to the Constitutional Court and there is a gradual adjustment of reduction limits, now themerit principle should be driven again by 3 + 2% opt-out along the second pillar. This should bring agreater incentive to save higher amounts of money, increase pensions and replacement rate.
5 AW = Average wage in Economy
SP + +
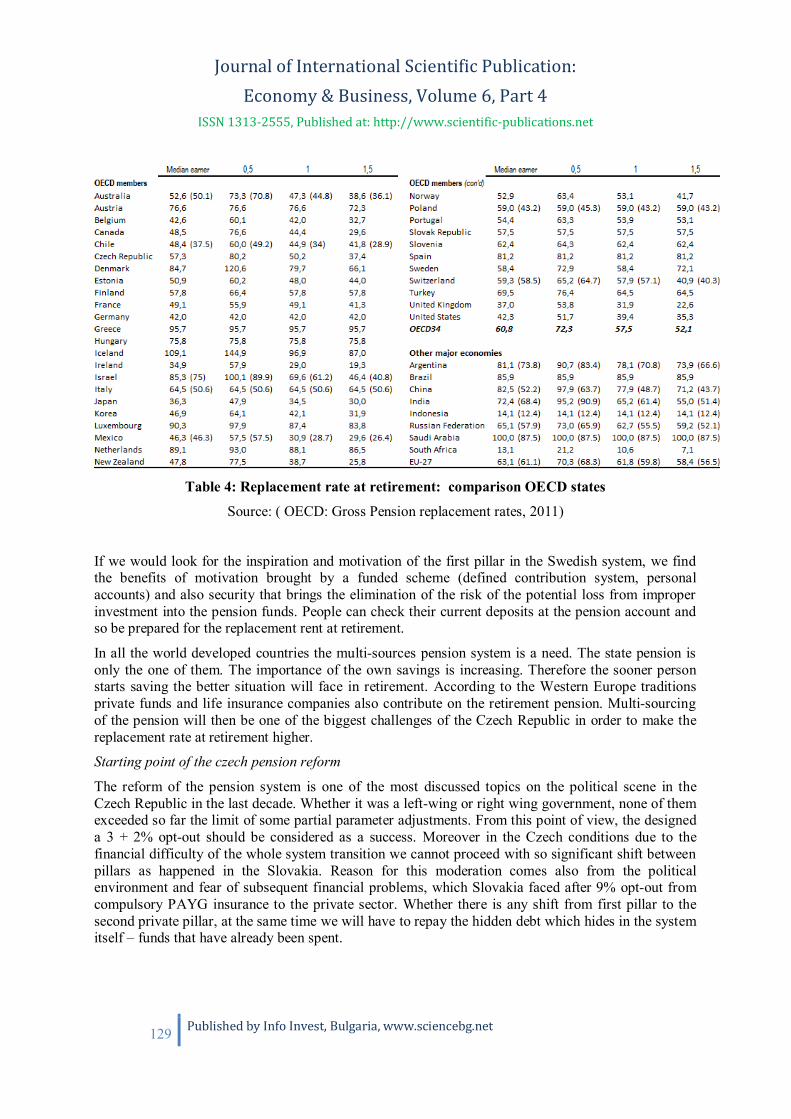
Journal of International Scientific Publication: Economy & Business, Volume 6, Part 4
ISSN 1313-2555, Published at: http://www.scientific-publications.net
129 Published by Info Invest, Bulgaria, www.sciencebg.net
Table 4: Replacement rate at retirement: comparison OECD states
Source: ( OECD: Gross Pension replacement rates, 2011)
If we would look for the inspiration and motivation of the first pillar in the Swedish system, we findthe benefits of motivation brought by a funded scheme (defined contribution system, personalaccounts) and also security that brings the elimination of the risk of the potential loss from improperinvestment into the pension funds. People can check their current deposits at the pension account andso be prepared for the replacement rent at retirement.
In all the world developed countries the multi-sources pension system is a need. The state pension isonly the one of them. The importance of the own savings is increasing. Therefore the sooner personstarts saving the better situation will face in retirement. According to the Western Europe traditionsprivate funds and life insurance companies also contribute on the retirement pension. Multi-sourcingof the pension will then be one of the biggest challenges of the Czech Republic in order to make thereplacement rate at retirement higher.
Starting point of the czech pension reform
The reform of the pension system is one of the most discussed topics on the political scene in theCzech Republic in the last decade. Whether it was a left-wing or right wing government, none of themexceeded so far the limit of some partial parameter adjustments. From this point of view, the designeda 3 + 2% opt-out should be considered as a success. Moreover in the Czech conditions due to thefinancial difficulty of the whole system transition we cannot proceed with so significant shift betweenpillars as happened in the Slovakia. Reason for this moderation comes also from the politicalenvironment and fear of subsequent financial problems, which Slovakia faced after 9% opt-out fromcompulsory PAYG insurance to the private sector. Whether there is any shift from first pillar to thesecond private pillar, at the same time we will have to repay the hidden debt which hides in the systemitself – funds that have already been spent.
Journal of International Scientific Publication: Economy & Business, Volume 6, Part 4
ISSN 1313-2555, Published at: http://www.scientific-publications.net
130 Published by Info Invest, Bulgaria, www.sciencebg.net
From 3% respectively 5% opt-out we would not have exaggerated expectations, as the most of theincome will still be drained ¼ to state pay-as-you-go pillar. Besides that opting-out will also bevoluntary, so we can only expect a transition of people with higher incomes, what could burden thefirst pillar even more. The levy of person who decides to join the second pillar of pension system willincrease from 28% to 30%where we also assume that such a person will be voluntarily paying anyadditional percentage to the third pillar.
If we analyze the situation of the current active generation, we can always mention the merit principle,who saves more will have more in the retirement. Although this principle is not linear, the one whopays higher pension insurance then gets higher benefit. The same however does not apply to thecurrent generation of retirees. Their pension calculations are fully dependent on the annual adjustmentdecided by the Government. Thus increase or decrease in their real income depends only on thegovernment. Unfortunately, the Government of the Czech Republic in the amendment from April2012 decided that the Czech retirees will get lower pension in the next three years. In our opinion thefull price valorization of pensions should take place every year in order to secure the living standard ofpensioners, while the possibility of the Government to change pensions by any other way should berestricted6.
2. CONCLUSION
Unfavorable demographic trends, decrease in natality and mortality, causing the aging of population,negatively affects the retirement system in lots of especially European countries as well as in theCzech Republic. This has devastating impact especially on the pension systems consisted mostly ofthe pay-as-you-go pillar where the growth in number of pensioners as well as the decrease in numberof people in working age negatively affect the balance on the pension account.
The proposed reform of pension system in the Czech Republic will bring more responsibility for eachindividual for their financial situation in retirement. The importance of voluntary third pillar is risingso that it becomes an essential part of the system. Awaited key reform step - the introduction of asecond funded pillar, on which citizens will be able to participate voluntarily and thereby agree to payan additional 2% of their income, is scheduled from 2013. 3% respectivelyv5% opt-out is not radicalin comparison with 25% transfer to the first pillar. As mentioned people will also be allowed to chooseto fully stay in 1st pillar which remains unchanged. Therefore unchanged will be also the motivationof people staying fully in first pillar. Based on this is quite unlikely that pension reform will achieve agreat success and even streamline or simplify the pension system. The inspiration for the first pillar ofthe reform can be found in Sweden in hypothetical personal accounts or in Germany in the pensionpoints.
Pension insurance levy for medium and high income people are disproportionately high, absolutely(30% in second pillar + additional percent in the third pillar) and also relatively with comparison howmuch can these people expect from the state in the retirement. Replacement rate at retirement of 1,5median is currently only 37,4%, which places Czech Republic on the bottom of scoreboard of OECDcountries.
The reform also does not deal with the situation of current retirees, people who already receivepensions. Those who are mostly unable to work (extra years) then become victims of the costs saving
6 As stated in recommendations section in The Expert Advisory Forum’s Final Report, 2010, page 12

Journal of International Scientific Publication: Economy & Business, Volume 6, Part 4
ISSN 1313-2555, Published at: http://www.scientific-publications.net
131 Published by Info Invest, Bulgaria, www.sciencebg.net
in the first pillar, as mentioned in the case of valorization in next three years. Therefore replacementrate of current pensioners will get lower. Current retirees who have earned the most in their productiveperiod will now suffer the most. The reform endeavour in the Czech Republic produces considerableconcerns primarily to our pensioners, but not only them. Despite it is very important and beneficialthat after many years of discussions the pension reform will finally happen.
REFERENCES
Act No. 155/1995 Coll. Pension Insurance
Czech Social Security Administration. www.cssz.cz [online]. 2012. [cit. 07.04.2012]. Pensioninsurance. Available from <http://www.cssz.cz/cz/duchodove-pojisteni/>.
Law No. 42/1994 Coll. On pension insurance, as amended
Melbourne Mercer Pension Global Index, www.mercer.com. 2011. [online]. [cit. 07.04.2012]. 60 pp.Available from <http://www.mercer.com/articles/global-pension-index/>
Ministry of Labour and Social Affairs. www.mpsv.cz [online]. 2010. [cit. 2012-06-19].The Expert Advisory Forum’s Final Report / Záv re ná zpráva Poradního expertního sboru 2010. 23pp. Available from <http://www.mpsv.cz/cs/8895/>
Ministry of Labour and Social Affairs. www.mpsv.cz [online]. 2012. [cit. 2012-06-23]. Prognosis ofpopulation development in the Czech Republic, 2008 – 2070 / Prognóza popula ního vývoje eskérepubliky, 2008 – 2070. 30 pp. Available from <http://www.mpsv.cz/cs/8838/>
OECD [online] 2011. [cit. 2012-04-19]. Pensions at a Glance 2011: Retirement-Income Systems inOECD and G20 Countries. Available from < http://www.oecd-ilibrary.org/docserver/download/fulltext/8111011ec015.pdf?expires=1341669648&id=id&accname=guest&checksum=7B03091AE9BA0BDEFB4E99C33B04F6EA>
PALMER E.: The Swedish Pension Reform Model: Framework and Issues, p.5
Public Notice of Law 286/2011 Coll., Available from<http://www.mpsv.cz/ppropo.php?ID=v286_2011/>

Journal of International Scientific Publication: Economy & Business, Volume 6, Part 4
ISSN 1313-2555, Published at: http://www.scientific-publications.net
132 Published by Info Invest, Bulgaria, www.sciencebg.net
STUDENT EMPLOYABILITY AND BRAIN DRAIN IN THE REPUBLIC OF MACEDONIA
Ljupco Eftimov
Faculty of Economics-Skopje, University “Ss. Cyril and Methodius”-Skopje,
Blvd. Krste Misirkov, nn., 1000 Skopje, Republic of Macedonia
web: www.eccf.ukim.edu.mk; e-mail: [email protected]
Abstract
Undoubted in its aspirations and future within the European Union, the Republic of Macedonia in2003 has signed Bologna Declaration and clearly and without hesitation has undertaken a largenumber of higher education reforms in order to provide compatibility with other European educationsystems and to satisfy newly created demands on the labor market as well.
This year, Republic of Macedonia celebrates a decade since the Bologna Declaration. A decade ofcontinuous reforms is a particularly long period, after which a review and detailed analysis ofexpectations and accomplishments is an anticipated step. In order to provide empirical data on resultsachieved after such complex and long-term reforms a comprehensive study of Macedonian highereducation system was executed with the special focus on student employability as one of the mostimportant Bologna goal. The study used official data from state institutions and included a separateresearch conducted on 981 students from public and private universities in the country.
The survey despite the relatively large number of positive results, unfortunately, revealed also someunfavorable trends such as rising percentage of unemployed people with higher education within thetotal number of unemployed and brain drain. In addition of this article are presented some potentialbrain drain-brain gain solutions for Macedonian universities.
Key words: Macedonian higher education institutions, Bologna Declaration, reforms, studentemployability, brain drain, practical experience, virtual enterprise.
1. INTRODUCTION
In the last two decades, in Republic of Macedonia and in the world in general, great changes tookplace which undoubtedly entailed major challenges. After it gained independence in 1991, theRepublic of Macedonia started a process of profound changes in the social order, which instigated acomplete transformation of the entire manner matters functioned in so far. Borders got opened, tradeliberalization took place, privatization of social capital began as well and market economy gotintroduced.
Along with the changes caused by political and economic transformation of the country after itsindependence, the great influence of world globalization processes induced border opening, greaterpeople mobility, dynamics of changes, rapid development of technique and technology with specialemphasis on IT technology. All these changes imposed the need for a complete structure redesign ofMacedonian society.
Higher education was not immune to these occurrences. Social changes undoubtedly raised the needfor its adjustment in order to secure a faster and more appropriate response to newly created

Journal of International Scientific Publication: Economy & Business, Volume 6, Part 4
ISSN 1313-2555, Published at: http://www.scientific-publications.net
133 Published by Info Invest, Bulgaria, www.sciencebg.net
challenges in the environment. Universities faced with new and different demands, and acquired a newand far more emphasized role than ever before. Students were required to acquire new types ofknowledge, think in a critical manner, develop entrepreneurial awareness and culture, and developmodern skills, flexibility, and ability to cope with future changes.
Universities were expected to offer solutions to present problems, anticipate future challenges, developinnovative solutions and behavior models that will secure a continuous social development in theproper direction.
Unfortunately, this was not a simple process. Although the Republic of Macedonia managed to resistthe military conflicts that occurred in the nearby neighborhood and had a relatively peacefulindependence process, it still failed to handle the transition well. As a consequence large number oforganizations got closed, thousands of employees got laid off, and unemployment rate rocketed(record breaking in Europe), which reduced the state budget as the main source of funding for highereducation.
All of this imposed the need for adopting a new mission and vision for the higher education, newstrategic goals, designing a new organizational structure of universities, new curricula, newperformance management methods or their new redesigned social role.
These changes were necessary in order for the higher education system of the Republic of Macedoniato take its role in the process of securing fundamental stability of the national economy, boosteconomic growth, strengthen public and private sector competitiveness, create an efficient legislative,and enforce high standards and values (Ministry of Education and Science, National EducationDevelopment Program, 2006, p. 17).
Internal transformation processes, as well as economic, political, cultural, ecological, and securitychallenges demanded for a closer international cooperation among countries in solving similar or jointproblems, which undoubtedly pointed out the need to bring compatibility to education systems and tostimulate fast education globalization.
Undoubted in its aspirations and future within the European Union, the Republic of Macedonia clearlyand without hesitation has undertaken a large number of higher education reforms which will enablesuch compatibility with other European education systems and satisfy newly created demands on thelabor market as well.
1.1 Bologna Process in the Republic of Macedonia
Several years prior to its official joining in the Bologna Process in 2003, the Republic of Macedoniaundertook certain steps towards a faster adjustment of its education system to European systems, suchas obliging universities to implement the ECTS and design their curricula in accordance to Bolognaprinciples. Private initiative was enabled, thus many national or foreign private faculties anduniversities got established as well.
Respecting the national cultural values and characteristics of the existing higher education system, theimplementation of Bologna goals aimed at increasing study efficiency, greater student and teachingstaff mobility, greater education process quality, a more active student role in providing quality, andperhaps most importantly providing a better educational structure of the population and improvingemployability of graduates on national and European labor markets (Ministry of Education andScience, National Education Development Program, 2006, p. 265).
Journal of International Scientific Publication: Economy & Business, Volume 6, Part 4
ISSN 1313-2555, Published at: http://www.scientific-publications.net
134 Published by Info Invest, Bulgaria, www.sciencebg.net
This year, the Republic of Macedonia celebrates almost a decade since the Bologna Declaration.Despite the fact that a great part of these reforms was complex, unpleasant and long-term, the countrymaintained its reform course, taking into consideration the benefits that are result from all actionsundertaken.
A decade of continuous reforms is a particularly long period, after which a review and detailedanalysis of plans and accomplishments is an anticipated step. Analyses of the Bologna process in theRepublic of Macedonia have so far been made, but most often in the form of studies of precise andspecific reform topics, such as the implementation of European Credit Transfer System (ECTS) (Pop-Ivanov and Velkovski, 2010), effects of dispersed studies (Popovski, 2010), academic and studentmobility (Pop-Ivanov, Bozinovska, and Bozovik, 2010); or in the form of more complex analyses,which have been carried out long time ago, such as the analysis of good educational managementcapacity (Popovski et al, 2007) or the process of linking higher education with the labor market(Center for Research and Policy Making, 2009). What was missing was in fact a study of reformeffects on higher education with the special focus on student employability as one of the mostimportant Bologna goal.
2. RESEARCH METHODOLOGY
Motivated by the aforementioned situation, a decision was reached to execute a comprehensive studyof higher education in the Republic of Macedonia, its current situation and results achieved after adecade of reforms. The study used official data from state institutions and included a separate researchconducted on 981 students from public and private universities in the country. The research wasconducted in the period of 26th March 2012 – 21st May 2012, with the help of a structuredquestionnaire. The Kwik Surveys free software was used to create, launch, and technically support thisresearch. The experience of eminent experts relevant to this field of research, as well as several similarresearches made by neighboring and other European countries were taken into consideration whilecreating this questionnaire. The group of 981 subjects (all of which are seniors or recently graduatedstudents) encompasses 2.6% of the entire student population that falls into some of these categories,which is a fact that proves this research was made on a representative statistical sample.7
All criteria for proper and proportional representation of different gender students were met, alongwith the criteria for different educational profiles, private and public university students, students withdifferent ways of financing their studies, and students with various GPA’s, all of which confirms theiractual percentage of these students within the Macedonian educational system.
7 According to data of the State Statistical Office of the Republic of Macedonia, the number of third or higheryear students during the 2010/2011 study year equals 28 123, while the number of student graduates in 2010equaled 9 944. This means that the research was executed successfully on a group of 981 out of 38 067 studentsand university graduates – all qualified for this research, which presents the percentage of 2.6%.
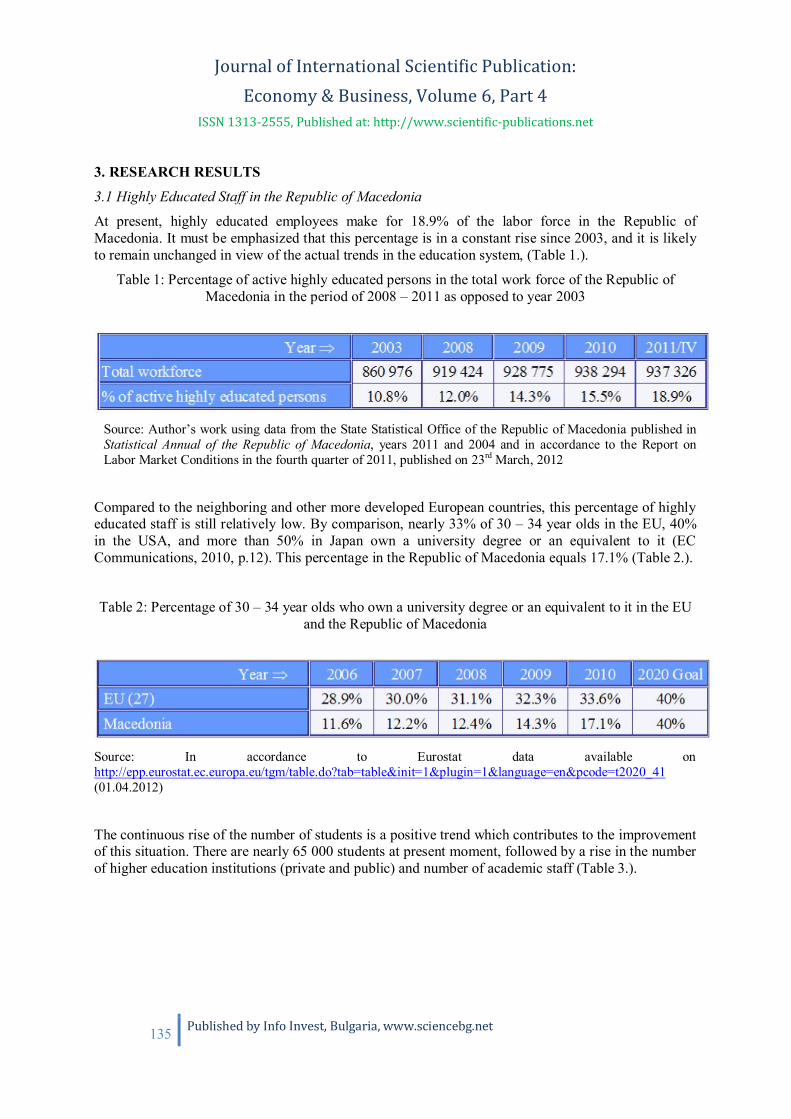
Journal of International Scientific Publication: Economy & Business, Volume 6, Part 4
ISSN 1313-2555, Published at: http://www.scientific-publications.net
135 Published by Info Invest, Bulgaria, www.sciencebg.net
3. RESEARCH RESULTS
3.1 Highly Educated Staff in the Republic of Macedonia
At present, highly educated employees make for 18.9% of the labor force in the Republic ofMacedonia. It must be emphasized that this percentage is in a constant rise since 2003, and it is likelyto remain unchanged in view of the actual trends in the education system, (Table 1.).
Table 1: Percentage of active highly educated persons in the total work force of the Republic ofMacedonia in the period of 2008 – 2011 as opposed to year 2003
Source: Author’s work using data from the State Statistical Office of the Republic of Macedonia published inStatistical Annual of the Republic of Macedonia, years 2011 and 2004 and in accordance to the Report onLabor Market Conditions in the fourth quarter of 2011, published on 23rd March, 2012
Compared to the neighboring and other more developed European countries, this percentage of highlyeducated staff is still relatively low. By comparison, nearly 33% of 30 – 34 year olds in the EU, 40%in the USA, and more than 50% in Japan own a university degree or an equivalent to it (ECCommunications, 2010, p.12). This percentage in the Republic of Macedonia equals 17.1% (Table 2.).
Table 2: Percentage of 30 – 34 year olds who own a university degree or an equivalent to it in the EUand the Republic of Macedonia
Source: In accordance to Eurostat data available onhttp://epp.eurostat.ec.europa.eu/tgm/table.do?tab=table&init=1&plugin=1&language=en&pcode=t2020_41(01.04.2012)
The continuous rise of the number of students is a positive trend which contributes to the improvementof this situation. There are nearly 65 000 students at present moment, followed by a rise in the numberof higher education institutions (private and public) and number of academic staff (Table 3.).
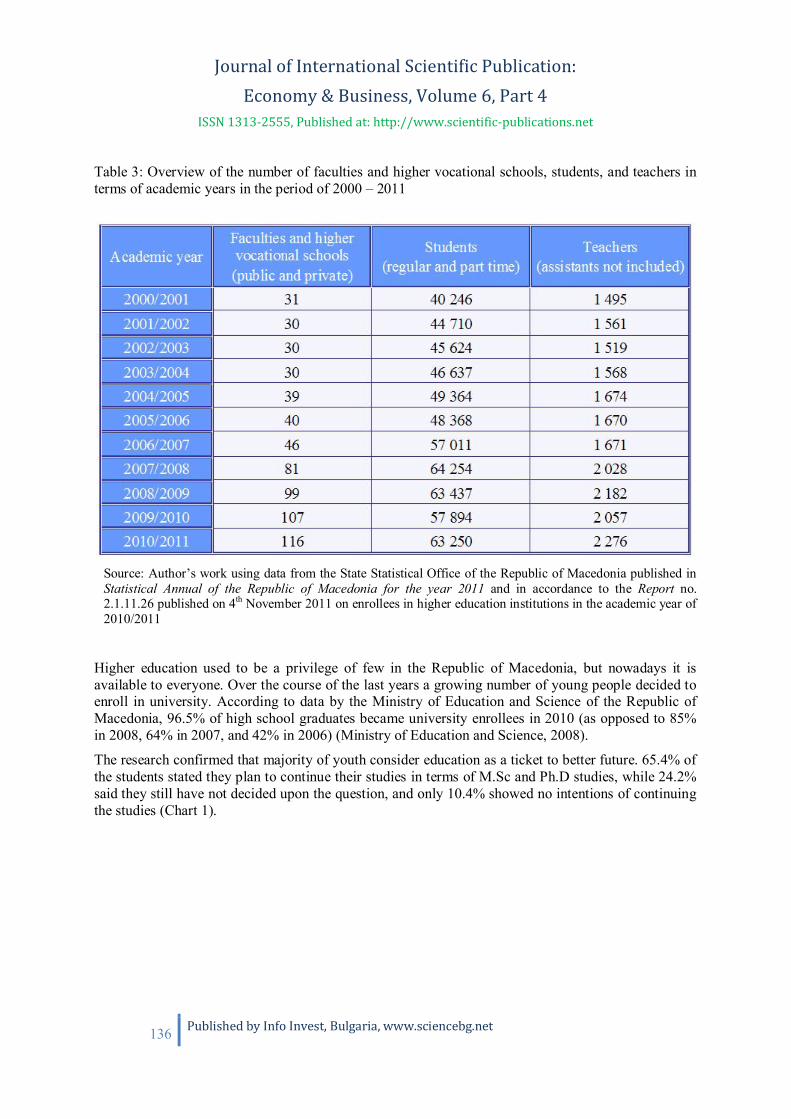
Journal of International Scientific Publication: Economy & Business, Volume 6, Part 4
ISSN 1313-2555, Published at: http://www.scientific-publications.net
136 Published by Info Invest, Bulgaria, www.sciencebg.net
Table 3: Overview of the number of faculties and higher vocational schools, students, and teachers interms of academic years in the period of 2000 – 2011
Source: Author’s work using data from the State Statistical Office of the Republic of Macedonia published inStatistical Annual of the Republic of Macedonia for the year 2011 and in accordance to the Report no.2.1.11.26 published on 4th November 2011 on enrollees in higher education institutions in the academic year of2010/2011
Higher education used to be a privilege of few in the Republic of Macedonia, but nowadays it isavailable to everyone. Over the course of the last years a growing number of young people decided toenroll in university. According to data by the Ministry of Education and Science of the Republic ofMacedonia, 96.5% of high school graduates became university enrollees in 2010 (as opposed to 85%in 2008, 64% in 2007, and 42% in 2006) (Ministry of Education and Science, 2008).
The research confirmed that majority of youth consider education as a ticket to better future. 65.4% ofthe students stated they plan to continue their studies in terms of M.Sc and Ph.D studies, while 24.2%said they still have not decided upon the question, and only 10.4% showed no intentions of continuingthe studies (Chart 1).

Journal of International Scientific Publication: Economy & Business, Volume 6, Part 4
ISSN 1313-2555, Published at: http://www.scientific-publications.net
137 Published by Info Invest, Bulgaria, www.sciencebg.net
Chart 1: Macedonian students who plan to continue their studies after graduation (in terms of M.Sc orPh.D studies)
It would be too naïve to finish the analysis at this point and conclude that matters are moving in theright direction. Thus effort was made to identify the key reasons for this trend. Results pointed out thatmost probably the majority of young people enroll in the university to upgrade their education level,but a large number of them also use higher education studies as temporary refuge from the chronicunemployment problem. Thus, young people postpone employment and try to improve theiremployment chances in the future. One should not of course neglect the influence of the aggressivecampaigning of the Macedonian Government for the benefits of higher education8, as well as theestablishment of new public and private universities and faculties and a large number of dispersedstudies in places which have so far not been university centers, all with the aim to bring educationcloser to young people.
A highly important detail kept occupying the interest of this analysis – the fact that the increasingnumber of university graduates within the total number of active population may result in a rise of thenumber of employed people (which is a welcomed option), but may also result in a rise of unemployedpeople (which is definitely not popular and least wanted trend in every society). This is the reason whya separate detailed analysis was conducted of each of these aspects.
The first step was to analyze the percentage of employed persons with higher education within thetotal number of employed in the Republic of Macedonia for the period of 2008 – 2011, compared tothe situation in 2003, which is the year that the Republic of Macedonia joined Bologna process (Table4.). As data points out, the number of employed persons with higher education is in a state of continualrise. Compared to 2003, numbers have almost doubled. The percentage of persons with highereducation within the total employed population has also risen from 13.6% in 2003 to 21.1% in 2011,which is a positive trend of course.
8 Knowledge is Strength, Knowledge is Power is a present and ongoing example of a government campaign.

Journal of International Scientific Publication: Economy & Business, Volume 6, Part 4
ISSN 1313-2555, Published at: http://www.scientific-publications.net
138 Published by Info Invest, Bulgaria, www.sciencebg.net
Table 4: Percentage of employed persons with higher education within the total number of employedin the Republic of Macedonia for the period of 2008 – 2011, compared to the situation in 2003
Source: Author’s work using data the State Statistical Office published in Statistical Annual of the Republic ofMacedonia, years 2011 and 2004 and in accordance to the Report on Labor Market Conditions in the fourthquarter of 2011, published on 23rd March, 2012
But, parallel to this trend, another trend emerges, one of a rising percentage of unemployed peoplewith higher education within the total number of unemployed. The fact that the percentage of 7.8% in2008 rose to 14.1% in the IV quarter of 2011 is especially worrisome (Table 5.). Just for comparison,in 2003 the percentage equaled barely 5.6%.
Table 5: Percentage of unemployed highly educated people within the total number of unemployedpersons in the Republic of Macedonia in the period of 2008 – 2011
Source: Author’s work using data from the State Statistical Office published in Statistical Annual of the Republicof Macedonia, years 2011 and 2004 and in accordance to the Report on Labor Market Conditions in the fourthquarter of 2011, published on 23rd March, 2012
More than half of the 41 878 unemployed persons i.e. 23 127 have a long-term unemployed status,which means they have been looking for employment longer than a year. This data is even morealarming. The longer these persons seek employment, the greater the risk of their unemployment dueto knowledge and qualifications obsoleteness and the fact they do not have the working experiencethat employers increasingly insist on. As time passes, these people age and it is even harder for themto compete with the new highly educated persons on the labor market.
In the end, there is a real risk that these people will not get the opportunity to ever enter the labormarket or have to accept working positions they are overqualified for, thus annulling all the effortsthey invested in their education (Center for Research and Policy Making, 2009, p. 25).
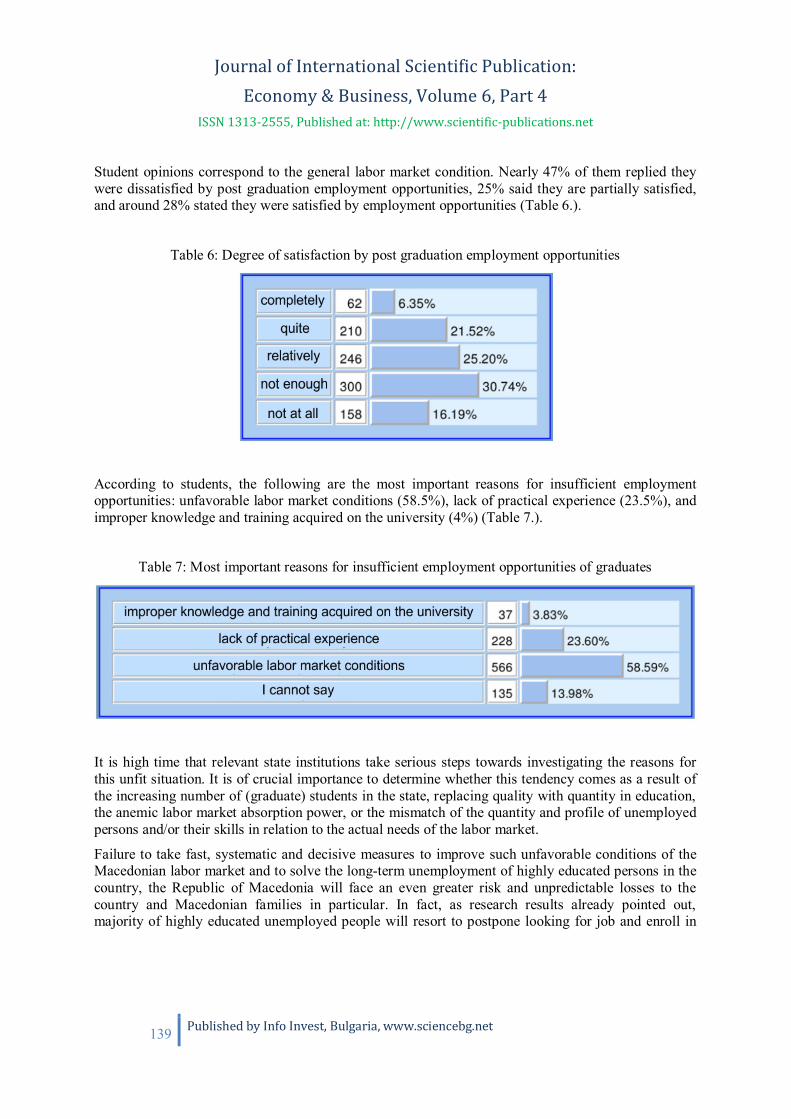
Journal of International Scientific Publication: Economy & Business, Volume 6, Part 4
ISSN 1313-2555, Published at: http://www.scientific-publications.net
139 Published by Info Invest, Bulgaria, www.sciencebg.net
Student opinions correspond to the general labor market condition. Nearly 47% of them replied theywere dissatisfied by post graduation employment opportunities, 25% said they are partially satisfied,and around 28% stated they were satisfied by employment opportunities (Table 6.).
Table 6: Degree of satisfaction by post graduation employment opportunities
According to students, the following are the most important reasons for insufficient employmentopportunities: unfavorable labor market conditions (58.5%), lack of practical experience (23.5%), andimproper knowledge and training acquired on the university (4%) (Table 7.).
Table 7: Most important reasons for insufficient employment opportunities of graduates
It is high time that relevant state institutions take serious steps towards investigating the reasons forthis unfit situation. It is of crucial importance to determine whether this tendency comes as a result ofthe increasing number of (graduate) students in the state, replacing quality with quantity in education,the anemic labor market absorption power, or the mismatch of the quantity and profile of unemployedpersons and/or their skills in relation to the actual needs of the labor market.
Failure to take fast, systematic and decisive measures to improve such unfavorable conditions of theMacedonian labor market and to solve the long-term unemployment of highly educated persons in thecountry, the Republic of Macedonia will face an even greater risk and unpredictable losses to thecountry and Macedonian families in particular. In fact, as research results already pointed out,majority of highly educated unemployed people will resort to postpone looking for job and enroll in
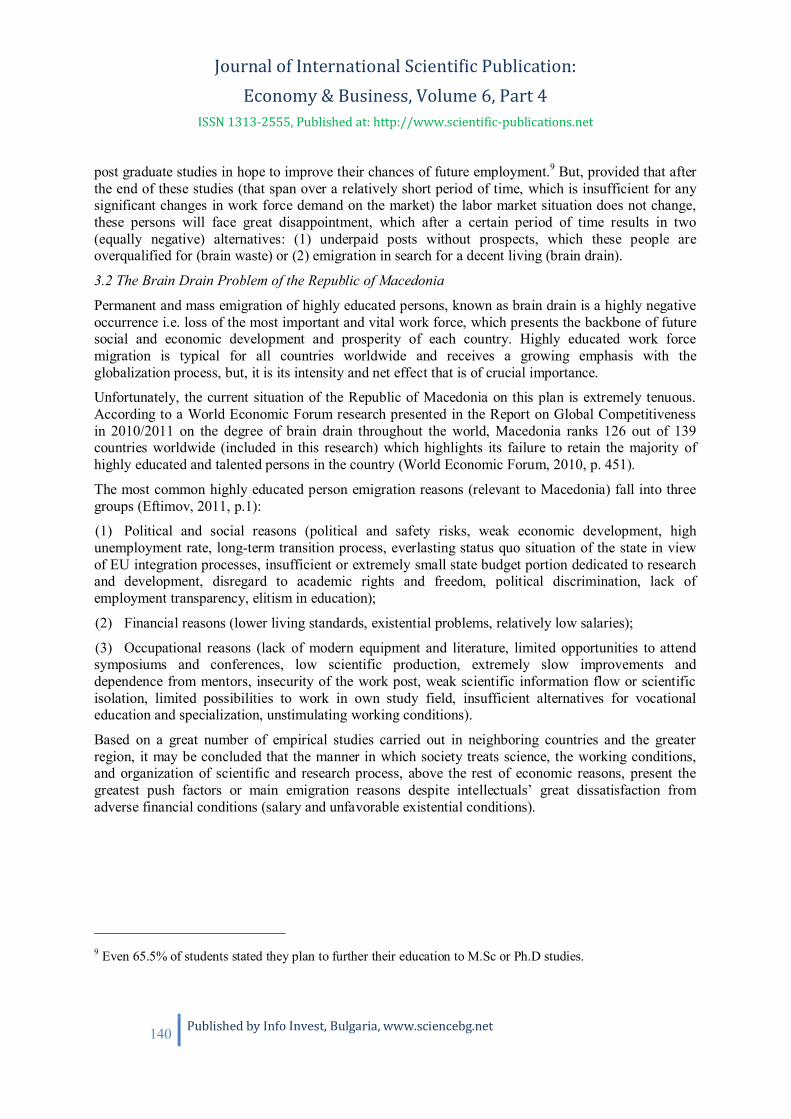
Journal of International Scientific Publication: Economy & Business, Volume 6, Part 4
ISSN 1313-2555, Published at: http://www.scientific-publications.net
140 Published by Info Invest, Bulgaria, www.sciencebg.net
post graduate studies in hope to improve their chances of future employment.9 But, provided that afterthe end of these studies (that span over a relatively short period of time, which is insufficient for anysignificant changes in work force demand on the market) the labor market situation does not change,these persons will face great disappointment, which after a certain period of time results in two(equally negative) alternatives: (1) underpaid posts without prospects, which these people areoverqualified for (brain waste) or (2) emigration in search for a decent living (brain drain).
3.2 The Brain Drain Problem of the Republic of Macedonia
Permanent and mass emigration of highly educated persons, known as brain drain is a highly negativeoccurrence i.e. loss of the most important and vital work force, which presents the backbone of futuresocial and economic development and prosperity of each country. Highly educated work forcemigration is typical for all countries worldwide and receives a growing emphasis with theglobalization process, but, it is its intensity and net effect that is of crucial importance.
Unfortunately, the current situation of the Republic of Macedonia on this plan is extremely tenuous.According to a World Economic Forum research presented in the Report on Global Competitivenessin 2010/2011 on the degree of brain drain throughout the world, Macedonia ranks 126 out of 139countries worldwide (included in this research) which highlights its failure to retain the majority ofhighly educated and talented persons in the country (World Economic Forum, 2010, p. 451).
The most common highly educated person emigration reasons (relevant to Macedonia) fall into threegroups (Eftimov, 2011, p.1):
(1) Political and social reasons (political and safety risks, weak economic development, highunemployment rate, long-term transition process, everlasting status quo situation of the state in viewof EU integration processes, insufficient or extremely small state budget portion dedicated to researchand development, disregard to academic rights and freedom, political discrimination, lack ofemployment transparency, elitism in education);
(2) Financial reasons (lower living standards, existential problems, relatively low salaries);
(3) Occupational reasons (lack of modern equipment and literature, limited opportunities to attendsymposiums and conferences, low scientific production, extremely slow improvements anddependence from mentors, insecurity of the work post, weak scientific information flow or scientificisolation, limited possibilities to work in own study field, insufficient alternatives for vocationaleducation and specialization, unstimulating working conditions).
Based on a great number of empirical studies carried out in neighboring countries and the greaterregion, it may be concluded that the manner in which society treats science, the working conditions,and organization of scientific and research process, above the rest of economic reasons, present thegreatest push factors or main emigration reasons despite intellectuals’ great dissatisfaction fromadverse financial conditions (salary and unfavorable existential conditions).
9 Even 65.5% of students stated they plan to further their education to M.Sc or Ph.D studies.
Journal of International Scientific Publication: Economy & Business, Volume 6, Part 4
ISSN 1313-2555, Published at: http://www.scientific-publications.net
141 Published by Info Invest, Bulgaria, www.sciencebg.net
4. POTENTIAL BRAIN DRAIN – BRAIN GAIN SOLUTIONS FOR MACEDONIANUNIVERSITIESIt is no longer a dilemma whether knowledge and education are most important capital to invest in. Onthe other hand, accessibility and availability of a country’s intelligence is the major resource thatcreates a nation’s wealth. What alternatives does a country have in cases of unfavorable migration?Timely systematic measures must be taken, since they will result in improved future employment andworking conditions for highly educated population, decrease the brain drain, and create favorableconditions for the return and swift integration into the society of emigrated highly educated persons.
Although, in comparison to neighboring countries, the Republic of Macedonia may be late in takingparticular measures towards improving this adverse brain drain situation, 2011 marked the first step inthis direction with the establishment of a national operative group comprised of eminent universityprofessors, which will lead, guide, and control activities in the Stop Brain Drain 2013 – 2020 strategy,benchmark the best world Brain Drain – Brain Gain examples and coordinate maximum usage of braincirculation. Success and swift results are welcome and expected.
Fortunately, brain drain is a dynamic occurrence, which direction and intensity may significantlychange by improving the social, economic, and political situation of the country. The brain drain trendmay turn into brain circulation in Macedonia within a period of 5 – 7 years with the help of wellplanned measures of retaining human capital within the country and their proper execution.
What is missing is an extensive and continuous research of labor market needs and sharing of theresults in order to adapt all educational policies.
In relation to micro level activities towards improvement of the brain drain situation, Macedonianuniversities may not have a substantial influence on labor market conditions, but they maysignificantly influence on student practical experience as second most important factor that determinestheir employability. They can enhance internship and training conditions and opportunities for theirstudents by:
making greater efforts in finding training and internship companies,
creating a better organized practical teaching process,
introducing the mentor and instructor mechanisms,
requesting that students create their papers or graduation projects based on the knowledge andexperience they have acquired while on internship in a certain company or institution, and
awarding a certain number of ECTS credits for this purpose.
Students would in this manner have greater motivation and a more serious approach towards practicalwork; they would be able to link and test theoretical knowledge to the real world; and finally, theywould acquire better practical experience and thus be more visible on the labor market.
As seen by afore presented research results, practical experience is an important factor that influencesstudent employability. This is completely understandable if majority of employers look for academicachievements, personal characteristics, and practical experience in applicants. Having experiencedecreases organizational expenses for employee training and significantly shortens the process ofintroduction to the working post.
It must be emphasized that at some instances, despite the great efforts of university staff andmanagement, limited market conditions obstruct the interest of Macedonian companies and institutions

Journal of International Scientific Publication: Economy & Business, Volume 6, Part 4
ISSN 1313-2555, Published at: http://www.scientific-publications.net
142 Published by Info Invest, Bulgaria, www.sciencebg.net
in providing student internship. It seems that state institutions are not readily open for cooperation onthis matter. In order to avoid such limiting factors, obtain quality internship opportunities, and enablestudents to acquire certain practical skills, some faculties resorted to innovative solutions.
Such practical and innovative solution applicable for most business and economic faculties, which areof greatest number in the Macedonian educational system, is virtual enterprise (computer simulation ofthe business matters of a real company or internship companies). This type of companies presents aquite efficient interactive study manner and mode of acquiring and enhancing business skills aspreparation to working in real world companies. The virtual enterprise is a successful softwareprogram created to simulate activities that take place in real enterprises, such as accounting, financialmanagement, marketing, sales and procurement, HR management, tax payment, etc. It is a successfuleducational method (in some countries even mandatory) for training business students andunemployed persons seeking employment. The program provides a real image of everyday businesslife and internal business processes, insight into foreign business relations and into all other businessfields. The project encompasses 42 countries so far and serves as mandatory or additional mode ofeducation for business students, and, lately, as training method of unemployed among the youngerportion of the population (Eftimov, 2010, p.66).
The Student Stock Exchange project is a similar virtual solution that enables students to understandand learn the operations on real stock exchanges, gain experience, and use it in future real-lifesituations on the work post. The project is an educational internet application that uses fictionalfinancial means made available to students to teach them how these systems work(http://www.studentskaberza.com.mk/ 01.09.2010).
The students of Oxford University Faculty of Law created an interesting solution when they simulateda real trial process on the International Court of Justice in Hague on the name issue between theRepublic of Macedonia and Greece, and a month before it actually happened, anticipated the exactcourt decision
The Faculty of Law at the State University in Tetovo started using a similar simulation of court trialsfor student training as well.
Students would in this manner have greater motivation and a more serious approach towards practicalwork; they would be able to link and test theoretical knowledge to the real world; and finally, theywould acquire larger practical experience and thus be more visible on the labor market.
5. CONCLUSION
Research results conclude that Republic of Macedonia as a result of the complex reform process ofthe higher education system has achieved some relatively good results:
Constant rise (almost double) of highly educated employees in the labor force in the Republicof Macedonia since 2003, which is the year when Macedonia joined Bologna process and thistrend is likely to remain unchanged in view of the actual trends in the education system;
The percentage of employed persons with higher education within the total number ofemployed in the Republic of Macedonia for the period of 2008 – 2011, compared to thesituation in 2003, has almost doubled from 13.6% in 2003 to 21.1% in 2011, which is anotherpositive trend of course.

Journal of International Scientific Publication: Economy & Business, Volume 6, Part 4
ISSN 1313-2555, Published at: http://www.scientific-publications.net
143 Published by Info Invest, Bulgaria, www.sciencebg.net
Positive trend of continuous rise of the percentage of high school graduates becominguniversity enrollees (42% in 2006, 64% in 2007, 85% in 2008 and 96.5% in 2010) followedby a rise in the number of higher education institutions (private and public) and number ofacademic staff;
The research confirmed that 65.4% of the students plan to continue their studies in terms ofM.Sc and Ph.D studies.
But, parallel to these trends, another trend emerges:
Rising percentage of unemployed people with higher education within the total number ofunemployed. The fact that the percentage of 5.6% in 2003, 7.8% in 2008 rose to 14.1% in theIV quarter of 2011 is especially worrisome;
Even more alarming is the fact that more than half of the 41 878 unemployed persons withhigher education i.e. 23 127 have a long-term unemployed status, which means they have beenlooking for employment longer than a year.
Failure to take fast, systematic and decisive measures to improve such unfavorable conditions of theMacedonian labor market and to solve the long-term unemployment of highly educated persons in thecountry, after a certain period of time will result in two (equally negative) alternatives: (1) with greatdisappointment these persons will take underpaid posts without prospects, which they areoverqualified for (brain waste) or (2) emigration in search for a decent living (brain drain).
According to a World Economic Forum research presented in the Report on Global Competitivenessin 2010/2011 on the degree of brain drain throughout the world, Macedonia ranks 126 out of 139countries worldwide (included in this research) which highlights its failure to retain the majority ofhighly educated and talented persons in the country
According to students, the following are the most important reasons for insufficient employmentopportunities: unfavorable labor market conditions (58.5%) and lack of practical experience (23.5%).
Macedonian universities may not have a substantial influence on labor market conditions, but theymay significantly influence on student practical experience as second most important factor thatdetermines their employability. They can enhance internship and training opportunities for theirstudents by making greater efforts in finding training and internship companies, creating a betterorganized practical teaching process, introducing the mentor and instructor mechanisms, and insistingthat students create their papers or graduation projects based on the knowledge and experience theyhave acquired while on internship in a certain company or institution.
It must be emphasized that at some instances, despite the great efforts of university staff andmanagement, limited market conditions obstruct the interest of Macedonian companies and institutionsin providing student internship. In order to avoid such limiting factors, obtain quality internshipopportunities, and enable students to acquire certain practical skills, some faculties should resort tomore innovative virtual solutions. Such practical and innovative solution applicable for most businessand economic faculties which are of greatest number in the Macedonian educational system, is virtualenterprise.Universities should be able to prevent brain drain, at least a part of it. For that purpose they shouldensure the development of their educational process, reinforce their competitiveness and rethink theirinvestment in this sector. Special focus on development of specific practical skills will improvestudent employability, employers satisfaction, and ultimately will prevent loss of the most vital and
Journal of International Scientific Publication: Economy & Business, Volume 6, Part 4
ISSN 1313-2555, Published at: http://www.scientific-publications.net
144 Published by Info Invest, Bulgaria, www.sciencebg.net
important work force, which presents the backbone of future social and economic development andprosperity of each country.
REFERENCES1. Atanasoska-Manasieva, M. (2012). Student assessment on our faculties? Skopje: Dnevnik,
20.02.2012. (In Macedonian).2. Center for Research and Policy Making (2009). Quality in Tertiary Education-How to Improve
It? Skopje: CRPM. Available at http://www.crpm.org.mk/wp-content/uploads/2012/03/EducationENG.pdf (accessed 08.06.2012).
3. EC Communications (2010). Europe 2020: A strategy for smart, sustainable and inclusivegrowth, COM (2010) 2020 of 3.3.2010. Brussels: European Commission.
4. Eftimov, L. (2010). Labour Market: Employment conditions and labour market in Republic ofMacedonia. In: The Report on Business Environment and Socio-Economic Situation in TheRepublic of Macedonia, pp.55-74. Skopje: Business Confederation of Republic of Macedonia.
5. Eftimov, L. (2011). Brain drain in Republic of Macedonia. Working Paper of the OperationalGroup Responsible for Stop Brain Drain 2013 – 2020 strategy. 01.12.2011. Ministry ofEducation and Science of the Republic of Macedonia. (In Macedonian).
6. Ministry of Education and Science of the Republic of Macedonia, National Program forEducation Development (2006). National Program for Education Development in Republic ofMacedonia 2005-2015 with associated program documents. Skopje: Ministry of Education andScience of the Republic of Macedonia. (In Macedonian).
7. Ministry of Education and Science of the Republic of Macedonia (2008). Results of TheGovernment Efforts for Higher Education For More Citizens of Macedonia. Skopje: Ministryof Education and Science of the Republic of Macedonia. (In Macedonian). Available at:http://www.mon.gov.mk/mk/novosti/193-2009-06-30-13-03-07 (accessed 08.06.2012)
8. Pop-Ivanov, L., & Velkovski, G. (2010). ECTS - Reality or Illusion in Higher Education.Skopje: Youth Educational Forum. (In Macedonian). Available at:http://soros.org.mk/dokumenti/EKTS-Realnost-ili-iluzija-vo-visokoto-obrazovanie.pdf(accessed 08.06.2012).
9. Pop-Ivanov, L., Bozinoska, M., and Bozovik, S. (2010). We Dream to Travel: An Analysis ofAcademic and Student Mobility. Skopje: Youth Educational Forum. (In Macedonian).Available at: http://mof.org.mk/publikacii/Studentska%20Mobilnost%2021.01.2011.pdf(accessed 08.06.2012).
10. Popovski, T.Z. (2010). The quality of higher education in question - the studies dispersion asMacedonian phenomenon. Skopje: Foundation Open society-Macedonia. (In Macedonian).Available at: http://soros.org.mk/dokumenti/disperzirani-studii-za-WEB.pdf (accessed08.06.2012).
11. Popovski, T.Z., Velkovski, Z., Gadzoska, L., Rusiti, A., Masnikoska, M., Mucunska-Palevska,V., and Dimitrievska, B. (2007). Analysis of the good governance capacity in education,Report. Skopje: Foundation Open society-Macedonia. (In Macedonian). Available at:http://www.gg.org.mk/pdf/analiza_obrazovanie.pdf (accessed 08.06.2012).
12. World Economic Forum (2010). The Global Competitiveness Report 2010–2011. Geneva:World Economic Forum.

Journal of International Scientific Publication: Economy & Business, Volume 6, Part 4
ISSN 1313-2555, Published at: http://www.scientific-publications.net
145 Published by Info Invest, Bulgaria, www.sciencebg.net
STRATEGIC FLEXIBILITY IN INTERNATIONAL INTERMEDIATE TRADE
WITH HANSEATIC PRINCIPLES.Artur Rieger, Maksim Saat
Tallinn University of Technology, School of Economics and Business Administration,
12618 Tallinn, Estonia, Akadeemia tee 3
Abstract
The purpose of the paper is to research, whether trading enterprises are able to adapt more flexibly tochallenges in the sales- and procurement markets than manufacturing enterprises The questions wereasked: is intermediate trade on the basis of the principles of the Hanseatic merchants a possiblebusiness strategy in our present time? In the paper three hypotheses are developed and empiricallytested. In order to check the factuality and sustainability of the hypotheses a questionnaire withmultiple choice-answeres were designed. Recipients of the questionnaire were owners, managers andexecutive board members of manufacturing enterprises. As a result, 87% of the participants believe,that intermediate trade strategy could be even more successful in our time than it was in the Hanseatictime.
Key words: strategic flexibility, international trade, Hanseatic principles.
INTRODUCTION
While enterprises in the fields of production and services have been studied in the scientific literatureextensively, very little attention has been paid to trading enterprises in these publications (Jones, 1998:p.1). In addition, the accomplishments of trading enterprises are often underestimated, not recognizedor even rejected. The negative image of trading enterprises is rooted in the occidental Christiantradition which, in comparison to the production of goods, did not have a high regard of trade(Gümbel,1985: pp.28). The fact that such a tradition could develop is actually surprising, since history hasproven over and over that trading is the key to wealth. For example, when the city of Florence grew toone of the largest and most prosperous cities in Europe during the 14th and 15th centuries, the keyfigures in the economic rise were merchants and not manufacturers (Brucker, 1984: p. 68.) Themerchants of the Hanseatic League are another example. They were the dominant economic power inEurope for more than half a millennium. This economic dominance came into being randomly, butwas the result of numerous efficiency-enhancing personal character qualities and principles. Amongother things, this meant that the merchants of the Hanseatic League limited themselves to intermediatetrade and did not engage in their own manufacturing. While the medieval Hanseatic League with all itsspecific structures and cultural conditions cannot be brought back to life today, we can, nevertheless,pose the question as to whether the principles of the Hanseatic League could serve as the basis for atrading strategy nowadays.

Journal of International Scientific Publication: Economy & Business, Volume 6, Part 4
ISSN 1313-2555, Published at: http://www.scientific-publications.net
146 Published by Info Invest, Bulgaria, www.sciencebg.net
1. MANUFACTURING AND TRADING ENTERPRISES
Enterprises can be categorized into manufacturing, trading, and service enterprises. In the following,only the first and second categories are relevant.
A classical manufacturing enterprise is a productive unit which produces goods by applying acombination of production factors (floor space, work force, capital). In order to manufacture products,a more or less capital-intensive production facility is needed. The setup requires financial resources inthe form of equity and outside capital. This capital is then committed in the medium or long term andis therefore not available for other short-term investments in the enterprise. Besides the commitmentof the capital, another reason for certain inflexibilities in typical manufacturing enterprises result fromthe fact that they need very specific production plants and machines for the manufacture of specificgoods. These plants cannot be changed into more suitable alternatives later without a loss in value.This is commonly referred to as irreversibility (Henry, 1974: p.1006).
In contrast, an intermediate trading enterprise is a productive unit which is characterized by theintermediation of goods. Several characteristic forms exist, such as broker or reseller (Casson, 1998:p.24). A constituent feature of a trading enterprise is the fact that no goods are manufactured and, thus,there is no need for a capital-intensive production facility (Ellis, 2010: p.18). Hence, intermediatetrading enterprises have two advantages: They do not need such a high capitalization and the capitaldoes not have to be committed in the medium or long term as is the case with manufacturingenterprises. Furthermore, trading enterprises face no or almost no risk of possible losses of value byinvestments in specific production plants.
During macroeconomic crises, such as the one in 2009 or others in times of intensifying competition,repeated calls and recommendations for more flexibility in enterprises can be heard from various sides(Meffert, 1985: p.121). It is argued that flexibility will be the only means of mastering economicchallenges successfully. However, there is usually no clear reference as to the meaning of thisflexibility and no distinction is made between production enterprises and trading enterprises. Scholarsdefine flexibility as the ability of an enterprise to respond to uncertain future changes in the marketand production conditions in a fast and targeted manner (Nagel, 2003: p.10).
If enterprises are reactively flexible, they only have the ability to adapt to changes in theenvironmental system.
If enterprises are actively flexible, they have the ability to influence processes in the enterprisein times when disturbances in the environmental system occur in such a way that theobjectives of the enterprise can still be achieved.
If enterprises are proactively flexible, they have the ability – on the basis of an installed earlywarning system – to anticipate future disturbances in the environmental system and thus, theprocesses in the enterprise can be adapted in time. Simultaneously, they can participate inshaping the whole change process (Damisch, 2002: pp.43).
Acting and reacting in an flexible way requires that enterprises have a scope for action available.There is a need either for alternative actions to transform the organizational and process structure orfor the possibility to optimize measures that have already been taken (Damisch, 2002: p.49).
In addition, enterprises need a willingness to take action. On the one hand, this means that thenecessary personnel are provided and measures are initiated. On the other hand, the already existingmeasures can be supported continually. This requires, in particular, the ability to relinquish traditionalpatterns of behavior and to make decisions even in uncertain circumstances (Nagel, 2003: p.12).

Journal of International Scientific Publication: Economy & Business, Volume 6, Part 4
ISSN 1313-2555, Published at: http://www.scientific-publications.net
147 Published by Info Invest, Bulgaria, www.sciencebg.net
Finally, flexibility goes hand in hand with a certain degree of speed of action. This is so becausescopes of action can only be used successfully by enterprises. Moreover, they are only valuable if theyare used at the right time. If a certain measure is implemented too late, it might not be possible anylonger to fend off a developing danger or to fully avail of an emerging opportunity (Damisch, 2003:p.49).
In this context, the term strategic flexibility is often used. For example, Jacob (1989: p.18) definesstrategic flexibility as the ability of an enterprise to adapt to changed framework conditions bychanges in the production program and product range. This will enable the enterprise to still make useof those market opportunities that remain from the original ones, while at the same time being able tofully exploit the new opportunities emerging from the changed framework conditions . However,strategic flexibility does not have an end in itself (Burmann, 2002: p.58). It must serve the long-termincrease in the enterprise value as an overall objective (Amram/Kulatilaka, 1999: p.95).
A detailed examination of the increasing demand for flexibility in enterprises reveals changes in theentrepreneurial environment that are the cause of this demand. In the past, such changes could still bepredicted with some degree of certainty. Thus, enough time remained for both the amortization of thecapital that had been committed and for the decision makers to redirect the focus of their enterprise.However, the changes in times of globalization are characterized by fast and almost unpredictable,stochastic and sometimes erratic changes. These changes can be categorized into challenges withregard to the (sales) market and challenges with regard to the procurement market.
Concerning the challenges in the area of the sales market, we can mention the liberalization ofmarkets, increasing market transparency, hyper competition in the market places, and shorterlife cycles of products (Damisch, 2002: p.66).
Concerning the challenges in the area of the procurement market, we can mention the highvolatility in the raw material and upstream market, problems concerning the acquisition offinancial resources, and problems in the implementation of foreign investments (No author,2005a and No author 2005b).
These changes in the environment of an enterprise meet with a situation within the enterprise that ischaracterized by a certain degree of inflexibility or irreversibility. Once a manufacturing enterprise hasdecided on its entrepreneurial objectives and has acquired the necessary production facilities, theenterprise has made its commitment for a certain time period. If the enterprise wants to avoid asituation where the acquisition of the production facilities has to be written off as a failed investment,it will have to maintain the production process for a certain time period, and thus, it will be restrictedin its flexibility. The scope of flexibility depends on the level of the investment sum in relation to thetotal capital of the enterprise. If the enterprise has invested a large sum, it will only be able toinfluence the variable costs by adjusting the production volume. Selling the production equipment isusually only possible by accepting a reduced price, which can lead to substantial losses for theenterprise, since the invested sum was high in relation to the total capital. If the enterprise invested asmall sum in relation to the total capital, the scope for flexibility would remain higher since the lossesincurred through the sale of the production equipment will not have such a strong effect. However, thedanger in this case is the following: if the investment was too moderate to begin with, due to a bettercost structure the enterprise might be squeezed out of the market by competitors. A rather uniqueproblem could occur, if the acquired resources are of a very specific type and therefore cannot be usedby anyone outside the enterprise, they would thus have to be considered as sunk costs (Damisch, 2002:pp.69). The case of sunk costs is the most restrictive one to the scope of flexibility and, from aperspective of flexibility, enterprises should avoid it.

Journal of International Scientific Publication: Economy & Business, Volume 6, Part 4
ISSN 1313-2555, Published at: http://www.scientific-publications.net
148 Published by Info Invest, Bulgaria, www.sciencebg.net
The changes in the economic environment pose enormous challenges for enterprises – on the onehand, their profits are squeezed by rising costs on the procurement market and, on the other hand, byfalling prices due to the competition in the sales market. If in addition discontinuities occur, ashappened in the crisis year 2009 when demands suddenly collapsed, many enterprises face tremendousdifficulties to adapt to the new conditions in their environment quickly. Therefore, it is not surprisingthat many enterprises had to digest heavy losses in this crisis year. Empirical studies show, however,that not all enterprises were equally affected. As an example, the Daimler AG in Germany – a classicalmanufacturing enterprise – had to digest losses of € 2.6 billion. (No author, 2010a). On the other hand,trading enterprises such as ALDI could maintain their profit level in 2009 (No author, 2010b). It isimportant to understand why trading enterprises could keep their profits stable in 2009, whileproduction enterprises had to deal with heavy losses. One suggestion would be that trading enterprisescan adapt to the challenges with more flexibility with regard to the procurement and sales markets. Itis precisely this question this empirical study deals with. In addition, the question is raised as towhether intermediate trade – in the same way the Hanseatic merchants did very successfully inmedieval times over a period of more than 500 years – could be a strategy that would allow a moreflexible response to market opportunities. Enterprises could do without the extensive and capital-intensive manufacturing plants and be more flexible in responding to market developments. Thus, thepurpose of this paper is twofold. On the one hand, the research focus is to examine whether tradingenterprises can adapt to challenges with more flexibility. On the other hand, it will be examinedwhether intermediate trade could serve as a strategy to response to market opportunities.
2. HYPOTHESESToday, entrepreneurial trading is not performed on the premise of security regarding the impendingchanges in the environment but on the basis of uncertain framework conditions (Trigeorgis, 1999:p.3). Enterprises have to deal with the challenges imposed on them by the procurement and salesmarket. A typical manufacturing enterprise, however, needs a production facility in order to producegoods. Once the decision for the purchase of these production facilities has been made, it cannot becancelled easily without causing additional costs. Such a decision is irreversible. Due to their businessmodel, trading enterprises have the advantage that they do not need extensive production facilities
Hypothesis 1:
Trading enterprises can deal more flexibly than manufacturing enterprises with the challengesregarding the procurement and sales market.
Typical manufacturing enterprises hold extensive production facilities in order to manufacture. Theseproduction facilities are financed with equity and borrowed capital. This capital is then committed inthe medium or long term and is therefore not available for short term alternatives, e.g. its use formarket opportunities. This results in a certain degree of inflexibility. Intermediate trading enterprisescan avoid such inflexibility since they do not need an extensive production facility and thus theircapital is not committed in the medium or long term.
Hypothesis 2:
Intermediate trade with goods is a strategy that allows a flexible response to market opportunities.

Journal of International Scientific Publication: Economy & Business, Volume 6, Part 4
ISSN 1313-2555, Published at: http://www.scientific-publications.net
149 Published by Info Invest, Bulgaria, www.sciencebg.net
The concept of intermediate trade was practiced with great success by the merchants of the HanseaticLeague during the Middle Ages for more than 500 years. In the case of the Hanseatic merchants, thefollowing attributes were considered essential: a distinct business sense, market orientation,organizational talent, entrepreneurship, entrepreneurial courage, ability to cooperate, reliability andfairness in doing business, common sense regarding the economy and technology, distinct acumen forprofitable businesses, a desire to investigate and conquer new markets, observance of a strict code ofhonor and a high sense of responsibility (Rieger, 2007: p.410).
Hypothesis 3:
International intermediate trade based on Hanseatic principles is a flexible and promising strategy forour present time.
3. METHODOLOGY OF THE RESEARCH3.1 Sample selection and data collection
In order to check the factuality and sustainability of the above hypotheses, an online questionnairewith multiple–choice answers was designed. The answers were intended to reflect the accurate andapplicable facts and circumstances. Recipients of the questionnaire were owners, managers andexecutive board members of manufacturing enterprises. In the summer of 2010 the questionnaireswere sent out to 778 enterprises, of which 669 were answered. To ensure that only owners, managersand executive board members of manufacturing companies participated in the survey, two exclusionquestions were used in the questionnaire.
The first question dealt with the type of enterprise the respondent was managing. The following threecategories were available: manufacturing enterprise, trading enterprise and service enterprise. Amongthe 669 answered questionnaires 132 came from respondents who either worked for a manufacturingenterprise or in their own manufacturing enterprise. The remaining 537 participants were excludedfrom the survey, because they are no adressee of the questionaire.
The second question concerned the position of the respondent in the enterprise. The following optionswere available: owner, manager, executive board member or “others”. Among the 132 participants, 17were owners, 21 were managers and 17 were board members; 75 held a different position in theirenterprise. In the following stage of the survey only the 17 owners, 21 managers and 17 boardmembers were permitted to participate. The remaining participants were excluded from the survey,because they are no adressee of the questionaire. A total of 55 participants remained in the survey, allof whom completed the questionnaire.
3.2 Results of the questionnaire
Since the first two questions had the function to exclude those participants the survey was not aimingat, the analysis starts with the third question in the survey. This was intended to provide informationabout the current business situation and the profit situation of the enterprise. 22% answered that thebusiness situation was excellent, the production facilities were working at full capacity and the profitsituation was excellent, too. 51% responded that the business situation was good, the productionfacilities were working to capacity, but the profit situation needed improvement. 18% valued thebusiness situation as satisfactory and the production facilities as sufficiently used, and thus maintainedthey could make ends meet. 9% of the respondents stated that the business situation was unsatisfactory
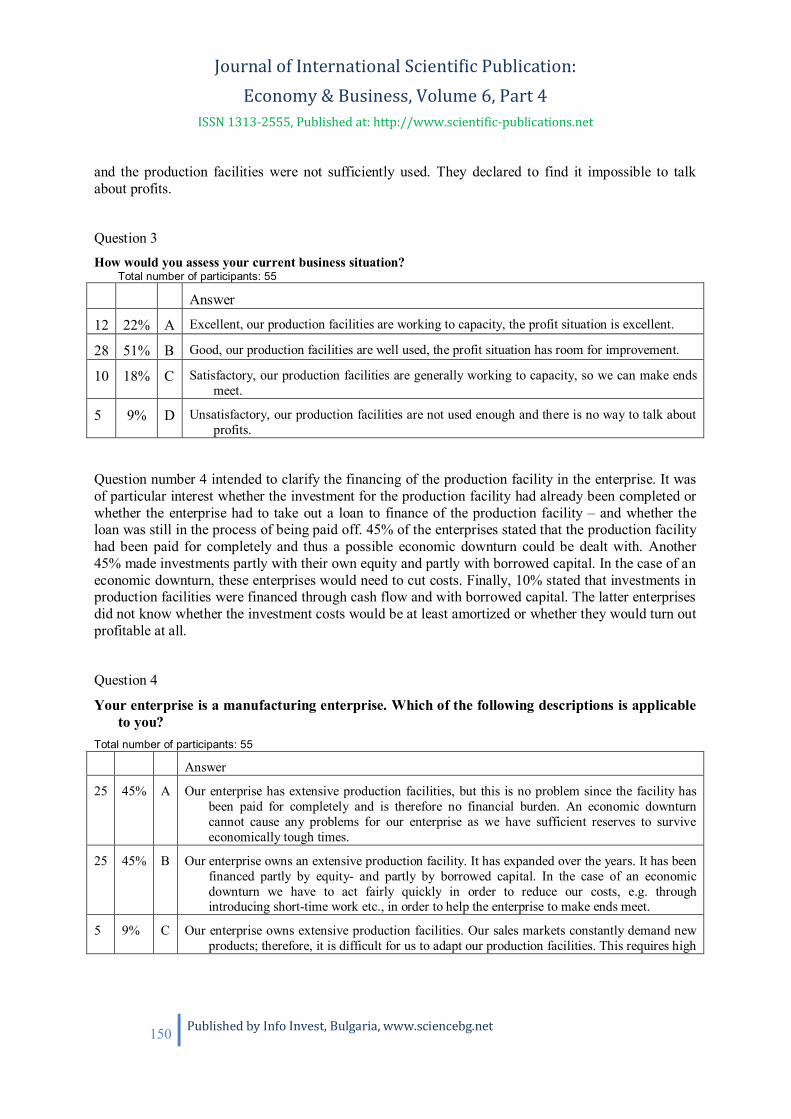
Journal of International Scientific Publication: Economy & Business, Volume 6, Part 4
ISSN 1313-2555, Published at: http://www.scientific-publications.net
150 Published by Info Invest, Bulgaria, www.sciencebg.net
and the production facilities were not sufficiently used. They declared to find it impossible to talkabout profits.
Question 3How would you assess your current business situation?
Total number of participants: 55
Answer
12 22% A Excellent, our production facilities are working to capacity, the profit situation is excellent.
28 51% B Good, our production facilities are well used, the profit situation has room for improvement.
10 18% C Satisfactory, our production facilities are generally working to capacity, so we can make endsmeet.
5 9% D Unsatisfactory, our production facilities are not used enough and there is no way to talk aboutprofits.
Question number 4 intended to clarify the financing of the production facility in the enterprise. It wasof particular interest whether the investment for the production facility had already been completed orwhether the enterprise had to take out a loan to finance of the production facility – and whether theloan was still in the process of being paid off. 45% of the enterprises stated that the production facilityhad been paid for completely and thus a possible economic downturn could be dealt with. Another45% made investments partly with their own equity and partly with borrowed capital. In the case of aneconomic downturn, these enterprises would need to cut costs. Finally, 10% stated that investments inproduction facilities were financed through cash flow and with borrowed capital. The latter enterprisesdid not know whether the investment costs would be at least amortized or whether they would turn outprofitable at all.
Question 4
Your enterprise is a manufacturing enterprise. Which of the following descriptions is applicableto you?
Total number of participants: 55
Answer
25 45% A Our enterprise has extensive production facilities, but this is no problem since the facility hasbeen paid for completely and is therefore no financial burden. An economic downturncannot cause any problems for our enterprise as we have sufficient reserves to surviveeconomically tough times.
25 45% B Our enterprise owns an extensive production facility. It has expanded over the years. It has beenfinanced partly by equity- and partly by borrowed capital. In the case of an economicdownturn we have to act fairly quickly in order to reduce our costs, e.g. throughintroducing short-time work etc., in order to help the enterprise to make ends meet.
5 9% C Our enterprise owns extensive production facilities. Our sales markets constantly demand newproducts; therefore, it is difficult for us to adapt our production facilities. This requires high
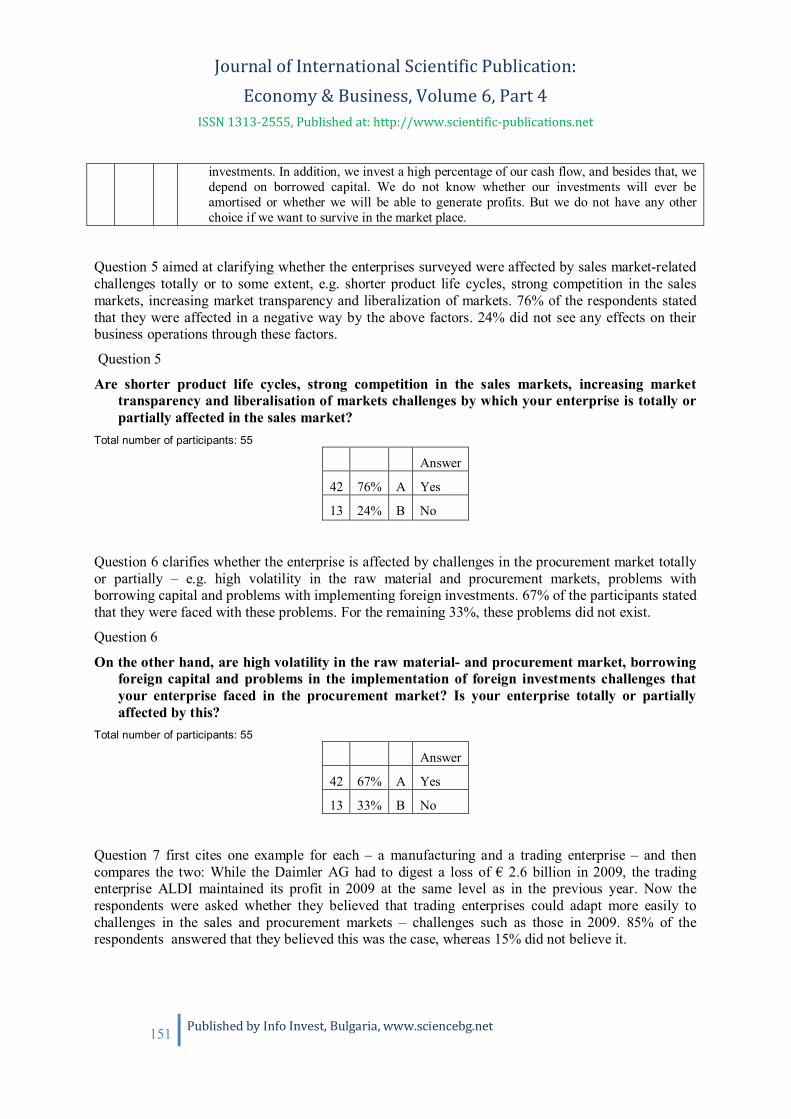
Journal of International Scientific Publication: Economy & Business, Volume 6, Part 4
ISSN 1313-2555, Published at: http://www.scientific-publications.net
151 Published by Info Invest, Bulgaria, www.sciencebg.net
investments. In addition, we invest a high percentage of our cash flow, and besides that, wedepend on borrowed capital. We do not know whether our investments will ever beamortised or whether we will be able to generate profits. But we do not have any otherchoice if we want to survive in the market place.
Question 5 aimed at clarifying whether the enterprises surveyed were affected by sales market-relatedchallenges totally or to some extent, e.g. shorter product life cycles, strong competition in the salesmarkets, increasing market transparency and liberalization of markets. 76% of the respondents statedthat they were affected in a negative way by the above factors. 24% did not see any effects on theirbusiness operations through these factors.
Question 5
Are shorter product life cycles, strong competition in the sales markets, increasing markettransparency and liberalisation of markets challenges by which your enterprise is totally orpartially affected in the sales market?
Total number of participants: 55
Answer
42 76% A Yes
13 24% B No
Question 6 clarifies whether the enterprise is affected by challenges in the procurement market totallyor partially – e.g. high volatility in the raw material and procurement markets, problems withborrowing capital and problems with implementing foreign investments. 67% of the participants statedthat they were faced with these problems. For the remaining 33%, these problems did not exist.
Question 6
On the other hand, are high volatility in the raw material- and procurement market, borrowingforeign capital and problems in the implementation of foreign investments challenges thatyour enterprise faced in the procurement market? Is your enterprise totally or partiallyaffected by this?
Total number of participants: 55
Answer
42 67% A Yes
13 33% B No
Question 7 first cites one example for each – a manufacturing and a trading enterprise – and thencompares the two: While the Daimler AG had to digest a loss of € 2.6 billion in 2009, the tradingenterprise ALDI maintained its profit in 2009 at the same level as in the previous year. Now therespondents were asked whether they believed that trading enterprises could adapt more easily tochallenges in the sales and procurement markets – challenges such as those in 2009. 85% of therespondents answered that they believed this was the case, whereas 15% did not believe it.

Journal of International Scientific Publication: Economy & Business, Volume 6, Part 4
ISSN 1313-2555, Published at: http://www.scientific-publications.net
152 Published by Info Invest, Bulgaria, www.sciencebg.net
Question 7
Many manufacturing enterprises had to digest high losses during the past year. For example, theDaimler AG had to digest € 2.6 billion losses in 2009. On the other hand, trading enterprises,e.g. ALDI, could maintain their profit level in 2009. Do you believe that trading enterprisescan adapt more easily to challenges related to the sales- and procurement market –challenges such as those in 2009?
Total number of participants: 55
Answer
47 85% A Yes
8 15% B No
Question 8 dealt with the medium and long term commitment of capital for production facilities inmanufacturing enterprises. The managers of enterprises were asked whether they would prefer, in theinterest of their enterprise strategy, that this capital is committed for a shorter time period and thusallow them more flexibility. 76% of the enterprise managers would prefer more flexibility andanswered the question with “Yes”, while 24% answered the question with “No”.
Question 8:
Your enterprise owns an extensive production facility. This production facility was financed byequity- and borrowed capital. This capital is now committed in the medium or long term andis not available for alternative use in the short term, e.g. to make use of opportunities in themarket. This type of commitment is the cause for certain inflexibilities in manufacturingenterprises. Would you argue, in the interest of the strategic orientation of your enterprise,for a shorter commitment of this capital, which would thus allow you a more flexibleresponse to market developments?
Total number of participants: 55
Answer
42 76% A Yes
13 24% B No
Question 9 asked whether the representatives of the enterprise had already reflected on the setup thatwould be necessary for their enterprise so that the afore-mentioned inflexibilities of manufacturingenterprises could be avoided. Of the respondents 80% answered with “Yes” and 20% with “No”.
Question 9
Have you reflected on the setup that would be necessary for your enterprise in order to avoid theafore-mentioned inflexibilities in manufacturing enterprises?
Total number of participants: 54
Answer
43 80% A Yes
11 20% B No

Journal of International Scientific Publication: Economy & Business, Volume 6, Part 4
ISSN 1313-2555, Published at: http://www.scientific-publications.net
153 Published by Info Invest, Bulgaria, www.sciencebg.net
Question 10 aimed at finding out whether the respondents could imagine that intermediate trading withgoods instead of manufacturing goods could be the way to avoid these afore-mentioned inflexibilities80% of the respondents said “Yes” and 20% “No”.
Question 10
Could you imagine that one could avoid this inflexibility with the intermediate trade of goodsinstead of the manufacture of goods as the enterprise would not need extensive productionfacilities, and the capital would not be committed in the medium or long term, thus allowingthe enterprise to respond very flexibly to market developments?
Total number of participants: 55 Answer
44 80% A Yes
11 20% B No
Question 11 intended to clarify whether the participants could imagine that the concept of intermediatetrade used very successfully by the Hanseatic merchants in the Middle Ages for more than 500 yearscould be useful for enterprises nowadays. 76% could imagine so and 24% could not.
Question 11
The concept of intermediate trade was practiced by the merchants of the Hanseatic League inthe Middle Ages very successfully for more than 500 years. For the Hanseatic merchantscertain attributes such as a distinct business sense, market orientation, organisational talent,entrepreneurial spirit and entrepreneurship, ability to cooperate, reliability and fairness indoing business, economic and technical common sense, keen acumen for profitable businessopportunities, a desire to explore and conquer new markets, adhering to a strict code ofhonour and a high sense of responsibility played an important role. Can you imagine thatthe concept of intermediate trade, used by the merchants of the Hanseatic League, couldserve as a model for a successful business strategy for you and your enterprise in the presenttime?
Total number of participants: 55
Answer
42 76% A Yes
13 24% B No
Question 12 asked the enterprise managers whether they could imagine that the above describedintermediate trading strategy of the Hanseatic merchants could be even more promising in our presenttime than in the Hanseatic times, since now search costs are much lower than in the past. 87%answered this question with “Yes” and 13% “No”.
Question 12
Could you imagine that the above described intermediate trading strategy of the Hanseaticmerchants could be even more successful in our present time than it was in the Hanseatic

Journal of International Scientific Publication: Economy & Business, Volume 6, Part 4
ISSN 1313-2555, Published at: http://www.scientific-publications.net
154 Published by Info Invest, Bulgaria, www.sciencebg.net
time since search costs are much lower due to modern communication methods, bigproduction- and price differences exist between various countries and fast and efficienttransport means are available with fewer trade barriers?
Total number of participants: 55
Answer
48 87% A Yes
7 13% B No
3.3 Analysis
The first hypothesis was tested with questions 5, 6, 7 and 8. It turns out that the formulated challengesconcerning the procurement and the sales market apply to 76% (question 5) and to 67% (question 6) ofthe enterprises. Of those who were asked, 85% even stated that trading enterprises could more easilyadapt to the challenges than manufacturing enterprises (question 7). Thus, the content of hypothesis 1that trading enterprises can adapt more flexibly to challenges with regards to the procurement andsales market than manufacturing enterprises is confirmed.
The necessary capital for the acquisition of the production facilities is committed in the medium orlong term and is therefore not available for short term alternative use in the enterprise, which leads to acertain inflexibility in manufacturing enterprises. When asked whether they would – in the strategicinterest of the enterprise – plead for a shorter commitment of the capital and thus allow for moreflexibility in responding to market developments, 76% answered “Yes” (question 8). Among theparticipants already 80% reflected on the necessary setup of their enterprise, in order to avoid theinflexibility described in manufacturing enterprises.
Question 9 was applied to test hypothesis 2. Of the managers of manufacturing enterprises, 80% canimagine that intermediate trade with goods instead of the manufacture of goods could be the way toavoid exactly the inflexibility described in manufacturing enterprises. In this case, the enterprisewould no longer need an extensive production facility and would not need to commit its capital in themedium or long term. Therefore, it would be able to respond very flexibly to market developments.This confirms hypothesis, namely the assumption that intermediate trade with goods is a strategy thatallows a flexible response to market opportunities.
Question 11 aimed at testing hypothesis 3. 76% of the enterprise managers can imagine the concept ofintermediate trade, as was practiced very successfully by the Hanseatic merchants, to serve as a modelfor a successful business strategy in the present time. Of the survey participants, 87% believe that anintermediate trade strategy can be even more successful in our time than it was among the Hanseaticmerchants, since search costs are much lower now. Thus, hypothesis 3 could also be confirmed,namely the point that international and intermediate trading on the basis of the Hanseatic principles isa promising strategy for the present.
3.4 Discussion
The purpose of the survey was to research examine, whether trading enterprises are able to adapt moreflexibly to challenges in the sales and procurement markets than manufacturing enterprises.Furthermore, the following question was asked: Is intermediate trade on the basis of the principles ofthe Hanseatic merchants a possible business strategy for our present time – a strategy that allows aflexible response to opportunities in the market?

Journal of International Scientific Publication: Economy & Business, Volume 6, Part 4
ISSN 1313-2555, Published at: http://www.scientific-publications.net
155 Published by Info Invest, Bulgaria, www.sciencebg.net
Of the survey participants, 76% and 67% are affected by the challenges in the procurement and salesmarkets respectively and 85% are of the opinion that trading enterprises can adapt more easily to thesechallenges than manufacturing enterprises. With regard to the strategic focus of their enterprise, 76%of the survey participants would prefer that the capital currently committed to the production facilitieswas not committed for such a long time, since this would allow the enterprise to respond more flexiblyto market opportunities. 80% already thought about the necessary setup of their enterprise that wouldallow them to avoid the inflexibility which results from the commitment of invested capital intoproduction facilities. 80% can imagine that intermediate trade with goods could be a strategy to avoidthis inflexibility and enable them to respond flexibly to market opportunities. Among the participantsquestioned, 76% can imagine that the concept of intermediate trade can serve as a model for asuccessful business strategy for enterprises in our present time. Furthermore, 87% of the participantsbelieve that the intermediate trade strategy could be even more successful in our time than it was in theHanseatic time.
The results of the survey confirm the correctness of all three hypotheses. This is definitely aremarkable result, since the survey was conducted on owners, managers and board members ofmanufacturing enterprises. One would expect managers of manufacturing enterprises to contemplatefuture strategies within their own economic scope of activities, namely that of manufacturingenterprises. This is even more so, since literature assumes that the manufacturer is superior to thetrader and that the trader has to worry constantly that his or her service might not be needed anymoreund thus will arrive in a “trader’s dilemma”. Consequently, trading should actually not be attractiveany longer (Ellis, 2005: p.376). However, the results of the survey reveal a totally contrasting picture.Among the participants surveyed, 76% anticipate becoming traders and apparently do not have anyconcerns that they might end up in the “trader’s dilemma”. They consider the advantages resultingfrom this as significantly outweighing any disadvantages. In particular, the avoidance of theinflexibilities described in manufacturing enterprises and the possibility to respond flexibly to marketopportunities appears to be an important argument for the surveyed participants in favor of a tradingstrategy.
The results of the survey confirm the assumption that trading enterprises can adapt to challenges in thesales and procurement markets more flexibly than manufacturing enterprises. The survey has alsodemonstrated that intermediate trade can be a strategy that permits a flexible response to marketopportunities. Thus, intermediate trade is a flexible and promising strategy for our present time.Among the survey participants, even 78% believe that an intermediate trading strategy can be moresuccessful in our present time than it was during the time of the Hanseatic League. This appears quiterealistic since search costs are much lower today than they were during the time of the HanseaticLeague, due to modern communication methods. In addition, big production and price differencesexist between various countries, and transport means are faster and more efficient with considerablylower trading barriers now than in the time of the Hanseatic League. These arguments makeintermediate trade look very attractive. However, to make an intermediate trade strategy successful,more research is needed. In particular, the practical application has to be researched, as well as theproducts and markets suitable for intermediate trade. Research is also needed on how the individualintermediate trade enterprise should be structured and organized, and on the skills and qualificationsthat should be available.

Journal of International Scientific Publication: Economy & Business, Volume 6, Part 4
ISSN 1313-2555, Published at: http://www.scientific-publications.net
156 Published by Info Invest, Bulgaria, www.sciencebg.net
4. SUMMARY
For more than half of a millennium the Hanseatic merchants were the dominating economic force inEurope. This economic dominance was no coincidence, but rather the result of numerous efficiency-enhancing personal characteristics and principles. Moreover, the exclusive focus on intermediate tradewas an important component of the success. This survey has shown that international intermediatetrade on the basis of the Hanseatic principles is a promising business strategy for our present time.Especially, the possibility to respond flexibly to market opportunities is a strong argument for this typeof business strategy.
REFERENCES
Amram, M. & Kulatilaka, N. 1999, Disciplined Decisions. Aligning strategy with the financialmarkets. Harvard Business Review 77(1), pp.95–105.
Burmann, C. 2002, Strategische Flexiblität und Strategiewechsel als Determinanten desUnternehmenswertes. Wiesbaden: Deutscher Universitätsverlag.
Brucker, G. A. 1984, Florenz: Stadtstaat, Kulturzentrum, Wirtschaftsmacht. München: KleinerBachmann Verlag.
Casson, M. 1998, The economic analysis of multinational trading companies. In G. Jones (Ed.), Themultinational traders, pp. 22-47. London and New York: Routledge.
Damisch, P. N. 2002, Wertorientiertes Flexibilitätsmanagement durch den Realoptionsansatz.Wiesbaden: Deutscher Universitätsverlag.
Ellis, P. D. 2005, ‘ The traders’ dilemma. The adverse consequences of superior performance inmediated exchances. International Business Review, 14(4), pp.375-396.
Ellis, P. D. 2010, International trade intermediaries and the transfer of marketing knowledge intransition economies. International Business Review, 19, pp.16-33.
Gümbel, R. 1985, Handel, Markt und Ökonomik. Wiesbaden: Gabler Verlag.
Henry, C. 1974, Investment Decisions under Uncertainty. The „Irreversibility Effect“. The AmericanEconomic Review, 64.Vol., Nr. 6, pp.1006-1012.
Jakob, H. 1989, Flexibilität und ihre Bedeutung für die Betriebspolitik. In Adam, D., Backhaus, K.,Meffert, H. & Wagner, H. (Ed.), Integration und Flexibilität. Eine Herausforderung für die allgemeineBetriebswirtschaftslehre. pp. 15–60. Wiesbaden: Gabler Verlag.
Jones, G. 1998, Multinational trading companies in hinstory and theory. In G. Jones (Ed.), TheMultinational Traders, pp. 1-21. London and New York: Routledge.
Meffert, H. 1985, Größere Flexibilität als Unternehmenskonzept. Zeitschrift fürbetriebswirtschaftliche Forschung , 37. Jahrgang, pp.121–137.
Nagel, M. 2003, Flexibilitätsmanagement – Ein systemdynamischer Ansatz zur quantitativenBewertung von Produktionsflexibilität. Wiesbaden: Deutscher Universitätsverlag.
No author 2005a, Hohe Rohstoffpreise werden zur Dauerlast. online in the internet under:http://www.impulse.de/ftd/artikel.html?artikel_id=707980, retrieval day: 22.02.2011.
Journal of International Scientific Publication: Economy & Business, Volume 6, Part 4
ISSN 1313-2555, Published at: http://www.scientific-publications.net
157 Published by Info Invest, Bulgaria, www.sciencebg.net
No author 2005b, Mittelstand vernachlässigt Finanzplanung. In Handelsblatt vom 21.03.2005. onlinein the internet unter: http://www.handelsblatt.com/pshb?fn=relhbi&sfn=hh_news_text&iID=1009707,retrieval day: 22.02.2011.
No author 2010a, Daimler schreibt Milliardenverlust. online in the internet under:http://www.spiegel.de/wirtschaft/0,1518,638983,00.html, retrieval day: 18.02.2011.
No author 2010, Aldi macht weiter dicke Gewinne. Online in the internet under:http://www.derhandel.de/news/unternehmen/pages/Aldi-macht-weiter-dicke-Gewinne_5708.html,retrieval day: 18.02.2011.
Rieger, A. 2007, Die Hanseprinzipien – Ein Schlüssel zu wirtschaftlichen Erfolg. In Economics VScientific Papers University of Latvia (Ed.), Volume 702, pp. 406-417. Riga: Raksti.
Trigeorgis, L. 1999, Real Options: A Primer. In: J. Alleman & E. Noam, E. (Ed.), The newinvestment theory of real options and ist implication for telecommunications economies, pp. 3-33.Boston: Kluwer.

Journal of International Scientific Publication: Economy & Business, Volume 6, Part 4
ISSN 1313-2555, Published at: http://www.scientific-publications.net
158 Published by Info Invest, Bulgaria, www.sciencebg.net
HUMAN CAPITAL AS THE SOURCE OF COMPETITIVENESS
OF FOOD INDUSTRY ENTERPRISESMa gorzata Juchniewicz
Chair of Economics of Enterprises, Faculty of Economic Sciences,
University of Warmia and Mazury in Olsztyn, 10-089 Olsztyn, ul. Oczapowskiego 4
E-mail: [email protected]
Abstract
Human capital is regarded as an essential factor in economic growth and competitiveness ofeconomies. The positive relationship between human capital and improving the competitivenessoccurs particularly in the center. In this study, therefore, attention has been paid to the importance ofhuman capital in shaping the competitiveness of the food industry in Poland. The analysis shows thatcompanies with foreign capital more efficiently, compared to companies with Polish capital use ofemployees and are more competitive. The overall improvement in the efficiency of human capital inthe last decade shows the steady growth rate of labor productivity in the food industry enterprises.
Key words: human capital, competitiveness, food industry
1. INTRODUCTION
Competitiveness of enterprises is tightly linked to the change of the paradigm of economy based onproduction into the paradigm of knowledge-based economy. Powell and Snellman (2004, p.201) saysthat the position of material resources (particularly raw materials) is substituted by knowledge. Theknowledge does not possess material nature, but it applies to the people and their creativity andentrepreneurship based on innovation. As a consequence of the above, the role of innovation andinnovativeness as the base for building competitiveness of enterprises is increasing. This is confirmedby the studies by Barsh J. et al. (2008, pp.37-46) indicating that the highest-level managers believethat in the nearest future innovation will be one of the major growth factors for enterprises.
Schumpeter (1960, p.104) introduced the notion of innovation to the economic sciences for good.That author formulated five definitions for understanding innovation as new combinations of differentnatural components and productive power of man, that is development of a new product or floating tothe market products possessing new characteristics, introduction of a new production method, openingof a new sales market, obtaining a new source of raw materials, implementation of new organizationof some industry, e.g. establishment of a monopoly or liquidation of it.
Contemporary definitions of innovation, however, assign more importance to information andknowledge in innovative activities. For example, in the Polish Government document “Direction ofincreasing innovativeness of the economy during the years 2007-2013” (2006, p.6), innovation isdefined as the ability and motivation of entrepreneurs for continuous search for and use in practice ofthe results of scientific research and research and development works, new concepts, ideas andinventions. In the strategy "Europe 2020" the first of three key priorities is "smart growth" that is,basing economic development on knowledge and innovation. As a consequence, human capital playthe key role in the innovative activities of enterprises.

Journal of International Scientific Publication: Economy & Business, Volume 6, Part 4
ISSN 1313-2555, Published at: http://www.scientific-publications.net
159 Published by Info Invest, Bulgaria, www.sciencebg.net
The concept of human capital was introduced by William Petty (1690) in the fifteenth century. Aparticularly intense period of research on human capital was recorded in the 60 twentieth century,through the work of Mincer (1958, pp.281-302), Schultz (1961, pp.1-17) and Becker (1964). Moderntheories of economic growth also treat human capital as an important determinant of economicdevelopment and competitiveness. Human capital is associated with level of education or morebroadly to a set of qualifications, acquired in the course of work. According to the OECD definition ofhuman capital, it is the knowledge, skills, competencies and attributes embodied in a person tofacilitate the creation of individual, social and economic welfare (Keeley, 2007, p.29). Widerrecognition of human capital presents Zió kowski (2006, pp.17-18), according to which the generalassets of the entity to enable improvement or maintenance of its position in different systems, not onlyeconomic but also social, cultural or political. These assets enable different interests, values and goals.Sopi ska (2010, p 84) indicates that a common feature of intellectual capital, irrespective of theaccepted criteria for classification and aggregation, is the creation of knowledge by both individualemployees and by teams of people. The author is referring to the complementary relationship betweenknowledge and human capital. Knowledge resources, creating intellectual capital, are both input andoutcome of the process of creating knowledge in the enterprise.
2. KNOWLEDGE IN BUILDING INNOVATIVENESS AND COMPETITIVENESS OFENTERPRISES
The new theory of growth forms the theoretical concept of the innovative system. Romer (2000,pp.149-169) says that endogenous technical progress is the basic factor influencing economic growthaccording to it. In endogenous theories the employees are treated as the element capable of influencingand creating changes in the production process. As a consequence, human capital and knowledge aswell as the employees’ learning process are assigned an immense role in the productivity increase(Gawlikowska-Heuckel, 2002, p.63). On the other hand, it is said that endogenous progress is theresult of the investments made by enterprises in research and development, i.e. the investments tightlylinked to the level of education and knowledge of the employees. It is worth noticing the fact that theissue of knowledge in the enterprise is in most cases situated in two areas: innovation and personalpolicy. In the area of personal policy the issue of knowledge, however, cannot be treated only as anarrowly understood education of employees, i.e. as mainly adjustment of their qualifications to newtechnologies. The contemporary problem of knowledge as the factor determining innovation andcompetition is seen in a wider and more comprehensive way (Tuziak, Tuziak, 2004, pp.513-527).Niedzielski and Rychlik (2006, p.51) say that according to the model of spiral innovation process (fig.1) both competitive advantage and innovativeness are the results of enterprise activities (itsdevelopment).
In that context it is worth noticing, as indicated by Pytel and Strzelecka (2008, p.509), that knowledgeis considered as the intellectual capital that should form the base for organizational values. Then,managing knowledge is a process encompassing also cultural values, which are linked to knowledgesharing and values of the enterprises. According to Selvarajan et.al. (2007, pp.1456-1470) the besthuman resources management practices should be focused on growth of employees’ empowermentbecause then they can be the stimulus for business innovation increase. It seems particularly importantin the new, open model of innovation, which is based first of all on exchange of knowledge, bothinternal and external.
Assuming knowledge for the determining factor of innovation and competitiveness of enterprisesPocztowski (2007) draws attention to the fact that employees should also be the “employees of
Journal of International Scientific Publication: Economy & Business, Volume 6, Part 4
ISSN 1313-2555, Published at: http://www.scientific-publications.net
160 Published by Info Invest, Bulgaria, www.sciencebg.net
knowledge”. In the innovative activity determining gaining competitive advantage by the enterprise,employees of that type play the most important role. Davenport (2007) says that those are the peoplerepresenting high level of specialist knowledge, education and experience. Additionally the majorgoals of their work include creation, proliferation and practical utilization of knowledge. Abstractivethinking and low level of routine also characterize them. They possess the internal need for updatingthe knowledge, they report the need for autonomy, trust, evaluation of work, the need to understandthe context, the need of learning through experience, they are aware of the necessity of exchangingtheir thoughts with experts. Employees of knowledge, however, in most cases are people in shortsupply in the labor market. Skrzypek (2009, p.145) also adds that in case of employing an averageemployee an important role is played by the enterprise organizational culture. He points out that if theenterprise has highly elaborate organizational culture, it allows the employee increasing competencesin the field of creativity and entrepreneurship. By the same, it contributes to improvement of thesituation in the enterprise as frequently the level of advancement of the skills in creativity andstrengthening the entrepreneurial attitudes determine the success of the organization.
Developing creativity influences creative thinking and acting, which translates usually intocompetitiveness and innovation. It is even said straight forward about innovation focused organizationculture (Spo eczne…2007). In such an enterprise the employees are generally characterized by criticalattitude to limiting formal rules and they do not support rigidly determined frameworks of operation.This means they show characteristics of knowledge employees. That critical attitude to formalizationcreates bases for creativity of employees representing an important component in winning thecompetitive position. Creative thinking is not limited to the analysis of market needs and adjustment ofown products/services to them. It is understood as creating the needs and formulating trends.Innovative organization culture favors such forms of creativity among employees that also express inthe forms of promotion of enterprise image, new operational patterns, creating original solutions ofproblems hindering work or active search for and obtaining of possibilities of financing theinnovations from various sources.
In enterprises there are many methods for proliferation of knowledge among the employees. In case ofthe methods for creating knowledge we can talk about the so-called knowledge, both obscure andevident, transfer. That first knowledge is aggregated in individual individuals in the form of education,qualifications – which can be generally referred to as competences. Karwowski (2004, pp.6-8) saysthat its transfer is not simple and that knowledge should be managed carefully so that it does not “fallinto the unauthorized hands”. It is difficult to capture and copy by others. The evident knowledgeconsists of databases, strategies, procedures, reports and instructions that can be easily copied byothers. This type of knowledge is maintained, easily transferred to other units, common and itstransport is simple.

Journal of International Scientific Publication: Economy & Business, Volume 6, Part 4
ISSN 1313-2555, Published at: http://www.scientific-publications.net
161 Published by Info Invest, Bulgaria, www.sciencebg.net
Fig. 1. Spiral model of innovation process
Source: Pytel M., Strzelecka A. 2008. Knowledge management in the aspect of creation of workpotential of an enterprise of the 21st century, [w:] Management 2008 in Times of Global Change and
Uncertainty, University of Presov, Presov Slovakia, p. 509.
COMPETITIVE ADVANTAGES
EXTERNAL ENVIRONMENT
INTERNAL ENVIRONMENT
LEARNINGPROCESS
INNOVATIONPROCESS
INNOVATIONPROCESS
LEARNINGPROCESS
CREATINGKNOWLEDGE
CREATINGKNOWLEDGE
INN
OV
ATIV
ESTR
ENG
HT

Journal of International Scientific Publication: Economy & Business, Volume 6, Part 4
ISSN 1313-2555, Published at: http://www.scientific-publications.net
162 Published by Info Invest, Bulgaria, www.sciencebg.net
Numerous studies have been conducted on methods of creating and expanding knowledge. Zwoli ska-Ligaj (2005, pp.672-685) confirmed that in the group of entrepreneurs covered slightly more than ahalf tried to improve their qualifications in enterprise management on current bases. The forms theyapplied in upgrading their skills were highly diversified. Nevertheless a group has formed of suchforms that were used the most frequently – it included studying of professional literature, participationin industry trainings or courses on changes in legal regulations. It can be noticed that the first of themethods for obtaining knowledge depends to a significant extent on the individual char5acteristics of agiven individual while the others can result to a wider extent from the decisions of the third parties,e.g. managers. Unfortunately among the organizations covered only fewer than 10% of theentrepreneurs saw the necessity for organizing training for lower and higher level employees. Theresults of other studies conducted among Polish entrepreneurs confirm that training courses representthe most frequently applied form of knowledge building. They can assume different forms. One ofthem is providing training within the company and by the people employed in it. External trainingcourses (frequently commercial), as a consequence requiring allocation of larger funds, representanother form. In the innovative activities, as indicated by the studies by Koszarek et al. (2008 pp.40)those were external training programs during which more experienced persons conveying knowledgeto new employees training them in performance of functions transferred to them. This for sure is amore economic form of conducting training.
Enterprises less frequently invested in external training of commercial character. Using paid trainingalways involves high costs (representing a particularly large burden for micro enterprises) and mostfrequently entrepreneurs opted for incurring such expenditures only when acquiring certain skills wasrequired by the situation – legal regulations or implementation of a new technology. Some of theenterprises indicated participation in free off charge training programs organized by manufacturers ofequipment and materials interested in pushing their products. The respondents pointed at the limitedoffer of commercial training programs and of those subsidized from public funds. They are often oflow specialization character (e.g. foreign language education, computer operation). Another weaknessof training courses is that those providing specialist knowledge are organized by few entities in Poland– participation in them would require additional costs in the form of expenditures for transport andwould limit the scale of enterprise operations because of the employees who participating in trainingwould have to be absent from work temporarily.
It is worth adding that with the development of ITC technology utilization e-learning is becoming anincreasingly popular method applied for training courses. According to the estimates by the GartnerGroup10 even up to 75% of expenditures on knowledge management are expenditures on computerhardware and software as well as communication infrastructure while just 25% are devoted todevelopment of soft aspects of knowledge management. Distant teaching, by securing uniformdidactic process builds not only uniform knowledge and skills but also uniform standards of corporatebehaviors or communication, which has significant influence on organization culture or, e.g. uniformcustomer service standards even in territorially scattered organizations. Remote teaching representsalso one of the best developed communication environments securing, thanks to high technologies,contacts that are both personal and group bases increasing the level of knowledge of the employees.
10 www.asseccobs.pl

Journal of International Scientific Publication: Economy & Business, Volume 6, Part 4
ISSN 1313-2555, Published at: http://www.scientific-publications.net
163 Published by Info Invest, Bulgaria, www.sciencebg.net
3. HUMAN CAPITAL IN DEVELOPING COMPETITIVENESS OF FOOD INDUSTRYENTERPRISES
Structural determinant of the economy of the European Union countries, including Polish, is a veryimportant food industry. The EU food and drink manufacturing sector is the largest (in 2009 accountedfor 12.9% of the turnover of the sector) and a leading employer (employing 13.5% of those working inindustrial enterprises). Another factor determining the importance of the food industry in the EU is itsleading position in international trade - share of world food exports of these countries was 18.6%, theyare also a leader in the export of highly processed foods (Supporting ... 2011, p.5).
Similar importance of food industry in the national economy takes place in Poland. The value ofindustry sales in 2009 amounted to 17% of total sales of industrial enterprises and the employment ofnearly 420 thousand. people, decided on the employment of about 18% of employees of industrialenterprises in the country. According to Szczepaniak (2011, pp.13-14) the value of food trade in 2010increased by almost 20%, which exports to unprecedented levels of 13.5 billion euros and imports to10.9 billion euros. The food industry, as a stable employer, a manufacturer and exporter, is therefore akey economic sector in many European countries. Consequently, the potential and competitiveposition of food and drink sector has a substantial impact on the international competitiveness ofindustrial enterprises. The basis for sustained competitiveness of the sector should and can createhuman capital.
Human capital is one of three components of intellectual capital, which also includes market capitaland organizational capital. Market capital of the enterprise means its market focus, i.e. the ability tosatisfy the needs and expectations of consumers. This involves, among others, identification of salesand supply markets needs, market segmentation and the choice of the market niche resulting from it,satisfying the needs of the selected market segment, flexible reacting to changes in clients’ needs,offering the consumers the products with preferred by them relation of price to quality, brand buildingand promotion system development.
Organizational capital, frequently underestimated, is the source of competitive advantage. It isrepresented by rationalization of the enterprise organization process. That process involves settingappropriate targets and tasks to be carried out, choice of means and objects of work (machines,devices, raw materials and materials, information). Coordination of attainment of the selected targetsat all levels of enterprise operation represents a very important component of that process. Acceleratedchanges in the environment of the enterprise cause that managers must skillfully transform andrestructure the resources available in the future competitive potential. This also covers changes inorganization of the enterprise towards its streamlining and improvement. It is worth highlighting that,as indicated by the studies by Neilson et al. (2009), organizations achieving success had carried outrestructuring changes in the field of streamlining the decisions and flows of information within thefirst step. Importance of those factors is confirmed by studies conducted among Polish managers,which attribute key importance to internal communication limiting stresses within the organization(Grzebiech, 2009). The components of intellectual capital specified are undoubtedly linked directly tothe human capital, which determines them.
Human capital encompasses, among others, employing employees with appropriate competences,making the payroll levels dependent on the results of work, systematic improvement of competencesof the employees, creating opportunities for development and advancement. Pointing at the change inthe paradigm of approach to the employees, Puli (2004) concludes that shifting the employees fromthe “costs” to the “investments” represents almost Copernican breakthrough in the economic relationsconcerning creating value, and by the same building lasting competitive advantage. Competences of

Journal of International Scientific Publication: Economy & Business, Volume 6, Part 4
ISSN 1313-2555, Published at: http://www.scientific-publications.net
164 Published by Info Invest, Bulgaria, www.sciencebg.net
employees are defined in the management literature very frequently and in different ways because theyare subject of interest to researchers representing numerous scientific disciplines. The most frequentlylisted components of employees’ competences are still the knowledge, skills (talents), personalcharacteristics, attitudes, behaviors and experience (Walkowiak, 2004).
Education is one of the components of knowledge. It belongs to the so-called hard competences, i.e.competences that refer to the areas of work in which a given individual is competent, which meansthat the individual satisfies the expectations concerning the effects of work performed. “Hard”competences also mean the ability of applying the knowledge held to various aspects of the workperformed for the purpose of obtaining the required effects (Armstrong, 2011).
The level of education of employees has direct influence on the effects of operations of a food industryenterprise. In the enterprises that are more advanced technologically and produce more processes foodproducts the level of education of the employees is higher than in the other enterprises (Szczepaniak2005, pp. 27-37). Manufacturers of finished products employed the largest proportion of people withtertiary and secondary education, more specialists in marketing and quality systems or in state of theart production technologies, information sciences, food hygiene and safety. High level of humancapital was one of the factors in undertaking effective innovation activities – all the enterprisesdeclared introduction of technological innovations in the form of new technologies of processing theproducts, new technologies of secondary processing, new methods of confectioning and packaging ofproducts during the recent years. Manufacturers of finished goods also implemented the highestnumbers of changes streamlining the organizational structures. Those activities were reflected in theincrease in labor productivity and profitability of production as well as in improvement of the currentfinancial liquidity, which improved their competitiveness in the market. Szczepaniak (2008, pp. 131-159) points out, however, at unfavorable phenomena increasing the gap in the level of competence ofintellectual capital between the domestic entities and the transnational corporations. Transnationalcorporations operate in food industry as a very important source of competition and they considerintellectual capital development, in particular human capital, to represent highly important target.Chechelski (2008, p.210) points out that modern human resources management in transnationalcorporations caused that those enterprises use the employees much more effectively compared to thecompanies with Polish capital and are more competitive. Higher wages and development opportunitiesin transnational corporations additionally cause outflow of people with higher qualification fromdomestic companies to them and as a result unfavorable widening of the gap in management betweenthose two groups. Noticing the importance of human capital as the source of competitive advantage bytransnational corporations causes that sectors of food industry dominated by global corporations aremore competitive in the international market. Domestic companies still use their price advantage butcompeting on price comes to the end and is highly susceptible as the base for competing. In theprocess of competition an increasing role is played by establishing the obscure for the competitor(intangible) resources assuring ling-term competitive advantage. Here we can include the intellectualcapital, which the domestic food producers should consider more and more in searching for thesources of competitiveness. Wiatrak (2005, p.25) formulates even the thesis that the existing status ofdevelopment of the economy, its low innovativeness and ability to compete are the consequences ofinsufficient support with knowledge and intellectual capital.
Increase in importance of human capital, as a factor of competitiveness of Polish food industry wasparticularly visible following Poland’s integration with the European Union. Free access to theEuropean Union market proved favorable for Polish food industry. Accession to the European Unioncaused not only more than 2.5-fold increase in agricultural-food exports but also almost four-foldincrease in the balance of trade (Urban et al., 2010, p.31). European integration not only contributed to
Journal of International Scientific Publication: Economy & Business, Volume 6, Part 4
ISSN 1313-2555, Published at: http://www.scientific-publications.net
165 Published by Info Invest, Bulgaria, www.sciencebg.net
the increase in exports, but it also has not resulted in flooding the Polish market with imported food.Food producers in Poland proved exceptionally active and effective in the markets of other MemberStates and as a consequence strengthened their position in the expanded European market. Thatsignificant increase in foreign trade in agricultural-food products after Poland’s accession to theEuropean Union was influenced, in addition to such obvious reasons as opening the markets andunrestricted trade between Poland and the European Union countries, by good preparation of Polishfood economy for membership in the Union, including the high level of competence of both themanagements and the line employees.
A measure for assessing the human capital may be economic efficiency measured by the value of salesper employee. In the years 2000-2010 has been a systematic increase of this indicator. In 2010, itamounted to 357.0 thousand z and was almost 2-fold higher than 2000 (Mroczek, 2011, p.34).Particularly marked improvement in labor productivity occurred after the Polish accession to the EU.Free trade was therefore one of the driving forces to improve the effectiveness of human capital in thefood industry. It is worth mentioning that the improvement in labor productivity occurred, although ina different scale, in all branches of food industry. Own research (Juchniewicz 2012, pp.62-76) alsoindicate that the rate of change in labor productivity were strongly correlated with the rate of growthof total factor productivity (TFP). This confirms that labor productivity growth was mainly due to theincreased technical equipment of work, or as a result of substitution of labor by capital. However asmaller effect on productivity growth had a "non-investment" technical progress, which confirms thecapital intensive nature of the food industry. Improved labor productivity, associated mainly withbetter equipment in the food industry machinery and equipment, has also been noted in studiesAdamczyk (2008, pp.95-106) and Go asia (2010, pp.30-50).
A significant increase in labor productivity and the level of technical equipment of employed was thebasis for improving the competitive capacity and capabilities of the food industry to compete on theEU market. International comparisons indicate that labor productivity in Poland in 2008, amounting to150.9 thousand. euro, compared with the countries of the former EU-15 is about 50% less. The highestproductivity was recorded in Ireland - 439.9 thousand euro, the Netherlands - 366.7 thousand euro andBelgium - 317.6 thousand euro (Mroczek, 2011, pp.104-105). This indicates the distance that separatesthe food industry in Poland from entities located in these countries. Thus improving the efficiency ofhuman capital in Polish enterprises of food industry is crucial, in terms of increasing the long-termcompetitive potential.
CONCLUSION
Low costs and prices of products offered as well as the increasing awareness in implementation ofcompetition on quality are the source of competitive advantage of Polish food producers. In the long-term perspective the success of the enterprise is, however, dependent to the highest extent, on the levelof human capital, which determines the ability of taking innovation focused actions and establishinglasting competitive advantage. Sectors of food industry dominated by global corporations see muchmore clearly than the domestic enterprises the importance of human capital as the source ofcompetitive advantage creating the bases for higher competitiveness in the international market. Thisshould be the signal to be considered by producers in search for the factors determining thecompetitive advantage of food industry enterprises. As a result, it can contribute to reducing the gapbetween the level of effectiveness of human capital in Poland in comparison with EU leaders.

Journal of International Scientific Publication: Economy & Business, Volume 6, Part 4
ISSN 1313-2555, Published at: http://www.scientific-publications.net
166 Published by Info Invest, Bulgaria, www.sciencebg.net
REFERENCESAdamczyk P., 2008. Produktywno czynników wytwórczych w przemy le spo ywczym w Polsce.Ekonomika i organizacja gospodarki ywno ciowej, Wyd. SGGW, Warszawa, 71, pp. 95-106.Armstrong M., 2011. Zarz dzanie zasobami ludzkimi. Wyd. Wolters Kluwer, Kraków.Barsh J., Capozzi M.M., Davidson J., 2008. Leadership and Innovation. The McKinsey Quarterly, 1,pp.37-46.Becker G.S., 1964. Human capital: a theoretical and empirical analysis, with special reference toeducation. University of Chicago Press.Chechelski P., 2008. Wp yw procesów globalizacji na polski przemys spo ywczy, Studia iMonografie, 145, IERiG -PIB, Warszawa.Davenport T., 2007. Zarz dzanie pracownikami wiedzy. Wyd. Wolters Kluwer, Kraków.Gawlikowska-Heuckel K., 2002. Wzrost gospodarczy a procesy konwergencji i polaryzacjiregionalnej. Wyd. Uniwersytetu Gda skiego, Sopot.Go a Z., 2010. Czynniki kszta tuj ce wydajno pracy w przedsi biorstwach przemys uspo ywczego. Zagadnienia Ekonomiki Rolnej, 4, pp.30-50.Grzebiech A., 2009. Cel biznesowy okre la struktur organizacji. Harvard Business Review, Polska,luty.Juchniewicz M., ukiewska K., 2012. Potencja konkurencyjny przemys u spo ywczego w Polsce.Zagadnienia Ekonomiki Rolnej, 1, pp.62-76.Karwowski W., 2004. Zarz dzanie wiedz . [w:] Bezpiecze stwo pracy, Centralny Instytut OchronyPracy - Pa stwowy Instytut Badawczy, Warszawa, 11: pp.6-8.Keeley B., 2007. Human capital. How what you know shapes your life, OECD, OECD Insights, Parys2007, p.29.Kierunki zwi kszania innowacyjno ci gospodarki na lata 2007-2013, 2006. Ministerstwo GospodarkiDepartament Rozwoju Gospodarki, Warszawa.Koszarek M. Rybacka M., Szultka A., 2008. Badanie innowacyjno ci sektora us ugowego. Raport zbadania. PARP, Warszawa.Mincer J., 1958. Investment in Human Capital and Personal Income Distribution. The Journal ofPolitical Economy, 66 (4), pp.281-302.Mroczek R., 2011. Procesy dostosowawcze polskiego przemys u spo ywczego do zmieniaj cego siotoczenia rynkowego (1). IERiG , Warszawa.Neilson G. L., Martin K. L., Powers E., 2009. Jak z powodzeniem wdro y strategi ? HarvardBusiness Review, Polska.Niedzielski P., Rychlik K., 2006. Innowacje i kreatywno . Wyd. Naukowe Uniwersytetu l skiego,Szczecin.Petty W., 1690. Political Arithmetik. Reprint, 1899. Hull.Pocztowski A., 2007. Zarz dzanie zasobami ludzkimi, PWE Warszawa.Powell W. W., Snellman K., 2004. The knowledge economy. Annual Review of Sociology, StanfordUniversity, t. 30, p.201.Pomykalski. A., 2001. Zarz dzanie innowacjami. Wyd. Naukowe PWN, Warszawa.Puli A., Kapita intelektualny – czy to dzia a?, Rozmowa A. Kowalika z prof. A. Puliciem. CFOMagazyn Finansistów z dnia 1.06.2004 r., www.cfo.cxo.pl/artykuly.

Journal of International Scientific Publication: Economy & Business, Volume 6, Part 4
ISSN 1313-2555, Published at: http://www.scientific-publications.net
167 Published by Info Invest, Bulgaria, www.sciencebg.net
Pytel M., Strzelecka A., 2008. Knowledge management in the aspect of creation of work potential ofan enterprise of the 21st century, [in:] Management 2008 in Times of Global Change and Uncertainty,University of Presov, Presov Slovakia, pp.506-515..Romer D., 2000. Keynesian macroeconomics without the LM curve. Journal of Economic.Perspectives, 14(2), pp.149-169.Schultz T.W., 1961. Investment in Human Capital. The American Economic Review 51(1), pp:1-17.Schumpeter J.A., 1960. Teoria rozwoju gospodarczego. PWN, Warszawa 1960.Selvarajan T. T., Ramamoorthy N. Flood P. C., Guthrie J. P., MacCurtain S., Liu W., 2007. The roleof human capital philosophy in promoting firm innovativeness and performance: test of causal model,The International Journal of Human Resource Management, Sierpie , pp.1456-1470.Skrzypek E., 2009. Wiedza jako czynnik sukcesu w nowej gospodarce. [w]: Skrzypek E., Sokó A.(red.). Zarz dzanie kapita em ludzkim w gospodarce opartej na wiedzy, Instytut Wiedzy i Innowacji,Warszawa.Spo eczne determinanty przedsi biorczo ci innowacyjnej. Raport. 2007. Pentor Research Internationalna zlecenie Polskiej Agencji Rozwoju Przedsi biorczo ci, Warszawa.Supporting the competitiveness of the European food and drink industry. 2011. FooddrinkeuropeCompetitiveness Report, Brussels.Szczepaniak I., 2005. Czynniki i uwarunkowania rozwoju rednich przedsi biorstw przemys uspo ywczego (na przyk adzie przemys u owocowo-warzywnego i mi snego). Rozprawa doktorska,IERiG -PIB, Warszawa.Szczepaniak I., 2008. Kapita intelektualny jako ród o konkurencyjno ci polskiego przemys uspo ywczego. [w:] Szczepaniak I. (red.). Wybrane aspekty konkurencyjno ci polskich producentówywno ci. IERIG -PIB, Warszawa, pp.131-159.
Szczepaniak I. (red)., 2011. Monitoring i ocena konkurencyjno ci polskich producentów ywno ci (1).IERIG , Warszawa.Tuziak B., Tuziak A., 2004. Wiedza i innowacyjno w kulturze organizacyjnej przedsi biorstwa jakosystemu spo ecznego, [w:] Jaremczuk K. (red.). Uwarunkowania przedsi biorczo ci. Pa stwowaWy sza Szko a Zawodowa im. prof. Stanis awa Tarnowskiego, Tarnobrzeg, pp.513-527.Urban R., Szczepaniak I., Mroczek R., 2010. Polski sektor ywno ciowy w pierwszych latachcz onkostwa. IERiG -PIB, Warszawa.Walkowiak R., 2004. Model kompetencji mened erów organizacji samorz dowych. UWM, Olsztyn.Wiatrak A.P., 2005. Wiedza i kapita intelektualny jako ród a nierówno ci gospodarczych ispo ecznych, [w:] M.G. Wo niak (red.). Nierówno ci spo eczne a wzrost gospodarczy. Kapita ludzki iintelektualny, Cz II, Zeszyt 7, Wydawnictwo MITEL, Uniwersytet Rzeszowski, Rzeszów.Zió kowski M., 2006. Przemiany interesów i warto ci spo ecze stwa polskiego. Wyd. FundacjiHumianiora, Pozna . [w:] Szafraniec K. (red.). Kapita ludzki i zasoby spo eczne wsi. Ludzie–spo eczno lokalna–edukacja, IRWiR PAN, Warszawa, pp.17-18.Zwoli ska-Ligaj M. 2005. Uwarunkowania i przejawy aktywno ci innowacyjnej przedsi biorstwzlokalizowanych na obszarach wiejskich – wybrane aspekty, [w:] Adamowicz M. (red). Zarz dzaniewiedz w agrobiznesie w warunkach polskiego cz onkostwa w Unii Europejskiej, Katedra PolitykiAgrarnej i Marketingu, Prace Naukowe, SGGW, Warszawa, 35, pp.672-685.
Journal of International Scientific Publication: Economy & Business, Volume 6, Part 4
ISSN 1313-2555, Published at: http://www.scientific-publications.net
168 Published by Info Invest, Bulgaria, www.sciencebg.net
FINANCIAL LEVERAGE MODELS VERSUS BANKRUPTCY ENTERPRISES
Piotr Masiukiewicz, Mateusz Nowak
Department of Collegium of Business Administration, Warsaw School of Economics
Al. Niepodleg o ci 162, 02-554 Warszawa
Key words: financial leverage, bankruptcy, second chance policy
1. INTRODUCTIONIn the context the recent last financial crisis and its implications for enterprises and banks there hasbeen an increase in the importance of rehabilitation of economic entities; new solutions ofrehabilitation processes are being searched for. In Poland there is an ongoing discussion regarding badlegislation in the field of regulating rehabilitation processes and bankruptcy. “A second chance” froma broad perspective means not only a reengagement of an entrepreneur in a new economic entity afterhis first failure, but also rehabilitation and restructuring of an enterprise facing a threat of bankruptcy –under a rehabilitation process; according to the Polish law there are two types of rehabilitationprocesses, one conducted under the civil law and the second with a court engagement that acts uponLaw on Bankruptcy and Reorganization (“Ustawa prawo upad o ciowe i naprawcze”; u.p.u.n). Thepolicy of “a second chance” is recommended by the European Commission.
In the literature there is no clear definition of the process of an enterprise rehabilitation, in contrast tonumerous definitions of restructuring. The latter cannot be treated as a synonym for rehabilitation, as itis a broader concept; while in the EU documents the name of the restructuring rehabilitation is used. InPolish literature, synonymous to recovery processes are also the concepts of company’s rehabilitationor rehabilitation processes. Briefly, the process of rehabilitation can be defined as the restoration oflong-term solvency.
The thesis of the article is as follows: institutional arrangements to support rehabilitation processes inPoland are inadequate, including a limited availability of financial leverage. Hence, the mostcommonly used procedure is a bankruptcy one.
The process of a company’s recovery is not only a legal procedure, it is also an economic process,management process, and finally also a social process. Hence, it is important to analyze this issue froma broad variety of perspectives.
2. THE COSTS OF BAKRUPCY VERSUS THE POLICY OF “A SECOND CHANCE”
Analyses and publications often stress the need for processes of recovery rather than bankruptcy. Thecosts of the repair process are often lower than these of bankruptcy, but one cannot generalize due tothe different ratios of losses to remaining assets of the company, the cost of access to capital, etc.Undoubtedly, bankruptcy entails a number of social costs; there are severe consequences forcustomers.
Considering the costs of bankruptcy one should consider two accounting dimensions, namely:

Journal of International Scientific Publication: Economy & Business, Volume 6, Part 4
ISSN 1313-2555, Published at: http://www.scientific-publications.net
169 Published by Info Invest, Bulgaria, www.sciencebg.net
1 / operational costs of an administrative receiver,
2 / social costs of bankruptcy.
In literature different approaches to the classification of the social costs of bankruptcy are used. Moststress the consequences for households and small and medium sized businesses.
E. Altman divide costs arising from the financial difficulties of enterprises into direct and indirectones. This author stresses the "sometimes considerable direct costs incurred by the debtor due toexternal legal services, accounting, consulting as well as internal legal costs."(Altman 2007, p.48) Thecost of experts may be a burden. Fees paid to consultants working on the bankruptcy of Enronprobably exceeded $ 1 billion. (Altman 2007, p. 79) Altman includes in the indirect costs all profitsthat were lost or not achieved; for example, many companies encounter a drop in sales and revenue,because customers do not want to pursue a transaction with a company in crisis. (Altman 2007, p. 80)A company in crisis is also exposed to additional costs such as higher interest rates on loans andcredits.
The evaluation of a complete and fair account of such costs is very difficult and most items can onlybe based on estimation.
“A second chance” from a broad perspective means not only a reengagement of an entrepreneur in anew economic entity after his first failure, but also rehabilitation and restructuring of an enterprisefacing a threat of bankruptcy – realised under a rehabilitation process.
New EU regulations and institutional arrangements are neither implemented nor popularized inPoland. The European Commission approach to bankruptcy cases can be considered revolutionary,because bankruptcy is to be a last resort if all forms aid for entrepreneurs have been exhausted.Moreover, despite bankruptcy, the entrepreneur should - with the support of various institutions have asecond chance - a chance to re-operate.
Basic legal and advisory instruments established by the EU are set out in the following documents:
· Communication from the Commission to the Council, the European Parliament, EuropeanEconomic and Social Committee and the Committee for the Regions "Overcoming the stigma ofbusiness failure - for a second chance"(Komisja Wspólnot Europejskich, 2007),
· "Community guidelines on State aid for rescuing and restructuring firms in difficulty " (KomisjaWspólnot Europejskich, 2004),
· The Directive of the European Parliament and the Council on the reorganization and winding up ofcredit institutions (Directive 2001/24/WE).
Furthermore, in many countries in the EU there operates a network supporting processes of enterpriserehabilitation - Enterprise Europe Network. EEN is an extensive network (numbering 600organizations and four thousand consultants) providing among others information and advice tocompanies facing bankruptcy and entrepreneurs who survived bankruptcy and decide to start abusiness again.
The European Commission believes that a more supportive environment for businesses at risk ofbankruptcy can prevent their failure. Highlighting the problem of negative effects of business failureand its negative reception by society would help to make the best of human creativity in Europe,encourage entrepreneurship and promote innovation and job creation. (Komisja WspólnotEuropejskich, 2007)

Journal of International Scientific Publication: Economy & Business, Volume 6, Part 4
ISSN 1313-2555, Published at: http://www.scientific-publications.net
170 Published by Info Invest, Bulgaria, www.sciencebg.net
In the guidelines of the European Commission the definition of a firm in difficulty was formulated andit is very broad. (Komisja Wspólnot Europejskich, 2004) Before, European definition of companiesthreatened with bankruptcy did not exist, however for the purpose of the Guidelines for the EuropeanCommission - it was established that a business is threatened, if it is unable, whether through its ownresources, or with the funds it is able to obtain from its owners (shareholders) or creditors, to stemlosses which, without outside intervention by the public authorities, will almost certainly condemn itto going out of business in the short or medium term.
Even when conditions listed above are not met, the company may be considered at risk, particularlywhen there are usual signs, such as increasing losses, diminishing turnover, growing inventory, unsoldexcess capacity, declining cash flow, mounting debt, rising interest charges and falling or nil net assetvalue. (Komisja Wspólnot Europejskich, 2004)
In the light of the Guidelines cited a newly created firm is not eligible for state aid for rescuing andrestructuring, even if its initial financial position is precarious.
In Poland, the number of bankruptcies is relatively small; however there is a large percentage ofcompanies going bankrupt without undergoing bankruptcy proceedings (due to lack of funds) and thenumber of procedures of enterprise recovery is very small. (M czy ska 2010, p. 435-446) This isprobably the implication of poor design of insolvency proceedings in Law on Bankruptcy andReorganization and the lack of sufficient leverage to support the process of company recovery.(Masiukiewicz, 2010)
3. INSTRUMENTS TO SUPPORT PROCESSES OF ENTERPRISE RECOVERY
Restrictions on the decision-making in a company pursuing a process of recovery occur in these areas(M czy ska, 2010) (Masiukiewicz, 2010):
· legal restrictions,· restrictions on access to financing current operations,· recommendations and expectations of owners,· adverse changes in the behavior of customers and suppliers,· time pressure (resulting in the need for quick and sometimes intuitive decisions),· disclosing false information and creative financial reporting,· high-risk operating conditions,· adverse changes in economic environment.
In practice of recovery action, there are many decision-making dilemmas (Masiukiewicz, 2011),among others:
· the dilemma of information sincerity versus the imperative of company rehabilitation,· the dilemma of social responsibility versus additional profit,· the dilemma of fair reward versus the primacy of the cost-cutting approach,· the dilemma of corporate social responsibility versus efficiency of operations, and others.
In these situations, there is a typical manager's dilemma; one has to choose between an effectivebusiness without ethics and ethics without a business. When considering the above matters the boardsof companies usually stand alone, taking into account that hiring a consulting firm of a companydoctor kind is expensive. It is particularly important to provide periodic financial assistance for thebankrupt company that has a chance to get out of trouble. (Altman, 2007), (Masiukiewicz, 2010)

Journal of International Scientific Publication: Economy & Business, Volume 6, Part 4
ISSN 1313-2555, Published at: http://www.scientific-publications.net
171 Published by Info Invest, Bulgaria, www.sciencebg.net
3.1 Bank support tools
In most cases, the role of a bank financing the company in the process of reorganization is crucial.Generally, without the help of the bank restructuring and rehabilitation of a company has little chanceof success. It can therefore be assumed that in almost every case a bankrupt company needs financialsupport for the program of recovery.
The bank that is cooperating with the company may also use different strategies to deal with situationsof a crisis on the client’s need for a process of recovery. In practice, there are four possibilities:(Masiukiewicz, 2011)
· placing immediate maturities of the loan status and their recovery (as a consequence, this maymean acceleration of bankruptcy),
· passive role in the process of recovery; incidental action taking (such as temporary suspension ofinterest payments, the exchange of information with other lenders to the company, sale of theliabilities to another bank, etc.),
· active participation in the restructuring of the company and exploiting of a range of financialinstruments and organizational tools,
· refraining from any action, waiting for developments.
From the standpoint of the efficiency of the process of recovery, what is the most desirable is theactive role of the bank. It has at its disposal a variety of financial instruments to support the process(Masiukiewicz, 2011), i.e.:
· continuation of restructuring of hitherto debt (debt conversion, partial redemption of the debtinstallments, re-negotiation of installments burdens, securitization, and others),
· granting the company another loan,· consolidation of loans and advances from other banks,· requesting participation in the meetings of the board and general meetings,· the contractual debt guarantee by strategic shareholders, secured on the shares,· consulting on financial restructuring.·
Table 8. Examples of bank actions toward a company's debt restructuring
Type ofliability
Conversionof overdue
debt into newcapital
Remission Securitization
Prolongingthe maturityof the debt
Lowering theintrest rates orcommisions
Foreclosure ofsome assets inexchange forunpaid debt
Principial + + + + - +
Interest + + - - + +
Commissions - + - + + -
Source: the author’s research based on the analysis of operations of banks sanitised by receivership inthe following banks: Bank Cz stochowa S.A., Bank Spo em S.A., Bank Wschodni S.A., BankPrzemys owy S.A.
When implementing a restructuring model, various techniques of changing credit conditions are used(Table 8). They all must, of course take into account, the capabilities of the client; especially those that
Journal of International Scientific Publication: Economy & Business, Volume 6, Part 4
ISSN 1313-2555, Published at: http://www.scientific-publications.net
172 Published by Info Invest, Bulgaria, www.sciencebg.net
derive from cash flow projections. There were cases when the bank had to renegotiate the terms ofrestructuring when the situation of the customer did not improve.
Typically, an important issue for the customer is the reduction of interest charges. For example, theIndustrial Bank SA in Lodz (Bank Przemys owy SA w odzi) in almost 56% of cases has loweredinterest rates or even forgone the interest temporarily (the variant used, among others when the loss ofvalue of the loan collateral occurred) for the benefit of their customers.
Tax provisions including any waivers as a taxable income of the enterprise constitute a significantobstacle to debt restructuring; tax law requires urgent changes.
3.2. Other support institutions
Besides banks, there are a number of institutions that can and should support the processes ofenterprise rehabilitation. Unfortunately, the key institutions supporting entrepreneurship in Polandmainly deal with healthy businesses. Polish Agency for Enterprise Development (Polska AgencjaRozwoju Przedsi biorczo ci), Industrial Development Agency (Agencja Rozwoju Przemys u), theNational Economy Bank (Bank Gospodarstwa Krajowego), the Chamber of Small and MediumEnterprises (Izba Ma ych i rednich Przedsi biorstw) and others, have the potential, which in partcould be used in the processes of rehabilitation in the economy. Guarantees funds, both the state one(administrated by Bank Gospodarstwa Krajowego) as well as regional ones are only interested indealing with successful businesses.
In Poland there is no developed structure of consulting firms - company doctors, which would supportrecovery programs. And there is no national restructuring fund, which together with the bank wouldprovide financing in a form of “the survival capital” for companies in crisis. A small fund supportingthe processes of bankruptcy, which is at the disposal of the a Minister of the Treasury - does not solvethe problems.
Tax authorities have an important role in the restructuring process, but usually their policy is toimmediately recover the taxes. Polish tax legislation does not expressis verbis provide for taxexemptions for businesses (as well as financial institutions) implementing programs of recovery.However, the legislature ensured a way of escape, which is very little known and rarely used. Namely,if a company is threatened by bankruptcy, and received an order for enforcement of tax arrears and itsrequest for their redemption was rejected, it may request a suspension of implementation of thedecision claiming that it is in companies major interest to do so.
The goal of prohibiting the implementation of the tax (Article 224 & 2 Polish Tax Act) is thetemporary protection of the taxpayer against the decision he challenges until its final verification. Inthe past, some tax authorities, unfortunately, felt that it depends solely on their discretion to grant sucha postponement. Fortunately, the tax authority is now obliged to suspend the implementation ofdecisions not only at the direct request of the taxpayer, but it can also do this ex officio - if only it is inan important interest of the taxpayer or the public interest.
In 2008 an entrepreneur was refused to suspension of the implementation of the tax. The taxpayer inthe application demonstrated a substantial interest, which was the risk of a loss of financial liquidityand the market in which he was operating and even a threat to the existence of his family. However,the tax office did not agree to suspend the decision - on grounds, namely that the suspension of thedecision depends on administrative discretion of the tax office. In addition, Tax Chamber confirmedthe correctness of this reasoning. ( abno, 2008) However, Regional Administrative Court in Krakowruled on the subject that if the conditions of an important interest of the taxpayer or the public interest
Journal of International Scientific Publication: Economy & Business, Volume 6, Part 4
ISSN 1313-2555, Published at: http://www.scientific-publications.net
173 Published by Info Invest, Bulgaria, www.sciencebg.net
are fulfilled a tax authority is obliged to suspend the implementation of the decision. For example, aninterest must be equivalent to the probability of cessation of business operations due to loss ofliquidity.
Unfortunately, despite such a state of the law, certain tax authorities continue to claim a right todiscretion to withhold the payment of the tax due, even if the facts regarding the matter are clearly infavor of stopping the execution. (Masiukiewicz, 2010)
4. EVALUATION OF THE EFFECTIVENESS AND EFFICIENCY OF FINANCIALLEVEAGE MODELSThe management of the company’s finances is driven by the desire to obtain long-term liquidity -ensuring solvency. Hence, there is a need for effective management of current assets, which affects theformation of long-term assets and ensures the development and therefore an increase in shareholdervalue. (Krajewski, 2010) Diligent studies not only help companies find the causes of troubles but alsoenable the design of future activities in the recovery program and become a planning tool. Liquiditymanagement (its level is sometimes more important than the profit itself) must be based on continuousmonitoring of changes and forecasting.
The selection of a method of the process of recovery, based on a certain financial leverage, should bepreceded by an analysis of the effectiveness. The analysis of the options of the effectiveness ofrehabilitation process (and subsequently the analysis of deviations from the plan duringimplementation) should be performed based on a set of carefully selected financial measures. Inaddition to traditional measures such as ROA, ROE, return on cost, level of equity and debt, carry-forward losses one can apply additional specific measures of assessment which are shown below.
A basic method in this regard is the comparative analysis of the cash flow for various regulatorypathways estimated in the recovery program – by means of DCF. Discounted cash flow model (DCF)used for the selection of a rehabilitation process, can be described as follows:
Where:
ZWNPFn – discounted net value of cash flow estimation for method n,
NCFt – net cash flows for the year t of the estimation,
T – number of years of estimation,
D – discount rate,
N – number of rehabilitation method.
Source: The authors‘ own research
A comparative study, answering the question which method gives the maximum surplus of ZWNPF –requires defining the number of years when the leverage will be used, the discount rate d, and finallydefining a cash flow forecast.
m
tt
tn d
NCFZWNPF
1 )1(
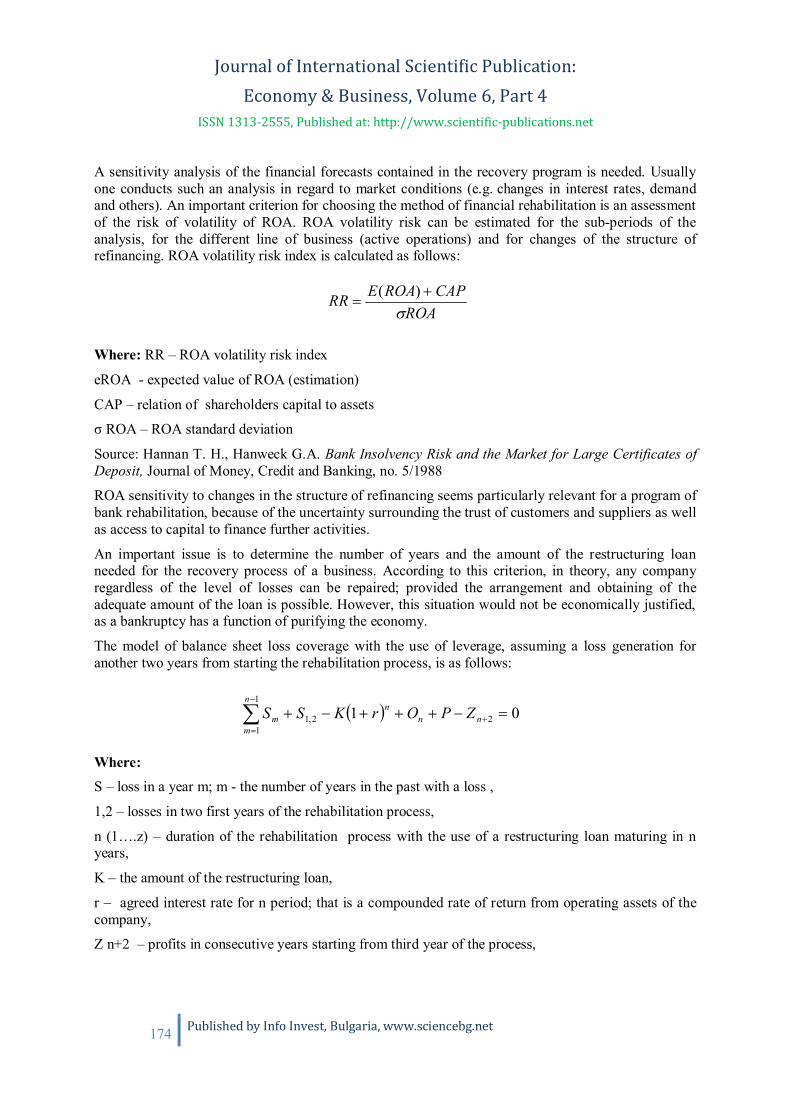
Journal of International Scientific Publication: Economy & Business, Volume 6, Part 4
ISSN 1313-2555, Published at: http://www.scientific-publications.net
174 Published by Info Invest, Bulgaria, www.sciencebg.net
A sensitivity analysis of the financial forecasts contained in the recovery program is needed. Usuallyone conducts such an analysis in regard to market conditions (e.g. changes in interest rates, demandand others). An important criterion for choosing the method of financial rehabilitation is an assessmentof the risk of volatility of ROA. ROA volatility risk can be estimated for the sub-periods of theanalysis, for the different line of business (active operations) and for changes of the structure ofrefinancing. ROA volatility risk index is calculated as follows:
Where: RR – ROA volatility risk index
eROA - expected value of ROA (estimation)
CAP – relation of shareholders capital to assets
ROA – ROA standard deviation
Source: Hannan T. H., Hanweck G.A. Bank Insolvency Risk and the Market for Large Certificates ofDeposit, Journal of Money, Credit and Banking, no. 5/1988
ROA sensitivity to changes in the structure of refinancing seems particularly relevant for a program ofbank rehabilitation, because of the uncertainty surrounding the trust of customers and suppliers as wellas access to capital to finance further activities.
An important issue is to determine the number of years and the amount of the restructuring loanneeded for the recovery process of a business. According to this criterion, in theory, any companyregardless of the level of losses can be repaired; provided the arrangement and obtaining of theadequate amount of the loan is possible. However, this situation would not be economically justified,as a bankruptcy has a function of purifying the economy.
The model of balance sheet loss coverage with the use of leverage, assuming a loss generation foranother two years from starting the rehabilitation process, is as follows:
Where:S – loss in a year m; m - the number of years in the past with a loss ,
1,2 – losses in two first years of the rehabilitation process,
n (1….z) – duration of the rehabilitation process with the use of a restructuring loan maturing in nyears,
K – the amount of the restructuring loan,
r – agreed interest rate for n period; that is a compounded rate of return from operating assets of thecompany,
Z n+2 – profits in consecutive years starting from third year of the process,
ROACAPROAERR )(
01 22,1
1
1nn
nn
mm ZPOrKSS
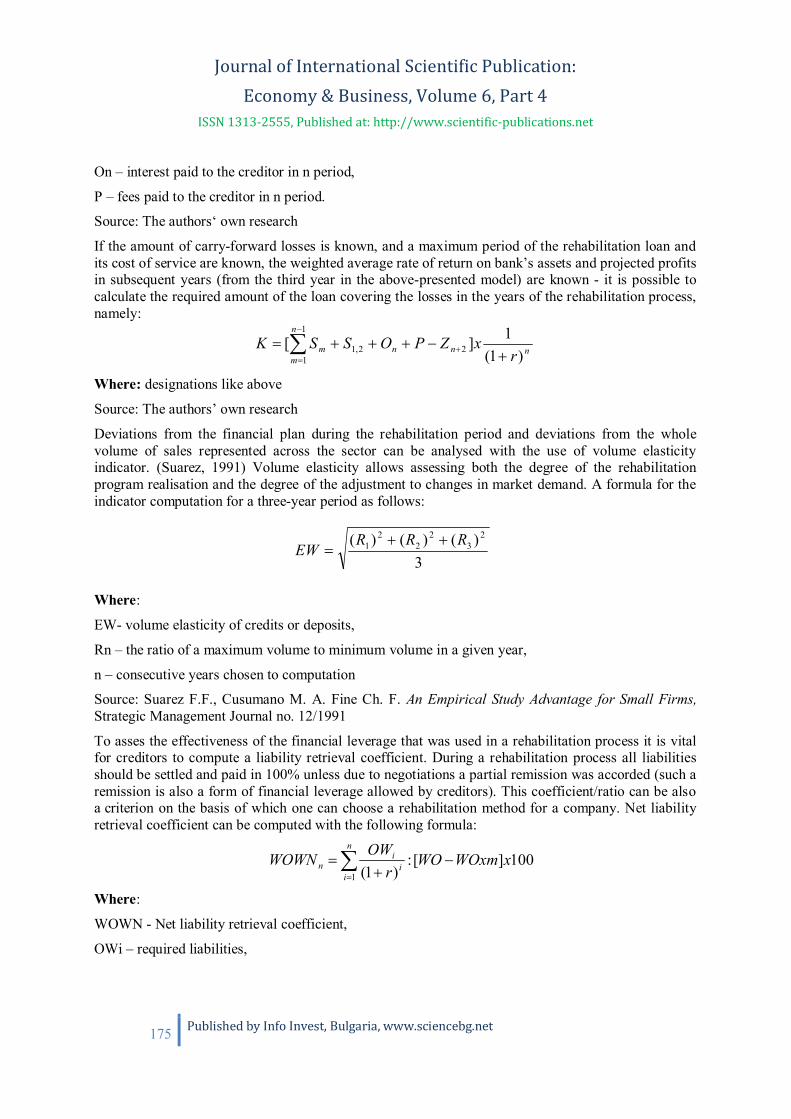
Journal of International Scientific Publication: Economy & Business, Volume 6, Part 4
ISSN 1313-2555, Published at: http://www.scientific-publications.net
175 Published by Info Invest, Bulgaria, www.sciencebg.net
On – interest paid to the creditor in n period,
P – fees paid to the creditor in n period.
Source: The authors‘ own research
If the amount of carry-forward losses is known, and a maximum period of the rehabilitation loan andits cost of service are known, the weighted average rate of return on bank’s assets and projected profitsin subsequent years (from the third year in the above-presented model) are known - it is possible tocalculate the required amount of the loan covering the losses in the years of the rehabilitation process,namely:
Where: designations like above
Source: The authors’ own research
Deviations from the financial plan during the rehabilitation period and deviations from the wholevolume of sales represented across the sector can be analysed with the use of volume elasticityindicator. (Suarez, 1991) Volume elasticity allows assessing both the degree of the rehabilitationprogram realisation and the degree of the adjustment to changes in market demand. A formula for theindicator computation for a three-year period as follows:
Where:
EW- volume elasticity of credits or deposits,
Rn – the ratio of a maximum volume to minimum volume in a given year,
n – consecutive years chosen to computation
Source: Suarez F.F., Cusumano M. A. Fine Ch. F. An Empirical Study Advantage for Small Firms,Strategic Management Journal no. 12/1991
To asses the effectiveness of the financial leverage that was used in a rehabilitation process it is vitalfor creditors to compute a liability retrieval coefficient. During a rehabilitation process all liabilitiesshould be settled and paid in 100% unless due to negotiations a partial remission was accorded (such aremission is also a form of financial leverage allowed by creditors). This coefficient/ratio can be alsoa criterion on the basis of which one can choose a rehabilitation method for a company. Net liabilityretrieval coefficient can be computed with the following formula:
Where:
WOWN - Net liability retrieval coefficient,
OWi – required liabilities,
nnn
n
mm r
xZPOSSK)1(
1][ 22,1
1
1
3)()()( 2
32
22
1 RRREW
100][:)1(1
xWOxmWOr
OWWOWNn
ii
in
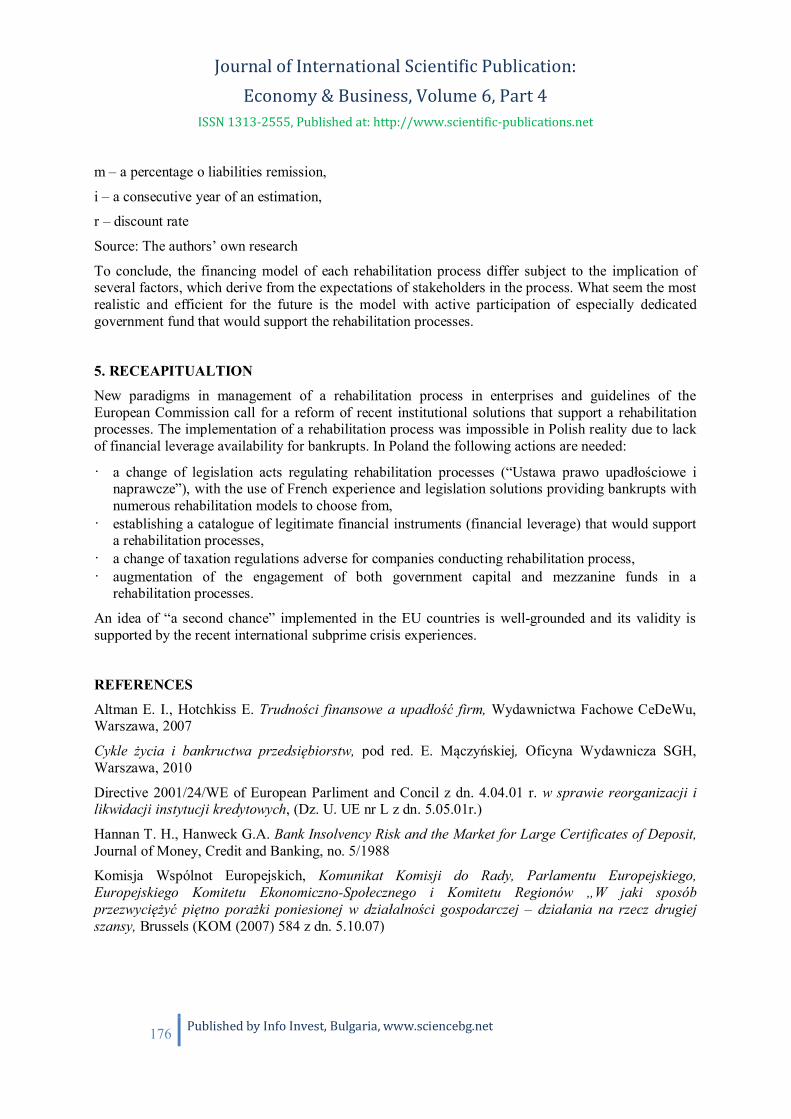
Journal of International Scientific Publication: Economy & Business, Volume 6, Part 4
ISSN 1313-2555, Published at: http://www.scientific-publications.net
176 Published by Info Invest, Bulgaria, www.sciencebg.net
m – a percentage o liabilities remission,
i – a consecutive year of an estimation,
r – discount rate
Source: The authors’ own research
To conclude, the financing model of each rehabilitation process differ subject to the implication ofseveral factors, which derive from the expectations of stakeholders in the process. What seem the mostrealistic and efficient for the future is the model with active participation of especially dedicatedgovernment fund that would support the rehabilitation processes.
5. RECEAPITUALTION
New paradigms in management of a rehabilitation process in enterprises and guidelines of theEuropean Commission call for a reform of recent institutional solutions that support a rehabilitationprocesses. The implementation of a rehabilitation process was impossible in Polish reality due to lackof financial leverage availability for bankrupts. In Poland the following actions are needed:
· a change of legislation acts regulating rehabilitation processes (“Ustawa prawo upad o ciowe inaprawcze”), with the use of French experience and legislation solutions providing bankrupts withnumerous rehabilitation models to choose from,
· establishing a catalogue of legitimate financial instruments (financial leverage) that would supporta rehabilitation processes,
· a change of taxation regulations adverse for companies conducting rehabilitation process,· augmentation of the engagement of both government capital and mezzanine funds in a
rehabilitation processes.
An idea of “a second chance” implemented in the EU countries is well-grounded and its validity issupported by the recent international subprime crisis experiences.
REFERENCES
Altman E. I., Hotchkiss E. Trudno ci finansowe a upad o firm, Wydawnictwa Fachowe CeDeWu,Warszawa, 2007
Cykle ycia i bankructwa przedsi biorstw, pod red. E. M czy skiej, Oficyna Wydawnicza SGH,Warszawa, 2010
Directive 2001/24/WE of European Parliment and Concil z dn. 4.04.01 r. w sprawie reorganizacji ilikwidacji instytucji kredytowych, (Dz. U. UE nr L z dn. 5.05.01r.)
Hannan T. H., Hanweck G.A. Bank Insolvency Risk and the Market for Large Certificates of Deposit,Journal of Money, Credit and Banking, no. 5/1988
Komisja Wspólnot Europejskich, Komunikat Komisji do Rady, Parlamentu Europejskiego,Europejskiego Komitetu Ekonomiczno-Spo ecznego i Komitetu Regionów „W jaki sposóbprzezwyci y pi tno pora ki poniesionej w dzia alno ci gospodarczej – dzia ania na rzecz drugiejszansy, Brussels (KOM (2007) 584 z dn. 5.10.07)
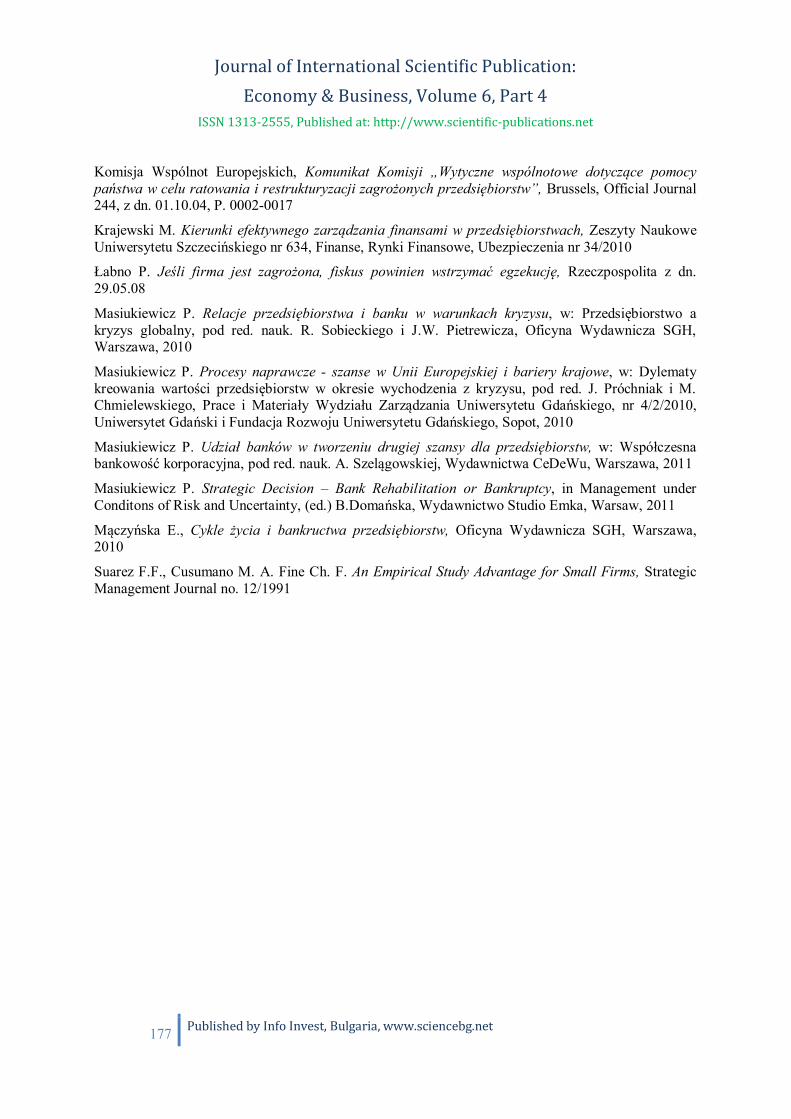
Journal of International Scientific Publication: Economy & Business, Volume 6, Part 4
ISSN 1313-2555, Published at: http://www.scientific-publications.net
177 Published by Info Invest, Bulgaria, www.sciencebg.net
Komisja Wspólnot Europejskich, Komunikat Komisji „Wytyczne wspólnotowe dotycz ce pomocypa stwa w celu ratowania i restrukturyzacji zagro onych przedsi biorstw”, Brussels, Official Journal244, z dn. 01.10.04, P. 0002-0017
Krajewski M. Kierunki efektywnego zarz dzania finansami w przedsi biorstwach, Zeszyty NaukoweUniwersytetu Szczeci skiego nr 634, Finanse, Rynki Finansowe, Ubezpieczenia nr 34/2010
abno P. Je li firma jest zagro ona, fiskus powinien wstrzyma egzekucj , Rzeczpospolita z dn.29.05.08
Masiukiewicz P. Relacje przedsi biorstwa i banku w warunkach kryzysu, w: Przedsi biorstwo akryzys globalny, pod red. nauk. R. Sobieckiego i J.W. Pietrewicza, Oficyna Wydawnicza SGH,Warszawa, 2010
Masiukiewicz P. Procesy naprawcze - szanse w Unii Europejskiej i bariery krajowe, w: Dylematykreowania warto ci przedsi biorstw w okresie wychodzenia z kryzysu, pod red. J. Próchniak i M.Chmielewskiego, Prace i Materia y Wydzia u Zarz dzania Uniwersytetu Gda skiego, nr 4/2/2010,Uniwersytet Gda ski i Fundacja Rozwoju Uniwersytetu Gda skiego, Sopot, 2010
Masiukiewicz P. Udzia banków w tworzeniu drugiej szansy dla przedsi biorstw, w: Wspó czesnabankowo korporacyjna, pod red. nauk. A. Szel gowskiej, Wydawnictwa CeDeWu, Warszawa, 2011
Masiukiewicz P. Strategic Decision – Bank Rehabilitation or Bankruptcy, in Management underConditons of Risk and Uncertainty, (ed.) B.Doma ska, Wydawnictwo Studio Emka, Warsaw, 2011
M czy ska E., Cykle ycia i bankructwa przedsi biorstw, Oficyna Wydawnicza SGH, Warszawa,2010
Suarez F.F., Cusumano M. A. Fine Ch. F. An Empirical Study Advantage for Small Firms, StrategicManagement Journal no. 12/1991

Journal of International Scientific Publication: Economy & Business, Volume 6, Part 4
ISSN 1313-2555, Published at: http://www.scientific-publications.net
178 Published by Info Invest, Bulgaria, www.sciencebg.net
ESTONIAN OPINION ON BUSINESS AND PROFESSIONAL ETHICS
Jaan Alver, Lehte Alver, Natalja Gurvitsh
Tallinn University of Technology, Estonia
Abstract
Accounting and business ethics can be examined and explored from a number of perspectives.This study analyses the opinion of Estonian practitioners and students on the place and role ofbusiness and professional ethics. In this paper authors analyse the results of the survey, whichconsisted of 15 statements and was concluded among the students of the Tallinn University ofTechnology and accounting practitioners, 381 responses were collected in the process. Thepresent study examined strengths and weaknesses of various statements. The survey discoveredthat in Estonia people are familiar with business ethics but there should be more attention paidto this issue especially in mass media as one of the weakest arguments was the one aboutgeneral opinion of business ethics in Estonia. The survey has also shown that there is not muchinterest toward business ethics in Estonia, which may be caused by the fact that this subject isconsidered of low importance in Estonia and no scandals have been related to ignoring theprinciples of business or accounting ethics so far. These findings emphasize that business andprofessional ethics definitely merit special attention and the educational institutions shouldmake it the compulsory course, especially for the students specializing in business management,economics, finance and accounting
Key words: accounting, business ethics, Estonia, ethics, professional ethics.
INTRODUCTIONBusiness and professional ethics became a matter of great public interest and concern after the EnronCase, as the question was not just orientation of the accounting profession but the place and function ofprofessional ethics in the society. For many years traditional approach to business was the one expressedby Milton Friedman that the main purpose of business was to make money. However, in the last years itseemed that public attitude has been shifted from making profit to corporate social responsibility whichencouraged many researchers to link ethics to Corporate Social Responsibility (CSR) (Quarter, Mook andRichmond, 2002) and sustainability, making the companies to report about their performance against keysocial, ethical and environmental dimensions of their behaviour and impact. (Zadek, Pruzan and Evans,1997).
Professional and business ethics can be examined and explored from a number of perspectives, some ofwhich have religious routes while the other are of philosophical or sociological approach. One approach isto study relationship between ethics and religion, the other is the philosophical approach, which examinesaccounting and business ethics from the teleological and deontological position. This approach is also
Acknowledgement: Authors would like to thank t Estonian-Swiss Cooperation Program, The Grant for the „FinancialReporting Technical Assistance Project“ for funding support.
Journal of International Scientific Publication: Economy & Business, Volume 6, Part 4
ISSN 1313-2555, Published at: http://www.scientific-publications.net
179 Published by Info Invest, Bulgaria, www.sciencebg.net
known as the “Golden rule” formulated by Maxwell (2003) by summing up all the issues of professionaland business ethics in one phrase “treat people as you want them to treat you”. The third approach is toexplore relationship of professional ethics to individual, contextual and issue attributes (Jones, 1991;Bachelard, 1994; McPhail and Walters, 2009). These approaches have gained much attention and growthover the last few centuries.
REVIEW OF LITERATURE
Several studies have been carried on business and accounting ethics, but only few of them try toestablish the place of professional ethics in the modern business world and whether students andpractitioners believe it to be really required and valid today. The most comprehensive and excitingstudies have been made by Boland (1982) who discusses the commercialization of the accountingprofession, Mitchell and Sikka (1993), who claim that audit is becoming more dependent on attractingnew perspective clients by decreasing the quality of services. Roberts (2001) reveals that professionalstatus is becoming less useful than commercial one and that accounting profession is becoming lessprofessionalized. However, some authors oppose this point of view and clearly identify that growingimportance of the CSR and appearance of social and environmental accounting in high schoolcurricula, presents a significant challenge to both accounting and business ethics, and addsprofessional responsibility to the accounting profession (Gray, 2001).
Numerous studies take philosophical perspectives and try to explain professional ethics in the contextof deontological ethics, represented by categorical imperative of Immanuel Kant (MacIntyre, 1982),an attempt to work out the universal law of ethical behaviour based on the reason principle, whileothers claim that accountants seem to have teleological mode of thinking as while getting their degreeor during professional practice they get exposed to a teleological ethics (Mc Phail, Gorringe and Gray,2004). Many books dedicated to political moral philosophy would like us to treat accountingprofession as a part of a national political structure and therefore the accounting ethics should be alsoconsidered to protect rights and interests of the particular group of a society. While social literature istrying to give professional ethics wider meaning as serving interests and protecting the rights ofvarious groups of stakeholders.
Growing number of studies inspirited by works of Levinas (1993), whose conception of ethics wasbased on the responsibility concept of all people being responsible for each other, and Bauman (1993)examine relationship between professional ethics and religion, influenced by the Genesis and thequestion of “Who I Am?” by concentrating on the story of Cain killing his brother Abel as well as theanswer to the famous question of “Am I my brother’s keeper?”. But, unfortunately, most of thesestudies seem to ignore another very important moment of this particular story that one starts to behavenon-ethically by not behaving ethically – “If you do what is right, will you not be accepted? But if youdo not do what is right, sin is crouching at your door; it desires to have you, but you must master it.(Genesis, Chapter 4).
A large number of articles and surveys were devoted to the relationship between professional ethicsand individual, contextual and issue attributes (McPhail and Walters, 2009). Individual attributes andethical behaviour have been explored in studies of Borkowski and Urgas (1992), Arlow (1992) andRadtke (2008), who discovered dependence of ethical behaviour on gender, whose works support theopinion that females are more ethical than males. Numerous studies explored the problem ofrelationship between professional ethics and age, while works of Trevino (1992) and Serwenek (1992)suggested that professional behaviour is largely influenced by age. While these researches confirm that

Journal of International Scientific Publication: Economy & Business, Volume 6, Part 4
ISSN 1313-2555, Published at: http://www.scientific-publications.net
180 Published by Info Invest, Bulgaria, www.sciencebg.net
individual attributes have high influence on a person in making professional decisions, many studiesalso show that the importance of contextual attributes cannot be neglected. Arnold, Bernardi,Neidermeyer and Schmee (2007) studied the effects of country and culture on perceptions ofappropriate ethical actions and found that national culture impact is much more significant than theone of the corporate culture. Many researchers also point to the fact that ethical decision-making of aparticular person may change a lot when he becomes a part of the “groupthink” (Sims 1992). Thisphenomenon has given a birth to social analysis of understanding and managing human socialbehaviour, by studying changes in ethical performance of an individual upon employment by a certaincompany. Some researchers also claim that professional behaviour is largely affected by situationalethics (Jones, 1991).
Many researchers emphasize the necessity of a professional code of conduct and even claim that noprofession can survive without it (Abbot, 1988) and that the main characteristic of a certain professionshould be code of ethics (Claypool, Fetyko and Pearson, 1990). This survey to some extent replicatessome of the above mentioned studies but also analyses the opinion of Estonian professionals andstudents on the place and role of business and professional ethics in the modern business world.
Hypotheses Statement
Not enough attention is being paid nowadays to business ethics in Estonia. This applies not only toeducational institutions, but also the state. People seem to be more motivated by material rather thanethical values in doing business. Therefore state should pay much more attention to the principles ofethics and introduce a compulsory course on ethics at colleges and universities for studentsspecializing in economics, finance, business and accounting.
SURVEY RESULTS
Methodology
The survey consisted of 15 statements that included 10 main and 5 additional statements aboutbusiness ethics. Each argument represents an opinion about business ethics, where respondents wereasked to rank each opinion from 1 to 5 in order to express their agreement or disagreement with eachstatement. Such method of ascribing quantitative value to qualitative data made it amenable tostatistical analysis. In the first part of the survey a score of 1 represented strong agreement and 5 –strong disagreement, whereas for the second part 5 statements a score of 1 represented strongdisagreement and 5 – strong agreement with the statement.
The survey was concluded among the students of the Tallinn University of Technology, accountingand practitioners, 381 responses were collected in the process. This information was compiled andanalysed based on gender, age, student status and education. Table 1 shows the result of this analysismakeup of the survey.

Journal of International Scientific Publication: Economy & Business, Volume 6, Part 4
ISSN 1313-2555, Published at: http://www.scientific-publications.net
181 Published by Info Invest, Bulgaria, www.sciencebg.net
Table 1.
Demographic Data of the Survey.
Status Sample
Students & Practitioners
BA students 65
MA students 228
Practitioners 88
Total 381
Major
Accounting 188
Business & Economics 150
Other 43
Total 381
Gender
Male 97
Female 284
Total 381
Age
< 25 139
25–35 134
36–45 76
> 45 32
Total 381
GENERAL FINDINGS
In the Tables 2 and 3 there are listed all 15 statements for both parts of the survey as well as the meanscore for each statement. The average score of 1.99 for the first 7 arguments part demonstrated that ingeneral people seem to agree with the idea that business ethics is not just a moral code of conduct, butalso an important tool for making managerial decisions as all respondents seem to be familiar andaware of business ethics definition and meaning (score 1.48) and strongly disagree with the statementthat consistent financial problems justify unethical behaviour (score 4.28). It is also worth mentioningthat respondents have expressed a high interest towards business ethics (score 1.99). In the second partof the survey they show a strong belief (score 4.15) of the necessity of business ethics in everydaybusiness activities. Respondents also agreed that business ethics largely depended on business industry(score 2.28) and that not enough attention has been drawn to this matter in Estonia so far (score 1.77).
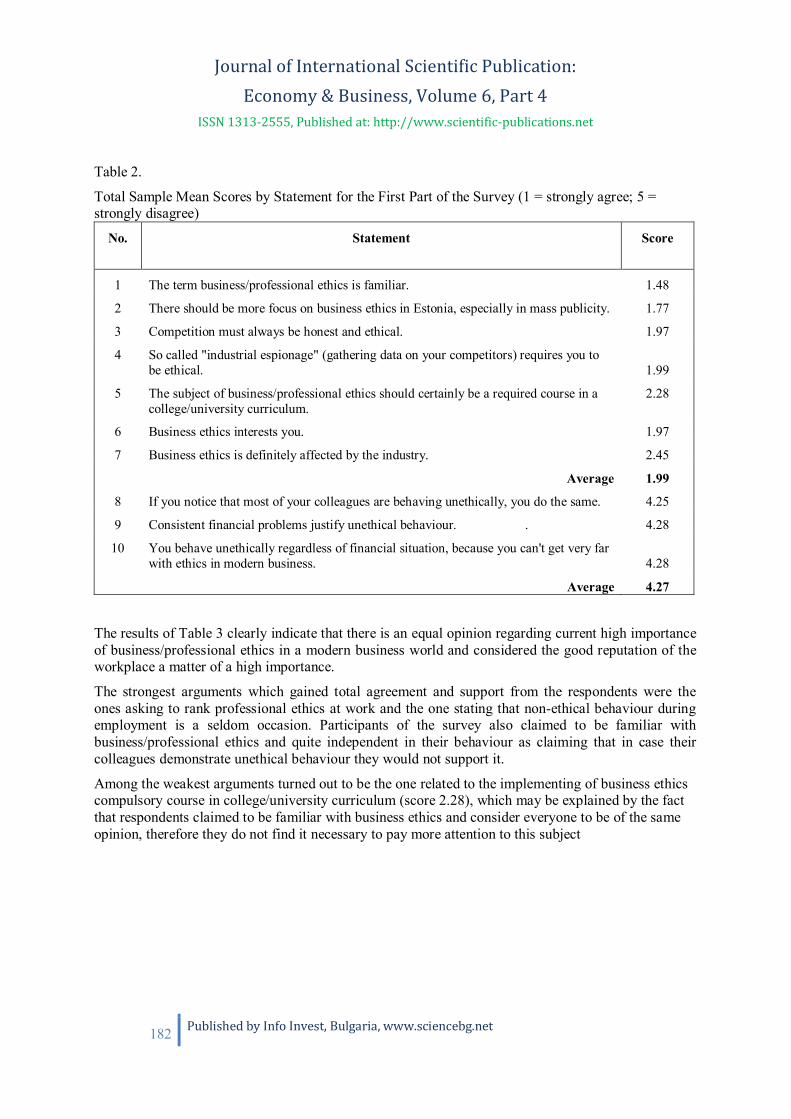
Journal of International Scientific Publication: Economy & Business, Volume 6, Part 4
ISSN 1313-2555, Published at: http://www.scientific-publications.net
182 Published by Info Invest, Bulgaria, www.sciencebg.net
Table 2.
Total Sample Mean Scores by Statement for the First Part of the Survey (1 = strongly agree; 5 =strongly disagree)
No. Statement Score
1 The term business/professional ethics is familiar. 1.48
2 There should be more focus on business ethics in Estonia, especially in mass publicity. 1.77
3 Competition must always be honest and ethical. 1.97
4 So called "industrial espionage" (gathering data on your competitors) requires you tobe ethical. 1.99
5 The subject of business/professional ethics should certainly be a required course in acollege/university curriculum.
2.28
6 Business ethics interests you. 1.97
7 Business ethics is definitely affected by the industry. 2.45
Average 1.99
8 If you notice that most of your colleagues are behaving unethically, you do the same. 4.25
9 Consistent financial problems justify unethical behaviour. . 4.28
10 You behave unethically regardless of financial situation, because you can't get very farwith ethics in modern business. 4.28
Average 4.27
The results of Table 3 clearly indicate that there is an equal opinion regarding current high importanceof business/professional ethics in a modern business world and considered the good reputation of theworkplace a matter of a high importance.
The strongest arguments which gained total agreement and support from the respondents were theones asking to rank professional ethics at work and the one stating that non-ethical behaviour duringemployment is a seldom occasion. Participants of the survey also claimed to be familiar withbusiness/professional ethics and quite independent in their behaviour as claiming that in case theircolleagues demonstrate unethical behaviour they would not support it.
Among the weakest arguments turned out to be the one related to the implementing of business ethicscompulsory course in college/university curriculum (score 2.28), which may be explained by the factthat respondents claimed to be familiar with business ethics and consider everyone to be of the sameopinion, therefore they do not find it necessary to pay more attention to this subject

Journal of International Scientific Publication: Economy & Business, Volume 6, Part 4
ISSN 1313-2555, Published at: http://www.scientific-publications.net
183 Published by Info Invest, Bulgaria, www.sciencebg.net
Table 3.
Total Sample Mean Scores by Statement for the Second Part of the Survey (1 = very low, 5 = veryhigh)
No. Statement Score
1 Which of the following is the most important:
a) short-term benefit from unethical behaviour (1) b) good reputation of yourworkplace (5). Options 2-4 are also accepted.
4.50
2 Importance/necessity of business ethics in modern business world. 4.15
3 Your professional ethics at work. 3.99
4 Your opinion of business ethics in Estonia. 2.72
Average 3.84
5 How often do you behave (are forced to behave) unethically at work? (Very often – 5,never – 1)
1.76
GENDER DIFFERENCES
Numerous studies in business and accounting ethics are dedicated to the question of dependence ofethical behaviour on gender. While works of Arlow (1991) and Stanga and Turpen (1991) do notconfirm the existence of gender difference in business ethics, works of Borkowski and Urgas (1992)state that women tend to behave more ethically at workplace than men. There have been also madestatements that women seem to treat codes of professional and business ethics with higher respect andit should be rational to employ more women for work at large accounting companies as a wise solutionof the ethical problems (Radtke, 2008). This approach based on the opinion that women are less likelyto be part of the „old-boy network”, they may not be sensitive as men to their status in the workplaceand that since the very childhood they choose game with fewer rules and are less likely to play by therules if they don’t think the rules are right. (McPhail and Walters, 2009).
Table 4 and Table 5 show the scores for each statement divided by gender category. These scoresindicate that women seem to be more familiar with business ethics (score 1.45 compared to 1.58) andmore interested in business ethics (score 2.22 compared to 2.69). They also seem to be more confidentin choosing proper behavior in unethical situations and think that business ethics should be taught incolleges and universities on a compulsory basis, while men would rather disagree with this statement.Men also seem to care less than women about ethics in case of getting important business information(scores 2.43 and 1.89 respectively) or entering into a business competition (scores 2.33 and 1.88respectively). It is also important to note that both groups agree that there should be focus on businessethics in Estonia (score 1.80 and 1.76 respectively). The results of the second part of the surveyindicate that in Estonia women care more about good reputation of the workplace than men (scores4.60 and 4.21 respectively) and also rank the requirements of business ethics in the modern worldhigher than men (scores 4.23 and 3.95 respectively). It is also worth mentioning that both men andwomen were not of a very high opinion of business ethics in Estonia (scores 2.69 and 2.73respectively), but ranked high the professional ethics at work (score 4.00 and 3.97 respectively).

Journal of International Scientific Publication: Economy & Business, Volume 6, Part 4
ISSN 1313-2555, Published at: http://www.scientific-publications.net
184 Published by Info Invest, Bulgaria, www.sciencebg.net
Table 4.
Comparison of Male and Female Scores for the First Part of the Survey (1 = strongly agree, 5 =strongly disagree)
No. Statement Male Female Score larger by
Male Female
1 The term business/professional ethics is familiar. 1.58 1.45 0.13
2 There should be more focus on business ethics inEstonia, especially in mass publicity.
1.80 1.76 0.04
3 Competition must always be honest and ethical. 2.12 1.91 0.21
4 So called "industrial espionage" (gathering data onyour competitors) requires you to be ethical.
2.33 1.88 0.45
5 The subject of business/professional ethics shouldcertainly be a required course in a college/universitycurriculum.
2.70 2.14 0.56
6 Business ethics interests you. 2.69 2.22 0.47
7 Business ethics is definitely affected by the industry. 2.23 2.53 0.30
Average 2.21 1.98 0.23
8 If you notice that most of your colleagues are behavingunethically, you do the same.
3.94 4.36 0.42
9 Consistent financial problems justify unethicalbehaviour.
4.25 4.29 0.04
10 You behave unethically regardless of financialsituation, because you can't get very far with ethics inmodern business.
4.02 4.36 0.34
Average 4.07 4.34 0.27
Comparison of Student and Practitioners Scores
The survey sample consisted of graduate and undergraduate students and business practitioners. Table6 and Table 7 show the mean scores for each group for all 15 statements. Overall, these resultsexplicitly reflect that undergraduate students feel more comfortable in the “ethics area” than thegraduate ones and show less cases of unethical behaviour, while the graduate students seem to be lessinterested in business ethics and that ethics should be taught as a required course in colleges and/oruniversities. At the same time graduate students tend to require more attention to be drawn to businessethics in Estonia (scores 1.87 and 1.98 respectively) seem to be of a higher opinion about businessethics in Estonia (scores 2.74 and 2.62 respectively), while the undergraduate ones are more concernedabout ethical and honest business competition (scores 1.98 and 2.13 respectively) than the graduateones.
It is also worth attention that practitioners expressed the highest belief that competition should be

Journal of International Scientific Publication: Economy & Business, Volume 6, Part 4
ISSN 1313-2555, Published at: http://www.scientific-publications.net
185 Published by Info Invest, Bulgaria, www.sciencebg.net
always honest and ethical (score 1.52) and that industrial espionage requires person to be ethical (score1.66), which in authors’ opinion is mainly explained by the fact that in their everyday work they havealready faced negative results caused by unethical behaviour in such situations as well as because theirpersonal professional experience have made them more cautious and careful while students seem to bemore concerned with the final result and believe that “the end justifies the means”.
Table 5.
Comparison of Male and Female Scores for the Second Part of the Survey (1 = very low, 5 = veryhigh)
No. Statement Male Female Score larger by
Male Female
1 Your professional ethics at work. 3.97 4.00 0.03
2 Importance/necessity of business ethics in modern businessworld.
3.95 4.23 0.28
3 Which of the following is the most important: a) short-termbenefit from unethical behaviour (1) b) good reputation ofyour workplace (5).Options 2-4 are also accepted.
4.21 4.60 0.39
4 Your opinion of business ethics in Estonia 2.69 2.73 0.04
Average 3.71 3.89 0.18
5 How often do you behave (are forced to behave) unethicallyat work? (Very often – 5, never – 1)
1.94 1.70 0.24
Table 6.
Comparison of Student and Practitioners Scores for the First Part of the Survey (1 = strongly agree; 5= strongly disagree)
No. Statement BA MA Pr1 The term business/professional ethics is familiar. 1.42 1.57 1.302 There should be more focus on business ethics in Estonia, especially in
mass publicity.1.98 1.87 1.57
3 Competition must always be honest and ethical. 1.98 2.13 1.524 So called "industrial espionage" (gathering data on your competitors)
requires you to be ethical.2.02 2.11 1.66
5 The subject of business/professional ethics should certainly be a requiredcourse in a college/university curriculum.
1.98 2.64 1.56
6 Business ethics interests you. 2.20 2.56 1.897 Business ethics is definitely affected by the industry. 2.48 2.32 2.77
Average 2.01 2.17 1.758 If you notice that most of your colleagues are behaving unethically, you do
the same.4.28 4.18 4.41
9 Consistent financial problems justify unethical behaviour. 4.18 4.21 4.5210 You behave unethically regardless of financial situation, because you can't
get very far with ethics in modern business.4.25 4.17 4.57
Average 4.24 4.19 4.50
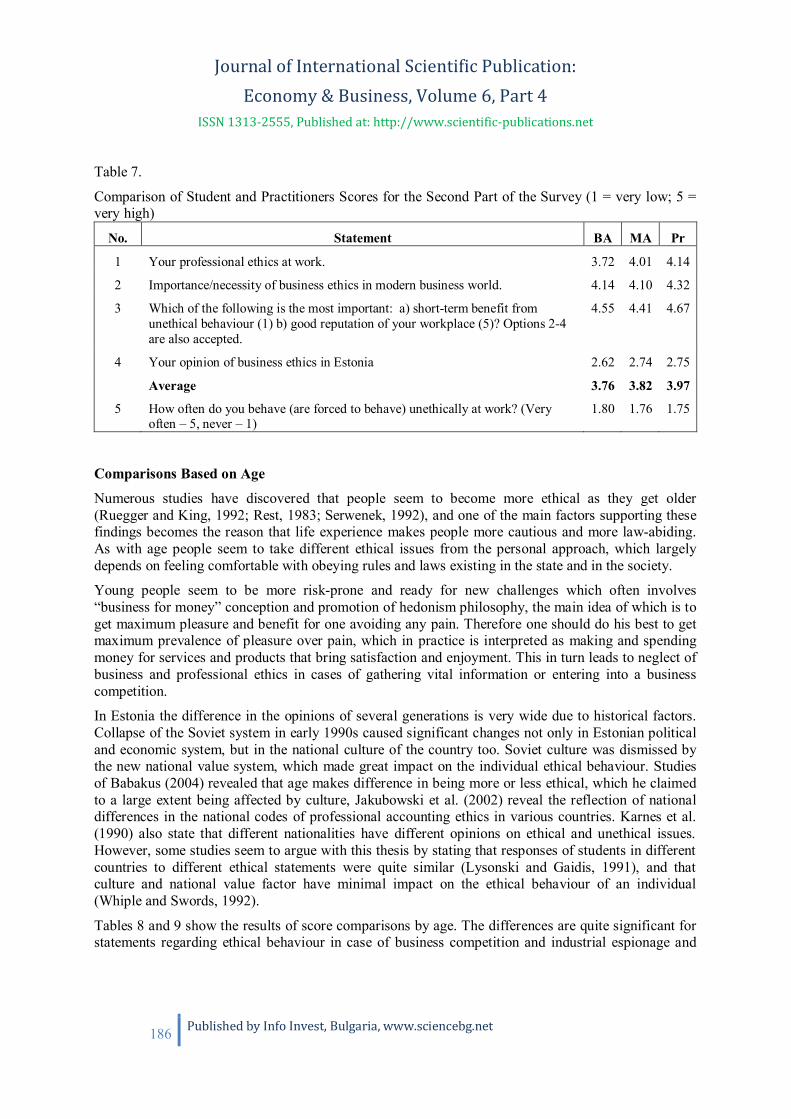
Journal of International Scientific Publication: Economy & Business, Volume 6, Part 4
ISSN 1313-2555, Published at: http://www.scientific-publications.net
186 Published by Info Invest, Bulgaria, www.sciencebg.net
Table 7.
Comparison of Student and Practitioners Scores for the Second Part of the Survey (1 = very low; 5 =very high)
No. Statement BA MA Pr
1 Your professional ethics at work. 3.72 4.01 4.14
2 Importance/necessity of business ethics in modern business world. 4.14 4.10 4.32
3 Which of the following is the most important: a) short-term benefit fromunethical behaviour (1) b) good reputation of your workplace (5)? Options 2-4are also accepted.
4.55 4.41 4.67
4 Your opinion of business ethics in Estonia 2.62 2.74 2.75
Average 3.76 3.82 3.97
5 How often do you behave (are forced to behave) unethically at work? (Veryoften – 5, never – 1)
1.80 1.76 1.75
Comparisons Based on Age
Numerous studies have discovered that people seem to become more ethical as they get older(Ruegger and King, 1992; Rest, 1983; Serwenek, 1992), and one of the main factors supporting thesefindings becomes the reason that life experience makes people more cautious and more law-abiding.As with age people seem to take different ethical issues from the personal approach, which largelydepends on feeling comfortable with obeying rules and laws existing in the state and in the society.
Young people seem to be more risk-prone and ready for new challenges which often involves“business for money” conception and promotion of hedonism philosophy, the main idea of which is toget maximum pleasure and benefit for one avoiding any pain. Therefore one should do his best to getmaximum prevalence of pleasure over pain, which in practice is interpreted as making and spendingmoney for services and products that bring satisfaction and enjoyment. This in turn leads to neglect ofbusiness and professional ethics in cases of gathering vital information or entering into a businesscompetition.
In Estonia the difference in the opinions of several generations is very wide due to historical factors.Collapse of the Soviet system in early 1990s caused significant changes not only in Estonian politicaland economic system, but in the national culture of the country too. Soviet culture was dismissed bythe new national value system, which made great impact on the individual ethical behaviour. Studiesof Babakus (2004) revealed that age makes difference in being more or less ethical, which he claimedto a large extent being affected by culture, Jakubowski et al. (2002) reveal the reflection of nationaldifferences in the national codes of professional accounting ethics in various countries. Karnes et al.(1990) also state that different nationalities have different opinions on ethical and unethical issues.However, some studies seem to argue with this thesis by stating that responses of students in differentcountries to different ethical statements were quite similar (Lysonski and Gaidis, 1991), and thatculture and national value factor have minimal impact on the ethical behaviour of an individual(Whiple and Swords, 1992).
Tables 8 and 9 show the results of score comparisons by age. The differences are quite significant forstatements regarding ethical behaviour in case of business competition and industrial espionage and
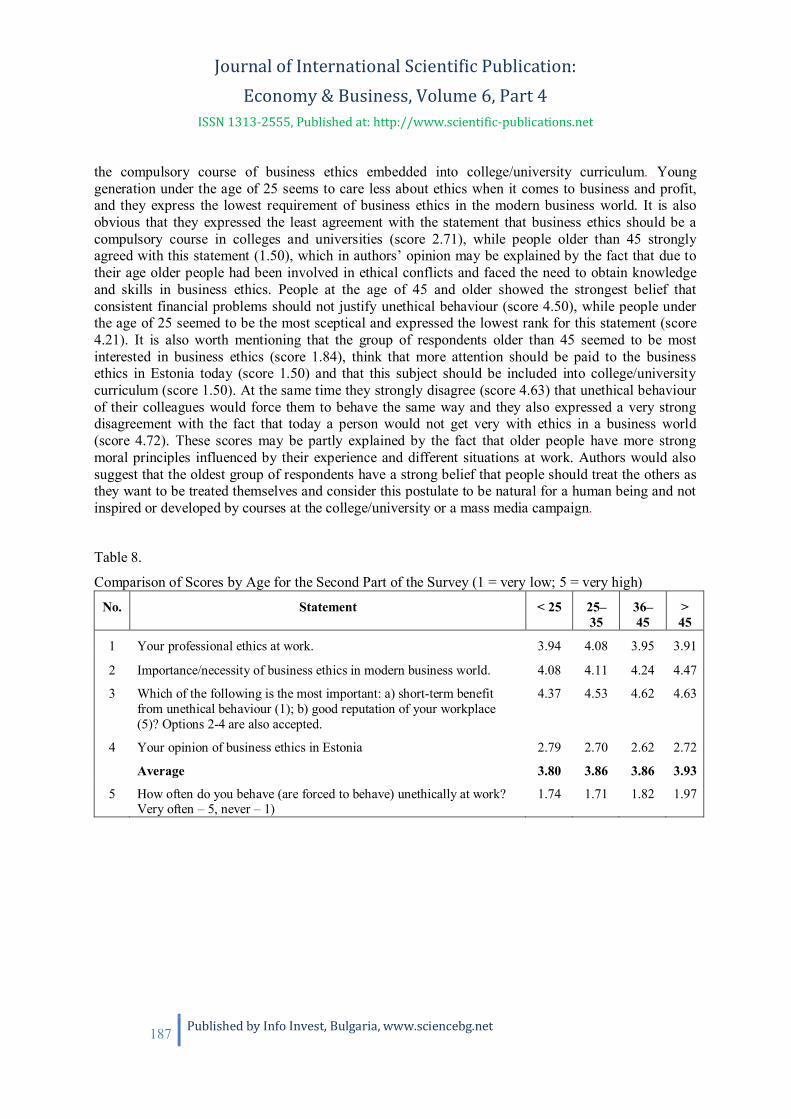
Journal of International Scientific Publication: Economy & Business, Volume 6, Part 4
ISSN 1313-2555, Published at: http://www.scientific-publications.net
187 Published by Info Invest, Bulgaria, www.sciencebg.net
the compulsory course of business ethics embedded into college/university curriculum. Younggeneration under the age of 25 seems to care less about ethics when it comes to business and profit,and they express the lowest requirement of business ethics in the modern business world. It is alsoobvious that they expressed the least agreement with the statement that business ethics should be acompulsory course in colleges and universities (score 2.71), while people older than 45 stronglyagreed with this statement (1.50), which in authors’ opinion may be explained by the fact that due totheir age older people had been involved in ethical conflicts and faced the need to obtain knowledgeand skills in business ethics. People at the age of 45 and older showed the strongest belief thatconsistent financial problems should not justify unethical behaviour (score 4.50), while people underthe age of 25 seemed to be the most sceptical and expressed the lowest rank for this statement (score4.21). It is also worth mentioning that the group of respondents older than 45 seemed to be mostinterested in business ethics (score 1.84), think that more attention should be paid to the businessethics in Estonia today (score 1.50) and that this subject should be included into college/universitycurriculum (score 1.50). At the same time they strongly disagree (score 4.63) that unethical behaviourof their colleagues would force them to behave the same way and they also expressed a very strongdisagreement with the fact that today a person would not get very with ethics in a business world(score 4.72). These scores may be partly explained by the fact that older people have more strongmoral principles influenced by their experience and different situations at work. Authors would alsosuggest that the oldest group of respondents have a strong belief that people should treat the others asthey want to be treated themselves and consider this postulate to be natural for a human being and notinspired or developed by courses at the college/university or a mass media campaign.
Table 8.
Comparison of Scores by Age for the Second Part of the Survey (1 = very low; 5 = very high)
No. Statement < 25 25–35
36–45
>45
1 Your professional ethics at work. 3.94 4.08 3.95 3.91
2 Importance/necessity of business ethics in modern business world. 4.08 4.11 4.24 4.47
3 Which of the following is the most important: a) short-term benefitfrom unethical behaviour (1); b) good reputation of your workplace(5)? Options 2-4 are also accepted.
4.37 4.53 4.62 4.63
4 Your opinion of business ethics in Estonia 2.79 2.70 2.62 2.72
Average 3.80 3.86 3.86 3.93
5 How often do you behave (are forced to behave) unethically at work?Very often – 5, never – 1)
1.74 1.71 1.82 1.97

Journal of International Scientific Publication: Economy & Business, Volume 6, Part 4
ISSN 1313-2555, Published at: http://www.scientific-publications.net
188 Published by Info Invest, Bulgaria, www.sciencebg.net
Table 9.
Comparison of Scores by Age for the First Part of the Survey (1 = strongly agree, 5 = stronglydisagree)
No. Statement < 25 25-35 36–45 > 45
1 The term business/professional ethics is familiar. 1.58 1.55 1.26 1.28
2 There should be more focus on business ethics in Estonia,especially in mass publicity.
1.95 1.76 1.59 1.50
3 Competition must always be honest and ethical. 2.24 1.98 1.67 1.41
4 So called "industrial espionage" (gathering data on yourcompetitors) requires you to be ethical.
2.11 2.05 1.87 1.53
5 The subject of business/professional ethics should certainly be arequired course in a college/university curriculum.
2.71 2.29 1.80 1.50
6 Business ethics interests you. 2.69 2.34 1.91 1.84
7 Business ethics is definitely affected by the industry. 2.11 2.51 2.64 3.16
Average 2.20 2.07 1.82 1.75
8 If you notice that most of your colleagues are behavingunethically, you do the same.
4.19 4.17 4.34 4.63
9 Consistent financial problems justify unethical behaviour. 4.21 4.22 4.41 4.50
10 You behave unethically regardless of financial situation, becauseyou can't get very far with ethics in modern business.
4.12 4.24 4.43 4.72
Average 4.17 4.21 4.39 4.62
Comparisons by Major
Tables 10 and 11 show the breakdown of scores by major, significant differences in responses wereshown in several cases. We can figure out that accounting students seem to be the most familiar (score1.41 compared to 1.58 and 1.42) and the most interested in business ethics (score 2.18 compared to2.49 and 2.51). They also have strong confidence that there should be more focus on business ethics in(score 1.69 compared to 1.80 and 2.02). Business & Economics students have shown the weakestscore for the argument stating that ethical behaviour is an essential attribute of industrial espionage(score 2.08) and that competition should be always ethical and honest (score 2.11), it seems that beingcompetitive in a certain business industry overcomes ethical postulates. In the second part of thesurvey the significant difference was the one which demonstrated that students specializing inBusiness & Economics found business ethics in modern business world less important than the otherstudents (score 4.03 compared to 4.21 and 4.35). Also important was the fact that students specializingin Business & Economics seemed to be express the least concern on good reputation of the goodreputation of the workplace, while accounting students were of the lowest opinion of business ethics inEstonia.

Journal of International Scientific Publication: Economy & Business, Volume 6, Part 4
ISSN 1313-2555, Published at: http://www.scientific-publications.net
189 Published by Info Invest, Bulgaria, www.sciencebg.net
Table 10.
Comparison of Scores by Major for the First Part of the Survey (1 = strongly agree, 5 = stronglydisagree)
No. Statement Accounting Business &
Economics
Other
1 The term business/professional ethics is familiar. 1.41 1.58 1.42
2 There should be more focus on business ethics in Estonia,especially in mass publicity.
1.69 1.80 2.02
3 Competition must always be honest and ethical. 1.88 2.11 1.81
4 So called "industrial espionage" (gathering data on yourcompetitors) requires you to be ethical.
1.93 2.08 1.98
5 The subject of business/professional ethics should certainlybe a required course in a college/university curriculum.
2.17 2.45 2.16
6 Business ethics interests you. 2.18 2.49 2.51
7 Business ethics is definitely affected by the industry. 2.49 2.47 2.19
Average 1.96 2.14 2.01
8 If you notice that most of your colleagues are behavingunethically, you do the same.
4.26 4.17 4.51
9 Consistent financial problems justify unethical behaviour. 4.27 4.25 4.40
10 You behave unethically regardless of financial situation,because you can't get very far with ethics in modernbusiness.
4.35 4.18 4.30
Average 4.29 4.20 4.40
A great number of professional studies were made in order to explore the nature of a singleprofessional group being more or less ethical than another, which may be caused by the educationalbackground. Works of Jeffrey (1993) and Arlow (1992) pointed out that ethical development ofaccounting students is higher than of the students with different specialization. While some studiesdiscovered that the accounting and business education has a negative influence on students ethicaldevelopment (Lane, 1988; Mayer, 1988; Gray et al., 1994), which is caused by simplifying the role ofbusiness as a generator of goods, services and profit (Loeb, 1991). After the Enron case this problemgained much interest among professional organizations, mass media and academic staff, therefore wethought that such survey of Estonian opinion will be worth attention and analysis. The results of suchcomparison of scores between accounting students and students studying business & economics arepresented above in two charts. These results show that accounting students behave unethically atworkplace slightly more often than the other respondents (score 1.80 compared to 1.72 and 1.51),which may be explained by the fact that they demonstrated the lowest score for argument asking fortheir opinion of business ethics in Estonia (score 2.70 compared to 2.73 and 2.81).

Journal of International Scientific Publication: Economy & Business, Volume 6, Part 4
ISSN 1313-2555, Published at: http://www.scientific-publications.net
190 Published by Info Invest, Bulgaria, www.sciencebg.net
Table 11.
Comparison of Scores by Major for the Second Part of the Survey (1 = very low; 5 = very high)
No. Statement Accounting Business &
Economics
Other
1 Your professional ethics at work. 3.96 3.92 4.37
2 Importance/necessity of business ethics in modern businessworld.
4.21 4.03 4.35
3 Which of the following is the most important a) short-termbenefit from unethical behaviour (1) b) good reputation ofyour workplace? (5). Options 2-4 are also accepted.
4.54 4.39 4.67
4 Your opinion of business ethics in Estonia 2.70 2.72 2.81
Average 3.85 3.77 4.05
5 How often do you behave (are forced to behave)unethically at work? (Very often – 5, never – 1)
1.86 1.73 1.47
SUMMARY AND CONCLUSIONS
The study examined strength and weaknesses of various statements that, in our opinion, have been themost worth attention and determine the place of business and professional ethics in modern world.Many of these arguments were dictated by the nowadays situation in business world and growingimportance of social aspect of economy, the others have long history and are more of the philosophicalmatter. The survey discovered that in Estonia people are familiar with business ethics but there shouldbe more attention paid to this issue especially in mass media as one of the weakest arguments was theone about general opinion of business ethics in Estonia. The survey has shown that there is not muchinterest toward business ethics in Estonia, which may be caused by the fact that this subject isconsidered of low importance in Estonia and no scandals have been related to ignoring the principlesof business or accounting ethics so far. Results have also shown that that there is a quite strong beliefthat in several industries business ethics is of a little importance. However, the strongest argument wasthe one that highly ranked the necessity business ethics in today business and the importance of thegood reputation of workplace.
These findings have various implications. First, they emphasize that the hypothesis stated by theauthors is proved and that if the government and the state would like to make companies sociallyresponsible and to achieve more transparency in business as well as to avoid financial frauds it shouldmake business and professional ethics items of a high priority. Second, business and professionalethics definitely merit special attention in the mass media and the educational institutions should makeit the compulsory course, especially for the students specializing in business management, economics,finance and accounting.
REFERENCESAbbot, A. (1988) System of professions: An essay on the division of expert labour (Chicago:University of Chicago Press).

Journal of International Scientific Publication: Economy & Business, Volume 6, Part 4
ISSN 1313-2555, Published at: http://www.scientific-publications.net
191 Published by Info Invest, Bulgaria, www.sciencebg.net
Arlow, P. (1992) Personal characteristics in college students’ evaluations of business ethics andcorporate social responsibility, Journal of Business Ethics, 10, pp. 63–69.
Arnold, D. F., Bernardi, R. A., Neidermeyer, P. E. and Schmee, J. (2007) The effect of country andculture on perceptions of appropriate ethical actions prescribed by codes of conduct: A WesternEuropean perspective among accountants, Journal of Business Ethics, 70, pp. 327–340.
Babakus, E., Cornwell T. B., Mitchell V. and Schlegelmilch B. (2004) Reaction to unethical consumerbehavior across six countries, The Journal of Consumer Marketing, 21(4/5), pp. 254 263.
Bachelard, G. (1994) The poetics of space (Boston: Beacon Press).
Bauman, Z. (1993) Postmodern ethics (Oxford: Blackwell).
Boland, R. J. Jr. (1982) Myth and technology in the American accounting profession, Journal ofManagement Studies, 19(1), pp.109 127.
Borkowski, S. C. and Urgas, Y. F. (1992) The ethical attitudes of students as a function of age, sex andexperience, Journal of Business Ethics, 11(12), pp. 961–979.
Claypool, G. A., Fetyko, D. F. and Pearson, M. A. (1990) Reaction to ethical dilemmas: A studypertaining to certified public accountants, Journal of Business ethics,16, pp. 1495–1466.
Genesis 4, Website: http://www.bibleontheweb.com/Bible.asp (Last accessed on March 20, 2012).
Gray, R. H., Bebbington, J. and McPhail, K. (1994) Teaching ethics and the ethics of teaching.Educating for immorality and a possible case for social and environmental accounting, AccountingEducation, 3, pp. 51–75.
Gray, R. H. (2001) 30 years of corporate social accounting, reporting and auditing: What (if anything)have we learnt?, Business Ethics: A European Review, 10(1), pp. 9–15.
Jakubowski, S. T., Chao, P., Huh, S. K. and Maheshwari, S. (2002), A cross-country comparison ofthe codes of professional conduct of certified/chartered accountants, Journal of Business Ethics, 35pp.111–129.
Jeffrey, C. (1993) Ethical development of accounting students, non-accounting business-students andliberal arts students, Issues in Accounting Education, 8(1), pp. 86–96.
Jones, T M. (1991) Ethical decision making by individuals in organizations: An issue-contingentmodel, Academy of Management Review, 16(2), pp. 366–395.
Karnes, A., Sterner, J., Welker, R. and Wu, F. (1990) A bi-cultural comparison of accountants’perceptions of unethical business practices, Accounting, Auditing & Accountability Journal, 3(3), pp.45–62.
Lane, M. S. (1988) Pygmalion effect: An issue for business education and ethics, Journal of BusinessEthics, 7, pp. 223–229.
Levinas, E. (1993) Outside the subject (London: Athlone Press).
Loeb, S. E. (1991) The evaluation of outcomes of accounting ethics education, Journal of BusinessEthics, 53, pp. 313–323.
Lysonski, S. and Gaidis, W. (1991), A cross-cultural comparison of the ethics of business students,Journal of Business Ethics, 10, pp. 141–150.

Journal of International Scientific Publication: Economy & Business, Volume 6, Part 4
ISSN 1313-2555, Published at: http://www.scientific-publications.net
192 Published by Info Invest, Bulgaria, www.sciencebg.net
MacIntyre, A. (1982) A short history of ethics: A history of moral philosophy from the Homeric age tothe twentieth century, (London: Routledge).
Maxwell, J. C. (2003) There’s No Such Thing as “Business” Ethics: There’s Only One Rule forMaking Decisions (New York: Warner Faith Books).
Mayer, J. (1988) Themes of social responsibility: A survey of free professional schools, Journal ofBusiness Ethics, 7(4), pp. 313–320.
Mitchell, A. and Sikka, P. (1993) Accounting for change; the institutions of accountancy, CriticalPerspectives on Accounting, 4, pp. 29–52.
Mc Phail, K. J., Gorring, T. and Gray, R. H. (2004) Accounting and theology: An introduction.initiating a dialogue between immediacy and eternity, Accounting, Auditing & Accountability Journal,17(3) pp. 320–326.
McPhail, K. and Walters D. (2009) Accounting and Business Ethics: An Introduction (London:Routledge).
Quarter, J., Mook, L., Richmond, B. J. (2002) What Counts: Social Accounting for Nonprofits andCooperatives (New York: Prentice Hall)
Radtke, R. (2008) Role morality in the accounting profession: How do we compare to physicians andattorneys?, Journal of Business Ethics, 70, pp. 279–297.
Rest, J. (1983) Morality in: P. Mussen (Ed) Handbook of Child Psychology, pp. 556–629 (New York:Wiley).
Roberts, R. W. (2001) Commercialism and its impact on the integrity of professional tax services inthe United States, Critical Perspectives on Accounting, 12, pp. 589–605.
Ruegger, D. and King, E. W. (1992) A Study of the Effect of Age and Gender upon Student BusinessEthics, Journal of Business Ethics, 11(3), pp. 179–186.
Serwenek, P. J. (1992) Demographic and related differences in ethical views among small businesses,Journal of Business Ethics, 11(7), pp. 555–566.
Sims, R. R. (1992) Linking groupthink to unethical behaviour in organizations, Journal of BusinessEthics, 11, pp. 651–662.
Stanga, K. G. and Turpen, R. A. (1991) Ethical judgments on selected accounting issues: An empiricalstudy, Journal of Business Ethics, 10, pp. 739–747.
Trevino, L. K. (1992) Moral reasoning and business ethics: Implications for research, education andmanagement, Journal of Business Ethics, 11, pp. 445–459.
Whipple, T. W. and Sword, D. F. (1992) Business ethics judgments: A cross-cultural comparison,Journal of Business Ethics, 11(9), pp. 671–678.
Zadek, S., Pruzan P., Evans, R. (1997) Building Corporate Accountability (London: EarthscanPublications Ltd).

Journal of International Scientific Publication: Economy & Business, Volume 6, Part 4
ISSN 1313-2555, Published at: http://www.scientific-publications.net
193 Published by Info Invest, Bulgaria, www.sciencebg.net
APPLICATION OF THE ANALYTIC HIERARCHY PROCESS TO OPTTIMIZE THE
STRUCTURE OF RUSSIAN INDUSTRY BY THE TYPE OF ECONOMIC ACTIVITYRafail R. Ishmuratov 1, Nuria R. Nasyrova 2
1,2 Kazan (Volga region) Federal University, Institute of Economics and Finance
Butlerov street 4, Kazan, Tatarstan Russian Federation, 420012
Abstract
This paper substantiates the necessity of using multi-criteria approach to determine the optimalstructure of Russian industry. To calculate the optimum correlation of the types of economic activitiesthe Analytic Hierarchy Process is used. The authors also determine the degree of deviation of theactual industrial structure from the optimal one.
Key words: industry structure, types of economic activities, the Analytic Hierarchy Process, pairwisecomparisons, the index of consistency.
Sustainable industrial growth is a priority in the economic policy of the state. Positive dynamics ofaggregate output suggests increasing the economic potential of the country, expanding the productionpossibilities of the society, and it serves as the basis for welfare growth of its citizens. However, thequalitative aspect of economic growth reflected in the structure of the industrial production is no lessimportant.
Certain types of economic activity are characterized by different indicators of labor input andprofitability, innovation and investment activity, social and ecological safety. Therefore, changes inthe proportions of industrial production involve changes in most spheres of the society. Structuralpolicy is a significant factor in the economic development of the country. Thus the development of ascientific approach to determine the optimal structure of industry in Russia is an important task of theresearch.
Structure analysis of Russian industry in 2009, presented in Table 1 shows that the largest specificweight of the volume of products shipped goes to extraction of fuel and energy mineral resources.This type of economic activity makes 20. 55 %. As for production and distribution of electric power,gas and water (13. 81%), coke, petroleum products and nuclear materials (12. 05%), metallurgicalproduction and fabricated metal products (10. 84 %), they also take the greatest part of the structure ofRussian industry, and present the industries manufacturing the products with low degree processing.Prevalence of these types of economic activities is explained by their high profitability. For instance,profitability level of the extraction of fuel and energy minerals amounts to 27.8%, manufacture ofcoke, refined petroleum and nuclear products - 25. 9%, metallurgical production and fabricated metalproducts - 14.0%. On the other hand, economic activities with low efficiency constitute a small sharein the industrial structure of Russia. This is the textile and clothing manufacture, wood processing andproduction of wood products, manufacture of rubber and plastic products. Similar relationship istraced between the amount of wages and the proportions of industrial production. Hence, in terms ofprofitability and wage the structure of Russian industry may be considered as optimal one.

Journal of International Scientific Publication: Economy & Business, Volume 6, Part 4
ISSN 1313-2555, Published at: http://www.scientific-publications.net
194 Published by Info Invest, Bulgaria, www.sciencebg.net
However, the additional information provided in Table 1 indicates that the most cost-effective andhighly paid activities are characterized by low rates of employment and adverse impact on theenvironment. Thus, the extraction of fuel and energy minerals, whose volume of products shipped is20.55%, provides jobs for only 5.58% of the total employment in the industry. Production andconsumption waste for this type of economic activity accounts for 1,984.9 million tons, more than halfof all industrial waste. The remaining extracting industries account for 31.97% of the waste with thespecific weight of the products shipped 2.51%. Manufacture of coke, refined petroleum products andnuclear materials is characterized by an acceptable level of environmental pollution, however, it showsa significant deviation between the percentage of products shipped (12.05%) and the proportion ofemployees (1.05%).
Table 1. Basic indicators of organizations in Russia by the type of economic activity for 2009
Type of economicactivity
Volume ofproducts shipped
Average annualnumber of workers Average
monthlywage, inrubles
Level ofprofitability,
%
Generation ofproduction andconsumption
waste
mln.,rubles
specificweight,
%
thousand
people
specificweight,
%
mln.,tons
specificweight,
%
Extraction of fuel andenergy mineralresources
4, 537.7 20.55 590.5 5.58 41, 568.3 27.8 1, 984.9 58.67
Extraction of mineralresources, except forfuel and energy
553.3 2.51 324.3 3.06 24, 064.1 31.0 1, 081.6 31.97
Production offoodstuff includingbeverages and tobacco
2, 822.1 12.78 1, 343.5 12.69 15, 653.1 11.2 25.1 0.74
Textile and clothingmanufacture 155.8 0.71 336.5 3.18 9, 020.5 5.4 0.2 0.01
Manufacture ofleather, leatherproducts and footwear
34.8 0.16 57.8 0.55 10 ,073.2 7.3 0.1 0.00
Wood processing andmanufacture of woodproducts
214.2 0.97 276.3 2.61 10, 947.2 -0.8 5.0 0.15
Pulp and paperindustry; publishingand printing activities
499.0 2.26 361.8 3.42 17, 707.1 8.1 5.3 0.16
Production of coke,petroleum productsand nuclear materials
2, 661.5 12.05 111.6 1.05 37, 963.7 25.9 1.5 0.04
Chemical production 1, 061.7 4.81 441.2 4.17 19, 428.7 10.1 20.6 0.61

Journal of International Scientific Publication: Economy & Business, Volume 6, Part 4
ISSN 1313-2555, Published at: http://www.scientific-publications.net
195 Published by Info Invest, Bulgaria, www.sciencebg.net
Manufacture of rubberand plastic products 375.0 1.70 259.4 2.45 13, 850.6 5.8 0.1 0.00
Manufacture of othernon-metallic mineralproducts
683.3 3.09 596.0 5.63 16, 053.7 6.7 12.1 0.36
Metallurgicalproduction andfabricated metalproduct manufacture
2, 393.2 10.84 997.7 9.42 17, 946.3 14.0 174.6 5.16
Manufacture ofmachinery andequipment
801.6 3.63 901.2 8.51 17, 009.6 7.6 1.8 0.05
Manufacture ofelectrical, electronicand optical equipment
816.6 3.70 824.2 7.79 17, 360.4 7.8 0.6 0.02
Manufacture oftransport vehicles andequipment
1, 119.4 5.07 1, 041.7 9.84 17, 367.8 1.7 1.9 0.06
Other production 303.5 1.37 286.5 2.71 12, 543.1 4.1 2.7 0.08
Production anddistribution of electricpower, gas and water
3, 049.6 13.81 1, 836.5 17.35 21, 554.2 7.6 65.3 1.93
TOTAL 22, 082.3 100.00 10, 586.7 100.00 3, 383.4 100.00
This analysis shows that it is impossible to single out any one criterion to develop the structural policyof the state. The methodology based on profitability and wages, will inevitably lead to furtherstrengthening the position of extracting industries. The consequence can be an unstable economicsituation, the lack of perspective for long-term development, and the emergence of threats to nationalsecurity. Using the criterion of employment will lead to an increase in the share of labor-intensiveindustries with low levels of technological innovation. Attention to the environmental componentresults in under-utilization of productive capacity and the weakening competitive position in the globaleconomy. Therefore, optimizing the industrial structure of Russia should be based on the use of multi-criteria method. There is an urgent need for a comprehensive, systematic, balanced approach designedto ensure industrial growth in the interests of various actors of the economy, which aims at finding acompromise between the development of production and preservation of favorable environmentalconditions, between the emergence of a strong state and maintaining a high standard of living. It is theAnalytic Hierarchy Process developed by the famous American scientist Thomas Saaty that enablesthe implementation of the principles stated above.
Let us consider the possibility of applying this method to find the optimal structure of industry inRussia. The solution of the problem can be divided into several stages.
Stage 1. Structuring the problem as a hierarchy.
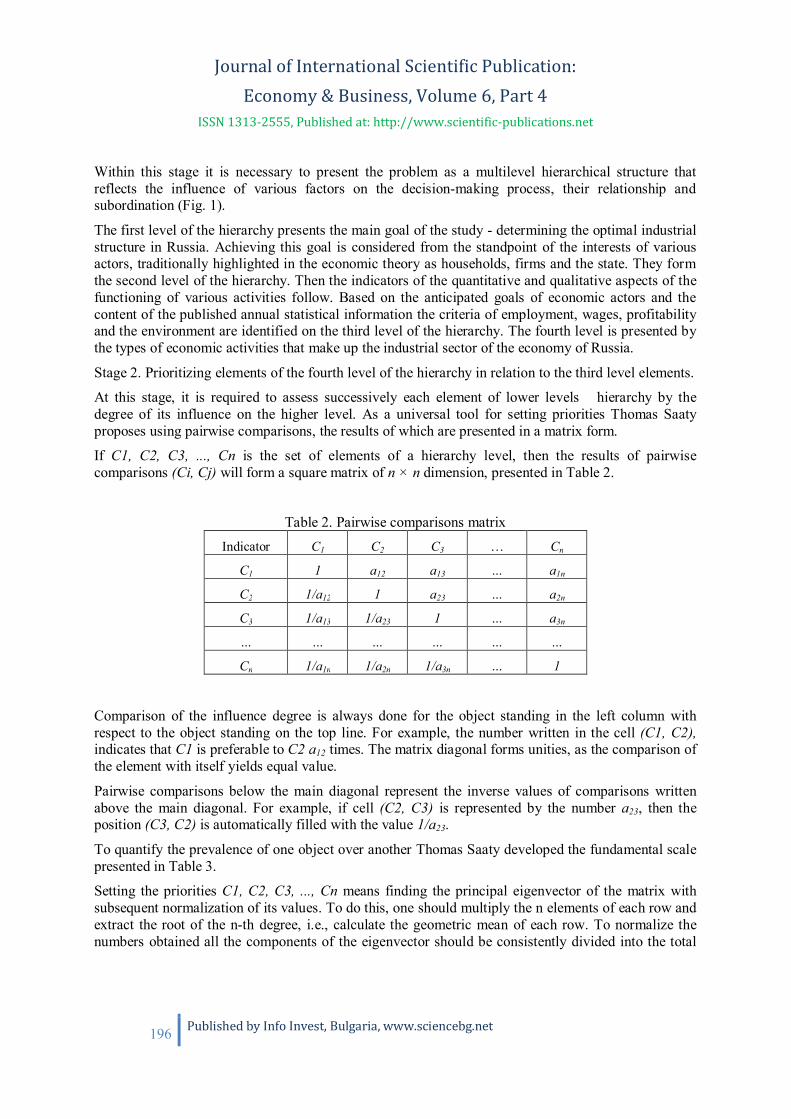
Journal of International Scientific Publication: Economy & Business, Volume 6, Part 4
ISSN 1313-2555, Published at: http://www.scientific-publications.net
196 Published by Info Invest, Bulgaria, www.sciencebg.net
Within this stage it is necessary to present the problem as a multilevel hierarchical structure thatreflects the influence of various factors on the decision-making process, their relationship andsubordination (Fig. 1).
The first level of the hierarchy presents the main goal of the study - determining the optimal industrialstructure in Russia. Achieving this goal is considered from the standpoint of the interests of variousactors, traditionally highlighted in the economic theory as households, firms and the state. They formthe second level of the hierarchy. Then the indicators of the quantitative and qualitative aspects of thefunctioning of various activities follow. Based on the anticipated goals of economic actors and thecontent of the published annual statistical information the criteria of employment, wages, profitabilityand the environment are identified on the third level of the hierarchy. The fourth level is presented bythe types of economic activities that make up the industrial sector of the economy of Russia.
Stage 2. Prioritizing elements of the fourth level of the hierarchy in relation to the third level elements.
At this stage, it is required to assess successively each element of lower levels hierarchy by thedegree of its influence on the higher level. As a universal tool for setting priorities Thomas Saatyproposes using pairwise comparisons, the results of which are presented in a matrix form.
If C1, C2, C3, ..., Cn is the set of elements of a hierarchy level, then the results of pairwisecomparisons (Ci, Cj) will form a square matrix of n × n dimension, presented in Table 2.
Table 2. Pairwise comparisons matrixIndicator C1 C2 C3 … Cn
C1 1 a12 a13 … a1n
C2 1/a12 1 a23 … a2n
C3 1/a13 1/a23 1 … a3n
… … … … … …
Cn 1/a1n 1/a2n 1/a3n … 1
Comparison of the influence degree is always done for the object standing in the left column withrespect to the object standing on the top line. For example, the number written in the cell (C1, C2),indicates that C1 is preferable to C2 a12 times. The matrix diagonal forms unities, as the comparison ofthe element with itself yields equal value.
Pairwise comparisons below the main diagonal represent the inverse values of comparisons writtenabove the main diagonal. For example, if cell (C2, C3) is represented by the number a23, then theposition (C3, C2) is automatically filled with the value 1/a23.
To quantify the prevalence of one object over another Thomas Saaty developed the fundamental scalepresented in Table 3.
Setting the priorities C1, C2, C3, ..., Cn means finding the principal eigenvector of the matrix withsubsequent normalization of its values. To do this, one should multiply the n elements of each row andextract the root of the n-th degree, i.e., calculate the geometric mean of each row. To normalize thenumbers obtained all the components of the eigenvector should be consistently divided into the total

Journal of International Scientific Publication: Economy & Business, Volume 6, Part 4
ISSN 1313-2555, Published at: http://www.scientific-publications.net
197 Published by Info Invest, Bulgaria, www.sciencebg.net
amount of components. The obtained values represent the preferences of the objects located at somelevel of the hierarchy with respect to the higher level.
Figure 1. Task hierarchy of finding the optimal structure of industry in Russia
To assess the consistency of judgments used in setting priorities, we must calculate the maximumeigenvalue of the matrix of pairwise comparisons. Multiplying the matrix A = (aij) by the vector ofpriorities gives a new vector. After dividing each component of the new vector to the correspondingcomponent of the vector of priorities we have a vector the average arithmetic of which represents anapproximation to the number of max (maximal eigenvalue).
Optimal structure of
Russian industry
Households Companies State
Employment Wage Profitability Environment
Extraction of fuel andenergy
mineral resources
Production of foodstuff
including beverages andtobacco
Textile and clothingmanufacture
Manufacture of leather,leather products and
footwear
Wood processing and
manufacture of woodproducts
Pulp and paper industry;
publishing and printingactivities
Manufacture of electrical,electronic and optical
equipment
Production of coke,petroleum products and
nuclear materialsChemical production
Manufacture of rubber andplastic products
Manufacture of other non-metallic mineral products
Metallurgical productionand fabricated metal product
manufacture
Manufacture of machineryand equipment
Other production
Manufacture of transportvehicles and equipment
Production and distributionof electric power, gas and
water
LEV
EL4
ALT
ERN
ATI
VES
LEV
EL3
CR
ITER
IA
LEV
EL2
AC
TOR
S
LEV
EL1
GO
AL
Extraction of mineralresources,
except for fuel and energy
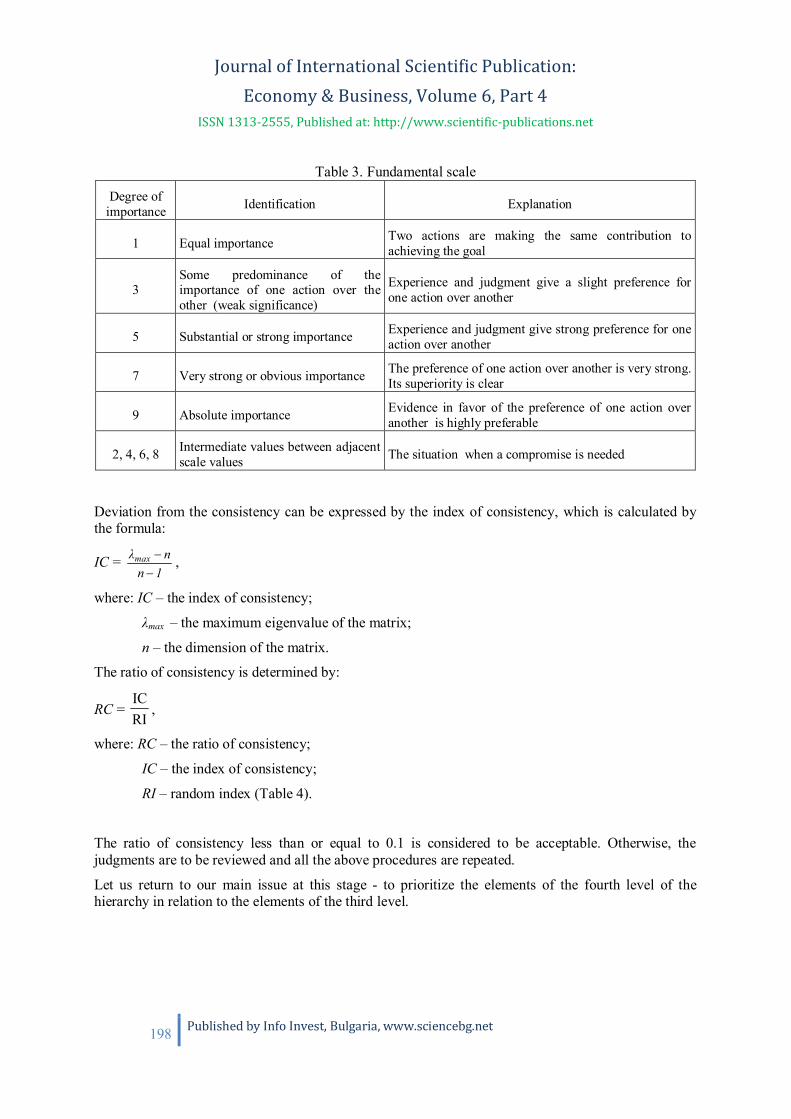
Journal of International Scientific Publication: Economy & Business, Volume 6, Part 4
ISSN 1313-2555, Published at: http://www.scientific-publications.net
198 Published by Info Invest, Bulgaria, www.sciencebg.net
Table 3. Fundamental scale
Degree ofimportance Identification Explanation
1 Equal importance Two actions are making the same contribution toachieving the goal
3Some predominance of theimportance of one action over theother (weak significance)
Experience and judgment give a slight preference forone action over another
5 Substantial or strong importance Experience and judgment give strong preference for oneaction over another
7 Very strong or obvious importance The preference of one action over another is very strong.Its superiority is clear
9 Absolute importance Evidence in favor of the preference of one action overanother is highly preferable
2, 4, 6, 8 Intermediate values between adjacentscale values The situation when a compromise is needed
Deviation from the consistency can be expressed by the index of consistency, which is calculated bythe formula:
I =1n
nmax ,
where: I – the index of consistency;
max – the maximum eigenvalue of the matrix;
n – the dimension of the matrix.
The ratio of consistency is determined by:
R =RII
,
where: RC – the ratio of consistency;
I – the index of consistency;
RI – random index (Table 4).
The ratio of consistency less than or equal to 0.1 is considered to be acceptable. Otherwise, thejudgments are to be reviewed and all the above procedures are repeated.
Let us return to our main issue at this stage - to prioritize the elements of the fourth level of thehierarchy in relation to the elements of the third level.

Journal of International Scientific Publication: Economy & Business, Volume 6, Part 4
ISSN 1313-2555, Published at: http://www.scientific-publications.net
199 Published by Info Invest, Bulgaria, www.sciencebg.net
Table 4.The values of the random index
Dimension of thematrix 1 2 3 4 5 6 7 8 9 10
Random index 0.00 0.00 0.58 0.90 1.12 1.24 1.32 1.41 1.45 1.49
We start with the criterion of "Employment". To describe it the actual data on the average number ofemployees of organizations by kinds of economic activity are used. Availability of statisticalinformation ensures maximum objectivity of the process and simplifies the calculations. However,using the absolute value of the average number of employees will result in a distortion of priorities andthe establishment of preference for the kinds of economic activity, where a high level of employmentis a consequence of large volumes of production. To resolve this deficiency one should calculatelabour intensity rates for each element of the fourth level of the hierarchy as follows:
LI =VOPANE
,
where: LI – labour intensity;
ANE – average number of employees of organizations;
VOP – volume of own production (works, services) shipped.
After normalization of the calculated values of the labour intensity we obtain the desired vector ofpriorities of economic activities by the criterion of "Employment" (Table 5).
Table 5.The calculation of priorities vector by the criterion of "Employment"
Type of economic activityAverage annual number
of workers, thousand
people
Labourintensity
Vector ofpriorities
Extraction of fuel and energy mineral resources 590.5 0.1301 0.0092
Extraction of mineral resources, except for fuel andenergy 324.3 0.5861 0.0416
Production of foodstuff including beverages andtobacco 1, 343.5 0.4761 0.0338
Textile and clothing manufacture 336.5 2.1598 0.1534
Manufacture of leather, leather products and footwear 57.8 1.6609 0.1180
Wood processing and manufacture of wood products 276.3 1.2899 0.0916
Pulp and paper industry; publishing and printingactivities 361.8 0.7251 0.0515
Production of coke, petroleum products and nuclearmaterials 111.6 0.0419 0.0030
Chemical production 441.2 0.4156 0.0295
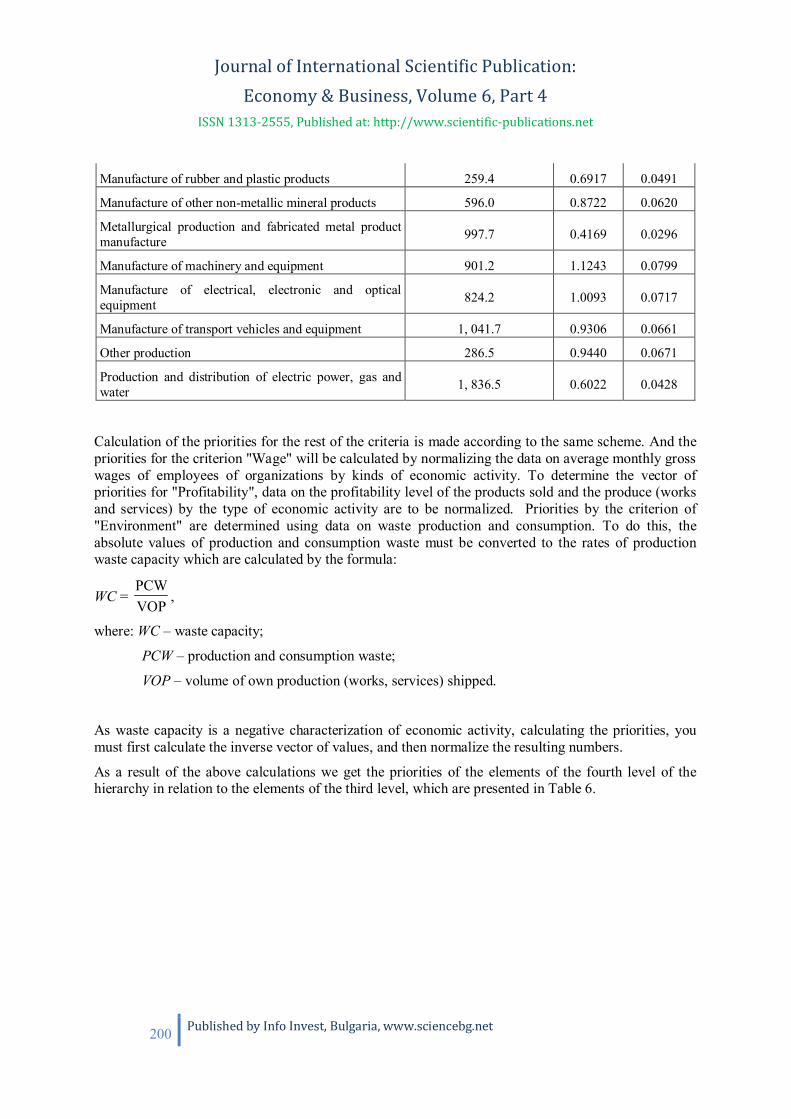
Journal of International Scientific Publication: Economy & Business, Volume 6, Part 4
ISSN 1313-2555, Published at: http://www.scientific-publications.net
200 Published by Info Invest, Bulgaria, www.sciencebg.net
Manufacture of rubber and plastic products 259.4 0.6917 0.0491
Manufacture of other non-metallic mineral products 596.0 0.8722 0.0620
Metallurgical production and fabricated metal productmanufacture 997.7 0.4169 0.0296
Manufacture of machinery and equipment 901.2 1.1243 0.0799
Manufacture of electrical, electronic and opticalequipment 824.2 1.0093 0.0717
Manufacture of transport vehicles and equipment 1, 041.7 0.9306 0.0661
Other production 286.5 0.9440 0.0671
Production and distribution of electric power, gas andwater 1, 836.5 0.6022 0.0428
Calculation of the priorities for the rest of the criteria is made according to the same scheme. And thepriorities for the criterion "Wage" will be calculated by normalizing the data on average monthly grosswages of employees of organizations by kinds of economic activity. To determine the vector ofpriorities for "Profitability", data on the profitability level of the products sold and the produce (worksand services) by the type of economic activity are to be normalized. Priorities by the criterion of"Environment" are determined using data on waste production and consumption. To do this, theabsolute values of production and consumption waste must be converted to the rates of productionwaste capacity which are calculated by the formula:
WC =VOPPCW
,
where: WC – waste capacity;
PCW – production and consumption waste;
VOP – volume of own production (works, services) shipped.
As waste capacity is a negative characterization of economic activity, calculating the priorities, youmust first calculate the inverse vector of values, and then normalize the resulting numbers.
As a result of the above calculations we get the priorities of the elements of the fourth level of thehierarchy in relation to the elements of the third level, which are presented in Table 6.
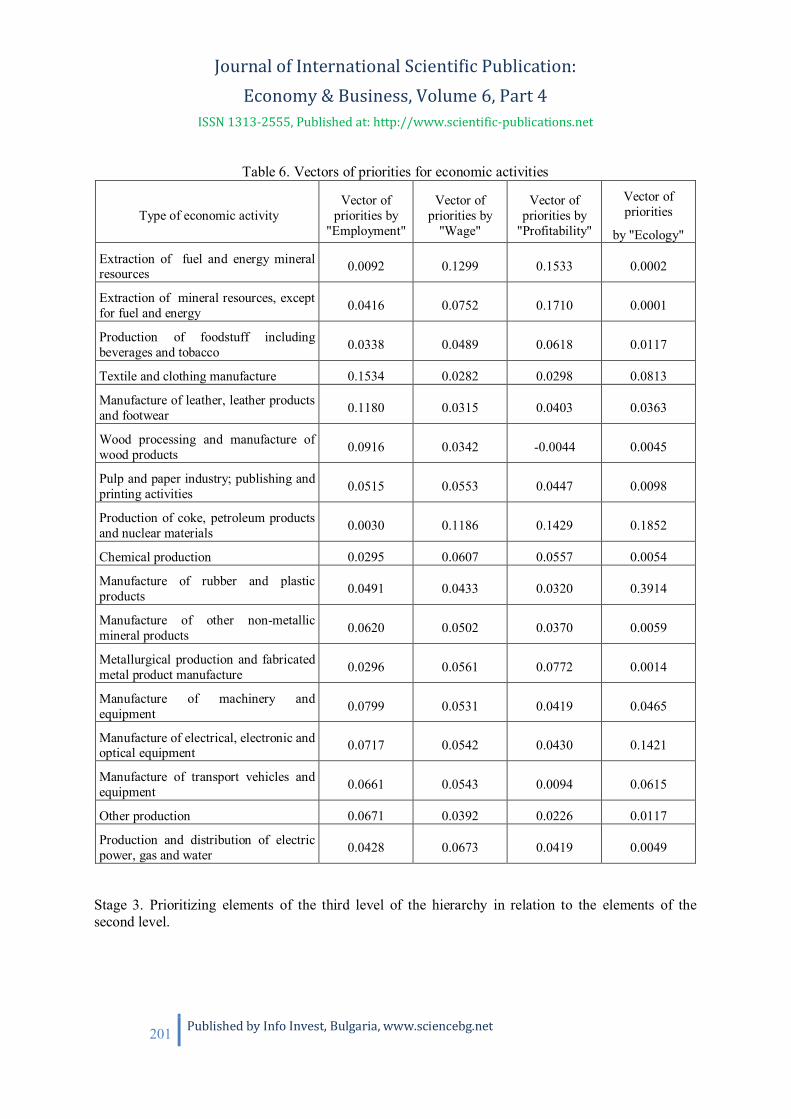
Journal of International Scientific Publication: Economy & Business, Volume 6, Part 4
ISSN 1313-2555, Published at: http://www.scientific-publications.net
201 Published by Info Invest, Bulgaria, www.sciencebg.net
Table 6. Vectors of priorities for economic activities
Type of economic activityVector of
priorities by"Employment"
Vector ofpriorities by
"Wage"
Vector ofpriorities by
"Profitability"
Vector ofpriorities
by "Ecology"
Extraction of fuel and energy mineralresources 0.0092 0.1299 0.1533 0.0002
Extraction of mineral resources, exceptfor fuel and energy 0.0416 0.0752 0.1710 0.0001
Production of foodstuff includingbeverages and tobacco 0.0338 0.0489 0.0618 0.0117
Textile and clothing manufacture 0.1534 0.0282 0.0298 0.0813
Manufacture of leather, leather productsand footwear 0.1180 0.0315 0.0403 0.0363
Wood processing and manufacture ofwood products 0.0916 0.0342 -0.0044 0.0045
Pulp and paper industry; publishing andprinting activities 0.0515 0.0553 0.0447 0.0098
Production of coke, petroleum productsand nuclear materials 0.0030 0.1186 0.1429 0.1852
Chemical production 0.0295 0.0607 0.0557 0.0054
Manufacture of rubber and plasticproducts 0.0491 0.0433 0.0320 0.3914
Manufacture of other non-metallicmineral products 0.0620 0.0502 0.0370 0.0059
Metallurgical production and fabricatedmetal product manufacture 0.0296 0.0561 0.0772 0.0014
Manufacture of machinery andequipment 0.0799 0.0531 0.0419 0.0465
Manufacture of electrical, electronic andoptical equipment 0.0717 0.0542 0.0430 0.1421
Manufacture of transport vehicles andequipment 0.0661 0.0543 0.0094 0.0615
Other production 0.0671 0.0392 0.0226 0.0117
Production and distribution of electricpower, gas and water 0.0428 0.0673 0.0419 0.0049
Stage 3. Prioritizing elements of the third level of the hierarchy in relation to the elements of thesecond level.

Journal of International Scientific Publication: Economy & Business, Volume 6, Part 4
ISSN 1313-2555, Published at: http://www.scientific-publications.net
202 Published by Info Invest, Bulgaria, www.sciencebg.net
At this stage, it is required to determine the degree of preference for each criterion, located on the thirdlevel of hierarchy in relation to business entities.
The calculation of the vector of priorities for households, companies and the state is presented intables 7, 8 and 9.
Table 7. The calculation of the vector of priorities for households
Criteria Employment Wage Profitability Environment Own vector Vector ofpriorities
Employment 1 3 9 5 3.4087 0.5651
Wage 1/3 1 7 3 1.6266 0.2696
Profitability 1/9 1/7 1 1/5 0.2374 0.0393
Environment 1/5 1/3 5 1 0.7598 0.1260
Table 8. The calculation of the vector of priorities for companies
Criteria Employment Wage Profitability Environment Own vector Vector ofpriorities
Employment 1 1/5 1/9 1/3 0.2934 0.0456
Wage 5 1 1/5 3 1.3161 0.2045
Profitability 9 5 1 7 4.2129 0.6545
Environment 3 1/3 1/7 1 0.6148 0.0955
Table 9. The calculation of the vector of priorities for the state
Criteria Employment Wage Profitability Environment Own vector Vector ofpriorities
Employment 1 7 9 3 3.7078 0.5824
Wage 1/7 1 3 1/5 0.5411 0.0850
Profitability 1/9 1/3 1 1/7 0.2697 0.0424
Environment 1/3 5 7 1 1.8481 0.2903
Stage 4. Prioritizing elements of the second level of the hierarchy in relation to the main goal and thecalculation of global priorities.
At this stage it is necessary to determine the degree of influence of each economic entity on the maingoal of the study. Depending upon country’s political and economic situation, its traditions andcustoms the actors' impact on the decisions may be different. Within the task considered, we assumethat each of the subjects of the economy has the same impact, so the vector of priorities will be(0.3333; 0.3333; 0.3333).

Journal of International Scientific Publication: Economy & Business, Volume 6, Part 4
ISSN 1313-2555, Published at: http://www.scientific-publications.net
203 Published by Info Invest, Bulgaria, www.sciencebg.net
After determining the priority of each level of hierarchy in relation to the higher level, the globalvector of priorities is computed. To do this, you first need to assess the priorities of economicactivities in relation to economic entities. They are calculated as the sum of the priorities of theelements of the fourth level of the hierarchy in relation to the elements of the third level and thepriorities of the third level elements in relation to the elements of the second one (Table 10).
Then the priorities of economic entities are consolidated in a single vector by finding the arithmeticmean of the priorities of households, companies and the state. Values of the found vector indicate thedesired result - an optimal industrial structure in Russia.
Table 10. Calculation of priorities of economic activities for economic actors
Type of economic activityVector of
priorities forhouseholds
Vector ofpriorities forcompanies
Vector ofpriorities for
the state
Extraction of fuel and energy mineral resources 0.0463 0.1273 0.0230
Extraction of mineral resources, except for fuel andenergy 0.0505 0.1292 0.0379
Production of foodstuff including beverages and tobacco 0.0362 0.0531 0.0299
Textile and clothing manufacture 0.1057 0.0400 0.1166
Manufacture of leather, leather products and footwear 0.0813 0.0416 0.0836
Wood processing and manufacture of wood products 0.0614 0.0087 0.0574
Pulp and paper industry; publishing and printingactivities 0.0470 0.0438 0.0394
Production of coke, petroleum products and nuclearmaterials 0.0626 0.1356 0.0716
Chemical production 0.0359 0.0507 0.0263
Manufacture of rubber and plastic products 0.0900 0.0694 0.1473
Manufacture of other non-metallic mineral products 0.0507 0.0378 0.0436
Metallurgical production and fabricated metal productmanufacture 0.0351 0.0635 0.0257
Manufacture of machinery and equipment 0.0670 0.0464 0.0663
Manufacture of electrical, electronic and opticalequipment 0.0747 0.0561 0.0894
Manufacture of transport vehicles and equipment 0.0601 0.0261 0.0614
Other production 0.0508 0.0270 0.0467
Production and distribution of electric power, gas andwater 0.0446 0.0436 0.0338

Journal of International Scientific Publication: Economy & Business, Volume 6, Part 4
ISSN 1313-2555, Published at: http://www.scientific-publications.net
204 Published by Info Invest, Bulgaria, www.sciencebg.net
Comparative analysis of the actual structure of the industry in 2009 and the optimal one is shown inTable 11.
The tables show that the Russian economy is characterized by its great unevenness with strongpredominance of some types of economic activities and weak development of others. For instance,20.55% of products shipped go to the extraction of fuel and energy minerals, whereas its optimal valueshould be lower by 13.99 points. Large deviations are also observed in the production and distributionof electric power, gas and water (9.74 points), food products, beverages and tobacco (8.81 points),metallurgical production and fabricated metal products (6.70 points). Meanwhile, such activities as themanufacture of rubber and plastic products, textile and clothing manufacture, manufacture of leather,leather products and footwear, are characterized by low rates of production and sales, whereas theAHP has prioritized these industries.
Thus, the results of the study clearly show the existing imbalances in the industry in Russia. Thestructure of the aggregate output is lopsided, and it is manifested in the predominance of economicactivities that are preferred by the companies, while the interests of other economic entities arepractically not taken into account. Application of the AHP to determine the optimal structure of theindustry allows to solve this issue comprehensively, considering various factors and the needs of awide range of participants. Results of the research conducted can be used to select the top priorityareas of investment, to identify economic activities that require government support most, and todetermine the vector of strategic development of the economy.
Table 11. The structure analysis of Russian industry
Type of economic activity Actual structure Optimalstructure Deviation
Extraction of fuel and energy mineral resources 20.55 6.55 -13.99Extraction of mineral resources, except for fuel and energy 2.51 7.25 4.75Production of foodstuff including beverages and tobacco 12.78 3.97 -8.81Textile and clothing manufacture 0.71 8.74 8.04Manufacture of leather, leather products and footwear 0.16 6.89 6.73Wood processing and manufacture of wood products 0.97 4.25 3.28Pulp and paper industry; publishing and printing activities 2.26 4.34 2.08Production of coke, petroleum products and nuclearmaterials 12.05 8.99 -3.06
Chemical production 4.81 3.76 -1.04Manufacture of rubber and plastic products 1.70 10.22 8.52Manufacture of other non-metallic mineral products 3.09 4.41 1.31Metallurgical production and fabricated metal productmanufacture 10.84 4.14 -6.70
Manufacture of machinery and equipment 3.63 5.99 2.36Manufacture of electrical, electronic and optical equipment 3.70 7.34 3.64Manufacture of transport vehicles and equipment 5.07 4.92 -0.15Other production 1.37 4.15 2.78Production and distribution of electric power, gas andwater 13.81 4.07 -9.74

Journal of International Scientific Publication: Economy & Business, Volume 6, Part 4
ISSN 1313-2555, Published at: http://www.scientific-publications.net
205 Published by Info Invest, Bulgaria, www.sciencebg.net
REFERENCES
1. Federal State Statistics service 2010, Statistical yearbook of Russia, Information and publishingcenter “Statistics of Russia”, Moscow.
2. Saaty, TL 1980, The analytic hierarchy process: planning, priority setting, resource allocation,McGraw-Hill International Book Co., New-York, London.

Journal of International Scientific Publication: Economy & Business, Volume 6, Part 4
ISSN 1313-2555, Published at: http://www.scientific-publications.net
206 Published by Info Invest, Bulgaria, www.sciencebg.net
THE EFFECT OF SERVICE QUALITY ON CUSTOMER SATISFACTION:
A RESEARCH IN PUBLIC AND UNIVERSITY HOSPITALS IN TURKEY11
Sebahattin Y ld z
Kafkas University, Faculty of Business and Administrative Sciences, Department
of Business Administration, Kars, Turkey
E-mail: [email protected]
AbstractThe main aim of this research was to determine which elements of service quality had the effect ofraising patient satisfaction to a higher level. The research was exploratory, with all data collected bymeans of a questionnaire. In Kars province in Turkey two State Hospitals (Public and Maternity)together with the University Hospital provided a convenience sample of some 265 outpatients to whomthe questionnaire was administered, and then all data analysed. In brief, the findings of the researchshow that even though the elements of service quality identified as 'investigatory services', 'servicesreceived prior to examination' and 'the physical surroundings' may vary according to the type ofhospital concerned, patient satisfaction would seem not to change regardless of the type of hospitalinvolved. However, the aspects of service quality identified as 'services received prior to examination'and 'the physical appearance of surroundings' did affect patient satisfaction; whilst the elementsdesignated as 'medical services', 'investigatory services' and 'services associated with registration'would not seem to affect patient satisfaction.
Key words: Service quality, customer satisfaction, hospital, Turkey, Kars
1. INTRODUCTION
Nowadays, companies find themselves struggling within a continuously rising cycle of competitionand, whether they lie within the manufacturing or service sectors, must make great efforts to ensuretheir advantage over competitors, and thus increase their market share. (Yava et al, 1997: 217–223).Hospitals and health institutions have found themselves forced to pay more attention to servicequality, and to differentiate within service provision, in order to ensure sustainability of existingresources and survival within an increasingly competitive environment. It would seem the focus onservice quality arises from the fact that it can be controlled, and from the customers' perspective, itprovides an indication of their value. From this it follows that different methods of measuring servicequality have been developed and continue to grow. This work examines data collected in Kars StateHospital, Kars Maternity Hospital and Kafkas University Hospital, on the effect of aspects of servicequality on patient satisfaction.
11 This article is a revised version of one presented to the 9th International Conference on Knowledge, Economy and Management held inBosnia & Herzegovina in June 23-25, 2011 and published on the CD of the conference proceedings.
Journal of International Scientific Publication: Economy & Business, Volume 6, Part 4
ISSN 1313-2555, Published at: http://www.scientific-publications.net
207 Published by Info Invest, Bulgaria, www.sciencebg.net
2. SERVICE QUALITY AND ITS EFFECT ON CUSTOMER SATISFACTION
Quality is something everyone feels they understand, but would also seem to be a concept which,when examined from all possible points of view, is impossible to define. (Edvardsson, Thomasson &Qvretveit, 1994: 77; Gümü o lu et al, 2007:38). When customers have paid for a service, and thatservice has been delivered, they should be able to give their own impressions of the quality of theservice they have received. Gronross (1984) states that service quality can be entwined withcustomers' perceptions and expectations, and for service managers to ensure outcomes of lasting value,the first step they should take is to introduce measurement of service quality. Consequently, it wouldseem possible to state that the concept of service quality should embrace the needs and expectations ofthe customer, aligned to core characteristics of the service, and by degrees the service will acquire asense of ownership with respect to its quality (Esin, 2002). The main components of service qualitycan be listed as: the service delivery environment and its appearance; timeliness of service delivery;expertise of those involved in delivery; offer of continuous service; and other factors such asreliability, accuracy and flexibility. Thus quality of health services should be defined, and perceived asbeing based upon, patient satisfaction throughout the different stages from the patient's initial contact,followed by diagnosis, treatment and care; at all times service quality should play a key role. At thesame time consideration should be given to what happens whilst the patient is waiting: the courtesyand consistency of staff; accessibility of service; whether or not the correct service is presented at thefirst attempt; how staff respond to and solve unexpected problems; and if the service is delivered ontime and completely; all of these play an important role within service quality (Tar m, 2000).
In the context of service quality measurement SERVQUAL, and other similar tools have beendeveloped (Parasuraman, Zeithaml & Berry, 1985; Y lmaz, 2007). According to Parasuraman,Zeithaml & Berry (1985, 1988) SERVQUAL measures 5 characteristics of service quality: reliability,assurance, tangibility, empathy and responsiveness (Parasuraman et al, 1988. p23).
In the current climate of competition for patients, high on the agenda of all health managers must bethe need to satisfy patients, and thus ensure that they will return to the hospital when necessary infuture. Ensuring patient satisfaction by meeting their needs and expectations, should result in thedesired outcome. In general, patient satisfaction can be seen as meeting the expectations of a givenpatient, or providing a given service which fits with the patient's perception. (Tar m, 2000;Kavuncuba , 2000: 291). Elements of patient satisfaction such as the actual patient, the staff involved,and characteristics of the physical surroundings and environment can all be linked. Considerationshould also be given to factors such as the patient's age, level of education, income, profession,gender, language, religion, race and family situation, all of which socio-demographic indicators canplay an important role in the context of patient satisfaction. Equally, service delivery personnel andphysical conditions can also affect satisfaction with the service. Patient satisfaction is one of the mostimportant factors in health service quality. Patient satisfaction is one of the basic outputs of healthservices which should be scrutinised throughout the health service delivery process, thus ensuring allpossible benefits (Demir, 1999:3). According to Önsöz et al (2008:33) patient satisfaction can bemeasured by asking questions based on the physical condition of the hospital; on satisfaction with staffinvolvement; on satisfaction in general; on whether or not they would use the hospital again; whetheror not they would recommend the hospital to others; and on what has been the most and leastsatisfying aspects of their hospital experience. Without doubt, it would seem clear that the importanceof measuring patient satisfaction has now been established. Latterly, it would seem that the subject ofpatient satisfaction has attracted even more attention, and work on its measurement has become evenmore widespread, in both the public and private health sectors (Hayran, 2005). To give a guarantee ofquality, or other similar assurance, patient satisfaction must be demonstrated. (Walker et al, 1998:
Journal of International Scientific Publication: Economy & Business, Volume 6, Part 4
ISSN 1313-2555, Published at: http://www.scientific-publications.net
208 Published by Info Invest, Bulgaria, www.sciencebg.net
193). In recent years, especially in developed countries such as the USA and Great Britain, patientsatisfaction features high on the list of outcome criteria drawn up by Health Ministries (Walker, 1998;Williams, 1994).
When conducting research within the service sector, in many other fields as well as the health sector, itwould seem that successful management within any such sector plays a critical role (Ya ç , 2006:218). An individual's past experiences, be they positive or negative, will be passed on to friends andacquaintances; expectations may find their way into all forms of media; age, gender, level ofeducation, social circumstances, the state of an individual's health or lack of same; a medical diagnosisand the patient's own personal perceptions of his/her state of health can all effect patient satisfaction(Forbes & Brown,1995: 737; Lin, 1996). Tükel et al (2004) produced a model based on factorseffecting patient satisfaction, when they investigated measured levels of satisfaction in patientsfollowing discharge, after in-patient treatment in the General Surgical Wards of one hospital. Ya c &Duman (2006) researched the characteristics of perceptions of quality within the outpatient clinics ofhospitals, and then investigated the relationship between the type of hospital involved and genericpatient satisfaction. They concluded that patient satisfaction was greatly affected in state hospitals bythe services encountered prior to examination, together with the appearance of the physicalsurroundings; in private hospitals all aspects of the service had equal impact; and in universityhospitals critical factors were the medical services, meeting of personal needs, investigatory servicesand appearance of physical surroundings. Önsöz et al (2008) investigated levels of patient satisfaction,and factors which influenced such levels, amongst in-patients at Marmara University Medical FacultyHospital. They concluded that the two most important factors affecting general levels of satisfactionwere the condition of the patients' rooms and the skill of the doctors. Özmen's (1990)’work revealedthat patients with low expectations and little relevant knowledge were the most satisfied, whilst thosewith knowledge of their condition or higher expectations were less satisfied. Zaim & Tar m (2010)applied SERVQUAL measures within Turkey's public hospitals and collected data on patientsatisfaction under five headings. These were reliability, assurance, tangibility, empathy andresponsiveness. They also asked patients whether or not they were satisfied with the services they hadreceived, and focused on patients' satisfaction with the hospitals in general, rather than with thehospital management or the doctors. Devebakan & Aksarayl (2003), carrying out research in a privatehospital in Izmir, examined the relationship between patients' demographic characteristics and theirevaluation of service quality. Their results showed that older patients deemed the service quality to bemore positive than younger patients; those of lower educational levels were more satisfied than theirmore educated counterparts; higher earners showed more satisfaction than those on lower incomes. Inthe same research work a modified version of the SERVQUAL measures was applied to the hospitalservices, and the most important aspects of service quality for patients were shown to be 'reliability'and 'trust'.
3. RESEARCH METHODOLOGY
The aim of this research was to examine the effects of elements of service quality on patientsatisfaction. Specifically the work aimed to produce an empiric study of the effects on patientsatisfaction within the health sector, of elements of service quality (services received prior toexamination, medical services, meeting individual patient needs and investigatory services, togetherwith physical appearance of surroundings). This research arose from the fact that in Kars province, inthe east of Turkey, health services are underused with inhabitants travelling to the nearest city,Erzurum, to receive treatment for even the most basic health issues. Hence it was predicated that if
Journal of International Scientific Publication: Economy & Business, Volume 6, Part 4
ISSN 1313-2555, Published at: http://www.scientific-publications.net
209 Published by Info Invest, Bulgaria, www.sciencebg.net
aspects of service quality in local institutions were investigated, weaknesses would be identified andcould be addressed, resulting in higher levels of patient satisfaction and increased usage of local healthservices. Research took place in the State, Maternity and University Hospitals in Kars province. Theresearch was based upon a questionnaire with 33 questions on service quality (Ya c & Duman, 2006)together with 4 questions on patient satisfaction derived from the literature (Önsöz et al, 2008) and atotal of 265 questionnaires were completed (by patients attending outpatient clinics). As this researchis considered to be exploratory it was decided to use a convenience sample rather than a randomsample.
Hypotheses used in this research are set out below:
H1: There are differences in aspects of service quality in different types of hospital.
H2: Patient satisfaction varies in different types of hospital.
H3: Aspects of service quality have a positive effect on patient satisfaction.
4. EMPIRICAL RESULTS
4.1. Demographic Characteristics
The sample of 265 patients taking part in this research comprised 107 in the Maternity Hospital, 61 inthe State Hospital and 97 in the University Hospital. The subjects were 191 female and 74 male. Theage range was 0-29 years, 123; 30-45 years, 79; and 46 years and over, 63.
4.2. Validity and Reliability
To test the validity of this research peer review and factor analysis were carried out. The servicequality questionnaire scored 94% on the Kaiser-Meyer-Olkin (KMO) test and the Bartlett testproduced a significance of .000. When service quality was considered in terms of 5 factors andvarimax rotational factor analysis applied to aspects of service quality, the total variance was 72.826.The 5 factors were, in order of application, medical services (F1); meeting personal needs andinvestigatory services (F2); services received from nurses and administrative personnel prior toexamination (F3); services relating to appointment-making and registration prior to examination (F4);physical appearance of surroundings (F5). Of the total 33 questions administered, 5 (questionsnumber 10,11,12,24,30) were removed from the final analysis because they would seem to have hadan adverse effect on the weight of factors and reduced reliability. In terms of patient satisfactionKMO was 82% and Bartlett significance .000. When varimax rotational analysis was applied withpatient satisfaction as the only factor the total variance was 81.01.
At the conclusion of factor analysis, for which questions had been grouped in line with factors, thosegroups which produced an eigen value greater than 1 were then collected according to responses, andreliability testing applied to reveal dependencies. Thus every single variable and mean relationshipbetween questions was evaluated to test the internal consistency of the measures. This showed that thereliability of the elements designated medical services (F1), meeting personal needs and investigatoryservices (F2), services received from nurses and administrative personnel prior to examination (F3),services relating to appointment-making and registration prior to examination (F4) and physicalappearance of surroundings (F5) were, in the same order, 0.95; 0.90; 0.90; 0.85; 0.82. The reliabilityof the patient satisfaction measure was 0.92. Finally the application of Cronbach’s Alpha coefficient ofreliability confirmed the reliability of the factors, and this was further reinforced by the relevantliterature which would seem to accept 70% and above (Nunnally, 1978; Altun k et al, 2004, p.115;

Journal of International Scientific Publication: Economy & Business, Volume 6, Part 4
ISSN 1313-2555, Published at: http://www.scientific-publications.net
210 Published by Info Invest, Bulgaria, www.sciencebg.net
Saruhan & Özdemirci, 2005, p.118). As can be seen, the content of the questionnaire and itsadministration, together with the measures chosen in the context of the health sector, can all be said tomeet required conditions for validity and reliability.
4.3. Means
Following factor analysis the aspects of quality service mean scores were as follows: medical services(F1) 5.39; physical surroundings (F5) 5.05; meeting personal needs and investigatory services (F2)5.00; appointment-making and registration services prior to examination (F4) 4.29; services receivedfrom nurses and administrative personnel prior to examination (F3) 4.24. The mean score on patientsatisfaction was 4.47. Thus it would seem that the most important aspect of service quality is ‘medicalservices’ and these should be evaluated for all patients in the clinic in terms of necessary treatment andcare, bearing in mind the vital role of correct diagnosis and appropriate treatment. It would also seemimportant to ensure that patients can contact the doctor when necessary, that they receive accurateinformation about their condition, and that they are given good advice to follow after discharge. Otheraspects of the doctor-patient relationship such as doctors' choosing which patients to treat, how theybehave towards patients and how any follow-up is handled would also seem crucial in this context.When a patient visits the doctor s/he expects that doctor to arrive at a correct diagnosis and prescribethe correct treatment. For this reason correct diagnosis and treatment play such an important role inservice quality. In second place was the element 'physical appearance of surroundings (5.050) whichfor a hospital should mean creating a calm, relaxing environment together with, for those who stay asin-patients, rooms which are clean and well-equipped, all of these feeding into effects on servicequality. The final place was taken by 'services received from nurses and administrative personnel priorto examination which scored (4.244).
4.4. Correlation Analysis
The Table below sets out the results of factor analysis on the relationship between the elements ofservice quality.
Table 1: Correlation AnalysisVARIABLES F1 F2 F3 F4 F5 PSF1 (Medical services) 1F2 (Meeting personal needsand investigatory services)
.669** 1
F3 (Services received fromnurses and admin. personnelprior to examination )
.554** .637** 1
F4 (Services relating toappointment-making andregistration prior toexamination)
.634** .721** .640** 1
F5 (Physical appearance ofsurroundings)
.544** .591** .505** .593** 1
PS (Patient satisfaction) .536** .566** .574** .568** .581** 1
** p < 0.01

Journal of International Scientific Publication: Economy & Business, Volume 6, Part 4
ISSN 1313-2555, Published at: http://www.scientific-publications.net
211 Published by Info Invest, Bulgaria, www.sciencebg.net
As can be seen from Table 1 which ranks the relationship between variables, the highest ranking isbetween 'meeting personal needs and investigatory services' (F2) and 'services relating to appointment-making and registration prior to examination' (F4); and the lowest ranking is between 'servicesreceived from nurses and admin. Personnel prior to examination' (F3) and 'physical appearance ofsurroundings' (F5).
4.5. Difference Analysis
Whether or not the type of hospital concerned had an impact on aspects of service quality and patientsatisfaction was also investigated, and the results can be seen in the Table below. From this it can beseen that whilst Hypothesis 2 is rejected, Hypothesis 1 should be accepted for the elements 'meetingpersonal needs and investigatory services' (F2), 'services received from nurses and administrativepersonnel prior to examination' (F3) and 'physical appearance of surroundings' (F5).
Table 2: Difference Analysis by Type of HospitalDependent Variable Independent
Variable (Type ofHospital )
N Mean S.D FValue
pValue
F1 (Medical services)(H1 REJECT)
Maternity 107 5.35 1.370.45 0.64State 61 5.29 1.87
University 97 5.5 1.32F2 (Meeting personalneeds and investigatoryservices)(H1 ACCEPT)
Maternity* 107 4.84 1.393.854 .022State 61 4.8 1.7
University* 97 5.31 1.13
F3 (Service receivedfrom nurses and admin.personnel prior toexamination)(H1 ACCEPT)
Maternity 107 4.25 1.18
3.881 .022State* 61 3.9 1.4University* 97 4.44 1.06
F4 (Service related toappointment-making/registration andwaiting forexamination) (H1REJECT)
Maternity 107 4.78 1.46
2.273 .105State 61 4.78 1.69University 97 5.18 1.31
F5 (Physicalappearance ofsurroundings)(H1 ACCEPT)
Maternity* 107 4.65 1.588.387 .000State 61 5.05 1.57
University* 97 5.5 1.25
PS (PatientSatisfaction) (H2 REJECT)
Maternity 107 2.67 1.761.27 0.28State 61 4.56 1.87
University 97 4.64 1.63
* Post hoc analysis revealed meaningful differences according to the source of the group.

Journal of International Scientific Publication: Economy & Business, Volume 6, Part 4
ISSN 1313-2555, Published at: http://www.scientific-publications.net
212 Published by Info Invest, Bulgaria, www.sciencebg.net
The University Hospital would seem to be better than the Maternity Hospital in terms of 'meetingpersonal needs and investigatory services', but this could be because the University Hospital has fewerpatients and thus is better able to meet their needs and provide a higher quality of service. Indeed, itwould seem that owners of a social security green card will not go to the University Hospital unlessthey are specifically sent there. In the context of 'services received from nurses and administrativepersonnel prior to examination' the University Hospital again would seem to offer a higher quality ofservice than the State Hospital. However, as above, the University Hospital's nurses andadministrative personnel deal with fewer patients and thus the quality of service is raised. TheUniversity Hospital would also seem to score higher than the Maternity Hospital for 'physicalappearance of surroundings', but this could be because the building is new, in-patient rooms have only2 or 3 beds, and the rooms are clean, light and airy. Lower levels of service quality at the MaternityHospital could be connected to the fact that the hospital is crowded with 8 – 10 beds per room, thebuilding is old, it is hard to reach from the city centre, and has a great number of outpatients on a dailybasis, the vast majority of whom are babies, children and pregnant women. Consideration should alsobe given to anecdotal evidence showing that the number of doctors at all three hospitals is inadequate,that much of their work is routine services delivered between stated times, that the doctors in thehospitals are mostly young and inexperienced, and when a post becomes vacant it can be someconsiderable time before it is filled. Consequently at all three hospitals 'medical services' show nodifferences. Furthermore all three hospitals reveal 'appointment-making and registration services priorto examination' to be the same. To register at any of the three hospitals the patient must appear at thehospital in person, it is not possible to register by telephone, hence waiting times followingregistration mean that sometimes the patient cannot be seen by a doctor on the same day, but servicesreceived during registration, appointment-making and waiting prior to examination showed nodifferences between hospitals.
A difference analysis on demographic variables was also carried out. This revealed that gender, levelof education and income had no meaningful effect on elements of service quality or patientsatisfaction. However, the age variable, whilst making no difference to aspects of service quality, didshow a meaningful effect on patient satisfaction (F:3.340; p:0.037). Post hoc testing gave thefollowing differences between two groups of patients: 'age 29 and below' (N:123; M: 4.29) togetherwith 'age 46 and above' (N:63; M:4.96) from which it would seem that the group 'age 46 and above'experience greater satisfaction than patients in the group 'age 29 and below'.
4.6. Regression Analysis
Analysis was also carried out to determine which elements of service quality had an affect on patientsatisfaction and the tables below give the results in 'General' terms and also 'By Type of Hospital'.These show that the H3 hypothesis should be accepted for 'service received from nurses andadministrative personnel prior to examination' and for 'physical appearance of surroundings'.
According to the regression analysis that was carried out, the elements of service quality having aneffect on patient satisfaction were 'services received from nurses and administrative personnel prior toexamination' (F3) and 'physical appearance of surroundings' (F5). Thus it would seem that the nurse-patient relationship has a significant effect on patient satisfaction, and health workers in generalshould conform to expected norms of attitude and behaviour, ensuring they act professionally,displaying appropriate skills, and are seen to be courteous, compassionate and take an interest in theirpatients. The time prior to examination by a doctor, when the patient is waiting, looking at equipmentand hospital workers, would seem to have an effect on patient satisfaction. In particular, considerationshould be given to the period following registration, and prior to meeting with a doctor, during which

Journal of International Scientific Publication: Economy & Business, Volume 6, Part 4
ISSN 1313-2555, Published at: http://www.scientific-publications.net
213 Published by Info Invest, Bulgaria, www.sciencebg.net
the patient, and any family members/friends accompanying him/her, may have to complete furtherbureaucratic processes, with a surfeit of requests for information, in a place crowded with peopleforming long queues. Furthermore, after this phase the amount of time during which the doctoractually delivers medical services to a patient can seem very short. Patients who go to a hospital do sowith the express intention of seeing a doctor, and waiting in a crowded space can skew theirperceptions of the hospital concerned. If seeing the doctor can be made quick and easy, this willnaturally raise the level of general satisfaction. On another issue, financial constraints often lead to thephysical appearance of surroundings in many hospitals being somewhat lacking. All too oftenbuildings seem old and in need of repair and maintenance, there is insufficient equipment and thehospital personnel's appearance can also leave much to be desired. If issues such as these are notaddressed, and improvements attained, they will have an effect on patient satisfaction.
Table 3: General Regression Model
Dependent Variable:General SatisfactionLevel
eta p- value Adjusted R2 F- value p-value
F1 (Medical services)(H3 REJECT)
0.15 0.05
0.466 47.064 0.000
F2 (Meeting personalneeds andinvestigatoryservices)
(H3 REJECT)
0.11 0.24
F3 (Services receivedfrom nurses & admin.personnel prior toexamination)
(H3 ACCEPT)
0.35 0
F4 (Appointment-making andregistration servicesprior to examination)(H3 REJECT)
0.13 0.14
F5 (Physicalappearance ofsurroundings)
(H3 ACCEPT)
0.32 0
Separate regression analysis was also carried out on each of the hospitals involved, which revealed theelements of service quality having an effect on patient satisfaction for the three different types ofhospital. Results are set out in the Table below.
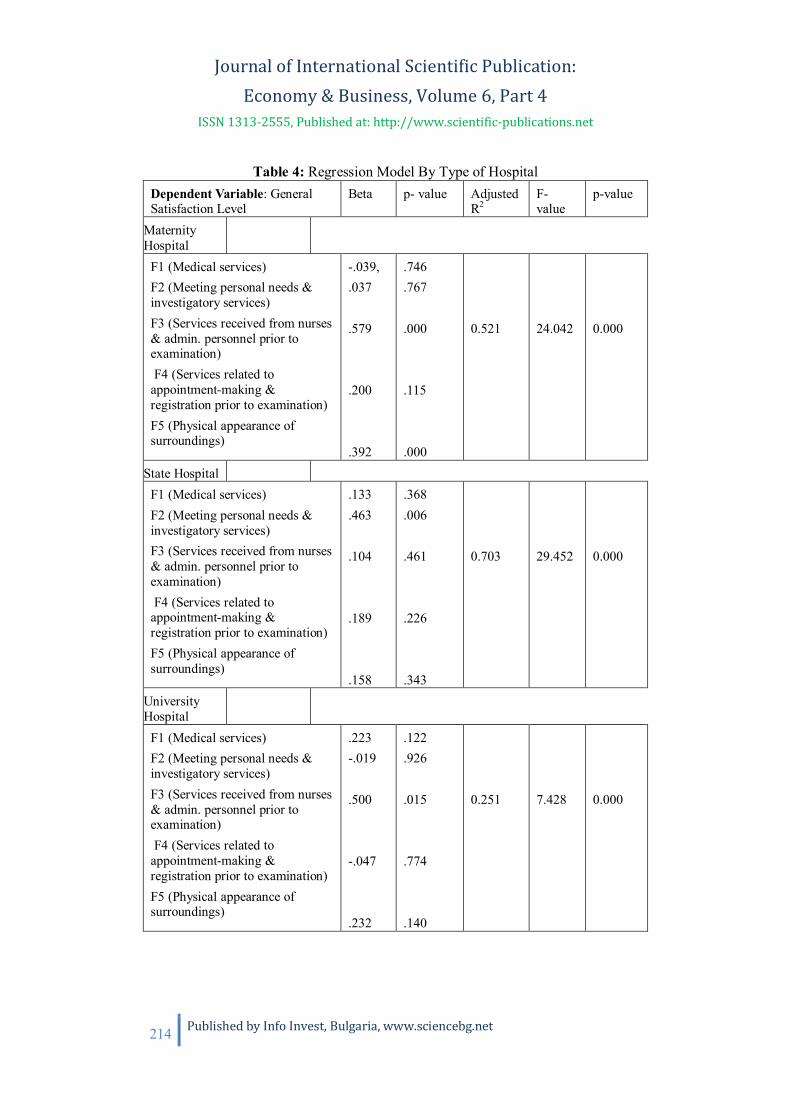
Journal of International Scientific Publication: Economy & Business, Volume 6, Part 4
ISSN 1313-2555, Published at: http://www.scientific-publications.net
214 Published by Info Invest, Bulgaria, www.sciencebg.net
Table 4: Regression Model By Type of HospitalDependent Variable: GeneralSatisfaction Level
eta p- value AdjustedR2
F-value
p-value
MaternityHospital
F1 (Medical services)F2 (Meeting personal needs &investigatory services)F3 (Services received from nurses& admin. personnel prior toexamination) F4 (Services related toappointment-making ®istration prior to examination)F5 (Physical appearance ofsurroundings)
-.039,.037
.579
.200
.392
.746
.767
.000
.115
.000
0.521 24.042 0.000
State HospitalF1 (Medical services)F2 (Meeting personal needs &investigatory services)F3 (Services received from nurses& admin. personnel prior toexamination) F4 (Services related toappointment-making ®istration prior to examination)F5 (Physical appearance ofsurroundings)
.133
.463
.104
.189
.158
.368
.006
.461
.226
.343
0.703 29.452 0.000
UniversityHospital
F1 (Medical services)F2 (Meeting personal needs &investigatory services)F3 (Services received from nurses& admin. personnel prior toexamination) F4 (Services related toappointment-making ®istration prior to examination)F5 (Physical appearance ofsurroundings)
.223-.019
.500
-.047
.232
.122
.926
.015
.774
.140
0.251 7.428 0.000

Journal of International Scientific Publication: Economy & Business, Volume 6, Part 4
ISSN 1313-2555, Published at: http://www.scientific-publications.net
215 Published by Info Invest, Bulgaria, www.sciencebg.net
For the Maternity Hospital it would seem that 'services received from nurses and administrativepersonnel prior to examination' (F3) together with 'physical appearance of surroundings' (F5) both hada positive effect on patient satisfaction. There is no doubt that nursing services are an important factorin patients' hospital experience, and their associated sense of satisfaction or dissatisfaction, and thusthe impact of nursing personnel, and their effect on and behaviour towards patients, should beconsidered as one of the basic elements within patient satisfaction. The importance of quality nursingservices and their impact on patient satisfaction would seem to be clear, in that nurses spend most timewith patients, meeting various of their needs; plus responsibility for the individual patient's on-goinghealth, and any necessary rehabilitation, will lie with the nurses and administrative personnel in thefirst instance. If physical and social conditions in the hospital could be tailored to give an individualthe feeling that s/he is 'at home' then it would seem a rise in satisfaction would follow. Furthermore, ifpatients could be given the comfort of feeling 'at home' in the hospital, together with appropriateinformation and a feeling that they are valued, they would certainly be more trusting of the treatmentand care they are given, and have an increased awareness of the health personnel charged withdelivery. In the context of the Maternity Hospital consideration should be given to the fact that thepatients are women, who may not be ill, but are there to give birth to a child, and hence they arepsychologically disposed to show higher levels of patient satisfaction when compared with genuinelyill patients in other hospitals. In the State Hospital it would seem that 'meeting personal needs andinvestigatory services' (F2) has a positive impact on patient satisfaction. In the State, Maternity andUniversity Hospitals there is a wide range of technical services used to support diagnosis: radiology,scanning, taking of samples and laboratory services; hence it could be the plethora of such servicesresults in an impact on service satisfaction. In the University Hospital 'services received from nursesand administrative personnel prior to examination' (F3) would seem to have a positive effect on patientsatisfaction. It is possible that the recently established University Hospital, with lower numbers of daypatients and outpatients, and nurses and other personnel dealing with lower patient numbers whencompared to the other two hospitals, can thus deliver a higher level of nursing care which has animpact on patient satisfaction.
5. DISCUSSION AND IMPLICATIONSIt would seem clear that health services in Kars province are unsatisfactory and thus patients travel tothe nearest city outside the province, Erzurum, for even the most simple of health issues. Thus it isnecessary to raise the level of local patient satisfaction, by clearly defining elements of service qualityand instigating measures to correct the current situation, for which this research could be used as abasis to address a problematic reality. The results of this research show that elements of servicequality can have a positive impact on patient satisfaction (H3 Accept), that the type of hospital caneffect different aspects of service quality (H1 Accept) but the type of hospital would not seem to makea difference to overall levels of patient satisfaction (H2 Reject). Finally the Table below shows whichaspects of all the hospitals seem to be satisfactory, and which are in need of further development.
In terms of elements of service quality the Maternity Hospital would seem to be satisfactory for'services received from nurses and administrative personnel prior to examination' (F3) and 'physicalappearance of surroundings' (F5). However, 'medical services' (F1), 'meeting personal needs andinvestigatory services' (F2) and 'services relating to appointment-making and registration prior toexamination' (F4) would all seem to be unsatisfactory. The State Hospital is deemed satisfactory forF2 but fails to meet the standard for F1, F3, F4 and F5. Finally the University Hospital is satisfactoryfor F3 only, and unsatisfactory for F1, F2, F4 and F5. With regard to F1 it could reflect the fact that
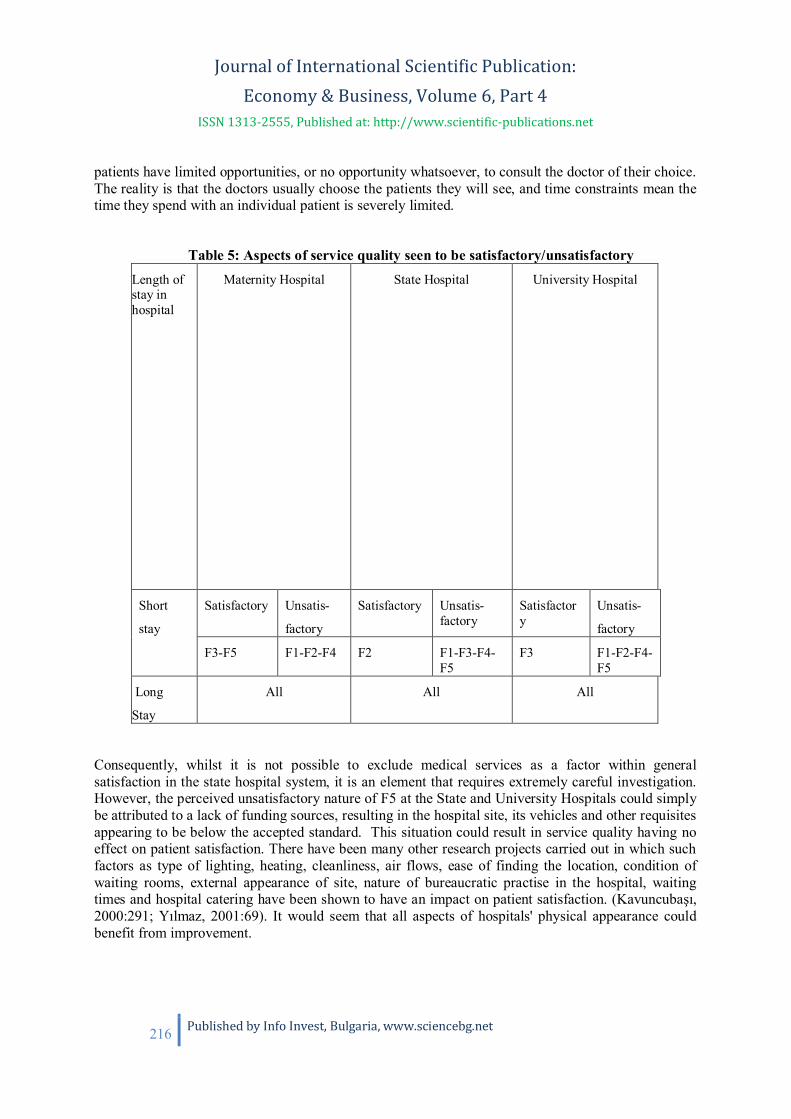
Journal of International Scientific Publication: Economy & Business, Volume 6, Part 4
ISSN 1313-2555, Published at: http://www.scientific-publications.net
216 Published by Info Invest, Bulgaria, www.sciencebg.net
patients have limited opportunities, or no opportunity whatsoever, to consult the doctor of their choice.The reality is that the doctors usually choose the patients they will see, and time constraints mean thetime they spend with an individual patient is severely limited.
Table 5: Aspects of service quality seen to be satisfactory/unsatisfactoryLength ofstay inhospital
Maternity Hospital State Hospital University Hospital
Short
stay
Satisfactory Unsatis-
factory
Satisfactory Unsatis-factory
Satisfactory
Unsatis-
factory
F3-F5 F1-F2-F4 F2 F1-F3-F4-F5
F3 F1-F2-F4-F5
Long
Stay
All All All
Consequently, whilst it is not possible to exclude medical services as a factor within generalsatisfaction in the state hospital system, it is an element that requires extremely careful investigation.However, the perceived unsatisfactory nature of F5 at the State and University Hospitals could simplybe attributed to a lack of funding sources, resulting in the hospital site, its vehicles and other requisitesappearing to be below the accepted standard. This situation could result in service quality having noeffect on patient satisfaction. There have been many other research projects carried out in which suchfactors as type of lighting, heating, cleanliness, air flows, ease of finding the location, condition ofwaiting rooms, external appearance of site, nature of bureaucratic practise in the hospital, waitingtimes and hospital catering have been shown to have an impact on patient satisfaction. (Kavuncuba ,2000:291; Y lmaz, 2001:69). It would seem that all aspects of hospitals' physical appearance couldbenefit from improvement.
Journal of International Scientific Publication: Economy & Business, Volume 6, Part 4
ISSN 1313-2555, Published at: http://www.scientific-publications.net
217 Published by Info Invest, Bulgaria, www.sciencebg.net
Individual characteristics of health workers can affect patient satisfaction. Personnel demonstratingcourtesy and kindness, and taking an interest in their patients, together with observable skills andexperience (F3) in the health services they are supplying, will have a positive effect on service quality.Consequently it would seem that to improve standards amongst personnel at the State Hospital, theirworking hours need to be clearly defined and their workload reduced. Furthermore, hospital personnelwho come into direct contact with patients, are dependent on regular training in the context of theservices they are expected to provide. In many situations an individual's health needs are known, andby simply discussing such needs and providing further information, health personnel can give thepatient a sense that s/he is valued. Work has been carried out in this context,which shows that merelytalking to the patient about the direction their treatment will take, and giving them further information,can result in a rise in the patients' trust of health personnel, and an increase in their sense ofsatisfaction. (Uz et al pp.13-118, Williams 1993 pp.28-331, Y lmaz 2001 pp.7). Alongside this,information programmes for patients can be implemented. In this country many institutions havesuccessfully introduced a philosophy of 'Towards Total Quality' which also needs to be adopted in thehospitals in Kars. From the point of view of the institutions involved this work should be carried out,and it would be advantageous to create a dedicated team for its application. For the long term,achieving satisfactory levels for all elements of service quality within all hospitals, should feature highon the list of strategic planning outcomes. In the short term different hospitals need to apply their ownpriorities. Businesses naturally try to use their unique advantages to overcome competition. Whilstusing such advantages can have an impact in the short term, at the same time weaknesses can beaddressed and preliminary work undertaken towards a longer term strategy. (Ya ç et al 2006 pp:218-238). Furthermore, from the institutions' viewpoint patient satisfaction is extremely important, lyingwithin their framework of objective criteria which must be attained by continuously establishingparameters, striving to improve service quality and ensure successful treatment. A patient who issatisfied with hospital services, having received good care and successful treatment, contributes to thesense of achievement at the hospital. Such a patient, having initially arrived at the hospital in aworried, negative condition leaves, following a positive experience, with renewed faith in the hospitaland its services. Both patients and health workers want and need to feel valued, and to achieve thisthere should be continuous research and evaluation, leading to implementation and development.
6. LIMITATIONS AND FUTURE RESEARCH
On examining the limitations of this research it would seem limited by being confined to the healthsector, when service quality also applies to other sectors, and also by virtue of the fixed time periodduring which data was collected. Constraints of time and finance decreed that the data analysed herewas collected in one month (April) during 2011. In the context of future work on service quality, itwould seem appropriate to carry out similar work in hospitals in other provinces and compare theresults. Finally, the work could be extended beyond the outpatients attending clinics studied here, tocover in-patients and/ or emergency admissions.
REFERENCES
1. Banar, Kerim-Vedat Ekergil (2010), “Muhasabe meslek mensuplar n n hizmet kalitesi:Sunulan hizmetlerin kalitesi ile mü teri memnuniyeti ili kisi” Eski ehir Uygulamas ,Anadolu Üniversitesi Sosyal Bilimler Dergisi. Cilt/Vol:10-Say /No:1, s.39-60.
Journal of International Scientific Publication: Economy & Business, Volume 6, Part 4
ISSN 1313-2555, Published at: http://www.scientific-publications.net
218 Published by Info Invest, Bulgaria, www.sciencebg.net
2. Demir, C. (1999) “GATA E itim Hastanesi Polikliniklerinde Hasta Tatmin DüzeyininSaptanmas ”, Sa l k Kurulu lar ve Hastane Yönetimi, Haberal E itim Vakf , s: 3-11.
3. Devebakan, N.-M. Aksarayl , (2003). “Sa l k i letmelerinde alg lanan hizmet kalitesininölçümünde servqual skorlar n n kullan m ve Özel Alt nordu Hastanesi uygulamas ”.Dokuz Eylül Üniversitesi Sosyal Bilimler Enstitüsü Dergisi, 5(1), s.38-54.
4. Edvardsson, Bo., Thomasson, Bertil and Qvretveit, John, (1994) Quality of ServiceMaking It Really Work, UK: Mc Graw-Hill.
5. Esin, Alp (2002), “ISO 9001:2000 I Alt nda Hizmette Toplam Kalite”, METU PressODTÜ Geli tirme Vakf Yay n , Ankara.
6. Forbes L.M.- N.H. Brown (1995), “Developing a instrument for measuring patientsatisfaction”, AORN Journal, 61 (4), s.737-743.
7. Gronross, Christian (1984). “A Service Quality Model and Its Marketing Implications”.European Journal of Marketing, 18(4), s.36-44.
8. Gümü o lu, evkinaz, e PIRNAR, Perran AKAN-Atilla AKBABA (2007), “HizmetKalitesi”, Detay Yay nc l k, Ankara.
9. Hayran, O- H.Sur (2005), “Sa l k letmelerinde Yönetim”. stanbul, Sayed Yay nlar .
10. Kavuncuba , .(2000) “Hastane ve Sa l k Kurumlar Yönetimi”,Siyasal Kitapevi, Ankara.
11. Lin, C.C. (1996), “Patient satisfaction with nursing care as an outcome variable: dilemmasfor nursing evaluation researchers”. Journal of Professional Nursing, 12(4), s.737-743.
12. Önsöz, Muhammed Fatih, Ahmet Topuzo lu, U. Can Cöbek, Sercan Ertürk-Birol FatmaY lmaz (2008), “ stanbul’da bir T p Fakültesi Hastanesi’nde yatan hastalar n memnuniyetdüzeyi”, Marmara Medical Journal,21(1); s.33-49.
13. Özmen, D (1999), “Dokuz Eylül Üniversitesi T p Fakültesi Hastanesi'nde yatan hastalar nbeklentilerinin saptanmas ”, II.Ulusal Hem irelik Kong. Bildirileri Kitab , zmir,s.532-538.
14. Parasuraman, A., V. Zeithaml-L.Berry (1985), “A Conceptual Model of Service Qualityand Its Implications for Future Research”,Journal of Marketing, 49 (4), s.41-50.
15. Parasuraman, A., L. Berry,- V. Zeithaml, (1988) “SERVQUAL: A multiple item scale formeasuring consumer perceptions of service quality”, Journal of Retailing, 64 (19), s.12-40.
16. Tar m, Mehve , (2000), “Hizmet Organizasyonlar nda (Hastanelerde) Kalite”, Prof. Dr.Nusret Ekin’e Arma an, Türk A r Sanayii ve Hizmet Sektörü Kamu verenleri SendikasYay n No:38, Ankara.
17. Tükel Burhan, A. Münir Acuner, Ö. R fk Önder-Arzu Üzgül (2004): “Ankara Üniversitesibn-i Sina Hastanesi’nde yatan hasta memnuniyeti (Genel Cerrahi Anabilim Dal örne i)”,
Ankara Üniversitesi T p Fakültesi Mecmuas , Cilt 57, Say 4, s: 205-214.
18. Ya ç , M. .- T.Duman (2006), “Hizmet kalitesi - mü teri memnuniyeti ili kisinin hastanetürlerine göre kar la t r lmas : devlet, özel ve üniversite hastaneleri uygulamas ”,Do uÜniversitesi Dergisi, 7(2) s.218-238.

Journal of International Scientific Publication: Economy & Business, Volume 6, Part 4
ISSN 1313-2555, Published at: http://www.scientific-publications.net
219 Published by Info Invest, Bulgaria, www.sciencebg.net
19. Yava , U., Z. Bilgin., D. Shemwell, D.(1997), “Service Quality in the Banking Sector inan Emerging Economy: A Consumer Survey”, International Journal of Bank Marketing,Vol. 15, No. 6, s. 217–223.
20. Y lmaz V., Z. Filiz.,-B. Yaprak (2007), “Servqual yöntemiyle yüksekö retimde hizmetkalitesinin ölçülmesi”. Anadolu Üniversitesi Sosyal Bilimler Dergisi. 7(1), s.299-316.
21. Zaim H.- M. Tar m (2010), “Hasta Memnuniyeti: Kamu Hastaneleri Üzerine Bir AlanAra t rmas ”. Sosyal Siyaset Konferanslar , Say : 59 (2), s. 1–24.
22. Walker, R- J. Adam, (1998), “Time-Sensitive clinical management: A Case study of acuteasthma care”, Soc. Sci. Med. 46 (4-5): 539-547.
23. Williams, B. (1994), “Patient satisfaction : a valid concept?”, Social Science andMedicine, 38(4), s.509-516.
24. http://www.hastanedergisi.com/sayi13/busayida25.asp (Erisim: 06.09.2007).
Journal of International Scientific Publication: Economy & Business, Volume 6, Part 4
ISSN 1313-2555, Published at: http://www.scientific-publications.net
220 Published by Info Invest, Bulgaria, www.sciencebg.net
FINANCIAL EFFICIENCY ANALYSIS OF A HIGHER EDUCATION INSTITUTION IN
TURKEY BY DATA ENVELOPMENT ANALYSIS APPROACH: THE CASE OF
LANGUAGE EDUCATION CENTER (TÖMER) OF ANKARA UNIVERSITY
Ali Argun KARACABEY, Faz l GÖKGÖZ
Ankara University, Faculty of Political Sciences,
Quantitative Methods (Department of Management),
06600 Cebeci, Ankara / TURKEY.
e-mail: [email protected]; [email protected]
Abstract
Ankara University TÖMER, a landmark institution of Turkey, utilizes latest, contemporarytechnologies in the teaching of Turkish and foreign languages and in designing teaching techniques.In this study, the comparative efficiency measurement for the 10 different branches of AnkaraUniversity TÖMER has been carried out by the inputs and outputs of each branches for 2009-2011period by means of Data Envelopment Analysis, a linear programming based model. Technical, pureand scale efficiencies of teaching branches of TÖMER have been determined via CCR model byCharnes et al. (1978) and BCC model by Banker et al. (1984). The relative CCR and BCC efficiencieshave been evaluated for TÖMER branches. Finally, considering the actual and projected weights ofdecision variables, we have also evaluated the potential improvement rates of the variables in theCCR and BCC models. The DEA analyses have revealed that all TÖMER branches in 2011 havedisplayed better efficiencies compared to that of 2009 by CCR and BCC models.
Key words: Efficiency Measurement, Data Envelopment Analysis, Educational Finance, Turkey.
1. INTRODUCTION
Academicians and practitioners have a great deal of interest on performance analyses, efficiency andproductivity since these are used as measurement tools while making comparisons. When studiesrelated to performance measurement are analyzed, more than one method is seen. As a result of thestudies, generally qualitative data sets are turned into quantitative data sets by applying certainmethods, thus having more objective results. In literature there is more than one method when it comesto efficiency studies. These methods are separated into two groups; parametric methods and non-parametric methods. When literature studies are analyzed it can be seen that non-parametric methodsare used more often. The reason behind is that parametric methods are applied under assumptions andcan unable to explain existing situations fully. Non-parametric methods do not require assumptionswhen data set is considered, thus such methods are more attractive to researchers.
Data Envelopment Analysis (DEA) is generally used in hospitals (Banker et.al., 1986), restaurants(Banker and Morey, 1986), health care institutions (Smith and Mayston, 1987), junior high schools(Thanassoulis and Dunstan, 1994), universities (Athanassopoulos and Shale, 1997; Johnes and Johnes,1993), professional basketball leagues (Alp and Gölcüklü, 2000), banks (Cingi and Tar m, 2000) whilesetting the efficiency levels.
Journal of International Scientific Publication: Economy & Business, Volume 6, Part 4
ISSN 1313-2555, Published at: http://www.scientific-publications.net
221 Published by Info Invest, Bulgaria, www.sciencebg.net
Besides, DEA is one of the most commonly used mathematical programming technique among non-parametric methods (Karacabey, 2001).
DEA is a useful method to determine similar decision making units’ relative efficiency levels. It hassome sort of linear programming characteristic. This method is generally used in analyzingeducational institutions’ efficiency results.
Rugerio (1996) has argued that his paper suggests incorporating programming results into a second-stage multivariate regression analysis. For illustrative purposes, this technique is applied to analyzeNew York State school districts.
Waxman et. al. (1997), investigated the achievement of test scores and school demographic datawere used initially to determine the efficiency and effectiveness ratings of 167 elementary schoolsfrom a large urban school district in the south central region of the United States America.
Ng and Li (2000), examine that utilizing data from 84 key Chinese higher education institutions. It isfound that research performance of institutions across regions has improved, although the institutionsas a whole have remained inefficient from 1993 to 1995.
Grosskopft and Moutray(2001) analyze the changes in performance for Chicago high schools between1989 and 1994 following the introduction of site-based management in 1988. They modeled thechange upon the focus on decentralized control following Grosskopf et.al. (1999), and used costindirect output distance functions to model decentralized control.
Abbott and Doucouliagos (2003) make a study of non-parametric techniques which are used toestimate technical and scale efficiency of individual Australian universities.
Kuaha and Wonga (2011) measure that assessing the efficiency of universities is Vital for effectiveallocation and utilization of educational resources.
Ankara University TÖMER is a landmark institution of Turkey that utilizes latest, contemporarytechnologies in the teaching of Turkish and foreign languages and in designing teaching techniques. Inthe framework of educational finance, analyzing the financial efficiency levels of TÖMER Brancheshas of great importance.
The number of students who learn Turkish in TÖMER Head Offices and Branches in the educationalyear 2010-2011 in Turkey has reached 20.401 including Government grantees. Foreign languageclasses for the senior personnel in Public Institutions who will be sent for Basic Training andSpecialization Training of European Communities Research and Implementation Center of ouruniversity have also continued.
In this regard, the goal of this study is to analyze the financial efficiencies of the 10 branches ofTÖMER comparatively for the period in 2009-2011. We have investigated the financial efficiencies ofthe mentioned education branches in terms of technical, pure and scale efficiencies.
The paper is organized as follows: The operational and technical figures regarding the TÖMERbranches are given in part one. Besides, the DEA technique has been mentioned the second part. Theempirical results have been given in the third part. General results and evaluations have been made inthe last part of the paper.

Journal of International Scientific Publication: Economy & Business, Volume 6, Part 4
ISSN 1313-2555, Published at: http://www.scientific-publications.net
222 Published by Info Invest, Bulgaria, www.sciencebg.net
2. CURRENT STATUS OF TÖMER
Foreign language education centers are of great importance in education systems. However, most ofthe universities have various education centers within their academic establishments. Turkey plays animportant role in foreign language education area. In this respect, Ankara University, a leadingEuropean University that has core competences in social sciences, heath sciences, education andengineering etc., involves a landmark foreign education center, known as TÖMER, since 1984.
In the educational year 2010-2011, TÖMER provided education in 13 foreign languages in addition toTurkish. Language teaching activities have continued with great attendance at TÖMER branches in 7cities; in addition to which, courses of diction and rhetoric, speed reading and creative writing andEnglish courses for primary school students have also been opened.
The operational figures of TÖMER branches for 2009–2011 period have been illustrated in Table 1.
Table1: Operational Figures of TÖMER Branches in 2009-2011 period.
As can be seen from the Table 1, total of expenditure of TÖMER branches has remained the same.The total expenditure of TÖMER remain equal level, personal expenditure has decreased by 4.617.034$ and reached to 4.414.391$ at the same period, current expenditure and investment expenditure havedecreased respectively by 3.550.068$ and 38.604, reached to 3.718.108$ and 126.458$. Besides, total
DMU’s
PersonelExpenditure
(USD)
CurrentExpenditure
(USD)
InvestmentExpenditure
(USD)
Number ofInstructors
Number
ofClassroom
Number
of
Student
ContributionMargin to the
University(USD)
AntalyaBranch 1.229.552 799.324 3.300 23 386 11.823 232.926
Alanya Branch 390.785 412.328 2.908 6 178 4.664 40.773
Bursa Branch 1.264.019 1.336.537 13.858 24 573 19.777 300.401
stanbulBranch 2.029.912 1.516.127 4.311 51 711 19.471 565.184
zmir Branch 1.595.274 1.223.070 14.232 41 746 19.194 342.384
Kad köyBranch 300.969 237.396 644 21 237 2.938 85.062
K z layBranch 3.351.045 2.696.806 119.943 86 1.440 39.052 767.509
SamsunBranch 620.648 978.461 8.669 15 422 14.248 265.902
TrabzonBranch 374.506 254.915 15.783 9 144 3.178 47.211
T.HilmiBranch 2.411.583 1.492.792 24.652 42 638 16.100 397.082

Journal of International Scientific Publication: Economy & Business, Volume 6, Part 4
ISSN 1313-2555, Published at: http://www.scientific-publications.net
223 Published by Info Invest, Bulgaria, www.sciencebg.net
of the expenditure has been 24.724.351$ and contribution margin of the university has been3.044.435$ during 2009-2011. The share of the total expenditure on personnel expenditure is 55%,investment expenditure 1% and current expenditure 44%. Contribution margin of the university hasafforded 12% of the total expenditure.
3. LITERATURE REVIEW
3.1. DEA Models in Financial Efficiency Analysis
DEA is a nonparametric and a linear programming technique which has been used to compare thetechnical efficiency of relatively homogeneous sets of decision making units (DMUs). The theoreticalconsideration of technical efficiency has existed in the economic literature since Koopmans (1951)defined technical efficiency as a feasible input/output vector where it is technologically impossible toincrease any output without simultaneously (Ruggiero, 2000).
Later, Farrell (1957) divided efficiency concept into two parts which are technical efficiency andallotment efficiency. While Farrell defines efficiency for only one output, DEA defines efficiency formultiple outputs.
Developed by Charnes et al. (1978), DEA was originally being intended for the use in public sectorand nonprofit DMUs such as educational institutions and health services. Banker et al. (1986)employed DEA for the evaluation of hospitals, restaurants (Banker and Morey, 1986) and universities(Athanassopoulos and Shale, 1997).
Basso and Funari (2000) have employed DEA models to measure performance of 47 DataEnvelopment Analysis (DEA) is a relatively new “data oriented” approach for evaluating theperformance of a set of peer entities which convert multiple inputs into multiple outputs.
Moreno and Tadepalli (2002)’s study examined the total number of graduates in each university, andthe total number of graduates in four or five year courses in each university.
Jinanjua (2010)’s study shows that there were 16 Provinces which reached DEA form of efficiency.The performance of each Province’s college education S&T innovation did not have obviouscorrelation with their economic development level.
DEA is a relatively new “data oriented” approach for evaluating the performance of a set of peerentities which convert multiple inputs into multiple outputs. In DEA, efficiency score is defined as theratio between a weighted sum of outputs and a weighted sum of inputs:
Max vk y kp / uj x jp (1)
where,
y kp =amount of output k produced by DMU j,
x jp = amount of input j utilized by DMU i,
vk = weight assigned for output j,
uj= weight assigned for input j.
By means of DEA, we can identify which units are efficient and which are not; what the unit ofreference is for the inefficient ones; which units present constant or variable returns to scale; whichunits have slack inefficiency; and what the situation objectives for each of the inefficient DMUs.

Journal of International Scientific Publication: Economy & Business, Volume 6, Part 4
ISSN 1313-2555, Published at: http://www.scientific-publications.net
224 Published by Info Invest, Bulgaria, www.sciencebg.net
DEA is a non-parametric technique that does not require any theoretical model as measurementbenchmarks. Instead DEA measures how we’ll a fund performs relative to the best set of funds withinthe declared objective category (Murthi et al.1997).
DEA models can be classified into two categories which are based on orientation. The output-orientedmodels refer to the capacity of a DMU to achieve the maximum volume of production (output) withthe available inputs, while the ability to maintain the same capacity of production using a minimum ofinputs is known as the input-oriented model. Input-oriented efficiency scores range between “0” and“1”, and whereas output-oriented efficiency scores range between “1” to infinity; in both cases, “1” isefficient (Coopers et.al, 2006; Coopers et al. 2000).
3.2. CCR Model
The two fundamental DEA models are the Charnes, Cooper, Rhodes (CCR) model and the Banker,Charnes, Cooper (BCC) model. According to both models a DMU is considered as efficient iftechnical efficiency corresponds to “1” (TE =1). On the other hand, if TE score is less than “1”, itpoints to what extend a DMU should reduce inputs to be able to produce its level output as efficient astechnically efficient DMUs (Fandel, 2003).
Bessent, Bessent, Elam and Long (1984), examine that a large-scale application of managementscience was employed by 25 independent public school districts, members of the EducationalProductivity Council (EPC) formed in 1981. Ray’s 1991 study combines DEA with regressionmodeling to estimate relative efficiency in the public school districts of Connecticut. Factors affectingachievements are classified as school inputs and other socio-economic factors. DEA is performed withthe school. Noulas and Ketkar’s study conducted in 1998, measures the efficiency of public schoolsfor the state of New Jersey using the DEA method; it also examines the effect certain socio-economicfactors on efficiency.
In this paper we offer a simple exposition of the neoclassical production theoretic foundations of DataEnvelopment Analysis. The concepts of technical efficiency (both input- and output-oriented), scaleefficiency, and cost efficiency are explained and the corresponding DEA models are described indetail.
In their study, Montoneri, Lin, Lee and Huang (2012) have applied DEA to explore the quantitativerelative efficiency of 18 classes of freshman students studying a course of English conversation at auniversity in Taiwan from the academic year of 2004 to 2006.
The assumption of constant returns to scale (CRS) is valid when proportional variation in inputs resultsthe same proportional variation in outputs if DMUs operate with optimal scale and the combination ofinputs is constant. Coopers et. al (2006) and Coopers et. al (2000) formulate the input oriented CCRmodel as follows:
Max (2)
s.t.
v x = 1
u y v x 0 (i=1,…, n)
u,v 0
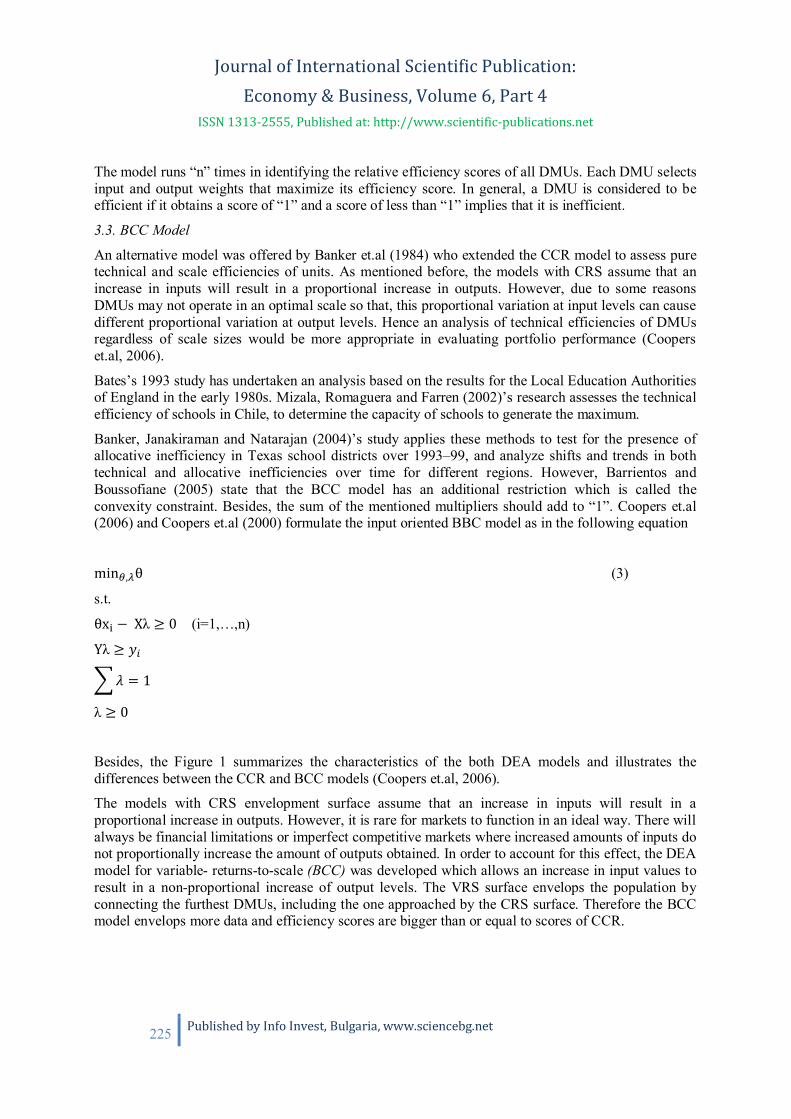
Journal of International Scientific Publication: Economy & Business, Volume 6, Part 4
ISSN 1313-2555, Published at: http://www.scientific-publications.net
225 Published by Info Invest, Bulgaria, www.sciencebg.net
The model runs “n” times in identifying the relative efficiency scores of all DMUs. Each DMU selectsinput and output weights that maximize its efficiency score. In general, a DMU is considered to beefficient if it obtains a score of “1” and a score of less than “1” implies that it is inefficient.
3.3. BCC Model
An alternative model was offered by Banker et.al (1984) who extended the CCR model to assess puretechnical and scale efficiencies of units. As mentioned before, the models with CRS assume that anincrease in inputs will result in a proportional increase in outputs. However, due to some reasonsDMUs may not operate in an optimal scale so that, this proportional variation at input levels can causedifferent proportional variation at output levels. Hence an analysis of technical efficiencies of DMUsregardless of scale sizes would be more appropriate in evaluating portfolio performance (Cooperset.al, 2006).
Bates’s 1993 study has undertaken an analysis based on the results for the Local Education Authoritiesof England in the early 1980s. Mizala, Romaguera and Farren (2002)’s research assesses the technicalefficiency of schools in Chile, to determine the capacity of schools to generate the maximum.
Banker, Janakiraman and Natarajan (2004)’s study applies these methods to test for the presence ofallocative inefficiency in Texas school districts over 1993–99, and analyze shifts and trends in bothtechnical and allocative inefficiencies over time for different regions. However, Barrientos andBoussofiane (2005) state that the BCC model has an additional restriction which is called theconvexity constraint. Besides, the sum of the mentioned multipliers should add to “1”. Coopers et.al(2006) and Coopers et.al (2000) formulate the input oriented BBC model as in the following equation
min , (3)
s.t.
x X 0 (i=1,…,n)
Y
= 1
0
Besides, the Figure 1 summarizes the characteristics of the both DEA models and illustrates thedifferences between the CCR and BCC models (Coopers et.al, 2006).
The models with CRS envelopment surface assume that an increase in inputs will result in aproportional increase in outputs. However, it is rare for markets to function in an ideal way. There willalways be financial limitations or imperfect competitive markets where increased amounts of inputs donot proportionally increase the amount of outputs obtained. In order to account for this effect, the DEAmodel for variable- returns-to-scale (BCC) was developed which allows an increase in input values toresult in a non-proportional increase of output levels. The VRS surface envelops the population byconnecting the furthest DMUs, including the one approached by the CRS surface. Therefore the BCCmodel envelops more data and efficiency scores are bigger than or equal to scores of CCR.

Journal of International Scientific Publication: Economy & Business, Volume 6, Part 4
ISSN 1313-2555, Published at: http://www.scientific-publications.net
226 Published by Info Invest, Bulgaria, www.sciencebg.net
In BCC model, total technical efficiency can be classified as pure technical efficiency and scaleefficiency. To calculate scale efficiency, the technical efficiency measures under both CRS and VRSassumptions should be measured. If there happens to exist a difference between the scores of TE underCRS and VRS for a certain DMU, the difference indicates that the DMU is scale inefficient (Cooperset.al, 2006).
Fig.1 Envelopment Surface and Orientation for the DMUs.
Scale efficiency can be calculated by dividing the total technical efficiency by pure technicalefficiency. Coopers et.al (2006) and Coopers et.al (2000) formulate the scale efficiency for the DMUsas in the following equation.
SE = TECCR / PTEBCC (4)
If the scale efficiency corresponds to 1, then the DMU is scale efficient. However, if the scaleefficiency is smaller than “1” (SE < 1), then combination of inputs and outputs are not scale efficient.
4. EMPIRICAL STUDIES
4.1. The Methodology
We have made financial efficiency analysed of TÖMER Branches for 2009-2011 period. However, wehave analyzed 9 TÖMER branches in 2009 and 10 TÖMER branches in 2010 and 2011. The totalexpenditure can be divided into three groups: personnel expenditure, current expenditure andinvestment expenditure, in order to compare three expenditures and contribution margins of theuniversity.

Journal of International Scientific Publication: Economy & Business, Volume 6, Part 4
ISSN 1313-2555, Published at: http://www.scientific-publications.net
227 Published by Info Invest, Bulgaria, www.sciencebg.net
Main goal of empirical study is to determine TÖMER’s activity measurements between 2009-2010according to DEA technique developed by Charnes etc. (1978) and Banker etc. (1984).
Decision making units (DMU’s) has been selected as 10 Branches of TÖMER. TÖMER branches thathas been submitted to the DEA analysis are as follows: Antalya Branch, Alanya Branch, BursaBranch, stanbul Branch, zmir Branch, Kad köy Branch, K z lay Branch, Samsun Branch, TrabzonBranch and Tunal Hilmi Branch.
On the other hand, in DEA technique, literature studies are considered while determining the inputs-outputs. Using input variables such as cost and number of teacher; and output variables such asmathematics, reading and writing are implemented by the CCR model developed by Bessent et.al.(1984). Input variables such as classroom teachers per pupil, support staff, administrative staff perpupil; and output variables such as mathematics score, language arts score, writing score and readingscore are applied by the CCR model by Ray (1991). In addition, the input variables which are capital,labour, fuel and material; and much of output variable which is cost are performed by the BCC modelby Ray and Chen (2009).
Moreover, Davutyan et. al. (2010), have determined input variables that are classroom teachers perpupil, support staff, administrative staff per pupil, number of teachers, number of classrooms in agiven province, average score attained on a nationwide high school entrance examination, standarddeviations of the quantitative and standard deviations of the verbal scores, much of output variablesthat are the number of high school, students in each province, the average quantitative and verbal.
Kuah and Wong (2011), have specified input variables - number of academic staff, number of taughtcourse student, average student’ qualifications and university expenditures - and much of outputvariables such as the number of graduates from taught courses, average graduates’ results, graduationrate% and graduates’ employee rate% in the CCR model.
In this study, input and output variables have determined similarly to the study carried by Glass et. al.(2006). In education output, education quality evaluation results are measured by number of students.Input side consists of academic personnel in universities, other staff, research supports, and capitalspending. As a result, policies are created and discussions have been done regarding the existingpolicies. This article is defined by considering the following variables. In this regard, the input and theoutput variables used in the analyses are as follows:
Input Variables: Personel Expenditures (USD), Current Expenditures (USD),Investment Expenditures (USD), Number of Instructors (Contractual andPermanent), Number of Classroom
Output Variable: Contribution Margin to the University (USD)
Descriptive statistical information regarding the 10 Branches of TÖMER for the DEA analyses in2009-2011, is presented in Table 2.
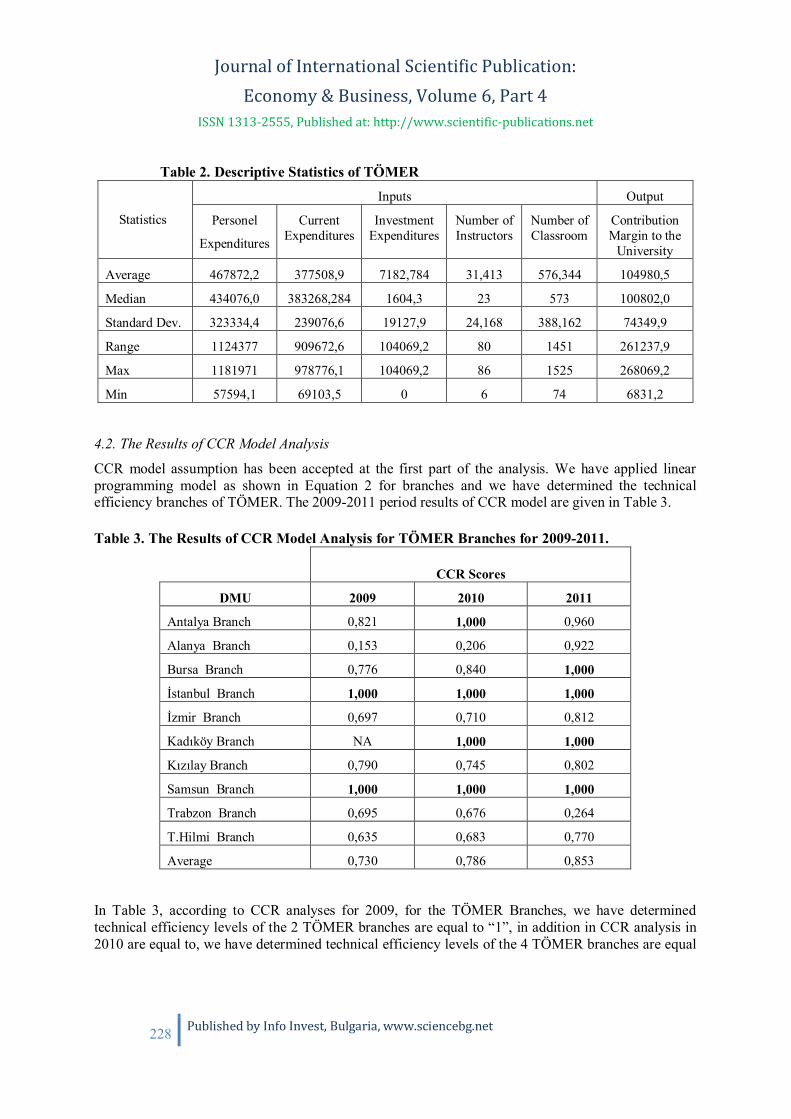
Journal of International Scientific Publication: Economy & Business, Volume 6, Part 4
ISSN 1313-2555, Published at: http://www.scientific-publications.net
228 Published by Info Invest, Bulgaria, www.sciencebg.net
Table 2. Descriptive Statistics of TÖMER
Statistics
Inputs Output
Personel
Expenditures
CurrentExpenditures
InvestmentExpenditures
Number ofInstructors
Number ofClassroom
ContributionMargin to the
University
Average 467872,2 377508,9 7182,784 31,413 576,344 104980,5
Median 434076,0 383268,284 1604,3 23 573 100802,0
Standard Dev. 323334,4 239076,6 19127,9 24,168 388,162 74349,9
Range 1124377 909672,6 104069,2 80 1451 261237,9
Max 1181971 978776,1 104069,2 86 1525 268069,2
Min 57594,1 69103,5 0 6 74 6831,2
4.2. The Results of CCR Model Analysis
CCR model assumption has been accepted at the first part of the analysis. We have applied linearprogramming model as shown in Equation 2 for branches and we have determined the technicalefficiency branches of TÖMER. The 2009-2011 period results of CCR model are given in Table 3.
Table 3. The Results of CCR Model Analysis for TÖMER Branches for 2009-2011.
CCR Scores
DMU 2009 2010 2011
Antalya Branch 0,821 1,000 0,960
Alanya Branch 0,153 0,206 0,922
Bursa Branch 0,776 0,840 1,000
stanbul Branch 1,000 1,000 1,000
zmir Branch 0,697 0,710 0,812
Kad köy Branch NA 1,000 1,000
K z lay Branch 0,790 0,745 0,802
Samsun Branch 1,000 1,000 1,000
Trabzon Branch 0,695 0,676 0,264
T.Hilmi Branch 0,635 0,683 0,770
Average 0,730 0,786 0,853
In Table 3, according to CCR analyses for 2009, for the TÖMER Branches, we have determinedtechnical efficiency levels of the 2 TÖMER branches are equal to “1”, in addition in CCR analysis in2010 are equal to, we have determined technical efficiency levels of the 4 TÖMER branches are equal
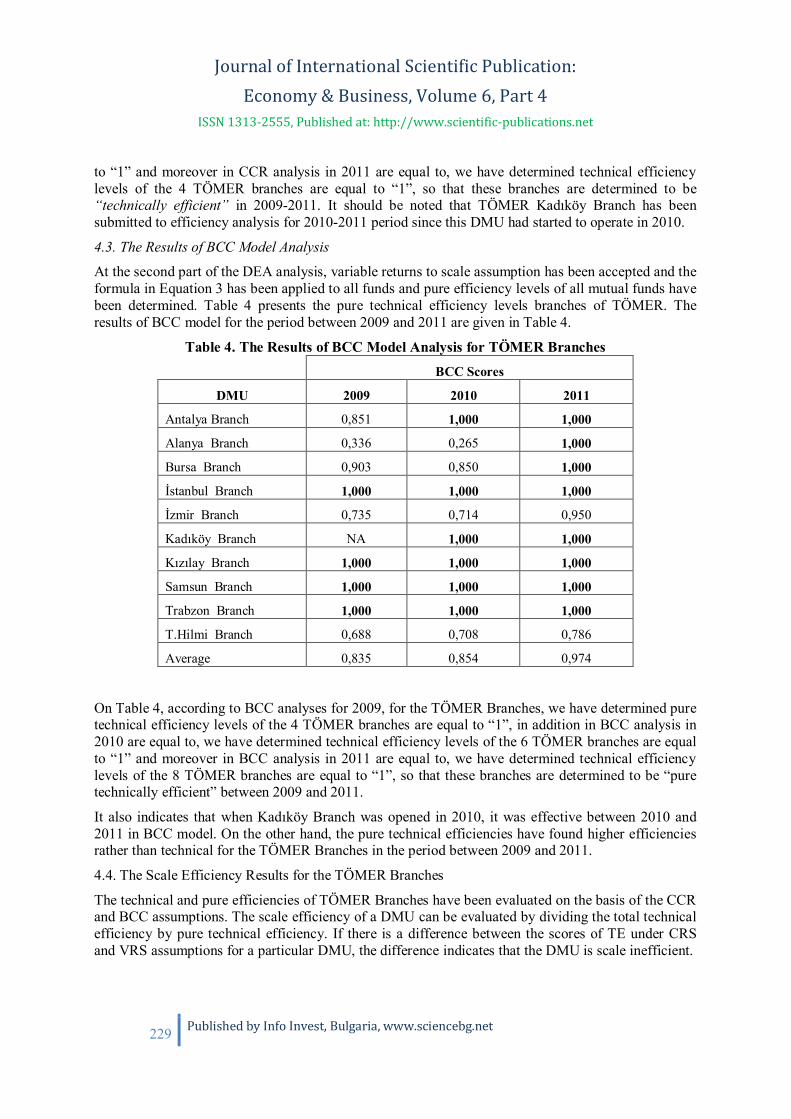
Journal of International Scientific Publication: Economy & Business, Volume 6, Part 4
ISSN 1313-2555, Published at: http://www.scientific-publications.net
229 Published by Info Invest, Bulgaria, www.sciencebg.net
to “1” and moreover in CCR analysis in 2011 are equal to, we have determined technical efficiencylevels of the 4 TÖMER branches are equal to “1”, so that these branches are determined to be“technically efficient” in 2009-2011. It should be noted that TÖMER Kad köy Branch has beensubmitted to efficiency analysis for 2010-2011 period since this DMU had started to operate in 2010.
4.3. The Results of BCC Model Analysis
At the second part of the DEA analysis, variable returns to scale assumption has been accepted and theformula in Equation 3 has been applied to all funds and pure efficiency levels of all mutual funds havebeen determined. Table 4 presents the pure technical efficiency levels branches of TÖMER. Theresults of BCC model for the period between 2009 and 2011 are given in Table 4.
Table 4. The Results of BCC Model Analysis for TÖMER BranchesBCC Scores
DMU 2009 2010 2011
Antalya Branch 0,851 1,000 1,000
Alanya Branch 0,336 0,265 1,000
Bursa Branch 0,903 0,850 1,000
stanbul Branch 1,000 1,000 1,000
zmir Branch 0,735 0,714 0,950
Kad köy Branch NA 1,000 1,000
K z lay Branch 1,000 1,000 1,000
Samsun Branch 1,000 1,000 1,000
Trabzon Branch 1,000 1,000 1,000
T.Hilmi Branch 0,688 0,708 0,786
Average 0,835 0,854 0,974
On Table 4, according to BCC analyses for 2009, for the TÖMER Branches, we have determined puretechnical efficiency levels of the 4 TÖMER branches are equal to “1”, in addition in BCC analysis in2010 are equal to, we have determined technical efficiency levels of the 6 TÖMER branches are equalto “1” and moreover in BCC analysis in 2011 are equal to, we have determined technical efficiencylevels of the 8 TÖMER branches are equal to “1”, so that these branches are determined to be “puretechnically efficient” between 2009 and 2011.
It also indicates that when Kad köy Branch was opened in 2010, it was effective between 2010 and2011 in BCC model. On the other hand, the pure technical efficiencies have found higher efficienciesrather than technical for the TÖMER Branches in the period between 2009 and 2011.
4.4. The Scale Efficiency Results for the TÖMER Branches
The technical and pure efficiencies of TÖMER Branches have been evaluated on the basis of the CCRand BCC assumptions. The scale efficiency of a DMU can be evaluated by dividing the total technicalefficiency by pure technical efficiency. If there is a difference between the scores of TE under CRSand VRS assumptions for a particular DMU, the difference indicates that the DMU is scale inefficient.

Journal of International Scientific Publication: Economy & Business, Volume 6, Part 4
ISSN 1313-2555, Published at: http://www.scientific-publications.net
230 Published by Info Invest, Bulgaria, www.sciencebg.net
The scale efficiency results of TÖMER Branches for the period between 2009 and 2011 are illustratedin Table 5.
Table 5. The Scale Efficiency Results of the TÖMER BranchesSE
DMU 2009 2010 2011
Antalya Branch 0,964 1,000 0,960
Alanya Branch 0,453 0,778 0,922
Bursa Branch 0,859 0,988 1,000
stanbul Branch 1,000 1,000 1,000
zmir Branch 0,949 0,994 0,855
Kad köy Branch NA 1,000 1,000
K z lay Branch 0,789 0,745 0,802
Samsun Branch 1,000 1,000 1,000
Trabzon Branch 0,695 0,675 0,264
T.Hilmi Branch 0,924 0,965 0,980
Average 0,848 0,914 0,878
In Table 5, according to scale efficiency analyses for 2009, for the TÖMER Branches, we havedetermined scale efficiency levels of the 2 TÖMER branches are equal to “1”, and we have found outscale efficiency levels of the 4 TÖMER branches are equal to “1” both for 2010 and 2011.
On the other hand, as a result of the DEA, for both the CCR and BCC models between the variablesfor inputs and outputs for further development of the required operational figures are summarized inTable 6.
Table 6. The Average Improvement Ratios for the CCR Model and BCC Model.CCR Model BCC Model
Input and Output 2009 2010 2011 2009 2010 2011
Personel Expenditures -0,093 -0,090 -0,108 -0,079 -0,043 -0,027
Current Expenditures -0,036 -0,051 -0,070 -0,112 -0,029 -0,034
Investment Expenditures -0,387 -0,138 -0,408 -0,211 -0,144 0
Number of Instructors -0,046 -0,019 -0,081 -0,045 -0,010 -0,044
Number of Classroom -0,043 - 0,091 -0,040 -0,057 -0,040 -0,018
Contribution Margin to theUniversity 0,864 0,586 0,369 0,341 0,372 0,036

Journal of International Scientific Publication: Economy & Business, Volume 6, Part 4
ISSN 1313-2555, Published at: http://www.scientific-publications.net
231 Published by Info Invest, Bulgaria, www.sciencebg.net
In Table 6, accordingly 2009 results regarding the CCR analysis is given. We have shown that theinputs should be reduced by ratios of between 3,60% to 38.70%, whereas the output is name ofcontribution margin of the university should be raised by the ratios of 86.4%. 2010 results show thatthe inputs should be decreased by the ratios of between 1.90% and 13.8%. On the other hand, theoutput is name of contribution margin of the university should be raised by the ratios of 58.6%.Therefore, 2011 results display the inputs should be reduced by ratios of between 4.0% and 40.8%. Inspite of that the output is name of contribution margin of the university should be raised by the ratiosof 36.9%.
On the other hand, Table 6 indicates the average improvement ratios within the context of BCCanalysis. In this context, according to the BCC model results for 2009, the inputs should be reduced bythe ratios of between 4.5% and 21.1%, whereas the output is name of contribution margin of theuniversity should be raised by the ratios of 34.1%. 2010 results show that the inputs should bedecreased by the ratios of between 1.0% and 14.4%, whereas the output is name of contributionmargin of the university should be raised by the ratios of 37.2%. Therefore, accordingly, 2011 resultsdisplay the inputs should be reduced by ratios of between 0% and 4.4%. In spite of that the output isname of contribution margin of the university should be raised by the ratios of 3.6%
In this consideration the input value should be decreased whereas the output value should beincreased. It can be concluded that according to the results of the CCR, BBC and SE models, mostlythe input and output values of the TÖMER Branches have found changed for immediately. It hasfound out a definite increase with time in the financial efficiencies of the branches between 2009-2011years in terms of CCR and BCC models. On the other hand, SE is fluctuated. The related efficiencydiagram is given in Figure 2.
Fig. 2 Comparison of DEA Efficiencies of TÖMER in 2009-2011 Period.
0
0.2
0.4
0.6
0.8
1
2009 2010 2011
Effic
ienc
ySc
ore
Years
Financial Efficiencies of TÖMER Branches
CCR
BCC
SE

Journal of International Scientific Publication: Economy & Business, Volume 6, Part 4
ISSN 1313-2555, Published at: http://www.scientific-publications.net
232 Published by Info Invest, Bulgaria, www.sciencebg.net
As shown in Figure 2, it has been found that TÖMER branches have demonstrated higher financialefficiency scores in respect of BBC model and CCR model from 2009 to 2011. Branches havedemonstrated 16,9% efficiency increase 2011 in terms of CCR analysis, continuously 16,6%efficiency increase 2011 in terms of BCC analysis. However Branches have shown 3,4% efficiencyincrease 2011 in terms of SE analysis. In addition, the average efficiency scores have also been takeninto consideration. Since we analyze the mentioned scores;
55.56% of TÖMER Branches in CCR model, 55.56% of TÖMER Branches in BCCmodel and 66.77% of TÖMER Branches in SE for 2009,
40% of TÖMER Branches in CCR model, 60% of TÖMER Branches in BCC modeland 70% of TÖMER Branches in SE for 2010,
60% of TÖMER Branches in CCR model, 80% of TÖMER Branches in BCC modeland 70% of TÖMER Branches in SE for 2011
demonstrated higher performance in comparison to the average efficiency score. Therefore, in2010 and 2011 all branches have support better efficiencies 2009 by CCR and BCC model.
5. CONCLUSION
In this paper, the DEA models have been applied to the TÖMER in order to assess the performance ofbranches between 2009 and 2011. Then, the financial efficiencies of TÖMER Branches have beenanalyzed. DEA is a worthy mathematical programming technique, and it is applied to determine thetechnical and pure technical efficiencies of the similar DMUs. However, similar DMUs have beenchosen in the empirical study. The inputs and outputs have been determined carefully to reflect theDMUs in the best possible way. The efficiency of the TÖMER Branches has been evaluated and hasbeen compared by DEA technique. Technical and pure technical efficiency levels of the TÖMERBranches have been evaluated by output oriented DEA models.
The study includes the analysis of 9 TÖMER Branches in 2009 and 10 TÖMER Branches in 2010 and2011. Based on the measurements of both CCR and BCC models, TÖMER Branches have shownsuperior performance when compared to their performance between 2009 and 2011. Inputs used forcomparison are “personnel expenditures, current expenditures, investment expenditures, number ofinstructors and number of classroom”, and much of output used for comparison is contribution marginto the university.
2009 results for CCR model indicate that two branches ( stanbul and Samsun) have full efficiency. Itmeans that branches are equal to “1”. Three Branches (Antalya, Bursa and K z lay) have efficiencyabove the average efficiency value of 0.73 but also below the “1”, so these do not have full efficiencybelow the average. In addition, 2010 results for CCR model indicate that four branches (Antalya,stanbul , Kad köy and Samsun) have full efficiency. Only one Branch (Bursa) does not have full
efficiency. The efficiency level of the remaining five branches (Alanya, zmir, K z lay, Trabzon andTunal Hilmi) is below the average. Moreover, 2011 results for CCR model indicate that four branches(Bursa, stanbul Kad köy and Samsun) have full efficiency. Four Branches (Antalya, Alanya, K z layand Tunal Hilmi) do not have full efficiency. The efficiency level of the remaining two branches( zmir and Trabzon) is below the average.
On the other hand, according to BCC model, 2009 result shows that four branches ( stanbul , K z lay,Samsun and Trabzon) have full efficiency. Two branches (Antalya and Bursa) do not have full

Journal of International Scientific Publication: Economy & Business, Volume 6, Part 4
ISSN 1313-2555, Published at: http://www.scientific-publications.net
233 Published by Info Invest, Bulgaria, www.sciencebg.net
efficiency. The efficiency level of the remaining three branches (Alanya, zmir and Tunal Hilmi) isbelow the average. Also, 2010 results for BCC model indicate that six branches (Antalya, stanbul ,Kad köy, K z lay, Samsun and Trabzon) have full efficiency. The efficiency level ofthe remaining four branches (Alanya, Bursa, zmir and Tunal Hilmi) is below the average. Besides,2011 results for BCC model indicate that eight branches (Antalya, Alanya, Bursa, stanbul Kad köy,K z lay, Samsun, Trabzon and Samsun) have full efficiency. The efficiency level of the remaining twobranches ( zmir and Trabzon) is below the average.
As a consequence, TÖMER branches have increased their financial efficiency levels between 2009and 20011 on the basis of both CCR Model and BCC Model. Besides, we can also conlude that DEAmethod is a worthy mathematical modelling tool for educational finance managers in evaluating theefficiencies of educational branches of the universities.
6. ACKNOWLEDGEMENT
We would like to thank TÖMER officials, Ms. Fatma Demir & Mr. Ercem Erkul for their valuablecomments and suggestions to the present paper.
1. Appendix 1: CCR Model Results of TÖMER Branches in 2009-2011.CCR-O
2009 2010 2011
DMU ScoreProjecti
onDifferen
ce % ScoreProjecti
onDifferen
ce % ScoreProject
ionDifferen
ce %
AntalyaBranch 0,82 1,00 0,96
PersonelExpenditures
424096 333487 -90610 -0,21
435871 435871 0,00 0,00 369585
220970 -148615 -0,40
CurrentExpenditures
301264 287904 -13360 -0,04
275269 275269 0,00 0,00 222792
222792 0 0,00
Invest.Expenditures 3195 1499 -1696 -0,53 0 0 0,00 0,00 105 105 0 0,00
Number ofInstructors 21 21 0 0,00 23 23 0,00 0,00 23 14 -9 -0,37
Number ofClassroom 457 457 0 0,00 393 393 0,00 0,00 386 372 -14 -0,04
ContributionMargin 90794 110557 19762 0,22 78027 78027 0,00 0,00 64105 66800 2695 0,04
AlanyaBranch 0,15 0,21 0,92
PersonelExpenditures
138274 120692 -17582 -0,13
135746 103485 -32262 -0,24 116765 95396 -21369 -0,18
Current 13291 127763 -5147 -0,04 15483 108098 -46736 -0,30 124585 99906 -24678 -0,20

Journal of International Scientific Publication: Economy & Business, Volume 6, Part 4
ISSN 1313-2555, Published at: http://www.scientific-publications.net
234 Published by Info Invest, Bulgaria, www.sciencebg.net
Expenditures 0 4
Invest.Expenditures 1073 670 -403 -0,38 1012 1012 0 0,00 824 20 -804 -0,98
Number ofInstructors 7 7 0 0,00 7 7 0 0,00 6 6 0 0,00
Number ofClassroom 193 193 0 0,00 178 139 -39 -0,22 178 169 -9 -0,05
ContributionMargin 6831 44767 37936 5,55 7106 34463 27357 3,85 26836 29093 2257 0,08
Bursa Branch 0,78 0,84 1,00
PersonelExpenditures
434076 370511 -63565 -0,15
434801 283397 -151404-0,35 395142
395142 0 0,00
CurrentExpenditures
498545 411435 -87110 -0,17
450717 450717 0 0,00 387276
387276 0 0,00
Invest.Expenditures 2913 2162 -752 -0,26 10944 5808 -5137 -0,47 0 0 0 0,00
Number ofInstructors 21 21 0 0,00 22 22 0 0,00 24 24 0 0,00
Number ofClassroom 615 615 0 0,00 578 519 -59 -0,10 573 573 0 0,00
ContributionMargin
109637 141307 31670 0,29
101291 120595 19304 0,19 89473 89473 0 0,00
stanbulBranch 1,00 1,00 0,23
PersonelExpenditures
660885 660885 0 0,00
711200 711200 0,00 0,00 657827
491774 -166053 -0,25
CurrentExpenditures
437671 437671 0 0,00
463746 463746 0,00 0,00 614710
443848 -170862 -0,28
Invest.Expenditures 2249 2249 0 0,00 1472 1472 0,00 0,00 591 591 0 0,00
Number ofInstructors 45 45 0 0,00 43 43 0,00 0,00 51 36 -15 -0,30
Number ofClassroom 750 750 0 0,00 709 709 0,00 0,00 711 711 0 0,00
ContributionMargin
192283 192283 0 0,00
189535 189535 0,00 0,00 33366
145108 111742 3,35
IzmirBranch 0,70 0,71 0,81
PersonelExpenditures
534125 534125 0 0,00
553299 553299 0,00 0,00 507850
496396 -11453 -0,02
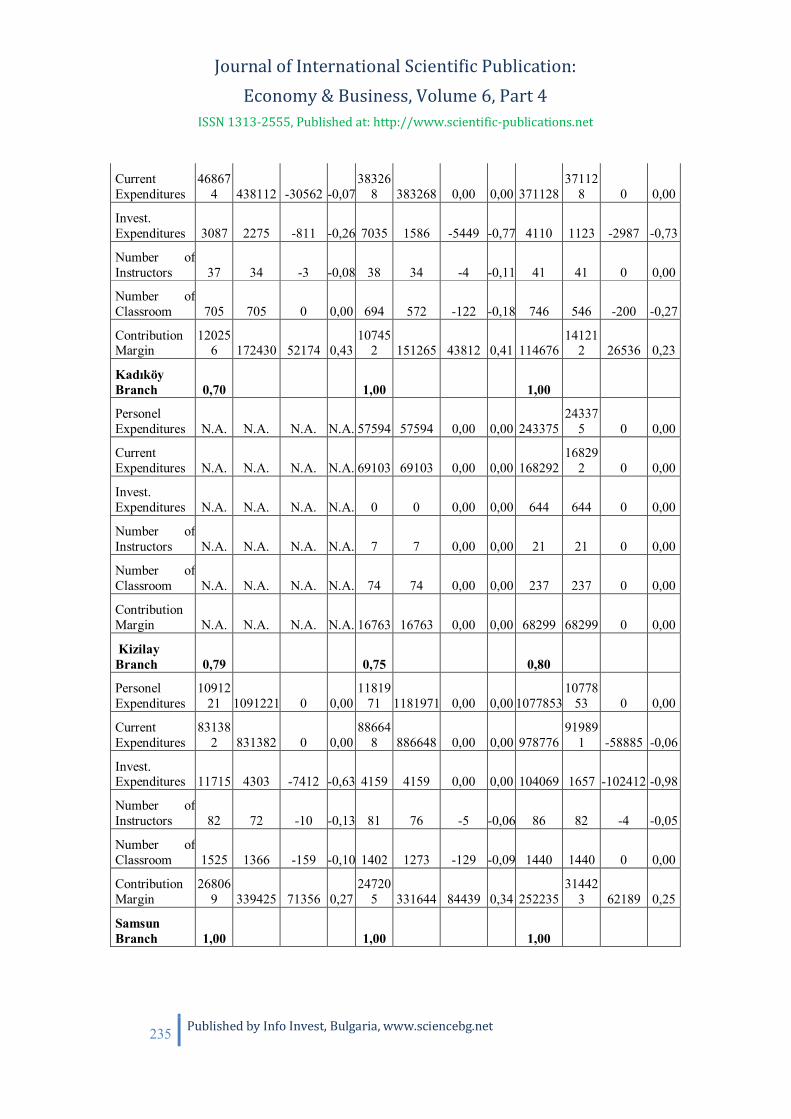
Journal of International Scientific Publication: Economy & Business, Volume 6, Part 4
ISSN 1313-2555, Published at: http://www.scientific-publications.net
235 Published by Info Invest, Bulgaria, www.sciencebg.net
CurrentExpenditures
468674 438112 -30562 -0,07
383268 383268 0,00 0,00 371128
371128 0 0,00
Invest.Expenditures 3087 2275 -811 -0,26 7035 1586 -5449 -0,77 4110 1123 -2987 -0,73
Number ofInstructors 37 34 -3 -0,08 38 34 -4 -0,11 41 41 0 0,00
Number ofClassroom 705 705 0 0,00 694 572 -122 -0,18 746 546 -200 -0,27
ContributionMargin
120256 172430 52174 0,43
107452 151265 43812 0,41 114676
141212 26536 0,23
Kad köyBranch 0,70 1,00 1,00
PersonelExpenditures N.A. N.A. N.A. N.A. 57594 57594 0,00 0,00 243375
243375 0 0,00
CurrentExpenditures N.A. N.A. N.A. N.A. 69103 69103 0,00 0,00 168292
168292 0 0,00
Invest.Expenditures N.A. N.A. N.A. N.A. 0 0 0,00 0,00 644 644 0 0,00
Number ofInstructors N.A. N.A. N.A. N.A. 7 7 0,00 0,00 21 21 0 0,00
Number ofClassroom N.A. N.A. N.A. N.A. 74 74 0,00 0,00 237 237 0 0,00
ContributionMargin N.A. N.A. N.A. N.A. 16763 16763 0,00 0,00 68299 68299 0 0,00
KizilayBranch 0,79 0,75 0,80
PersonelExpenditures
1091221 1091221 0 0,00
1181971 1181971 0,00 0,00 1077853
1077853 0 0,00
CurrentExpenditures
831382 831382 0 0,00
886648 886648 0,00 0,00 978776
919891 -58885 -0,06
Invest.Expenditures 11715 4303 -7412 -0,63 4159 4159 0,00 0,00 104069 1657 -102412 -0,98
Number ofInstructors 82 72 -10 -0,13 81 76 -5 -0,06 86 82 -4 -0,05
Number ofClassroom 1525 1366 -159 -0,10 1402 1273 -129 -0,09 1440 1440 0 0,00
ContributionMargin
268069 339425 71356 0,27
247205 331644 84439 0,34 252235
314423 62189 0,25
SamsunBranch 1,00 1,00 1,00

Journal of International Scientific Publication: Economy & Business, Volume 6, Part 4
ISSN 1313-2555, Published at: http://www.scientific-publications.net
236 Published by Info Invest, Bulgaria, www.sciencebg.net
PersonelExpenditures
254975 254975 0 0,00
127184 127184 0,00 0,00 238489
238489 0 0,00
CurrentExpenditures
300873 300873 0 0,00
427823 427823 0,00 0,00 249766
249766 0 0,00
Invest.Expenditures 1584 1584 0 0,00 7035 7035 0,00 0,00 50 50 0 0,00
Number ofInstructors 14 14 0 0,00 14 14 0,00 0,00 15 15 0 0,00
Number ofClassroom 444 444 0 0,00 434 434 0,00 0,00 422 422 0 0,00
ContributionMargin
100822 100822 0 0,00 92348 92348 0,00 0,00 72733 72733 0 0,00
TrabzonBranch 0,70 0,68 0,27
PersonelExpenditures
118236 92439 -25797 -0,22
127184 98539 -28645 -0,23 129086
115158 -13928 -0,11
CurrentExpenditures 72773 72773 0 0,00 78737 66560 -12177 -0,15 103406 93877 -9529 -0,09
Invest.Expenditures 1073 377 -696 -0,65 249 249 0 0,00 14461 207 -14254 -0,99
Number ofInstructors 6 6 0 0,00 6 6 0 0,00 9 9 0 0,00
Number ofClassroom 150 118 -32 -0,21 131 100 -31 -0,23 144 144 0 0,00
ContributionMargin 20321 29227 8905 0,44 18012 26652 8640 0,48 8878 33292 24414 2,75
Tunal HilmiBranch 0,64 0,68 0,78
PersonelExpenditures
880979 764026 -116953-0,13
852184 750601 -101582-0,12 678420
528704 -149715 -0,22
CurrentExpenditures
505976 505976 0 0,00
489438 489438 0 0,00 497378
420661 -76717 -0,15
Invest.Expenditures 11715 2600 -9115 -0,78 11332 1553 -9779 -0,86 1604 1022 -582 -0,36
Number ofInstructors 66 52 -14 -0,21 53 45 -8 -0,14 42 42 0 0,00
Number ofClassroom 937 867 -70 -0,07 870 748 -122 -0,14 638 638 0 0,00
ContributionMargin
141236 222291 81055 0,57
136619 200035 63416 0,46 119227
152139 32912 0,28

Journal of International Scientific Publication: Economy & Business, Volume 6, Part 4
ISSN 1313-2555, Published at: http://www.scientific-publications.net
237 Published by Info Invest, Bulgaria, www.sciencebg.net
Appendix 2: BCC Model Results of TÖMER Branches in 2009-2011.BCC-O
2009 2010 2011 DMU Score Projec. Diff. % Score Projec. Diff. % Score Proje
c.Diff. %
AntalyaBranch
0,851 1,000 1
PersonelExpenditures
424096
338287 -85809 -0,202
369585
369585 0 0,00%
435871
435871
0 0,00%
CurrentExpenditures
301264
281467 -19797 -0,066
222792
222792 0 0,00%
275269
275269
0 0,00%
Invest.Expenditures
3195 1646 -1549 -0,485
105 105 0 0,00%
0 0 0 0,00%
Number ofInstructors
21 21 0 0,000
23 23 0 0,00%
23 23 0 0,00%
Number ofClassroom
457 457 0 0,000
386 386 0 0,00%
393 393 0 0,00%
ContributionMargin
90794
106631 15837 0,174
64105
64105 0 0,00%
78027
78027
0 0,00%
AlanyaBranch
0,336 1,000 0,265
PersonelExpenditures
138274
118236 -20038 -0,145
116765
116765 0 0,00%
135746
128844
-6902 -5,08%
CurrentExpenditures
132910
72773 -60137 -0,453
124585
124585 0 0,00%
154834
118878
-35955 -23,22
%Invest.Expenditures
1073 1073 0 0,000
824 824 0 0,00%
1012 1012 0 0,00%
Number ofInstructors
7 6 -1 -0,143
6 6 0 0,00%
7 7 0 0,00%
Number ofClassroom
193 150 -43 -0,223
178 178 0 0,00%
178 167 -11 -6,44%
ContributionMargin
6831 20321 13490 1,975
26836
26836 0 0,00%
7106 26814
19709 277,36%
Bursa Branch0,903 1,000 0,850PersonelExpenditures
434076
346632 -87444 -0,201
395142
395142 0 0,00%
434801
288292
-146509
-33,70
%

Journal of International Scientific Publication: Economy & Business, Volume 6, Part 4
ISSN 1313-2555, Published at: http://www.scientific-publications.net
238 Published by Info Invest, Bulgaria, www.sciencebg.net
CurrentExpenditures
498545
331763 -166782
-0,335
387276
387276 0 0,00%
450717
437733
-12984 -2,88%
Invest.Expenditures
2913 1734 -1179 -0,405
0 0 0 0,00%
10944
5500 -5444 -49,74
%Number ofInstructors
21 21 0 0,000
24 24 0 0,00%
22 22 0 0,00%
Number ofClassroom
615 513 -102 -0,166
573 573 0 0,00%
578 510 -68 -11,79
%ContributionMargin
109637
121474 11838 0,108
89473
89473 0 0,00%
101291
119158
17867 17,64%
stanbulBranch
1,000 0,332 1,000
PersonelExpenditures
660885
660885 0 0,000
657827
499426 -158401
-24,08
%
711200
711200
0 0,00%
CurrentExpenditures
437671
437671 0 0,000
614710
427808 -186902
-30,40
%
463746
463746
0 0,00%
Invest.Expenditures
2249 2249 0 0,000
591 591 0 0,00%
1472 1472 0 0,00%
Number ofInstructors
45 45 0 0,000
51 31 -20 -39,95
%
43 43 0 0,00%
Number ofClassroom
750 750 0 0,000
711 597 -114 -16,04
%
709 709 0 0,00%
ContributionMargin
192283
192283 0 0,000
33366
100426 67060 200,98%
189535
189535
0 0,00%
IzmirBranch
0,735 1,000 0,714
PersonelExpenditures
534125
534125 0 0,000
507850
507850 0 0,00%
553299
553299
0 0,00%
CurrentExpenditures
468674
394951 -73723 -0,157
371128
371128 0 0,00%
383268
383268
0 0,00%
Invest.Expenditures
3087 2041 -1045 -0,339
4110 4110 0 0,00%
7035 1439 -5596 -79,55
%Number ofInstructors
37 35 -2 -0,045
41 41 0 0,00%
38 34 -4 -9,34%
Number of 705 654 -51 - 746 746 0 0,00 694 569 -125 -

Journal of International Scientific Publication: Economy & Business, Volume 6, Part 4
ISSN 1313-2555, Published at: http://www.scientific-publications.net
239 Published by Info Invest, Bulgaria, www.sciencebg.net
Classroom 0,072
% 17,97%
ContributionMargin
120256
163721 43465 0,361
114676
114676 0 0,00%
107452
150480
43027 40,04%
Kad köyBranch
0,000 1,000 1,000
PersonelExpenditures N.A. N.A. N.A.
N.A.
243375
243375 0 0,00%
57594
57594
0 0,00%
CurrentExpenditures N.A. N.A. N.A.
N.A.
168292
168292 0 0,00%
69103
69103
0 0,00%
Invest.Expenditures N.A. N.A. N.A.
N.A.
644 644 0 0,00%
0 0 0 0,00%
Number ofInstructors N.A. N.A. N.A.
N.A.
21 21 0 0,00%
7 7 0 0,00%
Number ofClassroom N.A. N.A. N.A.
N.A.
237 237 0 0,00%
74 74 0 0,00%
ContributionMargin N.A. N.A. N.A.
N.A.
68299
68299 0 0,00%
16763
16763
0 0,00%
KizilayBranch
1,000 1,000 1,000
PersonelExpenditures
1091221
1091221
0 0,000
1077853
1077853
0 0,00%
1181971
1181971
0 0,00%
CurrentExpenditures
831382
831382 0 0,000
978776
978776 0 0,00%
886648
886648
0 0,00%
Invest.Expenditures
11715
11715 0 0,000
104069
104069 0 0,00%
4159 4159 0 0,00%
Number ofInstructors
82 82 0 0,000
86 86 0 0,00%
81 81 0 0,00%
Number ofClassroom
1525 1525 0 0,000
1440 1440 0 0,00%
1402 1402 0 0,00%
ContributionMargin
268069
268069 0 0,000
252235
252235 0 0,00%
247205
247205
0 0,00%
SamsunBranch
1,000 1,000 1,000
PersonelExpenditures
254975
254975 0 0,000
238489
238489 0 0,00%
127184
127184
0 0,00%
CurrentExpenditures
300873
300873 0 0,000
249766
249766 0 0,00%
427823
427823
0 0,00%
Invest.Expenditures
1584 1584 0 0,000
50 50 0 0,00%
7035 7035 0 0,00%
Number ofInstructors
14 14 0 0,000
15 15 0 0,00%
14 14 0 0,00%
Number ofClassroom
444 444 0 0,000
422 422 0 0,00%
434 434 0 0,00%

Journal of International Scientific Publication: Economy & Business, Volume 6, Part 4
ISSN 1313-2555, Published at: http://www.scientific-publications.net
240 Published by Info Invest, Bulgaria, www.sciencebg.net
ContributionMargin
100822
100822 0 0,000
72733
72733 0 0,00%
92348
92348
0 0,00%
TrabzonBranch
1,000 1,000 1,000
PersonelExpenditures
118236
118236 0 0,000
129086
129086 0 0,00%
127184
127184
0 0,00%
CurrentExpenditures
72773
72773 0 0,000
103406
103406 0 0,00%
78737
78737
0 0,00%
Invest.Expenditures
1073 1073 0 0,000
14461
14461 0 0,00%
249 249 0 0,00%
Number ofInstructors
6 6 0 0,000
9 9 0 0,00%
6 6 0 0,00%
Number ofClassroom
150 150 0 0,000
144 144 0 0,00%
131 131 0 0,00%
ContributionMargin
20321
20321 0 0,000
8878 8878 0 0,00%
18012
18012
0 0,00%
Tunal HilmiBranch
0,688 1,000 0,708
PersonelExpenditures
880979
735544 -145435
-0,165
678420
678420 0 0,00%
852184
739800
-112383
-0,13
CurrentExpenditures
505976
505976 0 0,000
497378
497378 0 0,00%
489438
489438
0 0,00
Invest.Expenditures
11715
3891 -7824 -0,668
1604 1604 0 0,00%
11332
1635 -9697 -0,86
Number ofInstructors
66 51 -15 -0,221
42 42 0 0,00%
53 45 -8 -0,15
Number ofClassroom
937 884 -53 -0,056
638 638 0 0,00%
870 751 -119 -0,14
ContributionMargin
141236
205431 64195 0,455
119227
119227 0 0,00%
136619
193038
56419 0,41
REFERENCES
2. Alp, ., Gölcüklü, A., 2000. A new forecasting vehicle: DEA. Statistics Symposium Proceedings,Gazi University, Dept. of Statistics, 359-370.
3. Athanas os G. Noulas and Kusum W. Ketkar (1998) Efficient utilization of resources inpublic schools: a case study of New Jersey, Applied Economics, 1998, 30, 1299-1306

Journal of International Scientific Publication: Economy & Business, Volume 6, Part 4
ISSN 1313-2555, Published at: http://www.scientific-publications.net
241 Published by Info Invest, Bulgaria, www.sciencebg.net
4. Athanassopoulos, A. D., Shale, E., 1997. Assesing the comparative efficiency of higher educationinstitutions in the UK by means of Data Envelopment Analysis. Education Economics, 5,2, 117-134.
5. Banker R.D., Morey, R.C. (1986), “The Use of Categorical Variables in Data EnvelopmentAnalysis”, Management Science, 32, 1613-1627.
6. Banker, R.D., Charnes, A., Cooper, W.W. (1984), “Some Models for Estimating Technical andScale Inefficiencies in Data Envelopment Analysis”, Management Science, 30, 1078-1092
7. Banker,R.D., Janakiraman,S.and Natarajan, R.(2004), Analysis of trends in technical andallocative efficiency: An application to Texas public school districts, European Journal ofOperational Research 154 (2004) 477–491
8. Barrientos A., Boussofiane, A. (2005), “How Efficient are Pension Funds in Chile?”, R. Econ.contemp., Rio de Jeneiro, 9(2), 289-311.
9. Bessent, W. Bessent, J. Elam and D. Long(1984), Educational Productivity Council EmploysManagement Science Methods to Improve Educational Quality, Interfaces, Vol. 14, No. 6 (Nov. -Dec., 1984), pp. 1-8.
10. Charnes, A., Cooper W.W., Rhodes, E. (1978), “Measuring the Efficiency of Decision MakingUnits”, European Journal of Operational Research, 98, 408-418.
11. Cingi, S., Tar m, A., 2000. Türk banka sisteminde performans ölçümü: DEA-Malmquist TFPendeksi uygulamas . TBB Ara t rma Tebli leri, 2000-01.
12. Cooper, A., Seiford, L.M., Tone, K. (2000), Data Envelopment Analysis, Kluwer AcademicPublishers, pp-1-306.
13. Cooper, A., Seiford, L.M., Tone, K. (2006), Data Envelopment Analysis and its Uses, Springer,pp-1-342.
14. Davutyan, N. , Demir, M. and Polat, S.(2010), Assessing the efficiency of Turkish secondaryeducation: Heterogeneity, centralization, and scale diseconomies, Socio-Economic PlanningSciences 44 (2010) 35–44
15. E. Thanassoulis and P. Dunstan(1994), Guiding Schools to Improved Performance Using DataEnvelopment Analysis: An Illustration with Data from a Local Education Authority, The Journalof the Operational Research Society, Vol. 45, No. 11 (Nov., 1994), pp.1247-1262
16. Fandel, P. (2003), “Technical and Scale Efficiency of Corporate Farms in Slovakia”, Agric. Econ– Czech, 49, 375-383.
17. Farrell, M.J. (1957), “The Measurement of Productive Efficiency”, Journal of the Royal StatisticSociety, Ser. A 120, 253-281.
18. Glass J.C., McCallion, G., McKillop, D.G. and Stringer, S.R.K.S.(2006), Implications of variantefficiency measures for policy evaluations in UK higher education, Socio-Economic PlanningSciences 40 (2006) 119–142.
19. Grosskopf, S., Hayes, K., Taylor and L., & Weber, W. (1999). Anticipating the consequences ofschool reform: a new use of DEA. Management Science, 45, 608–620
20. Grosskopf, S. and Moutray,C.(2001), Evaluating performance in Chicago public high schools inthe wake of decentralization, Economics of Education Review 20 (2001) 1–14

Journal of International Scientific Publication: Economy & Business, Volume 6, Part 4
ISSN 1313-2555, Published at: http://www.scientific-publications.net
242 Published by Info Invest, Bulgaria, www.sciencebg.net
21. J. M. Bates(1993), The Efficiency of Local Education Authorities, Oxford Review of Education,Vol. 19, No. 3 (1993), pp. 277-289
22. Jianhua, S.(2010)The evaluation of college Education science and technology innovationperformance based on data envelopment analysis, Educational and Information Technology(ICEIT), 2010 International Conference on ,17-19 Sept. 2010, V2-59 - V2-63
23. Johnes, G., Johnes, J., 1993. Measuring the research performance of UK economics departments:application of Data Envelopment Analysis. Oxford Economic Papers, 45, 2, 332-348.
24. Karacabey, A. A., 2001. Data Envelopment Analysis. Ankara University Faculty of PoliticalSciences GETA Discussion Papers, 33, 1-12.
25. Kuaha, C.T. and Wonga,K. Y. (2011), Efficiency assessment of universities through dataenvelopment analysis, Procedia Computer Science 3 499–506
26. M. Abbott and C. Doucouliagosa (2003), The efficiency of Australian universities: a dataenvelopment analysis, Economics of Education Review 22 (2003) 89–97
27. Mizala, A., and Romaguera, P.& Farren, D. (2002) The technical efficiency of schools in Chile,Applied Economics, 34:12, 1533-1552
28. Montoneri, B.; Lin, T.T.; Lee, C-C; Huang, S-L.(2012),Application of Data EnvelopmentAnalysis on the Indicators Contributing to Learning and Teaching Performance,Teaching andTeacher Education: An International Journal of Research and Studies, v28 n3 p382-395 Apr 2012
29. Ng, Y.C.& Li,S. K. (2000), Measuring the Research Performance of Chinese Higher EducationInstitutions: An Application of Data Envelopment Analysis Education, Economics, Vol. 8, No. 2,2000.
30. Ray, S. C. (1991), Resource-Use Efficiency in Public Schools: A Study of Connecticut Data,Management Science, Vol. 37, No. 12 (Dec., 1991), pp. 1620-1628
31. Ray, S. C. and Chen, L. (2009), Data Envelopment Analysis for Performance Evaluation: AChild’s Guide, Working Paper 2009-38
32. Ruggiero, J. (1996), Efficiency of Educational Production: An Analysis of New York SchoolDistricts, The Review of Economics and Statistics, Vol. 78, No. 3 (Aug., 1996), pp. 499-509
33. Ruggiero, J. (2000), “Measuring Technical Efficiency”, European Journal of OperationalResearch, 121, 138-150.
34. Smith, P. and Mayston, D., 1987. Measuring efficiency in the public sector. OMEGA, 15, 3, 181-189.
35. Thanassoulis, E., Dunstan, P., 1994. Guiding schools to improved performance using DataEnvelopment Analysis: An illustration with data from a local education authority. Journal ofOperational Research Society, 45, 11, 1247-1262.
36. Waxman H. C., Huang, S-Y L., Anderson, L.& Weinstein, T.(1997) Classroom ProcessDifferences in Inner-City Elementary Schools, The Journal of Educational Research, 91:1, 49-59
Journal of International Scientific Publication: Economy & Business, Volume 6, Part 4
ISSN 1313-2555, Published at: http://www.scientific-publications.net
243 Published by Info Invest, Bulgaria, www.sciencebg.net
ENTREPRENEURIAL CULTURE AS A PREREQUISITE FOR THE FORMATION
OF INNOVATION DRIVEN ORGANIZATIONMarko Kolakovi 1, Boris Sisek2, Bojan Mori Milovanovi 1, Mladen Turuk2
1 Department of Managerial Economics, Faculty of Economics and Business, University of Zagreb,
10000 Zagreb, Croatia. E-mail: [email protected], [email protected] Department of Economic Theory, Faculty of Economics and Business, University of Zagreb, 10000
Zagreb, Croatia, E-mail: [email protected], [email protected]
Abstract
The paper analyzes entrepreneurial culture as a factor that influences realization of businessexcellence. In modern times this distinct competitive advantage is extremely difficult to achieve if acompany is not entrepreneurially oriented. That means meeting prerequisites necessary forcontinuous innovation as the source of competitive advantage. Support and development of innovationpresupposes favorable work environment, adequate human resources management, entrepreneuriallyoriented organizational culture and a balance between individual initiative and cooperative behavior.
Key words: organizational culture, corporate entrepreneurship, business excellence, stakeholderapproach
1. INTRODUCTION
Companies’ business strategy is increasingly evolving into a strategy of innovation which helps toprepare and support innovative processes that lead to business excellence. This evolution or tendencyto change is not accidental. It is the result of major changes in business environment that affectchanges in objectives, strategies and internal processes within company. These changes in the externalbusiness environment can be seen in several areas, but primarily refer to technological changes (rapiddevelopment of new technologies and greater difficulty in protecting intellectual property rights)(Morris, Kuratko and Covin, 2008). Change in economic environment (unpredictability of prices,costs, exchange rates, interest rates and business cycles) is the second major change. Competitors alsoreported significant changes (appearance of highly innovative competitors, competition from non-traditional sources with non-traditional tactics). In the labor area scarcity of skilled workers is presentas employees are becoming increasingly mobile and less loyal. Scarcity occurs in the area of resourcesas well. Clients are becoming more demanding and complex and markets are more fragmented andmore segmented. There are also changes in the law-making in the economic sphere andregulations. Changes are more aggressive, while on the other hand free and fair trade and strongenvironmental regulation are emphasized. Finally, the process of globalization brings daily changesthat impose new imperatives in front of the business world.
Turbulent changes affect the company and its internal structure, management and competitiveadvantage. These processes mean opening new opportunities for business ventures, but also theinevitable interruption of some of the current activities. In order to adapt to new circumstancescompany has to have some essential characteristics: innovation, proactive approach, adaptability,

Journal of International Scientific Publication: Economy & Business, Volume 6, Part 4
ISSN 1313-2555, Published at: http://www.scientific-publications.net
244 Published by Info Invest, Bulgaria, www.sciencebg.net
flexibility and speed. All these features give the company a new quality and lead to entrepreneurialorientation, which is a key source of sustainable competitive advantage. Rejecting the conventionalbusiness practices also means creating necessary conditions for continuous innovation, because it is amajor source of continuous improvement. For successful implementation of innovations, very specialentrepreneurial context is required. The above changes in the environment and internal businessprocesses must be taken into account while implementing various theoretical concepts into businesspractices in order to achieve business excellence.
Since the competition rules are constantly changing and competitive advantage is rapidly becomingobsolete, successful businesses today have found a solution in a continuous process of innovation andimplementation of ''creative destruction'' (Stopford and Baden-Fuller, 1994). Therefore, innovation,proactiveness, and risk taking are the main characteristics of modern enterprises in which employeesinvest their knowledge and skills to develop new products, services, and open new businessopportunities which constantly generate competitive advantages.
2. CORPORATE ENTREPRENEURSHIP AND INNOVATIONThe appropriate definition of entrepreneurship in modern terms is the creative ability to initiate newideas, concepts and creation of new enterprises and business ventures. Entrepreneurship has certaincommon features, regardless of scope, as evidenced by the introduction of the entrepreneurial processlevels: (a) opportunity identification, (b) concept development, (c) resource determination andacquisition, (d) venture introduction and development and (e) entrepreneurial venture harvest. Thedifferences between corporate and traditional entrepreneurship can be seen in the attitudes, motivation,time horizon, responsibility, risk propensity, skills and work style of corporate businesses (Morris,Kuratko and Covin, 2008).
Corporate entrepreneurship refers to the explanation of entrepreneurial activity in the medium andlarge enterprises, and includes the creation, development and implementation of new ideas, whileinnovation may represent new products and services, administrative procedures and productionprocesses. Jennings and Lumpkin (1989) observe corporate entrepreneurship through its basic formsrelating to the creation of new business opportunities within existing enterprises, transformation orrejuvenation of a business organization which can express the innovation process, including newsolutions of old problems, and refers to attempts to change the rules under which competitionoperates. Furthermore, Guth and Ginsberg (1990) note that corporate entrepreneurship consists of twokey phenomena: creation of new business ventures within existing companies, and organizationaltransformation through redefining business strategy and strategic renewal. Zahra (1991) observescorporate entrepreneurship as a set of formal and informal activities aimed at creating new businessopportunities in existing businesses in the form of new products, services, process innovation, andcreating new markets.
Lumpkin and Dees (1996) highlight five organizational aspects of entrepreneurial orientation:autonomy, innovativeness, risk-taking, proactiveness and competitive aggressiveness. Covin andMiles (1999) suggest that there are two elements that define an entrepreneurial organization; (a)innovation - introduction of new products, technologies, systems and processes and (b) sustainablehigh performance or radical improvement of competitive situation. The purpose of all organizationalredefinitions, renewals and rejuvenations is to achieve competitive superiority, or as we have definedit in the previous section - business excellence. Since corporate entrepreneurship refers to the creationof new business ventures within existing organizations and organizational transformation through

Journal of International Scientific Publication: Economy & Business, Volume 6, Part 4
ISSN 1313-2555, Published at: http://www.scientific-publications.net
245 Published by Info Invest, Bulgaria, www.sciencebg.net
strategic renewal it is necessary to highlight the main aspects of corporate entrepreneurship (Antoncicand Hisrich, 2003).
• New ventures and new businesses (main aspect). Creation of new venture is the main characteristicof corporate entrepreneurship because it leads to the creation of new businesses within existingcompany. New ventures can lead to the formation of autonomous and semi-autonomous departmentswhich can exist as a part of an organization or outside its boundaries in the form of a newly createdenterprise (spin out). The main difference between these two aspects of corporate entrepreneurship isreflected in the fact that the results of new ventures can be seen in the formation of new departmentsor enterprises (spin out), while the aspect of new businesses applies only to the entry to newbusinesses by an existing organization, without creating a new organizational entities.
• Product, service and process innovativeness. This aspect relates to the innovation of products andservices through the development of technology. Therefore, innovativeness of products and servicesprimarily differentiates from the innovativeness of processes through the segment related to thetechnological development of the manufacturing process. Thus, corporate entrepreneurship involvesdevelopment of new or improvement of existing products, services, production methods andprocedures.
• Self-renewal (willingness and commitment to the transformation of the key ideas on which thecompany is based on). Represents the aspect that relates to the organizational transformation based onthe redefinition of key ideas upon the company was founded on. Moreover, this aspect hasconnotations associated with the strategic and organizational changes, and includes strategyredefinition, reorganization and systemic changes that lead to the increased business flexibility andadaptability.
• Proactiveness. This aspect of corporate entrepreneurship refers to orientation and willingness of thetop level management to undertake initiative. Therefore it is related to the readiness of the company tolead, to become a market leader and not to follow competitors in crucial business segments such as theintroduction of new products/services, manufacturing technologies and administrative techniques.
• Risk taking. This aspect has its roots in the early definitions of entrepreneurship. Even Cantillondefined the entrepreneur as an individual who is inclined to take risk for profit makingactivities. Schumpeter has also defined risk-taking as a basic element of entrepreneurship (Kolakovic,2006). Therefore, risk-taking represents the possibility of business failure and the loss of investedresources related to the rapid and brave new entry business decisions.
• Competitive aggressiveness. Competitive aggressiveness refers to the company’s propensity tocompete with its rivals. Entrepreneurial posture can be reflected in the company’s tendency toaggressively compete with industry rivals (Covin and Slevin, 1991). This aspect can be also seen asthe organizational willingness to take a leading role in the market and a dominant position againstcompetitors. In addition, it is necessary to distinguish competitive aggressiveness andproactiveness. Their essential difference is reflected in the fact that proactiveness refers to theresponse on the perceived market opportunities, while competitive aggressiveness is associated withresponding to the threats of the competitors.
The extent to which corporate entrepreneurship will be realized and the ways in which will bemanifested depend on factors that can be grouped into four areas: external environment, strategicleadership, working environment and company results (Morris, Kuratko and Covin, 2008). Intensity ofcompany’s entrepreneurial orientation is a combination of the degree of entrepreneurship (which refers
Journal of International Scientific Publication: Economy & Business, Volume 6, Part 4
ISSN 1313-2555, Published at: http://www.scientific-publications.net
246 Published by Info Invest, Bulgaria, www.sciencebg.net
to the extent to which entrepreneurial activities are innovative, proactive and risky) and the frequencyof entrepreneurship (the extent to which entrepreneurial ventures are common).
Previous analysis has shown that corporate entrepreneurship and successful entrepreneurial orientationcan significantly increase the company’s competitive position and value added, and that the innovationis a crucial aspect of the entrepreneurial process. Creativity and innovation are critical for the successand survival of the company. However, innovation is not a simple concept to define. Althoughinnovation represents something unique or different, it is important to clarify the difference betweeninvention and innovation. Ahuja and Lampert (2001) consider it necessary to distinguish betweeninvention and innovation, not only for the conceptual reasons but for the practical reasons, as well,which relate to security and creation of new discoveries. Inventions represent development of newideas or the act of creation, while innovation is related to the commercialization of inventions. Otherauthors explain this relationship quite differently (Burns, 2005). Innovation is something original andthe realization of this originality may include invention (which is just an extreme and more risky formof innovation) and the development of innovative processes. However, for something to representsuccessful entrepreneurial innovation (innovation in economic sense of the word) it has to be related tothe consumer demand and market opportunities and has to become business reality. In this way,innovations are connected with market opportunities which allow generation of competitive advantagefor the company. Therefore, innovation can be seen as a broader concept then invention, sinceinventions do not have to achieve commercial success and because innovation is not necessarily aproduct of research and development activities, which is an essential aspect of invention.
Zimmerer and Scarborough (2008) distinguish creativity and innovation. Creativity is the ability todevelop new ideas and to discover new ways to test the basic problems and opportunities. Innovationis the ability to apply creative solutions to these problems and opportunities to enhance and enrichpeople's lives. Thus, innovation is realized creativity, i.e. it represents the transformation of new ideasin business practice. Entrepreneurs are those who discover and do new things or existing things in newways. They create new ideas and transform them into business practice, creating added value, althoughthey may not be in both functions in each case. Based on these elaborations, we can offer anacceptable, general, definition of innovation: it describes a range of organizational activities associatedwith the movement of new conceptual ideas to products and services offered on the market (Jones,2005). A broader and more detailed classification of certain aspects or forms of innovation can besummarized as follows (Johnson, 2001). Innovations refer to:
1. Any change in the range of products and services of an organization is on the market - it isclearly understandable form of innovation.
2. Any change in the application of products or services beyond its original purpose. (In adifferent direction from its original market)
3. Any change in the market that product or service is implemented in a different way.
4. Any change in the way the product or service developed differently from its original executionand logistics design.
5. There is also a special category of innovation that focuses on the manner in which theorganization performs the basic business model development, i.e. in a different way than theircurrent or previous business model (a new way of governance, new organizational culture,etc.).
Journal of International Scientific Publication: Economy & Business, Volume 6, Part 4
ISSN 1313-2555, Published at: http://www.scientific-publications.net
247 Published by Info Invest, Bulgaria, www.sciencebg.net
These forms of innovation show that creativity and innovation have entrepreneurial context, and referto person or group which creates innovation and transform it into business practice. Innovationincludes creativity, but it requires businesses and entrepreneurs in order to connect with marketconditions.
3. CHANGES IN ORGANIZATIONAL CULTURE
In modern economic conditions it is evident that the economy is becoming primarily based onintangible sources of value and those concepts such as reputation, trust and loyalty have a concreteimpact on competitive advantage, financial performance and businesses survival. Company’s cultureis an example of an intangible element. The culture of an organization consists of the basicassumptions and beliefs upon which companies are formed, how its members behave and how itdefines itself in relation to the external environment (Burns, 2005). Articulated analysis identifies sixbasic elements that make up culture: values, rules of conduct; dictionary; methodology, rituals andmyths and stories (Morris, Kuratko and Covin, 2008). Bowman and Faulkner (1997) divided thedimensions of culture into four domains: (a) values, (b) cognitive process, (c) behaviors, and (d)organizational processes. Burns (2005) systematized the results of empirical research, and on the basisof the results analyzed the dimensions and implications of the dominance of certain values.
• Individualism versus collectivism. It is the degree to which people tend to act as individuals ratherthan groups and vice versa.
• Power distance. It is the degree of inequality among people that the community is willing to accept.
• Uncertainty avoidance. It is the degree to which people are willing to avoid ambiguity, remove theuncertainty and strive for structured rather than unstructured situations.
• Masculinity versus femininity. The degree to which male values (competition, assertiveness, financialawards, achievements) and to which women values dominate (modesty, cooperation, rewards,relationships, a tendency to compromise).
The results showed that the entrepreneurial culture involves a shift from individualism to collectivism,to the extent to which the organization develops. Furthermore, entrepreneurial culture has a smalldistance of power. Such organization typically avoids uncertainty and finally, there is a balancebetween masculine and feminine dimension. What are the implications of such a composition values?The prevalence of collectivism and the balance between masculine and feminine dimensions of culturemeans creating relationships and networks with all stakeholders and sees them as more important thanformal structures. It is culture oriented toward achievement, motivating people, and employees feelthat they belong to the organization. Small distance of power creates culture that shares information,knowledge and learning. Small uncertainty avoidance indicates a culture that values creativity andinnovation and recognizes the importance of balanced risk avoidance.
The achievement of certain equilibrium between the values is the fundamental management taskwhich is often difficult to realize. We could use conflict of individualism and collectivism as anexample. The values of individualism are: achieving individual goals, self-sufficiency and self-orientation, while the values of collectivism care for the welfare of the group and put the emphasis onunity and cooperation. Management must reconcile that often extremely different values and find abalance that enables the achievement of company objectives. However, a certain contradiction ortension between individual autonomy and the creation of a joint cooperative culture can never beignored.

Journal of International Scientific Publication: Economy & Business, Volume 6, Part 4
ISSN 1313-2555, Published at: http://www.scientific-publications.net
248 Published by Info Invest, Bulgaria, www.sciencebg.net
Implementation and development of entrepreneurial orientation in a company to a large extent dependon the balance between individual initiative, creativity and cooperative behavior at different levels,which increases social capital and the results derived from the essence of cooperative values.
What is the company culture and how it is achieved?
There are several elements that stimulate innovation and entrepreneurship and thus contribute tocreation of an entrepreneurial culture (Morris, Kuratko and Covin, 2008):
• Focus on people and the transfer of powers
• Creating value through innovation and change
• Focusing attention on the essential
• Active (practical) management
• Doing the right things
• The freedom to fail and make mistakes
• Duty and personal responsibility
• Focus on the future and a sense of the reaction rate
For the realization of these values, they should be included in the company's vision and furtherconcretized in the company’s strategy. Bearing in mind the characteristics of employees and theintended profile of the culture, it is necessary to shape the policy for human resource managementwhich is consistent with the strengthening of entrepreneurial culture. If it is the case for culturedevelopment within existing organizations, then the focus should be placed on encouraging andrewarding of creativity as the main source of innovation. Although company's culture changes overtime due to changes of its components, it is important to point out that the company’s culture refers tothe way the company performs and carries out its business activities regardless to short-term events,changes or disruptions on the marketplace.
4. SYSTEM FOR PROMOTING CORPORATE ENTREPRENURSHIP
Modern enterprises faced with constant market uncertainty and rapid changes are trying to achieve twosomewhat conflicting goals. First one relates to the integration of various business activities in order toachieve economies of scale and economies scope, while the other one refers to starting new businessventures and creation of innovations. Therefore, the answer for achieving synergy effect between thesetwo goals offers corporate entrepreneurship which reconciles individual employee initiatives on oneside and company’s strategic goals on the other side (Wickham, 2006).
A variety of available literature states that culture is the most important element for the developmentof corporate entrepreneurship, i.e. if the company’s culture is entrepreneurially inclined then thecompany will act in an entrepreneurial manner (Burns, 2005). More accurately, company’s culture hasan impact on the development of corporate entrepreneurship in the short run, while if the companywants to encourage the entrepreneurial spirit of its employees to act innovatively and proactively inthe long run it has to provide an adequate incentive system which will enable employee willingness totake risks regarding their entrepreneurial activities. Conducting entrepreneurial activities within acompany requires a greater freedom for its employees whereby the company exposes its self to agreater level of various forms of risks. One form of the risk refers to the possibility of divergence

Journal of International Scientific Publication: Economy & Business, Volume 6, Part 4
ISSN 1313-2555, Published at: http://www.scientific-publications.net
249 Published by Info Invest, Bulgaria, www.sciencebg.net
between the strategic goals, guidelines and objectives set by the top management and the defined goalsof the projects developed by the employees. While other form of the risk to which the company isexposed to refers to the possibility that those employees in which the company has heavily investedand have become a valuable part of the company’s human and intellectual capital simply leave thecompany and start their own business venture which was previously developed within company orsimply defect to the competition. Therefore, in order to avoid the risks listed above or at least reducethem to the minimum, the development of an adequate incentive system is a necessity for achievingthe following objectives: (a) fostering the entrepreneurial and risk-taking spirit in the organization, (b)attracting and retaining the best talent, and (c) promoting venture success (Viswanathan andNagarajan, 2004).
In forming a system for promoting entrepreneurial activities various factors should be taken intoconsiderations. Factors that depend on the type of the business venture, venture development stage andthe intrapreneur’s role performed in the business venture. The most important factors which determinethe success of the incentive system are: (a) human element, (b) autonomy, structure and processes, (c)short-term vs. long-term incentives, (d) performance relatedness, and (e) attracting and retaining talent(Viswanathan and Nagarajan, 2004).
• The human element. A successful business venture requires a combination of employees who possessentrepreneurial, managerial and technological knowledge and who according with their specializedknowledge perform various critical roles during venture’s developmental phase. These roles may be:inventor, venture manager, venture team, internal support and external workers. Therefore, recognitionof these roles is crucial for designing an adequate incentive and compensation system.
• Autonomy, structure, processes. The business venture success greatly depends on the autonomy ofthe team responsible for realization of the business venture because venture team acts in a newlycreated or emerging market where learning primarily happens by operating on it. Autonomy may bemanifested as: a) autonomy in decision making, b) autonomy in support and resources needed, and c)autonomy in control and reporting required. Precisely because the greater level of autonomydifferentiates the business venture from the rest of the organization, a more specific incentive systemis need.
• Short-Term vs. Long-Term Incentives. As the words say a short-term incentive forms effect andensure the implementation of short-term actions, while long-term forms of incentives ensure therealization of key strategic actions. In any business venture a balance between short and long termforms of incentives is required.
• Connection with success. It is necessary that incentives and rewards are associated with the achievedresults and company’s performance. This does not mean that failures should be punished, simplybecause the probability of a venture failure is a lot greater than the probability of an ordinaryproject. Moreover, even if the business venture failed, those employees who have done their jobextraordinarily well should be rewarded.
• Attracting and retaining talent. In an effort to attract the best talent, a company should modifytraditional incentive and rewarding system because employees should not experience participating in anew business venture as something that will slow down their career development.
In addition to the factors mentioned above that affect design of incentive system for promotingcorporate entrepreneurship, the system itself should be as simple as possible with clearly definedgoals. The results for measuring the venture success have to be clearly defined, and different level of

Journal of International Scientific Publication: Economy & Business, Volume 6, Part 4
ISSN 1313-2555, Published at: http://www.scientific-publications.net
250 Published by Info Invest, Bulgaria, www.sciencebg.net
relevance should be given with the appropriate reward amounts. Moreover, the incentive and rewardsystem should be present during the entire life of the business venture.
The most important components of incentive system for implementing corporate entrepreneurship are:financial incentives, non-financial incentives and risks associated with participation in a venture teamresponsible for developing new business ventures (Kuratko et al. 2005). Incentive system has to bedesigned in a way to increase performance and efficiency, there must be clearly visible link betweenperformance and rewards, and the system must be based more on positive than on negativeconsequences of working behavior (Bahtijarevic-Siber, 1999).
• The financial incentives. Financial incentives are the most common form of incentives and rewardsbecause they are directly associated with work of the individual or a group and are perceived as adirect reward for committed effort. Therefore, the following table 1 gives a detailed view of variousforms of financial incentives and their characteristics.
Table 1: Financial incentives of corporate entrepreneurship and their characteristics
Financial incentive Incentive features
Equity and equity-related • Shares/ options in parent firm/ venture
• Phantom shares: if venture doesn’t exist as a separate entity
• Encourages collaborative behavior
• Purchased equity in new venture links risk to potential reward
• Relatively long term incentive
Bonuses • Fixed amounts known in advance; Variable, performance
linked; Discretionary bonus after major contribution
• Can be both long term as well as short term
Salary increases and salary • Salary increase is related to changing role in the venture
Fringe benefits • Holiday trips, scholarships to children, sabbaticals etc.
Source: Viswanathan, R.J. and Nagarajan, G.S. (2004) The 4E model: Designing an incentive systemfor internal ventures, ESADE MBA Business Review, p. 28
• Non-financial incentives. In order for an incentive system to be a comprehensive one, besidesfinancial incentive forms that make up its foundation, it has to include non-financial incentives aswell. The motivation for conducting entrepreneurial activities will be greater if an employee canrealize more of its diverse needs. Therefore, it could be said that non-financial incentives aresometimes more important than financial incentive forms, especially in the start-up phase of theventure. The following table 2 provides an overview of the most important non-financial forms forpromoting the development of corporate entrepreneurship within a company.

Journal of International Scientific Publication: Economy & Business, Volume 6, Part 4
ISSN 1313-2555, Published at: http://www.scientific-publications.net
251 Published by Info Invest, Bulgaria, www.sciencebg.net
Table 2: Non-financial incentives of corporate entrepreneurship and their characteristics
Non-financial incentive Incentive features
Top management supportfor venture
• Presence of a management champion for the venture
• Increased resources: money or personnel
Autonomy, freedom,independence
• Basic motivation of intrapreneur is to realize his vision in his own way:autonomy
• Intrapreneur does not have to take management permission for every move:freedom and independence in operation
Recognition • Recognition is not just a gesture, it is an empowerment tool
• Manifested through recognition ceremonies, awards and corporatepublications
Authority, responsibility,power
• Subtle incentives
• Only explicit way of awarding these incentives is through promotions
• Promotion to broadened responsibilities is the fundamental corporatereward
Source: Viswanathan, R.J. and Nagarajan, G.S. (2004) The 4E model: Designing an incentive systemfor internal ventures, ESADE MBA Business Review, p. 28
• Risks. The unique aspect of corporate entrepreneurship, i.e. participation in the development of newbusiness ventures, is the presence of significant levels of risk associated with intrapreneurs and otheremployees who participate in the ventures’ development. Risks associated with employees whoparticipate in a business venture development are presented in the table 3.
Table 3: Risks of employees and their characteristics
Risk for personnel Nature of risk
Financial risk • Opportunity cost of leaving some other division and working for new venture
• Possibility of missing out on incentives due to the inherent risk of the newventure
Career risks • Working for the new venture may become a Stumbling block in theemployee’s career. He may miss out on promotions, etc
Job security and benefitsrelated risk
• Firms sometimes don’t guarantee jobs in case of venture failure. This createsjob security risk.
• While joining new venture employees often have to give up standard benefitspackage.
Effort and stress • A new venture, by its inherent nature, is often more stressful and difficultthan an established venture
Source: Viswanathan, R.J. and Nagarajan, G.S. (2004) The 4E model: Designing an incentive systemfor internal ventures, ESADE MBA Business Review, p. 28

Journal of International Scientific Publication: Economy & Business, Volume 6, Part 4
ISSN 1313-2555, Published at: http://www.scientific-publications.net
252 Published by Info Invest, Bulgaria, www.sciencebg.net
After developing a design of an incentive system for promoting entrepreneurial activities it isnecessary to choose a model that would be appropriate for the company’s organizational structure,culture and climate, which will implement entrepreneurial spirit to all organizational levels. This couldbe achieved by the use of the various combinations of the following models: (a) personal contribution,(b) stock ownership, (c), life-cycle incentives approach (d) intracapital and (e) intrapreneurial careerpath development (Viswanathan and Nagarajan, 2004).
• Personal contributions. In this model, employees set aside a certain amount of the annual salary,with no wage increases during the year, until the business venture achieves a certain level ofperformance. After the objectives are met employees are awarded with monetary or other forms ofbonuses accompanied with the return of the previously unpaid wages. The same procedure is thenrepeated for the following year. The advantage of this model can be seen in encouraging teamworkand cooperation of the people involved in the venture development. Moreover, it creates a direct linkbetween the risks and the potential rewards.
• Stock ownership. This model can be implemented in two ways: (1) outstanding employees arerewarded with the options for shadow/actual equity in the venture and (2) employees are rewardedwith equity itself rather than options in the new venture. In this way employees are encouraged toparticipate in long-term venture development.
• The life cycle of the business venture. The company must have an established incentive and rewardssystem based on different aspects of the business venture life cycle. Different incentive forms andmodels are appropriate depending if the venture is in the seed phase, start-up phase, maturity or exitstage.
• Intracapital. This model satisfies the basic intrapreneur’s need, autonomy to manage and allocatecompany’s resources in order to convert its business idea into a successful businessventure. Therefore, to a worthy and proven intrapreneur a certain amount of resources is allocated andhe has an exclusive right to manage these funds according to his vision. In this way an intrapreneurwill be more careful with resource allocation and their consumption than he would be if the resourcesare under their superior’s control.
• Intrapreneurial career path development. One of the most demanding challenges of corporateentrepreneurship development is resolved with this model, and it is the problem of providing the mosttalented intrapreneurs with the opportunity to continuously develop their careers within thecompany. Most often problems occur when intrapreneurs have to return to their old work positions andtheir job routines where they are faced with the administrative tasks not related to new venturecreation. Successful intrapreneurs characterized with high levels of entrepreneurial orientation are noteven able to efficiently carry out the tasks associated with top management levels because they simplylack the features characterized with managers. Instead of giving hierarchical promotions, intrapreneursshould be rewarded with higher bonuses or by transferring them from a venture in the mature or exitstage to a new business venture which is in the concept or start-up phase. Therefore, this model aimsto achieve continuous intrapreneur career development for those employees who are born leaders andwho after successful venture realization simply would not be able to find the meaning and satisfactionof performing everyday operations of their old job positions.
After describing possible models for corporate entrepreneurship development, it can be concluded thatthe first two models, personal contributions and stock ownership, are closest to the traditional meaningof entrepreneurship, i.e. to the situation where intrapreneurs are most similar to entrepreneurs becausethese models create a direct relationship between the risks and possible rewards that business venture

Journal of International Scientific Publication: Economy & Business, Volume 6, Part 4
ISSN 1313-2555, Published at: http://www.scientific-publications.net
253 Published by Info Invest, Bulgaria, www.sciencebg.net
carries with itself. Other advantages of these models are encouragement of cooperation and teamworkamong participants in business venture creation.
5. CONCLUSION
New model of entrepreneurial culture has two essential objectives: a sustainable competitiveadvantage and the value delivery to company’s stakeholders. In this sense, changes in corporategovernance have to be implemented for management to meet the stakeholders’ needs and to increasethe shareholders’ value. At the same time, it has to create the conditions for the continuous innovationdevelopment which are the precondition for the business excellence realization.
Conditions for creating a new model of entrepreneurial culture has to be provided within corporateentrepreneurship, i.e. it is impossible to achieve business excellence without the implementation ofentrepreneurial orientation throughout all organizational segments. In order for a company to adjust tothe new market circumstances, employees have to possess the essential features of entrepreneurialorientation: innovation, proactiveness, and risk-taking, which emphasize diversity and initiative as themain factors of entrepreneurship. On the other hand, harmony and cooperation between employees,teamwork and cooperation in avoiding conflicts are required. This is a key problem in creating anadequate entrepreneurial atmosphere.
A similar problem occurs in the shaping of organizational culture which understands the way thecompany performs and carries out its activities regardless short-term disturbances. It is often crucial toachieve the balance between individual values that form the foundation of the entrepreneurialculture. One of the problems is the balance between individualism and collectivism, since they oftenhave conflicting values and beliefs. Some empirical research argues that an entrepreneurial cultureinvolves a shift from collectivism to individualism. The relations and networks with a strong sense of"inner group" are developed, at the same time with a sense of competition to the "outside groups".This is need to synchronize with the stakeholder model of entrepreneurial culture which refers to theculture that creates relationships and networks with all stakeholders where informal structure is moreimportant than the formal structure of relations.
Since the organizational culture is necessary for the realization of business excellence andstakeholders’ value in its essence it has to be entrepreneurially inclined, therefore a certaincontradiction between individual autonomy and collective cooperative culture remains the problem ofa new entrepreneurial culture model.
REFERENCES
1. Ahuja, G. and Lampert, C.M. (2001) Entrepreneurship in the large corporation: a longitudinalstudy of how established firms create breakthrough inventions, Strategic Management Journal,Vol. 22, pp. 521–543.
2. Antoncic, B. and Hisrich, R.D. (2003.) Clarifying the intrapreneurship concept, Journal ofSmall Business and Enterprise Development, Vol. 10, No. 1, pp. 7-24.
3. Bahtijarevi -Šiber, F. (1994.) Intrapoduzetništvo, Slobodno poduzetništvo: asopis zapromicanje poduzetništva i tržišnog gospodarstva, No.11, pp. 131-138
4. Bowman, C. and Faulkner, D.O. (1997) Competitive and corporate Strategy, London: Irwin

Journal of International Scientific Publication: Economy & Business, Volume 6, Part 4
ISSN 1313-2555, Published at: http://www.scientific-publications.net
254 Published by Info Invest, Bulgaria, www.sciencebg.net
5. Burns, P. (2005.) Corporate entrepreneurship: Building an entrepreneurial organisation,Palgrave MacMillan
6. Covin, J. G., and Miles, M. P. (1999) Corporate entrepreneurship and the pursuit ofcompetitive advantage, Entrepreneurship Theory and Practice, Vol. 23, No. 3, pp. 47-65.
7. Covin, J.G. and Slevin, D.P. (1991) A conceptual model of entrepreneurship as firm behavior,Entrepreneurship Theory and Practice, Vol. 16, No. 1, str. 7-25
8. Guth, W. and Ginsberg, A. (1990.) Guest editors' introduction: Corporate entrepreneurship,Strategic Management Journal, Vol. 11, str. 297-308
9. Jennings, D.F. and Lumpkin, J.R. (1989.) Functioning modeling corporate entrepreneurship:An empirical integrative analysis, Journal of Management Vol.15, No. 3, str. 485-502
10. Johnson, D. (2001) What is innovation and entrepreneurship? Lessons for largerorganizations, Industrial and commercial training, No. 4, pp. 135-140.
11. Jones, O. (2005) Manufacturing regeneration through corporate entrepreneurship: Middlemanagers and organizational innovation, International Journal of Operations and ProductionManagement, Vol. 25, No. 5, pp. 491–511.
12. Kolakovi , M. (2006.) Poduzetništvo u ekonomiji znanja, Sinergija, Zagreb
13. Kuratko, D.F., Ireland, R.D., Covin, J.G. and Hornsby, J.S. (2005.) A model of middle-levelmanagers' entrepreneurial behaviour, Vol. 29, No. 6, Entrepreneurship theory and practice, str.699-716
14. Lumpkin, G.T. and Dess, G.G. (1996.) Claryfying the entrepreneurial orientation constructand linking it to performance, Academy of Management Review, Vol. 21, No. 1, str. 135-172
15. Morris, M.H., Kuratko, D.F. and Covin, J.G. (2008.) Corporate entrepreneurship andinnovation, 2nd ed., Thompson
16. Stopford, J.M. and Baden-Fuller, C.W.F. (1994.) Creating corporate entrepreneurship,Strategic Management Journal, Vol. 15, str. 521-536
17. Viswanathan, R.J. and Nagarajan, G.S. (2004.) The 4E model: Designing an incentive systemfor internal ventures, ESADE MBA Business Review, str. 25-31
18. Wickham, P. (2006.) Strategic entrepreneurship, Prentice Hall
19. Zahra, S.A. (1991.) Predictors and financial outcomes of corporate entrepreneurship: Anexploratory study, Journal of Business Venturing, Vol. 6, No. 4, str. 259-285
20. Zimmerer, T.W. and Scarborough, N.M. (2008.) Essentials of entrepreneurship and smallbusiness management, Prentice Hall, New Jersy

Journal of International Scientific Publication: Economy & Business, Volume 6, Part 4
ISSN 1313-2555, Published at: http://www.scientific-publications.net
255 Published by Info Invest, Bulgaria, www.sciencebg.net
THE FACTORS OF FINANCIAL CRISIS
Ileana Anastase (Badulescu)
University Tomis, Cosntanta, Romania
Abstract
The author argues assertion that economic and financial crises are more "rules" than deviations fromthe "rule". An analysis of the evolution of large-scale crises, economic crises since the nineteenthcentury has been performed. A special attention is paid to "paraeconomic" processes destroyingmoney supply in the circuit with all the negative consequences on the further development of theeconomy. "Paraeconomic" processes called "financial bubbles" are factors generating financialcrises. Analysis of the causes and evolution of every economic and financial crisis can not serve asbasis for a theory that would exclude financial crises. Study of crisis is needed to predict theiroccurrence in order to minimize potential losses.
Key words: financial crisis, market, price, stock.
1. INTRODUCTION
The material includes handling crisis from a range of analytical factors: research, development ofcrisis, "contribution" of each factor in initiating and carrying out economic and financial crisis.Economic crisis are not missing for a moment in the global economy. They are only different by levelof depth, geography and as generators of crisis. The high level of economic interdependence makessome attacks to be easily mitigated, others multiplied. One financial crises within the meaning ofcontemporary concepts of "diagnostic" crisis was one of a.1857 the U.S., generated by "expulsion" ofU.S. exporters to Europe, Russian exporters are liberated from military adventures in Crimea.Geography, and prices have favored Russia. At that time, the effect of "punishment" given by themarket, have over 1400 U.S. banks failed. Usually, crises do not last long. This crisis lasted only twoyears.
The following dates have accompanied the global economy crisis as a "shadow", only that the size anddepth have not been large enough for them to go down in history. But by 1878, technological progress,actions have generated speculation the next crisis that swept the U.S. and Europe. A feature of thatcrisis was the unprecedent overproduction in space and time for the world economy (Kindleberger,1982, 1996; Pinner, 1937; Reinhart, 2009). Economy to a certain point, it is not unbalanced byfinancial bubbles until the market turns arbitrator and therefore bubbles "burst" with all theconsequences: money raise their value, prices are reduced, assets are materialized devalues, businessesfails, increase unemployment, etc.. On October 22, 1929, the newspaper "New York Times", IrvingFisher, economist with considerable authority, outlined his views on the share price. Actions,according to Fisher, sold below the actual cost.
Population understood correctly, Fisher really was right - actions had to be sold at a higher price.Consequently, both with money and those without money, through bank loans, and were filled"pockets" with cheap shares. Therefore, it created a financial bubble, which destroyed the finances ofthe economic cycle. Money, converted into shares in the hope they will make more money, have

Journal of International Scientific Publication: Economy & Business, Volume 6, Part 4
ISSN 1313-2555, Published at: http://www.scientific-publications.net
256 Published by Info Invest, Bulgaria, www.sciencebg.net
created a new situation on the market: supply of goods and services market was preserved, demand forgoods and services decreased; Dow-Jons, which increased from 104 in September 1924 to September1929 to 381.18, falling to 41.2 by July 1932. Financial bubble, driven by holders of shares snapped,shortage of money in the market caused the Great Depression of 1929-1933. Irving Fisher, inMcGrattan's opinion, was right (McGrattan, 2003): the shares were sold at an unreasonably high price.In 1933, Irving Fisher made theoretical explanations on causes conducting to economic crisis (Fisher,1933, p.337-357) and the successful theory was developed by Minsky (Minsky,1982, 1986). Starter ofthe economic crisis in the years 1929-1933 was not Irving Fisher, who said a truth, but "producers" ofshares.
2. COMPLEXITY OF FINANCIAL CRISIS
Statement can be expressed in formal language: note by N - number of shares, A - number of sharestraded, (NA) - the number of shares awaiting sale. Number of shares traded in a unit time isproportional to the number of shares sold (they are carriers of advertising pro stock), the number ofshares to be sold, or otherwise expressed, where - coefficient of proportionality.
Solving the first order differential equation with separable variables, we determine the optimal number
A* of shares tradeddt
ANAdA
ordt
ANdA
AdA
N1
from which we obtain
ANA
Nln1
= t orNte
ANA
A =Nte
N11
which can be interpreted graphically (Figure1).
Financial bubble was to be any claims, in fact correct, of Irving Fisher. The shares were sold to a
certain speed dtdA
which was stimulated by two factors: the number of shareholders already becomeinformation carriers pro action and the potential number of shareholders.
Irving Fisher's published output only accelerated the process of "swelling" of the financial bubble tothe size, the market and said "verdict" and financial bubble "burst", has generated economic crisis.Imaginary, the crisis could be avoided if there were restrictions on the number of shares to be sold out(the number N).
The increase in stock prices (generated by request), together with increasing N, leading to anaccumulation of financial resources to expand capacity beyond that of production processes.Uncontrolled population growth was due to carry debt crisis of 1929-1933. On closer analysis, wefound that the population led by the "flock of sheep" Fisher said - all bought, material goods prices fell- all trying to "get rid" of them.

Journal of International Scientific Publication: Economy & Business, Volume 6, Part 4
ISSN 1313-2555, Published at: http://www.scientific-publications.net
257 Published by Info Invest, Bulgaria, www.sciencebg.net
According to (Wheelock, 2008, p. 570), the U.S. unemployment rate in 1933 exceeded the 25%disposable income fell by 44%, real GDP fell by 30%. Over 43.8% of mortgages have remainedunpaid (Wheelock, 2008, p. 138-139). By 1934, 50% of banks have failed (Bridgewell, 1938, p 171).Returning to the crisis of 2008-2010, we find that in the U.S., 55 million homes remain as collateral tobanks, so 100-165 million people are affected (Barth, 2008).
Good conditions for initiation and growth of financial bubbles provide scientific and technicalprogress, innovation, advanced technologies. Emissions of action, enjoy overappreciation amongbuyers and, in principle, that is found "by a Fisher" that using the Internet, the modern means oftelecommunications, the rules "flock" financial bubbles can initiate the way, at any time, can"explode", generating a crisis of proportions.
Such a crisis has been the world market in the years 1995-2001. Crisis of 2008-2010 was predictedback in 2005 by R. Shiller (Shiller, 2005, p.78-80; Leonhardt, 2005) who found that housing prices inother real estate prices exceed 40%.
Financial crisis in 2008-2010 affected the world economy, but American banks and property andshares, which were well provided (Blackburn, 2008, p. 63-106; EEAG, 2009; Felton, 2008). Who,what, how and when to initiate financial bubbles, generating economic crisis? An attempt to answerthis question is found in the paper of German economist Zeidl K. [Zeidl, 2010, p. 122-133). In hisview, financial crises are caused by 12 factors, including:
One. Substandard construction mortgage bonds increased. Some U.S. residents, neînst ri i withoutpermanent jobs in the social policy of the state, took bank loans on favorable terms (first contributionis greatly reduced, the tax credit - for the next 2-3 years than the next tax year credit is flexibledepending on the potential customer banking) (Garriga, 2006, p..401-403). Consequently, in the years
t0
A
N
Figure 1: The evolution of the number of shares traded

Journal of International Scientific Publication: Economy & Business, Volume 6, Part 4
ISSN 1313-2555, Published at: http://www.scientific-publications.net
258 Published by Info Invest, Bulgaria, www.sciencebg.net
1994-2006, household debt increased considerably. For these favors have benefited people aged under35 years (Garriga, 2006, p.398).
Two. Tax reform in 1986. The reform favors created for mortgages. Some people took advantage ofthese facilities, has "converted" expenses for other needs in the mortgage. Consequently, householddebt increased.
Three. Lower percentage fees (Blackburn, 2008, p.65). Keeping taxes low and caused the appearanceof cheap loans available to many people. Percentage fees were reduced from 15% in 1981 to 6% in2005. Given the reduction of inflation, percentage fees were reduced from 8% in 1981 to 3.5% in2005. Cheap loans have contributed to increasing the supply of housing construction. Consequently,housing prices have increased (Garriga, 2006, p. 403-405).
Four. Securing debt. Receivables are a deal between two subjects: the debtor and creditor. The lendermakes the debt into shares they can sell, you can get the financial market, transferring his rights toanother creditor. In, further centers have been invented to secure debt by creating securities(McDonald, 2008, p. 36). Lender may (with some probability) the consequences bankruptcy debtoror percentage tax reductions. Both situations can be overcome by imposing a lien creditor of thedebtor, by establishing flexible percentage fee (McDonald, 2008, p. 32, 36). Relations between debtorand creditor, turned into securities can be sold at prices that correlate to the risk of business(Blanchard, 2009, p. 4-5; EEAG, 2009, p. 60-70]. Thus, the issuer of the securities fails to market riskprobability, banks avoid risks, may increase the number of debtors, debts growing company.
Five. Rating agencies collapse. In the U.S., the three Rating agencies, establish rating of bankruptcy,income drawn with a certain probability. The questionable methodology used by them: the rating isdetermined for each type of paper value separately, they are not considered in the complex; Ratingagencies are paid not by investors, but the issuers (ie, agency results are biased). Activities,establishing methods raitingurilor securities of these agents are much criticized (Benmelech, 2008).Lack of impartiality of the rating agencies allowed undeserved marketing of securities at inflatedprices.
Six.Deregulation of the banking, finance. Many of the securities issued debt security centers have beenpurchased by companies Special Purpose Vehicles, Structured Investments Vehicles, lacking capitaland term bonds were financed by low pay. These institutions were created by national banks inindustrialized countries and geographically located in Ireland, the Kayman Islands, where the tax isreduced. Through these institutions, banking systems, financial monitoring avoided by thoseauthorities.Through such a system banks got "freedom" in relations with customers, system, muchdivided, became uncontrollably (Mizen, 2008, p. 561; Blackburn, 2008, p.68-84).In our view,economist Zeidek failed to list all the factors that triggered the financial crisis of 2008-2010, and thefactors listed do not have a mechanism, algorithm initiation, growth and financial bubbles plesnirii,did not leave room for other factors, can the "shadow", which become "producers" of financialbubbles. To clarify the contribution of individual, group or all the factors producing financial bubblesin the initiation, conduct baking and financial crisis, to establish the conditions necessary forgenerating the crisis. To follow the evolution of economic indicators: some produce goods, services(called final products), others provide money needed to balance the economic cycle.
The financial crisis occurs when the market currently, liquidity needs are considerably below. Increating such a situation can not be "blamed" the productive. Here, the approximate, based on input-output models, in all industrialized countries, some developing countries (China, India, Brazil,Mexico, etc.), balance between the volume of final products and liquidity needs is provided. Why are

Journal of International Scientific Publication: Economy & Business, Volume 6, Part 4
ISSN 1313-2555, Published at: http://www.scientific-publications.net
259 Published by Info Invest, Bulgaria, www.sciencebg.net
cash poor at a time? In our opinion, the claim based solely on excessive increase in prices, isinsufficient to financial crises, if not explain such increases, it examines the activities of agents thatcontribute to higher prices. Economic activities carried on debt creates imbalances: goods, services arecreated, their financial coverage is issued at a time, is over a certain period. So, debt finance createsmicrodeficits. Liabilities may be the most diverse construction of a building, purchase of comfortitems related to the purchase of shares, etc. Each economic sector is accompanied by creditors anddebtors. Finance, which covers products already created over time, are currently missing in theeconomy. Debt "extract" of business in finance. "Withdrawals" (debts) are the most diverse financialand in early stages, is some financial bubbles without negative impact on the balance (balance) ofgoods, services and finance. Rising prices caused by a number of exogenous factors, endogenousfactors contribute to the liquidity gap. But price increases have immediate negative impact on thebalance of goods, services and financial coverage. Debt and concomitant increase in prices is anotherfactor with negative impact on the balance above named. Prices rise, debts increase, grow together,both contributes to financial bubbles, liquidity "withdrawn" in economic, financial bubbles feeds.Neither prices nor the number individuals, business entities that develop economic activities on debtcan not be adjusted by someone (e.g. the government), the emergence and growth of financial bubblescan not be adjusted. Conversely, financial bubbles can be initiated without much effort and can betaken to "swell". For example, the emergence of technologies can be successfully mediated, marketshares can be issued which can be made at prices that far exceed the face value, but is below the realeffectiveness of these technologies. Excess demand allows "stealing" of business in finance, reducepurchasing power for other products, creates prerequisites for market liquidity deficit. Market liquiditydeficit in country X can be created: money remittances to the country of origin of employees, activitiesin the informal economy, avoiding taxes by enterprises, income from trade in drugs, weapons, exportsof ideologies, political: military activities ; create ghost companies operating them; support excessiveinterested actions to increase the stock price, unproductive activities (gambling, etc.) super richpossibilities of subjects to withdraw in economic quantities of liquidity, lack of mechanisms formanaging the evolution of financial bubbles, no statistical evidence of the emergence and developmentof financial bubbles, diverse geography of financial bubbles.
3. CONCLUSIONS
World economy, of one or more countries, is always accompanied by economic and financial crisis,but being of different sizes have different impacts. The attention of society come only crises thatexceed certain dimensions. Crises are the shadow economy. In economic history came during thecrises of 1857, 1873, 1929-1933, 2008-2010. Factors that generate financial crises, economic relationsare different: technological progress, excessive increase in prices, debt, finance the productiveavoidance of wasteful activity, speculation in shares, start businesses, phantom shares, overproduction.Finance, out of natural economic cycle, is "financial bubble" that, over time, grow to critical size whengenerating financial crisis. The economic crisis in the years 1929-1933 was imminent, Fisher's articlein the newspaper "New York Times" just reduced the period of occurrence of crisis.
A considerable impact on the ongoing process of crisis it is the "flock". An economic misinformation,highly publicized, may generate a financial crisis (e.g., an error occurred processing system or astatement of statistical indicators of a failed state leader, for example in U.S. or Germany). Thefinancial crisis may be caused by unnecessarily large number of businesses, corporations, excessiveprices. Financial bubbles are initiated and technological and scientific innovations, technologies,actions that cause great confidence in potential buyers of shares.

Journal of International Scientific Publication: Economy & Business, Volume 6, Part 4
ISSN 1313-2555, Published at: http://www.scientific-publications.net
260 Published by Info Invest, Bulgaria, www.sciencebg.net
Consequently, the shares can be sold at unreasonably high prices, are initiated distractions in economicand finance, respectively, financial bubbles. Financial crises, in principle, can be predicted, but notavoided. The crisis in the years 2007-2010 was predicted by R. Shiller. On this basis, the Germaneconomist Zeidl vision, were placed 12 factors. Is an incomplete statement.
Number of factors contributed to the unfolding crisis is infinitely large, including a quantity of cashwithdrawal by the subjects to become mega rich and wealthy, to make "respect" commodity-exportingcountries, social policies in some states banking facilities granted to credit, thus demand, for example,the mortgage increases, then prices rise housing areas, fueling financial bubbles, fiscal reforms, suchreforms in 1986 in the U.S., create favors for loans, help increase debt buyers, again creating financialbubbles, reducing percentage fees on mortgages, securing debt by issuing securities, disinformationpotential buyers of shares by analytical agencies prestigious rankings suspicious of businessesestablished by the Rating agencies; loss the authorities to the possibilities of monitoring bankingactivities, lack of statistical evidence of the initiation and development of financial bubbles, lack offull analysis of profit debt countries overall world economy.
REFERENCES
Barth J.R. (2008) U.S. Subprime Mortgage Market Meltdown. Paper presented at the 14th DubrovnikEconomic Conference of the Croatian National Bank, June 25-28, Dubrovnik, Croatia.
Benmelech E., Dlugosz J. (2008) The Alchemy of CDO Credit Ratings: Working Paper. HarvardBusiness Shool.
Blackburn R. (2008) The Subprime Crisis II New Left Review 50, p. 63-106.
Blanchard O. (2009) The Crisis: Basic Mechanisms and Appropriate policies II CESifo Forum, p.3-14.
Bridgewell D.A. (1938) The Federal Home Loan Bank Board and its Agencies: A History of the FactsSurrounding the Passage of the Creating Legislation, The Establishment and Organization of theFederal Home Loan Bank Board and the Bank System, The Savings and Loan System, The HomeOwners' Loan Corporation, and the Federal Savings and Loan Insurance Corporation. Washington DC:Federal Home Loan Bank Board.
EEAG (European Economic Advisory Group). (2009) The EEAG Report on the European Economy2009, Munich: EEAG and CESifo.
Felton A., Reinhart C. (eds.) (2008) The First Global Financial Crisis of the 21st Century. London: AVoxEU.org publication, Centre for Economic Policy Research.
Fisher I. (2006) The Debt-deflation Theory of Great Depressions II, Econometrica. 1933, p.337-357.
Garriga C., Gavin W.T., Schlagenhauf, D. Recent Trends in Homeownership II Federal Reserve Bankof St. Louis Review, p.397-411.
Kindleberger C.P. (1996) Manias, Panics, and Crashes: A History of Financial Crises. N.Y.: BasicBooks.
Kindleberger C.P., Lafargue, J.P. (eds.) (1982) Financial Crises, Theory, History, and Policy.Cambridge: Cambridge University Press.
Leonhardt D. (2008) Be Warned: Mr. Bubble's Worried Again II, New York Times. August 21, 2005.
McDonald D.J., Thornton D.L. A Primer on the Mortgage Market and Mortgage Finance II, Federal
Journal of International Scientific Publication: Economy & Business, Volume 6, Part 4
ISSN 1313-2555, Published at: http://www.scientific-publications.net
261 Published by Info Invest, Bulgaria, www.sciencebg.net
Reserve Bank of St. Louis Review, p.31-45.
McGrattan E.R., Prescott E.C. (2003) The 1929 Stock Market: Irving Fisher Was Right. ResearchDepartment Staff Report 294 (revised), Federal Reserve Bank of Minneapolis.
Minsky H.P. (1982) Can it Happen Again? Essays in Instability and Finance, Armonk. NY: M.E.Sharpe.
Minsky H.P. (1986) Stabilizing an Unstable Economy. New Haven CT: Yale University Press.
Pinner F. (1937) Die gro en Weltkrisen im Lichte des Strukturwandels der kapitalistischen Wirtschaft.Zurich, Leipzig: Max Niehans.
Reinhart C., Rogoff K. (2009) This Time is Different, Princeton: Princeton University Press.
Shiller R.J. (2005) Irrational Exuberance. Princeton NJ: Princeton University Press, 2000; secondedition.
Wheelock D.G. (2008) The Federal Response to Home Mortgage Distress: Lessons from the GreatDepression // Federal Reserve Bank of St. Louis Review, p.133-148.
Wheelock D.C. (2008) Changing the Rules: State Mortgage Foreclosure Moratoria During the GreatDepression II, Federal Reserve Bank of St. Louis Review, p.569-583.
Mizen P. (2008) The Credit Crunch of 2007-2008: A Discussion of the Background, MarketReactions, and Policy Responses // Federal Reserve Bank of St. Louis Review, p.531-567.
K. (2010) , nr. 1, 2010, p.122-133.
Journal of International Scientific Publication: Economy & Business, Volume 6, Part 4
ISSN 1313-2555, Published at: http://www.scientific-publications.net
262 Published by Info Invest, Bulgaria, www.sciencebg.net
THE USE OF DYNAMIC ANALYSIS INDEX OF INVESTMENT PROJECTS ECONOMIC
EFFICIENCY: NET UPDATED VALUEMarian Andrei Gurau
Faculty of Engineering and Technological Systems Management,
University “Polytechnics” of Bucharest, Romania
Abstract
In this article is presented the dynamic analysis index of projects economic evaluation, the net updatedvalue (VAN), the method of calculation, as well as the advantages and disadvantages of using itthrough a case study. The net updated value is a significant index in assessing the economic andfinancial performance of a project or a company both internally and in the diagnostic tests requestedby external partners.
Through its signification, it determines the economic value of an investment project and plans toincrease this value by optimizing the investment decision after maximization criterion of VAN.
Key words: dynamic analysis, net updated value, economic evaluation, optimization
1. INTRODUCTION
Investment represents the commitment of resources in the hope of benefit achievements over a longperiod of time in the future, or action to spend money or other resources in the hope that in the futureyou will get other benefits.
All studies of investment analysis of projects in engineering and all economic decisions, associatethese studies must hold account of the additional value arising as a result of the acceptance of aparticular project, as compared with the initial situation. The fundamental question that must answerthe analyst is if the costs of accepting investments plus the costs of maintenance and its application arelower than income or savings associated with it (Doicin, 2009, pp.97).
The economic and financial evaluation of industrial investment projects in developed countries withmarket economy is based on the combined use of traditional and modern, rational methods,characterized by the scientific and reliability, tested and validated by long practice (Andreica, 2003,pp.1).
To take a financial investment decision, we must have a motivation based on knowledge of futureefficiency of the financed objective. Usually, the economic efficiency indicators that play investmentshave given effort designed and expected future financial effects. Because the initial investment costsvalues, income and expenditure, and the residual value of the cash-flow-time available varies from oneproject to another, there isn’t a unique method for determining efficiency of investment projects,which can be applied in any situation (Nistorescu, 2008, pp. 40-52).
Combined use of traditional methods and modern is specific to evaluate investment projects of smalland medium scale. For large scale evaluation of projects it’s used only the dynamic analyze based onmodern and rational methods. The most important thing is that the methods and methodologies used to

Journal of International Scientific Publication: Economy & Business, Volume 6, Part 4
ISSN 1313-2555, Published at: http://www.scientific-publications.net
263 Published by Info Invest, Bulgaria, www.sciencebg.net
ensure a realistic, relevant analysis of investment projects from the financial efficiency point view; tomeet specific objectives and interests of companies who realize the project investments, fromfinancing institutions exigencies country and abroad, in order to grant credits for attracting capitalavailable from developed countries (Andreica, 2003, pp.3-10).
Divesting refers to the decision of cancellation before the investment term of a process, with the aimof optimization of dynamic portfolio investment as a result of the emergence of opportunities which, atthe time of the initial decision, no one knew. Although divesting has defensive connotations, it is,however, an important element of dynamic optimization of corporate value.
Evaluation and justification of the divesting decision is similar to the procedure for investmentdecision but with reversed logic meaning: for example, how much would lose if it would continueinvesting just in case it would be cut off and would achieve another investment with a higher VAN,etc. Economic and financial criteria of divesting is representing maximizing the difference betweenrecoverable updated value and the updated value of marginal future incomes lost as a result of thedivesting decision. In fact, divesting is part of the general policy, medium-term and long-termperformance of any company.
2. A COUPLE OF SLOTS CLASSIFICATION OF INVESTMENTS
The investments can be classified according to several criteria, so:
1. After the relation of the projected objective, we have (Cazaubon, 1997, pp.20-28):
Direct investments are those that are made for the basic objective (acquisition of equipment,fitting them, etc.);
Related investments are those completed in other economic objectives, in order to ensure thenecessary raw materials for the production process of the future objective (land consolidations,etc.);
Collateral investments which ensure the utilities of basic objective (water pipelines, gas,compressed air, telephone networks, etc.);
2. After their technological structure, we have:
Construction-assembly works, consisting of construction works and installations of technologyequipment mounting on the construction sites;
Acquisitions of machinery that require mounting, fixing foundations, on pillars or placements;
Acquisitions of machinery which does not require installation, means of transport, tractors, etc.;
Geological works for the discovery of new reserves of useful mineral substances;
Other investment expenditures, which refers to the plant-growing trees, buying and breeding, etc.
3. After their purpose and nature of the results, we have (Hoffman, 2008, pp.66):
Materials - (buildings, machines, equipment) whose nature changed substantially nowadays,rapid growth in the volume of expenditure with informatics and automated production equipment,mechanical construction and buildings over;

Journal of International Scientific Publication: Economy & Business, Volume 6, Part 4
ISSN 1313-2555, Published at: http://www.scientific-publications.net
264 Published by Info Invest, Bulgaria, www.sciencebg.net
Nonmaterial - those efforts intended to prepare future (expenditure on computer science logic,commercial development, training of labor, research development).
4. After the character works, we have:
The constructions of new units are those which are for things that have not previously existed,based on their building all elements which lead to getting the objective;
Reconstruction of the existing objectives, which have suffered as a result of natural disasters,fires, etc.;
For development – consist in expenses that are made in order to increase production capacity;
For the modernization of existing units - consisting in the introduction of new machinery in placeof those that are worn out physically and morally.
For redevelopment – to the existing objectives for determining the best conditions of workactivity;
5. After how the investment affects the enterprises economy, profitability and efficiency of economicagents, we have:
With direct effects, reflected in the enterprise management (construction of new units, extendingthe existing capabilities and introduction of technical progress, including investments forrefurbishment.
With indirect effects on the economic situation of enterprise which invest (objectives forenvironmental pollution prevention, social and cultural objectives, strategic investments inperspective with useful effects).
6. After the source of financing, investments are dealt in investment financed from:
Own sources, are constituted by the owner's capital;
Attracted sources (foreign investments, etc.).
In Figure 1 is represented the diagram of design and implementation of a new investment project.

Journal of International Scientific Publication: Economy & Business, Volume 6, Part 4
ISSN 1313-2555, Published at: http://www.scientific-publications.net
265 Published by Info Invest, Bulgaria, www.sciencebg.net
Figure 1: Implement of a new investment project
3. METHOD OF NET UPDATED VALUE
There are groups who want to express the net economic value in the percentage form, so in the form ofa rate of profitability. Others prefer to express it, divided on the entire planned period, so they use theannual amount method. All these different ways of presenting of the same realities, shall be adoptedaccording to the managers faith as one or the other presents the company in a more favorable light.
The method of VAN (net updated value) is based on the idea of determining the equivalent value ofthe available cash-flows developed by an investment project, usually at the start of the project.Because the calculations are even forecasting at that time, the calculated index was named “valueupdated”. The facts that are taken into account the entries, positive values (cash inflow) and outs(negative values) (cash-outflow), was added the term “net” (Doicin, 2009, pp.99-111).
So, VAN represents the updated value of net benefits at the time of project starting of which weredecreased the costs of obtaining them. The update will require converting all cash-flow values, whichappear in the later moments, by multiplication (division) with (at) factors, determined on the basis ofan update rates, previously determined rates (Jovanovic, 1999, 221).
PLANIFICATION TECHNIQUECONCEPTION
ORGANIZATION
Development of thestudy of forecast, andperforms the plan.
Ensuring thecooperation relationswith other units.
Design and use of newand upgraded products.
Design and use of newand modernizedtechnologies.
Development andapplication oforganizational studies.
Development of anew work plan.
Record productioncapacities, and increasethem.
Design andmanufacture of newproduction equipment.
Design andimplementation of theprogramme of growthwork productivity.
INVESTMENTS
Development ofinvestment, financingand crediting plan.
Establishment ofeconomic and technicalindicators forinvestment objectives..
Tracking ofinvestments.

Journal of International Scientific Publication: Economy & Business, Volume 6, Part 4
ISSN 1313-2555, Published at: http://www.scientific-publications.net
266 Published by Info Invest, Bulgaria, www.sciencebg.net
In other words, the net updated value of an engineering investment project is a measure of capitalexcess (net profit), resulted at the life cycle end of an investment project (including the residualamount, VR). To calculate the VAN, as a function of the discount rate, k, should be updated all thefuture cash-flows (both those of the inflow and outflow type), at the initial time of the investmentproject, according to the relationship:
n
t
tt kCFVAN
0,)1( where (1)
VAN – net present value;
Io – initial investment [ monetary units];
CF – available cash flow;
n – lifespan of the project investment [years];
t - the index of the period of time considered as increment for life duration;
k - minimum acceptable rate of profitability [%];
VRn - residual value at the end of the project life [monetary units];
In connection with industrial investment projects is used the notion of value updated, 0V whoserelation is (Doicin, 2009, pp.100): 00 IVANV , or explain VAN, results:
;)1)1(
%)(1
0 nt
n
t kVRn
kCFDtkV (2)
Under the terms of which the enterprise owns an investment projects portfolio, to determine thecorresponding value VAN of a given project (be it i), it will use the relation:
.)1(
,)1(,%)( ,0
1int
n
ti I
knVRi
ktCFDikVAN (3)
If it’s analyzed the decision that only one project will be realized, it will be achieved if VAN > 0, andif are compared several mutually exclusive projects, then it will choose that for which VAN will bemaximal (and positive, obviously). Thus, we can reach the situation in which, given the severalprojects, we can’t choose anyone because all the VAN calculated values are negative.
Basically, VAN < 0 indicates that cash flow resulting from future exploitation of the project doesn’trealize replenishment of the funds assigned to the initial and in consequence, the project should berejected. All projects that will take VAN > 0, are preferable for monetary investments (in the form ofbank deposits, for example) at a bearing interest rate equal to or less than the discount rate, k.

Journal of International Scientific Publication: Economy & Business, Volume 6, Part 4
ISSN 1313-2555, Published at: http://www.scientific-publications.net
267 Published by Info Invest, Bulgaria, www.sciencebg.net
Figure 2: Representation of the net updated income
In Figure 2 is represented the variation of net updated income, and the selection mode of projectsbased on this indicator.
Although the net updated value method is the most popular method of evaluation of investmentprojects efficiency, it presents some disadvantages (Nistorescu, 2008):
Are not taken into account possible future changes of profitability rates, required by investorsdepending on the market interest rates;
Are not taken into account the budgetary constraints;
Are not taken into account the interrelationships between different investment projects;
At least one indication is required before proceeding with the case study presentation: as long as thecentral place is occupied by the available cash-flows, based on net profit, so after decreased of the taxprofit, all other components (residual value) must be determined in a similar logic, so as the net values.Alternatively, we can work with the values of gross profit (EBT) instead of available cash-flow, inwhich case the other components will be also calculated as gross amounts, before deduction of tax.
In the vast majority of cases, the index value of VAN is a net one, the investor wishing to evaluate theeffects of investment project in the form of net benefits and, therefore, we will assign priority in thecalculation of the net values.
k,%
VAN (k6)
0
VAN (k3)
VAN (k2)
VAN (k1)
+
-
k1 k2 k3 k4 k5 k6 k7
VAN (k)>0 the projects are accepted
VAN (k) <0 the projects are rejected
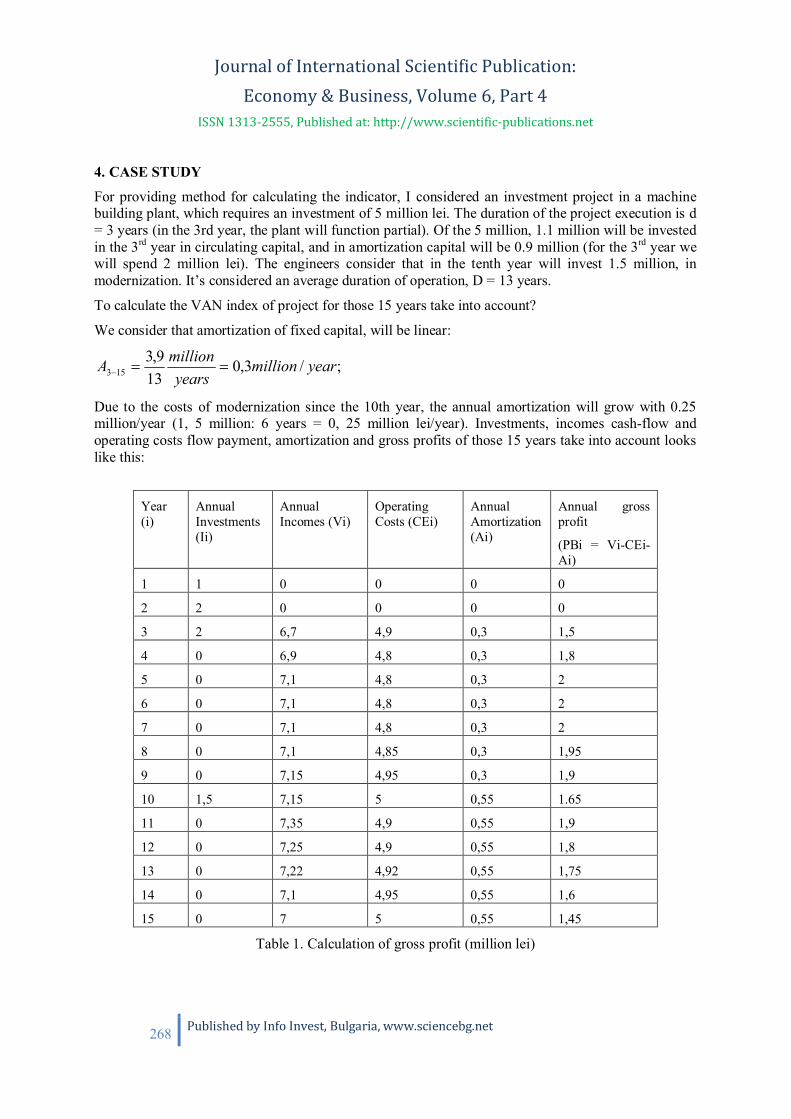
Journal of International Scientific Publication: Economy & Business, Volume 6, Part 4
ISSN 1313-2555, Published at: http://www.scientific-publications.net
268 Published by Info Invest, Bulgaria, www.sciencebg.net
4. CASE STUDY
For providing method for calculating the indicator, I considered an investment project in a machinebuilding plant, which requires an investment of 5 million lei. The duration of the project execution is d= 3 years (in the 3rd year, the plant will function partial). Of the 5 million, 1.1 million will be investedin the 3rd year in circulating capital, and in amortization capital will be 0.9 million (for the 3rd year wewill spend 2 million lei). The engineers consider that in the tenth year will invest 1.5 million, inmodernization. It’s considered an average duration of operation, D = 13 years.
To calculate the VAN index of project for those 15 years take into account?
We consider that amortization of fixed capital, will be linear:
;/3,013
9,3153 yearmillion
yearsmillionA
Due to the costs of modernization since the 10th year, the annual amortization will grow with 0.25million/year (1, 5 million: 6 years = 0, 25 million lei/year). Investments, incomes cash-flow andoperating costs flow payment, amortization and gross profits of those 15 years take into account lookslike this:
Year(i)
AnnualInvestments(Ii)
AnnualIncomes (Vi)
OperatingCosts (CEi)
AnnualAmortization(Ai)
Annual grossprofit
(PBi = Vi-CEi-Ai)
1 1 0 0 0 0
2 2 0 0 0 0
3 2 6,7 4,9 0,3 1,5
4 0 6,9 4,8 0,3 1,8
5 0 7,1 4,8 0,3 2
6 0 7,1 4,8 0,3 2
7 0 7,1 4,8 0,3 2
8 0 7,1 4,85 0,3 1,95
9 0 7,15 4,95 0,3 1,9
10 1,5 7,15 5 0,55 1.65
11 0 7,35 4,9 0,55 1,9
12 0 7,25 4,9 0,55 1,8
13 0 7,22 4,92 0,55 1,75
14 0 7,1 4,95 0,55 1,6
15 0 7 5 0,55 1,45
Table 1. Calculation of gross profit (million lei)
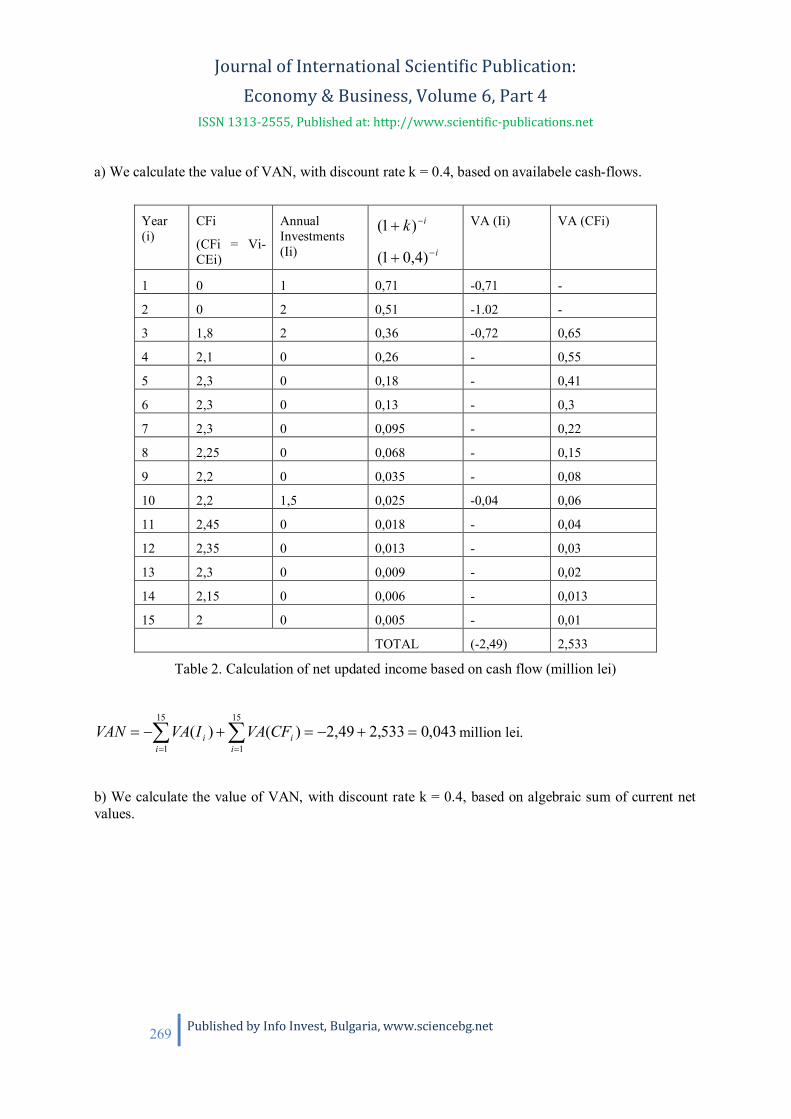
Journal of International Scientific Publication: Economy & Business, Volume 6, Part 4
ISSN 1313-2555, Published at: http://www.scientific-publications.net
269 Published by Info Invest, Bulgaria, www.sciencebg.net
a) We calculate the value of VAN, with discount rate k = 0.4, based on availabele cash-flows.
Year(i)
CFi
(CFi = Vi-CEi)
AnnualInvestments(Ii)
ik)1(i)4,01(
VA (Ii) VA (CFi)
1 0 1 0,71 -0,71 -
2 0 2 0,51 -1.02 -
3 1,8 2 0,36 -0,72 0,65
4 2,1 0 0,26 - 0,55
5 2,3 0 0,18 - 0,41
6 2,3 0 0,13 - 0,3
7 2,3 0 0,095 - 0,22
8 2,25 0 0,068 - 0,15
9 2,2 0 0,035 - 0,08
10 2,2 1,5 0,025 -0,04 0,06
11 2,45 0 0,018 - 0,04
12 2,35 0 0,013 - 0,03
13 2,3 0 0,009 - 0,02
14 2,15 0 0,006 - 0,013
15 2 0 0,005 - 0,01
TOTAL (-2,49) 2,533
Table 2. Calculation of net updated income based on cash flow (million lei)
15
1
15
1043,0533,249,2)()(
i iii CFVAIVAVAN million lei.
b) We calculate the value of VAN, with discount rate k = 0.4, based on algebraic sum of current netvalues.

Journal of International Scientific Publication: Economy & Business, Volume 6, Part 4
ISSN 1313-2555, Published at: http://www.scientific-publications.net
270 Published by Info Invest, Bulgaria, www.sciencebg.net
Anul(i) Vi Ki=Ii+CEi VNi=Vi-Ki
ik)1(i)4,01(
VA (VNi)
1 0 1 (-1) 0,71 (-0,71)
2 0 2 (-2) 0,51 (-1,02)
3 6,7 6,9 (-0,2) 0,36 (-0,07)
4 6,9 4,8 2,1 0,26 0,55
5 7,1 4,8 2,3 0,18 0,41
6 7,1 4,8 2,3 0,13 0,3
7 7,1 4,8 2,3 0,095 0,22
8 7,1 4,85 2,25 0,068 0,15
9 7,15 4,95 2,2 0,035 0,08
10 7,15 6,5 0,65 0,025 0,02
11 7,35 4,9 2,45 0,018 0,04
12 7,25 4,9 2,35 0,013 0,03
13 7,22 4,92 2,3 0,009 0,02
14 7,1 4,95 2,15 0,006 0,013
15 7 5 2 0,005 0,01
TOTAL 0,043
Table 3. Calculation of net updated income based on algebraic sum of current net values
15
1043,0)(
iiVNVAVAN million lei;
Note that in both of these ways of calculation (a, b) of the project's net updated value we get the samevalue and positive, so the project can be achieved.
4. CONCLUSIONS
Investment projects have a great importance for the development of industrial enterprises. Because itprepares the capabilities and future production conditions, these projects influencing long-termcompetitiveness of enterprises and in consequence the results and fiscal balance. Because investmentsconsume considerable long-term financial resources, these projects present a special risk, their launchhas most often an irreversible character.
The discount rate (k) used in VAN calculations accomplishes test criterion profitability of aninvestment project, acceptance or rejection of it. Indicator taken into account the execution time of

Journal of International Scientific Publication: Economy & Business, Volume 6, Part 4
ISSN 1313-2555, Published at: http://www.scientific-publications.net
271 Published by Info Invest, Bulgaria, www.sciencebg.net
investments (d), the useful lifespan of the projects (D), unequivalent financial flows dispersed in time,and all relevant financial information: the project's operating costs, revenues, cash flow, investments.
If the indicator is calculated based on the balance of the annual revenue and annual costs of investmentand operating costs, expressed in equivalent value, comparable, enable a full analysis on the horizontime (d + D), taking into account the dynamic parameters and their flow.
This article can be useful for economists, directors, managers of enterprises who want to achieve anoptimum choice for spending the funds investment, using the presented method.
ACKNOWLEDGEMENTSThis work is supported by the Sectorial Operational Program for Human Resources Development(SOP HRD), financed from the European Social Fund and by the Romanian Government under thecontract number POSDRU/1071.5/S/76909.
REFERENCES
Andreica M. and Parvu D. (2003) Efficiency and financing of investments, Cibernetica MC PublishingHouse, Bucharest.
Cazaubon C. (1997) Management de project technique, Ellipses Publishing House, Paris.
Doicin C. (2009) Analysis of engineering investment projects, Bren Publishing House, 2009.
Hoffman R.G. (2008) Economic scenarios for project evaluation, Journal of Bussines Strategy, Vol. 5,No. 4.
Jovanovic P. (1999) Application of sensitivity analysis in investment project evaluation underuncertainty and risk, International Journal of Project Management, Vol. 17, No. 4, August 1999.
Nistorescu T. and Constantinescu D. (2008) Project management, fundamentals, methods andtechniques, Sitech Publishing House.
Stancu I. (2007) Finance, Economic Publishing House, Bucharest.
Journal of International Scientific Publication: Economy & Business, Volume 6, Part 4
ISSN 1313-2555, Published at: http://www.scientific-publications.net
272 Published by Info Invest, Bulgaria, www.sciencebg.net
CYCLES ECONOMY BY THE EXAMPLE OF BALTIC STATES, GERMANY,
SWEDEN AND FINLANDToivo Tanning, Lembo Tanning, Maksim Saat
Tallinn University of Technology. School of Economics and Business Administration
Akadeemia tee 3, 12618 Tallinn, Estonia
e-mail: [email protected]; [email protected]; [email protected]
AbstractWith regard to the economic and the euro crisis has become actual problems of development of cycliceconomy. This applies not only to the gross domestic product (GDP), but also other economic indicatorssuch as changes in the labour market. Here are its major partner countries Estonia and thecorresponding analysis.
The article is a historical overview of economic cycles, the theoretical basis and the last 40 years in thereal world, the European Union (EU), Germany, Sweden, Finland and the Baltic countries' economicdevelopment, which confirms the cyclical trends in the economy today. Changes from region to region isdifferent, but they also have characteristics in common. Theoretical generalizations are also given forthe dynamics of mathematical models of economic development, trend lines. Regularities of change arecomplex, but it would be useful to know as well as politicians, business leaders and gather supplies forthe bad times.
Key words: economic cycle, economic growth, gross domestic product, European Union, Estonia.
INTRODUCTION
The theoretical basis for the current article stems from the statements of recognized scholars in the fieldof economics, the analysis of economic cycle and economic growth conducted by internationalorganizations, recently published academic works dealing with economies in Europe countries and theviews expressed in the authors´ (Tanning, 2010) recent publications.
Economics is the social science that analyzes the production, distribution, and consumption of goods andservices. (Wirtschaftswissenschaft) Political economy was the earlier name for the subject, buteconomists in the latter 19th century suggested 'economics' as a shorter term for 'economic science' thatalso avoided a narrow political-interest connotation and as similar in form to 'mathematics', 'ethics', andso forth. (Marshall, 1920)
A focus of the subject is how economic agents behave or interact and how economies work.Consistent with this, a primary textbook distinction is between microeconomics and macroeconomics.Microeconomics examines the behaviour of basic elements in the economy, including individualagents (such as households and firms or as buyers and sellers) and markets, and their interactions.Macroeconomics analyzes the entire economy and issues affecting it, including unemployment,inflation, economic growth, and monetary and fiscal policy. Other broad distinctions include thosebetween positive economics and normative economics; between economic theory and applied
Journal of International Scientific Publication: Economy & Business, Volume 6, Part 4
ISSN 1313-2555, Published at: http://www.scientific-publications.net
273 Published by Info Invest, Bulgaria, www.sciencebg.net
economics; between rational and behavioural economics; and between mainstream economics andheterodox economics. (Economics)
1. ECONOMIC GROWTH
Economic growth is the increase of per capita GDP or other measures of aggregate income, typicallyreported as the annual rate of change in real GDP. Economic growth is primarily driven byimprovements in productivity, which involves producing more goods and services with the sameinputs of labour, capital, energy and materials. Economists draw a distinction between short-termeconomic stabilization and long-term economic growth. The topic of economic growth is primarilyconcerned with the long run. The short-run variation of economic growth is termed the business cycle.GDP is a measure of the economic activity, defined as the value of all goods and services producedless the value of any goods or services used in their creation. The calculation of the annual growth rateof GDP volume is intended to allow comparisons of the dynamics of economic development both overtime and between economies of different sizes. For measuring the growth rate of GDP in terms ofvolumes, the GDP at current prices are valued in the prices of the previous year and the thus computedvolume changes are imposed on the level of a reference year; this is called a chain-linked series.Accordingly, price movements will not inflate the growth rate. (Real GDP)
The long-run path of economic growth is one of the central questions of economics; despite someproblems of measurement, an increase in GDP of a country greater than population growth is generallytaken as an increase in the standard of living of its inhabitants. Over long periods of time, even smallrates of annual growth can have large effects through compounding.
In order to compare per capita income among countries, the statistics may be quoted in a singlecurrency, based on either prevailing exchange rates or purchasing power parity (PPP). In economics,PPP asks how much money would be needed to purchase the same goods and services in twocountries, and uses that to calculate an implicit foreign exchange rate. To compensate for changes inthe value of money (inflation or deflation) the GDP or GNP is usually given in "real" or inflationadjusted, terms rather than the actual money figure compiled in a given year, which is called thenominal or current figure. (Purchasing)
2. ECONOMIC CYCLE
The term economic cycle or business cycle (German - Konjunktur; French - Cycle économique;Russian - ; Estonian - majandustsükkel) refers to economy-wide fluctuations inproduction or economic activity over several months or years. These fluctuations occur around a long-term growth trend, and typically involve shifts over time between periods of relatively rapid economicgrowth, and periods of relative stagnation or decline. (O'Sullivan, 2003) These fluctuations are oftenmeasured using the growth rate of real GDP. Despite being termed cycles, most of these fluctuationsin economic activity do not follow a mechanical or predictable periodic pattern.
2. 1 History economic cycle (crises) theory
The first systematic exposition of periodic economic crises, in opposition to the existing theory ofeconomic equilibrium, was the 1819 Nouveaux Principes d'économie politique by Jean Charles

Journal of International Scientific Publication: Economy & Business, Volume 6, Part 4
ISSN 1313-2555, Published at: http://www.scientific-publications.net
274 Published by Info Invest, Bulgaria, www.sciencebg.net
Léonard de Sismondi *. (Sismondi, 1911; Over Production, 2008) Prior to that point classicaleconomics had either denied the existence of business cycles, blamed them on external factors, notablywar, or only studied the long term. Sismondi found vindication in the Panic of 1825, which was thefirst unarguably internal economic crisis, occurring in peacetime. Sismondi and his contemporaryRobert Owen, who expressed similar but less systematic thoughts in 1817 Report to the Committee ofthe Association for the Relief of the Manufacturing Poor, both identified the cause of economic cyclesas overproduction and under consumption , caused in particular by wealth inequality. They advocatedgovernment intervention and socialism, respectively, as the solution. This work did not generateinterest among classical economists, though under consumption theory developed as a heterodoxbranch in economics until being systematized in Keynesian economics in the 1930s.
Sismondi's theory of periodic crises was developed into a theory of alternating cycles by CharlesDunoyer** and similar theories, showing signs of influence by Sismondi, were developed by JohannKarl Rodbertus***.(Rodbertus, 1905) Periodic crises in capitalism formed the basis of the theory ofKarl Marx ****, who further claimed that these crises were increasing in severity and predictedcommunist revolution; he devoted hundreds of pages of Das Kapital (Capital: Critique of PoliticalEconomy) to crises. There is a critical analysis of capitalism as political economy, meant to reveal theeconomic laws of the capitalist mode of production, and how it was the precursor of the socialist modeof production (Marx, 1867).
Clement Juglar * **** identified in 1860 the presence of economic cycles. He was one of the first todevelop an economic theory of business cycles. (Juglar, 1862) He identified the 7-11 year fixedinvestment cycle that is now associated with his name. Within the Juglar cycle one can observeoscillations of investments into fixed capital and not just changes in the level of employment of thefixed capital (and respective changes in inventories), as is observed with respect to Kitchin cycles. Therecent research employing spectral analysis has confirmed the presence of Juglar cycles in the worldGDP dynamics up to the present time. (Korotayev, 2010)
Austrian economist Joseph Schumpeter****** argued later, that a Juglar cycle has four stages:
expansion (increase in production and prices, low interests rates);
crisis (stock exchanges crash and multiple bankruptcies of firms occur);
* Jean Charles Léonard de Sismondi (1773 –1842), whose real name was Simonde, was a Switzerlandeconomist. He is best known for his works on French and Italian history, and his economic ideas.** Barthélemy-Charles-Pierre-Joseph Dunoyer de Segonzac (1786 - 1862) was a French liberal economist.*** Johann Karl Rodbertus (1805 –1875), also known as Karl Rodbertus-Jagetzow, was a German economistand socialist of the scientific or conservative school from Greifswald. He defended the labor theory of value aswell as the view, as an inference from that, that interest or profit is theft. He believed that capitalist economiestend toward overproduction.**** Karl Heinrich Marx (1818 –1883) was a Prussian philosopher, economist, sociologist, and revolutionarysocialist. His ideas played a significant role in the development of social science and the socialist politicalmovement.* **** Clément Juglar (1819 –1905) was a French doctor, economist and statistician.****** Joseph Alois Schumpeter (1883 –1950) was an Austrian-American economist and political scientist. Hepopularized the term "creative destruction" in economics.

Journal of International Scientific Publication: Economy & Business, Volume 6, Part 4
ISSN 1313-2555, Published at: http://www.scientific-publications.net
275 Published by Info Invest, Bulgaria, www.sciencebg.net
recession (drops in prices and in output, high interests rates);
recovery (stocks recover because of the fall in prices and incomes).
In this model, recovery and prosperity are associated with increases in productivity, consumerconfidence, aggregate demand, and prices. In the mid-20th century, Schumpeter and others proposed atypology of business cycles according to their periodicity, so that a number of particular cycles werenamed after their discoverers or proposers: (Seidl, 1999; Schumpeter, 1987 and 1961)
the Kitchin inventory cycle of 3–5 years;
the Juglar fixed investment cycle of 7–11 years;
the Kuznets infrastructural investment cycle of 15–25 years;
the Kondratiev wave or long technological cycle of 45–60 years.
Interest in these different typologies of cycles has waned since the development of modernmacroeconomics, which gives little support to the idea of regular periodic cycles.
Kondratiev wave
Kondratiev waves - also called Supercycles, surges, long waves or K-waves - are described as regular,sinusoidal-like cycles in the modern capitalist world economy. Averaging fifty and ranging fromapproximately forty to sixty years in length, the cycles consist of alternating periods between highsectorial growth and periods of relatively slow growth. Unlike the short-term business cycle, the longwave of this theory is not accepted by current mainstream economics.
Nikolai Kondratiev * (Kondratjew, 1926; , 2002; , 2004; , 2009) wasthe first to bring these observations to international attention in his book “The Major EconomicCycles” (1925) alongside other works written in the same decade.
Schumpeter's relationships with the ideas of other economists were quite complex in his mostimportant contributions to economic analysis – the theory of business cycles and development.Following neither Walras nor Keynes, Schumpeter starts in “The Theory of Economic Development”(Schumpeter 1987… Schumpeter 1961…) with a treatise of circular flow which, excluding anyinnovations and innovative activities, leads to a stationary state. The stationary state is, according toSchumpeter, described by Walrasian equilibrium. The hero of his story is the entrepreneur.
The entrepreneur disturbs this equilibrium and is the prime cause of economic development, whichproceeds in cyclic fashion along several time scales. In fashioning this theory connecting innovations,cycles, and development, Schumpeter kept alive the Russian Nikolai Kondratiev's ideas on 50-yearcycles, Kondratiev waves.
Schumpeter suggested a model in which the four main cycles, Kondratiev (54 years), Kuznets (18years), Juglar (9 years) and Kitchin (about 4 years) can be added together to form a compositewaveform. Actually there was considerable professional rivalry between Schumpeter and Kuznets.The wave form suggested here did not include the Kuznets Cycle simply because
* Nikolai Dmitriyevich Kondratiev (1892 - 1938) was a Russian economist, who was a proponent of the NewEconomic Policy (NEP) in the Soviet Union. He proposed a theory that Western capitalist economies have longterm (50 to 60 years) cycles of boom followed by depression. Kondratiev was 46 at the time of his execution bythe NKVD.
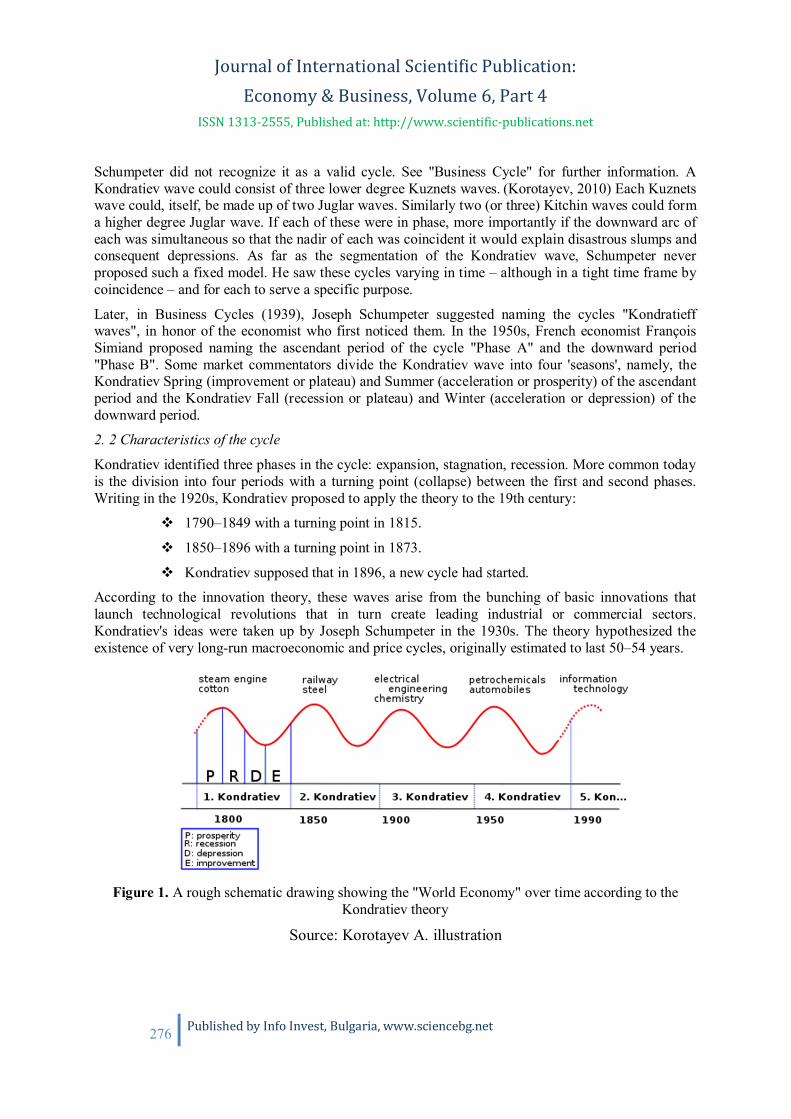
Journal of International Scientific Publication: Economy & Business, Volume 6, Part 4
ISSN 1313-2555, Published at: http://www.scientific-publications.net
276 Published by Info Invest, Bulgaria, www.sciencebg.net
Schumpeter did not recognize it as a valid cycle. See "Business Cycle" for further information. AKondratiev wave could consist of three lower degree Kuznets waves. (Korotayev, 2010) Each Kuznetswave could, itself, be made up of two Juglar waves. Similarly two (or three) Kitchin waves could forma higher degree Juglar wave. If each of these were in phase, more importantly if the downward arc ofeach was simultaneous so that the nadir of each was coincident it would explain disastrous slumps andconsequent depressions. As far as the segmentation of the Kondratiev wave, Schumpeter neverproposed such a fixed model. He saw these cycles varying in time – although in a tight time frame bycoincidence – and for each to serve a specific purpose.
Later, in Business Cycles (1939), Joseph Schumpeter suggested naming the cycles "Kondratieffwaves", in honor of the economist who first noticed them. In the 1950s, French economist FrançoisSimiand proposed naming the ascendant period of the cycle "Phase A" and the downward period"Phase B". Some market commentators divide the Kondratiev wave into four 'seasons', namely, theKondratiev Spring (improvement or plateau) and Summer (acceleration or prosperity) of the ascendantperiod and the Kondratiev Fall (recession or plateau) and Winter (acceleration or depression) of thedownward period.
2. 2 Characteristics of the cycle
Kondratiev identified three phases in the cycle: expansion, stagnation, recession. More common todayis the division into four periods with a turning point (collapse) between the first and second phases.Writing in the 1920s, Kondratiev proposed to apply the theory to the 19th century:
1790–1849 with a turning point in 1815.
1850–1896 with a turning point in 1873.
Kondratiev supposed that in 1896, a new cycle had started.
According to the innovation theory, these waves arise from the bunching of basic innovations thatlaunch technological revolutions that in turn create leading industrial or commercial sectors.Kondratiev's ideas were taken up by Joseph Schumpeter in the 1930s. The theory hypothesized theexistence of very long-run macroeconomic and price cycles, originally estimated to last 50–54 years.
Figure 1. A rough schematic drawing showing the "World Economy" over time according to theKondratiev theory
Source: Korotayev A. illustration

Journal of International Scientific Publication: Economy & Business, Volume 6, Part 4
ISSN 1313-2555, Published at: http://www.scientific-publications.net
277 Published by Info Invest, Bulgaria, www.sciencebg.net
2. 3 Real economic development since 1970
Having a base in the world, Europe and Estonia's main partner countries' economies and the dynamicsof the major trade organizations the IMF, OECD and Eurostat estimates, we will see how in the world,the European Union (EU) and its important for our national economy developed, and what the futurebrings us. This allows countries to knowledge, as well as companies and individuals to plan theiractivities in an optimal way for a right decision. However, it could make predictions unexpectedpolitical decisions, natural disasters, etc.. However, it is considered that the composition of the EU andGermany have since changed and the Baltic countries' economies will be from 1992. year. The actualdevelopment is cyclical and vary widely from region to region.
Figure 2. Total world, developed and developing economies nominal GDP USD in millions
Source: authors illustration
The authors made to the drawings in the world, the EU and the countries analyzed in the economy(GDP) for development of 40 years, the Baltic States since 1992. UNSTADi (Handbook of Statistics)based on the input.
Details are still separately developed and developing countries on economic development. As a rule,have their share in the global economy, about 1/3 and 2/3. Transition economy countries have beenneglected, because their energy is very small. Theoretical generalization of the global dynamics of amathematical model, which is a 6-degree polynomial, the coefficient of determination R2 = 0.9902 isvery high, allowing to make generalizations about the world economy.
Since 1970. was the minimum years of global economic development. Stagnation in the first half ofthe 1980s, with the 1982nd even in decline, including both country groups. Next was a period ofstagnation, ¬ 1990 in the second half, with the 1997th and 1998. years, GDP was lower than in 1996.
0
10000000
20000000
30000000
40000000
50000000
60000000
70000000World Developing economies
Developed economies Polynom (World)
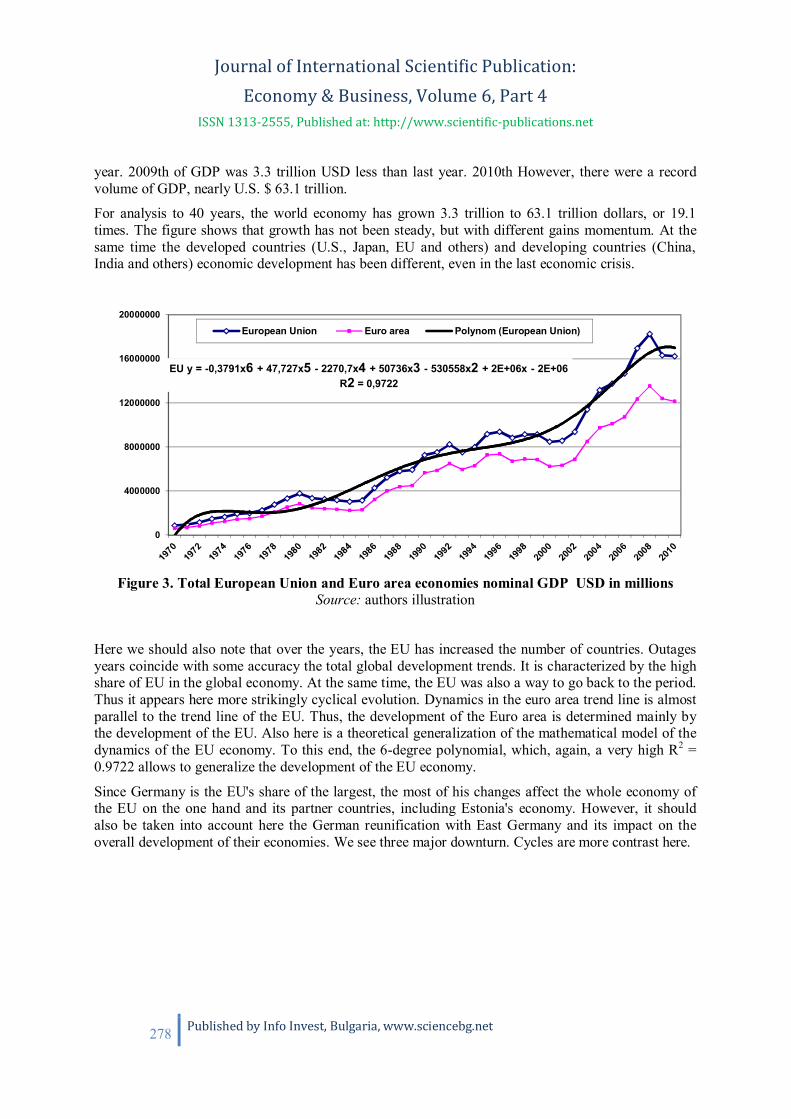
Journal of International Scientific Publication: Economy & Business, Volume 6, Part 4
ISSN 1313-2555, Published at: http://www.scientific-publications.net
278 Published by Info Invest, Bulgaria, www.sciencebg.net
year. 2009th of GDP was 3.3 trillion USD less than last year. 2010th However, there were a recordvolume of GDP, nearly U.S. $ 63.1 trillion.
For analysis to 40 years, the world economy has grown 3.3 trillion to 63.1 trillion dollars, or 19.1times. The figure shows that growth has not been steady, but with different gains momentum. At thesame time the developed countries (U.S., Japan, EU and others) and developing countries (China,India and others) economic development has been different, even in the last economic crisis.
Figure 3. Total European Union and Euro area economies nominal GDP USD in millionsSource: authors illustration
Here we should also note that over the years, the EU has increased the number of countries. Outagesyears coincide with some accuracy the total global development trends. It is characterized by the highshare of EU in the global economy. At the same time, the EU was also a way to go back to the period.Thus it appears here more strikingly cyclical evolution. Dynamics in the euro area trend line is almostparallel to the trend line of the EU. Thus, the development of the Euro area is determined mainly bythe development of the EU. Also here is a theoretical generalization of the mathematical model of thedynamics of the EU economy. To this end, the 6-degree polynomial, which, again, a very high R2 =0.9722 allows to generalize the development of the EU economy.
Since Germany is the EU's share of the largest, the most of his changes affect the whole economy ofthe EU on the one hand and its partner countries, including Estonia's economy. However, it shouldalso be taken into account here the German reunification with East Germany and its impact on theoverall development of their economies. We see three major downturn. Cycles are more contrast here.
EU y = -0,3791x6 + 47,727x5 - 2270,7x4 + 50736x3 - 530558x2 + 2E+06x - 2E+06R2 = 0,9722
0
4000000
8000000
12000000
16000000
20000000
European Union Euro area Polynom (European Union)

Journal of International Scientific Publication: Economy & Business, Volume 6, Part 4
ISSN 1313-2555, Published at: http://www.scientific-publications.net
279 Published by Info Invest, Bulgaria, www.sciencebg.net
Note: GFR = Germany (former Federal Rep.) 1970 – 1989; Germany 1990 –
Figure 4. Germany economies nominal GDP USD in millions
Source: authors illustration
Figure 5. Sweden and Finland economies nominal GDP USD in millions
Source: authors illustration
0
500000
1000000
1500000
2000000
2500000
3000000
3500000
4000000
Germany GFR
0
100000
200000
300000
400000
500000
600000Finland Sweden
Polynom (Finland) Polynom (Sweden)

Journal of International Scientific Publication: Economy & Business, Volume 6, Part 4
ISSN 1313-2555, Published at: http://www.scientific-publications.net
280 Published by Info Invest, Bulgaria, www.sciencebg.net
Sweden and Finland is Estonia's most important business partners. They depend very much on thedevelopment of Estonia's progress. We see periodic recessions in Finland and especially the sharpdecline in the 1990s ("lying"). However, the fluctuations in the development of the Swedish economyand even greater than Finland. Strongly influenced by the downturn in Germany and the EU, andchanges in the global economy. Here, too, the theoretical generalization of the economic dynamics ofmathematical models - a 6-degree polynomial. Also, they have very high R2 = 0.9533 and R2 = 0.9677,which can make generalizations about economic development in Sweden and Finland.
Figure 6. Estonia, Latvia and Lithuania economies nominal GDP USD in millions
Source: authors illustration
Before and after the economic crisis in the Baltic states were the highest increments in GDP, but thecrisis was the decline in one of the world. Here, too, is developing a somewhat different trend lines,especially in the initial years of restored independence. Here there are no abrupt changes, except forthe crisis years, as was the old market economies. 2010th had not yet reached the 2007th year levels.According to Eurostat, Estonia's GDP surpassed pre-crisis level of the 2011th In the first quarter, butthe per capita projections by only 2012th year. Latvia and Lithuania is going to take time for a fewyears.
Germany, Estonia, Latvia, Lithuania and Finland, the economic summit in 2008., Sweden, however,the 2007th year. Germany and Sweden exceeded the pre-crisis level of the 2010th in Finland, and the2011th Estonia, Latvia and Lithuania did not reach pre-crisis levels even in the 2011th year, butEstonia's 2012th, Latvia, Lithuania and the 2013th year. 2011th Estonia's GDP is projected to remainin the 2008th the level of 293 million euros or 1.8%. However, the 2012th It is already in excess of702 million and 2013. million euros in 1860.
0
10000
20000
30000
40000
50000
1992 1993 1994 1995 1996 1997 1998 1999 2000 2001 2002 2003 2004 2005 2006 2007 2008 2009 2010
Estonia Latvia Lithuania
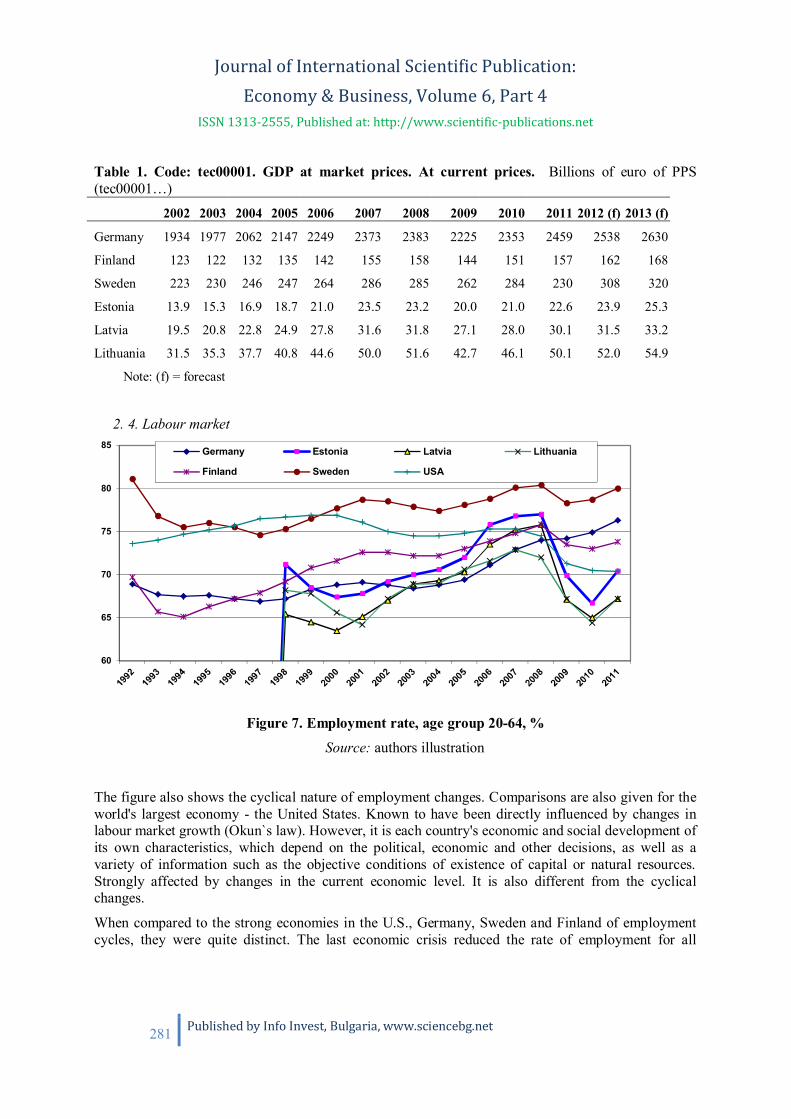
Journal of International Scientific Publication: Economy & Business, Volume 6, Part 4
ISSN 1313-2555, Published at: http://www.scientific-publications.net
281 Published by Info Invest, Bulgaria, www.sciencebg.net
Table 1. Code: tec00001. GDP at market prices. At current prices. Billions of euro of PPS(tec00001…)
2002 2003 2004 2005 2006 2007 2008 2009 2010 2011 2012 (f) 2013 (f)
Germany 1934 1977 2062 2147 2249 2373 2383 2225 2353 2459 2538 2630
Finland 123 122 132 135 142 155 158 144 151 157 162 168
Sweden 223 230 246 247 264 286 285 262 284 230 308 320
Estonia 13.9 15.3 16.9 18.7 21.0 23.5 23.2 20.0 21.0 22.6 23.9 25.3
Latvia 19.5 20.8 22.8 24.9 27.8 31.6 31.8 27.1 28.0 30.1 31.5 33.2
Lithuania 31.5 35.3 37.7 40.8 44.6 50.0 51.6 42.7 46.1 50.1 52.0 54.9
Note: (f) = forecast
2. 4. Labour market
Figure 7. Employment rate, age group 20-64, %
Source: authors illustration
The figure also shows the cyclical nature of employment changes. Comparisons are also given for theworld's largest economy - the United States. Known to have been directly influenced by changes inlabour market growth (Okun`s law). However, it is each country's economic and social development ofits own characteristics, which depend on the political, economic and other decisions, as well as avariety of information such as the objective conditions of existence of capital or natural resources.Strongly affected by changes in the current economic level. It is also different from the cyclicalchanges.
When compared to the strong economies in the U.S., Germany, Sweden and Finland of employmentcycles, they were quite distinct. The last economic crisis reduced the rate of employment for all
60
65
70
75
80
85 Germany Estonia Latvia Lithuania
Finland Sweden USA

Journal of International Scientific Publication: Economy & Business, Volume 6, Part 4
ISSN 1313-2555, Published at: http://www.scientific-publications.net
282 Published by Info Invest, Bulgaria, www.sciencebg.net
analyzed countries, except Germany, where it is grown for eight years. When Sweden and Finland,employment rates dropped a little during the crisis, the U.S. strongly. The new European Union (EU)member states, the Baltic states of employment cycles are quite similar. They all have a commonproblem for relatively low wages compared to the rich Nordic countries. After opening the EU labourmarket in the new Member States to labour, including skilled workers move to the Western Europeancountries.
Estonia's rate of employment in a mathematical model of the trend line (6th degree polynomial):
y = 0,0007x6 - 0,0558x5 + 1,7705x4 - 29,274x3 + 266,2x2 - 1263,6x + 2515,9; R2 = 0,9506
We see that in practical use, this mathematical model is too complicated, but works well as guidance.
Figure 8. Euro area and EU27 unemployment rates, quarterly average, % (une_rt_q…)
Source: Eurostat illustration
Eurostat figure in the euro area and EU27 unemployment rate of well-characterized changes in thecyclical nature of unemployment in 2000 - the 2012. We see two drop and rise to the top.

Journal of International Scientific Publication: Economy & Business, Volume 6, Part 4
ISSN 1313-2555, Published at: http://www.scientific-publications.net
283 Published by Info Invest, Bulgaria, www.sciencebg.net
Figure 9. Estonia, Latvia and Lithuania unemployment rates, quarterly average, %
Source: authors illustration
The years 1998 - 2012 the Baltic countries, cyclical unemployment rate trend lines are quite similar.Trend lines are dependent on the tips of their countries' economic crisis, especially the last. However,the highest unemployment rate came close to a year later, when their biggest drop in GDP.
In summary, here are the social cycles are similar to the economic cycles, labour cycles, but the peaksare further shifted by almost a year.
Estonia's rate of unemployment in a mathematical model of the trend line (6th degree polynomial):
y = -4E-08x6 + 4E-06x5 + 6E-05x4 - 0,0142x3 + 0,5003x2 - 7,0766x + 47,967; R2 = 0,8123
An analogous situation was also a major economic recession in Finland (1990 - 1993) and subsequentrapid growth period. If, before the economic crisis, the 1989th In Finland, the unemployment rate was3.1% and yet the 1990th to 3.2%, but it was a record-breaking 1994th in 16.6% of the annual growthof GDP was 3.7%. Years 1996 - 1999 were years of Finland's fast economic gains. During this periodincreased output (GDP) is significantly faster than the trend line trend line of employment. (Tanning,2000). This generalization is also now in Estonia and other European countries.
CONCLUSIONS
In summary, the main indicator of economic development is considered in real GDP (PPP) changesover time, which is also used here. However, it can, however, to assess the accuracy of certain factorssuch as labour productivity, etc. development. The output produced per worker and GDP, and changesin GDP and unemployment among the correlation relationship. Figures show the real economy (GDP)growth dynamics, which, however, is different from the smooth trend of the theoretical lines usedhere, despite the complex 6-degree polynomials and its very high R2. Kondratieva economic cyclesand other generalized trend lines are thus highly simplified generalizations.
3
6
9
12
15
18
21
24
Estonia Latvia Lithuania

Journal of International Scientific Publication: Economy & Business, Volume 6, Part 4
ISSN 1313-2555, Published at: http://www.scientific-publications.net
284 Published by Info Invest, Bulgaria, www.sciencebg.net
As the labour market development is also dependent on the overall economic development, then hereare similar to the cycles of social economic cycles, labour cycles but are almost a year beyond the tipsof the displaced. Unemployment is rising as fast as economic improvement. So many unemployed,who used to live in a relatively high unemployment compensation benefits, do not rush over to lookfor work so quickly. It also does not increase unemployment will immediately fall in GDP, but untilsome time after the unemployment rate will increase. Future economic growth is faster than thegrowth of employment. This means that after the recession has intensified the economic developmentof much greater intensity than before the crisis.
Requires in-depth analysis of economic development as well as hundreds of other economic and socialindicators for the treatment of these correlations examination, even by industry. Their decision-makingshould take into account both the politicians and business leaders in the economic development of acyclical nature, the fact that after the economic boom slows down or even go back to it (the crisis),then to grow again after some time. Capitalism does not develop uniformly. This is confirmed by boththe global and Estonian economic development in recent years. Politicians and business leaders are notmaking their decisions, need to know the exact complex mathematical models, one need onlysimplified the regularities of general knowledge.
REFERENCES
Benkemoune, R 2009, `Charles Dunoyer and the Emergence of the Idea of an Economic Cycle`,History of Political Economy, vol. 41(2), pp. 271-295http://hope.dukejournals.org/content/41/2/271.abstract 21.06.2012
Code: tec00001.Gross domestic product at market prices. Eurostat
http://epp.eurostat.ec.europa.eu/tgm/refreshTableAction.do?tab=table&plugin=1&pcode=tec00001&language=en 21.06.2012
Economics. The United economic encyclopedia. http://unieco.info/ 21.06.2012
Juglar, C 1862, Des Crises commerciales et leur retour periodique en France, en Angleterre, et auxEtats-Unis, Guillaumin, Paris http://gallica.bnf.fr/ark:/12148/bpt6k1060720 21.06.2012
Kondratjew, ND 1926, `Die langen Wellen der Konjunktur`, In: Archiv für Sozialwissenschaft undSozialpolitik, vol. 56, S. 573–609.
Korotayev, AV &Tsirel, SV 2010, `A Spectral Analysis of World GDP Dynamics: Kondratieff Waves,Kuznets Swings, Juglar and Kitchin Cycles in Global Economic Development, and the 2008–2009Economic Crisis`. Structure and Dynamics. Vol.4. #1. pp. 3-57.
http://www.escholarship.org/uc/item/9jv108xp 21.06.2012
Marshall, A 1920, `Principles of Economics (Revised Edition ed.)`. Macmillan; reprinted byPrometheus Books. London http://www.econlib.org/library/Marshall/marP.html 21.06.2012
Marx, K Vol. I 1867, vol. II 1885, vol. III 1894. `Das Kapital, Kritik der politischen Ökonomie`(Capital: Critique of Political Economy), Verlag von Otto Meisner. Hamburghttp://www.deutschestextarchiv.de/marx/kapital01/1867/
O'Sullivan, A & Steven MS 2003, `Economics: Principles in action ,̀ Pearson Prentice Hall UpperSaddle River, New Jersey 07458, pp. 57, 310.
Journal of International Scientific Publication: Economy & Business, Volume 6, Part 4
ISSN 1313-2555, Published at: http://www.scientific-publications.net
285 Published by Info Invest, Bulgaria, www.sciencebg.net
http://www.pearsonschool.com/index.cfm?locator=PSZ3R9&PMDbSiteId=2781&PMDbSolutionId=6724&PMDbCategoryId=&PMDbProgramId=12881&level=4. 21.06.2012
Over Production and Under Consumption, 2008, ScarLett, History of Economic Theory and Thoughthttp://www.economictheories.org/2008/11/over-production-and-under-consumption.html 21.06.2012
Purchasing power parities (PPPs) - calculation and uses. Eurostat.
http://epp.eurostat.ec.europa.eu/statistics_explained/index.php/Purchasing_power_parities_(PPPs)_-_calculation_and_uses 21.06.2012
Real GDP growth rate. Eurostat. http://epp.eurostat.ec.europa.eu/tgm/web/table/description.jsp21.06.2012
Rodbertus, Johann Karl 1905, New International Encyclopedia.
http://en.wikisource.org/wiki/The_New_International_Encyclop%C3%A6dia/Rodbertus,_Johann_Karl 21.06.2012
Schumpeter, JA 1987, `Theorie der wirtschaftlichen Entwicklung. Eine Untersuchung überUnternehmergewinn, Kapital, Kredit, Zins und den Konjunkturzyklus`, Berlin, S. 93, 110, 122, 132ff.
Schumpeter, JA 1961, `The theory of economic development : an inquiry into profits, capital, credit,interest, and the business cycle`, translated from the German by Redvers Opie New York: OUP
Seidl, C 1999, `Schumpeter Joseph Alois`, In: Österreichisches Biographisches Lexikon 1815–1950(ÖBL). Band 11, Verlag der Österreichischen Akademie der Wissenschaften, Wien, S. 369 – 371.http://www.biographien.ac.at/oebl_11/369.pdf 21.06.2012
Sismondi, Jean Charles Leonard de
http://en.wikisource.org/wiki/1911_Encyclop%C3%A6dia_Britannica/Sismondi,_Jean_Charles_Leonard_de 21.06.2012
Tanning, L 2000, Nordisk ekonomi. Põhjamaade majandus, vol. II` (Nordic economic, Volume II).Ten Team Ltd., Tallinn, pp. 82-83.
Tanning, L &Tanning, T 2010, `Rahvusvaheline majandus, vol. II` (International economy, VolumeII), Tallinn University of Technology, Tallinn, pp. 13-33, 113-230.
Handbook of Statistics, UNCTAD.http://unctadstat.unctad.org/ReportFolders/reportFolders.aspx21.06.2012
Wirtschaftswissenschaft
http://www.uni-marburg.de/fb02/studium/studgang/studinteressierte/studium_allg/wiwi 21.06.2012
2002, ` `, ,, oc , 764 c.
& 2009, `,c , / . , % ,
, /URSS, oc , c. 189-229.
http://cliodynamics.ru/index.php?option=com_content&task=view&id=263&Itemid=1 21.06.2012 2004, ` « » . . ` http://ss.xsp.ru/st/019/index.php
21.06.2012
Journal of International Scientific Publication: Economy & Business, Volume 6, Part 4
ISSN 1313-2555, Published at: http://www.scientific-publications.net
286 Published by Info Invest, Bulgaria, www.sciencebg.net
EASTERN EUROPEAN COUNTRIES SALARIES AND PRODUCTIVITY
BY THE EXAMPLE ESTONIAToivo Tanning, Lembo Tanning, Maksim Saat
Tallinn University of Technology. School of Economics and Business Administration
Akadeemia tee 3, 12618 Tallinn, Estonia
e-mail: [email protected]; [email protected]; [email protected]
AbstractAfter the opening of the European Union (EU) labour markets, some EU countries started facing theproblem of partial work force drain to richer countries with higher wages. From Estonia, the mainmigration is to Finland. At the same time, East-European countries face quite a high unemploymentrate on the one hand, and many vacant jobs on the other hand – there is a lack of qualified work force.
Hence the objective of this article is to analyse the labour market of new member states of the EUcoming from East-Europe, with emphasis made on Estonia, more specifically the productivity, labourcosts and salaries, problems associated with labour market, and to compare it with the EU levels. Thearticle focuses on the analysis of whether the low wages of Eastern European countries, includingEstonia, are justified when compared to the wages of Western European countries, and what are thepossibilities and possible benefits of raising them.
Key words: European Union, Estonia, productivity, salaries, labour market.
INTRODUCTIONAn important element in Estonia's post-independence reorientation has been closer ties with theNordic countries, especially Finland and Sweden. Estonia has had a market economy since the end of1990s and one of the highest per capita income levels in Eastern Europe. The current government haspursued relatively sound fiscal policies, resulting in balanced budgets and low public debt. A balancedbudget, almost non-existent public debt, flat-rate income tax, free trade regime, competitivecommercial banking sector, innovative e-Services and even mobile-based services are all hallmarks ofEstonia's market economy. Before the economic crisis, the economic growths of Estonia, Latvia andLithuania were one of the highest in the European Union. Hence these countries were called BalticTigers. The crisis, however, took the three countries to a completely different edge – the fall of theirGDPs was one of the biggest in the EU. After the crisis, the economic growth factors of Estonia haveagain been the biggest in the union. In 2011, the real GDP growth in Estonia was 7.6%. (Code: tsieb020)
However, the employment rate and wages in Estonia are one of the lowest in the EU. A thoroughanalysis of the development of a small economy such as Estonia will also help make more generalconclusions, at least on the European level.
After the economic crisis the GDP usually goes on an upward incline, while the unemployment is hardto curb. Why? To surmount the crisis, companies try to reduce the labour costs to a minimum. They

Journal of International Scientific Publication: Economy & Business, Volume 6, Part 4
ISSN 1313-2555, Published at: http://www.scientific-publications.net
287 Published by Info Invest, Bulgaria, www.sciencebg.net
endeavour to get rid of poor quality, redundant and also conflict-prone workers, in the first place.Concurrently a new problem rises – qualified labour is scarce. This problem does not only pesterEstonia, it is endemic. One of the root causes are locally prevalent low salaries as compared to theremunerations paid in West-European countries.
After the crisis the economy does not develop along the extensive track, but mainly by the intensiveways, i.e. on account of growth in productivity. Expanding of the production occurs mainly with thehelp of adopting more efficient machines and equipment and better work organisation, reducing thenumber of low-qualification workers and increasing the demand for high-qualification ones. Besidesworkers, that also affects the people with higher education and other specialists. Regardless of therelatively large unemployment an opposite situation has obtained in the labour market – in manybranches of economy, the qualified labour is scarce. Due to free movement of labour in the EUcountries a situation has obtained in the East-European member states, incl. also in Estonia: youngerand experienced workers leave the country to work abroad, where salaries are higher. It is a foregoneconclusion.
Looking into the future, all this boils down to the need to increase the efficiency of production andproductivity, and also to provide a competitive salary level. For elaboration of means necessary toenhance the efficiency of operating of the labour market, the complex analysis of labour market isneeded.
By reference to the above, the goal of this article is to analyse the major components affecting thelabour market, the productivity and salaries and their relation in East-Europe, in the first place inEstonia. It is usually alleged that salaries cannot be increased due to low productivity. Since Estonianproductivity in ratios is over twice higher than the salaries, the question “Why?” suggests itself. Whilethe emphasis will be on Estonia, for theoretical generalisations the EU as an entirety has been partiallyinvolved in this article.
What are the opportunities to increase the labour market’s efficiency and salaries?
Theoretical bases lay, as a rule on relevant positions of renown economists published in academicissues and concerning mainly East-Europe, analyses and reference data of international organisations(ILO, IMF, OECD, Eurostat etc.) and also on positions of present authors released in their earlierpublications (Tanning, L and T, 2010; Tanning, T and L, 2011).
Productivity is an important economic indicator, directly impacting on development of the wholeeconomy and companies, as well as workers’ salaries – ditto standard of living. Estonian salaries fallsignificantly short of the salary level of Nordic and West-European countries. Referred to as thegrounds for that is our relatively low productivity, which does not enable increasing remunerations inEstonia to the level of Finland and other countries with advanced economy.
Below we shall analyse, by reference to Eurostat source materials, how the factors affectingproductivity have changed over an extensive period. We shall compare productivity and salaries bothin Estonia and Europe. For instance, if the company would like to multiply the salaries, the productionshould yield the needed amount of extra money. Moreover, the company should retain, besides labourexpense some money for overheads, profit etc. The income obtained should exceed the expenseincurred. As a rule, labour costs constitutes the largest share in the company expense.

Journal of International Scientific Publication: Economy & Business, Volume 6, Part 4
ISSN 1313-2555, Published at: http://www.scientific-publications.net
288 Published by Info Invest, Bulgaria, www.sciencebg.net
ANALYSIS
Analysis of labour costs and average gross annual salaries in the European countries make public inDecember 2011 (Tanning, T and L, 2011).
Table 1. Net per year salaries, EUR, 1997 – 20111997 1999 2002 2004 2006 2007 2008 2009 2010 2011
EU (27) 12,489 11,934 15,844 16,407 17,235 17,910 17,975 17,728 18,456 17,928
EU (15) 15,222 14,356 18,723 19,413 20,260 20,942 20,910 20,697 21,350 20,911
Germany 23,966 18,786 21,958 23,022 23,597 24,180 24,739 24,552 25,297 26,253
Finland 15,023 15,512 18,434 19,478 20,797 22,047 23,170 23,643 24,449 25,385
Sweden 16,072 16,667 20,773 22,232 23,200 24,109 24,271 22,418 25,369 27,320
Source: Code: earn_nt_net
Figure 1. Net per year salaries, EUR, 2011
Source: authors illustration
In new EU member states the average net annual salary in 2007 was 5266 EUR, significantly smallerthan Estonian salary (in 2011 was 6664). Also contrastively presented herein is the EU candidate stateTurkey’s salary, which was on an average level among the others. As regards the Estonia’s
0
5 000
10 000
15 000
20 000
25 000
30 000
35 000
40 000
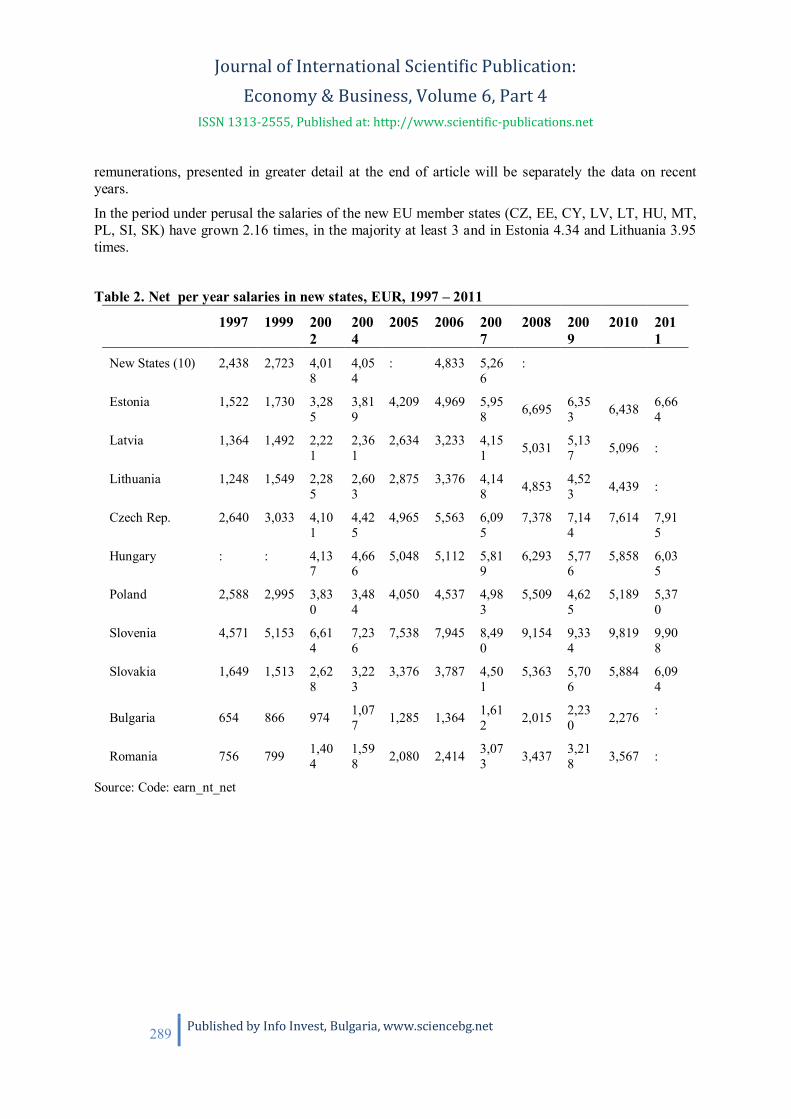
Journal of International Scientific Publication: Economy & Business, Volume 6, Part 4
ISSN 1313-2555, Published at: http://www.scientific-publications.net
289 Published by Info Invest, Bulgaria, www.sciencebg.net
remunerations, presented in greater detail at the end of article will be separately the data on recentyears.
In the period under perusal the salaries of the new EU member states (CZ, EE, CY, LV, LT, HU, MT,PL, SI, SK) have grown 2.16 times, in the majority at least 3 and in Estonia 4.34 and Lithuania 3.95times.
Table 2. Net per year salaries in new states, EUR, 1997 – 2011
1997 1999 2002
2004
2005 2006 2007
2008 2009
2010 2011
New States (10) 2,438 2,723 4,018
4,054
: 4,833 5,266
:
Estonia 1,522 1,730 3,285
3,819
4,209 4,969 5,958 6,695 6,35
3 6,438 6,664
Latvia 1,364 1,492 2,221
2,361
2,634 3,233 4,151 5,031 5,13
7 5,096 :
Lithuania 1,248 1,549 2,285
2,603
2,875 3,376 4,148 4,853 4,52
3 4,439 :
Czech Rep. 2,640 3,033 4,101
4,425
4,965 5,563 6,095
7,378 7,144
7,614 7,915
Hungary : : 4,137
4,666
5,048 5,112 5,819
6,293 5,776
5,858 6,035
Poland 2,588 2,995 3,830
3,484
4,050 4,537 4,983
5,509 4,625
5,189 5,370
Slovenia 4,571 5,153 6,614
7,236
7,538 7,945 8,490
9,154 9,334
9,819 9,908
Slovakia 1,649 1,513 2,628
3,223
3,376 3,787 4,501
5,363 5,706
5,884 6,094
Bulgaria 654 866 974 1,077 1,285 1,364 1,61
2 2,015 2,230 2,276 :
Romania 756 799 1,404
1,598 2,080 2,414 3,07
3 3,437 3,218 3,567 :
Source: Code: earn_nt_net

Journal of International Scientific Publication: Economy & Business, Volume 6, Part 4
ISSN 1313-2555, Published at: http://www.scientific-publications.net
290 Published by Info Invest, Bulgaria, www.sciencebg.net
0
2 000
4 000
6 000
8 000
10 000
12 000
EUnew
states .
Slovenia
Malta
Chech Rep
.
Estonia
Slovakia
Hungary
Turkey
Poland
Latvia
Lithuan
ia
Romania
Bulgaria
Figure 2. Net per year salaries in new states, EUR, 2011
Source: authors illustration
In the years of 1999 – 2011, as a general rule the minimum salaries grew, however due to theeconomic crisis part of the countries had frozen their salaries for two to three years, incl. in Estonia tothe level of 2008. The British decreased minimum salaries in 2011 as against 2008 and the Americansincreased it substantially. In Estonia, is has nevertheless increased as from 1999 by 3.6 times; inLatvia 3.8 times and Lithuania 2.5 times. In increased still more in Romania (5.9 times) and Bulgaria(4.2 times). It thence transpires that in evidence is the trend to level out the salaries, although atvariable rates, significantly influenced by the position of their economies during the crisis and successof the policy in superseding the crisis.
Discrepancies in minimum salaries still are overwhelmingly large. Hence in Bulgaria it was 13.0 timeslesser than in Luxembourg, 5.5 times lesser than in better economy post-socialist Slovenia and 2.1times lesser than in Estonia. Whereas in Estonia the minimum salary is 6.2 times lesser than inLuxembourg and 2.6 times lesser than in Slovenia. Whereas the Luxembourg’s minimum salaries areseveral times higher than in new EU member states. Reckoning with divergent price levels of thecountries, Estonia’s minimum salary should be 362 euro, subject to purchasing power standard (PPP).
Table 3. Productivity, basing on PPS, per one worker and hour, 1995 – 2010
Per person employed (EU-27=100) Per hour worked (EU-27=100)
1995
1998
2001
2004
2006
2008
2009 2010 199
51998
2001
2004
2006
2008
2009
2010
EU-27 100.0
100.0
100.0
100.0
100.0
100.0
100.0
100.0
100.0
100.0
100.0
100.0
100.0
100.0
100.0
100.0
Bulgaria 31.6 27.4 32.1
34.8
36.4
39.6 40.1 41.3 32.0 28.6 33.0 35.
036.8
39.9
39.8 41.4
Germany 115. 112. 106 107 108 107 105. 105. 131. 128. 123. 125 127 126 124 123.

Journal of International Scientific Publication: Economy & Business, Volume 6, Part 4
ISSN 1313-2555, Published at: http://www.scientific-publications.net
291 Published by Info Invest, Bulgaria, www.sciencebg.net
6 0 .2 .5 .7 .9 0 3 1 7 9 .6 .6 .6 .7 9
Estonia 34.1 41.6 48.3
57.7
62.4
66.0 65.8 69.2 : : 41.4 48.
552.1
56.0
59.0 61.0
Latvia 33.3 36.9 41.5
45.9
48.8
51.6 52.8 54.6 : : 32.0 36.
538.4
42.9
44.5 46.7
Lithuania 36.2 41.1 47.3
53.8
56.8
62.1 57.5 62.3 36.2 39.7 43.8 49.
951.1
54.4
50.8 54.8
Finland 111.3
114.2
112.9
113.5
110.6
113.3
110.2
111.5
108.7
111.8
110.4
110.5
108.1
112.0
108.3
109.6
Sweden 111.2
113.2
109.0
115.5
113.1
114.2
111.9
114.5
117.6
117.8
114.2
120.6
118.1
117.9
114.2
115.4
Hungary 55.0 57.6 61.5
67.0
67.8
70.9 72.1 71.2 47.5 49.0 52.2 56.
457.0
59.5
60.2 60.1
Poland 46.0 50.8 56.3
61.9
61.1
62.3 65.6 66.8 38.3 42.1 45.8 49.
849.1
50.2
52.5 53.9
Romania : : 25.7
34.6
39.7
49.1 49.2 48.9 : : 23.5 31.
535.5
43.7
42.9 43.0
Slovenia 66.8 75.5 76.1
81.5
83.4
83.8 80.9 80.4 : : 76.1 78.
783.5
83.7
79.6 79.4
Slovakia 50.3 56.6 60.8
65.7
71.7
79.7 79.7 81.4 46.4 53.9 57.2 63.
367.5
74.2
73.6 74.6
Source: Code: tsieb030 and tsieb040
Figure 3. Higher productivity states > EL=100, 2010
Source: authors illustration
Of higher productivity in EU and also globally is Luxembourg and Norway, external to EU.
170
137125
116 115 113 113 109 105114
108 105110
149144
111
70
90
110
130
150
170
190
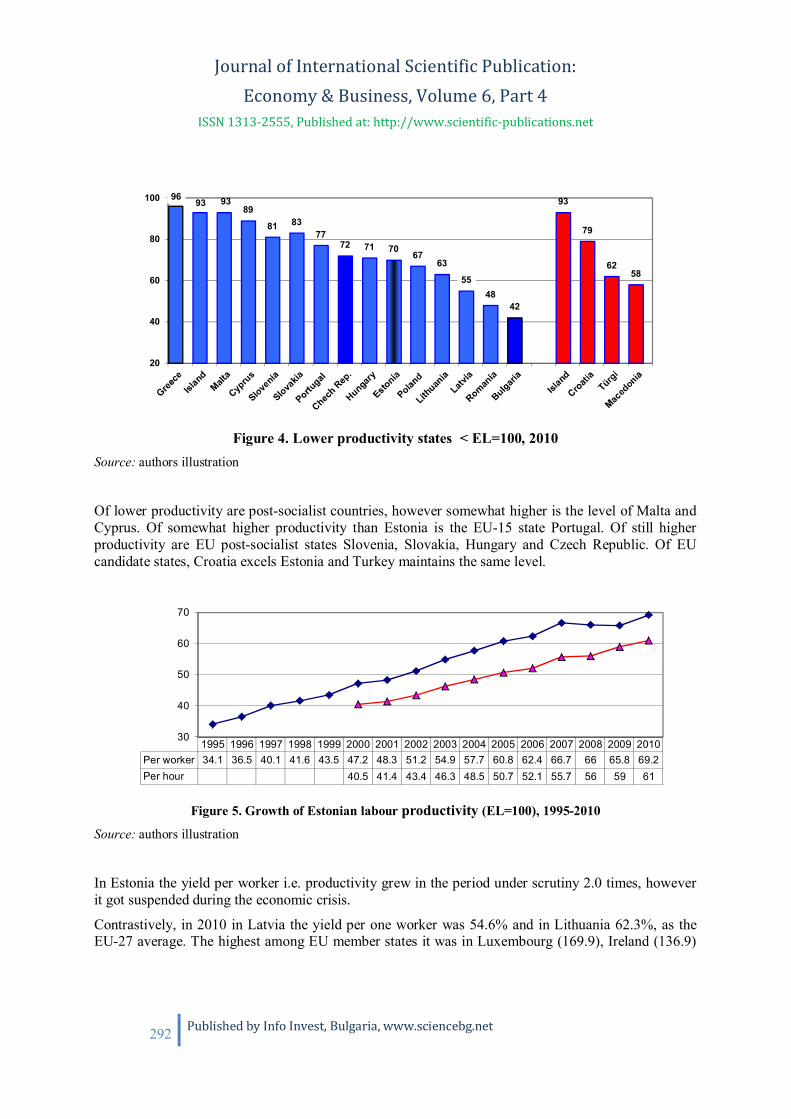
Journal of International Scientific Publication: Economy & Business, Volume 6, Part 4
ISSN 1313-2555, Published at: http://www.scientific-publications.net
292 Published by Info Invest, Bulgaria, www.sciencebg.net
Figure 4. Lower productivity states < EL=100, 2010Source: authors illustration
Of lower productivity are post-socialist countries, however somewhat higher is the level of Malta andCyprus. Of somewhat higher productivity than Estonia is the EU-15 state Portugal. Of still higherproductivity are EU post-socialist states Slovenia, Slovakia, Hungary and Czech Republic. Of EUcandidate states, Croatia excels Estonia and Turkey maintains the same level.
Figure 5. Growth of Estonian labour productivity (EL=100), 1995-2010
Source: authors illustration
In Estonia the yield per worker i.e. productivity grew in the period under scrutiny 2.0 times, howeverit got suspended during the economic crisis.
Contrastively, in 2010 in Latvia the yield per one worker was 54.6% and in Lithuania 62.3%, as theEU-27 average. The highest among EU member states it was in Luxembourg (169.9), Ireland (136.9)
96 93 9389
81 8377
72 71 70 6763
5548
42
93
79
6258
20
40
60
80
100
1995 1996 1997 1998 1999 2000 2001 2002 2003 2004 2005 2006 2007 2008 2009 2010Per worker 34.1 36.5 40.1 41.6 43.5 47.2 48.3 51.2 54.9 57.7 60.8 62.4 66.7 66 65.8 69.2Per hour 40.5 41.4 43.4 46.3 48.5 50.7 52.1 55.7 56 59 61
30
40
50
60
70

Journal of International Scientific Publication: Economy & Business, Volume 6, Part 4
ISSN 1313-2555, Published at: http://www.scientific-publications.net
293 Published by Info Invest, Bulgaria, www.sciencebg.net
and France (115.8) and the lowest in Bulgaria (41.3%) and Romania (48.8). In Norway (150.7) andUSA (143.5) the productivity was 1.5 times higher than the EU average.
The one working hour’s productivity displays a similar trend, the highest in Luxembourg 187.1.Estonia’s productivity amounts only to 61.0%.
However the prevailing trend is that regardless of growth in productivity elsewhere, it rises in Estoniaand also other EU new accessions noticeably quicker than in veteran and wealthy EU-15 countries.
When analysing the EU-27 productivity (added value produced by one worker) as per branches ofeconomy and size of companies, one cannot draw an equipollent (equal in force or effect) conclusionas regards the productivity and number of workers engaged in the company. It is conditional of thebranch of economy. For that matter, productivity in energy and water management companies is thehighest in small firms, with up to 9 persons on payroll. Whereas the largest productivity is evidencedin big firms, keeping in employ 250 workers or more, the companies operating in the lease of movableproperty, accommodation (housing) companies and in total all branches of economy as an entity.Textile and habiliment (articles of clothing) firms have the largest productivity, with number ofworkers from 10 - 49; so do the timber companies with number of workers from 50 – 249 (Code:tin00054).
Below we will analyse in greater detail, from among productivity indicators of Estonian companies,the labour expense in current prices, or which the predominant share is constituted by salaries.
We will look at Estonian productivity indicators both by reference to sales revenue and added value asper employed and the same by reference to hourly productivity, mainly on new methods(Classification of Economic Activities (EMTAK) 2008), applied in 2008.
In Estonia, productivity differs little as per company size up to 249 workers. In 2003 and 2007 thelargest productivity was boasted by firms with workers from 50 – 99; in 2005 with workers up to 9people and for the rest under survey from 100 – 249 workers. Invariably, big companies of lesserproductivity had 250 workers and more. That can be accounted for by larger flexibility in managementof lesser companies, lesser number of ancillary personnel and also because workers of smallcompanies are more of “jacks of all trades” than in big companies. In big firms productivity is sapped,as a general rule by large overheads.
Table 4. Productivity indicators of Estonian companies in current prices, 2001-2012Labour productivity per person employed on the basis of net sales, thousand euros
2001 2002 2003 2004 2005 2006 2007 2008 2009 2010 2011 2012
Iquarter
10.8 11.1 12.3 13.6 15.2 17.6 20.6 21.2 18.5 20.8 25.2 26.9
IIquarter
12.2 12.9 13.4 15.2 17.3 20.2 23.4 23.4 20.4 24.0 27.6
IIIquarter
12.3 12.8 14.0 15.4 18.2 21.0 23.6 24.0 20.8 25.2 28.1
IVquarter
13.4 13.6 15.0 16.6 19.7 22.0 24.4 22.0 21.7 26,8 29.3

Journal of International Scientific Publication: Economy & Business, Volume 6, Part 4
ISSN 1313-2555, Published at: http://www.scientific-publications.net
294 Published by Info Invest, Bulgaria, www.sciencebg.net
Labour productivity per person employed on the basis of value added, thousand euros
2002 2003 2004 2005 2006 2007 2008 2009 2010 2011 2012
I quarter 2.1 2.4 2.5 2.7 3.4 4.0 4.2 3.2 3.5 4.3 4.7
II quarter 2.5 2.6 2.8 3.3 3.9 4.7 4.6 3.7 4.1 5.0
III quarter 2.5 2.7 2.8 3.4 4.2 4.7 4.6 3.5 4.4 5.0
IV quarter 2.6 2.7 2.9 3.6 4.5 4.7 4.0 3.8 4.7 5.1
Source: Code: FS0411
Productivity as per employed by reference to sales revenue was over 20 thousand euro as from thesecond half of 2006. In 2009 QI a dramatic decline occurred, again followed by a slowly ascendinggrowth, whereas 2010 QIII and QIV were record-breakers. Admittedly Estonia has made its exit fromthe economic crisis mainly along the intensive track, i.e. on account of growth in productivity.
Productivity as per employed by reference to net value added has changed due to other regularities. Aslate as in 2010 QIV, Estonia attained the level of three successful quarters of the pre-crisis 2007.Whereas in 2010 QIV the level was already 1.5 times higher than productivity in the deepest slump ofcrisis in 2009 QI.
After the crisis, productivity recovered quicker by reference to sales revenue than by reference tovalue added, which implies the runaway selling prices after the crisis.
Whereas the above analysis per quarters support evidence to the surmise that in the period ofeconomic crisis the changes are extremely rapid and consequently the analysis with one year precisionwill not yield a correct picture of changes underway.
Table 5. Estonian companies’ productivity per employed, thousand euro, 2005 – 20102005 2006 2007 2008 2009 2010
By reference to sales revenue 72.1 81.2 92.2 93.6 81.2 95,6
By reference to value added 14.7 17.4 19.3 18.7 17.4 16,7
Source: Code FS008
Sales revenue as per employed, of the first quarter of 2010 was 44.3 thousand euro. It is more than inthe previous year, nevertheless it falls short of 2007 and 2008 average.
Business sector’s productivity by reference to the net value added increased in 2010 by18%, whereasthe companies’ average labour expense per employed kept on the level of 2009.
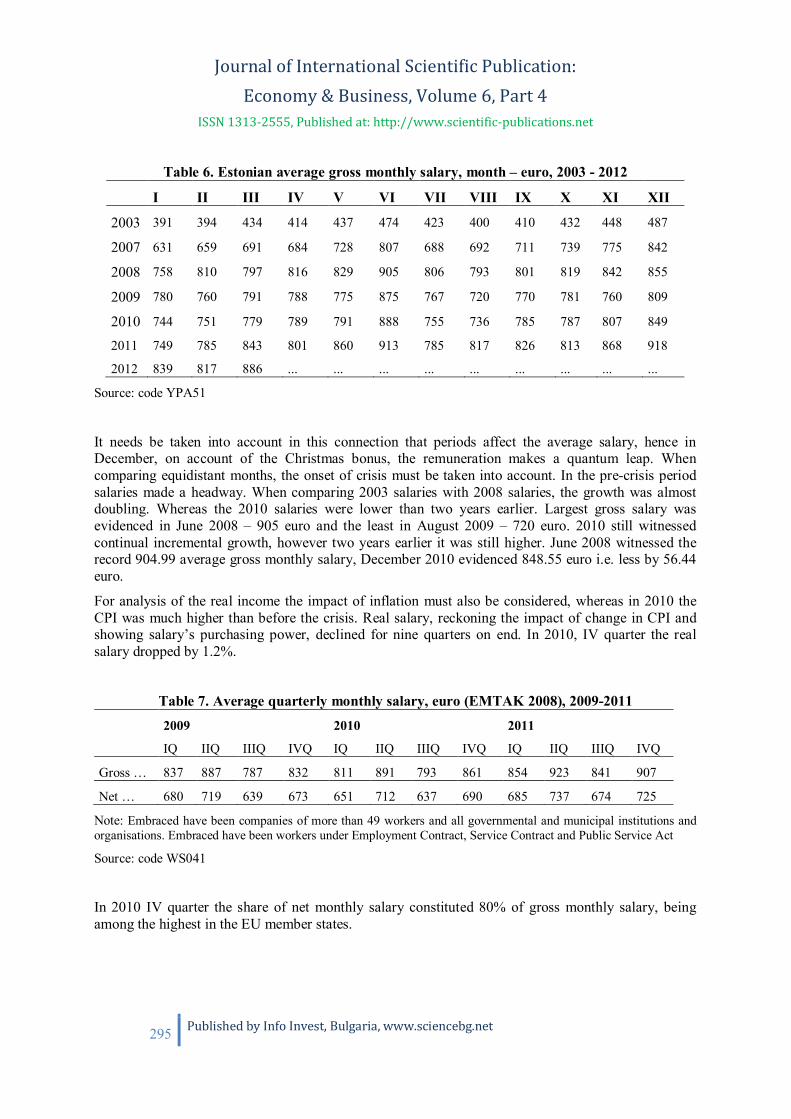
Journal of International Scientific Publication: Economy & Business, Volume 6, Part 4
ISSN 1313-2555, Published at: http://www.scientific-publications.net
295 Published by Info Invest, Bulgaria, www.sciencebg.net
Table 6. Estonian average gross monthly salary, month – euro, 2003 - 2012
I II III IV V VI VII VIII IX X XI XII
2003 391 394 434 414 437 474 423 400 410 432 448 487
2007 631 659 691 684 728 807 688 692 711 739 775 842
2008 758 810 797 816 829 905 806 793 801 819 842 855
2009 780 760 791 788 775 875 767 720 770 781 760 809
2010 744 751 779 789 791 888 755 736 785 787 807 849
2011 749 785 843 801 860 913 785 817 826 813 868 918
2012 839 817 886 ... ... ... ... ... ... ... ... ...
Source: code YPA51
It needs be taken into account in this connection that periods affect the average salary, hence inDecember, on account of the Christmas bonus, the remuneration makes a quantum leap. Whencomparing equidistant months, the onset of crisis must be taken into account. In the pre-crisis periodsalaries made a headway. When comparing 2003 salaries with 2008 salaries, the growth was almostdoubling. Whereas the 2010 salaries were lower than two years earlier. Largest gross salary wasevidenced in June 2008 – 905 euro and the least in August 2009 – 720 euro. 2010 still witnessedcontinual incremental growth, however two years earlier it was still higher. June 2008 witnessed therecord 904.99 average gross monthly salary, December 2010 evidenced 848.55 euro i.e. less by 56.44euro.
For analysis of the real income the impact of inflation must also be considered, whereas in 2010 theCPI was much higher than before the crisis. Real salary, reckoning the impact of change in CPI andshowing salary’s purchasing power, declined for nine quarters on end. In 2010, IV quarter the realsalary dropped by 1.2%.
Table 7. Average quarterly monthly salary, euro (EMTAK 2008), 2009-20112009 2010 2011
IQ IIQ IIIQ IVQ IQ IIQ IIIQ IVQ IQ IIQ IIIQ IVQ
Gross … 837 887 787 832 811 891 793 861 854 923 841 907
Net … 680 719 639 673 651 712 637 690 685 737 674 725
Note: Embraced have been companies of more than 49 workers and all governmental and municipal institutions andorganisations. Embraced have been workers under Employment Contract, Service Contract and Public Service Act
Source: code WS041
In 2010 IV quarter the share of net monthly salary constituted 80% of gross monthly salary, beingamong the highest in the EU member states.

Journal of International Scientific Publication: Economy & Business, Volume 6, Part 4
ISSN 1313-2555, Published at: http://www.scientific-publications.net
296 Published by Info Invest, Bulgaria, www.sciencebg.net
Quite naturally, in the pre-crisis year the salary and consequently labour expense were larger than in2009. As from the second quarter 2010 the level of the previous year was superseded, however therewas a shortfall, as compared to the pre-crisis time.
As per areas of activities the IV quarter of 2010 continually displayed the largest gross monthly salaryin finance and insurance business (1337.73) and in information and communication (1305.33).Salaries in manufacturing industry (777.10); trade (740.74) and building (853.35) were much lower.The lesser area however was „other servicing business“ – 502.41 euro. Average gross monthly salaryin 2010, IV quarter was the largest in Tallinn 920.46 and Tartu 811.93 and lower in county Valga610.48 euro (code WS21).
Table 8. Average gross monthly wages and labour cost per employee, euro, 2002-2012
2002 2003
2004 2005
2006
2007
2008 2009
2010
2011
2012
I quarter
Gross monthly wages 366 405 431 475 549 660 788 776 758 792 847
Monthly labour cost 498 546 581 640 739 886 1 059 1055
1030
1074
1148
II quarter
Gross monthly wages 406 442 474 530 609 738 850 813 822 857 ..
Monthly labour cost 549 596 639 713 818 991 1 145 1105
1114
1159
..
III quarter
Gross monthly wages 374 411 449 498 580 697 800 752 759 809 ..
Monthly labour cost 506 555 605 670 779 937 1 078 1024
1027
1096
..
IV quarter
Gross monthly wages 416 455 492 555 653 784 838 783 814 865 ..
Monthly labour cost 565 617 665 750 879 1056
1 137 1069
1105
1175
..
Source: code: WS010

Journal of International Scientific Publication: Economy & Business, Volume 6, Part 4
ISSN 1313-2555, Published at: http://www.scientific-publications.net
297 Published by Info Invest, Bulgaria, www.sciencebg.net
Figure 6. Estonian gross monthly salary per owner, QIV 2011, euro
Source: authors illustration
Productivity reverted to decline in the second half of 2007 and attained the trough of the slump in2008, IV quarter. Whereas salary increased and its record sizes were evidenced in 2008 II and IVquarter, where productivity had plummeted. mbraced have been workers under Employment Contract,Service Contract and Public Service Act. While on the one hand it is emphasised that the salaries ofgovernment and self- governments were frozen, because before crisis they enjoyed a non-motivatedlarge growth, the growth analysis of salaries of 2010, IV quarter contradicts to it. Lesser growth ofsalaries was evidenced in private sector. (Code: WS31)
Figure 7. Estonian gross salary, %, 2000-2011
Source: authors illustration
In Estonia, in the 4th quarter of 2011, the average monthly gross wages and salaries were 865 eurosand the average hourly gross wages and salaries were 5.19 euros. Compared to the 4th quarter of 2010,the average monthly gross wages and salaries grew 6.3% and the average hourly gross wages andsalaries by 7.4%. (News releases 22.02.2012, no 33)
State; 1042
Localgovernment;
709
Estonian person inprivate law;
760
Foreign person inprivate law;
1068
0
200
400
600
800
1000
1200
1400
+4,8%
+3,9% +6,2%
+6,7%
-5.0
0.0
5.0
10.0
15.0
20.0
25.0
10.5 12.3 11.59.4 8.4
10.8
16.5
20.5
13.9
-51.1
5.6
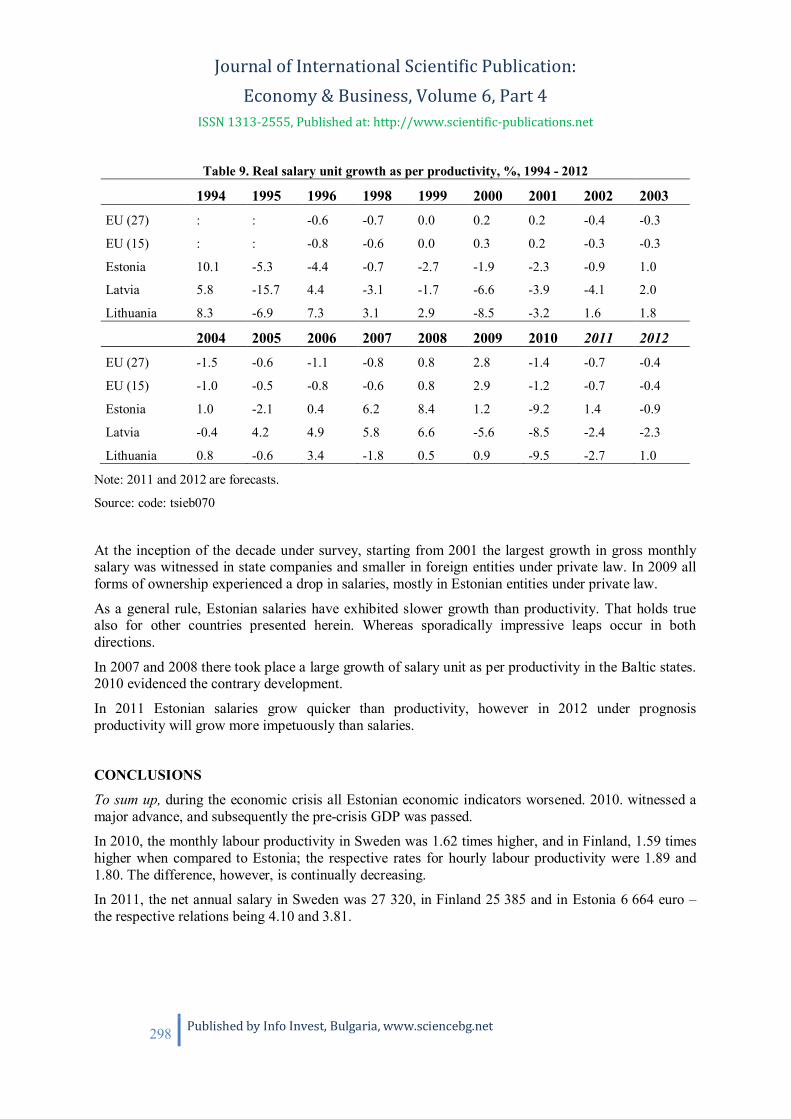
Journal of International Scientific Publication: Economy & Business, Volume 6, Part 4
ISSN 1313-2555, Published at: http://www.scientific-publications.net
298 Published by Info Invest, Bulgaria, www.sciencebg.net
Table 9. Real salary unit growth as per productivity, %, 1994 - 2012
1994 1995 1996 1998 1999 2000 2001 2002 2003EU (27) : : -0.6 -0.7 0.0 0.2 0.2 -0.4 -0.3
EU (15) : : -0.8 -0.6 0.0 0.3 0.2 -0.3 -0.3
Estonia 10.1 -5.3 -4.4 -0.7 -2.7 -1.9 -2.3 -0.9 1.0
Latvia 5.8 -15.7 4.4 -3.1 -1.7 -6.6 -3.9 -4.1 2.0
Lithuania 8.3 -6.9 7.3 3.1 2.9 -8.5 -3.2 1.6 1.8
2004 2005 2006 2007 2008 2009 2010 2011 2012EU (27) -1.5 -0.6 -1.1 -0.8 0.8 2.8 -1.4 -0.7 -0.4
EU (15) -1.0 -0.5 -0.8 -0.6 0.8 2.9 -1.2 -0.7 -0.4
Estonia 1.0 -2.1 0.4 6.2 8.4 1.2 -9.2 1.4 -0.9
Latvia -0.4 4.2 4.9 5.8 6.6 -5.6 -8.5 -2.4 -2.3
Lithuania 0.8 -0.6 3.4 -1.8 0.5 0.9 -9.5 -2.7 1.0
Note: 2011 and 2012 are forecasts.
Source: code: tsieb070
At the inception of the decade under survey, starting from 2001 the largest growth in gross monthlysalary was witnessed in state companies and smaller in foreign entities under private law. In 2009 allforms of ownership experienced a drop in salaries, mostly in Estonian entities under private law.
As a general rule, Estonian salaries have exhibited slower growth than productivity. That holds truealso for other countries presented herein. Whereas sporadically impressive leaps occur in bothdirections.
In 2007 and 2008 there took place a large growth of salary unit as per productivity in the Baltic states.2010 evidenced the contrary development.
In 2011 Estonian salaries grow quicker than productivity, however in 2012 under prognosisproductivity will grow more impetuously than salaries.
CONCLUSIONS
To sum up, during the economic crisis all Estonian economic indicators worsened. 2010. witnessed amajor advance, and subsequently the pre-crisis GDP was passed.
In 2010, the monthly labour productivity in Sweden was 1.62 times higher, and in Finland, 1.59 timeshigher when compared to Estonia; the respective rates for hourly labour productivity were 1.89 and1.80. The difference, however, is continually decreasing.
In 2011, the net annual salary in Sweden was 27 320, in Finland 25 385 and in Estonia 6 664 euro –the respective relations being 4.10 and 3.81.
Journal of International Scientific Publication: Economy & Business, Volume 6, Part 4
ISSN 1313-2555, Published at: http://www.scientific-publications.net
299 Published by Info Invest, Bulgaria, www.sciencebg.net
Based on the data from Sweden, the annual net salary in Estonia according to labour productivityshould be 16 864 or 14 455 euro, that is over two times higher than it is now. Based on Finnish data,the respective figures are 15 965 or 14 193 Euros. We are currently comparing net salaries due to thedifferences in Swedish, Finnish and Estonian tax systems.
However, it is not enough to compare merely gross and net salaries: for a deeper analysis, price levels,social expenditures, family budget and other social figures must also be observed. As it is known, thehighest price levels are in Switzerland, Norway and from EU countries, Denmark.
In Estonia, certain prices of more expensive goods and services may even reach the price levels ofGermany, but in overall, the price levels in Estonia are still lower than in richer Western Europeancountries.
When comparing the salaries in public and private sector in Estonia, it must be considered that inpublic sector, the number of people with higher education is much bigger than in private sector.Therefore it is not feasible to compare, for example, the salaries in education (public sector) withsalaries in services (private sector), as the qualifications of workers are too different. Unfortunately,the salaries of workers with higher education do not differ that greatly from the salaries of workerswith basic education.
Estonian productivity is 69%, but salaries are below 30% EU average. Consequently at such level ofaverage productivity it is, as a general rule possible to raise salaries primarily on the expense of ownerprofit. This would also lessen the drain of qualified workforce. Keeping qualified workers in Estonia isin the long run also beneficial to the employer. A reasonable raise in the salaries would be a beneficialfuture investment for the companies. As for the rise of profit, it would be insured by keeping qualifiedworkforce and by lessening or saving from training expenses on new employees, etc. But we mustn’talso forget the golden rule of economic theory: the main goal of a business enterprise is earning profitto its owners. Hence, the conflict of interests arises. Therefore we may also look at differententerprises from a viewpoint of whether their activity is focused on today only or does it also considerthe future.
Productivity in ratios of other post-socialist countries, new EU states is also substantially higher thansalaries.
Significant discrepancy of productivity and salaries causes movement of labour of East-Europeanstates to the states of higher salaries. Whereas it must be taken into account that East-Europeancountries produce, as a general rule goods of lower value than in Western Europe.
Nevertheless the labour market will put in place, in due course of time the correct relation ofproductivity and salaries, but by that time new EU member states will have lost part of their preciouslabour.
The possibility of raising salaries should be analysed separately according to economic branches, jobsand professions. The countries of Eastern Europe, including Estonia, could try to model after theexperiences of developed industrial countries.
The salaries could be raised in there areas where the result (turnover and profit) is more connected tothe quality if workforce, in order to find better and more competitive employees. It should also becertainly connected to the productivity and quality of work through salaries and bonus systems.
These generalisations could also be made to other new European Union countries.

Journal of International Scientific Publication: Economy & Business, Volume 6, Part 4
ISSN 1313-2555, Published at: http://www.scientific-publications.net
300 Published by Info Invest, Bulgaria, www.sciencebg.net
REFERENCES
Code: earn_nt_net. Annual net earnings. Eurostat. Last update: 15-03-2012http://appsso.eurostat.ec.europa.eu/nui/show.do?dataset=earn_nt_net&lang=en
Code: FS008. Enterprises' value added and productivity measures by economic activity (EMTAK2008) and number of persons employed. Statistics Estonia http://pub.stat.ee/px-web.2001/Dialog/varval.asp?ma=FS008&ti=ENTERPRISES%27+VALUE+ADDED+AND+PRODUCTIVITY+MEASURES+BY+ECONOMIC+ACTIVITY+%28EMTAK+2008%29+AND+++NUMBER+OF+PERSONS+EMPLOYED&path=../I_Databas/Economy/09Financial_statistics_of_enterprises/04Enterprises_financial_key/02Annual_statistics/&lang=1 22.03.2012
Code: tin00054. Labour productivity by sector and enterprise size-class in the EU-27. Eurostathttp://epp.eurostat.ec.europa.eu/tgm/table.do?tab=table&init=1&language=de&pcode=tin00054&plugin=1 12.06.2012
Code: tps00113. Total wages and salaries total. Eurostat.
http://epp.eurostat.ec.europa.eu/tgm/table.do?tab=table&init=1&language=en&pcode=tps00113&plugin=1 12.06.2012
Code: tsieb020. Real GDP growth rate – volume. Percentage change on previous year. Eurostat
http://epp.eurostat.ec.europa.eu/tgm/table.do?tab=table&init=1&language=en&pcode=tsieb020&plugin=1 21.06.2012
Code: tsieb030. Labour productivity per person employed. Index (EU-27 = 100). Eurostat.
http://epp.eurostat.ec.europa.eu/tgm/table.do?tab=table&init=1&plugin=1&language=en&pcode=tsieb030 12.06.2012
Code: tsieb040. Labour productivity per hour worked. Eurostat.
http://epp.eurostat.ec.europa.eu/tgm/table.do?tab=table&init=1&plugin=1&language=en&pcode=tsieb040 12.06.2012
Code: WS010. Average monthly gross wages (salaries) and average hourly gross wages (salaries) byeconomic activity (EMTAK 2008) (quarters). Statistics Estonia http://pub.stat.ee/px-web.2001/Dialog/varval.asp?ma=WS010&ti=AVERAGE+MONTHLY+GROSS+WAGES+%28SALARIES%29+AND+AVERAGE+HOURLY+GROSS+WAGES+%28SALARIES%29+BY++ECONOMIC+ACTIVITY+%28EMTAK+2008%29+%28QUARTERS%29&path=../I_Databas/Economy/36Wages_and_salaries_and_labour_costs/09Wages_and_salaries/04Short_term_statistic/&lang=122.03.2012
Code: WS041. Average monthly gross and net wages (salaries) by economic activity (EMTAK 2008divisions) (quarters). Statistics Estonia
http://pub.stat.ee/px-web.2001/Dialog/varval.asp?ma=WS041&ti=AVERAGE+MONTHLY+GROSS+AND+NET+WAGES+%28SALARIES%29+BY+ECONOMIC+ACTIVITY+%28EMTAK+2008+DIVISIONS%29++%28QUARTERS%29&path=../I_Databas/Economy/36Wages_and_salaries_and_labour_costs/09Wages_and_salaries/04Short_term_statistic/&lang=112.06.2012
Code: FS0411. Enterprises productivity measures by economic activity (EMTAK 2008) at currentprices (quarters). Statistics Estonia

Journal of International Scientific Publication: Economy & Business, Volume 6, Part 4
ISSN 1313-2555, Published at: http://www.scientific-publications.net
301 Published by Info Invest, Bulgaria, www.sciencebg.net
http://pub.stat.ee/px-web.2001/Dialog/varval.asp?ma=FS0411&ti=ENTERPRISES+PRODUCTIVITY+MEASURES+BY+ECONOMIC+ACTIVITY+%28EMTAK+2008%29+AT+CURRENT+PRICES++%28QUARTERS%29&path=../I_Databas/Economy/09Financial_statistics_of_enterprises/04Enterprises_financial_key/04Short_term_statistics/&lang=1 06.06.2012
Code: WS21. Average monthly gross and net wages (salaries) by county (quarters). Statistics Estoniahttp://pub.stat.ee/px-web.2001/Dialog/varval.asp?ma=Ws21&ti=AVERAGE+MONTHLY+GROSS+AND+NET+WAGES+%28SALARIES%29+BY+COUNTY+%28QUARTERS%29&path=../I_Databas/Economy/36Wages_and_salaries_and_labour_costs/09Wages_and_salaries/04Short_term_statistic/&lang=1 12.06.2012
Code: WS31. Average monthly gross and net wages (salaries) by kind of owner of an enterprise(institution, organization) (quarters). Statistics Estonia
http://pub.stat.ee/px-web.2001/Dialog/varval.asp?ma=Ws31&ti=AVERAGE+MONTHLY+GROSS+AND+NET+WAGES+%28SALARIES%29+BY+KIND+OF+OWNER+OF+AN+ENTERPRISE++%28INSTITUTION%2C+ORGANISATION%29+%28QUARTERS%29&path=../I_Databas/Economy/36Wages_and_salaries_and_labour_costs/09Wages_and_salaries/04Short_term_statistic/&lang=1 22.03.2012
Code: YPA51. Average gross monthly salary. Statistics Estonia http://www.stat.ee/34204 12.06.2012
News release 196/2010 - 16 December 2010. Euro area hourly labour costs rose by 0.8%. Eurostathttp://epp.eurostat.ec.europa.eu/cache/ITY_PUBLIC/3-16122010-AP/DE/3-16122010-AP-DE.PDF
Tanning, L &Tanning, T 2010, `Rahvusvaheline majandus, vol. II` (International economy, VolumeII), Tallinn University of Technology, Tallinn, pp. 15-33, 51-54, 73-75, 86-88, 108-111, 235-240.
Tanning, T &Tanning, L 2011, `Analysis of Productivity and Salaries in East-European Countries`, In:Baltic Horizons No 18(115). December 2011. EuroUniversity Press, Tallinn, pp. 37–56.

Journal of International Scientific Publication: Economy & Business, Volume 6, Part 4
ISSN 1313-2555, Published at: http://www.scientific-publications.net
302 Published by Info Invest, Bulgaria, www.sciencebg.net
ORGANIZATIONAL CHANGES AND CHALLENGES OF PUBLIC ADMINISTRATION IN
THE SECTORAL MANAGEMENT OF HUNGARIAN PUBLIC EDUCATION, BETWEEN
1998 AND 2010 IN THE ASPECT OF PUBLIC POLICY
Lilla Bauer
Doctoral School of Political Science, Public Administration Sciences Subprogram,
Corvinus University of Budapest, Hungary
AbstractThis study aims to investigate the structural changes and management implementation of the maingoals of educational policy. It tries to give evidence to the failure of certain implementations ofeducational policy that were caused by the need of structural changes in the managing administrativebody; the lack of institutional conversation and the continuity of reforms; and the anomalies of thecooperation of politicians and public officers. From 1998 on, the declared main goal has been seen inthe development of a knowledge-based society, in favor of which numerous, very resource-intensivereform of the educational policy took place, in preparation of the coming joining to the EU in the fieldof education as well. The management was to become more and more fragmented and multiple,private sector was to gain a wider place in the improvement of schools’ condition, and the number ofexperts working in enterprises was to widen as well (quality assurance, teachers training). In thesectoral management, the strict sense of the centralized responsibilities of the state and the dutiesand powers under the delegation of regional jurisdictions was planned to become more sharplyseparated.
It is obvious that institutional changes were required to successfully implement the changing goals ofeducational policy in the decision-making and decision-preparing bodies of the ministry, as well as inthe supply institutes of the ministry and the different levels of the territorial administration. At thesame time, I assume that those state administration and administrative changes that took place werenot only introduced for reasons of the educational policy. I believe that many of the educational policyfailures ending by the given political cycle or processes arching over cycles with no results orgenerating more difficulties were administrative were due to organizational constraints.
Key words: Administration, Administrative reforms, Educational policy goals, Institutional need,Failure of implementation
1. INTRODUCTION
Education plays a crucial role in theories of social capital. These theories stress the importance ofmutual trust, cohesion, social norms, civic mindedness and other connections among individuals forthe well-being of societies (cf. the seminal contributions by Pierre Bourdieu 1986, James S. Coleman1988 and Robert D. Putnam 1993).
Theories of human and social capital stress the importance of education on the long run for economicand social well-being of individuals and societies. This makes an analysis of how education can be
Journal of International Scientific Publication: Economy & Business, Volume 6, Part 4
ISSN 1313-2555, Published at: http://www.scientific-publications.net
303 Published by Info Invest, Bulgaria, www.sciencebg.net
supplied in an efficient and equitable way a research topic of utmost economic and societalimportance.
My starting point is the assumption that changes in the managing of educational systems areinseparable from changes taking place in the governmental–administrative system in a wider sense. Inthe last two decades a diverse and complex restructuring of the responsibility and power relations hastaken place in Hungarian public education: decentralized educational structure have been established.
Following the changes that took place the role which is played by the state in the regulation of publiceducation systems since the 19th century has fundamentally changed and is changing right now, aswell. The state (as the public power) has a comprehensive responsibility for the functioning of thedifferent subsystems in modern democracies as well. The state is responsible for those basic socialgoals that conceptualize the process of the democratic political will-formulating to be prevailed invarious subsystems – auch as, e.g., the educational system. To reach these goals which follow fromthe role of the state a well built and continously updated public administration is needed. I am mostcertain that the complexity of our modern world demands the public policy attitude and methodologycarried out by national governments.
In the Hungarian public administration the public policy approach, what is more, the concept of publicpolicy is hardly known: instead, the traditional juridical attitude prevails. The juridical approachidentifies not the social but the juridical problem, and thus, it identifies decision-making withlegislation. In the Hungarian public administration, the view of legal and organizational authoritydominates over aim-rational approach.
Neither on the level of the whole of the government nor on the level of the ministries doing sectoralmanagement are those structural units to be found that focus on identifying exploring and solving thedemands or problems of society.
The purpose of this study is to find answers for the following questions based on the above mentioned:
How can we identify the proper functioning of the managing state administrative body in the succes orfailure of certain educational policy implementations? What kind of examples show the structural-administrative changes (either because of the complications of implementation or the failures)? Whatkind of examples show that the correlation and mutual affection between the succesful implementationof the education policy’s goals and the sectoral structural-administrative operation has beenacknowledged?
2. CHALLENGES ROOTING FROM THE RELATIONS BETWEEN EDUCATION ANDPUBLIC ADMINISTRATION
“National governments of nearly all colours, embarrassed by responsibilities they cannot or will notdischarge, are devolving authority to lower levels and loosening the grip of public bureaucracies onthe provision of some services. Others are wholly privatised. At times central government abets thesechanges simply by tolerating local experientation, waiving formally – or through inaction – theirstatutory rights to specify how programmes are administered.” (Sabel, 2001)
In more countries, public administrative reforms were consciously introduced following the logicabove and arching through more electoral cycles, often referred to as “New Public Management”.Based on the literature specialized on public administrative reforms (Hood, 1955; Pollitt-Bouckaert,2000) we can contrast the New Public Management to the ordinary or “old” public administration in
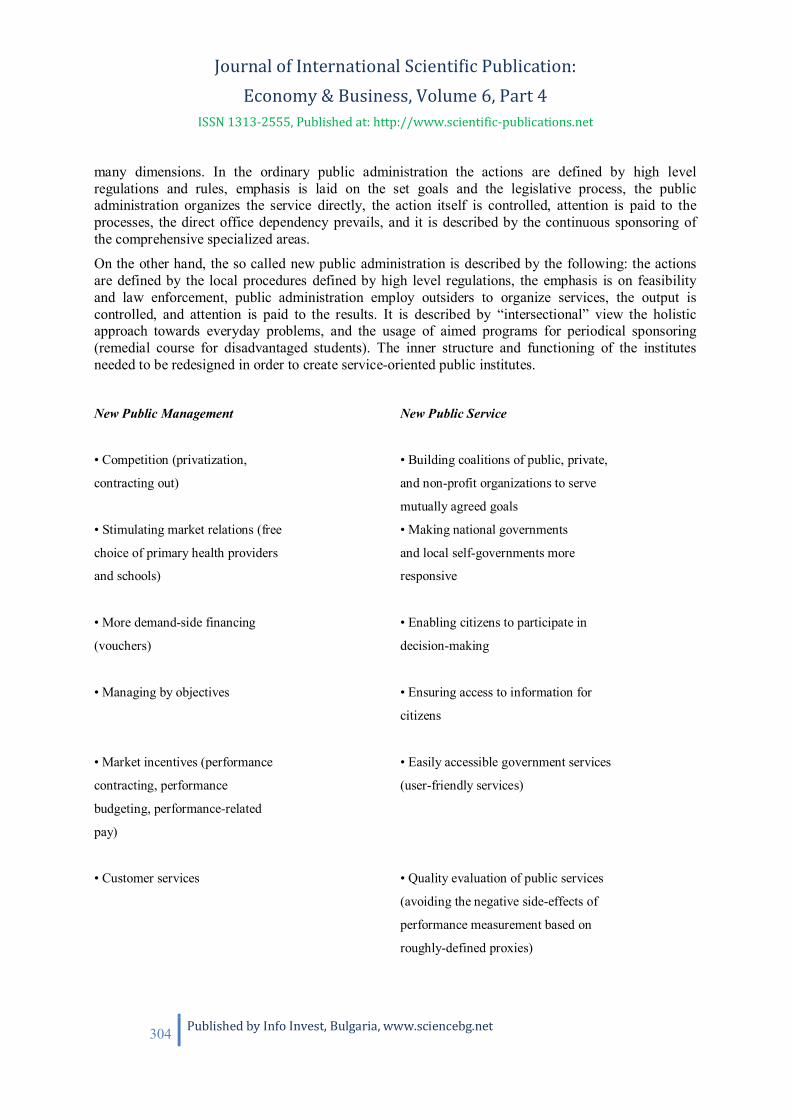
Journal of International Scientific Publication: Economy & Business, Volume 6, Part 4
ISSN 1313-2555, Published at: http://www.scientific-publications.net
304 Published by Info Invest, Bulgaria, www.sciencebg.net
many dimensions. In the ordinary public administration the actions are defined by high levelregulations and rules, emphasis is laid on the set goals and the legislative process, the publicadministration organizes the service directly, the action itself is controlled, attention is paid to theprocesses, the direct office dependency prevails, and it is described by the continuous sponsoring ofthe comprehensive specialized areas.
On the other hand, the so called new public administration is described by the following: the actionsare defined by the local procedures defined by high level regulations, the emphasis is on feasibilityand law enforcement, public administration employ outsiders to organize services, the output iscontrolled, and attention is paid to the results. It is described by “intersectional” view the holisticapproach towards everyday problems, and the usage of aimed programs for periodical sponsoring(remedial course for disadvantaged students). The inner structure and functioning of the institutesneeded to be redesigned in order to create service-oriented public institutes.
New Public Management New Public Service
• Competition (privatization,
contracting out)
• Building coalitions of public, private,
and non-profit organizations to serve
mutually agreed goals
• Stimulating market relations (free
choice of primary health providers
and schools)
• Making national governments
and local self-governments more
responsive
• More demand-side financing
(vouchers)
• Enabling citizens to participate in
decision-making
• Managing by objectives • Ensuring access to information for
citizens
• Market incentives (performance
contracting, performance
budgeting, performance-related
pay)
• Easily accessible government services
(user-friendly services)
• Customer services • Quality evaluation of public services
(avoiding the negative side-effects of
performance measurement based on
roughly-defined proxies)
Journal of International Scientific Publication: Economy & Business, Volume 6, Part 4
ISSN 1313-2555, Published at: http://www.scientific-publications.net
305 Published by Info Invest, Bulgaria, www.sciencebg.net
• Strategic planning
• Performance measurement
• Deregulations, standards
• Reducing and modernizing public
employment
Table 1. The Instruments of NPM and NPS
According to Jenei (Vezetéstudomány, 2004) the cooperation and strategic partnership of publicofficers and politicians are needed for these reform processes to be realized.
The reform processes in the majority of the OECD countries were characterized by being clientoriented, evaluating performance, giving preference to contractual solutions, or introducing electronicgovernment system (Governance in transition, 1995; Issues and developments in Public Management,1997).
In Hungary, these goals took priority during the public administration reform in 2006 – with littlesuccess. During 2000 our national endeavors towards public administration’s upgrading were aimedmore at the revision of the authorities of the different levels of public administration, the strengtheningof public administrative staff, or the revision of the existing regulations (including the law-harmonization with the EU).
3. UTILITIES FOR PRACTICING THE GOOD GOVENANCE – CIVIK SERVICE LAWS
To accomplish the functioning complexity and stand up to the challanges arising from the need toreach the well-being of citizens, modern democracies invented a new art of government, named goodgovernance. Every state that promotes human rights, equity, transparency, accountability has to –independently from their political attitude – follow this method of governing. I do not wish to enterinto details of this theory, but we must take a look at how its basic elements define the managementtrajectories in the so-called transition countries that force out the modernization of publicadministration. According to these, from the middle of 1990s, reform processes take off in the CEETransition Countries. There is a juridical, human resource and managment aspect for these publicadministrational reforms, driven through by for example Civil Service Laws (CSL).
Civil Service Laws are essentially about management in the public administration. Their purpose is topromote the creation of a new professional ethic built on accountability and transparent values,dedicated to the delivery of public services in a cost effective way, to the best standard, for the wholepopulation. The detail of the law will concern definitions, authority, rights, responsibilities and soforth, but the goals are to facilitate good governance, to ensure the delivery of public benefits,impartially and at reasonable cost, and to establish government as a model employer.
The reform of public administration, and the implementation of a Civil Service Law and its associatedsecondary legislation or regulatory instruments, must be built on the development of human resources.This implies a large investment in training and education:

Journal of International Scientific Publication: Economy & Business, Volume 6, Part 4
ISSN 1313-2555, Published at: http://www.scientific-publications.net
306 Published by Info Invest, Bulgaria, www.sciencebg.net
- to enhance the value placed on, and the prestige earned by, the new generation of civil servants;
- to achieve visible and measurable improvements in standards of performance and service;
- to match improvement in professional integrity and ethical standards with commensurate rewards.
As for Hungary, the Civil Service Law of 1992 provided the early basis for the development of acareer-based professional and politically neutral civil service, but the legal framework includesnumerous other laws and regulations which deal with specific areas and professions. The personnelfunction is largely decentralised to the level of the employing authority within government, with noministry responsible for the overall policy.
The career-basis of civil service was strengthened in 1997 through the introduction of the basic publicadministration examination, and in 1998 through the special public administration examination.Exemption was granted to law graduates and a few others, but they were otherwise compulsory fornew entrants, and for senior positions, respectively. National coordination was achieved through theHungarian Institute of Public Administration which is responsible for the standards and trainingpreparation, although the implementation is decentralised to the county level. Both levels ofexamination have a strong emphasis on law.
4. GOAL SETTINGS OF THE EDUCATIONAL POLICY
The art of governing can be succesful only when clear public policy goals are set. As for a certain filedof public policy – in our case the educational policy -, further fine-tuning is required. The goals ofeducation policy are usually two-fold, encompassing both goals of efficient allocation and goals ofequitable distribution. The extent to which each of these goals should be pursued is a matter ofpolitical choice and as such beyond scientific evaluation.
What scientific analysis can deliver, though, is an evaluation of how these goals either may or may notbe achieved, and of the relationship between the two goals. Of course, goals of efficiency and equityare not restricted to education policy. However, a combined policy perspective that would also addressother policies such as social policies, labour market policies and immigration policies and determinejoined policy solutions lies beyond the scope of the current analysis, which explicitly focuses oneducation and training policies.
As per a European Commission report: “The concept of efficiency relates the outcome of a process toits input. A system is said to be efficient if a maximum output is obtained from given input, or if agiven output is obtained with minimum input. Efficiency has thus to do with the ratio between outputand input: How much do we get for what we put into the system? The analysis of efficiency thus dealswith a comparison of costs and benefits.
The output may either be measured as a goal within the education and training system, such asachievement scores or completion rates, or as a goal outside the education and training system, such asemployment probabilities or earnings returns on the labour market. There are two main aspects of anefficient resource use. First, efficiency is about allocating efficiently between different kinds ofresources – e.g., between teachers and blackboards, or between more teachers per student and better-qualified teachers – that is, about choosing the most efficient input mix (allocative efficiency). Second,efficiency is also about using each resource efficiently, that is, making the best use of each given input(technical efficiency).
Journal of International Scientific Publication: Economy & Business, Volume 6, Part 4
ISSN 1313-2555, Published at: http://www.scientific-publications.net
307 Published by Info Invest, Bulgaria, www.sciencebg.net
The assessment of efficiency in education and training has both an external aspect, where investmentsin education are compared to alternative investments outside the education system, and an internalaspect, which refers to the internal functioning of the education and training system.”
Educational policy is the usage of the available power and resources for educational management inorder to change or influence the behavior of the actors and institutes of the education according to thefoundations of public policy: to change, in a way by repairing it. A comparative study done at the endof 1990’s including five Middle-European countries identified seven fundamental public policy goals– Quality/Success, Efficiency, Fairness and Equal Opportunity, Transparency and Accountability, thePossibility of Personal Choice and Multiple Supplies, Stability and Predictability, Adaptability - thosesuccess can be measured in the field of education. According to this study, in the Hungarianeducational system, ensuring Possibility of Personal Choice (part of which is the wide supply) andAdaptability become realized on a relative high level, while goals of Fairness and Equal Opportunityand Stability and Predictability were fulfilled on a below average level (Pesti szerk., 2006).
5. WHAT IS EDUCATIONAL POLICY? – BY PETER RADO„Making the distinction between politics and policy is not easy due to the lack of separate words inmost European languages. Therefore, the discussion on educational policymaking and implementationin decentralized education systems should start with a definition. However, since providing anoverview of the large number of definitions produced by the literature goes far beyond the purpose ofthis reading, a definition (extracted from various attempts at definition) is offered here that is easilytranslated to the activities in the practice. Educational policy is the use of authority and resources atthe disposal of the governance of education to change or influence the behavior of the actors andinstitutions of education in order to solve problems. If this definition is unpacked a little bit, there arealready a few simple messages that it carries. First of all, educational policy is a public policy area,that is, it flows from the authority of constitutional governance and the political mandate for the use ofpublic resources. The second message is the aim of policymaking: change for the sake of problemsolving. Thirdly, policymaking is mainly an indirect instrument; it works through the changedbehavior of others, such as teachers, parents, mayors, etc.”
This is an ideal-typical approach towards governanace and implementation; and political decisions andinstitutional (public administrative) decisons; and last but not least the difference between politiciansand leader civil servants. I agree with Peter Rado in a sense, that: ” …policymaking in a decentralizededucation systems is a sophisticated art of change management on a systemic scale. But still, the focalpoint of policymaking is governance and management: the legal mandate deployed to the differentgovernance and management actors determines their policy responsibilities. Therefore, it is not onlythe national level that makes and implements policies; all management actors that face problems thatcall for initiating any sort of change within the realm of their responsibilities are policymakers: localand schools’ policies are no less relevant than those developed at the national level. Educationalpolicymaking being a governance instrument, in decentralized education systems the general aim ofpolicies is not different: at the national level policies influence the connected local and institutionalmanagement cycles, while local policies address the management cycles of schools. In the followingpages we will concentrate on policymaking and implementation at the national level, because the fullscale of underlying concepts and the possible instruments are relevant only at the level ofgovernments. However, it is important to bear in mind that the same concepts and instruments apply atlower levels, although with certain limitations”. In addition to his words, I would like to add that theroot of the failure we can experience is the disharmony that occured in the cooperation between

Journal of International Scientific Publication: Economy & Business, Volume 6, Part 4
ISSN 1313-2555, Published at: http://www.scientific-publications.net
308 Published by Info Invest, Bulgaria, www.sciencebg.net
politicians and civil servants; although the responsibilities are clearly set by regulations, reality showsanother picture displaying diffuse methods. Furthermore, what I have inclined once, is that policymaking procedures do not meet in time and space, thus they cannot be coincident and coherent”.
6. INSTITUTIONAL – ORGANIZATIONAL NEEDS AND FAILURES IN THE PROCESS OFEDUCATIONAL POLICY
Why do we have to study the management trajectories when we try to understand the functioning ofpublic policies? It is basically required that different processes of policies meet and in time they areharmonized. The allocation of public funds needed to carry out the decisions of educational policy canstart with the definition of the given years financial act for the government taking up office.The fund,however, is available only from the January of the year following the year of the successful election,and it is only auditable after the harmonization of funds and entitlements whether the organizationalstructure implementing political decisions is able to realize the decisions in an effective and efficientmanner.
In those countries that went through a regime change, like Hungary exactly that attitude has not beenrooted that is based on both fiscal rationality and national responsibility and could be the basis ofpublic policy decisions and actions that are in the case of educational policy meant to be mainly long-term, arching through governing cycles. The political conceptions of those parties struggling forpolitical power manifest themselves in public policy promises and programs.
For example, planning, negotiating, and approving the annual education budget of a country arepolitical decisions. At the same time, allocating the funds a well-functioning administrative body orinstitute is required to be able to make numerous small decisions that are dedicated to different levelsof hierarchy of the educational system. For more details regarding the allocation of responsibilities,see chart on next page.
“While in the OECD countries the main motivation is the globalization, the problems of effectivityand efficiency in the duty fulfillment of the state, the democratic deficit and the improving demand ofthe society for quality services, in Hungary beside the problems coming from the question ofeffectivity and efficiency – these motivations are the “transformation challenge” rooted from thecomplete social-economical transfer and the need for integration. The most important of those isIDEA, the official program of the Ministry of Internal affairs that was launched in the autumn of 2002,and commits itself on “decentralizing the central power, fulfilling the decentralization process”, theprinciples of “good governance” and the questions of a regional reform clearly take form in its goalsettings and ideology. The anomalies of the Hungarian public education management and publicadministration are basically identical: fragmented self government structure on the level ofsettlements, the lack of or weakness of midlevel, strengthening, a central level non-committed forsubsidiarity and the lack of partnership. Abolishing these problems requires measures both for theoverall renewal of public administrative system and specific, sectoral measures as well” (Balázs-Palotás, 2009).
Because of the political and interest differences, only certain measures of those concepts could beimplemented. It was also a failure, that the government fulfilled its intentions of reforms onlyfollowing fiscal objectives, that it completely ignored the public duties of the ministry and its supplyinstitutes, just like their professional, institutional, personal needs, furthermore there was noconsultation with the apparatus and the lobbies. These were the results of a study carried out by theMTA Sociological Research, which tried to find answers to what were the direct reasons for the
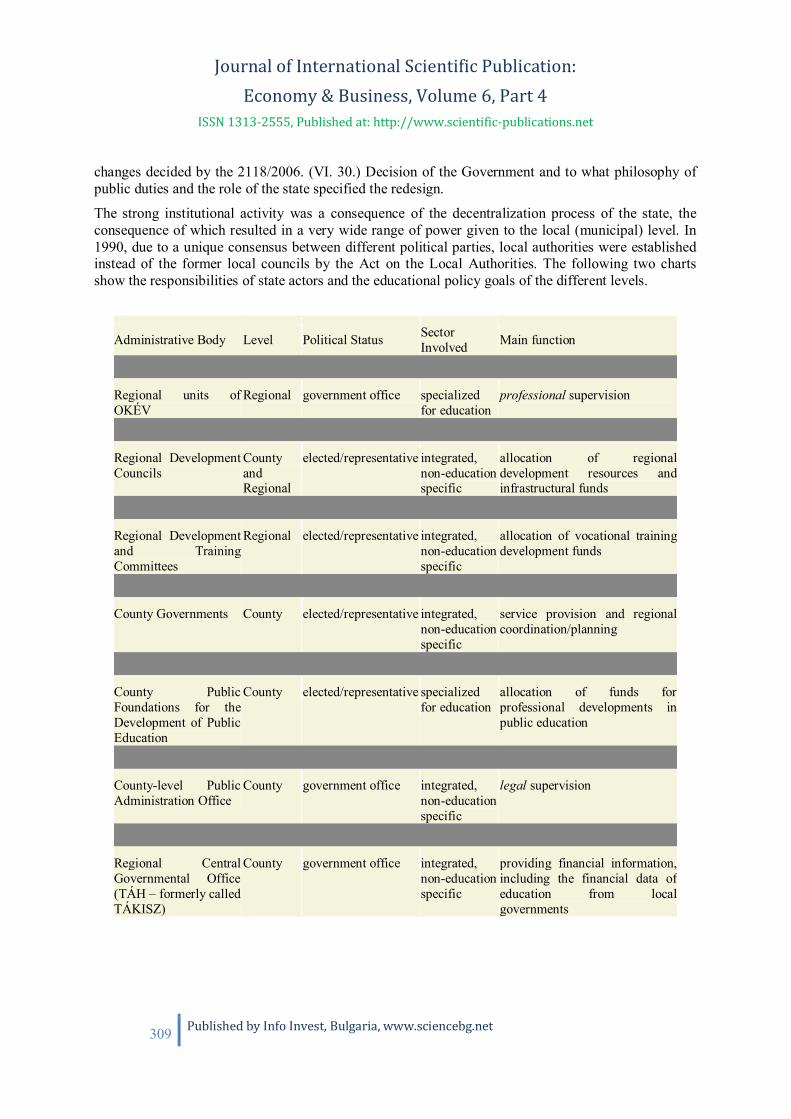
Journal of International Scientific Publication: Economy & Business, Volume 6, Part 4
ISSN 1313-2555, Published at: http://www.scientific-publications.net
309 Published by Info Invest, Bulgaria, www.sciencebg.net
changes decided by the 2118/2006. (VI. 30.) Decision of the Government and to what philosophy ofpublic duties and the role of the state specified the redesign.
The strong institutional activity was a consequence of the decentralization process of the state, theconsequence of which resulted in a very wide range of power given to the local (municipal) level. In1990, due to a unique consensus between different political parties, local authorities were establishedinstead of the former local councils by the Act on the Local Authorities. The following two chartsshow the responsibilities of state actors and the educational policy goals of the different levels.
Administrative Body Level Political Status SectorInvolved Main function
Regional units ofOKÉV
Regional government office specializedfor education
professional supervision
Regional DevelopmentCouncils
CountyandRegional
elected/representative integrated,non-educationspecific
allocation of regionaldevelopment resources andinfrastructural funds
Regional Developmentand TrainingCommittees
Regional elected/representative integrated,non-educationspecific
allocation of vocational trainingdevelopment funds
County Governments County elected/representative integrated,non-educationspecific
service provision and regionalcoordination/planning
County PublicFoundations for theDevelopment of PublicEducation
County elected/representative specializedfor education
allocation of funds forprofessional developments inpublic education
County-level PublicAdministration Office
County government office integrated,non-educationspecific
legal supervision
Regional CentralGovernmental Office(TÁH – formerly calledTÁKISZ)
County government office integrated,non-educationspecific
providing financial information,including the financial data ofeducation from localgovernments

Journal of International Scientific Publication: Economy & Business, Volume 6, Part 4
ISSN 1313-2555, Published at: http://www.scientific-publications.net
310 Published by Info Invest, Bulgaria, www.sciencebg.net
Table 2. Actors of public education administration at regional level (Halász – Lannert, (Palotás) 2003.)
Level Operational planning Planning for development
National Annual planning of the school
year (examinations, evaluation,
centrally administered
assessments, etc.)
Thematic government strategies
(LLL, social inclusion, etc.)
Sectoral development strategies
Subsectoral development strategies
(e.g., vocational education
development strategy)
Subsectoral thematic strategies
(e.g., special needs inclusion strategy)
Strategies of large-scale development
programs
Regional Territorial development (NUTS 2)
School network planning (NUTS 2 or 3)
Local Annual operational planning Mid-term thematic planning
(e.g., equal opportunity plans)
Mid-term operational planning
(quality management planning)
School Annual operational planning School development plan (if not
included in quality managementprogram)
Mid-term operational quality
mangement program
Pedagogical program or school
curriculum
Table 3. Multilevel Planning System in Education (Péter, Radó, 2010.)
The fundemental developments are appropriately characterized and summarized by Balázs – Hermann// as follows // so it will be worth citing them: „Contrary to the former local bodies, the new ones hadreal responsibilities, independently from the state (and the central party).
The ownership of the schools shifted from the state to local authorities: local and county governmentsnow maintain more than 90% of the schools, whilst the rest includes church, foundation and privateschools. By the law, local governments have to undertake obligatory public education services, but
Journal of International Scientific Publication: Economy & Business, Volume 6, Part 4
ISSN 1313-2555, Published at: http://www.scientific-publications.net
311 Published by Info Invest, Bulgaria, www.sciencebg.net
they are free to choose their methods: for exanple by establishing new schools; maintaining theexisting one; initiating joint schools and so on.
Offering territorial level education services (for example maintaining secondary schools, youthhostels, professional expertise) was a free choice for local authorities but an obligatory task of thecounty authorities. This inconsistency—generated by the Act on Local Authorities - has had, and stillhas, many problems in territorial education administration.
The decentralization of state administration resulted in more than 3 200 autonomous local authorities,amongst which nearly 2 500 became school owners.
This change, which was worth as much as a constitutional one, established autonomous local
bodies, empowering them to decide on the local society and economy. But this process was not a partof a coherent constitutional change, because many regulations did not perfectly fit into the logic of adecentralized state system.”
7. BASIC DEMANDS OF POLICY MAKING
Public policy is not an act for once; it is a continuously operated and institutionalized function. Theprocess has many idealtypical approaches. One of those is the so-called rational approach (D. Stone,2001), according to which public policy is a rational line of steps following and based on each other.In the centre of this approach lie policy making and the technology of implementation. Politicalscience, public management, law and public policy analysis all consider their mission to set publicpolicy free from the allegedly “irrational” influence of politics, in order to help shape public policywith the help of scientific methods based on rationality and analysis. The incremental approachrepresents a different thinking, as it believes, the actors behavior in public policy is not predictable.The parts of the educational policy’s process are: 1. identifying those educational political problemsneeding intervention 2. planning of educational policies, designating the goals and the tools attached tothem 3. educational political deal and formal decision 4. implementation of educational policy 5.evaluation of educational policy. These 5 elements designate the company of those questions that haveto be asked in connection with every particular educational political initiative or basically, thefunctioning of every legitimate government – apart from those approaches mentioned above.
The evaluation of the educational political processes – according to the list of the five parts above –was neglected even in one governmental cycle, and when a government change happened, apart fromthe formal handover-takeover, no real handover of knowledge capacity or professional calling toaccount took place.
Educational policy is nothing more than solving those problems that require intervention from thestate. State capacity is the ability to translate the intention of the state to a (public) policy, or the abilityof the state concerning a collective act – with the least possible cost for the society – both includingthe administrative capacity of state officers and the deeper institutional mechanisms. (van Deveer,Dabelko, 2001.) In the United States, public political decisions are born as an act of a formal politicaldecision making process, thus they are political decisions. On the contrary, in (continental) Europe theplace of public policy making is the central public management, thus making the public politicaldecision a public management decision based on political authorization.
The privileged place of the central sectoral management is maintained because every actor of thepublic policy system adjusts to it. Ministries operate the professional consulting mechanism of the

Journal of International Scientific Publication: Economy & Business, Volume 6, Part 4
ISSN 1313-2555, Published at: http://www.scientific-publications.net
312 Published by Info Invest, Bulgaria, www.sciencebg.net
public policy making, the dealing process with the different groups of interest. For the ministries, thebackground of the information and knowledge of the public policy decisions is provided by their ownagencies and institutes; the most important customer of public policy evaluations is publicadministration and not politics. The Ministry of Education is the most important partner of those whomaintain schools and market actors (National Educational Press and other presses, professionalservices, consultant agencies, etc.) as the preparer of legislative and financial decisions. Thus, theMinistry of Education creates a special surface that makes visible the system of relations between theeducational sector and the political decision making system, and at the same time it negotiates betweenthem in a directing way.
Parallel to the growing complexity of education systems, the complexity of educational policies is alsoincreasing. As a result, the information and knowledge demand that policymaking generates is alsogrowing. In those European countries where there is a long tradition of cooperation among academicresearch and policymakers educational policy analysis is rarely institutionalized. By contrast, inCentral and South Eastern European countries, where education science and empirical research ineducation is rather limited and cooperation between governments and researchers is more problematic,there is a need to institutionalize the knowledge management for policymaking. In certain countries,this function is institutionalized in universities, in several countries independent NGOs are doingpolicy research and analysis, while there are others where ministries of education establish an internaleducational policy department or within an institution affiliated with the ministry.
Putting policies into effect may happen according to two distinct logics: in a top-down manner bywhich central initiatives are rolled through the education system, and in a bottom-up manner, by whichlocal but sporadic existing good practices are scaled-up to the entire system along central policypriorities. Although the devotees of democratic principles would immediately opt for bottom-upimplementation just because of its direction, it is important to see that the great majority of policies areimplemented top-down because the initiative comes from the center, even in decentralized systems.
As far as Top-down manner is concerned, Hungary introduced for example, school-based qualityassurance in a large-scale development program in 1,700 schools that opted into the program on avoluntary basis. When the program phased out, an amendment to the legislation made running qualitymanagement systems mandatory for all schools. Bottom-up implementation is the transferring of goodpractices that exist in a school to all other schools with similar problems on the basis of central policypriorities. In other words, it is the systemic scaling-up of good practices.
Policymaking in education is a high-quality governance activity, if it is open and evidence-based. Inmore concrete terms, the requirements of the quality of the educational policy process are: (i) policiesshould address well-documented and well-understood problems, (ii) policies are to operate withinstruments that have the potential of affecting the behavior of actors in the desired way within thespecific context, (iii) policies are able to gain the support of the most important stakeholders, (iv) theimplementation of policies should be based on a strategy that fits both the context and the purpose, andis managed in an effective way, and (v) the policy process and the impact of the policies should beevaluated and the results of evaluation are fed back to policymakers.
High-quality policymaking and implementation is not a simple question of the capacities of theparticipating actors; it requires that various systemic conditions should be in place. Apart from all thefunctional governance instruments, transparency, systematic monitoring of the education system,policy evaluation, self-organized stakeholder groups, open and institutionalized policy consultation,and intensive international cooperation are all essential conditions. (see Rado, 2010.)

Journal of International Scientific Publication: Economy & Business, Volume 6, Part 4
ISSN 1313-2555, Published at: http://www.scientific-publications.net
313 Published by Info Invest, Bulgaria, www.sciencebg.net
8. POLICY – PUBLIC POLICY, POLITICIANS - BUREAUCRATS
After the regime transition the Hungarian educational management followed the continentalprocedure, and the institution system between management and lobby was built up; however, thelegitimate connection between politicians and public officers (for example, the public officer was notallowed to be member of any party) actually meant the overpower of the politician, what’s more, thebounds of real interest groups of the bargain processes of the public policy was kept in the shadows bythe power games.
All these analyzes are conducted deeper Vass and Jenei // as follows // so it will be worth citing them:„After 1990 the new political parties not only restricted the autonomy of the public administration, butalso politicized the activities of the bureaucracy. The result of the impact of the new parties was adecrease in the professionalism of bureaucracy. It means that the legal-rational principle of theWeberian theory on bureaucracy was only partly accomplished. It turned out that no imitation of anyWestern models is possible, because of the impact of the Byzantine historical heritage. It resulted inthat the legal- institutional framework was set up, but the political behaviour was not adequate to theframework and it caused serious deficiencies.” (Jenei, 2009.)
„A typical child-disease of the new, inexperienced ministers in Hungary that minister require theministerial bureaucracy to be loyal to the governing political party.(The latest example: after theelections a leader of the junior coalition party introduced the newly appointed minister to theministerial apparatus. Showing the helpfulness, he offered party-assistance to the bureaucrats in theirwork…)” (Vass, 2010).
9. SUMMARYGoverning is public policy itself. And the actual educational government is the director of educationalpolicies implementation. The knowledge of the parts of the public policy process, their identificationand their operation according to the public policy’s logic is necessary to avoid endangering thecontinuity of the process by changing any of the educational policy’s structure.
There are two relevant approaches to decentralization in education: a public administration(management) approach that focuses on the distribution of authorities among the actors at differentlevels, and the service delivery (educational) approach that focuses on the scope and extent of theautonomy of schools.
An operational approach to decentralization can be extracted from the inherent logic of the workingsof governance systems. It is partly based on the distinction between schools and their systemicenvironment, as well as on the basis of taxonomy of the separate functional governance instrumentswithin the systemic environment. (The practical relevance of these distinctions is larger indecentralized than in centralized systems.)
Horizontal decentralization means the redefinition of the role of major actors at different levels in thecourse of vertical decentralization (i.e., transferring authorities to lower levels). A core set of functions(i.e., roles) can be determined for each level of management.
The basic role of local and regional self-governments is to perform those functions that flow from thescope of their ownership over educational services that are provided locally.
Journal of International Scientific Publication: Economy & Business, Volume 6, Part 4
ISSN 1313-2555, Published at: http://www.scientific-publications.net
314 Published by Info Invest, Bulgaria, www.sciencebg.net
Management at regional levels performs various additional roles, such as territorial planning anddevelopment, deconcentrated administration, quality evaluation (professional inspection), andprofessional support services. These distinct functions are to be institutionalized separately.
In decentralized systems, governance at the national level is free from administrative decision-makingtasks and performs strategic steering and policymaking-related functions.
For the sake of ease and convenience, the definition of decentralization applied here does not includeevery possible aspect of decentralization. By decentralization we mean the delegation or devolution ofthe authority from central government agencies to the actors at the lower levels of management byinvolving non-administrative actors in decision-making. Therefore, decentralization is by definitionpower sharing. (see Rado, 2010)
After the transition, the governments management in the educational sector either the structuralchanges occurring from the public administrative reforms were in controls ignoring those processesinitiated according to previous educational policy goal settings, or there were deficiencies in planningand providing the resources. Arising from all these problems – despite the many achievements – wecan see an educational policy struggling with an “identity-disturbance”, which frame is a managinginstitute system restructured every four years or even more frequently. However, failures does notstem only from the “satisfactory” or straightforward “irrational choices” (Hirrschmann, 2000).
It is more the lack of harmony and institutional conversation between coherent elements – educationalpolicies listing goals in the name of the usefulness towards the society, the financial resourcesenabling realization, public management reforms - that causes it. The roles and the way of cooperationbetween politicians wanting to win the elections and public officers is also unclear (Pesti, 2009). InHungary, it is still unclear, what the difference is between politics and public policy (Ágh, 2004).
So far, I have been collecting the literature and the base of knowledge that is neccessary for my furtherstudies in my respective field of interest. Besides, I have asked permission to carry out a research inthe Ministry of National Resources (NEFMI) archive. I would like to have a deeper look into thosedocuments of organizational rules of operation and inner management regulations storaged there inorder to explore the motivation and inner logic of the structural chages – if there was anything of thesort at all. Are there only the automations of bureocratical mechanisms in the background, or is therean organic and rational reason behind those changes? Or, are there any coincidences with educationalpolicy goals?
REFERENCESJenei György: A közintézményi menedzsmentreformok hatása a közigazgatási modernizációra. 73-84.oldal. In: Vezetéstudomány 7-8. szám, 2004.
Ágh Attila: A közpolitika anarchiája Magyarországon, In.: Mi a politika?, Osiris, 2004.
Jenei György: Adalékok a közpolitikai szemlélet értelmezéséhez, 5-27 oldal. In: Nemzeti Érdek. 2007tavasz. I. évf. 1. szám.
Vass László: A politika és a közigazgatás viszonya, Politikatudományi Szemle XIX/3. 65–80. pp.MTA Politikai Tudományok Intézete, 2010.
Pesti Sándor: Politikusok és köztisztvisel k viszonya, politikai patronázs nyugat-európaidemokráciákban, Századvég, 32. szám, 2009. 107-139. o
Journal of International Scientific Publication: Economy & Business, Volume 6, Part 4
ISSN 1313-2555, Published at: http://www.scientific-publications.net
315 Published by Info Invest, Bulgaria, www.sciencebg.net
Rozgonyi Tamás (szerk.): Államreform, közigazgatás, háttérintézmények. Egy kutatás tapasztalatai,Gondolat Kiadó, Budapest, 2008.
Balázs Éva – Palotás Zoltán: A közoktatás rendszere, In: Jelentés a magyar közoktatásról, azOktatáskutató és Fejleszt Intézet kiadványa, Jelentés a magyar közoktatásról, 2009.
„Szakpolitikák a rendszerváltás utáni Magyarországon 1990-2006” c. könyvben (Rejtjel politológiakönyvek. Rejtjel Kiadó. 2006. 169-237. o. szerk. Pesti Sándor
Péter, Radó: Governing Decentralized Education Systems - Systemic Change in South Eastern Europe,Local Government and Public Service Reform Initiative, Open Society Foundations–Budapest, 2010
Deborah Stone: Policy paradox – The Art of Political Decision Making, New York, W.W. Norton &Company, 2001.
Lindblom, C.E. Still muddling, not yet through, Public Administration Review, 39, 1979.
Hood, C. (1995): The “New Public Management” in the 1980s: Variations on a These. Accounting,Organisations and Society, Vol. 20., No. 2/3. 93-109.
Sabel, Charles F. (2001): A Quiet Revolution of Democratic Governance: Towards DemocraticExperimentalism. in: Governance in the 21st century, OECD, Paris, 121-148. p.
Pollitt-Bouckaert: Public Management Reform: a Comparativ Analysis, Oxford University Press,2000.
Van Deveer, Dabelko: It’s Capacity, International Assistance and National Implementation, in: GlobalEnviromental Politics, 2001.
Albert O.Hirschmann: Verseng nézetek a piaci társadalomról, Jószöveg M hely Kiadó, 2000.
Bourdieu, Pierre (1986). The Forms of Capital. In: John G. Richardson (ed.), Handbook of
Theory and Research for the Sociology of Education, p. 241-258. New York: Greenwood.
Coleman, James S. (1988). Social Capital in the Creation of Human Capital. American
Journal of Sociology 94: S95-S120.
Putnam, Robert D. (1993). The Prosperous Community: Social Capital and Public Life. The
American Prospect 4 (13): 35-42.
Putnam, Robert D., John F. Helliwell (1999). Education and Social Capital. NBER Working
Paper 7121. Cambridge, MA: National Bureau of Economic Research.
Ludger Wößmann and Gabriela Schütz: Efficiency and Equity in European Education and TrainingSystems - Analytical Report for the European Commission, 2006.
Jelentés a magyar közoktatásról, 2003. Szerkesztette: Halász Gábor és Lannert JuditÉva Balázs -Zoltán Hermann: Education Management and Finance in Hungary. Efficiency, Equity and QualityProblems in the Transition Period http://lgi.osi.hu/publications/2002/96/PP_Edu_Ch2_2.pdf
György, Jenei: A Post-accession Crisis? Political Developments and Public Sector Modernization inHungary, 2009. [email protected]
http://www.uni-bamberg.de/vwl-fiwi/forschung/berg/

Journal of International Scientific Publication: Economy & Business, Volume 6, Part 4
ISSN 1313-2555, Published at: http://www.scientific-publications.net
316 Published by Info Invest, Bulgaria, www.sciencebg.net
HUMAN CAPITAL DEVELOPMENT THROUGH A COMPANY’S STRATEGY
Ieva Kozlovska, Irina Kuzmina,
BA School of Business and Finance, Deloitte Latvia and RTU Riga Business School
E-mail: [email protected]; [email protected]
Abstract
Purpose Every company performs its business based on its strategy defined. In order to complete thestrategy and successed investors’ expectations management is forced to use all resources available –financial and non-financial as well. One of the most significant ones is considered the human capital.This matter has motivated the author to study human capital role in the context of a company strategy.
Approach. Authors explore the issue of human capital and its relatedness with the strategy of thecompany based on the study Western scientific publications and analysis of Latvian practice.Particular attention is paid to the importance of human capital management (HCM) system using theexample of a Latvian retail company.
Findings. The authors’ conclusions could be useful for the company management not only whenforming the company’s human capital policies, but also developing company’s strategies (includinginvestment strategies). In case company is able to achieve its goals and strategies in the most efficientway then winners are all – starting with the company’s executives, investors, employees and endingwith whole the whole society, industry the company operates in, country, etc.
Practical implications. This article reveals the theoretical and practical relevance of the researchedtopic examines the existing approach used by Latvian company for developing its human capital inorder to ensure that all employees are working in accordance with company’s strategy. This articlemay be of interest to financial statement users, regulators and standards setters.
Key words: human capital, human capital development, company’s strategy
INTRODUCTION
Since new information age changed previous industry stage plenty of changes have been occured andevery day they continue to influence almost all companies all over the world. These significant andimportant issues (e.g. globalization, increasing mutual competition among companies all over theworld, aging workforce, technology changes, intense regulatory environments, etc.) forces companiesall over the world to look for more and more new directions and to change or develop its strategies toincrease its competitiveness and efficiency in order not only to survive, but also be successful in theglobal market place. Most advanced executives have already discovered the importance of thisassociation between company’s expenses related to its human capital and company’s corporate issues.They already discovered the key role of human capital for the company’s welfare and they definepossible solutions to find definite directions how develop its human capital.
The study aim was to explore the issue of human capital relatedness with company’s strategic goalsand examine how the Latvian company leads the development process of its human capital inaccordance with its strategy and goals.

Journal of International Scientific Publication: Economy & Business, Volume 6, Part 4
ISSN 1313-2555, Published at: http://www.scientific-publications.net
317 Published by Info Invest, Bulgaria, www.sciencebg.net
For attaining the goal set, various research methods were used during the development of paper. Themethodology of the research includes a qualitative, theoretical research approach, involving a literaturereview, collecting data from public data bases (Lursoft, Ebsco), and from European Journal ofOperational Research; data analysis and drawing conclusions. In the practical part of the articlecompany’s Y financial reports and internal information has been used also.
The theoretical focus of this study is analysis of human resource management and credit managementrelated issues, and their applications in the business environment.
The questions discussed and explored in this article reveal various existing problems in the companyrelated to effective credit management; which is considered by the authors of this article to be theeffective practical benefit of this research.
Conclusions and recommendations are based on the results of the research and taking into account thestudying the view of the investigated company’s management.
The results of the study allowed the authors to identify specific patterns in the practice as well asformulate directions for further research aimed at developing recommendations not only for Latvian,but also for other companies. This article may be of interest to financial statement users, regulators andstandards setters.
HUMAN CAPITAL AS A MAJOR RESOURCE IN ACHIEVEMENT OF A COMPNY’SSTRATEGIC GOALSToday in almost every company the workforce is the most significant user of such company’scorporate resources as information technology, real estate, etc. It was discovered that company’sexpenses related to human capital are in range from 40 percent to 70 percent of total company’soperating expenses per particular period. Usually these expenses consist of such items as monthlysalaries, various bonuses and compensations paid to employees, benefits, trainnings and coaching, etc.Therefore it is clear that today in almost every company expenses related its human capital are reallysignificant ones. Unfortunatelly, still there are plenty of executives who are only in the process torecognizing this issue and evaluate the importance of this phenomen. Only few of them understand theassociation between expenses related to the company’s human capital and company’s corporate issues.
It is ordinary practice that the company uses various tools in order to ensure efficiency in itsoperations. In recent years various systems and models have been developed and used in order tomanage various resources and processes within the company in the most effective way. Goodexamples are various financial accounting systems, sypply chain management operations and systems,manufacturing softwares, customer relationship management tools, etc. Unfortunatelly, there are noany software developed yet to lead company’s human capital. In Authors’s opinion, it is just a matterof time and it is essential for company’s management, scientists and experts to think forward andevaluate the rule of overall strategic planning by implementing top-down approach to “workforceintelligence”. This approach will ensure the possibility to focus first on identification of specificbusiness issues and only then by use of various analytical tools to convert workforce data in actionablebusiness information. This approach will assist managers to plan and lead human capital in suchactivities like recruiting, planning process of company’s workforce, safety, mergers and acquisitions,various controls, etc. By example, particular recruitment process of sales manager in internationalretail company. Nevertheless, there was revolution in field of recruitment process since web sites andonline assistance systems that authomatically conenct potential applicant and company’s human

Journal of International Scientific Publication: Economy & Business, Volume 6, Part 4
ISSN 1313-2555, Published at: http://www.scientific-publications.net
318 Published by Info Invest, Bulgaria, www.sciencebg.net
resource management were introduced, the selection process of the most suitable applicants for thissales position for the further interviews is still a manual activity for the respective company’s humanresource manager. Human resource manager spends significant part of his time to read and evaluateeach of the application received. In case of specific automated system this process could be done in themost effective and fastest way ensuring the best results and also not loosing potential employee, whocan apply and to be hired by other competitor while the selecting process for most applicableapplicants for further interviews has been performed.
Authors thinks that it is one of key issues for the company’s management to plan its workforce byconnecting by example the demand of the company’s product, future revenues and company’sworkforce together. Management should be effective enough not only to ensure in current situationthat necessary employees work in the right places and needless ones are removed or changed, but alsoto see this process from the global perspective by managing the dynamics of its workforce for the next3 or 5 years as well. Company’s management has to be the one deciding what will be the dynamic anddemography of its workforce for the next years in order to ensure the company will keep its marketpositions in the global market and decide what kind of specialists will have to be developed, deployed,etc. in order to ensure that company’s strategic goals will be reached.
In authors’s opinion the top-down approach to “workforce intelligence” is very important in today’sbusiness world since countless significant and important issues such as globalization and increasingmutual competition are taking place in the business world, aging workforce, technology changes,intense regulatory environments forces companies to find more and more new directions in order toincrease its competitiveness and efficiency in order not only to survive, but also be successful in theglobal market place. And it is very crucial for comapany’s management to find possible solutions tofind definite directions it will develop its human capital.
THE CONCEPT OF HUMAN CAPITAL DEVELOPMENT
Today more and more executives in all industries and contries all over the world evaluate importanceof human capital management within a company. They understand that company’s results andprofitability of its business mostly relies on its human capital.
Research Related to Human Capital in Scientific Literature
The Authorss of this article reviewed the research publications by foreign Authorss in order to studythe degree of this topic development in the international scientific literature. On the basis of the resultsof the theoretical study the Authorss concluded that the interests of foreign researchers are focused onthe following main research fields:
- History;- Development;- Most recent researches.
Table 1 summarizes the results of the study of the viewpoints of some foreign researchers in theresearch fields listed above.

Journal of International Scientific Publication: Economy & Business, Volume 6, Part 4
ISSN 1313-2555, Published at: http://www.scientific-publications.net
319 Published by Info Invest, Bulgaria, www.sciencebg.net
Table 1
Human capital: researchers’ views on the problemResearcher(s) Main research idea/conclusion
(by the opinion of the Authorss of the paper)
History, development of human capital, Human capital in management practice and innovations
Ndinguri, Prieto,Machtmes (2012)
Reveals current human capital development approaches and explore its importance inthe process of achieving company’s strategic competitive advantage.
Smith, Courvisanos,Tuck, McEachern(2012)
Authors find that certain human resourse practices not only support, but also evenimprove the company’s capacity of innovation. Nevertheless, at the same time there isan insignificant direct link between human resource practices and innovations. Andtherefore there is no need for definite human resource practices and the capacity forinnovations are necessary rather than sufficient conditions.
Passard C. D.,McKenna K., Vyas K.,(2012)
Stated that due to the movement from industrial to information age human capital isone of the most important assets to every company. Also, based on study performedamong persons related to accounting consider that this is a very important company’sasset and should be included whether in the balance sheet or in a separate humancapital report.
Gamerschlag R.,Moeller K. (2009)
Describe benefits company is able to to increase its financial performnace by use ofhuman capital reporting. The Authors developed a model supporting this idea.
Ployhart, VanIddekinge, Mackenzie(2011)
Authors discuss and support by the dynamic model the importance ofinterconnected human capital resources -when changes ingeneric human capital (personality, cognitive ability) bring to changes in unit-specific human capital (advanced training, experience). And further this process leadsto influences unit service performance behavior, effectiveness.
Mehra, Mookerjee(2012)
The results reveal that today for comapnies operating in the IT industry (softwarecompanies) with specialized products and services should pay attention to find newways to find open source projects that better suits to company’s business and projects.They also emphasizes that it is crucial for the company to be successful to be learningorganization.
Asaju (2012) The Authors discuss the value of different employees. The stars are ones the mostvaluable human capital for the company. Also, they found out that the performanceof these employees usually decline because of various factors.
Scharf E. R. (2012) The results of Authors’s performed search support idea the human capital is of keyelements for the development process of company’s value proposition.
Campbell B.A., CoffR.,
Krydcynski D. (2012)
Autors investigated imperferctions in the labor market. They extend theories ofhuman-capital based competive advantage of the company describing both: demand-side and supply-side of mobility constraints.
Ghalandarzehi K.,Safdarie M. (2012)
Authors by application of ednogeous economic models came to the conclusion thatthere are positive correlation between human capital and economic growth. Theystated that human capital is one of the most effective factors for economic growth(e.g. developing factories by deviding work, implement usage of benefits, increase ofmarket size, increase in productivity and capacity that are done by implementingcorresponding management policies, etc.).

Journal of International Scientific Publication: Economy & Business, Volume 6, Part 4
ISSN 1313-2555, Published at: http://www.scientific-publications.net
320 Published by Info Invest, Bulgaria, www.sciencebg.net
Razi N., More E.(2012)
Authors describe impact of a change of the effectiveness of human capital of a highperformance work system practices in the service setting.
Saba A., Bashir I.,Ahmed K., Hashim R.(2012)
Authors described the relationship between human capital and financial capital withinan organization. They stated that in case the management support its employees viavarious kind of ways (invest, empower, learn, appraise, persuade through monetraryand non-monetary rewards, etc.) the financial figures (profit) will increasesignificantly, because of strong correlation between company’s human capital andfinancial capital.
Asaju (2012) Stated that investments in human capital (at educational level) ensure thedevelopment in the particular country that further reduce the poverty.
Chan J., Brugess J.(2011)
The Authors explore some Australian IPO’s (listed 2010 and 2011) and explore howthese companies report information toward human capital. They examined that inreporting performed by these companies there are only limited information aboutcompany’s human resource reporting and strategic plans for its development.
Jack J.F. (2005) Decribes proc and cons of use ROI (return on investment) toward humancapital and defines companies using this ROI process as well.
Kuzmina, I., (2008)
The article shows the role of Intangible assets (including Human capital) inthe content of a company’s strategy and describes the methods of itsmeasurement and evaluation.
Kuzmina, I., Kotane, I.(2011)
The article shows the role of non-financial indicators in measuring intangibleassets and company’s performance management.
The results of study of foreign researchers’ opinions show that there is a new direction not only in themanagement of human capital within the organization, but also in the development of company’sreporting strategy toward human capital.
HUMAN CAPITAL PERFORMANCE EVALUATIONIn order to ensure that not only company’s strategic goals are reached, but also each of employeeshave been developed at the same time, the company develops specific human capital management(HCM) system by use of which both goals are being reached. This system ensure that also company’speople asset or human capital can be evaluated and measured and similar to other company’s assetsand its value has been increased similar with other assets by use of investments. Therefore, firstlycompany’s management regularly (e.g. every year) defines and communicates its short-term and long-term goals and performance expectations to its employees in all levels. Usually company’s humanresource manager is responsible to lead such activities as rating, rewarding and other ones to ensurethe company’s goals set will be reached. In the specific company explored it has been done by use ofemployee’s continues improvement through its career in this company ensuring that employee is ableto develop in many various directions. Special Enteriprise Resource Pkanning System (ERPS) hasbeen used where all information toward each employee has been recorded – startingfrom his yearlygoals set and self evaluating and ending with payroll and company’s government policies.
Since the employee has been seleceted, interviewed and hired short-term and long-term goals for thisemployee have been set. Usually this process has been lead by employee’s direct manager or mentor,but the whole process by responsible managers and also leadersip development manager. By use of
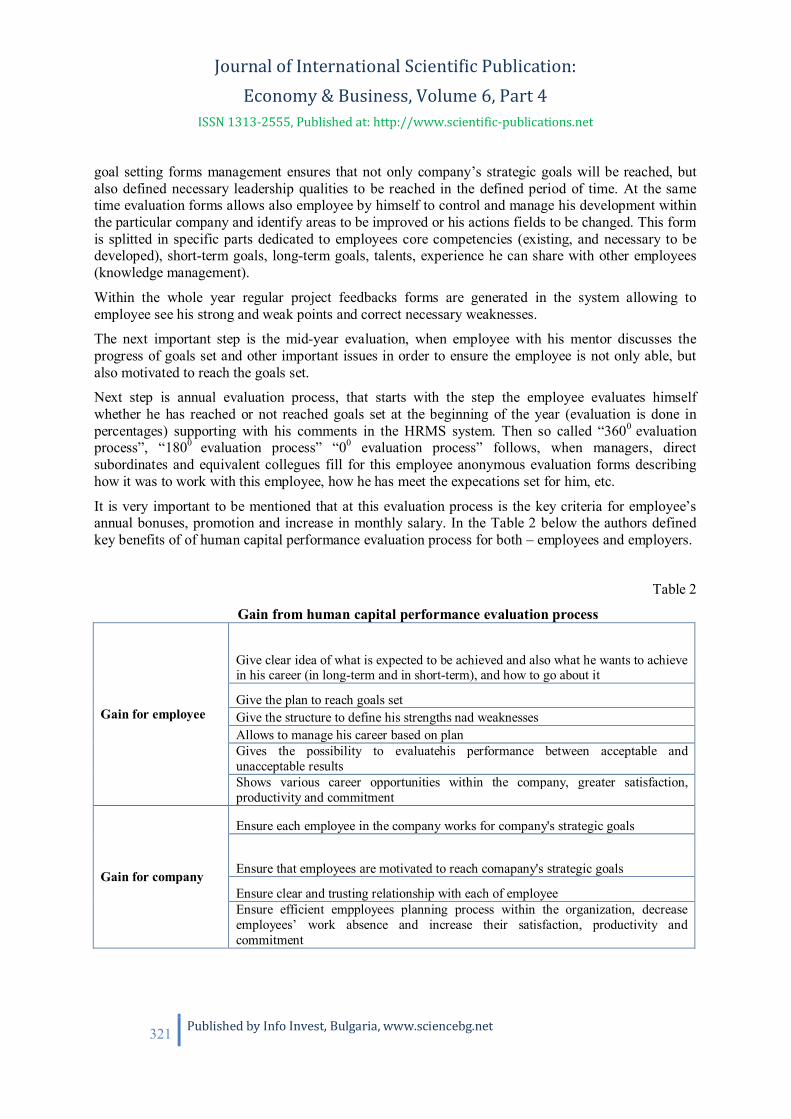
Journal of International Scientific Publication: Economy & Business, Volume 6, Part 4
ISSN 1313-2555, Published at: http://www.scientific-publications.net
321 Published by Info Invest, Bulgaria, www.sciencebg.net
goal setting forms management ensures that not only company’s strategic goals will be reached, butalso defined necessary leadership qualities to be reached in the defined period of time. At the sametime evaluation forms allows also employee by himself to control and manage his development withinthe particular company and identify areas to be improved or his actions fields to be changed. This formis splitted in specific parts dedicated to employees core competencies (existing, and necessary to bedeveloped), short-term goals, long-term goals, talents, experience he can share with other employees(knowledge management).
Within the whole year regular project feedbacks forms are generated in the system allowing toemployee see his strong and weak points and correct necessary weaknesses.
The next important step is the mid-year evaluation, when employee with his mentor discusses theprogress of goals set and other important issues in order to ensure the employee is not only able, butalso motivated to reach the goals set.
Next step is annual evaluation process, that starts with the step the employee evaluates himselfwhether he has reached or not reached goals set at the beginning of the year (evaluation is done inpercentages) supporting with his comments in the HRMS system. Then so called “3600 evaluationprocess”, “1800 evaluation process” “00 evaluation process” follows, when managers, directsubordinates and equivalent collegues fill for this employee anonymous evaluation forms describinghow it was to work with this employee, how he has meet the expecations set for him, etc.
It is very important to be mentioned that at this evaluation process is the key criteria for employee’sannual bonuses, promotion and increase in monthly salary. In the Table 2 below the authors definedkey benefits of of human capital performance evaluation process for both – employees and employers.
Table 2
Gain from human capital performance evaluation process
Gain for employee
Give clear idea of what is expected to be achieved and also what he wants to achievein his career (in long-term and in short-term), and how to go about it
Give the plan to reach goals setGive the structure to define his strengths nad weaknessesAllows to manage his career based on planGives the possibility to evaluatehis performance between acceptable andunacceptable resultsShows various career opportunities within the company, greater satisfaction,productivity and commitment
Gain for company
Ensure each employee in the company works for company's strategic goals
Ensure that employees are motivated to reach comapany's strategic goals
Ensure clear and trusting relationship with each of employeeEnsure efficient empployees planning process within the organization, decreaseemployees’ work absence and increase their satisfaction, productivity andcommitment

Journal of International Scientific Publication: Economy & Business, Volume 6, Part 4
ISSN 1313-2555, Published at: http://www.scientific-publications.net
322 Published by Info Invest, Bulgaria, www.sciencebg.net
HUMAN CAPITAL IMPACT ON COMPANY’S FINANCIAL INDICATORS
The case study will be supported by real example from international company Y (further Company Y– authors’ comment) operating in the retail industry in Latvia. The authors analyzed the credit controlpolicy of a retail company Y for the period 2011 – 2012. The employee described will be oneemployed in the field of finance and responsible for company’s credit control department. Since thecompany’s management has defined and focused on specific finance-specific competencies (e.g.employee’s previous work experience, education, skills, knowledge, abilities, motivation, etc.) itensures that his behavior will lead to the planned employee’s performance that will be in accoradancewith company’s strategic goals and values.
The credit controller has been employed in order to develop and implement credit control policy in thecompany. There is no any such a policies, credit standards, credit terms, credit monitoring used beforein the company since its establishment (more than 7 years). Due the fact, that the turnover of thiscompany has increased significantly from year to year (in year 2011: LVL23,274,440 and in year2012: LVL27,155,488), also customers including debtors increased proportionally. The total amountof accounts receivables at the beginning of year 2012 were almost LVL4, 000,000 out of whichLVL672, 744 were bad debts; the profit per this period was LVL 1,712, 282. It is really criticalamount of bad debts (39% of the profit) meaning that this money still is not a real profit, but morelikely as “unreal money”; there the authors means the money on customers’ hands. In other words itcan be even translated as “percent free loan” given to some of customers for unsettled date. At thebeginning of year 2012 there were almost 800 debtors and more than half the bad ones. Although thecompany is quite important and significant player not only in the local market, but also in the globalmarket, this figure is really dramatic one.
Uncollectible accounts belonging to customers that are not able or even not willing to pay back moneyto the company for products received have been increasing from year to year as well. Due the fact, thatthe company at the moment of sales is not able to know, how long time will take to receive cashreceipts, it is really crucial to dully estimate possible losses from uncollectible accounts and to bookthis estimate as expense in the financial year the sales have been performed; this calculated amount ofpossible losses is credit to allowance fro uncollectible amount. Usually the amount of provisionneeded is calculated very accurately and with more pessimistic point of view. Based on thecalculations, the provisions have been calculated per each quarter by following principle: 50%provision for debts older than 90 days and 100% provision for debts older than 180 days. Due theamount of debts become bigger and older, also the amount of provisions increases automatically.
The period explored is from 1st of January 2012 till 1st of December 2012. The Credit Control Policywas implemented at the end of February 2012; consequently, to value the effectiveness of new CreditControl Policy, all the figures will be compared before March 2012 and after March 2012.
Based on the figures it is obvious that the new hired credit controller does his work in the best way,and corresponding financial figures support this. Actually the successful result has been reachedbecause of highly developed company’s ERPS and effective employees’ recruitment processperformed by the company’s human resource manager.
As soon as employee was recruited the career plan has to be developed. In the goal setting form ofnew credit controller were defined key competnecies and goals to ensure the company’s new creditpolicy will be developed, implemented and ensuring the first positive results already in the firstmonths after its implementation. Based on table 2 and table 3 above it is shown that the goal settingform did the best – the employee were motivated to fulfill goals set for him that parallel ensure that the

Journal of International Scientific Publication: Economy & Business, Volume 6, Part 4
ISSN 1313-2555, Published at: http://www.scientific-publications.net
323 Published by Info Invest, Bulgaria, www.sciencebg.net
company’s strategic goals are reached either. Career planning and development for the creditcontroller supports the necessity of the match between organizational and individual employee goalsthat lead to positive results not only for the company, but also for employee itself as well. The Authorsthinks that career development of credit controller increased his motivation and profuctivity. Thereforethe company’s goal to decrease the amount of bad debts and not allow new debts develop actually hasbeen reached.
Table 3
Calculation of provisions for bad debts per period from 1st January 2012 till 30th November 2012Source: The authors’ calculations based on the company’ financial information
PROVISION -TOTAL BALTIC (LVL)
01.01.2012. 01.04.2012. 01.07.2012. 01.11.2012. 01.12.2012.
Total 145 907 161 823 203 858 174 967 172 996
Table 4
Calculation of three ratios relating to accounts receivables and bad debtors per period 1st
January 2012 till 30th November 2012
Source: The authors’ calculations based on the company’ financial information
Period Receivables Turnover Average days’ salesuncollected
Average collectionperiod, days
January, 2012 1,2 304 52
February, 2012 1,1 325 50
March, 2012 1,2 294 50
April, 2012 1,1 337 55
May, 2012 1,3 272 46
June, 2012 1,0 351 58
July, 2012 1,1 318 54
August, 2012 1,3 275 47
September, 2012 1,1 327 54
October, 2012 1,3 274 47
November, 2012 1,2 297 49
Journal of International Scientific Publication: Economy & Business, Volume 6, Part 4
ISSN 1313-2555, Published at: http://www.scientific-publications.net
324 Published by Info Invest, Bulgaria, www.sciencebg.net
CONCLUSIONS
The results of the research conducted by the authors of this article show that the topic of human capitalimportance is not only the subject for considerable debate among scholars and professionals, but it isalready necessity for every company all over the world. Therefore the authors came to the followingconclusion. The problems connected with the practical application of the various systems for thecontrol and development of company’s human capital can be explained by the fact that expense forhuman capital are in range from 40 percent to 70 percent of total company’s operating expenses perparticular period. Usually these expenses consist of such items as monthly salaries, various bonusesand compensations paid to employees, benefits, trainnings and coaching, etc. Therefore it is clear thattoday in almost every company expenses related its human capital are really significant ones.Unfortunatelly, today only few executives understand this phenomen. This conclusion is based on thepractical case – company Y.
Most sensitive and difficult matter is evaluation of employees’ competence and professional skills. Bythe opinion of the authors developing human capital performance management system within thecompany Y can be useful. A fundamental part of the performance management process is performanceand development discussion, PDD where manager helps to secure the company’s mission toaccomplish the business goals and where the employee, in co-operation with their manager, evaluatesthe previous year and prepares their own action plans for the year ahead. The PDD results will helpemployees to develop strengths and areas for improvement, to plan own career, to affect individualand team targets and in addition to take suitable training. The PDD results will help managers tosupport the individual development of employees and to plan business based on employee’scompetence, performance and development activities. Moreover, it will help to identify and managetraining needs, to provide the right needs of motivation and to identify and manage performanceconcerns.
Therefore, PDD allows transforming the business goals into individual targets for each employee, andit could be the first step by the way of creation human capital performance managemenet system in thecompany. In this case will be very interesting practical experience which is accumulated by someScandinavian banks operating in Latvia and it could be the object of further research.
REFERENCES
Asaju, K. (2012), “Human capital development and poverty alleviation in Nigeria: a symbioticoverview”, Online submission, 15. Available at:
http://web.ebscohost.com.resursi.rtu.lv/ehost/detail?vid=5&hid=106&sid=0631f5e3-4aa0-49ab-9270-d1e04fdd30df%40sessionmgr113&bdata=JnNpdGU9ZWhvc3QtbGl2ZQ%3d%3d#db=bth&AN=82028807
(Accessed 7 December 2012).
Campbell, B.A., Coff, R., Kryscynski, D. (2012), “Rethinking sustaind competetive advantage fromhuman capital”, Academy of Management Review, 37(3), 276-395. Available at:
http://web.ebscohost.com.resursi.rtu.lv/ehost/detail?vid=6&hid=111&sid=8dca4517-a66c-4c48-9de2-8f015e316b9e%40sessionmgr112&bdata=JnNpdGU9ZWhvc3QtbGl2ZQ%3d%3d
(Accessed 7 Dcember 2012).
Journal of International Scientific Publication: Economy & Business, Volume 6, Part 4
ISSN 1313-2555, Published at: http://www.scientific-publications.net
325 Published by Info Invest, Bulgaria, www.sciencebg.net
Chan, J., Brugess, J. (2011), “The reporting and recognition of human resource assets in recentAustralian IPOS”, Employment Relations Record, 11(1), 19-31. Available at:
http://web.ebscohost.com.resursi.rtu.lv/ehost/pdfviewer/pdfviewer?sid=8dca4517-a66c-4c48-9de2-8f015e316b9e%40sessionmgr112&vid=16&hid=14
(Accessed 8 December 2012).
Hill, C.W.L., Jones, G. R., (2007), Strategic Management. An Integrated Approach, Houghton MifflinCompany, Boston, New York.
Gamerschlag R., Moeller K. (2009), “Inernal benefits of human capital reporting – a theoreticalappraisal”, Proceedings of the European Conference on International Capital, 210-216. Available at:
http://web.ebscohost.com.resursi.rtu.lv/ehost/pdfviewer/pdfviewer?sid=8dca4517-a66c-4c48-9de2-8f015e316b9e%40sessionmgr112&vid=16&hid=14
(Access 8 December 2012).
Ghalandarzehi, K., Safdarie, M. (2012), “Role & status of educated human resources (human capital)on economic growth of Iran”, International Journal of Business and and Social Science, 3(11), 164-172. Available at:
http://web.ebscohost.com.resursi.rtu.lv/ehost/detail?vid=5&hid=106&sid=0631f5e3-4aa0-49ab-9270-d1e04fdd30df%40sessionmgr113&bdata=JnNpdGU9ZWhvc3QtbGl2ZQ%3d%3d#db=bth&AN=76474070
(Accessed 7 December 2012).
Jack, J. F., (2005), “Investment as long as there is a payoff”, Investing in Your Company’s HumanCapital, 73-92. Available at:
http://web.ebscohost.com.resursi.rtu.lv/ehost/pdfviewer/pdfviewer?sid=8dca4517-a66c-4c48-9de2-8f015e316b9e%40sessionmgr112&vid=16&hid=127
(Accessed 8 December 2012).
Kuzmina, I., (2008). Accounting of Intangible Assets in the Context of a Company’s Strategy,Accounting and Finance in Transition, Volume 5, Greenwich University Press, Series ISSN 1743-1999, ISBN 1-86166-252-1, London 2008, page 209-229.
Kuzmina, I., Kotane I., (2011). Non-financial indicators for evaluation of business activity,EUROPEAN INTEGRATION STUDIES, Research and Topicalities Nr.5 (2011). ISSN1822 – 8402,Kaunas University of Technology Institute of Europe. Technologija, Kaunas, 2011, p. 213-219.
Mehra, A., Mookerjee, V., (2012), “Human capital development for programmers using open sourcesoftware”, MIS Quarterly”, 36(1), 107-122-A5. Available at:
http://web.ebscohost.com.resursi.rtu.lv/ehost/detail?vid=5&hid=106&sid=0631f5e3-4aa0-49ab-9270-d1e04fdd30df%40sessionmgr113&bdata=JnNpdGU9ZWhvc3QtbGl2ZQ%3d%3d#db=bth&AN=71154845
(Access 7 December 2012).
Musaraj, A. (2011), “Albania, the human factor and sustainable development: a lesson from present”,Academicus, 4, 35-41. , available at:

Journal of International Scientific Publication: Economy & Business, Volume 6, Part 4
ISSN 1313-2555, Published at: http://www.scientific-publications.net
326 Published by Info Invest, Bulgaria, www.sciencebg.net
http://web.ebscohost.com.resursi.rtu.lv/ehost/resultsadvanced?sid=0631f5e3-4aa0-49ab-9270-d1e04fdd30df%40sessionmgr113&vid=4&hid=106&bquery=human+capital&bdata=JmRiPWE5aCZkYj1idGgmZGI9aWloJmRiPWVyaWMmZGI9aGV2JmRiPThnaCZkYj1oeGgmZGI9aGNoJmRiPWx4aCZkYj1mNWgmZGI9Y21lZG0mZGI9bmZoJmRiPWJ3aCZkYj1hcGgmZGI9dHJoJnR5cGU9MSZzaXRlPWVob3N0LWxpdmU%3d
(Accessed 7 December 2012).
Ndinguri, E., Prieto, L, and Machtmes, K. (2012), “Human capital development dynamics: theknowledge based approach”, Academy of Strategic Mangement Journal, 11(2), 121-136. Available at:
http://web.ebscohost.com.resursi.rtu.lv/ehost/pdfviewer/pdfviewer?sid=0631f5e3-4aa0-49ab-9270-d1e04fdd30df%40sessionmgr113&vid=6&hid=106
(Accessed at: 7 December 2012).
Razi, N., More, E., (2012), “Human capital and performance management in high performing serviceindustry: a case of the impact of an acquisition”, Journal of Accounting,Business & Management,19(2), 14-43. Available at:
http://web.ebscohost.com.resursi.rtu.lv/ehost/detail?vid=6&hid=106&sid=0631f5e3-4aa0-49ab-9270-d1e04fdd30df%40sessionmgr113&bdata=JnNpdGU9ZWhvc3QtbGl2ZQ%3d%3d#db=bth&AN=820288
(Access 7 December 2012).
Passard, C. D., McKenna, K., Vyas, K., (2012), “Accounting for Human Capital: Is the Balance SheetMissing Something?”, International Journal of Business & Social Science, 3(12), 61-64. Available at:http://web.ebscohost.com.resursi.rtu.lv/ehost/detail?vid=6&hid=106&sid=0631f5e3-4aa0-49ab-9270-d1e04fdd30df%40sessionmgr113&bdata=JnNpdGU9ZWhvc3QtbGl2ZQ%3d%3d#db=bth&AN=77707699
(Accessed 7 December 2012).
Ployhart, R. E., Van Iddekinge, C.H., and Mackenzie, Jr, V. I. (2011), “Aquiring and developinghuman capital in service contexts: developing human capital in service contexts: theinterconnectedness of human capital resources”, Academy of Management Journal, 54(2), 353-368,available at: http://web.ebscohost.com.resursi.rtu.lv/ehost/detail?vid=5&hid=106&sid=0631f5e3-4aa0-49ab-9270-d1e04fdd30df%40sessionmgr113&bdata=JnNpdGU9ZWhvc3QtbGl2ZQ%3d%3d#db=bth&AN=60263097
(Acessed 7 December 2012).
Saba, A., Bashir, I., Ahmed, K., Hashim, R. (2012), “Correlation between human capital and financialcapital in developing countries: case of Pakistan”, Interdisciplinary Journal of ContemporaryResearch in Business, 4(2), 676-686. Available at:
http://web.ebscohost.com.resursi.rtu.lv/ehost/detail?vid=5&hid=106&sid=0631f5e3-4aa0-49ab-9270-d1e04fdd30df%40sessionmgr113&bdata=JnNpdGU9ZWhvc3QtbGl2ZQ%3d%3d#db=bth&AN=83518168
(Accessed 7 December 2012).

Journal of International Scientific Publication: Economy & Business, Volume 6, Part 4
ISSN 1313-2555, Published at: http://www.scientific-publications.net
327 Published by Info Invest, Bulgaria, www.sciencebg.net
Scahrf, E. R. (2012), “Value proposition and Human Capital: strategic marketing practices”, RevistaBrasileira de Gestão de Negócios, 14(43), 216-233. Available at:
http://web.ebscohost.com.resursi.rtu.lv/ehost/detail?vid=10&hid=15&sid=8dca4517-a66c-4c48-9de2-8f015e316b9e%40sessionmgr112&bdata=JnNpdGU9ZWhvc3QtbGl2ZQ%3d%3d#db=bth&AN=79433883
(Accessed 7 December 2012).
Smith, A., Courvisanos, J., Tuck, J., and McEachern, S. (2012), „Building the Capacity toInnovate:TheRole of Human Capital. Research Report”. „National Centre of Vocational Education Research(NCVER)”, 43.
http://www.evf.lu.lv/fileadmin/user_upload/lu_portal/projekti/evf/konferences/maijs_2012/Session2/Bumane.pdf
(Accessed 10 July 2012).

Journal of International Scientific Publication: Economy & Business, Volume 6, Part 4
ISSN 1313-2555, Published at: http://www.scientific-publications.net
328 Published by Info Invest, Bulgaria, www.sciencebg.net
THE EFFECTS OF THE TRANSITION TO IFRS ON PRUDENTIAL REQUIREMENTS
REGARDING CREDIT RISKChitan Gheorghe
Academy of Economic Studies, Ion N. Angelescu building, Romana square no.6,
District 1, Bucharest, Romania
Abstract
The study examines, at the level of the regulatory framework in Romania, the method for determiningthe depreciation adjustments applied with the adoption of IFRS, comparative to the method ofdetermination of prudential adjustments as laid down in prudential regulations and also present themeasures adopted by the regulatory authority to mitigate the differences between these two methods.The study highlights that the provisions for impairment depends on the subjective character of theassessment made by managers and the value of accepted collateral. Also, in case of standardapproach for determining capital requirements for credit risk, IFRS adoption, leads to higher capitalrequirements, but also to an increase of own funds due to lower impairment adjustments comparedwith prudential adjustments.
Key words: impairment, IFRS, prudential filters, credit institutions
1. INTRODUCTION
In context of globalization of financial activity, the need to use the same standards for the preparationof financial statements had become stringent in order to understand and ensure the inter-comparabilityof information. In this regard also frames the decision of banking regulatory authority in Romaniaregarding the adoption of International Financial Reporting Standards (IFRS) as of January 1, 2012(NBR Order no.9/2010) following the procedure set out in the Regulation (EC) No .1606/2002.
As stated in Financial stability report, 2012, among benefits of IFRS implementation are included:decrease of regulatory costs, assurance of a consolidated level of trust, relevance and transparency ofthe financial statements, assurance of consistency of accounting treatments, etc..
By addressing concrete implications of IFRS on the Romanian banking sector, the study is intended asa supplement to those developed by Raducanescu V. and Dima M., 2011, and Stefan C. and Musat M.,2011, highlighting the factors that influence the level of provisions.
With the adoption of IFRS, besides determining the prudential adjustments are to be determined alsothe impairment adjustments (NBR R no.11/2011).
Raducanescu, V. and Dima, M., 2011, after the recognition of loss, depending on the duration of theloan, consider two types of provisioning: the model of materialized (expected) loss - IFRS and modelof projected (unexpected) loss - Basel II. Also, after the manner of allocation of loss on asset classes,the model of materialized loss - IFRS is divided into specific credit risk provisions and collectiveprovisions.

Journal of International Scientific Publication: Economy & Business, Volume 6, Part 4
ISSN 1313-2555, Published at: http://www.scientific-publications.net
329 Published by Info Invest, Bulgaria, www.sciencebg.net
To mitigate the changes produced by the implementation of IFRS on prudential banking indicators, inrespect of the Guidelines on Prudential Filters for Regulatory Capital (CEBS, 2004) were adoptedprudential filters (NBR Regulation no.18/2006). At EU level, reconciliation of the accountingprovisioning with that for prudential supervision is diverse. For example, in countries like Greece,Slovenia, Bulgaria it is used the extra-accounting adjustments over the own prudential funds in thesense of their decrease (Raducanescu V. and Dima M., 2011).
The remainder of the paper is organized as follows. Section 2 deals with determination of adjustmentsfor credit impairment. Section 3 deals with determination of capital requirements. Section 5 concludes.
2. DETERMINATION OF CREDIT IMPAIRMENT
In recognition of credit risk and losses from loans are used two methods of adjustment: prudential andimpairment adjustments.
Prudential adjustments are determined in accordance with NBR Regulation no.11/2011 by applyingthe provisioning coefficient on gross exposure adjusted with value of collateral accepted as decreasedrisk factor. Provisioning coefficients are different on classification categories according to perceivedrisk.
Classification of loans and investments are made in five categories (standard, observation,substandard, doubtful and loss) based on debt service, financial performance and judicial proceedings.In assessing financial performance are considered quantitative indicators (return on assets, return onequity, etc.) and qualitative (ability of manager, business, etc.).
IFRS impairment adjustments are individually determined for significant exposures which recordsimpairments and collectively determined for significant exposures which do not record impairmentson one hand and insignificant exposures on the other hand.
Credit materiality level is set differently from one credit institution to another due to factors as: levelof exposure in own funds, the level of exposure in total credit portfolio, the bank's market share in thebanking sector, the loan approval level.
According to IAS39.59 "A financial asset or group of financial assets is depreciated if there areobjective evidences of impairment as a result of one or more events that occurred after the initialrecognition of the asset and respective generating losses events have an impact that can reliableestimate the future cash flows ".
Indices for loan impairment are: infringement of contractual terms, significant deterioration of thefinancial situation, the probability for opening the bankruptcy procedure or similar protectionprocedure, significant decreases in estimated cash flows for a portfolio of loans (e.g. unfavourableeconomic conditions correlated with failed obligations – increase of inflation, increase ofunemployment, lower GDP, lower asset values, etc.).
2.1 Individual approach
To emphasize the computation of adjustments for impairment where it is considered a significant loanof 90,000 EUR, contracted for a period of five years from January 1 year N (i=0), payable in equalinstalments at the end of each year, with an annual fixed interest of 6% also payable at the end of eachyear. A commission of 3% (2,700 EUR) is retained when loan is granted. The loan is guaranteed 30%

Journal of International Scientific Publication: Economy & Business, Volume 6, Part 4
ISSN 1313-2555, Published at: http://www.scientific-publications.net
330 Published by Info Invest, Bulgaria, www.sciencebg.net
with a real estate guarantee. Debtor holds to the credit institution a deposit in the amount of EUR7,000 which is due in year N +2.
To determine the effective interest rate, are used the loan cash flows shown in Table no. 1, where itakes values from 1 (December N) to 4 (December N +4). Solving equation (1) we obtain the value7.171085% real interest rate.
87.300 =23.400(1 + )
+22.320
(1 + )+
21.240(1 + )
+20.160
(1 + )+
19.080(1 + )
(1)
Depreciation is the positive difference between the amortized cost of the loan, determined by summingfuture cash flows (principal and interest) adjusted with amounts to be amortized (commission) and theprojected cash flows over the life of the loan, updated by effective interest rate used when the loan wasgranted (equation no.2).
Table no.1Period
(1)
Outstandingprincipal (P)
Pi-1 - pi
(2)
Cash flow –principal (p)
(pi = 90.000/5)
(3)
Cash flow –interest (d)
(di = Pi*6%)
(4)
Commissionreceived
(5)
Totalcashflow
(3+4)
(6)
Updatingfactor
1/(1+y)i
(7)
Updatedcashflow
forecast
(6*7)
(8)
Jan. N 90,000 - - 2,700 -87,300
Dec. N 72,000 18,000 5,400 23,400 0.933087 21,834
Dec. N+1 54,000 18,000 4,320 22,320 0.8706522 19,433
Dec. N+2 36,000 18,000 3,240 21,240 0.8123947 17,255
Dec. N+3 18,000 18,000 2,160 20,160 0.758035 15,282
Dec. N+4 0 18,000 1,080 19,080 0.7073133 13,496
Total 90,000 16,200 2,700 18,900 87,300
Source: own processing
Present value =( )
(2)
where:
t - estimated timing of cash flows
t0 - the date when the recoverable amount is calculated
T - the latest estimated cash flow
CFt - estimated cash flows (including those related to collateral) at time t
reff. - effective interest rate (calculated when loan was granted)
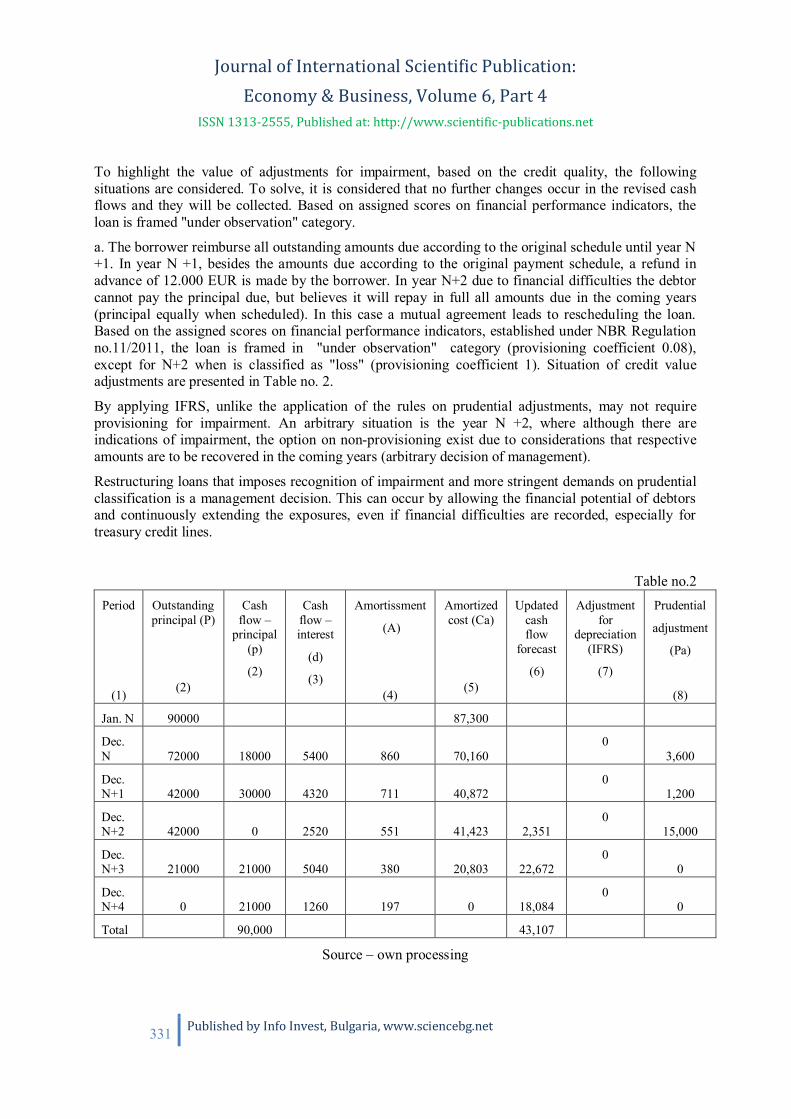
Journal of International Scientific Publication: Economy & Business, Volume 6, Part 4
ISSN 1313-2555, Published at: http://www.scientific-publications.net
331 Published by Info Invest, Bulgaria, www.sciencebg.net
To highlight the value of adjustments for impairment, based on the credit quality, the followingsituations are considered. To solve, it is considered that no further changes occur in the revised cashflows and they will be collected. Based on assigned scores on financial performance indicators, theloan is framed "under observation" category.
a. The borrower reimburse all outstanding amounts due according to the original schedule until year N+1. In year N +1, besides the amounts due according to the original payment schedule, a refund inadvance of 12.000 EUR is made by the borrower. In year N+2 due to financial difficulties the debtorcannot pay the principal due, but believes it will repay in full all amounts due in the coming years(principal equally when scheduled). In this case a mutual agreement leads to rescheduling the loan.Based on the assigned scores on financial performance indicators, established under NBR Regulationno.11/2011, the loan is framed in "under observation" category (provisioning coefficient 0.08),except for N+2 when is classified as "loss" (provisioning coefficient 1). Situation of credit valueadjustments are presented in Table no. 2.
By applying IFRS, unlike the application of the rules on prudential adjustments, may not requireprovisioning for impairment. An arbitrary situation is the year N +2, where although there areindications of impairment, the option on non-provisioning exist due to considerations that respectiveamounts are to be recovered in the coming years (arbitrary decision of management).
Restructuring loans that imposes recognition of impairment and more stringent demands on prudentialclassification is a management decision. This can occur by allowing the financial potential of debtorsand continuously extending the exposures, even if financial difficulties are recorded, especially fortreasury credit lines.
Table no.2Period
(1)
Outstandingprincipal (P)
(2)
Cashflow –
principal(p)
(2)
Cashflow –interest
(d)
(3)
Amortissment
(A)
(4)
Amortizedcost (Ca)
(5)
Updatedcashflow
forecast
(6)
Adjustmentfor
depreciation(IFRS)
(7)
Prudential
adjustment
(Pa)
(8)
Jan. N 90000 87,300
Dec.N 72000 18000 5400 860 70,160
03,600
Dec.N+1 42000 30000 4320 711 40,872
01,200
Dec.N+2 42000 0 2520 551 41,423 2,351
015,000
Dec.N+3 21000 21000 5040 380 20,803 22,672
00
Dec.N+4 0 21000 1260 197 0 18,084
00
Total 90,000 43,107
Source – own processing
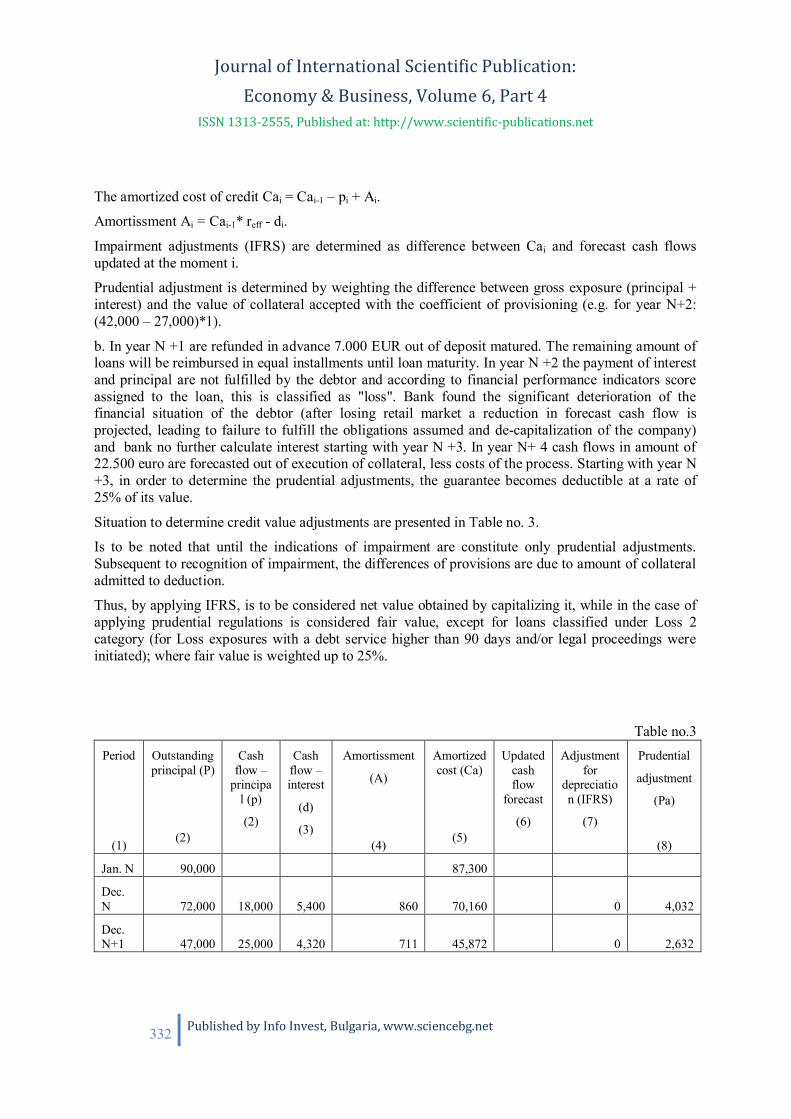
Journal of International Scientific Publication: Economy & Business, Volume 6, Part 4
ISSN 1313-2555, Published at: http://www.scientific-publications.net
332 Published by Info Invest, Bulgaria, www.sciencebg.net
The amortized cost of credit Cai = Cai-1 – pi + Ai.
Amortissment Ai = Cai-1* reff - di.
Impairment adjustments (IFRS) are determined as difference between Cai and forecast cash flowsupdated at the moment i.
Prudential adjustment is determined by weighting the difference between gross exposure (principal +interest) and the value of collateral accepted with the coefficient of provisioning (e.g. for year N+2:(42,000 – 27,000)*1).
b. In year N +1 are refunded in advance 7.000 EUR out of deposit matured. The remaining amount ofloans will be reimbursed in equal installments until loan maturity. In year N +2 the payment of interestand principal are not fulfilled by the debtor and according to financial performance indicators scoreassigned to the loan, this is classified as "loss". Bank found the significant deterioration of thefinancial situation of the debtor (after losing retail market a reduction in forecast cash flow isprojected, leading to failure to fulfill the obligations assumed and de-capitalization of the company)and bank no further calculate interest starting with year N +3. In year N+ 4 cash flows in amount of22.500 euro are forecasted out of execution of collateral, less costs of the process. Starting with year N+3, in order to determine the prudential adjustments, the guarantee becomes deductible at a rate of25% of its value.
Situation to determine credit value adjustments are presented in Table no. 3.
Is to be noted that until the indications of impairment are constitute only prudential adjustments.Subsequent to recognition of impairment, the differences of provisions are due to amount of collateraladmitted to deduction.
Thus, by applying IFRS, is to be considered net value obtained by capitalizing it, while in the case ofapplying prudential regulations is considered fair value, except for loans classified under Loss 2category (for Loss exposures with a debt service higher than 90 days and/or legal proceedings wereinitiated); where fair value is weighted up to 25%.
Table no.3Period
(1)
Outstandingprincipal (P)
(2)
Cashflow –
principal (p)
(2)
Cashflow –interest
(d)
(3)
Amortissment
(A)
(4)
Amortizedcost (Ca)
(5)
Updatedcashflow
forecast
(6)
Adjustmentfor
depreciation (IFRS)
(7)
Prudential
adjustment
(Pa)
(8)
Jan. N 90,000 87,300
Dec.N 72,000 18,000 5,400 860 70,160 0 4,032
Dec.N+1 47,000 25,000 4,320 711 45,872 0 2,632

Journal of International Scientific Publication: Economy & Business, Volume 6, Part 4
ISSN 1313-2555, Published at: http://www.scientific-publications.net
333 Published by Info Invest, Bulgaria, www.sciencebg.net
Dec.N+2 47,000 0 0 551 46,423 0 28,144 22,820
Dec.N+3 47,000 0 0 380 46,803 0 28,524 43,070
Dec.N+4 47,000 0 0 197 47,000 18,279 28,721 43,070
Total 2,700 18,279
Source – own processing
The amortized cost of credit- Cai = Cai-1 – pi + Ai
Amortissment Ai = Cai-1* reff - di
In column 6 is presented the updated cash flow forecast since the indications of impairment occurred.
Interest calculated for the year N+2 is 47 000 * 6% = 2.820 Eur.
IFRS Impairment adjustments are determined as difference between Cai and forecast cash flowsupdated at the time i (for example, for the year N +2: 46.423 - 18.279).
Prudential adjustment is determined by weighting the difference between gross exposure (principal +interest) and the value of collateral accepted with the coefficient of provisioning (e.g. for year N+3:43.070 = ((47.000 + 2.820) - 27.000 * 0.25).
2.2. Collective approach
Collective approach involves grouping of financial assets for which there is no objective evidence ofimpairment or those existing are insignificant, based on similar credit risk characteristics and theirassessment using historical loss rates associated with information about prior experiences regardinglosses in the respective assets groups.
Segmentation in homogeneous groups of financial assets is based on features that are relevant forestimating future cash flows for such groups of assets indicating the debtors' capacity to reimburse allamounts due according to the contractual terms applicable to valued assets (IAS 39.AG87). Thecriteria considered are:
- Type of customer (individual or legal person);
- Marital status of the client;
- Type and currency of the loan;
- Type of warranty;
- Initial value of the loan;
- Duration of the loan;
- Classification of each exposure according to the NBR regulations, respectively: Standard, UnderObservation, Substandard, Doubtful, Loss 1 (for Loss exposures with a debt service less than 90 days)and Loss 2 (for Loss exposures with a debt service higher than 90 days and / or legal proceedings wereinitiated, corresponding to “default” classification);

Journal of International Scientific Publication: Economy & Business, Volume 6, Part 4
ISSN 1313-2555, Published at: http://www.scientific-publications.net
334 Published by Info Invest, Bulgaria, www.sciencebg.net
Determination of impairment adjustments related to collective portfolio of bank exposures is made foreach group of financial assets that present similar risks:
AjDiCOLL group J = EADI
group J * PD group J * LGDgroup J (3)
where:
AjDiCOLL group J - represent the impairment adjustment related to exposure i of financial assets J ;
EADIgroup J - represent the balance sheet exposure i from financial assets group J;
PD group J - probability of default related to financial assets group J ;
LGDgroup J - loss given default related to financial assets group J.
The probability of default is intended to measure the qualitative evolution of the portfolio of exposuresby analyzing the number of exposures depreciated.
Exemplifying the calculation methodology of collective impairments, it is to be considered thatmonthly credit migration from one category classification as in NBR Regulation into another isanalyzed. Analysis is performed on a time horizon of at least 12 months prior to calculating theadjustments.
Measurement will be made by quantifying monthly migrating exposures related to each classificationcategory into default category. This will be achieved by establishment the percentage of exposures thathave migrated from each classification category into “in default “against the number of impairedexposures at the beginning.
Thus the probability of default for each month for all categories of classification is determined basedon equation no.4, hypothetical results being presented in Table no.4. The value determined for themonth 12, year N+1 is 49%.
DR= ( ( )
(4)
If probability of default (PD) is determined based on value of each loans migrating in the “in default”category from other categories, are obtain the results shown in the table no table no.4 (in case of a 4months analysis).
It is observable that PD value calculated based on the number of credits differs from that calculated bythe credit values. For example, for the first month, PD calculated based on the number of loans is3.77% and those calculated on loans value is 0.17%. It shows the more frequent depreciation of theloans with inferior values.
Loss given default (LGD) is determined on monthly basis by analyzing the historical data over a timehorizon of minimum 12 months before the date for calculating the adjustments as in formula below:
LGDI =
(5)
where:
j Execution j - is the sum of exposures for which legal proceedings were initiated in the 12months ending month.
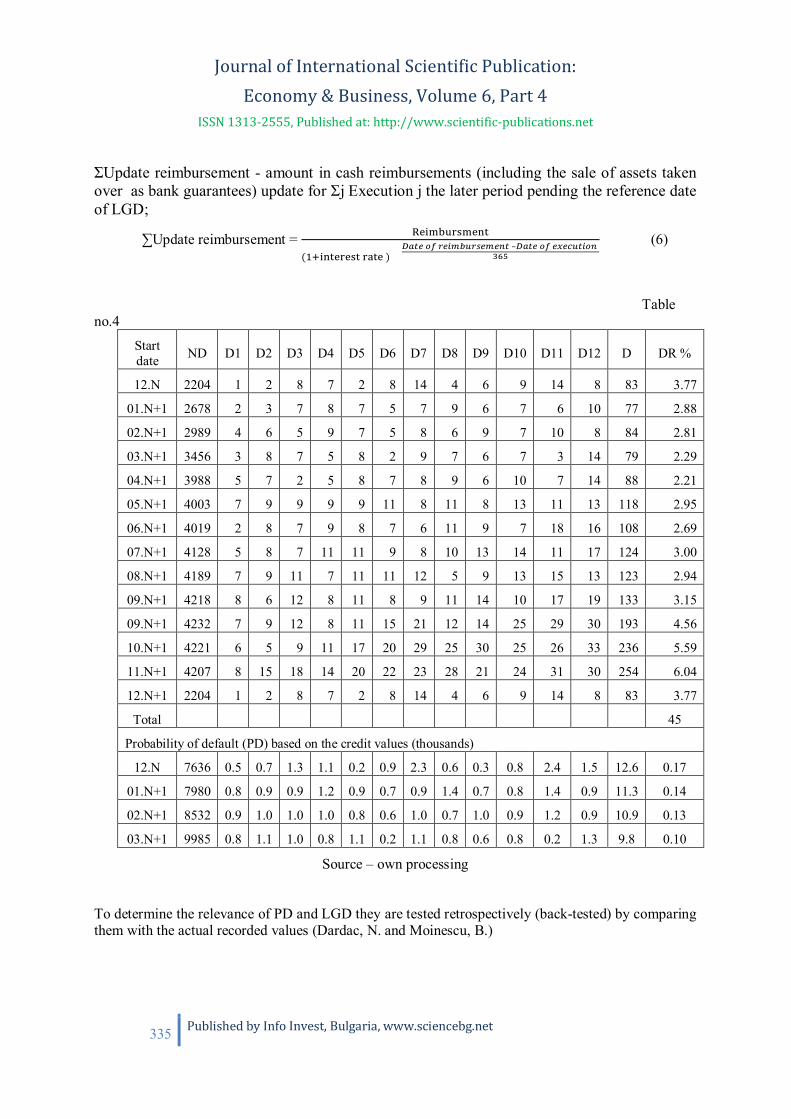
Journal of International Scientific Publication: Economy & Business, Volume 6, Part 4
ISSN 1313-2555, Published at: http://www.scientific-publications.net
335 Published by Info Invest, Bulgaria, www.sciencebg.net
Update reimbursement - amount in cash reimbursements (including the sale of assets takenover as bank guarantees) update for j Execution j the later period pending the reference dateof LGD;
Update reimbursement =( ) – (6)
Tableno.4
Startdate ND D1 D2 D3 D4 D5 D6 D7 D8 D9 D10 D11 D12 D DR %
12.N 2204 1 2 8 7 2 8 14 4 6 9 14 8 83 3.77
01.N+1 2678 2 3 7 8 7 5 7 9 6 7 6 10 77 2.88
02.N+1 2989 4 6 5 9 7 5 8 6 9 7 10 8 84 2.81
03.N+1 3456 3 8 7 5 8 2 9 7 6 7 3 14 79 2.29
04.N+1 3988 5 7 2 5 8 7 8 9 6 10 7 14 88 2.21
05.N+1 4003 7 9 9 9 9 11 8 11 8 13 11 13 118 2.95
06.N+1 4019 2 8 7 9 8 7 6 11 9 7 18 16 108 2.69
07.N+1 4128 5 8 7 11 11 9 8 10 13 14 11 17 124 3.00
08.N+1 4189 7 9 11 7 11 11 12 5 9 13 15 13 123 2.94
09.N+1 4218 8 6 12 8 11 8 9 11 14 10 17 19 133 3.15
09.N+1 4232 7 9 12 8 11 15 21 12 14 25 29 30 193 4.56
10.N+1 4221 6 5 9 11 17 20 29 25 30 25 26 33 236 5.59
11.N+1 4207 8 15 18 14 20 22 23 28 21 24 31 30 254 6.04
12.N+1 2204 1 2 8 7 2 8 14 4 6 9 14 8 83 3.77
Total 45
Probability of default (PD) based on the credit values (thousands)
12.N 7636 0.5 0.7 1.3 1.1 0.2 0.9 2.3 0.6 0.3 0.8 2.4 1.5 12.6 0.17
01.N+1 7980 0.8 0.9 0.9 1.2 0.9 0.7 0.9 1.4 0.7 0.8 1.4 0.9 11.3 0.14
02.N+1 8532 0.9 1.0 1.0 1.0 0.8 0.6 1.0 0.7 1.0 0.9 1.2 0.9 10.9 0.13
03.N+1 9985 0.8 1.1 1.0 0.8 1.1 0.2 1.1 0.8 0.6 0.8 0.2 1.3 9.8 0.10
Source – own processing
To determine the relevance of PD and LGD they are tested retrospectively (back-tested) by comparingthem with the actual recorded values (Dardac, N. and Moinescu, B.)
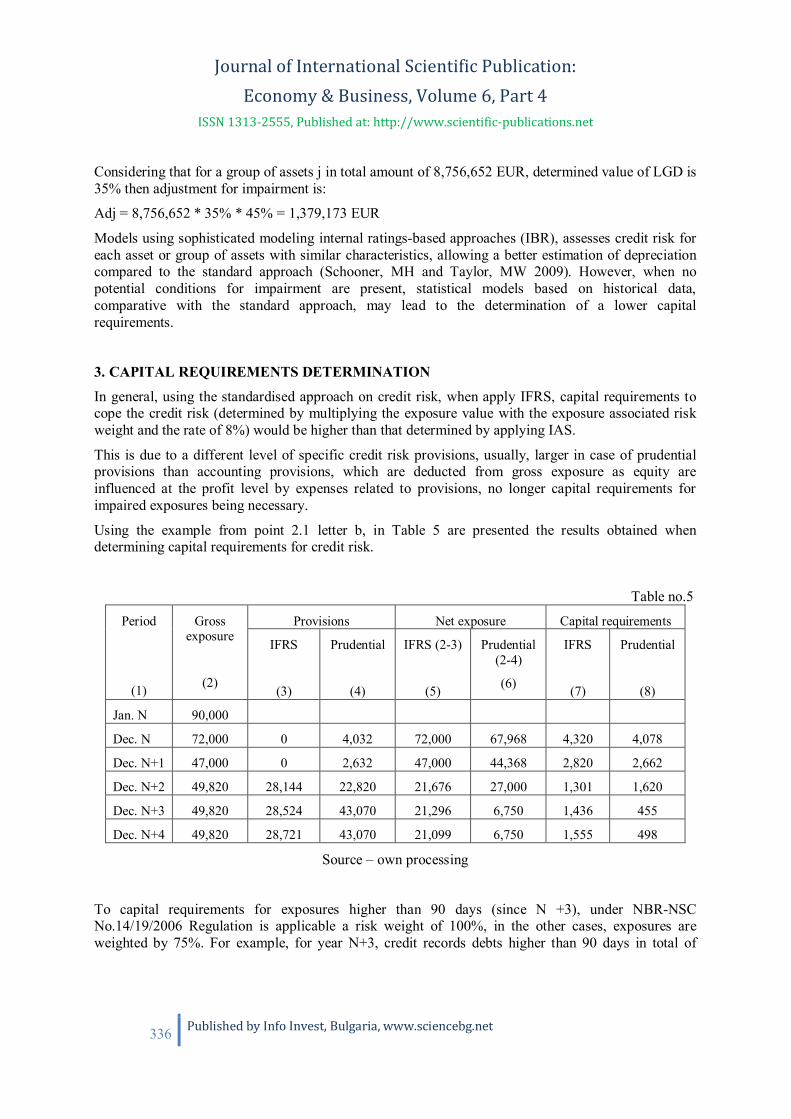
Journal of International Scientific Publication: Economy & Business, Volume 6, Part 4
ISSN 1313-2555, Published at: http://www.scientific-publications.net
336 Published by Info Invest, Bulgaria, www.sciencebg.net
Considering that for a group of assets j in total amount of 8,756,652 EUR, determined value of LGD is35% then adjustment for impairment is:
Adj = 8,756,652 * 35% * 45% = 1,379,173 EUR
Models using sophisticated modeling internal ratings-based approaches (IBR), assesses credit risk foreach asset or group of assets with similar characteristics, allowing a better estimation of depreciationcompared to the standard approach (Schooner, MH and Taylor, MW 2009). However, when nopotential conditions for impairment are present, statistical models based on historical data,comparative with the standard approach, may lead to the determination of a lower capitalrequirements.
3. CAPITAL REQUIREMENTS DETERMINATION
In general, using the standardised approach on credit risk, when apply IFRS, capital requirements tocope the credit risk (determined by multiplying the exposure value with the exposure associated riskweight and the rate of 8%) would be higher than that determined by applying IAS.
This is due to a different level of specific credit risk provisions, usually, larger in case of prudentialprovisions than accounting provisions, which are deducted from gross exposure as equity areinfluenced at the profit level by expenses related to provisions, no longer capital requirements forimpaired exposures being necessary.
Using the example from point 2.1 letter b, in Table 5 are presented the results obtained whendetermining capital requirements for credit risk.
Table no.5
Period
(1)
Grossexposure
(2)
Provisions Net exposure Capital requirements
IFRS
(3)
Prudential
(4)
IFRS (2-3)
(5)
Prudential(2-4)
(6)
IFRS
(7)
Prudential
(8)
Jan. N 90,000
Dec. N 72,000 0 4,032 72,000 67,968 4,320 4,078
Dec. N+1 47,000 0 2,632 47,000 44,368 2,820 2,662
Dec. N+2 49,820 28,144 22,820 21,676 27,000 1,301 1,620
Dec. N+3 49,820 28,524 43,070 21,296 6,750 1,436 455
Dec. N+4 49,820 28,721 43,070 21,099 6,750 1,555 498
Source – own processing
To capital requirements for exposures higher than 90 days (since N +3), under NBR-NSCNo.14/19/2006 Regulation is applicable a risk weight of 100%, in the other cases, exposures areweighted by 75%. For example, for year N+3, credit records debts higher than 90 days in total of

Journal of International Scientific Publication: Economy & Business, Volume 6, Part 4
ISSN 1313-2555, Published at: http://www.scientific-publications.net
337 Published by Info Invest, Bulgaria, www.sciencebg.net
31,333 EUR (15,667 EUR principal and 2.820 EUR interest) associated provisions being distributedproportionally. Applying prudential adjustments for year N+3, capital requirements are determined asfollows:
- Net Exposure for payment delays less than 90 days: 31.333 - 31.333 / 49.820 * 28.524 = 13.394.Capital requirement = 13,394 * 8% * 75% = 804;
- Net Exposure for late payment higher than 90 days: 18 487 - 18 487/49 820 * 28 524 = 7902. Capitalrequirement = 7902 * 8% * 100% = 632.
For example within Table no. 5, for a loan with a gross exposure of 47,000 EUR, classified accordingto prudential regulations in “Loss” category, and according to Regulation NBR- NSC No.14/19/2006on credit risk treatment using the standardised approach, for credit institutions and investment firmsassignment to retail claims, the capital requirements to cope the credit risk is 2,662 EUR [(47,000-2,632)*8%*75%], by applying the prudential adjustments and of 2,820 EUR [(47,0000-0)*8%*75%],by applying the impairment adjustments.
This is compensated by faster growth of own funds through net profit 2,211 EUR by applying IFRS.However, by enforcing the prudential adjustments (larger) a tax saving of 421 EUR, is obtain against0 EUR by applying adjustments for impairment under IFRS.
To avoid significant changes to the bank prudential indicators, including capital requirements forcredit risk after implementing IFRS and in order to ensure financial stability, prudential fiscalmeasures have been taken. Prudential measures impose a prudential filter consisting in deduction fromthe credit institution's own funds of the positive difference between the size of the prudentialprovisions and the level of IFRS accounting provisions.
This difference is also deducted when calculating the exposure value for determining the capitalrequirements for credit risk in order to avoid the double damage of the capital. Also in order to avoidthe fiscal influence of the credit risk provisions expenses, the deductibility of the prudential filter havebeen admitted when calculating taxable profits.
Influences on own funds and measures adopted by the regulatory authorities for second year arepresented in Table no. 6. For this consider initial equity worth 70,000 Euro and gross profit withoutinfluence in provisioning costs 100,000 Euro.
Table no.6Prudential0 IFRS0 IFRS1 by applying filters
Capital requirements 2,662 2,820 2,662
Gross profit 100,000 100,000 100,000
Expense provisions 2,632 0 0
Deductible expenses of prudential filters 2,632
Taxable profit 97,368 100,000 97,368
Tax (16%)/Tax savings 15,579/421 16,000/0 15,579/421
Net profit 81,789 84,000 81,789
Total own funds 151,789 154,000 151,368
Source – own processing

Journal of International Scientific Publication: Economy & Business, Volume 6, Part 4
ISSN 1313-2555, Published at: http://www.scientific-publications.net
338 Published by Info Invest, Bulgaria, www.sciencebg.net
Thus, when applying the standard approach, in order to avoid the artificially increase of the own fundsand the exposure of the credit institution to potential credit risks, prudential filters have beenimplemented in order to cancel the negative effect of IFRS implementation and to ensure prudentialrequirements at the same level as prior adopting the new rules for determining the prudential valueadjustments for credit risk.
Adjustments for impairment greater than prudential allowed as positive elements in determining ownfunds available to a limit of 0.6% of risk weighted exposure.
As states Raducanescu V and Dima M., 2011, in case of approach based on internal ratings, aprudential filter is not required, the capital requirement being set to cover the unexpected losses.
4. CONCLUSIONS
Given the role that capital requirements plays in providing coverage of losses and ensuring financialstability, factors that influence their level, including provisions for loan impairment, requires a carefulmonitoring.
The study examines the effects of applying the accounting policies set out by the InternationalAccounting Standards on methods to determine credit risk provisions and their impact on own fundsof credit institutions.
The study indicates that failure to establish uniform criteria for recognition of loan impairmentindicators, may lead to discrepancies in addressing credit risk from one credit institution to anotheraccording to risk inclination of managers. These different approaches can hide losses that over timemay affect the stability of the credit institution.
In order to neutralize the negative effects of adopting IFRS, is required to issue regulations tocounteract the artificial increase of funds availability by non-recognition of latent losses.
ACKNOWLEDGEMENTS
This work was supported by the Academy of Economic Studies, Bucharest - IOSUD.
REFERENCES
Committee of European Banking Supervisiors (CEBS), Guidelines on prudential filters for regulatorycapital, december 2004, http://www.eba.europa.eu/News--Communications/Year/2004/CEBS-guidelines-on-prudential-filters-for-regulato.aspx
Dardac N., Moinescu B., Validation Techniques of the Intern Models for Credit Risk Theoretical andApplied Economics no. 9 / 2006 (504), p55-60.
National Bank of Romania, Financial stability report, 2012, http://www.bnro.ro/Regular-publications-2504.aspx
National Bank of Romania, Ordin nr. 9 /2010 privind aplicarea Standardelor Interna ionale deRaportare Financiar de c tre institu iile de credit,
http://www.bnro.ro/apage.aspx?pid=404&actId=323609
Journal of International Scientific Publication: Economy & Business, Volume 6, Part 4
ISSN 1313-2555, Published at: http://www.scientific-publications.net
339 Published by Info Invest, Bulgaria, www.sciencebg.net
National Bank of Romania, National Securities Commission, Regulation NBR- NSC No.14/19/2006on credit risk treatment using the standardised approach, for credit institutions and investment firms,http://www.bnro.ro/Credit-Institutions-2698.aspx
National Bank of Romania, National Securities Commission, Regulation NBR- NSC No.15/20/2006on credit risk treatment using the internal models based approach, for credit institutions andinvestment firms, http://www.bnro.ro/Credit-Institutions-2698.aspx
National Bank of Romania, National Securities Commission, Regulation no.18/23/14.12.2006regarding own funds of credit institutions and investment firms, http://www.bnro.ro/Credit-Institutions-2698.aspx
National Bank of Romania, National Securities Commission, Regulation NBR-NSC no.13/18/2006concerning the determination of minimum capital requirements for credit institutions and investmentfirms, http://www.bnro.ro/Credit-Institutions-2698.aspx
Raducanescu V., Dima V., Provocarile trecerii la IFRS in planul supravegherii prudentiale ainstitutiilor de credit, Revista Audit Financiar no.11, 2011, p.18-26.
Schooner M. H., Taylor M.W. (2009), Global bank regulation. Principles and policies, AcademicPress, USA, p152-159.
Stefan C., Musat M, Considerations Regarding NBR Regulations on IFRS Implementation by theRomanian Banking System, Revista Audit Financiar no.11, 2011, p.28-35.
***, Regulation (ec) no 297/2008 of the European Parliament and of the Council amending regulation(ec) no 1606/2002 on the application of international accounting standards, http://eur-lex.europa.eu/LexUriServ/LexUriServ.do?uri=OJ:L:2008:097:0062:0063:EN:PDF
***, Standarde Internationale de Raportare Financiara, IFRS, 2011

Journal of International Scientific Publication: Economy & Business, Volume 6, Part 4
ISSN 1313-2555, Published at: http://www.scientific-publications.net
340 Published by Info Invest, Bulgaria, www.sciencebg.net
C o n t e n t s
SSESSMENT OF THE CONDITION OF PRIMARY HEALTH CARE IN BULGARIA
Tihomira Zlatanova1, Ralitsa Zlatanova-Velikova2, Tsvetelina Petrova-Gotova3
1, 2, 3 Medical University – Sofia, Faculty of Public Health, Department of Health Economics, Sofia, Bulgaria
5
OPTIMIZED APPROACH TO FUNDING PRIMARY OUTPATIENT HEALTH CARE
IN REPUBLIC OF BULGARIA
Tsvetelina M. Petrova-Gotova, Tihomira Zl. Zlatanova
Medical University – Sofia, Faculty of Public Health, Department of Health Economics, 1527 Sofia, Bulgaria
11
VARIABLES USED BY THE PALESTINIAN BANKS' MANAGERS TO MEASURE THEIR
BANK PERFORMANCE
Suleiman M. Abbadi, Nour Abu-Rub
Faculty of Administrative & Financial Science, Arab American University , Jenin , Palestine
19
BRANCH-AND-BOUND TECHNIQUE IN ECONOMICS
Velizar T. Pavlov1 , Ivan R. Georgiev2
1, 2Department of Numerical Analysis and Statistics, University of Ruse, 8 Studentska Str., Ruse 7017, Bulgaria
34
ENTERPRISE SIZE DISTRIBUTION IN THE CROATIAN SOFTWARE INDUSTRY
Ksenija Vukovi
Faculty of Organization and Informatics, University of Zagreb, Pavlinska 2, Varaždin, Croatia
43
CHALLENGES OF THE EU AND THE NATIONAL SME POLICY:
BETWEEN ADMINISTRATING, MANAGING AND GOVERNING
Ksenija Vukovi
Faculty of Organization and Informatics, University of Zagreb, Pavlinska 2, Varaždin, Croatia,
52
INTEGRATION OF FINANCIAL MARKETS: PROBLEMS AND OPPORTUNITIES
Zhanna D. Serikbayeva
International Academy of Business, Almaty, Rozybakiyeva st., 227, Kazakhstan
62

Journal of International Scientific Publication: Economy & Business, Volume 6, Part 4
ISSN 1313-2555, Published at: http://www.scientific-publications.net
341 Published by Info Invest, Bulgaria, www.sciencebg.net
HISTORICAL REVIEW AND INFLUENTIAL FACTORS OF THE ELECTRICITY PRICE
MOVEMENT FOR SELECTED COUNTRIES OF THE EUROPEAN UNION AND THE
REPUBLIC OF CROATIAi
Ljerka Cerovic2, Dario Maradin2, Ivan Markovi 2
2University of Rijeka, Faculty of Economics Rijeka, 51000 Rijeka, Croatia
71
THE PERCEPTIONS OF HOSPITALITY SECTOR EMPLOYEES TOWARD EURASIAN
TOURIST NATIONS’ ATTITUDES AND BEHAVIOUR IN THE ANTALYA REGION
Erkan Sezgin and R dvan Kozak,
Faculty of Tourism, Faculty of Economics, Yunus Emre Kampusu, Anadolu University, Eskisehir, Turkey
81
INTERNAL AUDIT – INTERNAL CONTROL SYSTEM
AND ORGANIZATIONAL STRUCTURE RELATIONSHIP
Kadir Dabbagoglu
Halic University Business School, Bankalar Cad. Mektep Sk. 21, Sishane Istanbul Turkey
90
PROBLEMS OF IMPLEMENTATION CORPORATE SUSTAINABILITY IN THE NEW EU
STATES ON THE EXAMPLE OF POLAND
Jacek Kami ski
Pope John Paul II State School of Higher Education in Bia a Podlaska
Institute of Economy and Management, Sidorska 95/97, 21-500 Bia a Podlaska, Poland
98
DEVELOPMENT OF MEDIA–RELEVANT HEALTH PORTALS IN THE CZECH REPUBLIC
Josef K ížek, Martin Nohál
University of Economics, Prague, Faculty of Economics, W. Churchill Sq. 4, 130 67 Prague 3, Czech Republic
110
POTENTIAL THREATS OF THE CZECH PENSION REFORM
Josef K ížek, Martin Nohál
University of Economics, Prague, Faculty of Economics, W. Churchill Sq. 4, 130 67 Prague 3, Czech Republic
123
STUDENT EMPLOYABILITY AND BRAIN DRAIN IN THE REPUBLIC OF MACEDONIA
Ljupco Eftimov
Faculty of Economics-Skopje, University “Ss. Cyril and Methodius”-Skopje,
Blvd. Krste Misirkov, nn., 1000 Skopje, Republic of Macedonia
132
Journal of International Scientific Publication: Economy & Business, Volume 6, Part 4
ISSN 1313-2555, Published at: http://www.scientific-publications.net
342 Published by Info Invest, Bulgaria, www.sciencebg.net
STRATEGIC FLEXIBILITY IN INTERNATIONAL INTERMEDIATE TRADE
WITH HANSEATIC PRINCIPLES.
Artur Rieger, Maksim Saat
Tallinn University of Technology, School of Economics and Business Administration, Tallinn, Estonia, Akadeemia tee 3
145
HUMAN CAPITAL AS THE SOURCE OF COMPETITIVENESS
OF FOOD INDUSTRY ENTERPRISES
Ma gorzata Juchniewicz
Chair of Economics of Enterprises, Faculty of Economic Sciences,
University of Warmia and Mazury in Olsztyn, 10-089 Olsztyn, ul. Oczapowskiego 4
158
FINANCIAL LEVERAGE MODELS VERSUS BANKRUPTCY ENTERPRISES
Piotr Masiukiewicz, Mateusz Nowak
Department of Collegium of Business Administration, Warsaw School of Economics, 02-554 Warszawa
168
ESTONIAN OPINION ON BUSINESS AND PROFESSIONAL ETHICS
Jaan Alver, Lehte Alver, Natalja Gurvitsh
Tallinn University of Technology, Estonia
178
APPLICATION OF THE ANALYTIC HIERARCHY PROCESS TO OPTTIMIZE THE
STRUCTURE OF RUSSIAN INDUSTRY BY THE TYPE OF ECONOMIC ACTIVITY
Rafail R. Ishmuratov 1, Nuria R. Nasyrova 2
1,2 Kazan (Volga region) Federal University, Institute of Economics and Finance, Kazan, Tatarstan Russian Federation
193
THE EFFECT OF SERVICE QUALITY ON CUSTOMER SATISFACTION:
A RESEARCH IN PUBLIC AND UNIVERSITY HOSPITALS IN TURKEYii
Sebahattin Y ld z
Assistant Professor, Kafkas University, Faculty of Business and Administrative Sciences, Department
of Business Administration, Kars, Turkey
206
FINANCIAL EFFICIENCY ANALYSIS OF A HIGHER EDUCATION INSTITUTION IN
TURKEY BY DATA ENVELOPMENT ANALYSIS APPROACH: THE CASE OF
LANGUAGE EDUCATION CENTER (TÖMER) OF ANKARA UNIVERSITY
Ali Argun KARACABEY, Faz l GÖKGÖZ
Ankara University, Faculty of Political Sciences,
Quantitative Methods (Department of Management), 06600 Cebeci, Ankara / TURKEY.
220

Journal of International Scientific Publication: Economy & Business, Volume 6, Part 4
ISSN 1313-2555, Published at: http://www.scientific-publications.net
343 Published by Info Invest, Bulgaria, www.sciencebg.net
ENTREPRENEURIAL CULTURE AS A PREREQUISITE FOR THE FORMATION
OF INNOVATION DRIVEN ORGANIZATION
Marko Kolakovi 1, Boris Sisek2, Bojan Mori Milovanovi 1, Mladen Turuk2
1 Department of Managerial Economics, Faculty of Economics and Business, University of Zagreb, Croatia.2 Department of Economic Theory, Faculty of Economics and Business, University of Zagreb, Croatia
243
THE FACTORS OF FINANCIAL CRISIS
Ileana Anastase (Badulescu), University Tomis, Cosntanta, Romania
255
THE USE OF DYNAMIC ANALYSIS INDEX OF INVESTMENT PROJECTS ECONOMIC
EFFICIENCY: NET UPDATED VALUE
Marian Andrei Gurau
Faculty of Engineering and Technological Systems Management, University “Polytechnics” of Bucharest, Romania
262
CYCLES ECONOMY BY THE EXAMPLE OF BALTIC STATES, GERMANY,
SWEDEN AND FINLAND
Toivo Tanning, Lembo Tanning, Maksim Saat
Tallinn University of Technology. School of Economics and Business Administration, 12618 Tallinn, Estonia
272
EASTERN EUROPEAN COUNTRIES SALARIES AND PRODUCTIVITY BY THE EXAMPLE ESTONIA
Toivo Tanning, Lembo Tanning, Maksim Saat
Tallinn University of Technology. School of Economics and Business Administration, 12618 Tallinn, Estonia
286
ORGANIZATIONAL CHANGES AND CHALLENGES OF PUBLIC ADMINISTRATION IN
THE SECTORAL MANAGEMENT OF HUNGARIAN PUBLIC EDUCATION, BETWEEN
1998 AND 2010 IN THE ASPECT OF PUBLIC POLICY
Lilla Bauer
Doctoral School of Political Science, Public Administration Sciences Subprogram,
Corvinus University of Budapest, Hungary
302
HUMAN CAPITAL DEVELOPMENT THROUGH A COMPANY’S STRATEGY
Ieva Kozlovska, Irina Kuzmina,
BA School of Business and Finance, Deloitte Latvia and RTU Riga Business School
316

Journal of International Scientific Publication: Economy & Business, Volume 6, Part 4
ISSN 1313-2555, Published at: http://www.scientific-publications.net
344 Published by Info Invest, Bulgaria, www.sciencebg.net
THE EFFECTS OF THE TRANSITION TO IFRS ON PRUDENTIAL REQUIREMENTS
REGARDING CREDIT RISK
Chitan Gheorghe
Academy of Economic Studies, Ion N. Angelescu building, Romana square no.6, District 1, Bucharest, Romania
328