interaction between a supersonic jet and … · interaction between a supersonic jet and tubes in...
TRANSCRIPT
INTERACTION BETWEEN A SUPERSONIC JET AND
TUBES IN KRAFT RECOVERY BOILERS
by
Ameya Pophali
A thesis submitted in conformity with the requirements for the degree of
Doctor of Philosophy
Graduate Department of Chemical Engineering and Applied Chemistry
University of Toronto
© Copyright by Ameya Pophali 2011

Interaction between a Supersonic Jet and Tubes in Kraft
Recovery Boilers
Doctor of Philosophy 2011
Ameya Pophali
Department of Chemical Engineering and Applied Chemistry
University of Toronto
ABSTRACT
Sootblowing is a process in which supersonic steam jets are used to periodically blast deposits off
heat transfer tubes in kraft recovery boilers. However, sootblowing significantly consumes the
valuable high pressure steam generated by the boiler, hence it should be optimized. A recovery
boiler consists of three convective sections - superheater, generating bank and economizer. The
tube arrangement in these sections, particularly the tube spacing is different from each other.
Moreover, tubes in an economizer are finned. A sootblower jet will interact differently with these
tube arrangements, potentially affecting its strength, and hence deposit removal capability.
The objective of this work was to characterize jet/tube interaction in the three sections of
a recovery boiler. Lab-scale experiments were conducted in which these interactions were
visualized using the schlieren technique coupled with high-speed video, and were quantified by
pitot pressure measurements. This work is the first to visualize the interactions. The offset
between the jet and tube centrelines, the nozzle exit diameter relative to the tube diameter, and the
distance between the nozzle and tube were varied to examine their effects on jet/tube interaction.
Results showed that due to the very low spreading rate of a supersonic jet, a jet (primary
jet) stops interacting with a superheater platen when the jet is only a small distance away from it.
When the jet impinges on a tube, the jet deflects at an angle, giving rise to a weaker ‘secondary’
ii

jet. Due to the large inter-platen spacing, a secondary jet has an insignificant impact in a
superheater. In a generating bank, the primary jet weakens between the closely spaced tubes due
to increased mixing. However, a secondary jet impinges on the adjacent tubes exerting a high
impact pressure on those tubes. The primary jet also weakens between finned economizer tubes,
but remains stronger for a greater distance than in a generating bank. As in the case inside a
generating bank, a secondary jet also impinges on adjacent rows of tubes in an economizer.
The results imply that in a superheater, a sootblower jet must be directed close to the
platens to yield useful jet/deposit interactions, and to avoid wasting steam by blowing between
the platens. In a generating bank, deposits beyond the first few tubes of a row experience a
weaker sootblower jet, and thus may not be removed effectively. However, secondary jets may
contribute to removing deposits from the first few adjacent tubes. They may also induce erosion-
corrosion of those tubes. Secondary jets may also help remove deposits from adjacent rows in a
finned tube economizer. In an economizer, the strength and hence, the deposit removal capability
of a sootblower jet diminish only slightly beyond the supersonic portion of the jet.
A mathematical model was also developed to determine the feasibility of using inclined
sootblower nozzles in recovery boiler superheaters, and suggests that it may be possible to clean
superheater platens more effectively with slightly inclined nozzles.
iii

ACKNOWLEDGEMENT
This work is a result only of the Grace of my Lord Sri Sadguru Sainath Maharaj Ji upon
me. Without His Grace and Blessings, this work would not have been possible at all by me. He
blessed me with strength and patience, because of which I could complete this work. My humble
prostrations before Him.
First, I would like to extend my sincere gratitude to my supervisors Prof. Honghi Tran
and Prof. Markus Bussmann for their continuous guidance, support and encouragement over the
course of my PhD study here at the University of Toronto, Canada. Their excellent supervision
and invaluable advice have benefited me immensely. I have continuously learnt from them about
scientific and technical subjects, as well as leadership and effective communication.
I would like to thank Prof. Kortschot and Prof. Jones for being my committee members
and for guiding me throughout my study. Their constructive feedback has helped shape my final
thesis. I thank my senior colleagues Dr. Andrei Kaliazine and Sue Mao for their help throughout
my study period. I had many fruitful discussions with Dr. Kaliazine on different related and
unrelated topics to my research work. Sue Mao helped me in many of my experiments. My thanks
to Dr. Babak Emami who was a great companion in the lab, and from whom I have learnt a lot.
My sincere thanks to Paul Jowlabar, who always helped me in my experimental endeavours, and
offered his expertise related to machining. I am truly grateful to the entire staff of the Chemistry
Machine Shop, who fabricated the different apparatus which made my research possible.
This work is part of the research consortium on “Increasing Energy and Chemical
Recovery Efficiency in the Kraft Pulping Process” in the Pulp & Paper Center at the University of
Toronto. I deeply acknowledge the financial support of all the members of the consortium.
Finally, I am sincerely and heartily thankful to my family for their tremendous support
and patience. Without them, this thesis would not have been possible at all.
iv
TABLE OF CONTENTS
ABSTRACT ii
ACKNOWLEDGEMENT iv
TABLE OF CONTENTS v
LIST OF TABLES ix
LIST OF FIGURES x
LIST OF APPENDICES xv
NOMENCLATURE xvi
1.0 INTRODUCTION 1
1.1 Fouling in Kraft Recovery Boilers and Sootblowing 4
1.2 Recovery Boiler Tube Arrangements 8
1.3 Thesis Objectives 10
2.0 LITERATURE SURVEY 12
2.1 Fouling and Sootblowing in Kraft Recovery Boilers 12
2.1.1 Deposits in recovery boilers 13
2.1.2 Deposit removal by sootblowing and other techniques 15
2.1.3 Sootblower jet dynamics 21
2.2 Basic Compressible Flow Theory 25
2.2.1 One-dimensional isentropic flow relations 25
2.2.2 Shock and expansion waves 26
2.2.3 Supersonic nozzle flow 30
2.3 The Schlieren Technique 33
2.4 Supersonic Free Jets 36
2.4.1 Jet structure 36
v
2.4.2 Jet oscillation 42
2.5 Impinging Jets 43
2.5.1 Incompressible jet impingement on a cylinder 43
2.5.2 Supersonic jet impingement on a flat surface 47
2.5.3 Supersonic jet impingement on a cylinder 50
2.6 Conclusions from the Literature Survey 51
3.0 EXPERIMENTAL DESIGN AND METHODOLOGY 53
3.1 Scaled-down Nozzle and Tube Bundles 54
3.1.1 Similarity of the lab air jet to an actual sootblower jet 56
3.2 High-Speed Schlieren Flow Visualization System 59
3.3 Pitot Probe and Positioning System 60
3.3.1 Repeatability of measurements 62
3.3.2 Accuracy of measurements 65
3.4 LabVIEW Control and Data Acquisition (DAQ) System 66
3.5 Image Processing 68
4.0 FREE JET CHARACTERIZATION 70
4.1 Jet Structure 71
4.2 Centreline Peak Impact Pressure 72
4.3 Radial Peak Impact Pressure and Jet Spread 74
5.0 INTERACTION BETWEEN A JET AND A SINGLE TUBE 78
5.1 Experimental Parameters 78
5.2 Effect of Offset between Jet and Tube Centrelines 79
5.2.1 Secondary jet angle versus offset 82
5.3 Effect of Tube Size and Distance between Nozzle and Tube 84
5.3.1 Formation of secondary jets and their failure to form 84
5.3.2 Alternate rise and fall of secondary jet angle with distance 87
vi
5.3.3 Unsteadiness of flow around tube 88
6.0 INTERACTION BETWEEN A JET AND TUBE ARRANGEMENTS 90
6.1 Interaction with Model Superheater Platens 91
6.1.1 Model superheater platens 91
6.1.2 Effect of offset 92
6.1.3 Jet midway between platens 95
6.2 Interaction with a Model Generating Bank 97
6.2.1 Model generating bank 97
6.2.2 Effect of offset 99
6.2.3 Jet midway between two rows of tubes 102
6.3 Secondary Jets 108
6.3.1 Experimental apparatus and procedure 109
6.3.2 Secondary jet structure 110
6.3.3 Secondary jet peak impact pressure 112
6.4 Interaction with Model Economizer Tubes (Finned Tubes) 115
6.4.1 Model economizer section 115
6.4.2 Effect of offset 116
6.4.3 Jet midway between two rows of tubes 119
6.5 Practical Implications – Effects of Formation of Secondary Jets and
Closer Tube Spacing 122
7.0 SCHLIEREN VISUALIZATION OF SYNTHETIC DEPOSIT BREAKUP
BY JET IMPINGEMENT 127
7.1 Synthetic Deposit and Experimental Procedure 128
7.1.1 Synthetic deposit 128
7.1.2 Experimental procedure 129
7.2 Deposit Breakup Images 130
vii

8.0 FEASIBILITY OF USING INCLINED SOOTBLOWER NOZZLES IN 134
RECOVERY BOILER SUPERHEATERS
8.1 Loss in Jet Penetration versus Nozzle Inclination Angle, 137
8.2 Schlieren Visualization of Inclined Jet Impingement 138
9.0 CONCLUSIONS, CONTRIBUTIONS, AND RECOMMENDATIONS 140
9.1 Conclusions and Practical Implications 140
9.2 Contributions of this Work 142
9.3 Recommendations for Future Work 144
REFERENCES 145
APPENDICES 154
Appendix A: Schlieren Images of Jet Temporal Development 155
Appendix B: LabVIEW Graphical Program to Control the Data Acquisition System 156
Appendix C: Interaction between a Jet and a Single Tube: Supplementary Results 157
Appendix D: Typical Kraft Recovery Boiler Tube Arrangements: Results of a Recent
Survey (August 2010) 163
Appendix E: Schlieren Images of a Jet Midway between Two Rows of Finned
Economizer Tubes 165
viii
LIST OF TABLES
Chapter 2
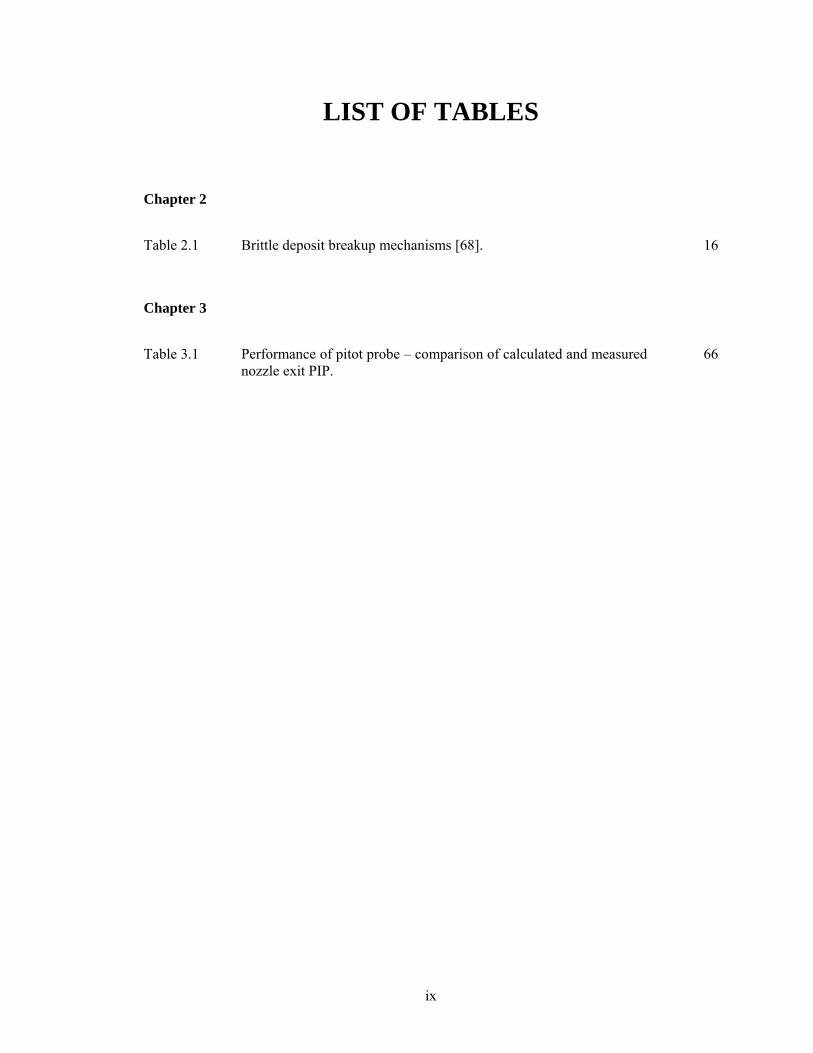
Table 2.1 Brittle deposit breakup mechanisms [68]. 16
Chapter 3
Table 3.1 Performance of pitot probe – comparison of calculated and measured nozzle exit PIP.
66
ix
LIST OF FIGURES
Chapter 1
Figure 1.1 A two-drum kraft recovery boiler. 3
Figure 1.2 Plugging of the flue gas passages at the generating bank inlet in a recovery boiler [107].
4
Figure 1.3 A sootblower removing deposits from a row of tubes. 5
Figure 1.4 Schematic showing the internal structure of a sootblower head. 6
Figure 1.5 A long retractable sootblower [54]. 6
Figure 1.6 Typical tube arrangements in the superheater, generating bank, and economizer sections of a recovery boiler.
8
Figure 1.7 Arrangement of superheater platens in a recovery boiler [2]. 9
Chapter 2
Figure 2.1 Asymmetric deposits formed on superheater platens by carryover impaction [107].
13
Figure 2.2 Massive deposit buildup between superheater platens. 13
Figure 2.3 Jet PIP required for deposit removal versus deposit thickness; (a) head-on impingement; (b) impingement at 90° relative to the head-on case [53].
18
Figure 2.4 Deposit thermal shock caused by supersonic jet impingement [38]. 20
Figure 2.5 Computed peak impact pressure along the centerline of subsonic and supersonic jets with the same mass flow [21].
22
Figure 2.6 (a) Normal shock wave; (b) oblique shock wave; (c) expansion wave.
27
Figure 2.7 Ratio of pitot pressure across an oblique shock wave as a function of shock angle and upstream Mach number [28].
29
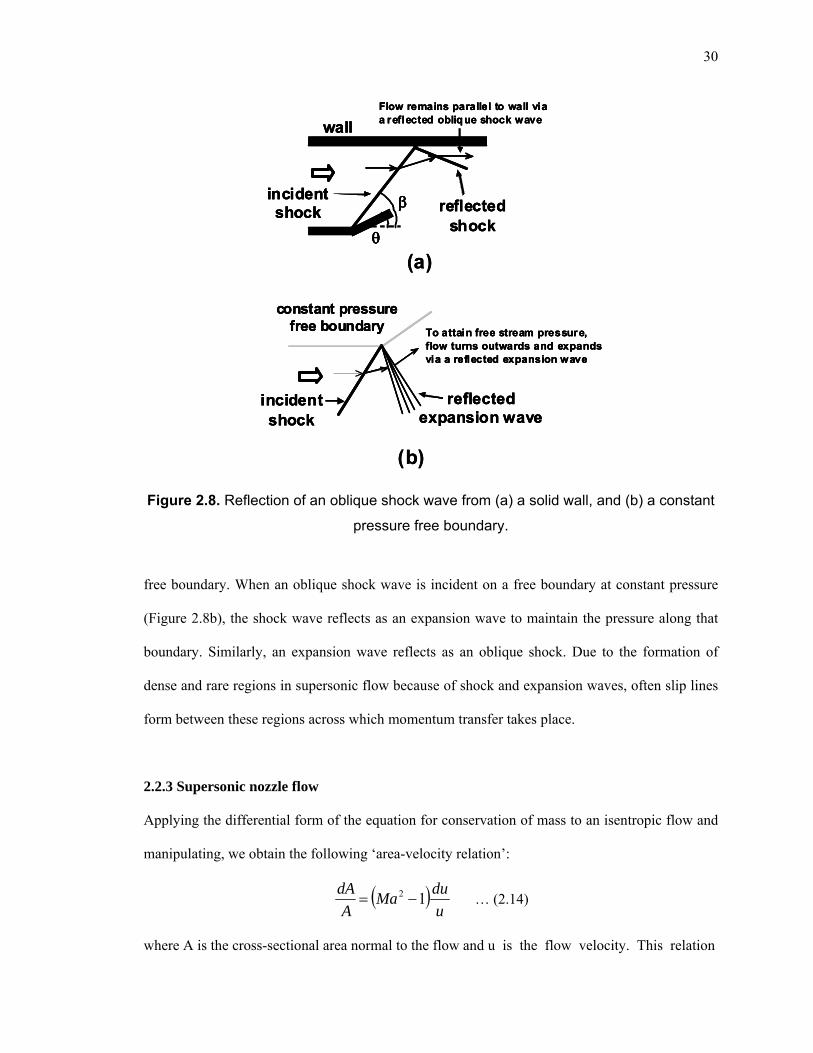
Figure 2.8 Reflection of an oblique shock wave from (a) a solid wall, and (b) a constant pressure free boundary.
30
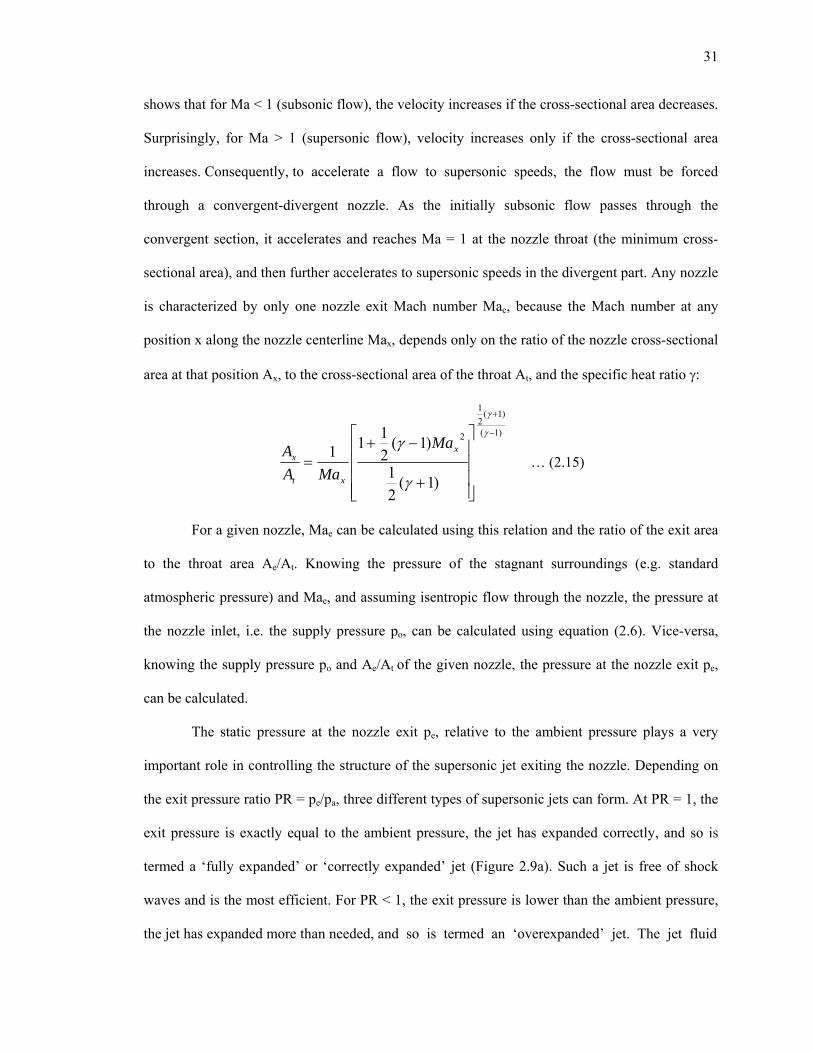
Figure 2.9 Supersonic jets; (a) fully expanded; (b) overexpanded; (c) underexpanded.
32
x
Figure 2.10 Planar refraction of light passing through a region with a negative vertical refractive index gradient [84].
34
Figure 2.11 A conventional 2-mirror z-type schlieren system [84]. 35
Figure 2.12 A mildly underexpanded jet [18]; (a) schematic of jet structure; (b) sonic jet with PR = 1.59.
39
Figure 2.13 A strongly underexpanded jet [18]; (a) schematic of jet structure; (b) sonic jet with PR = 4.09.
39
Figure 2.14 Acoustic feedback mechanism producing screech noise and oscillations in a rectangular jet (instantaneous schlieren image, [76]).
42
Figure 2.15 Oscillation modes exhibited by a screeching jet generated using a Mach 1.41 convergent-divergent nozzle [83].
44
Figure 2.16 Parameters governing the flow field of a jet impinging on a cylinder.
44
Figure 2.17 Flow field of a jet impinging on a cylinder placed away from the nozzle; the level of turbulence in the impinging jet is high.
45
Figure 2.18 The Coanda effect; (a) a free jet in the absence of a curved surface; (b) a jet attached to a cylinder due to the Coanda effect.
46
Figure 2.19 Supersonic jet impinging on a flat surface. 48
Figure 2.20 Bubble of recirculating fluid between the plate and plate shock [18]. 48
Figure 2.21 The shock layer, transonic zone, and beginning of the near wall jet during supersonic jet impingement on a flat plate [15].
49
Chapter 3
Figure 3.1 Experimental apparatus; (a) schematic; (b) photograph. 55
Figure 3.2 (a) Parabolic mirror used in the schlieren system, with custom-designed stand; (b) high-speed camera.
60
Figure 3.3 Pitot probe designed to measure supersonic jet PIP; (a) photograph; (b) schematic showing probe internal design.
61
Figure 3.4 Typical voltage signal of jet peak impact pressure, obtained using the pitot probe.
62
Figure 3.5 Pitot probe positioning system (inset shows the magnetic stand used to clamp the probe to reduce vibration).
63
Figure 3.6 (a) LabVIEW control and data acquisition (DAQ) system diagram; (b) photograph of the control system hardware.
67
xi

Figure 3.7 Sample of a contrast-enhanced average image. 69
Chapter 4
Figure 4.1 Supersonic jet used in this work. 71
Figure 4.2 Centreline PIP variation in the supersonic jet. 73
Figure 4.3 Radial PIP profiles of the jet at different axial locations. 75
Figure 4.4 (a) Definition of jet radius; (b) jet radius versus axial distance from nozzle exit (jet spread); data from [47] is shown for comparison.
77
Chapter 5
Figure 5.1 Jet impinging on a tube at different offsets. 80
Figure 5.2 Formation of secondary jets. 81
Figure 5.3 Secondary jet angle versus offset. 83
Figure 5.4 Effect of nozzle-tube distance on jet/tube interaction for three tube sizes (offset = 0).
85
Chapter 6
Figure 6.1 Typical layout of boiler tubes. 90
Figure 6.2 Model superheater platens. 92
Figure 6.3 Jet impingement on a platen at different offsets. 93
Figure 6.4 Jet PIP exerted near the surface of a model superheater platen as a function of offset and distance; probe at (a) 72 mm; (b) 103 mm; (c) 151 mm from nozzle (po is the same for all cases) [39].
94
Figure 6.5 (a) Jet midway between two platens – no interaction; (b) jet touching one platen – interaction can be seen (flow is from right to left in both cases).
96
Figure 6.6 Jet midway between superheater platens. 96
Figure 6.7 Model generating bank. 98
Figure 6.8 Jet flow into a model generating bank, at different offsets. 100
xii
Figure 6.9 Flow field inside a model generating bank, away from the nozzle, for jet impingement at an offset (ε/R = 1.05, image e in Figure 6.8); the nozzle is to the right hand side.
101
Figure 6.10 Peak impact pressure profiles of a jet midway between model generating bank tubes.
102
Figure 6.11 Flow of a jet midway between model generating bank tubes; the dashed arrows indicate the local flow direction.
104
Figure 6.12 Jet midway between generating bank tubes. 106
Figure 6.13 Flow midway between two rows of tubes farther from the nozzle. 108
Figure 6.14 Experimental module with tube oriented vertically in front of the nozzle for visualizing secondary jets and measuring their centreline PIP.
109
Figure 6.15 Secondary jet at 0.75R offset for a 13 mm (0.5”) OD tube (de/D = 0.58); (a) tube horizontal in front of the nozzle; (b) tube vertical in front of the nozzle.
111
Figure 6.16 Secondary jets at different offsets for a 13 mm (0.5”) OD tube (de/D = 0.58).
113
Figure 6.17 Centreline peak impact pressure of secondary jets at different offsets, for a 13 mm (0.5”) OD tube (de/D = 0.58); the primary jet peak impact pressure is shown for comparison.
114
Figure 6.18 Model economizer tubes: (a) schematic of a row; (b) tube assembly. 116
Figure 6.19 Jet impinging on economizer tubes at different offsets. 118
Figure 6.20 Secondary jet angle versus offset for the superheater, generating bank and economizer tube arrangements.
119
Figure 6.21 Peak impact pressure profiles of a jet midway between model economizer tubes.
120
Figure 6.22 Impingement of a secondary jet on a tube behind the first tube of a generating bank row.
125
Chapter 7
Figure 7.1 Entrained Flow Reactor (EFR) at the University of Toronto; (a) schematic; (b) photograph (tube is located near the EFR exit); (c) carryover deposit formed on a tube using the EFR.
128
Figure 7.2 Breakup of a synthetic deposit by jet impingement, visualized using the schlieren technique (continued on the next page).
132
xiii
Chapter 8
Figure 8.1 Centreline peak impact pressure of primary and secondary jets; the primary jet can be considered as exiting from an inclined nozzle, whereas the secondary jets result from the impingement of a jet from a straight nozzle (data shown is the same as in Figure 6.17).
135
Figure 8.2 (a) Sootblower jet from inclined nozzles; (b) loss in jet penetration between platens due to inclination angle α.
136
Figure 8.3 Behaviour of h as a function of α. 137
Figure 8.4 Effect of nozzle inclination angle α on jet/platen interaction. 139
xiv
LIST OF APPENDICES
Appendix A Schlieren Images of Jet Temporal Development 155
Appendix B LabVIEW Graphical Program to Control the Data Acquisition System
156
Appendix C Interaction between a Jet and a Single Tube: Supplementary Results
157
Appendix D Typical Kraft Recovery Boiler Tube Arrangements: Results of a Recent Survey (August 2010)
163
Appendix E Schlieren Images of a Jet Midway between Two Rows of Finned Economizer Tubes
165
xv

NOMENCLATURE
a Local speed of sound
A Area
c Speed of light in a medium
co Speed of light in vacuum, 3 × 10⁸ m/s
cp Specific heat of gas at constant pressure
cv Specific heat of gas at constant volume
d Diameter
dc Characteristic length
ddeposit Outer diameter of a model deposit
dj Jet diameter at an axial location along the jet
D Outer diameter of tube
f Frequency of vortex shedding just downstream of a cylinder submerged in unlimited parallel flow
Fjet Sootblower jet force
h Length of a superheater platen that is exposed to a sootblower jet from an inclined nozzle
h Deposit thickness
H Side-spacing between boiler tubes
k Coefficient for turbulent transfer of momentum
K Gladstone-Dale constant
l Tube length
L Length of a typical row or platen of boiler tubes
ṁ Mass flow rate
xvi

Mj Fully expanded jet Mach number, in [50]
MW Gas molecular weight
Ma Mach number, Ma = u/a
Mac Convective Mach number, in [63]
Man Normal component of Mach number
n Local refractive index, n = co/c; also, sample size (number of measurements in a sample or data set)
p Pressure
ppit Pitot pressure
q Member (or a single measurement) of a sample or data set (of measurements)
q Average of a sample or data set (of measurements)
r Radial coordinate
R Outer radius of tube
Rgas Specific gas constant, Rgas = RU/MW
RU Universal gas constant, RU = 8.314 kJ/kg-K
Re Reynolds number
S Front-to-back spacing between boiler tubes
St Strouhal number, St = fd/2u
t Time
T Temperature; also, fin thickness
u Axial velocity
ou Axial velocity normalized by nozzle exit velocity, in [44]
W Fin width
x Axial coordinate
xc Jet core length
xvii
x Axial coordinate normalized by nozzle exit radius, in [44]
Greek Symbols
α Nozzle inclination angle
Oblique shock wave angle
Offset between jet and tube centerlines; also, deflection angle of refracted light rays
Specific heat ratio of a gas, = cp/cv
Dynamic viscosity
Rotational speed of sootblower
Prandtl-Meyer expansion wave angle
max Maximum value of a dimensionless deposit ‘shape function’, in [35]
Density
e Density normalized by nozzle exit density, in [44]
adh Deposit adhesion strength
t Deposit tensile strength
Secondary jet angle defined in this thesis; also, flow deflection angle
Prandtl-Meyer function,
1tan)1(1
1tan
1
1)( 2121
MaMaMa
Subscripts
a Ambient conditions
e Nozzle exit
i Measurement number in a sample or data set (of measurements)
j Local jet conditions
xviii
xix
o Total or stagnation conditions
t Nozzle throat
x Axial location
1 Conditions upstream of a shock or expansion wave; also, initial state of a process
2 Conditions downstream of a shock or expansion wave; also, final state of a process
Abbreviations
EFR Entrained Flow Reactor
ID Inner diameter
OD Outer diameter
PIP Peak impact pressure
PR Pressure ratio, PR = pe/pa
SD Standard deviation
SE Standard error
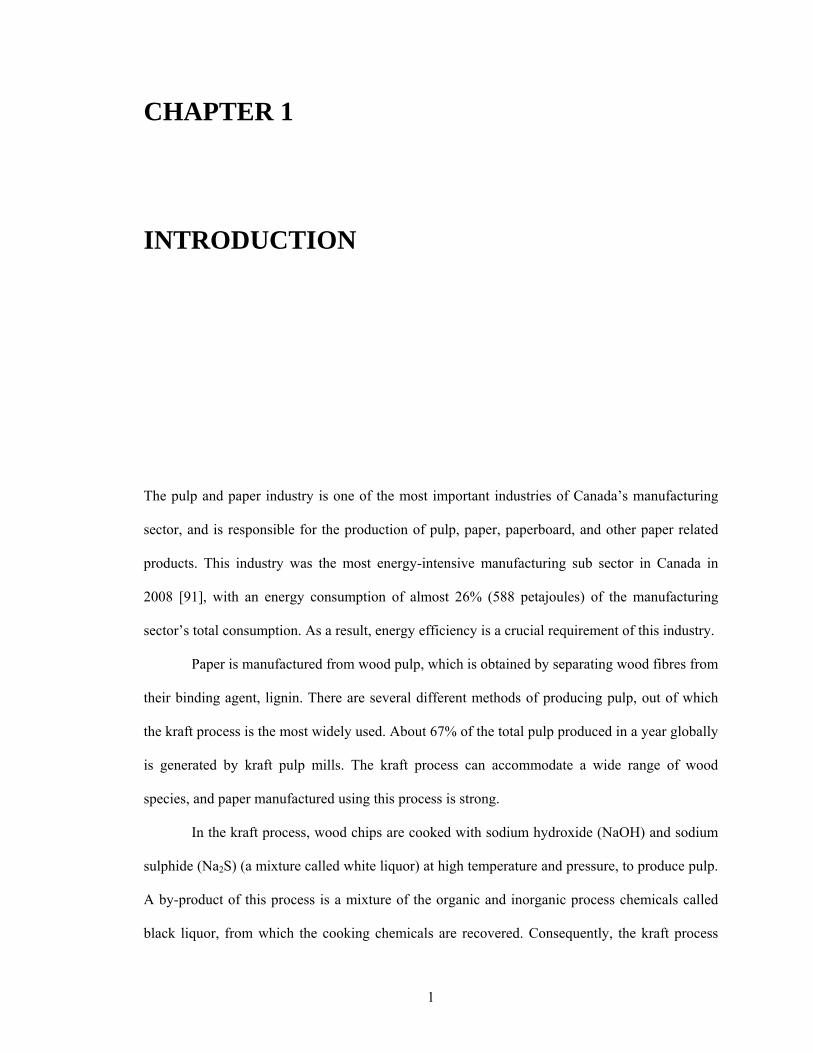
CHAPTER 1
INTRODUCTION
The pulp and paper industry is one of the most important industries of Canada’s manufacturing
sector, and is responsible for the production of pulp, paper, paperboard, and other paper related
products. This industry was the most energy-intensive manufacturing sub sector in Canada in
2008 [91], with an energy consumption of almost 26% (588 petajoules) of the manufacturing
sector’s total consumption. As a result, energy efficiency is a crucial requirement of this industry.
Paper is manufactured from wood pulp, which is obtained by separating wood fibres from
their binding agent, lignin. There are several different methods of producing pulp, out of which
the kraft process is the most widely used. About 67% of the total pulp produced in a year globally
is generated by kraft pulp mills. The kraft process can accommodate a wide range of wood
species, and paper manufactured using this process is strong.
In the kraft process, wood chips are cooked with sodium hydroxide (NaOH) and sodium
sulphide (Na2S) (a mixture called white liquor) at high temperature and pressure, to produce pulp.
A by-product of this process is a mixture of the organic and inorganic process chemicals called
black liquor, from which the cooking chemicals are recovered. Consequently, the kraft process
1
2
consists of two main cycles - pulping and chemical recovery. The recovery boiler is one of the
most important components of the recovery cycle, and is used to burn black liquor for two main
purposes - to recover the inorganic cooking chemicals used in the pulping process, and to make
use of the chemical energy in the organic portion of the liquor to generate steam for the mill
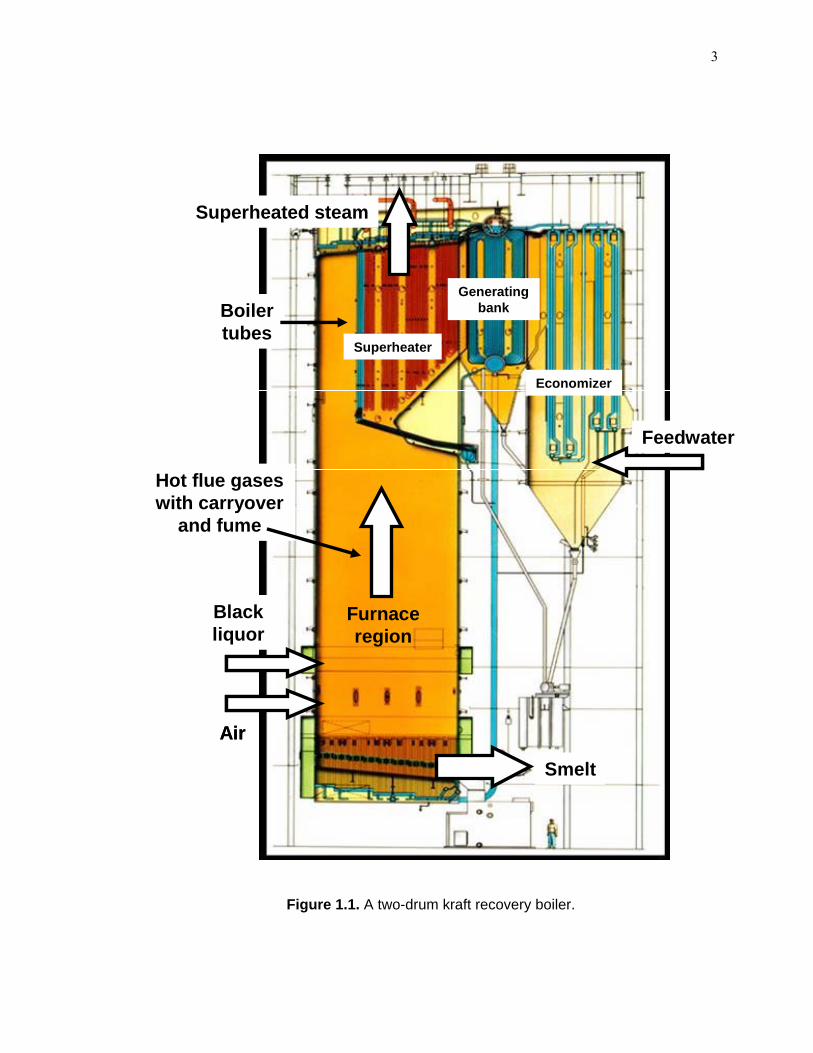
[105]. Figure 1.1 schematically shows a two-drum kraft recovery boiler. Black liquor is burned in
the furnace region at the bottom of the boiler. At the top, the boiler contains three convective heat
transfer sections consisting of tubes – economizer, generating bank, and superheater sections.
Feedwater to be converted to steam flows through the tubes in these sections, from the
economizer to the superheater. The hot flue gases resulting from black liquor combustion travel
upwards from the furnace region and between the tubes, transferring heat to the feedwater and
converting it into high pressure superheated steam. This steam is sent through a turbine to
generate electricity for the mill, and the low pressure steam exiting the turbine is used in process
applications around the mill.
The kraft process produces about 1.5 tons of black liquor dry solids (black liquor without
water) per ton of pulp produced. For every ton of dry solids fired in the boiler, about 3.5 tons of
high pressure steam are generated by the recovery boiler. Depending on the steam quality and
type of turbine, a 1000 ton per day kraft pulp mill can generate 25 to 35 MW of electricity by
burning 1500 tons per day of black liquor dry solids in its recovery boiler [105]. The recovery
boiler typically generates about 60% of the electricity needed by the mill. Increasing the
efficiency of the boiler is always desired to improve the energy efficiency and self-sufficiency of
the mill, because the boiler is the main bottleneck in pulp production, and one of the main reasons
for this is fouling.
3
Superheated steam
Figure 1.1. A two-drum kraft recovery boiler.
Furnace region
Feedwater
Boiler tubes
Hot flue gases with carryover
and fume
Black liquor
Air
Generatingbank
Economizer
Superheater
Smelt
Superheated steam
Furnace region
Feedwater
Boiler tubes
Generatingbank
Superheater
Economizer
Hot flue gases with carryover
and fume
Black liquor
Air
Smelt
4
1.1 Fouling in Kraft Recovery Boilers and Sootblowing
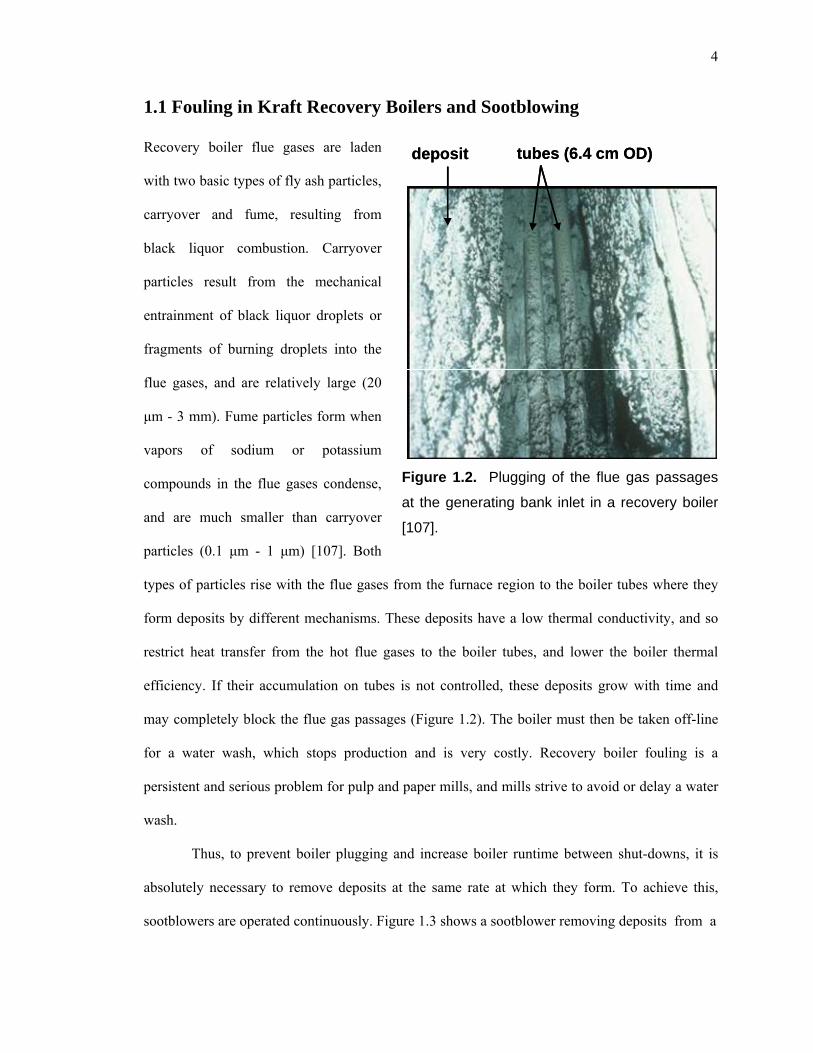
Recovery boiler flue gases are laden
with two basic types of fly ash particles,
carryover and fume, resulting from
black liquor combustion. Carryover
particles result from the mechanical
entrainment of black liquor droplets or
fragments of burning droplets into the
flue gases, and are relatively large (20
μm - 3 mm). Fume particles form when
vapors of sodium or potassium
compounds in the flue gases condense,
and are much smaller than carryover
particles (0.1 μm - 1 μm) [107]. Both
types of particles rise with the flue gases from the furnace region to the boiler tubes where they
form deposits by different mechanisms. These deposits have a low thermal conductivity, and so
restrict heat transfer from the hot flue gases to the boiler tubes, and lower the boiler thermal
efficiency. If their accumulation on tubes is not controlled, these deposits grow with time and
may completely block the flue gas passages (Figure 1.2). The boiler must then be taken off-line
for a water wash, which stops production and is very costly. Recovery boiler fouling is a
persistent and serious problem for pulp and paper mills, and mills strive to avoid or delay a water
wash.
deposit tubes (6.4 cm OD)
Thus, to prevent boiler plugging and increase boiler runtime between shut-downs, it is
absolutely necessary to remove deposits at the same rate at which they form. To achieve this,
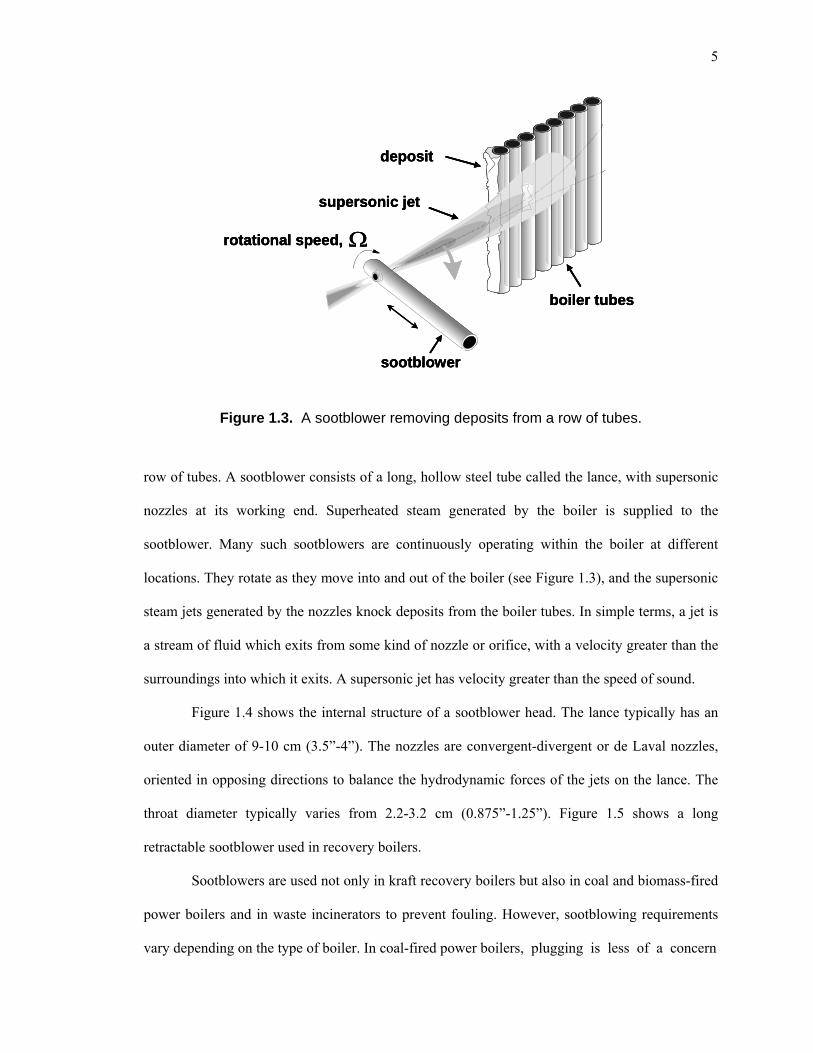
sootblowers are operated continuously. Figure 1.3 shows a sootblower removing deposits from a
Figure 1.2. Plugging of the flue gas passages
at the generating bank inlet in a recovery boiler
[107].
deposit tubes (6.4 cm OD)
5
sootblower
supersonic jet
Figure 1.3. A sootblower removing deposits from a row of tubes.
row of tubes. A sootblower consists of a long, hollow steel tube called the lance, with supersonic
nozzles at its working end. Superheated steam generated by the boiler is supplied to the
sootblower. Many such sootblowers are continuously operating within the boiler at different
locations. They rotate as they move into and out of the boiler (see Figure 1.3), and the supersonic
steam jets generated by the nozzles knock deposits from the boiler tubes. In simple terms, a jet is
a stream of fluid which exits from some kind of nozzle or orifice, with a velocity greater than the
surroundings into which it exits. A supersonic jet has velocity greater than the speed of sound.
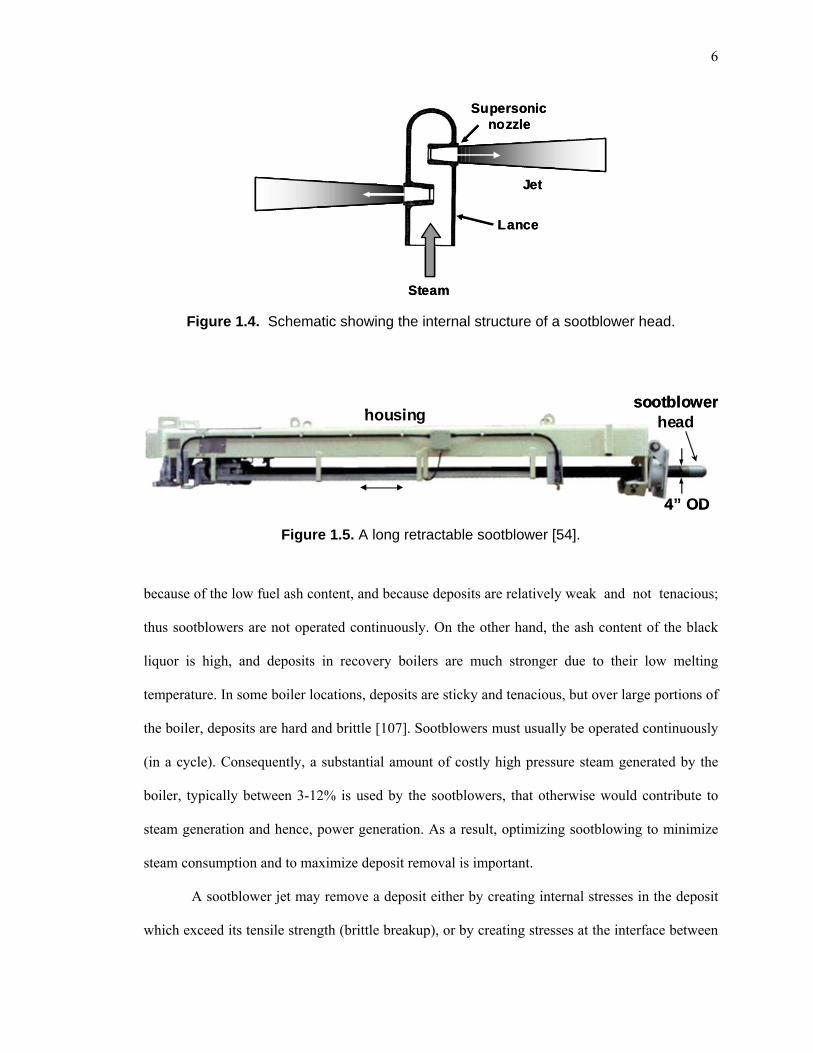
Figure 1.4 shows the internal structure of a sootblower head. The lance typically has an
outer diameter of 9-10 cm (3.5”-4”). The nozzles are convergent-divergent or de Laval nozzles,
oriented in opposing directions to balance the hydrodynamic forces of the jets on the lance. The
throat diameter typically varies from 2.2-3.2 cm (0.875”-1.25”). Figure 1.5 shows a long
retractable sootblower used in recovery boilers.
Sootblowers are used not only in kraft recovery boilers but also in coal and biomass-fired
power boilers and in waste incinerators to prevent fouling. However, sootblowing requirements
vary depending on the type of boiler. In coal-fired power boilers, plugging is less of a concern
boiler tubes
deposit
rotational speed,
sootblower
supersonic jet
boiler tubes
deposit
rotational speed,
sootblower
supersonic jet
boiler tubes
deposit
rotational speed,
6
Steam
Lance
Supersonicnozzle
Jet
Steam
Lance
Supersonicnozzle
Jet
Figure 1.4. Schematic showing the internal structure of a sootblower head.
4” OD
housingsootblower
head
4” OD
housingsootblower
head
Figure 1.5. A long retractable sootblower [54].
because of the low fuel ash content, and because deposits are relatively weak and not tenacious;
thus sootblowers are not operated continuously. On the other hand, the ash content of the black
liquor is high, and deposits in recovery boilers are much stronger due to their low melting
temperature. In some boiler locations, deposits are sticky and tenacious, but over large portions of
the boiler, deposits are hard and brittle [107]. Sootblowers must usually be operated continuously
(in a cycle). Consequently, a substantial amount of costly high pressure steam generated by the
boiler, typically between 3-12% is used by the sootblowers, that otherwise would contribute to
steam generation and hence, power generation. As a result, optimizing sootblowing to minimize
steam consumption and to maximize deposit removal is important.
A sootblower jet may remove a deposit either by creating internal stresses in the deposit
which exceed its tensile strength (brittle breakup), or by creating stresses at the interface between

7
the deposit and the tube which exceed the adhesion strength of the deposit (debonding), or by
both ways. Conventionally, the performance of the jet in removing deposits has been correlated
with the jet peak impact pressure (PIP) [32], which is the pressure a pitot tube would measure
when inserted into the jet at its centerline. It is also the pressure that the jet would exert on a
deposit. However, the jet force is also an important quantity. The PIP is the pressure at a single
point, whereas the force is the integral of the pressure across the jet cross-section. As a result, the
PIP decreases faster with distance than the force, because the axial momentum is conserved in the
jet.
Due to the fast decay of PIP with distance from the nozzle, the interaction between the jet
and a tube/deposit is the strongest when the jet impinges on the tube/deposit head-on (i.e. when
the jet impinges on the tube/deposit orthogonally), and hence, this interaction is the most
important. This interaction weakens as the sootblower rotates, because the effective distance
between the nozzle and tube/deposit increases as the jet impinges on the tube/deposit at an angle.
Based on trigonometric calculations and decrease of jet force with distance, Tandra [97] proposed
that the most effective zone of cleaning for rotating sootblowers is between 45° with respect to
the head-on or strongest impingement position. The probability of deposit removal decreases
outside this zone.
During operation, a sootblower jet propagates between different tube arrangements. Since
the jet is supersonic, it is sensitive to any obstacle or disturbance in its flow. An obstacle in a
supersonic flow creates a series of complicated shock and expansion waves, which, in the case of
a jet, can directly affect the jet structure, and hence jet strength (PIP) and penetration. If the PIP is
reduced, then the jet may not be able to remove deposits, particularly those away from the nozzle.
As a result, just as it is important to understand how a sootblower jet breaks and removes
deposits, it is also important to understand how the jet interacts with the tubes in different
arrangements found in a recovery boiler, so that such information could be used to direct the jet
onto deposits to yield maximum impact. However, a sootblower jet and its interaction with tubes
8
have never been visualized to date, mainly because of the hostile conditions inside the boiler, and
because these jets cannot be seen by the naked eye, or via regular photographic process.
1.2 Recovery Boiler Tube Arrangements
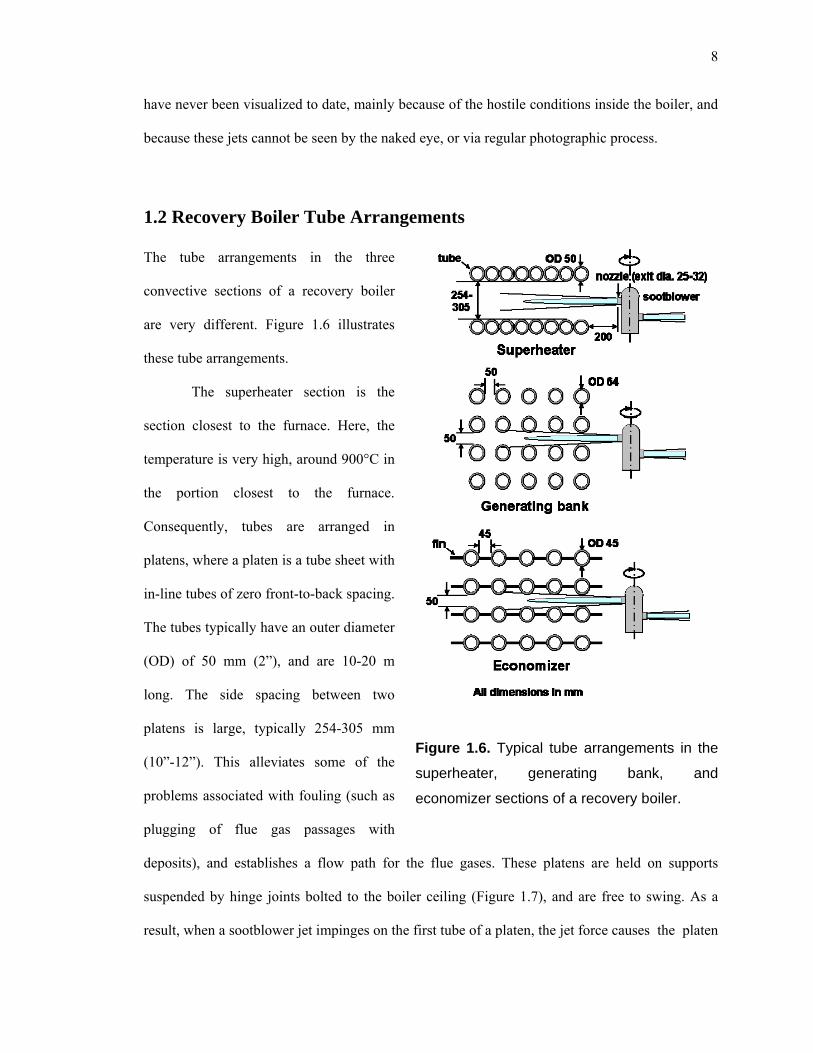
The tube arrangements in the three
convective sections of a recovery boiler
are very different. Figure 1.6 illustrates
these tube arrangements.
The superheater section is the
section closest to the furnace. Here, the
temperature is very high, around 900°C in
the portion closest to the furnace.
Consequently, tubes are arranged in
platens, where a platen is a tube sheet with
in-line tubes of zero front-to-back spacing.
The tubes typically have an outer diameter
(OD) of 50 mm (2”), and are 10-20 m
long. The side spacing between two
platens is large, typically 254-305 mm
(10”-12”). This alleviates some of the
problems associated with fouling (such as
plugging of flue gas passages with
deposits), and establishes a flow path for the flue gases. These platens are held on supports
suspended by hinge joints bolted to the boiler ceiling (Figure 1.7), and are free to swing. As a
result, when a sootblower jet impinges on the first tube of a platen, the jet force causes the platen
Figure 1.6. Typical tube arrangements in the
superheater, generating bank, and
economizer sections of a recovery boiler.
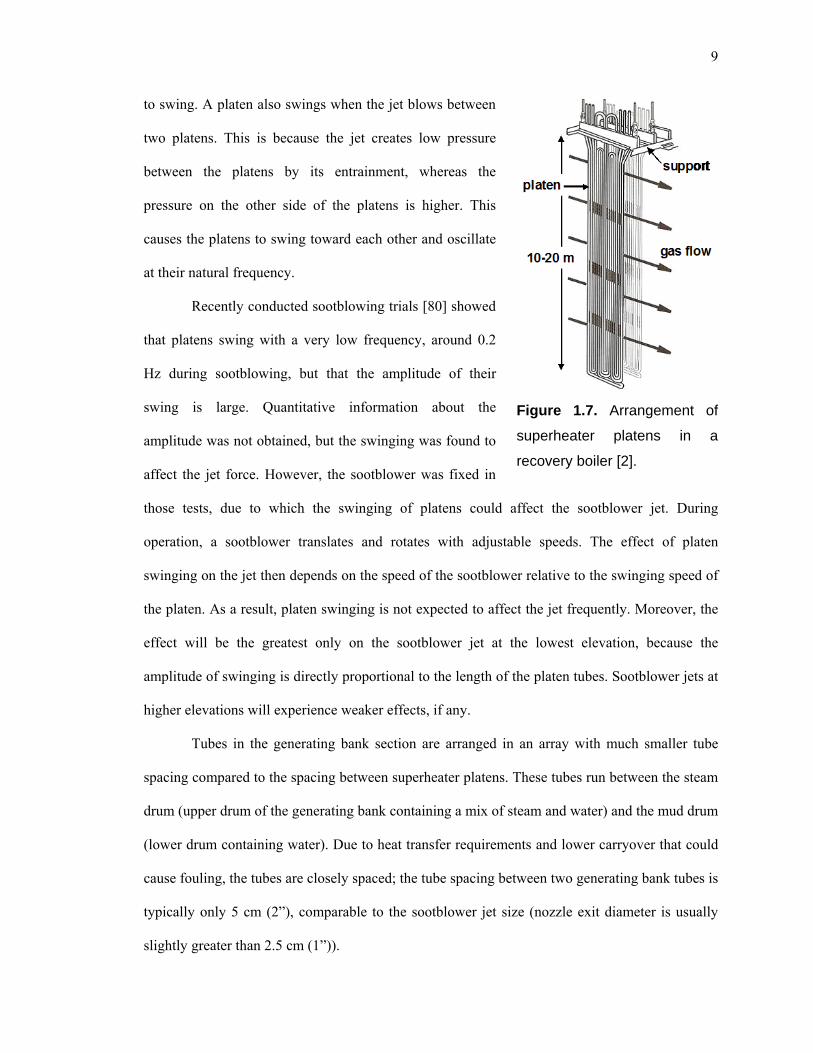
9
to swing. A platen also swings when the jet blows between
two platens. This is because the jet creates low pressure
between the platens by its entrainment, whereas the
pressure on the other side of the platens is higher. This
causes the platens to swing toward each other and oscillate
at their natural frequency.
Recently conducted sootblowing trials [80] showed
that platens swing with a very low frequency, around 0.2
Hz during sootblowing, but that the amplitude of their
swing is large. Quantitative information about the
amplitude was not obtained, but the swinging was found to
affect the jet force. However, the sootblower was fixed in
those tests, due to which the swinging of platens could affect the sootblower jet. During
operation, a sootblower translates and rotates with adjustable speeds. The effect of platen
swinging on the jet then depends on the speed of the sootblower relative to the swinging speed of
the platen. As a result, platen swinging is not expected to affect the jet frequently. Moreover, the
effect will be the greatest only on the sootblower jet at the lowest elevation, because the
amplitude of swinging is directly proportional to the length of the platen tubes. Sootblower jets at
higher elevations will experience weaker effects, if any.
Figure 1.7. Arrangement of
superheater platens in a
recovery boiler [2].
Tubes in the generating bank section are arranged in an array with much smaller tube
spacing compared to the spacing between superheater platens. These tubes run between the steam
drum (upper drum of the generating bank containing a mix of steam and water) and the mud drum
(lower drum containing water). Due to heat transfer requirements and lower carryover that could
cause fouling, the tubes are closely spaced; the tube spacing between two generating bank tubes is
typically only 5 cm (2”), comparable to the sootblower jet size (nozzle exit diameter is usually
slightly greater than 2.5 cm (1”)).
10
The tubes in the economizer section are arranged in a manner similar to that in the
generating bank. However, due to the lower temperature in this section, modern generating bank
and economizer tubes have fins to increase the heat transfer area. These fins may alter the jet
impingement flow field strongly. As a result, the interaction between a sootblower jet and
generating bank and economizer tubes is expected to be stronger than that with superheater tubes.
Understanding the interaction between a supersonic jet and tubes is the first important
and necessary step in developing improved sootblowing strategies. ‘Seeing’ this interaction will
yield valuable information about the flow field during sootblowing. The only way to visualize
such flows, is by taking advantage of flow characteristics such as shock and expansion waves,
which create density gradients, and hence, refractive index gradients in the jet fluid. Such
refractive index gradients can be captured by special optical techniques such as the schlieren
technique, and thus the jet and its interaction with tubes can be made visible.
1.3 Thesis Objectives
The main objectives of this thesis are:
(1) To visualize and document the interaction of a supersonic jet with a single tube, and
determine the effects of the governing parameters on this interaction. This is important
because the sootblower jet always interacts with the first tube of a given row of tubes during
operation, and this interaction determines the subsequent flow of the jet.
(2) To visualize and document the interaction of a supersonic jet with models of the typical tube
arrangements in the three convective sections of a recovery boiler, and to quantify the effects
of this interaction on jet strength by measuring the jet peak impact pressure between tubes.
These three sections are the main regions of the boiler where fouling occurs. This
information is useful in determining the sootblowing effectiveness in these sections.

11
Just as understanding the flow around a tube is the first important step before deposition
on a tube can be understood, understanding the flow of a supersonic jet between and its
interaction with tube bundles is the first necessary step before its interaction with deposits can be
understood. Therefore this thesis investigated the interaction of a supersonic jet with clean round
tubes instead of the interaction of a particle-laden jet with fouled tubes having an irregular cross-
section. Information obtained from the former study will provide a strong foundation for the latter
study.
The objectives described above were achieved through lab-scale experimentation. As will
be evident later in this thesis, this work has helped evaluate the effectiveness of current
sootblowing practices, and has shed light on how the design of the superheater, generating bank,
and economizer sections of a boiler affects sootblowing effectiveness in those sections. It has also
provided potentially useful data for improving boiler tube arrangements with the purpose of
increasing sootblowing effectiveness and reducing sootblower-assisted boiler tube erosion and
corrosion.
CHAPTER 2
LITERATURE SURVEY
This chapter reviews previous work related to sootblowing optimization, as well as free and
impinging supersonic jets. As sootblower jets are supersonic, basic supersonic flow theory,
including nozzle flow, is central to understanding these jets and their interaction with tubes, so
the relevant portions of this theory are also presented. Finally, conclusions are drawn from the
literature survey.
2.1 Fouling and Sootblowing in Kraft Recovery Boilers
The effectiveness of sootblowing depends upon many factors: those that characterize the
sootblower, such as steam flow rate, supply pressure, and nozzle design, and those that
characterize the deposits, such as size and strength. Understanding the effects of these parameters
on deposit removal effectiveness is important in order to devise effective sootblowing strategies.
Most research on fouling in various boilers (for e.g. [9, 22, 33, 72, 79, 108]) has focused on
measuring and modeling deposit formation and growth, and studying deposit characteristics.
Sootblowing optimization, and more specifically sootblower jet dynamics and jet-tube/deposit
12
13
interaction have received far less attention. Most of the research related to these topics has been
performed at the University of Toronto, and has focused on deposit characterization, as well as
sootblower jet dynamics and deposit removal mechanisms. The main results of this research are
summarized next.
2.1.1 Deposits in recovery boilers
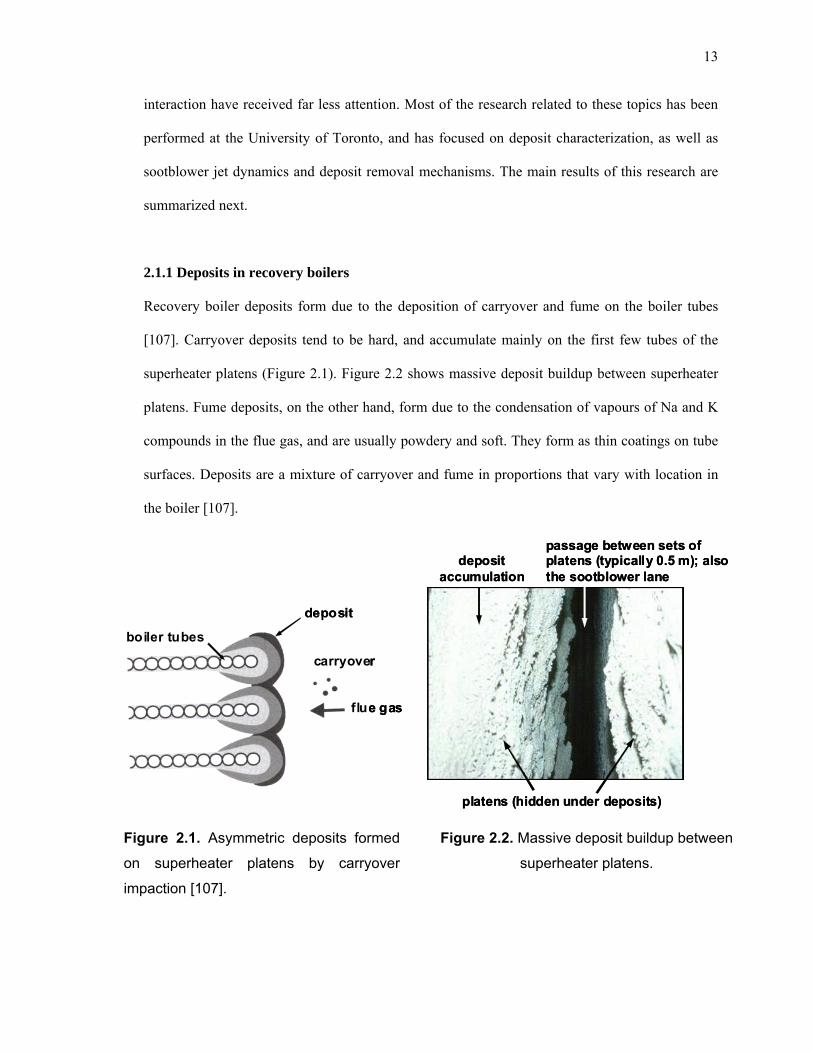
Recovery boiler deposits form due to the deposition of carryover and fume on the boiler tubes
[107]. Carryover deposits tend to be hard, and accumulate mainly on the first few tubes of the
superheater platens (Figure 2.1). Figure 2.2 shows massive deposit buildup between superheater
platens. Fume deposits, on the other hand, form due to the condensation of vapours of Na and K
compounds in the flue gas, and are usually powdery and soft. They form as thin coatings on tube
surfaces. Deposits are a mixture of carryover and fume in proportions that vary with location in
the boiler [107].
Figure 2.1. Asymmetric deposits formed
on superheater platens by carryover
impaction [107].
Figure 2.2. Massive deposit buildup between
superheater platens.
passage between sets of platens (typically 0.5 m); also the sootblower lane
deposit accumulation
passage between sets of platens (typically 0.5 m); also the sootblower lane
deposit accumulation
platens (hidden under deposits)
boiler tubes
carryover
deposit
flue gas
boiler tubes
carryover
deposit
flue gas
platens (hidden under deposits)
14
The melting behaviour of deposits plays a vital role in boiler fouling [7, 106, 110]. Being
chemical mixtures, deposits have several characteristic temperatures. The “sticky temperature” is
defined as the temperature at which the deposit contains 15-20% liquid phase, and becomes
sticky to the tube. The “radical deformation” temperature is the temperature at which the material
contains about 70% liquid phase, with enough fluid that it can run off due to its own weight.
Between these two temperatures, deposits are sticky and massive deposit accumulation can occur.
These temperatures are strong functions of the deposit chloride and potassium contents. For a
given level of potassium, increasing the chloride content from 0 to 10 mol% Cl/(Na+K) can
decrease the sticky temperature by 280°C. The radical deformation temperature also decreases
with increase in the chloride content, but less drastically. For a given level of chloride, increasing
the potassium content decreases the sticky temperature but the effect is much less pronounced
[107].
The mechanical behaviour of deposits is closely linked to their thermal behaviour. The
tensile and adhesion strengths of deposits depend strongly on the flue gas and tube temperatures
respectively, in addition to many other parameters [35]. At low temperatures (less than 300°C),
both these strengths are very low. As the flue gas and tube temperatures increase, these strengths
increase due to sintering and reach a maximum. With further increases in temperature, the
strengths decrease due to the formation of a liquid phase in the deposit. The deposit adhesion
strength is generally lower than the tensile strength. Piroozmand [65] showed that deposit tensile
strength increases exponentially with density.
Deposits in most sections of the boiler are brittle. Generally, deposits such as those in the
superheater section are brittle at temperatures lower than 500C and they completely melt above
about 820C [107]; deposits are generally big and hard as they form due to inertial impaction of
big carryover particles. Deposits in the generating bank section are also brittle, but weaker than
those in the superheater. Deposits in the economizer section are mainly fume deposits, so they are
15
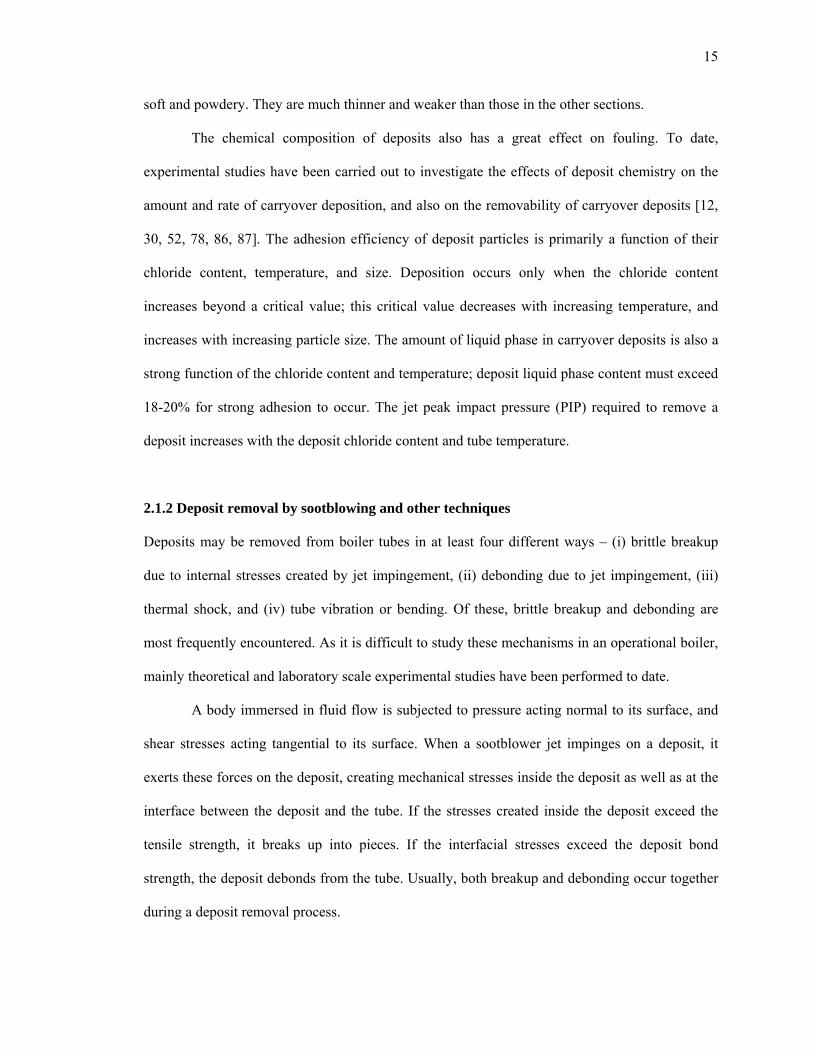
soft and powdery. They are much thinner and weaker than those in the other sections.
The chemical composition of deposits also has a great effect on fouling. To date,
experimental studies have been carried out to investigate the effects of deposit chemistry on the
amount and rate of carryover deposition, and also on the removability of carryover deposits [12,
30, 52, 78, 86, 87]. The adhesion efficiency of deposit particles is primarily a function of their
chloride content, temperature, and size. Deposition occurs only when the chloride content
increases beyond a critical value; this critical value decreases with increasing temperature, and
increases with increasing particle size. The amount of liquid phase in carryover deposits is also a
strong function of the chloride content and temperature; deposit liquid phase content must exceed
18-20% for strong adhesion to occur. The jet peak impact pressure (PIP) required to remove a
deposit increases with the deposit chloride content and tube temperature.
2.1.2 Deposit removal by sootblowing and other techniques
Deposits may be removed from boiler tubes in at least four different ways – (i) brittle breakup
due to internal stresses created by jet impingement, (ii) debonding due to jet impingement, (iii)
thermal shock, and (iv) tube vibration or bending. Of these, brittle breakup and debonding are
most frequently encountered. As it is difficult to study these mechanisms in an operational boiler,
mainly theoretical and laboratory scale experimental studies have been performed to date.
A body immersed in fluid flow is subjected to pressure acting normal to its surface, and
shear stresses acting tangential to its surface. When a sootblower jet impinges on a deposit, it
exerts these forces on the deposit, creating mechanical stresses inside the deposit as well as at the
interface between the deposit and the tube. If the stresses created inside the deposit exceed the
tensile strength, it breaks up into pieces. If the interfacial stresses exceed the deposit bond
strength, the deposit debonds from the tube. Usually, both breakup and debonding occur together
during a deposit removal process.

16
Brittle breakup due to internal stresses. In relation to sootblowing in recovery boilers,
Kaliazine et al. [37] were the first to investigate the effects of different operating parameters on
the breakup of deposits impinged by a supersonic jet. They conducted deposit breakup
experiments using model deposits made from gypsum, and a supersonic air jet. First, they
observed that breakup of brittle deposits occurs rapidly, within a few milliseconds. Noting that
the jet-to-deposit exposure time in recovery boilers is on the order of 100 ms, their finding
implies that where deposits are thin and brittle, there is room for reducing sootblowing steam
consumption by appropriately increasing the lance speed. Second, based on a theoretical analysis,
they proposed the following criterion for brittle breakup:
tPIP 2 … (2.1)
where PIP is the value required for breakup and t is the deposit material tensile strength. This
criterion was found to agree reasonably well with their experimental results.
Recently, Eslamian et al. [23, 24] and Pophali [69] performed experiments similar to
those of Kaliazine et al. [37], but studied the brittle breakup mechanism in detail via high-speed
photography. Their work identified three different deposit breakup mechanisms, which correlated
with the jet-to-deposit diameter ratio (see Table 2.1). Crack formation was found to be vital for
Table 2.1: Brittle deposit breakup mechanisms [68].
Observed Breakup
Mechanism
Jet-to-deposit
Diameter Ratio Breakup Image
Axial crack formation dj/ddeposit > 0.51
Surface erosion + axial
crack formation 0.36 < dj/ddeposit < 0.51
Surface erosion + spalling dj/ddeposit ≤ 0.36

17
fast deposit breakup. Cracks form easily and quickly in thin deposits, whereas in thick deposits,
crack formation can only occur if the jet has drilled into the deposit.
Debonding. This mechanism is particularly important for very hard and thick deposits such as
those in the superheater region of the boiler. If a strong deposit is weakly attached to the tubes, a
strong sootblower jet may not be able to break it, but may remove it by debonding. Debonding
occurs when a jet exerts a moment on the deposit about its interface with the tube, creating
interfacial stresses.
Sabet [19] studied deposit removal by debonding. He measured the mean and fluctuating
drag and lift forces exerted by a jet on different types of deposits, and found that the flow-induced
vibrations caused by the lift force fluctuations may be the dominant lateral forces responsible for
debonding deposits.
Kaliazine et al. [35] developed a theoretical model of the deposit mechanical structure,
and used it to estimate the stress distribution in the adhesion layer between the deposit and the
tube. Their criterion for debonding is:
W
dPIP c
adh max
1 … (2.2)
where PIP is the value required for debonding a deposit of adhesion strength adh, dc is the deposit
characteristic length, W its thickness, and max a dimensionless ‘shape function’ of order unity,
which characterizes the deposit shape. Equation (2.2) shows that the jet PIP required for
debonding decreases with deposit thickness. Thus, thin deposits are more likely to break by brittle
breakup, whereas thick deposits by debonding.
Mao et al. [53] studied the effects of deposit thickness and jet impact angle on deposit
removal in conditions more representative of boiler conditions, using an Entrained Flow Reactor
(EFR) and an air jet apparatus. Synthetic deposits were prepared by mixing different chemicals
and burning them in the EFR. Deposits of varying thicknesses were impinged by a jet in two
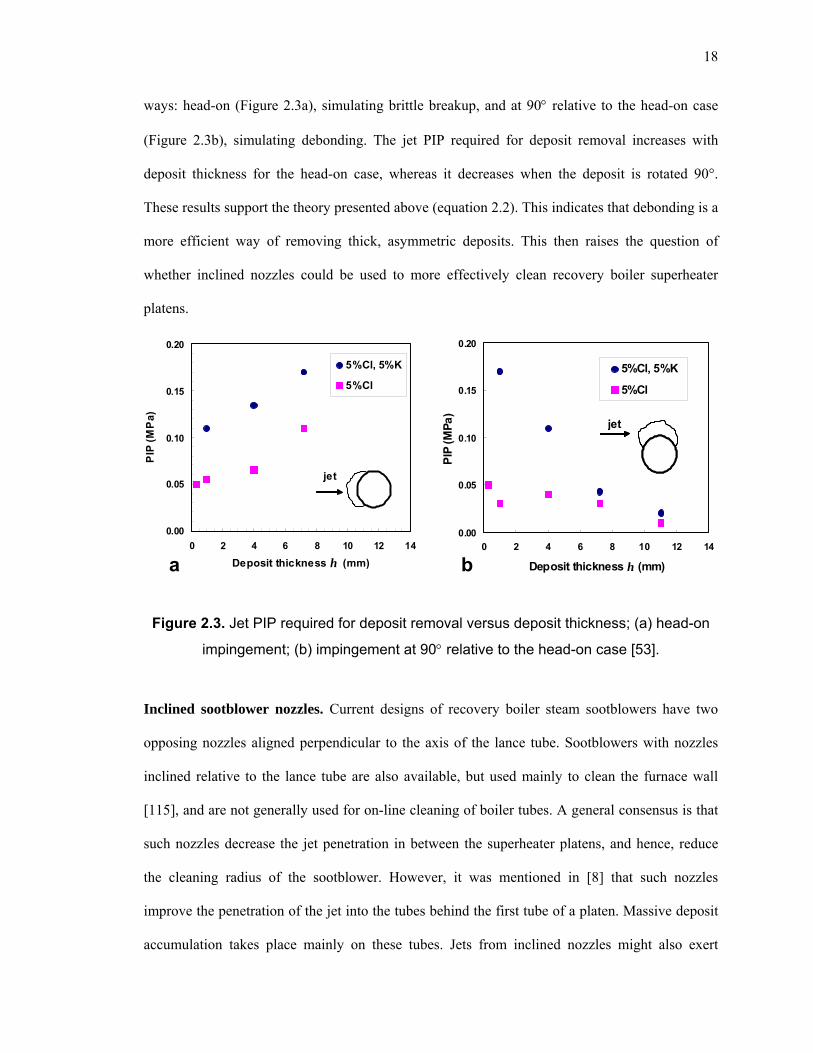
18
ways: head-on (Figure 2.3a), simulating brittle breakup, and at 90 relative to the head-on case
(Figure 2.3b), simulating debonding. The jet PIP required for deposit removal increases with
deposit thickness for the head-on case, whereas it decreases when the deposit is rotated 90°.
These results support the theory presented above (equation 2.2). This indicates that debonding is a
more efficient way of removing thick, asymmetric deposits. This then raises the question of
whether inclined nozzles could be used to more effectively clean recovery boiler superheater
platens.
0.00
0.05
0.10
0.15
0.20
0 2 4 6 8 10 12 14
Deposit thickness h (mm)
PIP
(M
Pa)
Figure 2.3. Jet PIP required for deposit removal versus deposit thickness; (a) head-on
impingement; (b) impingement at 90 relative to the head-on case [53].
Inclined sootblower nozzles. Current designs of recovery boiler steam sootblowers have two
opposing nozzles aligned perpendicular to the axis of the lance tube. Sootblowers with nozzles
inclined relative to the lance tube are also available, but used mainly to clean the furnace wall
[115], and are not generally used for on-line cleaning of boiler tubes. A general consensus is that
such nozzles decrease the jet penetration in between the superheater platens, and hence, reduce
the cleaning radius of the sootblower. However, it was mentioned in [8] that such nozzles
improve the penetration of the jet into the tubes behind the first tube of a platen. Massive deposit
accumulation takes place mainly on these tubes. Jets from inclined nozzles might also exert
5%Cl, 5%K
5%Cl
jet
0.00
0.05
0.10
0.15
0.20
0 2 4 6 8 10 12 14
Deposit thickness h (mm)
PIP
(M
Pa
)
5%Cl, 5%K
5%Cl
jet
a b
0.00
0.05
0.10
0.15
0.20
0 2 4 6 8 10 12 14
Deposit thickness h (mm)
PIP
(M
Pa)
0.00
0.05
0.10
0.15
0.20
0 2 4 6 8 10 12 14
Deposit thickness h (mm)
PIP
(M
Pa
)
5%Cl, 5%K 5%Cl, 5%K
5%Cl 5%Cl
jet
jet
a b
19
greater debonding force on these massive deposits. However, they may also increase platen
swinging to their inclined impact on the platens [80]. Sootblowers with such inclined nozzles
have been used successfully in coal-fired utility boilers (lead-lag nozzles), but in these boilers, the
inter-platen spacing is larger than in recovery boilers [102]. Only very recently have these nozzles
been introduced in recovery boilers [101], and their performance is currently being evaluated.
Their feasibility remains to be determined.
Thermal shock. During operation, deposits are subjected to two different types of thermal shocks
- one arising from a change in fuel firing, and the other arising from the impingement of the
sootblower jet, which is relatively cooler than the deposit surface.
Deposits in the superheater section typically have a linear thermal expansion coefficient
of about 46 m/mC, which is 3 - 4 times higher than that of the carbon steel used for making
boiler tubes [107]. So, during a thermal shock or 'chill-and-blow' event, the black liquor flow is
reduced or turned off in order to rapidly cool the deposits. This causes the deposits to contract
faster than steel, and consequently crack and detach from the tubes. Then, they either fall due to
their weight or can be easily blown off by sootblowers. A thermal shock event in a recovery
boiler typically requires about 8 hours to complete [107]. Laboratory experiments carried out at
the University of Toronto have shown that thermally shocked deposits are much easier to remove
using a jet than are deposits not subjected to a thermal shock [38].
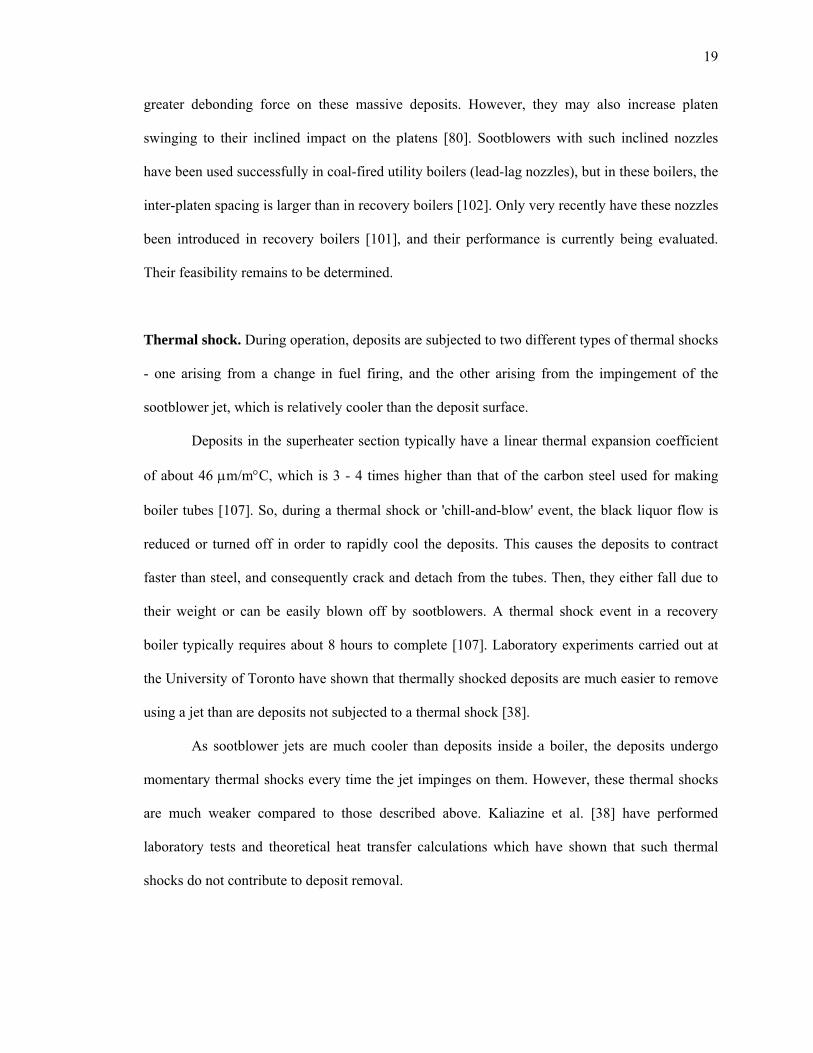
As sootblower jets are much cooler than deposits inside a boiler, the deposits undergo
momentary thermal shocks every time the jet impinges on them. However, these thermal shocks
are much weaker compared to those described above. Kaliazine et al. [38] have performed
laboratory tests and theoretical heat transfer calculations which have shown that such thermal
shocks do not contribute to deposit removal.
20
Figure 2.4. Deposit thermal shock caused by supersonic jet impingement [38].
Figure 2.4 shows their calculated variation of the deposit-tube wall interface temperature
with time, caused by sootblower jet impingement. The theoretical model used for this
computation was validated by the researchers using laboratory experimental data. Since the
chemical composition of a typical deposit is similar to that of smelt, the typical thermal
conductivity of smelt, around 1 W/mK was used in the theoretical calculations [38]; however, a
much higher value was also used for comparison. The figure clearly shows that the drop in the
deposit temperature for a deposit conductivity of 1 W/mK is negligible, and that the drop for 12
W/mK is also very small, and practically cannot contribute to deposit removal.
Tube vibration or bending. Industrial experience has shown that flue gas flow and sootblower
jet impingement cause boiler tubes to swing, vibrate, and bend. Bending creates stresses in the
deposits accumulated on these tubes. These stresses continuously change with time from tensile
to compressive and vice-versa depending on the direction of bending, and fatigue the deposits.
The deposits eventually crack, and become easier to remove during sootblowing.
21
Sabet [19] and Kaliazine et al. [37] performed artificial deposit blow-off experiments, in
which they found that the lift force fluctuations cover a large frequency range from zero to the so-
called Strouhal frequency. They theoretically and experimentally showed that if the affected
structure has a natural frequency within this range, the structure interacts with the jet in a resonant
way, drastically increasing the effect of the fluctuating force. The increase in magnitude is
inversely proportional to the square root of a vibration decay coefficient. This coefficient is that
part of the system mechanical energy that dissipates during one cycle of vibration. Kaliazine et al.
[37] also obtained a criterion for vibrational deposit removal during sootblowing.
2.1.3 Sootblower jet dynamics
There have been very few studies on sootblower jet dynamics and jet/tube interaction to date.
Before those studies are reviewed however, it is important to understand why sootblowers used in
kraft recovery boilers are supersonic and not simply subsonic. Jets are typically generated using
convergent nozzles. For any convergent nozzle, the jet supply pressure necessary to generate a
fully-expanded sonic jet (most efficient sonic jet) is given by the following relation derived using
isentropic flow theory –
1
1
2
ao pp … (2.3)
where po is the required jet supply pressure, pa is the ambient pressure, and is the specific heat
ratio of the gas. For air, po = 1.9pa = 192 kPa (abs) = 27.8 psia. If the jet supply pressure is greater
than this value for pa = 101.325 kPa (abs) = 14.7 psia, the subsonic jet automatically converts into
a less efficient supersonic jet. Special convergent-divergent nozzles must be used to obtain the
most efficient supersonic jet, and the supply pressure of these nozzles is relatively much larger.
That is why the supply pressure of subsonic jets is much lower than that of supersonic ones.
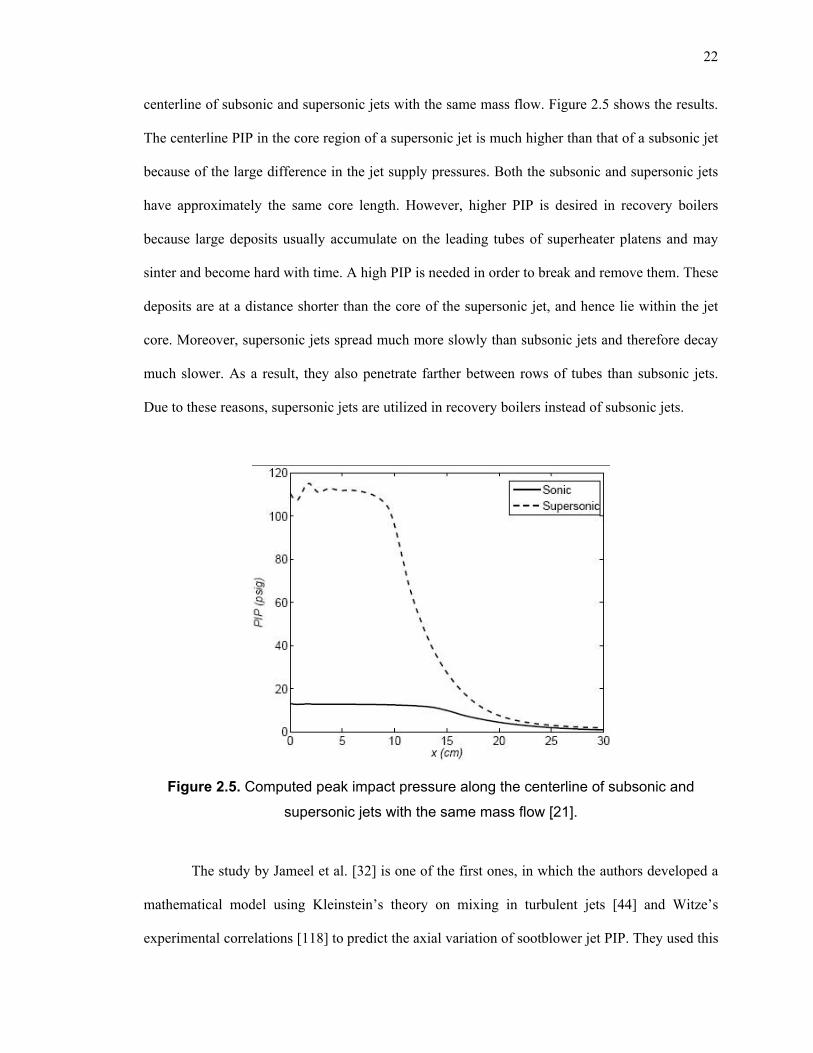
Emami [21] used a semi-empirical model to calculate the peak impact pressure along the
22
centerline of subsonic and supersonic jets with the same mass flow. Figure 2.5 shows the results.
The centerline PIP in the core region of a supersonic jet is much higher than that of a subsonic jet
because of the large difference in the jet supply pressures. Both the subsonic and supersonic jets
have approximately the same core length. However, higher PIP is desired in recovery boilers
because large deposits usually accumulate on the leading tubes of superheater platens and may
sinter and become hard with time. A high PIP is needed in order to break and remove them. These
deposits are at a distance shorter than the core of the supersonic jet, and hence lie within the jet
core. Moreover, supersonic jets spread much more slowly than subsonic jets and therefore decay
much slower. As a result, they also penetrate farther between rows of tubes than subsonic jets.
Due to these reasons, supersonic jets are utilized in recovery boilers instead of subsonic jets.
Figure 2.5. Computed peak impact pressure along the centerline of subsonic and
supersonic jets with the same mass flow [21].
The study by Jameel et al. [32] is one of the first ones, in which the authors developed a
mathematical model using Kleinstein’s theory on mixing in turbulent jets [44] and Witze’s
experimental correlations [118] to predict the axial variation of sootblower jet PIP. They used this

23
model to compare conventional nozzles to full expansion nozzles, and concluded that full
expansion nozzles are more efficient than conventional ones. The use of full expansion nozzles
increases the jet energy available for deposit removal, and their cleaning area is much larger than
that achieved by the conventional ones. The findings of this study had a major impact on the pulp
and paper industry due to which about 90% of the recovery boilers world-wide adopted
sootblowers with full expansion nozzles [109].
Kaliazine et al. [36] also investigated the feasibility of using low pressure steam
exhausting from the turbine, for sootblowing instead of the more valuable high pressure steam
generated by the boiler, normally used for sootblowing. The low pressure steam exiting the
turbine has a lower monetary value than the high pressure steam generated by the boiler, and so it
may be possible to achieve substantial monetary savings by switching to low pressure
sootblowing. However, due to the lower pressure, the steam flow rate must be increased above
that required in high pressure sootblowing to obtain a comparable deposit removal capability. As
a result, the feasibility of this technology depends mainly on the differential cost between high
pressure and low pressure steam and the amount of additional steam required to compensate for
the lower pressure [111].
Tandra [99] developed a modified k- turbulence model to numerically simulate a
sootblower jet and its interaction with recovery boiler superheater platens. He also used this
model to investigate the feasibility of low pressure sootblowing [97]. He showed that by using a
larger nozzle and a slightly greater steam flow rate for low pressure sootblowing, it is possible to
exert a drag force on a deposit which is comparable to that exerted by a high pressure sootblower
jet, and thus attain comparable deposit removal capability.
Fouling monitoring and location for targeted sootblowing. Sootblowing timing and strategy
are as important for deposit removal as the jet strength and dynamics. A boiler location which is
greatly fouled must be subjected to sootblowing for a longer duration of time than a location
24
which is relatively cleaner. However, the hostile conditions inside a boiler make it almost
impossible to determine which location is fouled. Presently, mill operators use infrared cameras
for this purpose, but even those cannot provide this information in most cases. As a result, current
research efforts in the industry are directed at finding ways to locate the fouled region in the
boiler.
Very recently, Adams [3] developed a method to determine the local deposition rate in
the vicinity of each sootblower in a fleet of sootblowers cleaning a boiler. Using boiler operating
data, he showed that the rate of deposit removal is a good representative of the rate of deposition
or fouling. In this method, the change in the generating bank outlet temperature with time is
continuously monitored during a stroke of a given sootblower, and reflects the rate of fouling in
the vicinity of that sootblower as well as in the entire superheater and generating bank sections.
An increase in the outlet temperature indicates increased fouling. By applying appropriate
corrections, the rate of fouling in the vicinity of that particular sootblower is isolated, thus
identifying the locations of the boiler which are prone to fouling and plugging.
Another method was presented by Tandra et al. [100], in which the authors used changes
in heat flow from the combustion gases to the water/steam in the heat transfer tubes to identify
when a certain section of the boiler was fouled. In this method, mass and energy balances are
performed on the different sections of a boiler and on the entire boiler, to determine the heat
transfer efficiency of a given section. This efficiency is monitored continuously, and when the
efficiency drops to a pre-determined low value due to fouling, sootblowing is initiated to restore
the efficiency. In this way, only that much steam is consumed for sootblowing as much is truly
needed.
As sootblower jets are supersonic, a review of basic compressible flow theory is
necessary in order to understand their interaction with a tube and tube arrangements.
25
2.2 Basic Compressible Flow Theory
In compressible flow, moderate to strong changes in pressure give rise to substantial changes in
density. The Mach number Ma, is an indicator of flow compressibility, and is defined as the ratio
of the flow velocity u, to the speed of sound a, in the fluid: Ma = u/a. Generally, flow with Ma ≥
0.3 is treated as compressible [5]; flow at Ma < 1 is subsonic, and that at Ma > 1 is supersonic.
Due to the high velocity in supersonic flow, shock and expansion waves form to adjust to abrupt
disturbances. Supersonic flow is conveniently described using one-dimensional isentropic flow
theory.
2.2.1 One-dimensional isentropic flow relations
A flow is isentropic if it is both adiabatic and reversible (i.e. there is no heat transfer with
surroundings and no increase in entropy). The following relation holds for an isentropic process:
1
1
2
1
2
1
2
T
T
p
p … (2.4)
where p, , and T are the static pressure, density, and static temperature respectively, is the ratio
of specific heats of the gas, and subscripts 1 and 2 refer to the initial and final states in the
process. Applying conservation of energy to one-dimensional isentropic flow and considering a
calorically perfect gas, the following relation is obtained:
2
2
11 x
x
o MaT
T
… (2.5)
where To is the total or stagnation temperature of the flow and x is the spatial coordinate. This
relation enables us to calculate the ratio of total to static temperature at any point in the flow as a
function of the Mach number and . From equations (2.4) and (2.5), we obtain a similar relation
for the ratio of total to static pressure:
26
12
2
11
x
x
o Map
p … (2.6)
where po is the total or stagnation pressure of the flow. Similar relations can be obtained for other
thermodynamic quantities, for isentropic flow.
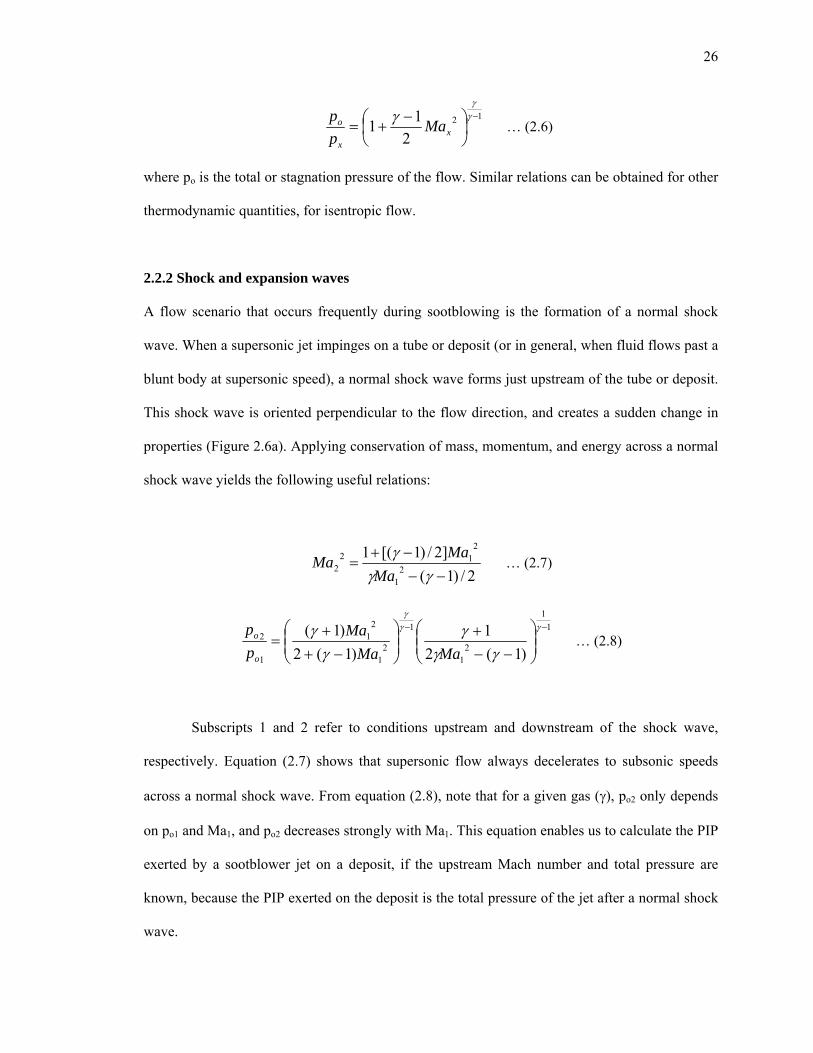
2.2.2 Shock and expansion waves
A flow scenario that occurs frequently during sootblowing is the formation of a normal shock
wave. When a supersonic jet impinges on a tube or deposit (or in general, when fluid flows past a
blunt body at supersonic speed), a normal shock wave forms just upstream of the tube or deposit.
This shock wave is oriented perpendicular to the flow direction, and creates a sudden change in
properties (Figure 2.6a). Applying conservation of mass, momentum, and energy across a normal
shock wave yields the following useful relations:
2/)1(
]2/)1[(12
1
212
2
Ma
MaMa … (2.7)
1
1
21
1
21
21
1
2
)1(2
1
)1(2
)1(
MaMa
Ma
p
p
o
o … (2.8)
Subscripts 1 and 2 refer to conditions upstream and downstream of the shock wave,
respectively. Equation (2.7) shows that supersonic flow always decelerates to subsonic speeds
across a normal shock wave. From equation (2.8), note that for a given gas (), po2 only depends
on po1 and Ma1, and po2 decreases strongly with Ma1. This equation enables us to calculate the PIP
exerted by a sootblower jet on a deposit, if the upstream Mach number and total pressure are
known, because the PIP exerted on the deposit is the total pressure of the jet after a normal shock
wave.
27
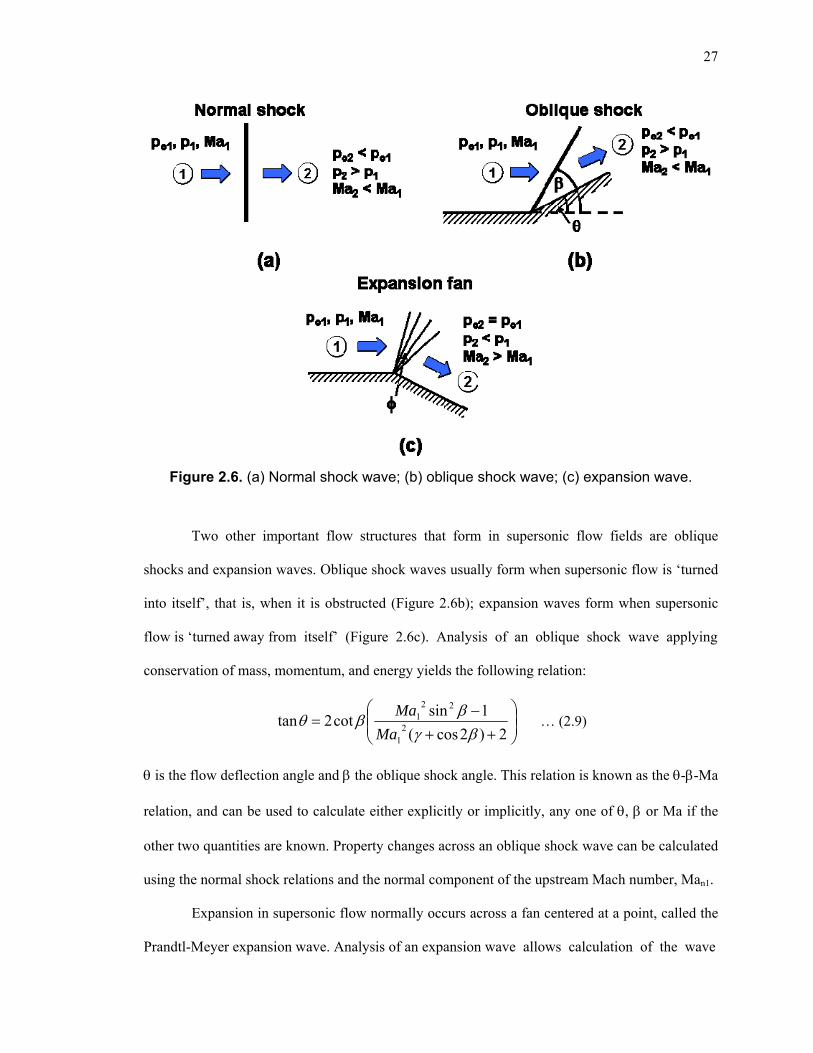
Figure 2.6. (a) Normal shock wave; (b) oblique shock wave; (c) expansion wave.
Two other important flow structures that form in supersonic flow fields are oblique
shocks and expansion waves. Oblique shock waves usually form when supersonic flow is ‘turned
into itself’, that is, when it is obstructed (Figure 2.6b); expansion waves form when supersonic
flow is ‘turned away from itself’ (Figure 2.6c). Analysis of an oblique shock wave applying
conservation of mass, momentum, and energy yields the following relation:
2)2cos(
1sincot2tan
21
221
Ma
Ma … (2.9)
is the flow deflection angle and the oblique shock angle. This relation is known as the --Ma
relation, and can be used to calculate either explicitly or implicitly, any one of , or Ma if the
other two quantities are known. Property changes across an oblique shock wave can be calculated
using the normal shock relations and the normal component of the upstream Mach number, Man1.
Expansion in supersonic flow normally occurs across a fan centered at a point, called the
Prandtl-Meyer expansion wave. Analysis of an expansion wave allows calculation of the wave
28
angle, as:
)()( 12 MaMa … (2.10)
where 1tan)1(1
1tan
1
1)( 2121
MaMaMa
… (2.11)
is the Prandtl-Meyer function. Subscripts 1 and 2 again denote the conditions upstream and
downstream of the expansion wave. Expansion through such a wave is isentropic.
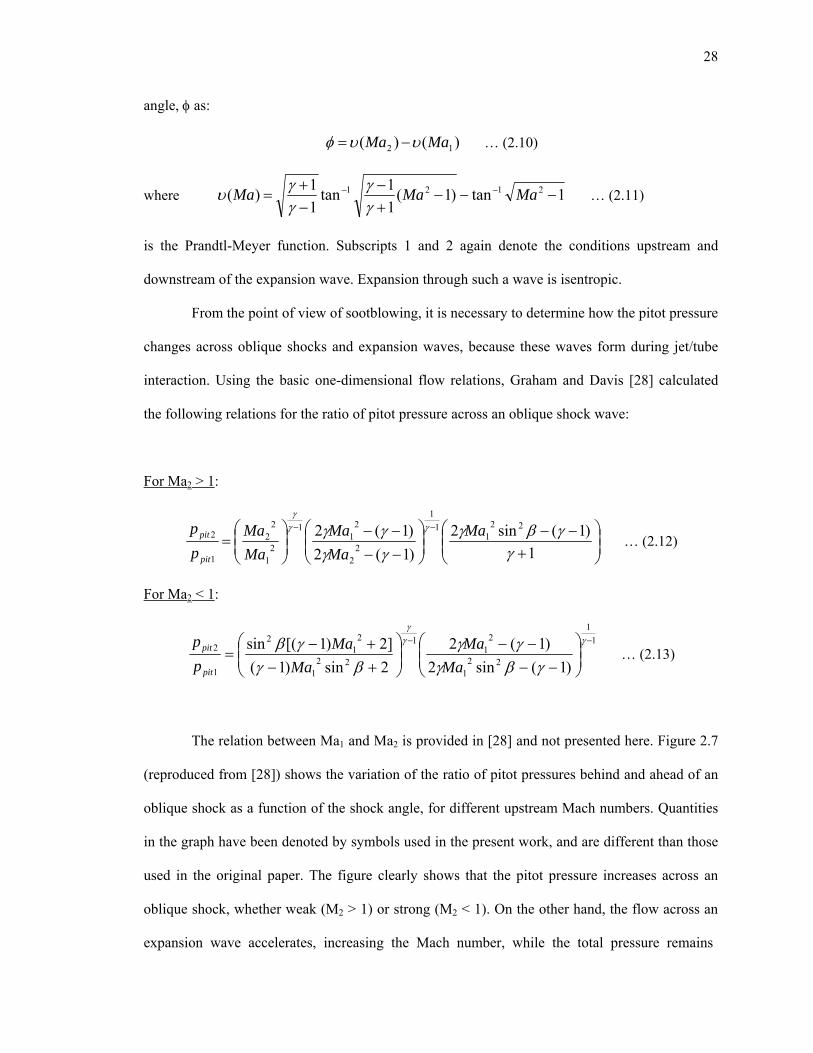
From the point of view of sootblowing, it is necessary to determine how the pitot pressure
changes across oblique shocks and expansion waves, because these waves form during jet/tube
interaction. Using the basic one-dimensional flow relations, Graham and Davis [28] calculated
the following relations for the ratio of pitot pressure across an oblique shock wave:
For Ma2 > 1:
1
)1(sin2
)1(2
)1(2 221
1
1
22
21
1
21
22
1
2
Ma
Ma
Ma
Ma
Ma
p
p
pit
pit … (2.12)
For Ma2 < 1:
1
1
221
21
1
221
21
2
1
2
)1(sin2
)1(2
2sin)1(
]2)1[(sin
Ma
Ma
Ma
Ma
p
p
pit
pit … (2.13)
The relation between Ma1 and Ma2 is provided in [28] and not presented here. Figure 2.7
(reproduced from [28]) shows the variation of the ratio of pitot pressures behind and ahead of an
oblique shock as a function of the shock angle, for different upstream Mach numbers. Quantities
in the graph have been denoted by symbols used in the present work, and are different than those
used in the original paper. The figure clearly shows that the pitot pressure increases across an
oblique shock, whether weak (M2 > 1) or strong (M2 < 1). On the other hand, the flow across an
expansion wave accelerates, increasing the Mach number, while the total pressure remains
29
0
1
2
3
4
5
6
0 10 20 30 40 50 60 70 80 90
Oblique shock angle, [deg]
Pit
ot p
res
sure
beh
ind
sho
ck
Pit
ot
pre
ssu
re a
hea
d o
f sho
ck
Ma2 > 1(weak shocks)
oblique shock
Figure 2.7. Ratio of pitot pressure across an oblique shock wave as a function of shock
angle and upstream Mach number [28].
constant. As a result, the normal shock wave at the orifice of a pitot tube is stronger downstream
of the wave than upstream, and the pitot pressure decreases across an expansion wave.
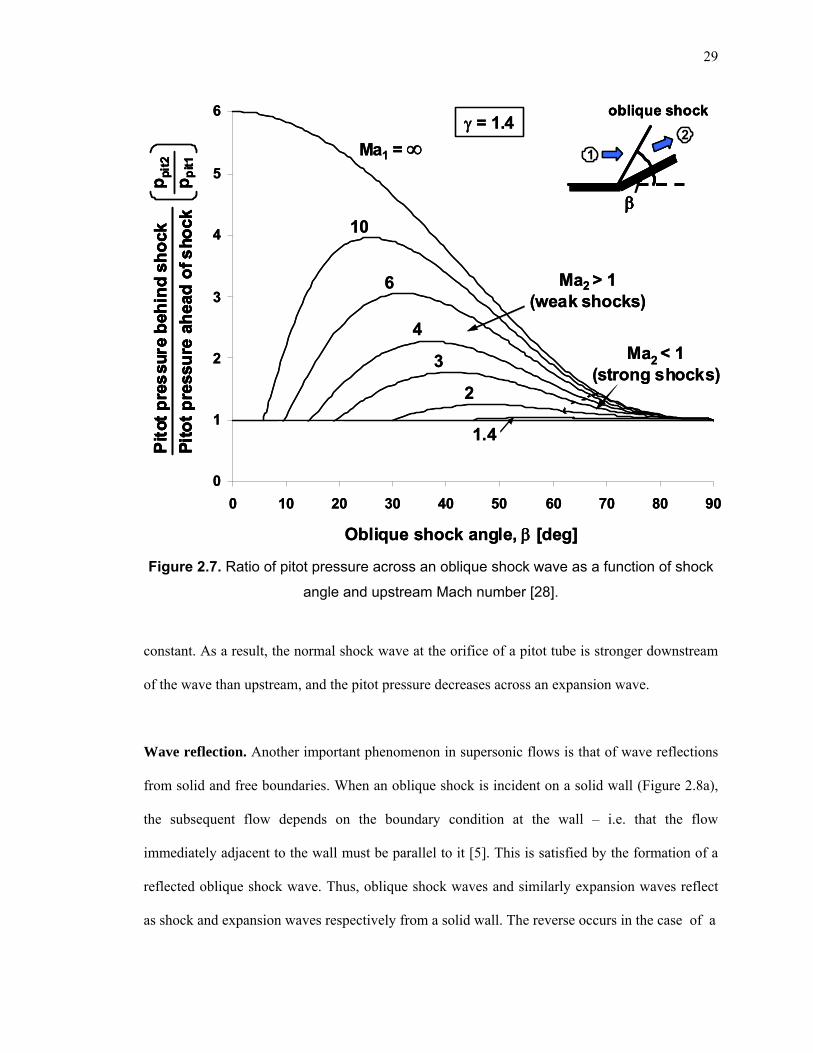
Wave reflection. Another important phenomenon in supersonic flows is that of wave reflections
from solid and free boundaries. When an oblique shock is incident on a solid wall (Figure 2.8a),
the subsequent flow depends on the boundary condition at the wall – i.e. that the flow
immediately adjacent to the wall must be parallel to it [5]. This is satisfied by the formation of a
reflected oblique shock wave. Thus, oblique shock waves and similarly expansion waves reflect
as shock and expansion waves respectively from a solid wall. The reverse occurs in the case of a
pp
it2
pp
it1
= 1.4
10
6
3
Ma1 =
4
2
1.4
Ma2 < 1(strong shocks)
1
2
0
1
2
3
4
5
6
0 10 20 30 40 50 60 70 80 90
Oblique shock angle, [deg]
Pit
ot p
res
sure
beh
ind
sho
ck
Pit
ot
pre
ssu
re a
hea
d o
f sho
ck
Ma2 > 1(weak shocks)
oblique shock
pp
it2
pp
it1
Pit
ot p
res
sure
beh
ind
sho
ck
Pit
ot
pre
ssu
re a
hea
d o
f sho
ck
Pit
ot p
res
sure
beh
ind
sho
ck
Pit
ot
pre
ssu
re a
hea
d o
f sho
ck
pp
it2
pp
it1
= 1.4
10
6
3
Ma1 =
4
2
1.4
oblique shock
2
Ma2 < 1(strong shocks)
1
2
1
30
Figure 2.8. Reflection of an oblique shock wave from (a) a solid wall, and (b) a constant
pressure free boundary.
free boundary. When an oblique shock wave is incident on a free boundary at constant pressure
(Figure 2.8b), the shock wave reflects as an expansion wave to maintain the pressure along that
boundary. Similarly, an expansion wave reflects as an oblique shock. Due to the formation of
dense and rare regions in supersonic flow because of shock and expansion waves, often slip lines
form between these regions across which momentum transfer takes place.
2.2.3 Supersonic nozzle flow
Applying the differential form of the equation for conservation of mass to an isentropic flow and
manipulating, we obtain the following ‘area-velocity relation’:
u
duMa
A
dA12 … (2.14)
where A is the cross-sectional area normal to the flow and u is the flow velocity. This relation
wall
incident shock
Flow remains parallel to wall via a reflected obliq ue shock wave
reflected shock
constant pressure free boundary
incident shock
reflected expansion wave
To attain free stream pressure, flow turns outwards and expands via a reflected expansion wave
(a)
(b)
wall
incident shock
Flow remains parallel to wall via a reflected obliq ue shock wave
reflected shock
wall
incident shock
Flow remains parallel to wall via a reflected obliq ue shock wave
reflected shock
constant pressure free boundary
incident shock
reflected expansion wave
To attain free stream pressure, flow turns outwards and expands via a reflected expansion wave
constant pressure free boundary
incident shock
reflected expansion wave
To attain free stream pressure, flow turns outwards and expands via a reflected expansion wave
(a)
(b)
31
shows that for Ma < 1 (subsonic flow), the velocity increases if the cross-sectional area decreases.
Surprisingly, for Ma > 1 (supersonic flow), velocity increases only if the cross-sectional area
increases. Consequently, to accelerate a flow to supersonic speeds, the flow must be forced
through a convergent-divergent nozzle. As the initially subsonic flow passes through the
convergent section, it accelerates and reaches Ma = 1 at the nozzle throat (the minimum cross-
sectional area), and then further accelerates to supersonic speeds in the divergent part. Any nozzle
is characterized by only one nozzle exit Mach number Mae, because the Mach number at any
position x along the nozzle centerline Max, depends only on the ratio of the nozzle cross-sectional
area at that position Ax, to the cross-sectional area of the throat At, and the specific heat ratio :
)1(
)1(2
1
2
)1(2
1
)1(2
11
1
x
xt
xMa
MaA
A … (2.15)
For a given nozzle, Mae can be calculated using this relation and the ratio of the exit area
to the throat area Ae/At. Knowing the pressure of the stagnant surroundings (e.g. standard
atmospheric pressure) and Mae, and assuming isentropic flow through the nozzle, the pressure at
the nozzle inlet, i.e. the supply pressure po, can be calculated using equation (2.6). Vice-versa,
knowing the supply pressure po and Ae/At of the given nozzle, the pressure at the nozzle exit pe,
can be calculated.
The static pressure at the nozzle exit pe, relative to the ambient pressure plays a very
important role in controlling the structure of the supersonic jet exiting the nozzle. Depending on
the exit pressure ratio PR = pe/pa, three different types of supersonic jets can form. At PR = 1, the
exit pressure is exactly equal to the ambient pressure, the jet has expanded correctly, and so is
termed a ‘fully expanded’ or ‘correctly expanded’ jet (Figure 2.9a). Such a jet is free of shock
waves and is the most efficient. For PR < 1, the exit pressure is lower than the ambient pressure,
the jet has expanded more than needed, and so is termed an ‘overexpanded’ jet. The jet fluid
32
Figure 2.9. Supersonic jets; (a) fully expanded; (b) overexpanded; (c) underexpanded.
undergoes compression through oblique shocks just outside the nozzle to increase its pressure to
the ambient value (Figure 2.9b). For PR > 1, the exit pressure is greater than the ambient
pressure, the jet has not completed full expansion, and so is termed an ‘underexpanded’ jet. The
jet fluid expands through a Prandtl-Meyer expansion wave at the nozzle exit that lowers its
pressure to the ambient value (Figure 2.9c). Over and underexpanded jets are also termed
‘imperfectly expanded’ or ‘off-design’ jets. The structure of supersonic jets will be further
described in section 2.4.
Although the assumption of isentropic flow is used to describe supersonic nozzle flow
and provides a good approximation to the actual flow, it should be noted that real flow inside any
nozzle is not fully isentropic. Due to unavoidable friction losses and heat transfer, the extent of
the deviation from being isentropic depends on the design of the nozzle – the smoother the
nozzle, the smoother the flow through it, and the closer the flow is to being isentropic.
Another useful equation is that yielding the mass flow rate ṁ, through a choked nozzle:
1
1
1
2
gaso
to
RT
Apm … (2.16)
Rgas is the specific gas constant, and is obtained from the universal gas constant RU as RU/MW,
where MW is the gas molecular weight. RU = 8.314 kJ/kg-K. This relation shows that the mass
flow rate increases with the supply pressure and throat cross-sectional area, or with the square of
the throat diameter, and decreases with the square root of the stagnation temperature.
(a)
nozzle
jet shear layer
(b)
expansion waves
shock wave
(c)
expansion waves
shock wave
(a)
nozzle
jet shear layer
(a)
nozzle
jet shear layer
(b)
expansion waves
shock wave
(b)
expansion waves
shock wave
(c)
expansion wavesexpansion waves
shock wave
(c)
shock wave
33
2.3 The Schlieren Technique
Supersonic gas jets cannot be seen by the naked eye or with regular photographic equipment, but
special techniques are available to visualize them. The schlieren technique is one such method
which has been extensively used for a long time, yet continues to be used today to visualize and
study supersonic flows. The technique was invented by German physicist August Toepler
between 1859 and 1864, who used it to visualize and study flames, convection, shock waves, and
other phenomena invisible until then [45, 84]. This technique was used extensively in the present
thesis, so descriptions of the principles and apparatus are presented here.
The operating principle of the schlieren technique is that parallel light rays refract as they
pass through optical inhomogeneities such as density gradients in a transparent medium.
Supersonic gas jets exhibit such density gradients. For a gas, the local value of the refractive
index1 n, is directly proportional to the local value of the density as per the Gladstone-Dale
relationship [84]:
Kn 1 … (2.17)
where K is the Gladstone-Dale constant and depends on the gas characteristics as well as the
frequency of the light used. Density gradients in the medium (or in a supersonic jet for example)
give rise to refractive index gradients in the medium. When light passes through such an optically
inhomogeneous medium, the refractive index gradients cause the light rays to bend in different
directions, and this refraction can be captured as a schlieren image.
To better explain this technique, consider the situation shown in Figure 2.10. This figure
shows light rays traveling through a medium with a negative refractive index gradient in the
vertical direction (dn/dy < 0)2, and shows their refraction. Due to the negative gradient, density
increases in the downward direction, reducing the speed of light, c. As a result, the distance
1 Refractive index, n = co/c, where co = speed of light in vacuum (3 108 m/s) and c = speed of light in the surrounding medium. 2 This section on geometrical optics is based on Settles [84].
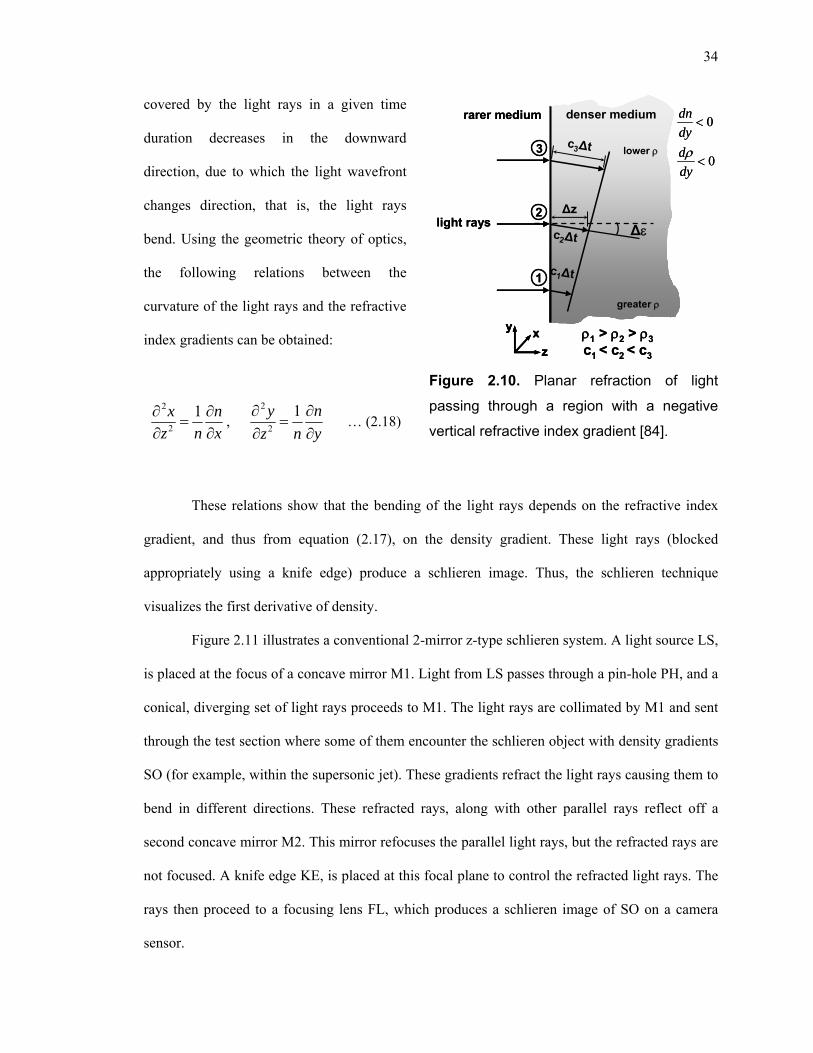
34
covered by the light rays in a given time
duration decreases in the downward
direction, due to which the light wavefront
changes direction, that is, the light rays
bend. Using the geometric theory of optics,
the following relations between the
curvature of the light rays and the refractive
index gradients can be obtained:
0
0
dy
d
dy
dn
rarer medium denser medium
x
n
nz
x
1
2
2
, y
n
nz
y
1
2
2
… (2.18)
These relations show that the bending of the light rays depends on the refractive index
gradient, and thus from equation (2.17), on the density gradient. These light rays (blocked
appropriately using a knife edge) produce a schlieren image. Thus, the schlieren technique
visualizes the first derivative of density.
Figure 2.11 illustrates a conventional 2-mirror z-type schlieren system. A light source LS,
is placed at the focus of a concave mirror M1. Light from LS passes through a pin-hole PH, and a
conical, diverging set of light rays proceeds to M1. The light rays are collimated by M1 and sent
through the test section where some of them encounter the schlieren object with density gradients
SO (for example, within the supersonic jet). These gradients refract the light rays causing them to
bend in different directions. These refracted rays, along with other parallel rays reflect off a
second concave mirror M2. This mirror refocuses the parallel light rays, but the refracted rays are
not focused. A knife edge KE, is placed at this focal plane to control the refracted light rays. The
rays then proceed to a focusing lens FL, which produces a schlieren image of SO on a camera
sensor.
Figure 2.10. Planar refraction of light
passing through a region with a negative
vertical refractive index gradient [84].
z
yx
lower
greater
3
2
1
c3∆t
light rays∆z
c2∆t
c1∆t
∆
1 > 2 > 3c1 < c2 < c3
0
0
dy
d
dy
dn
rarer medium denser medium
z
yx
z
yx
lower
greater
3
2
1
c3∆t
∆zlight rays
c2∆t
c1∆t
∆
1 > 2 > 3c1 < c2 < c3
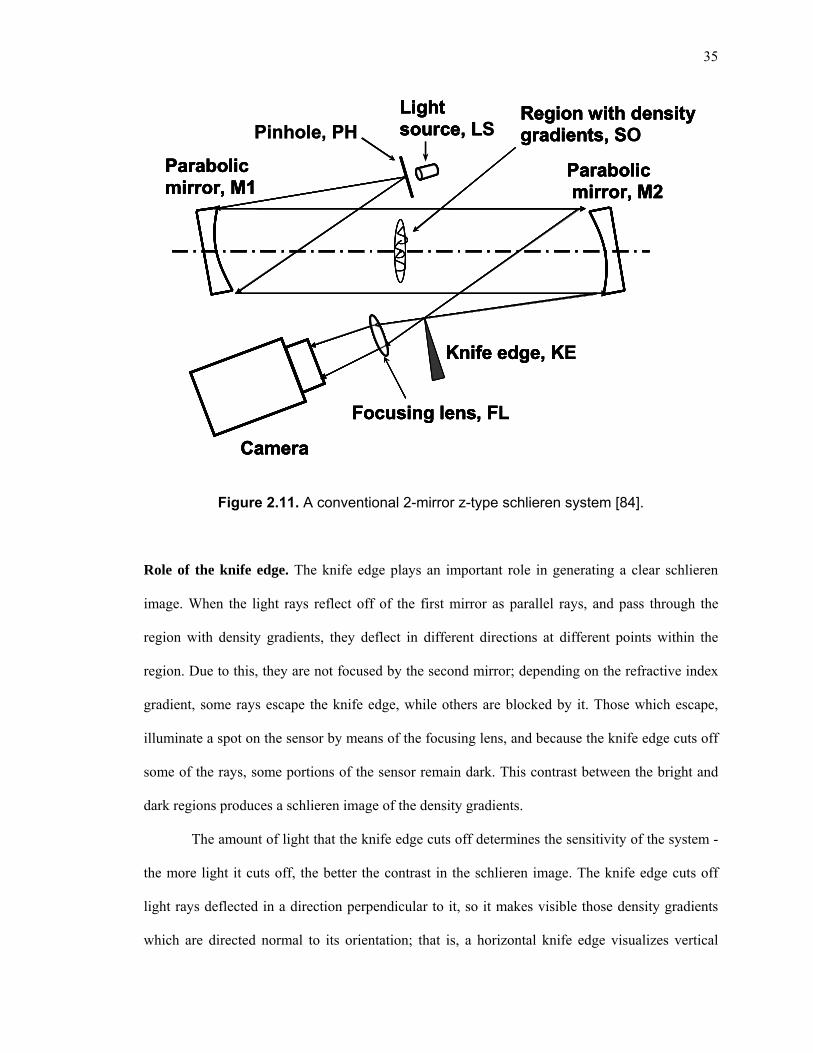
35
Light source, LPinhole, PH
Parabolicmirror, M1
Parabolicmirror, M2
Region with densitygradients, S
Knife edge, K
Figure 2.11. A conventional 2-mirror z-type schlieren system [84].
Role of the knife edge. The knife edge plays an important role in generating a clear schlieren
image. When the light rays reflect off of the first mirror as parallel rays, and pass through the
region with density gradients, they deflect in different directions at different points within the
region. Due to this, they are not focused by the second mirror; depending on the refractive index
gradient, some rays escape the knife edge, while others are blocked by it. Those which escape,
illuminate a spot on the sensor by means of the focusing lens, and because the knife edge cuts off
some of the rays, some portions of the sensor remain dark. This contrast between the bright and
dark regions produces a schlieren image of the density gradients.
The amount of light that the knife edge cuts off determines the sensitivity of the system -
the more light it cuts off, the better the contrast in the schlieren image. The knife edge cuts off
light rays deflected in a direction perpendicular to it, so it makes visible those density gradients
which are directed normal to its orientation; that is, a horizontal knife edge visualizes vertical
Focusing lens, F
Camera
Light source, LS
Parabolicmirror, M1
Parabolicmirror, M2
Region with densitygradients, SO
Knife edge, KE
Focusing lens, FL
Camera
Light source, LPinhole, PH
Parabolicmirror, M1
Parabolicmirror, M2
Region with densitygradients, S
Knife edge, K
Focusing lens, F
Camera
Light source, LS
Parabolicmirror, M1
Parabolicmirror, M2
Region with densitygradients, SO
Knife edge, KE
Focusing lens, FL
Camera
36
density gradients. The amount of light cut off by the knife edge, that is, the sensitivity, is
restricted by the minimum amount of illumination required to obtain a good image of the overall
flow field.
2.4 Supersonic Free Jets
As described in section 2.2.3, supersonic jets can be either fully-expanded or off-design
(over/underexpanded), depending on the jet static pressure at the nozzle exit. Due to their wide
spread applications in engineering, such as in rocket and aircraft propulsion, the structure of
supersonic jets has been studied in detail over the years.
2.4.1 Jet structure
Fully-expanded jets
The fully expanded jet (PR = 1) has the simplest structure because it is free of any shock or
expansion waves in its core region (although practically, some weak shock waves always exist).
The jet boundary just outside the nozzle is straight and parallel to the direction of jet flow. The
core region of jet extends from the nozzle exit to about 10-15 nozzle diameters downstream, but
the core decreases in diameter with distance from the nozzle, because of turbulent mixing in the
shear layer of the jet. Pressure, temperature, density, total pressure and other variables remain
unchanged in the core. The peak impact pressure and velocity are the highest in the core. Beyond
the core, the jet becomes subsonic and fully developed, with self-similar velocity profiles
characteristic of turbulent jets. In this fully developed region, the velocity and total pressure of
the jet decrease monotonically with distance due to turbulent mixing and radial spreading.
Due to its relatively simple structure, a fully expanded jet is more amenable to theoretical
treatment than its off-design counterparts. The main characteristic of such a jet that must be
determined analytically is the decay of properties along the jet centerline in the subsonic portion

37
of the jet, which is caused by compressible turbulent mixing. Earlier theoretical studies of this
decay by Kleinstein [44], Warren [116], and Witze [118] have been reasonably successful in
obtaining a close agreement between theory and experimental data. Kleinstein [44] was one of the
first to describe a fully-expanded jet by linearizing the basic conservation equations, and by
introducing a modified eddy viscosity expression. He derived the following expression for the
decay of axial velocity along the jet centreline:
7.0
1exp1
2/1e
oxk
u
… (2.19)
in which ou is the axial velocity normalized by the nozzle exit velocity, x is the axial coordinate
normalized by the nozzle exit radius, e is the density normalized by the nozzle exit density and
k is a constant in the expression for the modified eddy viscosity that Kleinstein assumed to be
equal to 0.074. Later, Warren [116] generalized Kleinstein’s model to allow k to depend on the
Mach number, and Witze [118] extended the model further by introducing two expressions for k,
one for subsonic jets (isothermal and heated) and the other for supersonic. For supersonic jets:
15.02 )1(063.0 jMk … (2.20)
where Mj is the nozzle exit Mach number.
Few experimental studies of the structure of fully-expanded jets are available in the
literature. Of these, the earlier studies by Eggers [20] and Lau et al. [50] are important because
they are comprehensive experimental studies of the different aspects of fully-expanded
supersonic jets. Eggers [20] measured the centerline and radial pitot pressure profiles of a Mach
2.22 air jet and converted them into profiles of axial velocity, as well as of eddy viscosity
distributions. He also determined the spreading rate of that jet. Lau et al. [50] measured the
centerline and radial velocity of subsonic and almost fully-expanded supersonic jets using a laser
velocimeter, and developed correlations to fit that data. These correlations can used to predict, for
example, the centerline velocity decay in jets. They also obtained the following relation between
38
the jet core length, xc, and the jet Mach number, Mj:
21.12.4 je
c Md
x … (2.21)
More recent studies involving fully-expanded jets are those of Katanoda et al. [42] and Kweon et
al. [47]. These studies report measurements of the centerline and radial pitot pressure of fully-
expanded and off-design jets, even though the studies focus on the structure of off-design jets.
Although fully expanded jets are the most efficient due to the absence of shock waves,
they are very difficult to generate. Jets are fully-expanded when the nozzle exit static pressure
exactly equals the ambient pressure. This rarely occurs because of unavoidable factors including
supply pressure fluctuations and manufacturing imperfections in the nozzle. Sootblower jets are
no exception, and operate either slightly under or overexpanded (off-design) most of the time.
Off-design jets
For a given nozzle, an underexpanded jet is more powerful than an overexpanded jet, because the
underexpanded jet forms at a higher supply pressure than the overexpanded jet, and so its
diameter is also larger. Underexpanded jets can be tentatively classified into two types depending
on the exit pressure ratio – mildly underexpanded (1 < PR ≤ 2) and strongly underexpanded (PR
> 2) [18, 25]. Underexpanded jets, and specifically strongly underexpanded jets, have been
studied experimentally in great detail (e.g. [4, 6, 16, 18, 25, 31, 41, 42, 47, 51, 57, 60, 114, 119]).
Only the main features of these jets are described here, based on these studies.
The nozzle exit pressure of a mildly underexpanded jet (Figure 2.12a) is only slightly
greater than the ambient pressure, and so the fluid expands as it comes out of the nozzle to match
its pressure to the ambient value (Figure 2.12b). The expansion occurs through a weak Prandtl-
Meyer expansion fan centered at the nozzle lip. Due to this expansion, the jet bulges and grows
radially as it exits the nozzle. The expansion waves reach the opposite side of the jet and reflect
as compression waves back into jet (the jet boundary is a constant pressure boundary). These
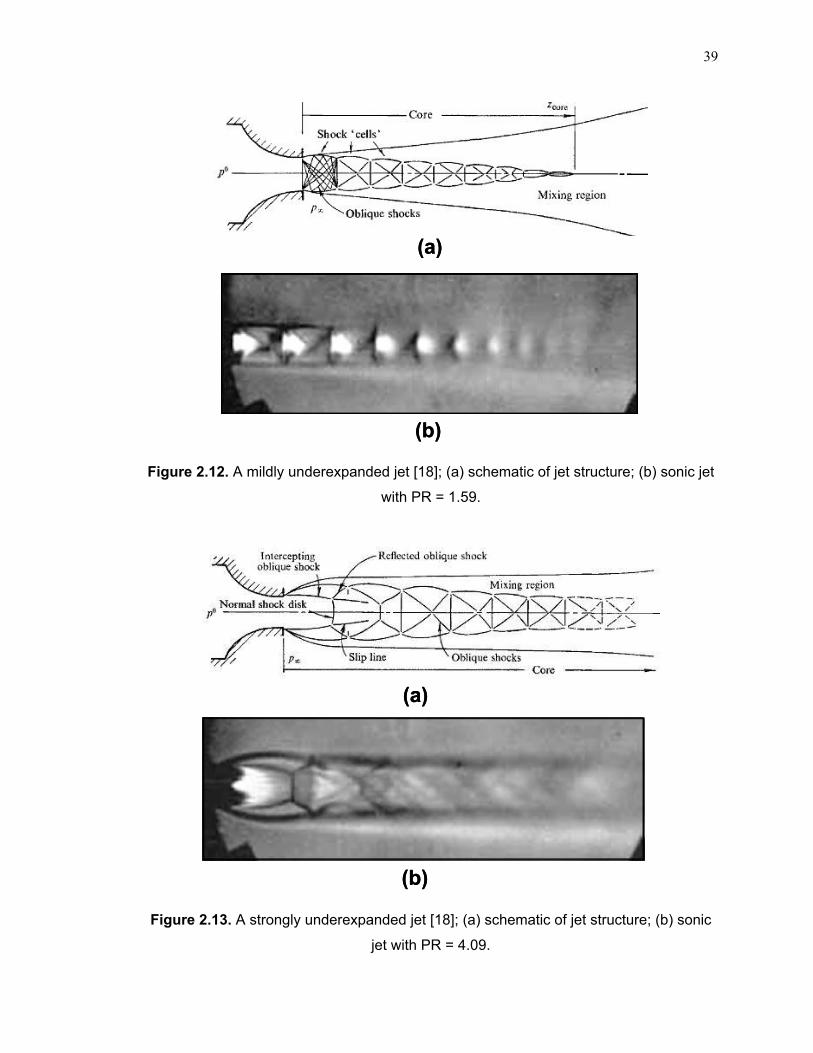
39
(a)
(b)
(a)
(b)
Figure 2.12. A mildly underexpanded jet [18]; (a) schematic of jet structure; (b) sonic jet
with PR = 1.59.
(a)
(b)
(a)
(b)
Figure 2.13. A strongly underexpanded jet [18]; (a) schematic of jet structure; (b) sonic
jet with PR = 4.09.
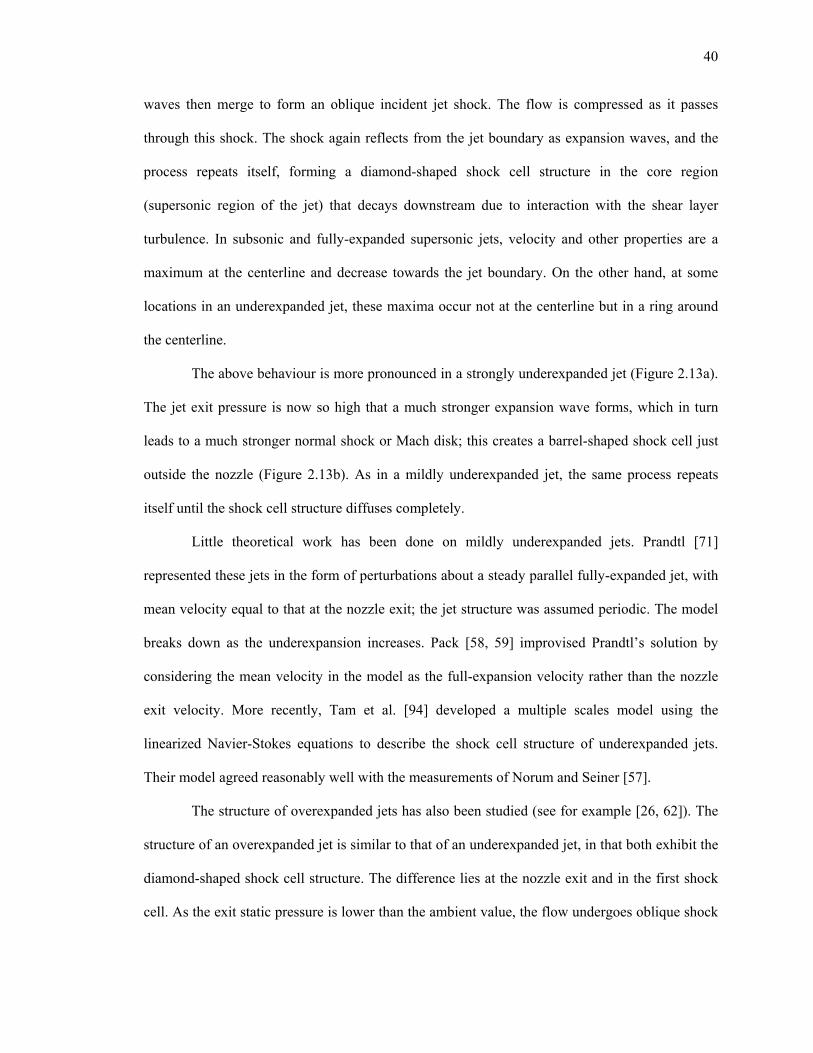
40
waves then merge to form an oblique incident jet shock. The flow is compressed as it passes
through this shock. The shock again reflects from the jet boundary as expansion waves, and the
process repeats itself, forming a diamond-shaped shock cell structure in the core region
(supersonic region of the jet) that decays downstream due to interaction with the shear layer
turbulence. In subsonic and fully-expanded supersonic jets, velocity and other properties are a
maximum at the centerline and decrease towards the jet boundary. On the other hand, at some
locations in an underexpanded jet, these maxima occur not at the centerline but in a ring around
the centerline.
The above behaviour is more pronounced in a strongly underexpanded jet (Figure 2.13a).
The jet exit pressure is now so high that a much stronger expansion wave forms, which in turn
leads to a much stronger normal shock or Mach disk; this creates a barrel-shaped shock cell just
outside the nozzle (Figure 2.13b). As in a mildly underexpanded jet, the same process repeats
itself until the shock cell structure diffuses completely.
Little theoretical work has been done on mildly underexpanded jets. Prandtl [71]
represented these jets in the form of perturbations about a steady parallel fully-expanded jet, with
mean velocity equal to that at the nozzle exit; the jet structure was assumed periodic. The model
breaks down as the underexpansion increases. Pack [58, 59] improvised Prandtl’s solution by
considering the mean velocity in the model as the full-expansion velocity rather than the nozzle
exit velocity. More recently, Tam et al. [94] developed a multiple scales model using the
linearized Navier-Stokes equations to describe the shock cell structure of underexpanded jets.
Their model agreed reasonably well with the measurements of Norum and Seiner [57].
The structure of overexpanded jets has also been studied (see for example [26, 62]). The
structure of an overexpanded jet is similar to that of an underexpanded jet, in that both exhibit the
diamond-shaped shock cell structure. The difference lies at the nozzle exit and in the first shock
cell. As the exit static pressure is lower than the ambient value, the flow undergoes oblique shock
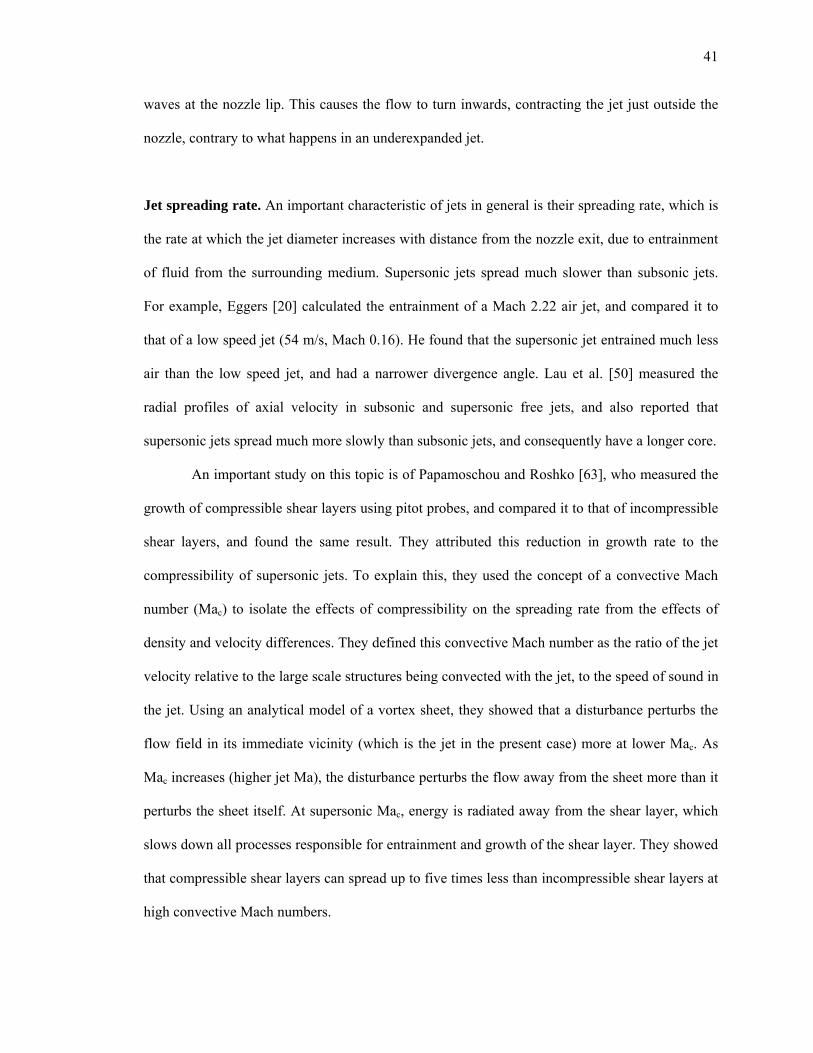
41
waves at the nozzle lip. This causes the flow to turn inwards, contracting the jet just outside the
nozzle, contrary to what happens in an underexpanded jet.
Jet spreading rate. An important characteristic of jets in general is their spreading rate, which is
the rate at which the jet diameter increases with distance from the nozzle exit, due to entrainment
of fluid from the surrounding medium. Supersonic jets spread much slower than subsonic jets.
For example, Eggers [20] calculated the entrainment of a Mach 2.22 air jet, and compared it to
that of a low speed jet (54 m/s, Mach 0.16). He found that the supersonic jet entrained much less
air than the low speed jet, and had a narrower divergence angle. Lau et al. [50] measured the
radial profiles of axial velocity in subsonic and supersonic free jets, and also reported that
supersonic jets spread much more slowly than subsonic jets, and consequently have a longer core.
An important study on this topic is of Papamoschou and Roshko [63], who measured the
growth of compressible shear layers using pitot probes, and compared it to that of incompressible
shear layers, and found the same result. They attributed this reduction in growth rate to the
compressibility of supersonic jets. To explain this, they used the concept of a convective Mach
number (Mac) to isolate the effects of compressibility on the spreading rate from the effects of
density and velocity differences. They defined this convective Mach number as the ratio of the jet
velocity relative to the large scale structures being convected with the jet, to the speed of sound in
the jet. Using an analytical model of a vortex sheet, they showed that a disturbance perturbs the
flow field in its immediate vicinity (which is the jet in the present case) more at lower Mac. As
Mac increases (higher jet Ma), the disturbance perturbs the flow away from the sheet more than it
perturbs the sheet itself. At supersonic Mac, energy is radiated away from the shear layer, which
slows down all processes responsible for entrainment and growth of the shear layer. They showed
that compressible shear layers can spread up to five times less than incompressible shear layers at
high convective Mach numbers.
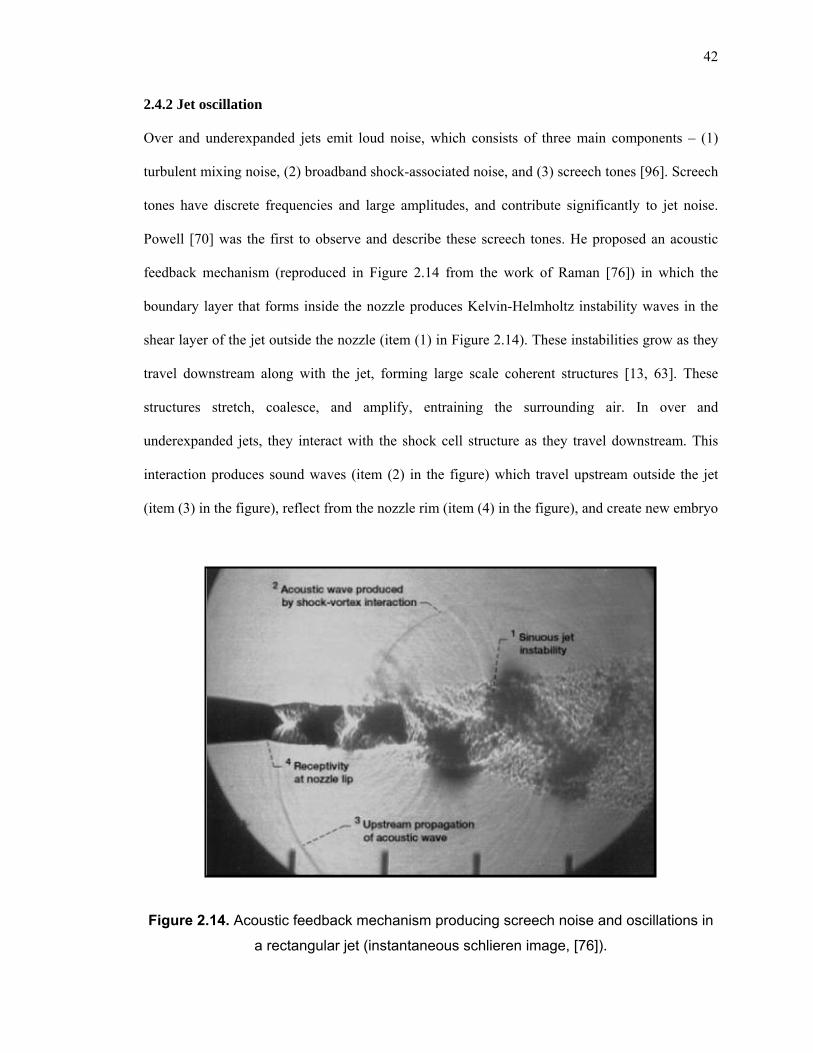
42
2.4.2 Jet oscillation
Over and underexpanded jets emit loud noise, which consists of three main components – (1)
turbulent mixing noise, (2) broadband shock-associated noise, and (3) screech tones [96]. Screech
tones have discrete frequencies and large amplitudes, and contribute significantly to jet noise.
Powell [70] was the first to observe and describe these screech tones. He proposed an acoustic
feedback mechanism (reproduced in Figure 2.14 from the work of Raman [76]) in which the
boundary layer that forms inside the nozzle produces Kelvin-Helmholtz instability waves in the
shear layer of the jet outside the nozzle (item (1) in Figure 2.14). These instabilities grow as they
travel downstream along with the jet, forming large scale coherent structures [13, 63]. These
structures stretch, coalesce, and amplify, entraining the surrounding air. In over and
underexpanded jets, they interact with the shock cell structure as they travel downstream. This
interaction produces sound waves (item (2) in the figure) which travel upstream outside the jet
(item (3) in the figure), reflect from the nozzle rim (item (4) in the figure), and create new embryo
Figure 2.14. Acoustic feedback mechanism producing screech noise and oscillations in
a rectangular jet (instantaneous schlieren image, [76]).
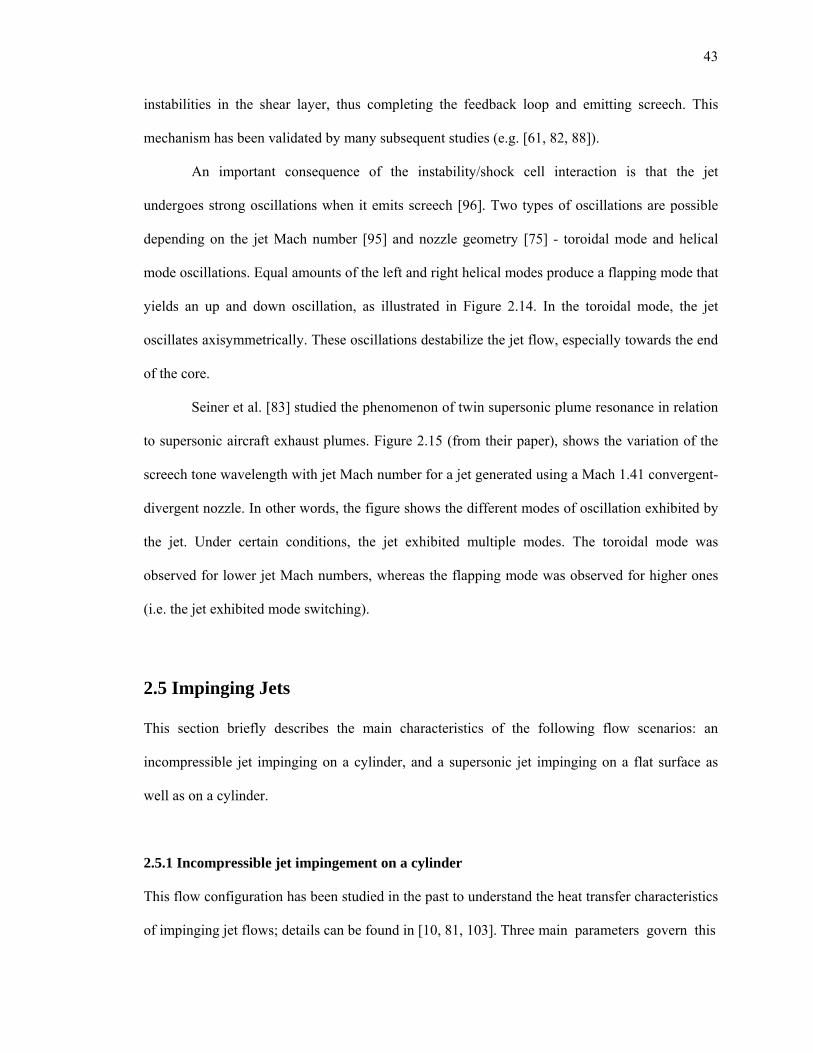
43
instabilities in the shear layer, thus completing the feedback loop and emitting screech. This
mechanism has been validated by many subsequent studies (e.g. [61, 82, 88]).
An important consequence of the instability/shock cell interaction is that the jet
undergoes strong oscillations when it emits screech [96]. Two types of oscillations are possible
depending on the jet Mach number [95] and nozzle geometry [75] - toroidal mode and helical
mode oscillations. Equal amounts of the left and right helical modes produce a flapping mode that
yields an up and down oscillation, as illustrated in Figure 2.14. In the toroidal mode, the jet
oscillates axisymmetrically. These oscillations destabilize the jet flow, especially towards the end
of the core.
Seiner et al. [83] studied the phenomenon of twin supersonic plume resonance in relation
to supersonic aircraft exhaust plumes. Figure 2.15 (from their paper), shows the variation of the
screech tone wavelength with jet Mach number for a jet generated using a Mach 1.41 convergent-
divergent nozzle. In other words, the figure shows the different modes of oscillation exhibited by
the jet. Under certain conditions, the jet exhibited multiple modes. The toroidal mode was
observed for lower jet Mach numbers, whereas the flapping mode was observed for higher ones
(i.e. the jet exhibited mode switching).
2.5 Impinging Jets
This section briefly describes the main characteristics of the following flow scenarios: an
incompressible jet impinging on a cylinder, and a supersonic jet impinging on a flat surface as
well as on a cylinder.
2.5.1 Incompressible jet impingement on a cylinder
This flow configuration has been studied in the past to understand the heat transfer characteristics
of impinging jet flows; details can be found in [10, 81, 103]. Three main parameters govern this
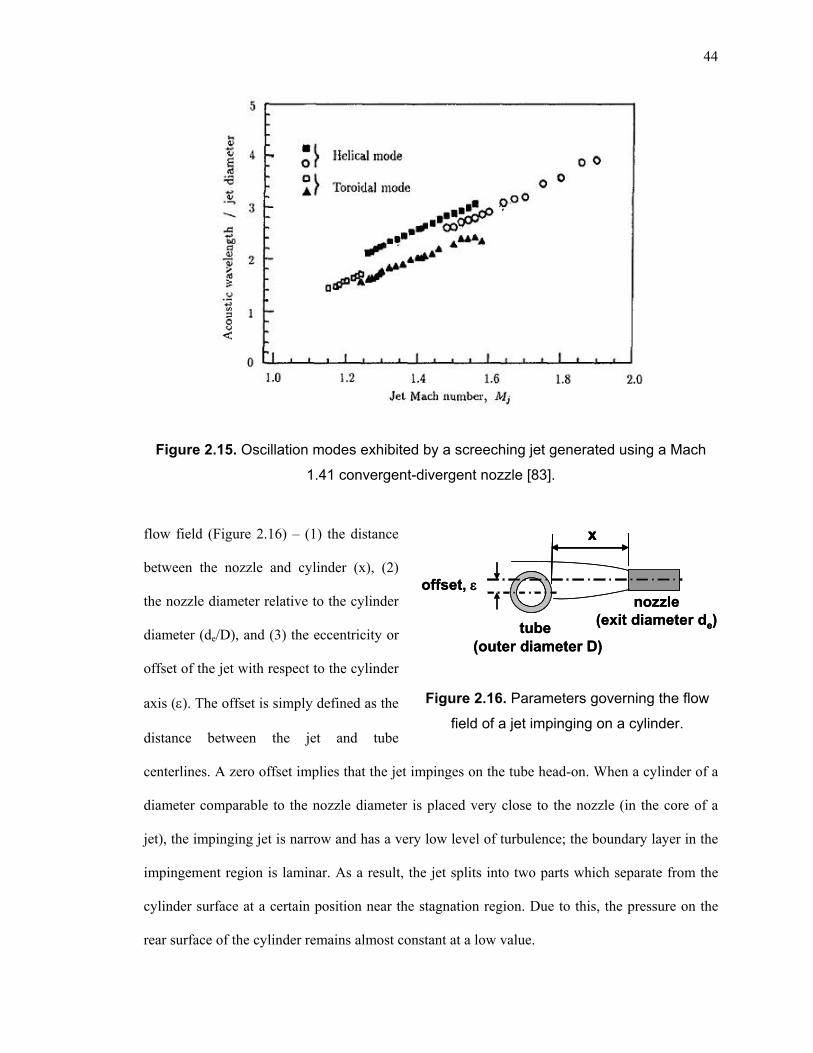
44
Figure 2.15. Oscillation modes exhibited by a screeching jet generated using a Mach
1.41 convergent-divergent nozzle [83].
flow field (Figure 2.16) – (1) the distance
between the nozzle and cylinder (x), (2)
the nozzle diameter relative to the cylinder
diameter (de/D), and (3) the eccentricity or
offset of the jet with respect to the cylinder
axis (). The offset is simply defined as the
distance between the jet and tube
centerlines. A zero offset implies that the jet impinges on the tube head-on. When a cylinder of a
diameter comparable to the nozzle diameter is placed very close to the nozzle (in the core of a
jet), the impinging jet is narrow and has a very low level of turbulence; the boundary layer in the
impingement region is laminar. As a result, the jet splits into two parts which separate from the
cylinder surface at a certain position near the stagnation region. Due to this, the pressure on the
rear surface of the cylinder remains almost constant at a low value.
Figure 2.16. Parameters governing the flow
field of a jet impinging on a cylinder.
x
offset,
tube(outer diameter D)
x
nozzle(exit diameter de)
xx
offset,
tube(outer diameter D)
x
nozzle(exit diameter de)
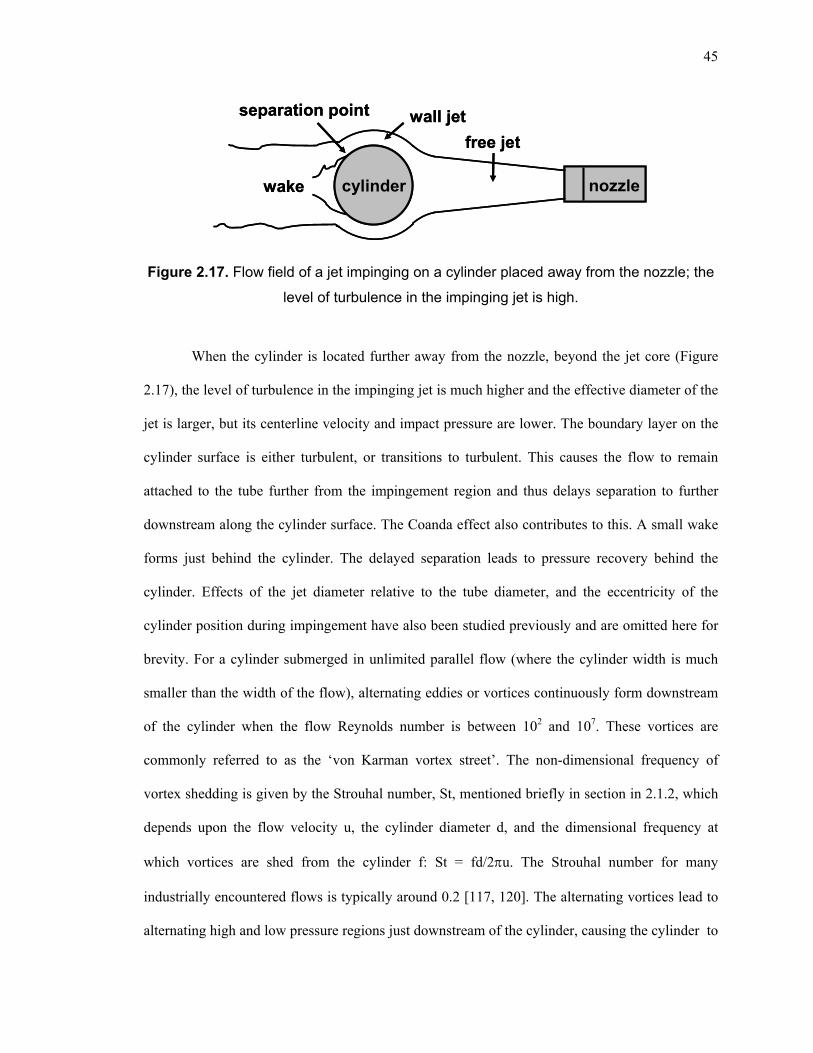
45
Figure 2.17. Flow field of a jet impinging on a cylinder placed away from the nozzle; the
level of turbulence in the impinging jet is high.
When the cylinder is located further away from the nozzle, beyond the jet core (Figure
2.17), the level of turbulence in the impinging jet is much higher and the effective diameter of the
jet is larger, but its centerline velocity and impact pressure are lower. The boundary layer on the
cylinder surface is either turbulent, or transitions to turbulent. This causes the flow to remain
attached to the tube further from the impingement region and thus delays separation to further
downstream along the cylinder surface. The Coanda effect also contributes to this. A small wake
forms just behind the cylinder. The delayed separation leads to pressure recovery behind the
cylinder. Effects of the jet diameter relative to the tube diameter, and the eccentricity of the
cylinder position during impingement have also been studied previously and are omitted here for
brevity. For a cylinder submerged in unlimited parallel flow (where the cylinder width is much
smaller than the width of the flow), alternating eddies or vortices continuously form downstream
of the cylinder when the flow Reynolds number is between 102 and 107. These vortices are
commonly referred to as the ‘von Karman vortex street’. The non-dimensional frequency of
vortex shedding is given by the Strouhal number, St, mentioned briefly in section in 2.1.2, which
depends upon the flow velocity u, the cylinder diameter d, and the dimensional frequency at
which vortices are shed from the cylinder f: St = fd/2u. The Strouhal number for many
industrially encountered flows is typically around 0.2 [117, 120]. The alternating vortices lead to
alternating high and low pressure regions just downstream of the cylinder, causing the cylinder to
cylinderwake
free jet
wall jetseparation point
nozzlecylinderwake
free jet
wall jetseparation point
nozzle
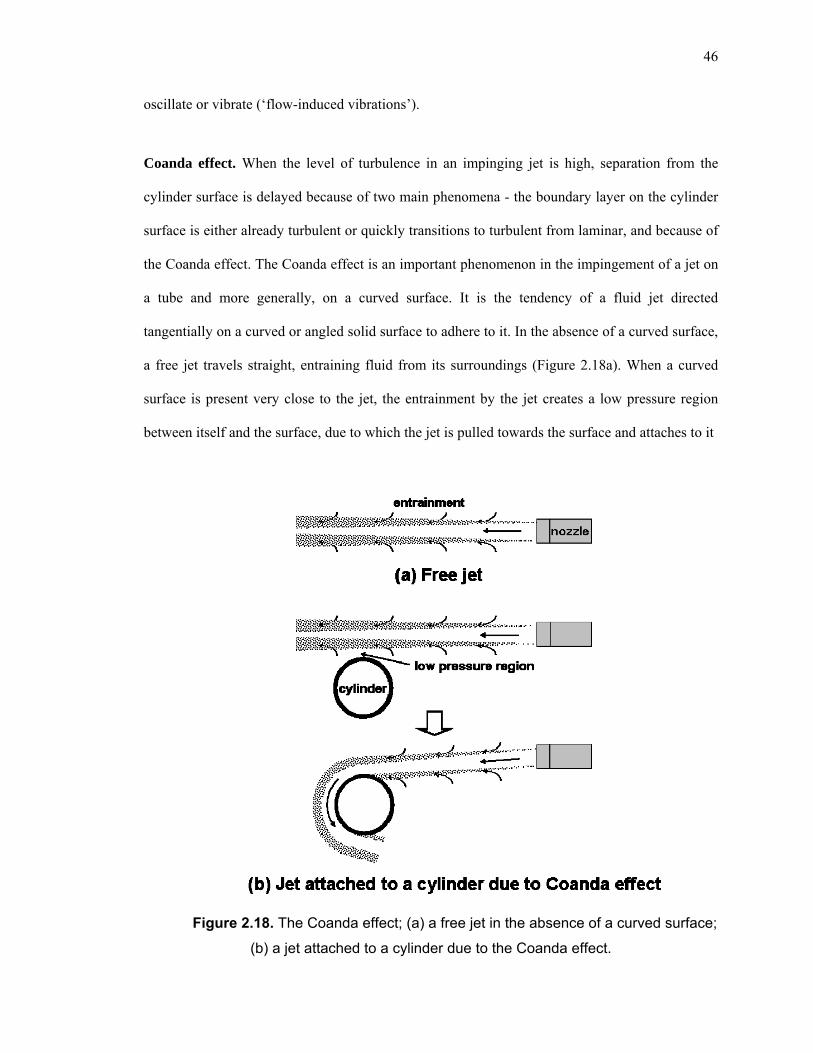
46
oscillate or vibrate (‘flow-induced vibrations’).
Coanda effect. When the level of turbulence in an impinging jet is high, separation from the
cylinder surface is delayed because of two main phenomena - the boundary layer on the cylinder
surface is either already turbulent or quickly transitions to turbulent from laminar, and because of
the Coanda effect. The Coanda effect is an important phenomenon in the impingement of a jet on
a tube and more generally, on a curved surface. It is the tendency of a fluid jet directed
tangentially on a curved or angled solid surface to adhere to it. In the absence of a curved surface,
a free jet travels straight, entraining fluid from its surroundings (Figure 2.18a). When a curved
surface is present very close to the jet, the entrainment by the jet creates a low pressure region
between itself and the surface, due to which the jet is pulled towards the surface and attaches to it
Figure 2.18. The Coanda effect; (a) a free jet in the absence of a curved surface;
(b) a jet attached to a cylinder due to the Coanda effect.

47
(Figure 2.18b) [112]. The Coanda effect is experienced more strongly by turbulent jets than by
laminar jets due to the greater entrainment by turbulent jets, and is effective mainly for
incompressible and low subsonic flows. Supersonic flows, which have a high momentum and are
dominated by shock and expansion waves, are mostly not affected by this effect.
In industrial boilers, this effect strongly influences the flow behaviour of combustion
gases between tube bundles. The flow of gases between two rows of tubes is similar to a two-
dimensional jet. Such a jet discharging into a limited space does not flow straight, but deflects to
one side of the flow passage because of the Coanda effect [56].
2.5.2 Supersonic jet impingement on a flat surface
This flow configuration has been studied extensively in the context of vertical takeoff and landing
(VTOL) aircraft, thrust vectoring, and ground erosion due to exhaust plume impingement [46].
Figure 2.19 schematically shows a supersonic jet impinging on a flat surface. Three main
parameters govern this flow [55] – (1) the jet structure (over/underexpanded) characterized by the
nozzle exit pressure ratio (PR), (2) the distance between the nozzle and surface, and (3) the
surface inclination angle. The flow field can be classified into three main regions as indicated in
the figure – (1) the free jet flow, (2) the impingement region, and (3) the radial wall jet. When a
supersonic jet impinges on a flat surface, a normal shock (called the plate shock) forms slightly
upstream of the surface. Flow downstream of this shock is subsonic, changes direction according
to the surface angle, and accelerates. This gives rise to the radial wall jet.
One of the earliest studies of jet impingement on a flat surface is that by Donaldson and
Snedeker [18]. They studied the impingement of subsonic and underexpanded supersonic jets on
a flat plate at different angles, by measuring the pressure distributions on the plate surface. In the
case of a strongly underexpanded jet, they found that the maximum surface pressure occurs in a
ring around the jet centerline, instead of at a stagnation point. Using surface flow visualization to
analyze this phenomenon, they proposed that the ring forms due to a region of separated flow
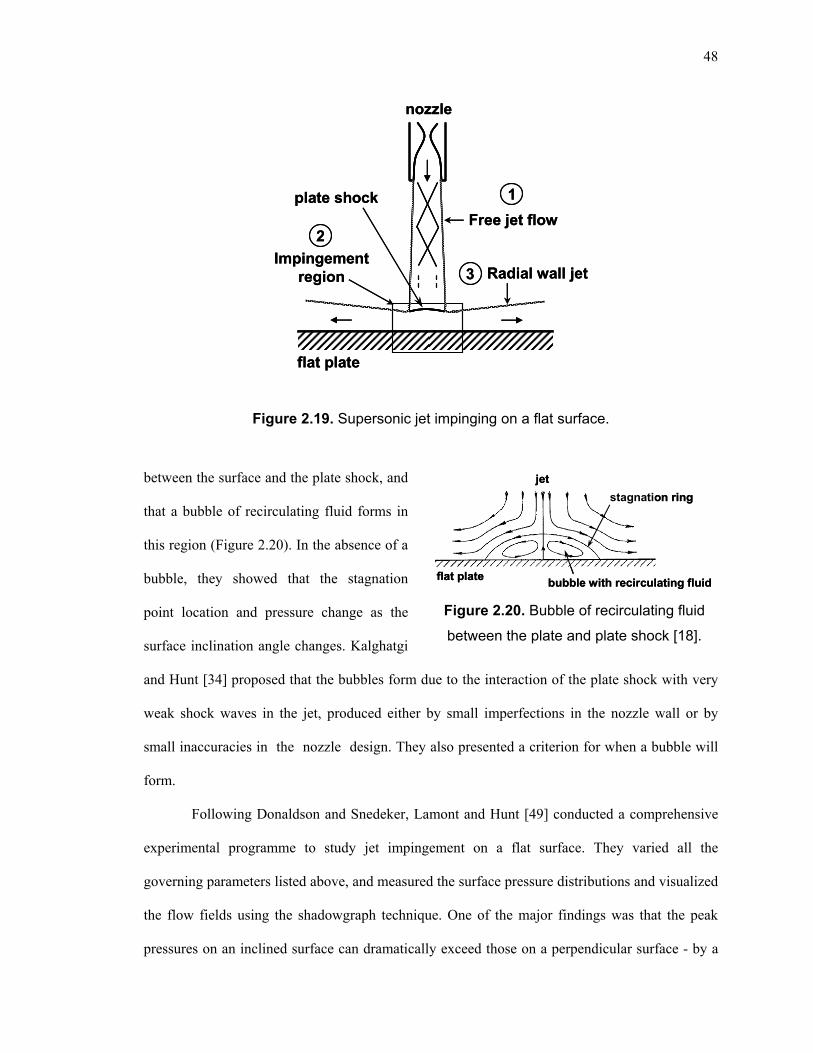
48
Figure 2.19. Supersonic jet impinging on a flat surface.
between the surface and the plate shock, and
that a bubble of recirculating fluid forms in
this region (Figure 2.20). In the absence of a
bubble, they showed that the stagnation
point location and pressure change as the
surface inclination angle changes. Kalghatgi
and Hunt [34] proposed that the bubbles form due to the interaction of the plate shock with very
weak shock waves in the jet, produced either by small imperfections in the nozzle wall or by
small inaccuracies in the nozzle design. They also presented a criterion for when a bubble will
form.
Following Donaldson and Snedeker, Lamont and Hunt [49] conducted a comprehensive
experimental programme to study jet impingement on a flat surface. They varied all the
governing parameters listed above, and measured the surface pressure distributions and visualized
the flow fields using the shadowgraph technique. One of the major findings was that the peak
pressures on an inclined surface can dramatically exceed those on a perpendicular surface - by a
stagnation ring
bubble with recirculating fluidflat plate
jet
stagnation ring
bubble with recirculating fluidflat plate
jet
Figure 2.20. Bubble of recirculating fluid
between the plate and plate shock [18].
1
Free jet flow
Radial wall jet3Impingement
region
2
nozzle
flat plate
plate shock 1
Free jet flow
Radial wall jet3Impingement
region
2
nozzle
flat plate
plate shock
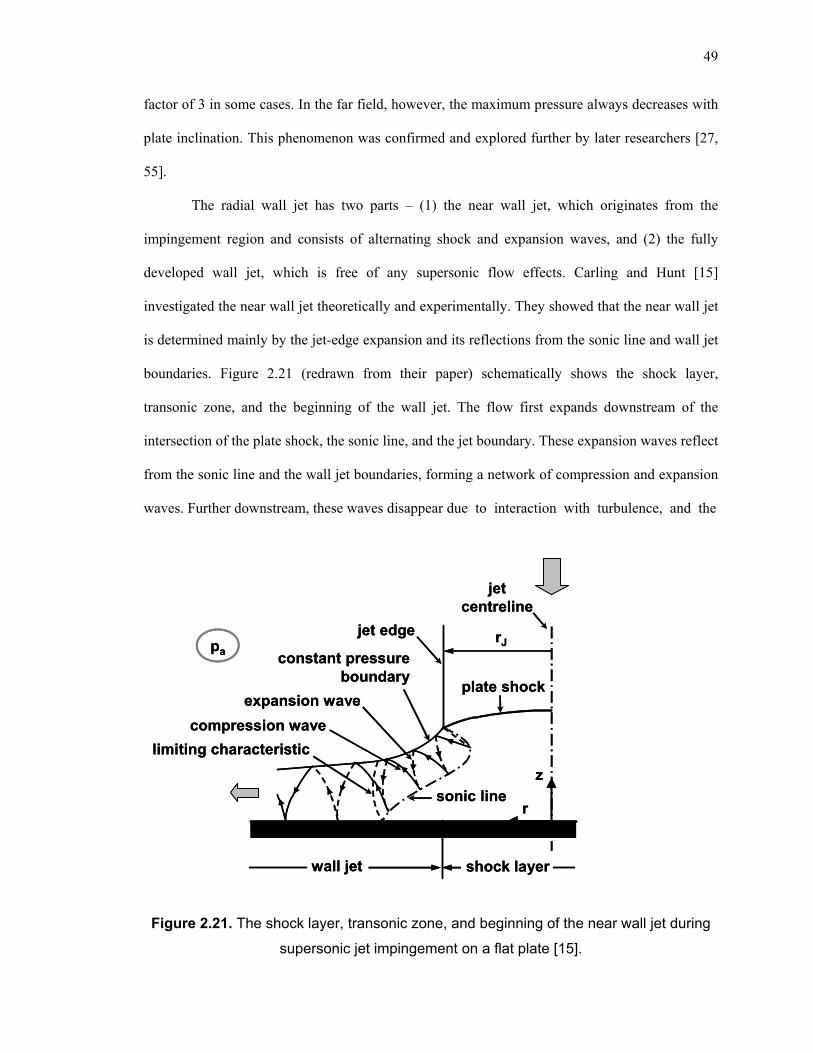
49
factor of 3 in some cases. In the far field, however, the maximum pressure always decreases with
plate inclination. This phenomenon was confirmed and explored further by later researchers [27,
55].
The radial wall jet has two parts – (1) the near wall jet, which originates from the
impingement region and consists of alternating shock and expansion waves, and (2) the fully
developed wall jet, which is free of any supersonic flow effects. Carling and Hunt [15]
investigated the near wall jet theoretically and experimentally. They showed that the near wall jet
is determined mainly by the jet-edge expansion and its reflections from the sonic line and wall jet
boundaries. Figure 2.21 (redrawn from their paper) schematically shows the shock layer,
transonic zone, and the beginning of the wall jet. The flow first expands downstream of the
intersection of the plate shock, the sonic line, and the jet boundary. These expansion waves reflect
from the sonic line and the wall jet boundaries, forming a network of compression and expansion
waves. Further downstream, these waves disappear due to interaction with turbulence, and the
r
z
plate shock
rJjet edge
constant pressure boundary
expansion wave
compression wave
limiting characteristic
sonic line
pa
wall jet shock layer
jet centreline
r
z
plate shock
rJjet edge
constant pressure boundary
expansion wave
compression wave
limiting characteristic
sonic line
pa
wall jet shock layer
jet centreline
Figure 2.21. The shock layer, transonic zone, and beginning of the near wall jet during
supersonic jet impingement on a flat plate [15].
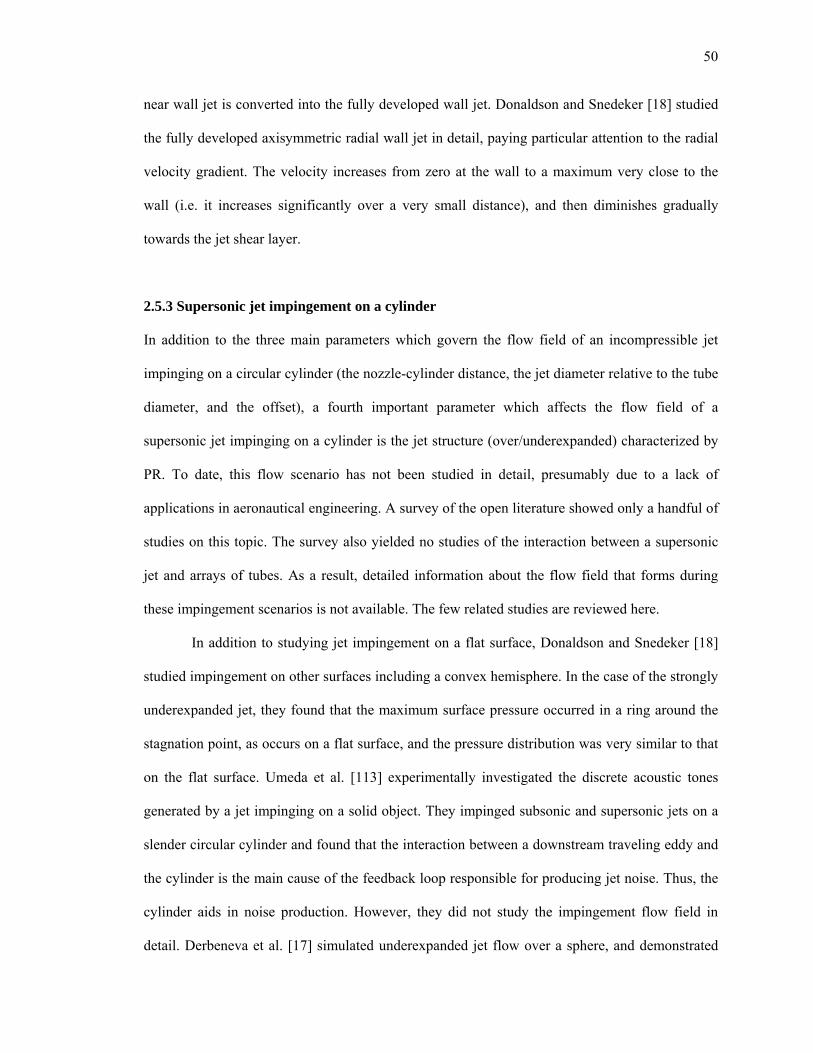
50
near wall jet is converted into the fully developed wall jet. Donaldson and Snedeker [18] studied
the fully developed axisymmetric radial wall jet in detail, paying particular attention to the radial
velocity gradient. The velocity increases from zero at the wall to a maximum very close to the
wall (i.e. it increases significantly over a very small distance), and then diminishes gradually
towards the jet shear layer.
2.5.3 Supersonic jet impingement on a cylinder
In addition to the three main parameters which govern the flow field of an incompressible jet
impinging on a circular cylinder (the nozzle-cylinder distance, the jet diameter relative to the tube
diameter, and the offset), a fourth important parameter which affects the flow field of a
supersonic jet impinging on a cylinder is the jet structure (over/underexpanded) characterized by
PR. To date, this flow scenario has not been studied in detail, presumably due to a lack of
applications in aeronautical engineering. A survey of the open literature showed only a handful of
studies on this topic. The survey also yielded no studies of the interaction between a supersonic
jet and arrays of tubes. As a result, detailed information about the flow field that forms during
these impingement scenarios is not available. The few related studies are reviewed here.
In addition to studying jet impingement on a flat surface, Donaldson and Snedeker [18]
studied impingement on other surfaces including a convex hemisphere. In the case of the strongly
underexpanded jet, they found that the maximum surface pressure occurred in a ring around the
stagnation point, as occurs on a flat surface, and the pressure distribution was very similar to that
on the flat surface. Umeda et al. [113] experimentally investigated the discrete acoustic tones
generated by a jet impinging on a solid object. They impinged subsonic and supersonic jets on a
slender circular cylinder and found that the interaction between a downstream traveling eddy and
the cylinder is the main cause of the feedback loop responsible for producing jet noise. Thus, the
cylinder aids in noise production. However, they did not study the impingement flow field in
detail. Derbeneva et al. [17] simulated underexpanded jet flow over a sphere, and demonstrated
51
that the flow separates from the surface, with a suspended shock. However, they did not analyze
jet interaction with a cylinder.
Very few sootblowing-inspired studies have been performed to date; they are reviewed
next. More recently, Tabrizi [92] and Rahimi [73] studied the impingement of an underexpanded
jet on a cylinder, in the context of sootblowing in boilers. Tabrizi measured the surface pressure
coefficient around a cylinder impinged by an underexpanded jet, and studied the effects of
nozzle-tube distance and offset on the pressure coefficient. However, he focused mainly on the
interaction between a slot jet and a cylinder, and compared it to limited data on the interaction
with a round jet. He also performed numerical simulations to calculate the shear stress coefficient
around a cylinder impinged by a jet. Assuming that the shear stresses are primarily responsible
for cleaning tubes, he concluded that slot jets are more effective than round jets. Rahimi focused
on the heat transfer characteristics of jet impingement on a cylinder, and carried out temperature
measurements to determine the Nusselt number distributions. He found that the Nusselt number is
a maximum in a ring around the stagnation point on the surface, analogous to the very similar
pressure distribution for underexpanded jets. The Nusselt number decreases very quickly away
from the impingement region, indicating that boiler tubes could be subjected to severe thermal
stresses if a sootblower were placed very close to the tubes.
2.6 Conclusions from the Literature Survey
The following conclusions may be drawn from the literature survey:
(1) The review of the literature related to sootblowing optimization showed that no major study
has been conducted to understand the interaction between a sootblower jet and a single tube,
or an array of tubes. These interactions occur continuously during sootblowing. As the
sootblower jet is supersonic, these interactions may affect jet structure and strength, and
hence, sootblowing efficacy. As a result, understanding these interactions is important.
52
(2) The open literature on supersonic jets is almost entirely related to aerospace applications. As
a result, jet/tube interactions have not been studied in detail due to lack of related
applications. Studies have been conducted to understand the behaviour of free supersonic jets
and supersonic jets impinging on flat surfaces, and these studies provide valuable information
about the impingement flow.
(3) Inclined sootblower nozzles are commonly used in coal-fired boilers, where the inter-platen
spacing is greater than in recovery boilers. Due to concerns over reduced cleaning radius and
increased platen swinging, these inclined nozzles have not been used until very recently to
clean recovery boiler superheater platens. The feasibility of using such nozzles remains to be
demonstrated.
(4) The generating bank and economizer sections of modern recovery boilers are made up of
finned tubes. There is little information in the open literature about the flow of a supersonic
jet impinging on such a geometry.
CHAPTER 3
EXPERIMENTAL DESIGN AND
METHODOLOGY
The interaction of a supersonic jet with models of tube arrangements found in the superheater,
generating bank and economizer sections was investigated by means of flow visualization and
peak impact pressure (PIP) measurements. This work involved the design, fabrication and setup
of the following apparatus, and measurement and data acquisition systems:
scaled-down models of a typical sootblower nozzle, and superheater, generating bank and
economizer tube bundles;
high speed schlieren flow visualization system;
pitot probe and positioning system;
LabVIEW control and data acquisition system; and
image processing software.
These systems will be described in detail in this chapter.
53
54
3.1 Scaled-down Nozzle and Tube Bundles
The main components of the experimental apparatus were ¼ scale models of a typical sootblower
nozzle, and of superheater, generating bank and economizer tube arrangements. The design of
each of the different tube arrangements is described in chapter 6.
A scale-down factor of 4 was selected to keep the experimental apparatus of a reasonable
size and complexity. In the past, the author had performed artificial deposit breakup experiments
using a supersonic jet [66]. He used a ¼ scale apparatus in those experiments, in which air was
supplied to a nozzle from standardized Linde compressed air cylinders. He found that a jet of 2s
duration caused the supply pressure in the cylinder to decrease by about 15%. As a result,
reducing the scale-down factor in the present experiments to 2 for example would have yielded a
larger apparatus, making instrumentation for measurements more convenient, but would have
increased the supply pressure drop much more. Equation (2.16) for the mass flow rate through a
choked nozzle shows that the flow rate is directly proportional to the cross-sectional area of the
nozzle throat, or to the square of the throat diameter. Increasing the throat diameter by a factor of
2 increases the mass flow rate by a factor of 4. Preventing a large supply pressure drop would
have required much bigger equipment such as a large stagnation chamber. On the other hand,
increasing the scale-down factor to greater than 4 would have decreased the supply pressure drop,
but would have yielded a very small apparatus, making instrumentation troublesome. Therefore, a
factor of 4 was selected as a reasonable compromise between maintaining a steady jet supply
pressure and keeping the apparatus simple.
The nozzle was a convergent-divergent nozzle with a throat diameter, dt = 4.5 mm, an
exit diameter, de = 7.4 mm, and a cone half-angle of 6.4° for the conical expansion section.
Where superheated steam is used in actual sootblowers, air was used in these experiments for
reasons of safety and simplicity.
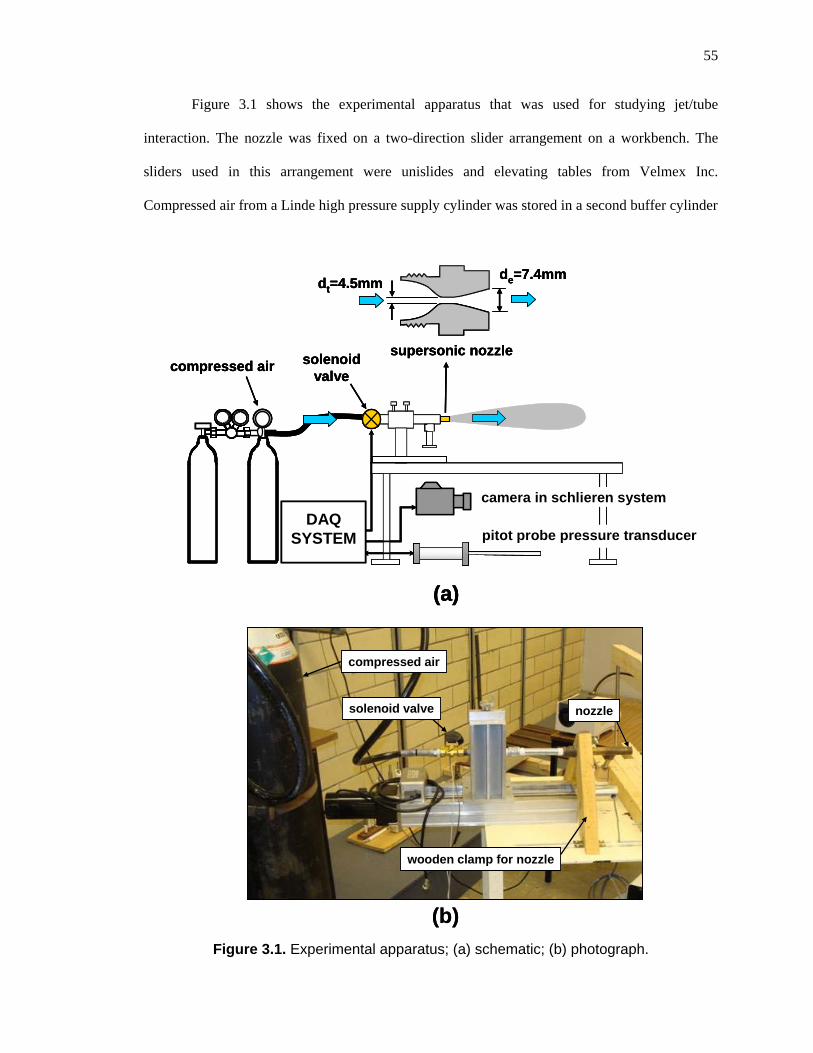
55
Figure 3.1 shows the experimental apparatus that was used for studying jet/tube
interaction. The nozzle was fixed on a two-direction slider arrangement on a workbench. The
sliders used in this arrangement were unislides and elevating tables from Velmex Inc.
Compressed air from a Linde high pressure supply cylinder was stored in a second buffer cylinder
Figure 3.1. Experimental apparatus; (a) schematic; (b) photograph.
(b)
solenoid valve
compressed air
nozzle
wooden clamp for nozzle
(a)
solenoid valve
camera in schlieren system
supersonic nozzlecompressed air
pitot probe pressure transducerDAQ
SYSTEM
dt=4.5mmde=7.4mm
(b)
solenoid valve
compressed air
nozzle
wooden clamp for nozzle
(a)
solenoid valve
camera in schlieren system
supersonic nozzlecompressed air
pitot probe pressure transducerDAQ
SYSTEM
dt=4.5mmde=7.4mm
(a)
solenoid valve
camera in schlieren system
supersonic nozzlecompressed air
pitot probe pressure transducerDAQ
SYSTEM
de=7.4mmdt=4.5mm
56
and supplied to the nozzle through a solenoid valve (series 21EN, manufactured by Granzow Inc.)
such that the pressure at the nozzle inlet was 2.14 MPa gauge (310 psig), similar to that of an
actual sootblower [32, 111]. The nozzle inlet pressure was maintained at this value for all
experiments. In each experiment, the jet was blown for 0.2s. This duration was found to be
optimal considering both the time required for completely pressurizing the pitot probe, and the
amount of air used per experiment. Preliminary experiments were performed in which the
temporal development of the jet from its initial transient stages to its quasi steady-state was
recorded, and showed that the jet attained quasi steady-state in less than about 20 ms, much
shorter than the total jet duration of 0.2s (or 200 ms). Schlieren images of the temporal
development of the jet are presented in Appendix A. The jet impinged on model tubes or tube
bundles placed in front of the nozzle and the resulting interaction was visualized using the
schlieren technique and captured by a high-speed camera.
3.1.1 Similarity of the lab air jet to an actual sootblower jet
For the experiments to reflect actual sootblower jet usage, the lab jet was designed to be
geometrically and dynamically similar to a sootblower jet [32, 111]. First of all, air was used in
these experiments instead of steam for reasons of safety and simplicity mentioned earlier. This is
justified based on the following reasons:
1. Sootblowing steam is superheated; therefore, it is a homogeneous fluid. For dynamic
similarity, the lab jet must also be of a homogeneous fluid, which is air in these experiments.
2. Dynamic similarity of a compressible flow requires that the ratio of specific heats, = cp/cv
should be similar for both the lab jet (air) and a sootblower jet (steam). of steam is ~1.3,
whereas that of air is ~1.4.
3. Recently, field trials were conducted in operating recovery boilers in Sweden, to measure
sootblower jet force by a special probe [80]. The data were found to be consistent with those
57
obtained from lab scale experiments using air as the jet fluid [35, 40].
Geometric similarity was achieved by scaling the nozzle throat and exit diameters four
times smaller than the corresponding diameters of the actual nozzle.
For the lab jet to be dynamically similar to an actual jet, three aspects were considered:
nozzle exit Mach number, Mae, jet structure (under/overexpanded), and jet spreading rate (rate at
which the jet diameter increases with distance from the nozzle exit due to entrainment of the
surrounding fluid; see section 2.4.1). Theoretically, Mae is only a function of the ratio of the
nozzle exit diameter to throat diameter (see equation 2.15). Since the lab nozzle is geometrically
similar to an actual nozzle, the same Mae was obtained for the lab jet as an actual jet. Using the
basic one-dimensional nozzle flow theory summarized in section 2.2.3, the air supply pressure
was set such that an almost fully expanded jet with a nozzle exit Mach number, Mae of 2.5 was
generated.
Actual sootblower jets are always either underexpanded or overexpanded due to supply
pressure fluctuations and other reasons. A given nozzle generates an underexpanded jet when the
supply pressure is greater than the nozzle design pressure, and generates an overexpanded jet
when the supply pressure is lower than the design pressure. As a result, underexpanded jets are
more powerful than overexpanded jets due to the higher steam flow and are preferred over
overexpanded jets. At 2.14 MPa gauge (310 psig), the lab jet was slightly underexpanded, and
hence suitable for experiments.
Three parameters that affect the spreading rate of supersonic jets are (in decreasing order
of importance): (i) Mae, (ii) the ratio of the velocity of the stream surrounding the jet (the co-
flowing stream) to the velocity of the jet, and (iii) the ratio of the density of the co-flowing stream
to the density of the jet [63]. Mae was the same for both the lab and actual jets. The velocity ratio
was effectively 0 in the experiments and inside the boiler. The density ratio is ~4 inside the boiler
whereas it was ~3 in these experiments. As a result, the spreading rate of the lab jet was very
close to that of an actual jet.
58
The field trials in Sweden referred to above [80] showed that the flue gas temperature in
the vicinity of a sootblower does not affect the sootblower jet strength in any significant way.
Two trials were carried out using the same sootblower in a recovery boiler at different times. At
the time of the first trial, the boiler was about to be commissioned and was operating on gas, so
the flue gas temperature in the vicinity of the sootblower was low, between 100°C-300°C. At the
time of the second trial, the boiler was burning black liquor at 50% of its full firing capacity, and
the flue gas temperature was much higher, between 500°C-540°C. The results of the tests
performed during both these trials were similar to and consistent with each other; no significant
difference was observed between them.
In the ideal scenario, the lab jet Reynolds number based on the conditions at the nozzle
exit, Ree, should also be similar to that of an actual jet, to ensure dynamic similarity. Using
Sutherland’s law to calculate viscosity [117], Ree of both the lab jet as well as an actual jet were
determined to be of the order of 106 (around 1.6 x 10⁶ for the lab jet and 1.9 x 10⁶ for an actual
jet). However, it should be noted that for supersonic flow involving obstacles, the Mach number
has a much greater influence on the fluid dynamics than the Reynolds number [117].
Finally, the effect of the scale-down process on jet PIP and force should also be
determined. The PIP at a given location in the supersonic portion of a jet depends only on the
local total pressure and Mach number upstream of a normal shock wave, and the specific heat
ratio, , of the jet fluid (see equation (2.8)). The local upstream total pressure and Mach number
in turn depend on the jet supply pressure and the nozzle exit Mach number, as well as the nozzle
design. As mentioned earlier, both the supply pressure and the exit Mach number of the lab jet
were similar to those of an actual sootblower jet. Any minor differences will be due to differences
in the nozzle design. Moreover, the difference in of air and steam ( of air = 1.4 versus of
steam = 1.3) will contribute only little to the difference between the PIP of the lab jet and an
actual jet. For example, the PIP along the centreline of a Mach 2.5 fully expanded jet core differs
59
by 8% between air and steam jets (with the same supply pressure). As a result, although there will
be a difference in the PIP of the lab and actual jets, the cumulative effect of the difference in the
nozzle design and on the difference in the PIP will not be large.
Control volume analysis just outside the nozzle using appropriate scale-down factors and
isentropic relations showed that the force of the lab jet was approximately 14-15 times smaller
than the force of an actual sootblower jet, mainly due to the reduction in the nozzle exit diameter
by a factor of 4, which leads to a decrease in area of 16 times. However, the present thesis is a
study mainly of the jet flow field and PIP during interaction with tubes, and does not involve a
study of jet force. As a result, the effect of the scale-down process on jet force is not important in
this work.
For the above reasons, the lab air jet was considered similar to an actual sootblower jet,
and the results of this work are applicable to actual sootblowing inside a boiler.
3.2 High-Speed Schlieren Flow Visualization System
The schlieren technique was employed to visualize the invisible air jet and its interaction with
tubes and tube bundles. Due to the very high velocity of supersonic jets, a high-speed camera was
coupled with the schlieren technique.
As described in section 2.3, a conventional two-mirror, z-type schlieren system was used
for flow visualization. The system was supplied by Optikon Inc. and consisted of two parabolic
mirrors, a light source with adjustable aperture, and a knife edge. The mirrors were made of
Pyrex, and had a focal length of 1524 mm (60”), and a diameter and hence field-of-view of 140
mm (5.5”) (Figure 3.2a). The light source was a Schott KL2500 series continuous halogen cold
light source. Custom-designed telescoping metal stands were fabricated for supporting the
mirrors. The knife edge was positioned on an adjustable tripod.
The high-speed camera used was a MegaSpeed 70KS2B2HS from Canadian Photonics
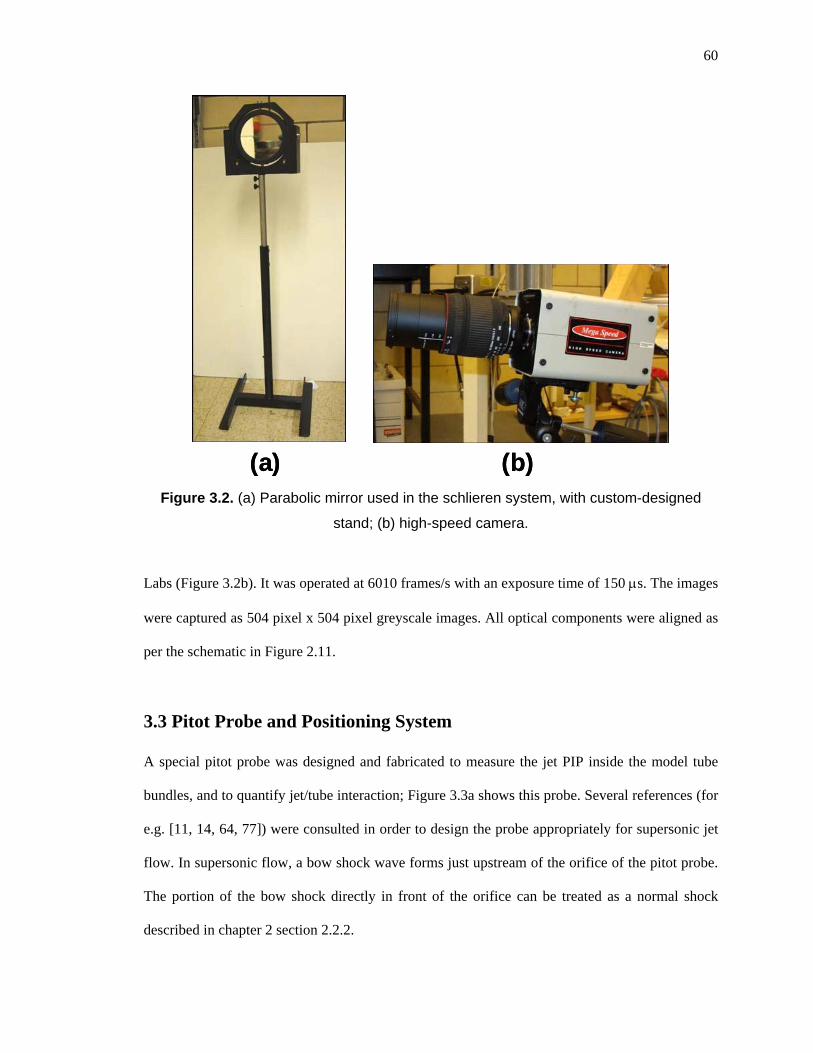
60
(a) (b)(a) (b)
Figure 3.2. (a) Parabolic mirror used in the schlieren system, with custom-designed
stand; (b) high-speed camera.
Labs (Figure 3.2b). It was operated at 6010 frames/s with an exposure time of 150 s. The images
were captured as 504 pixel x 504 pixel greyscale images. All optical components were aligned as
per the schematic in Figure 2.11.
3.3 Pitot Probe and Positioning System
A special pitot probe was designed and fabricated to measure the jet PIP inside the model tube
bundles, and to quantify jet/tube interaction; Figure 3.3a shows this probe. Several references (for
e.g. [11, 14, 64, 77]) were consulted in order to design the probe appropriately for supersonic jet
flow. In supersonic flow, a bow shock wave forms just upstream of the orifice of the pitot probe.
The portion of the bow shock directly in front of the orifice can be treated as a normal shock
described in chapter 2 section 2.2.2.
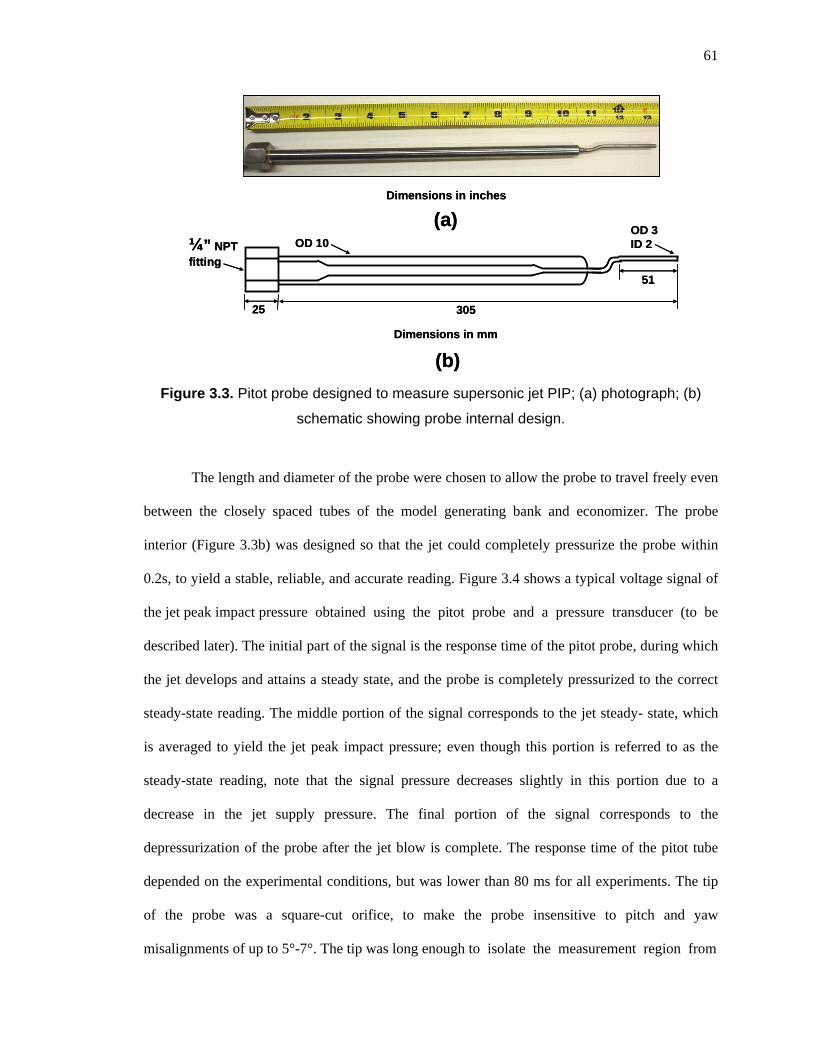
61
Dimensions in inchesDimensions in inches
(a)
Figure 3.3. Pitot probe designed to measure supersonic jet PIP; (a) photograph; (b)
schematic showing probe internal design.
The length and diameter of the probe were chosen to allow the probe to travel freely even
between the closely spaced tubes of the model generating bank and economizer. The probe
interior (Figure 3.3b) was designed so that the jet could completely pressurize the probe within
0.2s, to yield a stable, reliable, and accurate reading. Figure 3.4 shows a typical voltage signal of
the jet peak impact pressure obtained using the pitot probe and a pressure transducer (to be
described later). The initial part of the signal is the response time of the pitot probe, during which
the jet develops and attains a steady state, and the probe is completely pressurized to the correct
steady-state reading. The middle portion of the signal corresponds to the jet steady- state, which
is averaged to yield the jet peak impact pressure; even though this portion is referred to as the
steady-state reading, note that the signal pressure decreases slightly in this portion due to a
decrease in the jet supply pressure. The final portion of the signal corresponds to the
depressurization of the probe after the jet blow is complete. The response time of the pitot tube
depended on the experimental conditions, but was lower than 80 ms for all experiments. The tip
of the probe was a square-cut orifice, to make the probe insensitive to pitch and yaw
misalignments of up to 5°-7°. The tip was long enough to isolate the measurement region from
OD 3ID 2¼” NPT
fitting
(a)
(b)
25 305
Dimensions in mm
51
OD 10OD 3ID 2¼” NPT
fitting
(b)
25 305
Dimensions in mm
51
OD 10
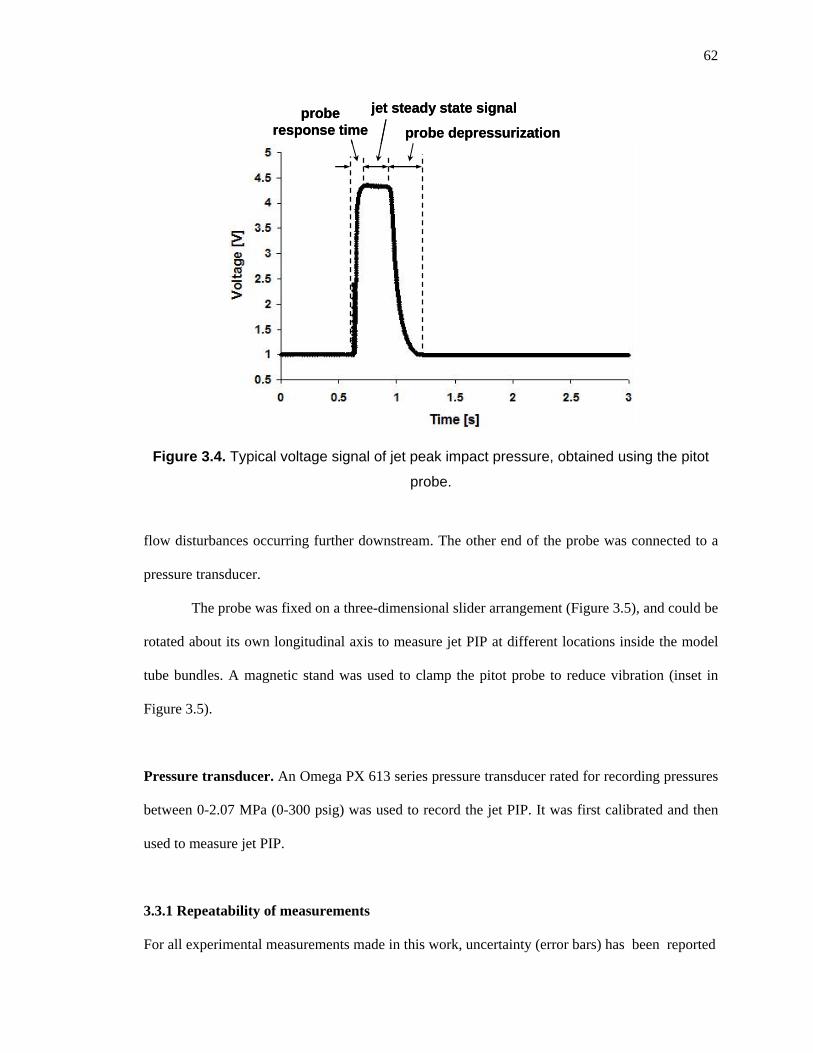
62
jet steady state signal
Figure 3.4. Typical voltage signal of jet peak impact pressure, obtained using the pitot
probe.
flow disturbances occurring further downstream. The other end of the probe was connected to a
pressure transducer.
The probe was fixed on a three-dimensional slider arrangement (Figure 3.5), and could be
rotated about its own longitudinal axis to measure jet PIP at different locations inside the model
tube bundles. A magnetic stand was used to clamp the pitot probe to reduce vibration (inset in
Figure 3.5).
Pressure transducer. An Omega PX 613 series pressure transducer rated for recording pressures
between 0-2.07 MPa (0-300 psig) was used to record the jet PIP. It was first calibrated and then
used to measure jet PIP.
3.3.1 Repeatability of measurements
For all experimental measurements made in this work, uncertainty (error bars) has been reported
probe depressurizationprobe
response time
jet steady state signal
probe depressurizationprobe
response time
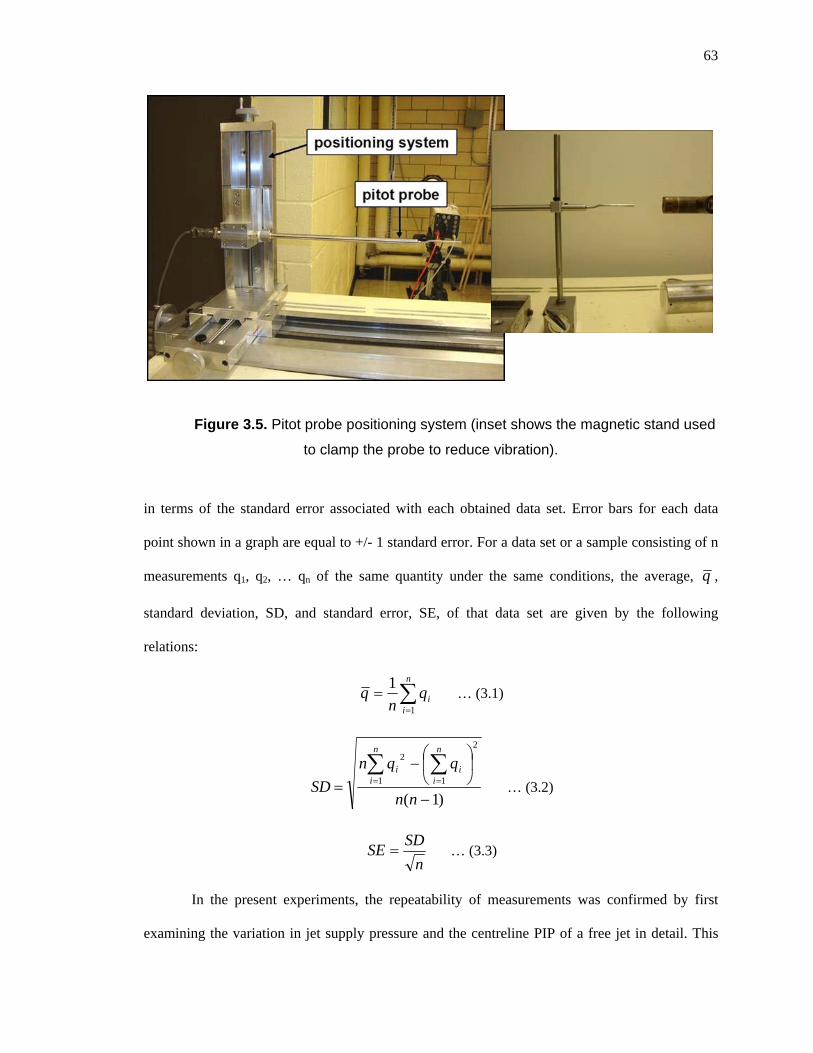
63
Figure 3.5. Pitot probe positioning system (inset shows the magnetic stand used
to clamp the probe to reduce vibration).
in terms of the standard error associated with each obtained data set. Error bars for each data
point shown in a graph are equal to +/- 1 standard error. For a data set or a sample consisting of n
measurements q1, q2, … qn of the same quantity under the same conditions, the average, q ,
standard deviation, SD, and standard error, SE, of that data set are given by the following
relations:
n
iiq
nq
1
1 … (3.1)
)1(
2
11
2
nn
qqn
SD
n
ii
n
ii
… (3.2)
n
SDSE … (3.3)
In the present experiments, the repeatability of measurements was confirmed by first
examining the variation in jet supply pressure and the centreline PIP of a free jet in detail. This
64
was done by repeating those measurements several times. Because those measurements were
found repeatable with only small uncertainty, any subsequent measurements were repeated only
once (that is, two measurements under the same conditions) to confirm their repeatability.
The uncertainty in the jet supply pressure was determined based on 25 measurements;
only for these tests, a transducer other than the one described above was used, since it had a
pressure rating higher than 2.07 MPa (300 psig). The average supply pressure was found to be
2.14 MPa gauge (310 psig) with a standard deviation of only 14 kPa (2 psig) or 0.7% of the
supply pressure, and a standard error of 2.8 kPa (0.4 psig).
Uncertainty in the jet PIP measurements can be introduced by uncertainty in the supply
pressure as well as in the signal generated by the transducer (random errors). The normal shock
relation (equation 2.8) shows that the PIP in the supersonic portion of a jet depends mainly on the
total pressure and Ma upstream of a normal shock wave that forms at the probe tip; the PIP is
directly proportional to the upstream total pressure. The PIP at a subsonic location is the total
pressure of the flow at that location (since no shock waves form). Both the upstream total
pressure and Ma in turn depend on the jet supply pressure. As a result, any uncertainty in the
supply pressure will lead to uncertainty in the PIP measurement. However, this contribution (due
to 0.7% variation in the present experiments) is expected to be very small for a mildly
underexpanded jet, which is the case in the present experiments; the shock cells of such a jet are
weak, yielding mild changes in jet properties such as the total pressure and Ma in the radial and
axial directions.
The uncertainty in the signal recorded at each axial location of the jet was determined
from at least 3 measurements at each location (4 in some cases). The maximum standard
deviation was found to be 70 kPa (10 psig) for a PIP equal to 0.84 MPa gauge (122 psig) at 2.8
cm from the nozzle exit, that is, 8.3% of the PIP. The standard error was 40 kPa (6 psig).

65
3.3.2 Accuracy of measurements
Accuracy of a measurement can be determined by comparing the measured value to that obtained
by some other method for the same conditions. This other method is preferably a theoretical
analysis of the phenomenon governing the quantity being measured. In case the phenomenon is
too complicated for theoretical analysis, the accuracy can be determined by comparison with data
from previous similar experiments. To confirm that the pitot probe measured the jet PIP
accurately in the present experiments, the PIP measured at the nozzle exit was compared to that
calculated theoretically using the normal shock relation (equation 2.8). This theory allows
calculation of the flow inside the nozzle, up to the nozzle exit. Beyond the exit, theoretical
analysis is complicated due to the presence of shock cells and due to shock-turbulence
interaction.
The pitot probe was used to measure the supply pressure at the nozzle inlet as well as the
nozzle exit PIP. The probe directly measured the jet supply pressure at the nozzle inlet, since the
flow in this region is subsonic and free of any shock/expansion waves. The pressure measured at
the nozzle exit was the jet PIP behind a normal shock wave at the probe tip. The measured supply
pressure and the theoretically calculated nozzle exit Mach number (determined from equation
2.15) were inserted in equation 2.8 to calculate the expected nozzle exit PIP. This was carried out
for four different supply pressures, and for each supply pressure, the measurements were repeated
twice, and were found reproducible. The results are shown in Table 3.1.
It is clear from Table 3.1 that the pitot probe functioned properly, and the measured PIP
values were accurate. The measured and calculated nozzle exit PIP values for all the tested supply
pressures were found to be very close to each other. In fact, the error relative to the calculated PIP
decreased as the supply pressure increased, and was only 1% at a supply pressure of 2.15 MPa
gauge (312 psig). At other positions downstream of the exit, the PIP profile of a free jet was
consistent with that available in the literature under conditions similar to the present experiments
[47]. Hence, the probe and measurement system were deemed accurate and capable of measuring
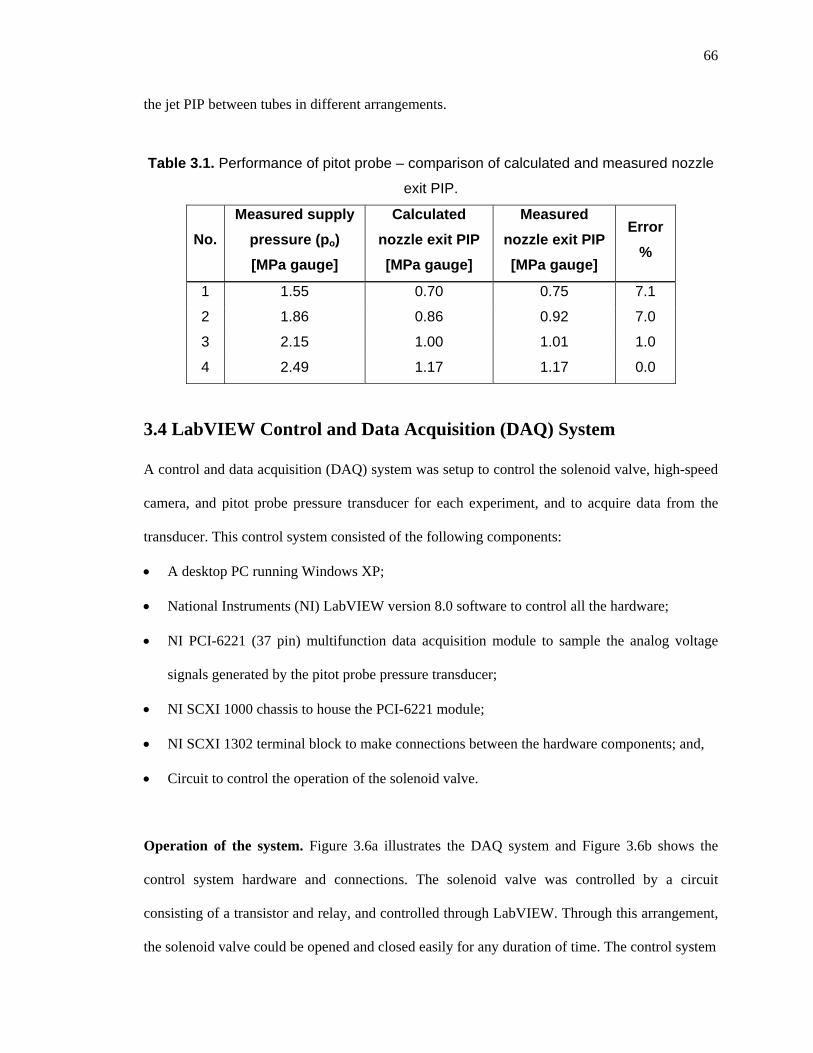
66
the jet PIP between tubes in different arrangements.
Table 3.1. Performance of pitot probe – comparison of calculated and measured nozzle
exit PIP.
No.
Measured supply
pressure (po)
[MPa gauge]
Calculated
nozzle exit PIP
[MPa gauge]
Measured
nozzle exit PIP
[MPa gauge]
Error
%
1 1.55 0.70 0.75 7.1
2 1.86 0.86 0.92 7.0
3 2.15 1.00 1.01 1.0
4 2.49 1.17 1.17 0.0
3.4 LabVIEW Control and Data Acquisition (DAQ) System
A control and data acquisition (DAQ) system was setup to control the solenoid valve, high-speed
camera, and pitot probe pressure transducer for each experiment, and to acquire data from the
transducer. This control system consisted of the following components:
A desktop PC running Windows XP;
National Instruments (NI) LabVIEW version 8.0 software to control all the hardware;
NI PCI-6221 (37 pin) multifunction data acquisition module to sample the analog voltage
signals generated by the pitot probe pressure transducer;
NI SCXI 1000 chassis to house the PCI-6221 module;
NI SCXI 1302 terminal block to make connections between the hardware components; and,
Circuit to control the operation of the solenoid valve.
Operation of the system. Figure 3.6a illustrates the DAQ system and Figure 3.6b shows the
control system hardware and connections. The solenoid valve was controlled by a circuit
consisting of a transistor and relay, and controlled through LabVIEW. Through this arrangement,
the solenoid valve could be opened and closed easily for any duration of time. The control system

67
Figure 3.6. (a) LabVIEW control and data acquisition (DAQ) system diagram; (b)
photograph of the control system hardware.
was used to power the pressure transducer and receive the analog voltage signal. The system was
also used to trigger the high-speed camera used in the schlieren system.
For each experiment, the following steps were performed in sequence:
1. Through the DAQ system, a signal was first sent to operate the pitot probe pressure
transducer and start recording the voltage output from the transducer.
~
In
OutTrigger
High-speed camera
Pitot probe pressure transducer
Solenoid valve control circuit
DAQ
SYSTEM
(a)
(b)
~
In
OutTrigger
High-speed camera
Pitot probe pressure transducer
Solenoid valve control circuit
DAQ
SYSTEM
~~~~
In
OutTrigger
High-speed camera
Pitot probe pressure transducer
Solenoid valve control circuit
DAQ
SYSTEM
(a)
(b)
68
2. The high-speed camera was then triggered to start recording.
3. Then, the solenoid valve was opened for 0.2s during which a supersonic air jet exited from
the nozzle and impinged on a model tube or tube bundle placed in front of the nozzle. The
resulting interaction was captured by the high-speed camera. The jet PIP voltage signal
generated by the pressure transducer was simultaneously recorded by the DAQ system.
4. The valve was then closed and recording of the transducer output signal was stopped. By the
end of the experiment, the camera was also stopped.
5. The captured images and transducer signal were processed and analyzed. For each
measurement, a fixed number of samples from the steady-state region of the recorded voltage
signal was averaged, and the average value was converted to gauge pressure using the
transducer calibration equations.
The delay associated with the DAQ system was measured to be about 0.14s and was
taken into account when programming the system, as it was unavoidable. The LabVIEW
graphical program developed to operate the system described above is included as Appendix B.
3.5 Image Processing
For most of this work, image processing was used to enhance the brightness and contrast of
individual schlieren images captured by the high-speed camera. However, in the work related to
secondary jets, for each experiment, image processing was first used to average a large number of
images showing the steady-state flow field. This averaged image was contrast-enhanced and then
used to measure the secondary jet angle. Figure 3.7 shows a sample contrast-enhanced average
image. ImageJ software was used to process and analyze the images [29].

69
Figure 3.7. Sample of a contrast-enhanced average image.
CHAPTER 4
FREE JET CHARACTERIZATION
The main objective of this work was to study the interaction between a supersonic jet and tube
bundles with different tube arrangements. A necessary prerequisite to studying this interaction is
the characterization of the supersonic jet itself, so that the interaction with a tube bundle can be
characterized by comparison with the free jet. Jet flow between two rows of tubes is an important
flow scenario, and knowledge of the jet size (radius or diameter) is very important to correctly
understand this jet/tube interaction. Jet size determines if strong interaction will occur between a
jet and a tube bundle (depending on the spacing between the tubes), and if interaction occurs, jet
size determines the location of the initial point of interaction. As a result, one of the objectives of
characterizing the free jet was determining the jet radius as a function of the axial distance from
the nozzle exit, that is, to determine the jet spreading. This chapter describes the structure and
characteristics of the supersonic jet used in this work.
70
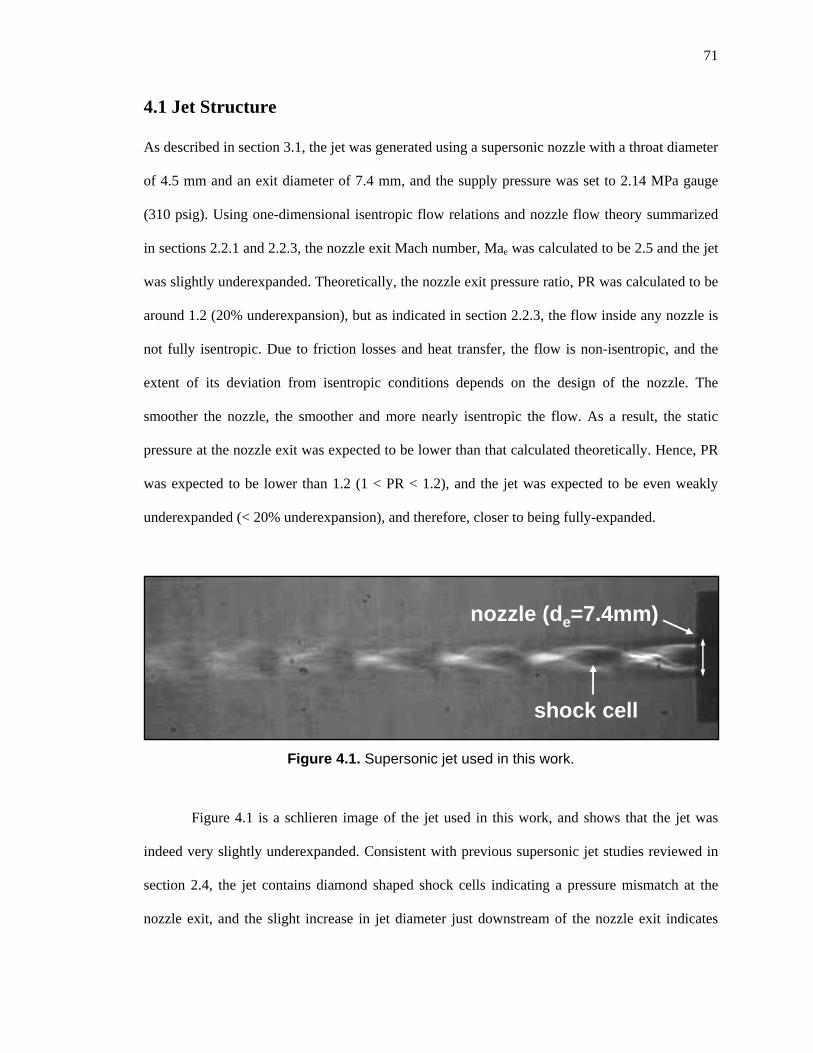
71
4.1 Jet Structure
As described in section 3.1, the jet was generated using a supersonic nozzle with a throat diameter
of 4.5 mm and an exit diameter of 7.4 mm, and the supply pressure was set to 2.14 MPa gauge
(310 psig). Using one-dimensional isentropic flow relations and nozzle flow theory summarized
in sections 2.2.1 and 2.2.3, the nozzle exit Mach number, Mae was calculated to be 2.5 and the jet
was slightly underexpanded. Theoretically, the nozzle exit pressure ratio, PR was calculated to be
around 1.2 (20% underexpansion), but as indicated in section 2.2.3, the flow inside any nozzle is
not fully isentropic. Due to friction losses and heat transfer, the flow is non-isentropic, and the
extent of its deviation from isentropic conditions depends on the design of the nozzle. The
smoother the nozzle, the smoother and more nearly isentropic the flow. As a result, the static
pressure at the nozzle exit was expected to be lower than that calculated theoretically. Hence, PR
was expected to be lower than 1.2 (1 < PR < 1.2), and the jet was expected to be even weakly
underexpanded (< 20% underexpansion), and therefore, closer to being fully-expanded.
nozzle (de=7.4mm)
shock cell
nozzle (de=7.4mm)
shock cell
Figure 4.1. Supersonic jet used in this work.
Figure 4.1 is a schlieren image of the jet used in this work, and shows that the jet was
indeed very slightly underexpanded. Consistent with previous supersonic jet studies reviewed in
section 2.4, the jet contains diamond shaped shock cells indicating a pressure mismatch at the
nozzle exit, and the slight increase in jet diameter just downstream of the nozzle exit indicates
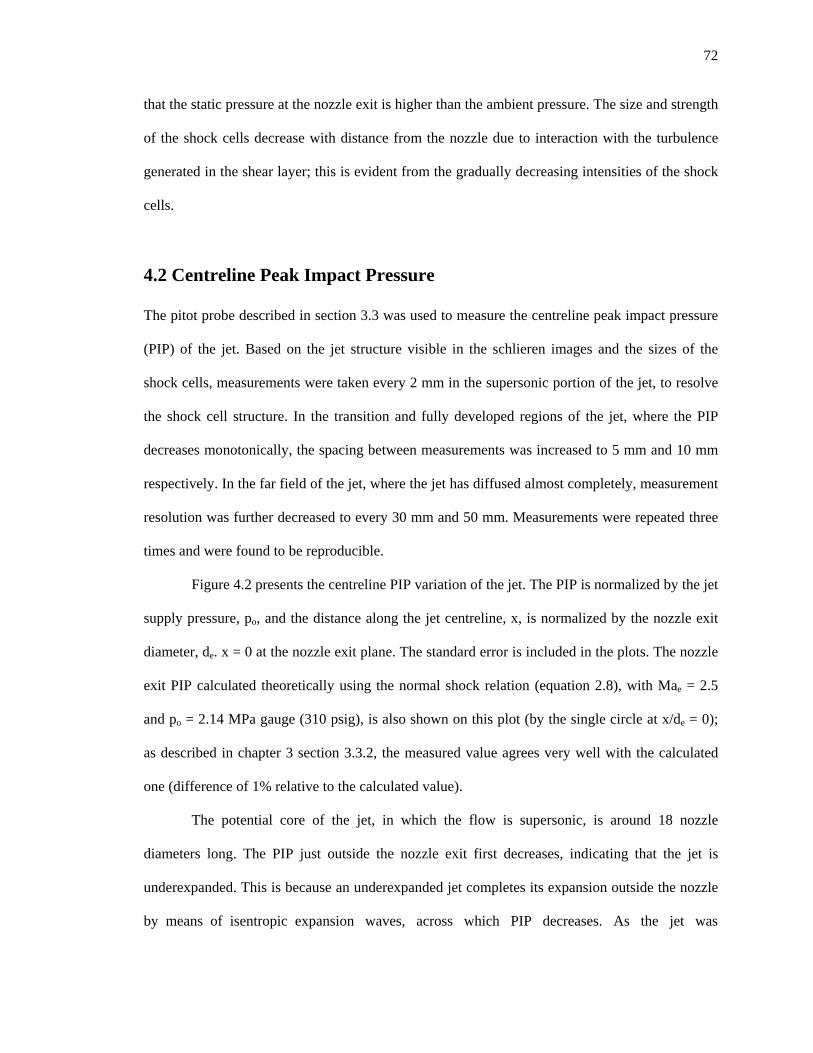
72
that the static pressure at the nozzle exit is higher than the ambient pressure. The size and strength
of the shock cells decrease with distance from the nozzle due to interaction with the turbulence
generated in the shear layer; this is evident from the gradually decreasing intensities of the shock
cells.
4.2 Centreline Peak Impact Pressure
The pitot probe described in section 3.3 was used to measure the centreline peak impact pressure
(PIP) of the jet. Based on the jet structure visible in the schlieren images and the sizes of the
shock cells, measurements were taken every 2 mm in the supersonic portion of the jet, to resolve
the shock cell structure. In the transition and fully developed regions of the jet, where the PIP
decreases monotonically, the spacing between measurements was increased to 5 mm and 10 mm
respectively. In the far field of the jet, where the jet has diffused almost completely, measurement
resolution was further decreased to every 30 mm and 50 mm. Measurements were repeated three
times and were found to be reproducible.
Figure 4.2 presents the centreline PIP variation of the jet. The PIP is normalized by the jet
supply pressure, po, and the distance along the jet centreline, x, is normalized by the nozzle exit
diameter, de. x = 0 at the nozzle exit plane. The standard error is included in the plots. The nozzle
exit PIP calculated theoretically using the normal shock relation (equation 2.8), with Mae = 2.5
and po = 2.14 MPa gauge (310 psig), is also shown on this plot (by the single circle at x/de = 0);
as described in chapter 3 section 3.3.2, the measured value agrees very well with the calculated
one (difference of 1% relative to the calculated value).
The potential core of the jet, in which the flow is supersonic, is around 18 nozzle
diameters long. The PIP just outside the nozzle exit first decreases, indicating that the jet is
underexpanded. This is because an underexpanded jet completes its expansion outside the nozzle
by means of isentropic expansion waves, across which PIP decreases. As the jet was
73
0
0.1
0.2
0.3
0.4
0.5
0.6
0.7
0 10 20 30 40
x/de
PIP/po
50
potential core(supersonic)
theoretical nozzle exit PIP assuming isentropic flow
•
oscillations due to expansion-compression waves
0
0.1
0.2
0.3
0.4
0.5
0.6
0.7
0 10 20 30 40
x/de
PIP/po
50
potential core(supersonic)
theoretical nozzle exit PIP assuming isentropic flow
•
oscillations due to expansion-compression waves
Figure 4.2. Centreline PIP variation in the supersonic jet.
underexpanded, the PIP can be seen to oscillate in this region because of the conical expansion
and compression waves forming the shock cells. Approximately eight shock cells were captured
by the pitot probe measurements; this is consistent with the number of shock cells captured in the
schlieren image of Figure 4.1. The PIP oscillations decay towards the end of the core as the shock
cells diffuse. Thereafter, the PIP decreases monotonically because of turbulent mixing. The jet
structure and its centreline PIP profile were found to be very similar to that reported by Kweon et
al. [47], who used a jet under operating conditions similar to the conditions in the present
experiments.
74
4.3 Radial Peak Impact Pressure and Jet Spread
The term peak impact pressure (PIP) generally refers to the pressure measured at the centreline of
a fully-expanded jet using a pitot tube, and is termed ‘peak’ because this pressure is the maximum
pressure across the jet cross-section at that axial location. However, in this thesis, PIP will also be
used to refer to jet pressure measured off the centreline using a pitot probe, to avoid using
additional terms. Radial PIP profiles were obtained at five axial locations downstream of the
nozzle exit, at x/de = 1.4, 5.4, 10.8, 16.2, and 21.6. At each axial location, the PIP was measured
every 1 mm across the jet (the minimum spacing possible with the apparatus), until the PIP
decreased to zero across the jet boundary or shear layer. Each profile was measured at least three
times and found to be reproducible. Figure 4.3 presents the radial PIP profiles of the jet at the five
axial locations. Similar to Figure 4.2, the PIP is normalized by po and r is normalized by de. The
standard error is also included in the plots.
At x/de = 1.4 (Figure 4.3a), the PIP profile is only as wide as the nozzle. The maximum
PIP does not occur at the jet centreline, but towards the outer part of the jet, in a ring around the
jet centreline. As described in chapter 2 sections 2.2.3 and 2.4.1, the air around the jet centreline
at this axial location passes through an expansion fan originating at the nozzle lip, whereas the air
in the outer region of the jet passes through an incident oblique shock, and is compressed. As a
result, the PIP increases radially outward from the jet centreline. It then rapidly drops to zero
across the jet shear layer because the shear layer is very thin at this axial location.
The profile at x/de = 5.4 (Figure 4.3b) is similar to that at x/de = 1.4, because these axial
locations are very similar positions within the first and second shock cells; so the flow at x/de =
5.4 is similar to that at x/de = 1.4. However, the shear layer at x/de = 5.4 has grown, as indicated
by the relatively slower rate of decrease of PIP across the shear layer; consequently, the jet has
spread radially.
At x/de = 10.8 (Figure 4.3c), the PIP profile is flat near the centerline, and then decreases
monotonically. This indicates that the shock cells are weaker at this axial location compared to
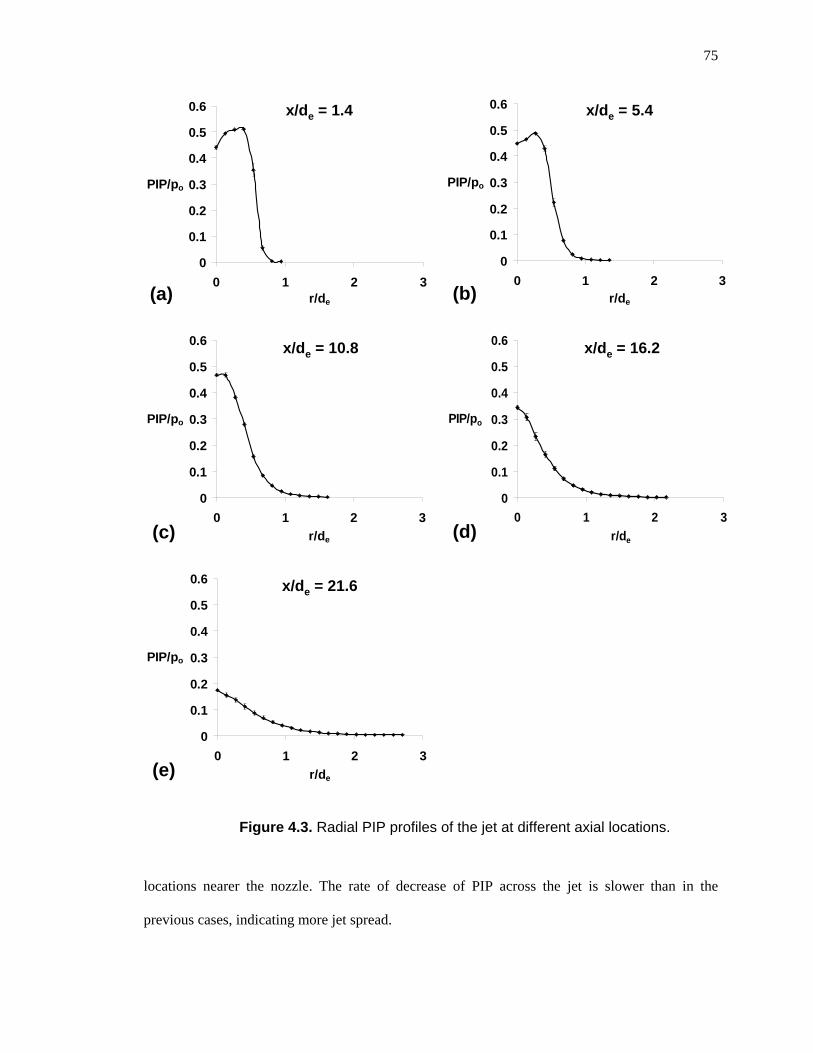
75
0
0.1
0.2
0.3
0.4
0.5
0.6
0 1 2 3r/de
PIP/po
Figure 4.3. Radial PIP profiles of the jet at different axial locations.
locations nearer the nozzle. The rate of decrease of PIP across the jet is slower than in the
previous cases, indicating more jet spread.
0
0.1
0.2
0.3
0.4
0.5
0.6
0 1 2 3r/de
PIP/po
0
0.1
0.2
0.3
0.4
0.5
0.6
0 1 2 3
r/de
PIP/po
0
0.1
0.2
0.3
0.4
0.5
0.6
0 1 2 3
r/de
PIP/po
0
0.1
0.2
0.3
0.4
0.5
0.6
0 1 2 3
r/de
PIP/po
(a)
(c)
(b)
(d)
(e)
x/de = 1.4 x/de = 5.4
x/de = 16.2x/de = 10.8
x/de = 21.6
0
0.1
0.2
0.3
0.4
0.5
0.6
0 1 2 3r/de
PIP/po
0
0.1
0.2
0.3
0.4
0.5
0.6
0 1 2 3r/de
PIP/po
0
0.1
0.2
0.3
0.4
0.5
0.6
0 1 2 3
r/de
PIP/po
0
0.1
0.2
0.3
0.4
0.5
0.6
0 1 2 3
r/de
PIP/po
0
0.1
0.2
0.3
0.4
0.5
0.6
0 1 2 3
r/de
PIP/po
(a)
(c)
(b)
(d)
(e)
x/de = 1.4 x/de = 5.4
x/de = 16.2x/de = 10.8
x/de = 21.6
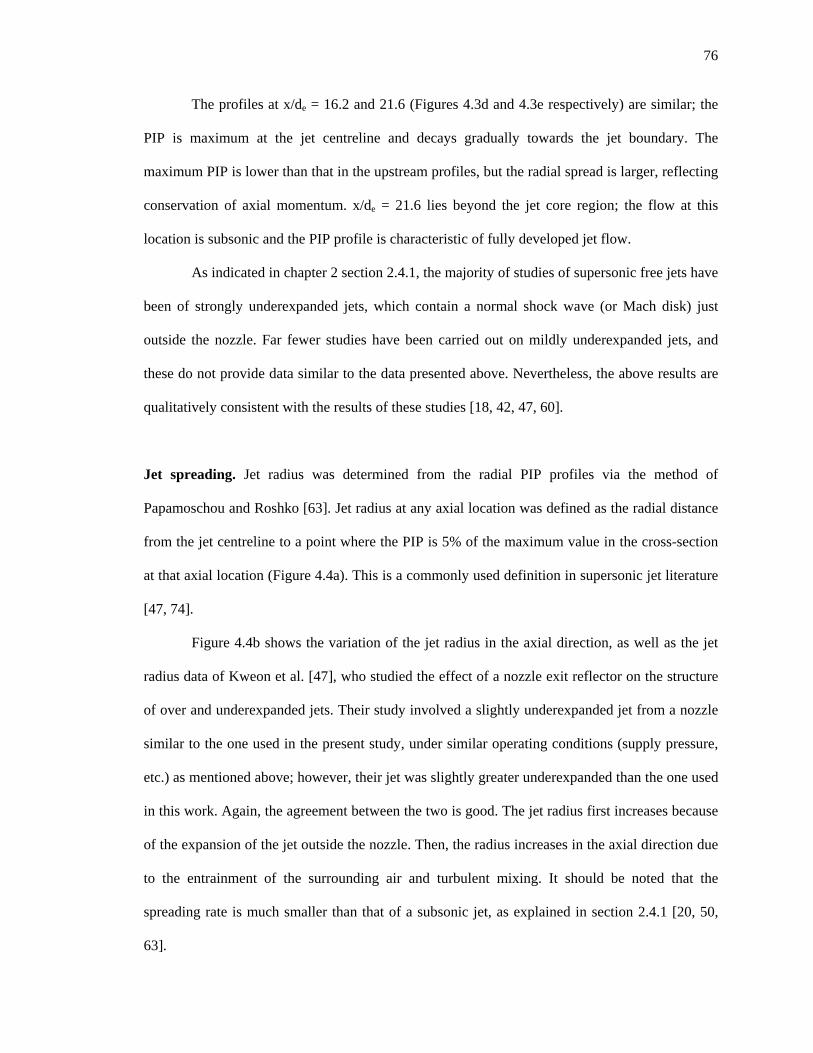
76
The profiles at x/de = 16.2 and 21.6 (Figures 4.3d and 4.3e respectively) are similar; the
PIP is maximum at the jet centreline and decays gradually towards the jet boundary. The
maximum PIP is lower than that in the upstream profiles, but the radial spread is larger, reflecting
conservation of axial momentum. x/de = 21.6 lies beyond the jet core region; the flow at this
location is subsonic and the PIP profile is characteristic of fully developed jet flow.
As indicated in chapter 2 section 2.4.1, the majority of studies of supersonic free jets have
been of strongly underexpanded jets, which contain a normal shock wave (or Mach disk) just
outside the nozzle. Far fewer studies have been carried out on mildly underexpanded jets, and
these do not provide data similar to the data presented above. Nevertheless, the above results are
qualitatively consistent with the results of these studies [18, 42, 47, 60].
Jet spreading. Jet radius was determined from the radial PIP profiles via the method of
Papamoschou and Roshko [63]. Jet radius at any axial location was defined as the radial distance
from the jet centreline to a point where the PIP is 5% of the maximum value in the cross-section
at that axial location (Figure 4.4a). This is a commonly used definition in supersonic jet literature
[47, 74].
Figure 4.4b shows the variation of the jet radius in the axial direction, as well as the jet
radius data of Kweon et al. [47], who studied the effect of a nozzle exit reflector on the structure
of over and underexpanded jets. Their study involved a slightly underexpanded jet from a nozzle
similar to the one used in the present study, under similar operating conditions (supply pressure,
etc.) as mentioned above; however, their jet was slightly greater underexpanded than the one used
in this work. Again, the agreement between the two is good. The jet radius first increases because
of the expansion of the jet outside the nozzle. Then, the radius increases in the axial direction due
to the entrainment of the surrounding air and turbulent mixing. It should be noted that the
spreading rate is much smaller than that of a subsonic jet, as explained in section 2.4.1 [20, 50,
63].
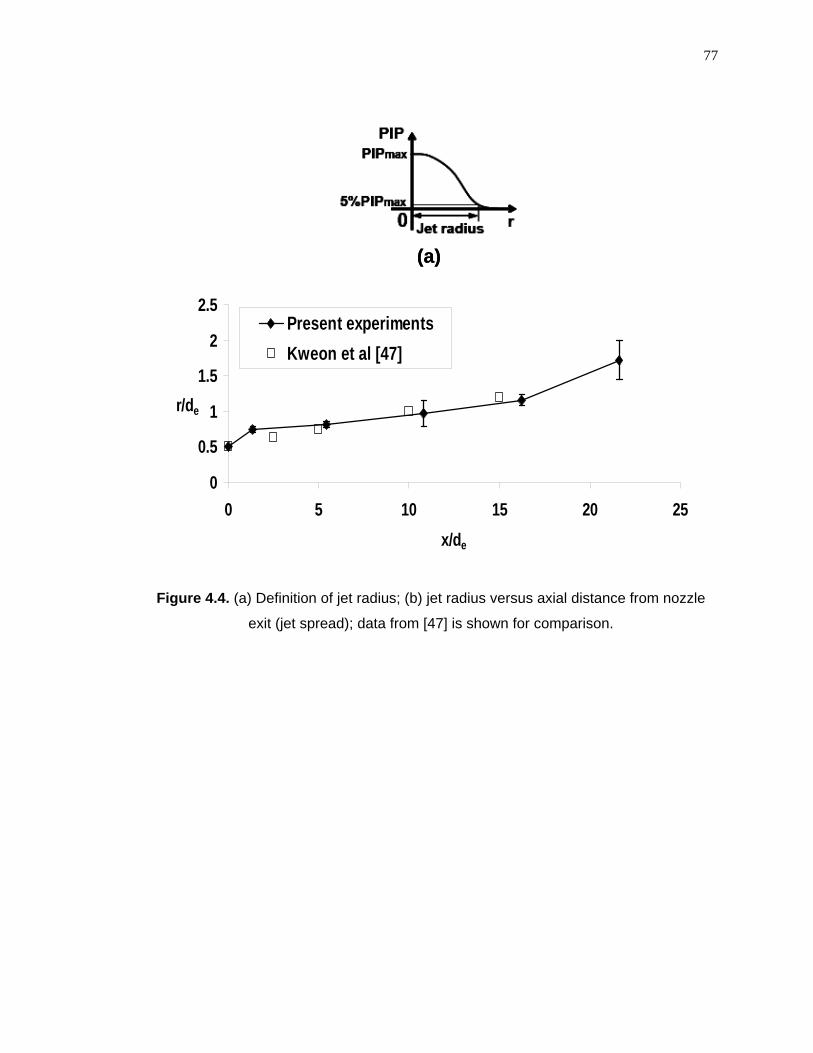
77
Figure 4.4. (a) Definition of jet radius; (b) jet radius versus axial distance from nozzle
exit (jet spread); data from [47] is shown for comparison.
0
0.5
1
1.5
2
2.5
0 5 10 15 20 25
x/de
r/de
Present experiments
Kweon et al [47]
(a)
0
0.5
1
1.5
2
2.5
0 5 10 15 20 25
x/de
r/de
Present experiments
Kweon et al [47]
(a)
CHAPTER 5
INTERACTION BETWEEN A JET AND A
SINGLE TUBE
As described in the Introduction (chapter 1), tubes in a recovery boiler are arranged in rows.
During sootblowing, the jet almost always interacts with the first tube of a given row. Depending
on the spacing between rows, this interaction can occur for a significant portion of the
sootblowing time. As a result, as a first step in studying the flow and interaction of a sootblower
jet with tube bundles, we consider the interaction between a supersonic jet and a single tube.
5.1 Experimental Parameters
As mentioned in chapter 2 section 2.5.3, the main parameters governing the interaction between a
supersonic jet and a tube are the jet structure (over/underexpanded), as characterised by the
nozzle exit pressure ratio, PR, the distance between the nozzle and tube, x, the size of the jet (dj)
relative to the size of the tube (D), and the offset between the jet and tube centrelines, . In this
work, the same jet described in chapter four was used in all the experiments. Consequently,
experiments were performed to investigate the effects of offset, nozzle-tube distance, and tube
size on jet/tube interaction.
78
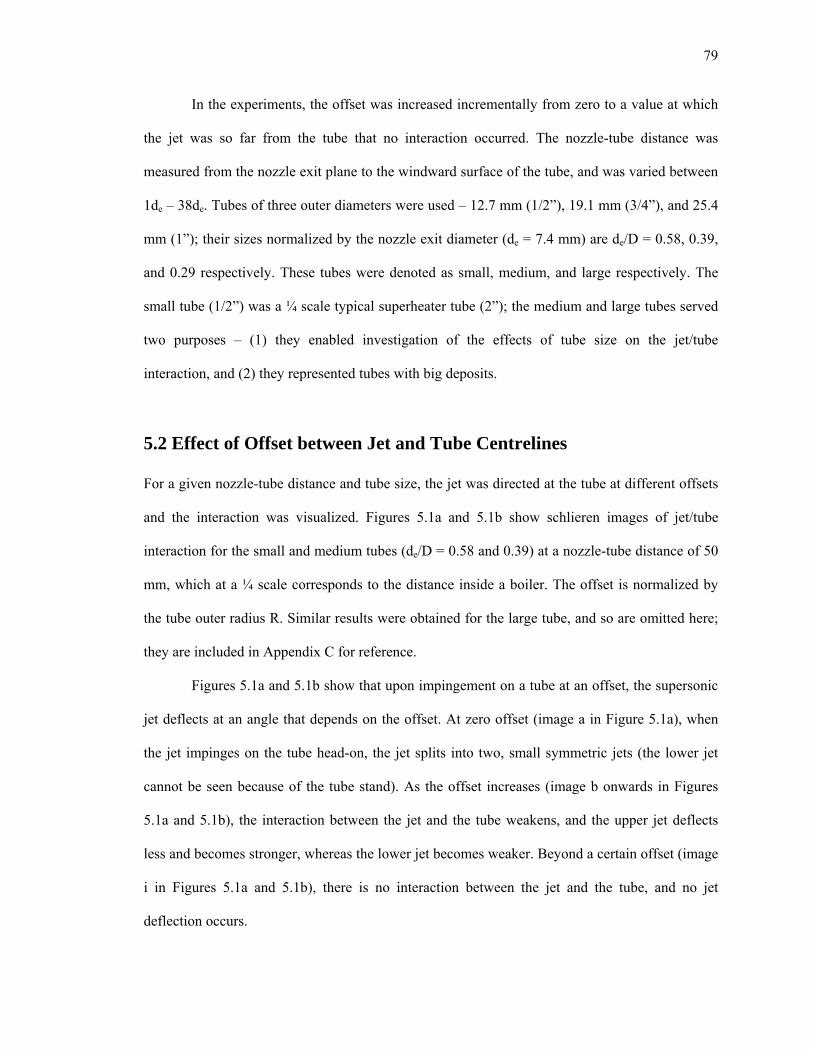
79
In the experiments, the offset was increased incrementally from zero to a value at which
the jet was so far from the tube that no interaction occurred. The nozzle-tube distance was
measured from the nozzle exit plane to the windward surface of the tube, and was varied between
1de – 38de. Tubes of three outer diameters were used – 12.7 mm (1/2”), 19.1 mm (3/4”), and 25.4
mm (1”); their sizes normalized by the nozzle exit diameter (de = 7.4 mm) are de/D = 0.58, 0.39,
and 0.29 respectively. These tubes were denoted as small, medium, and large respectively. The
small tube (1/2”) was a ¼ scale typical superheater tube (2”); the medium and large tubes served
two purposes – (1) they enabled investigation of the effects of tube size on the jet/tube
interaction, and (2) they represented tubes with big deposits.
5.2 Effect of Offset between Jet and Tube Centrelines
For a given nozzle-tube distance and tube size, the jet was directed at the tube at different offsets
and the interaction was visualized. Figures 5.1a and 5.1b show schlieren images of jet/tube
interaction for the small and medium tubes (de/D = 0.58 and 0.39) at a nozzle-tube distance of 50
mm, which at a ¼ scale corresponds to the distance inside a boiler. The offset is normalized by
the tube outer radius R. Similar results were obtained for the large tube, and so are omitted here;
they are included in Appendix C for reference.
Figures 5.1a and 5.1b show that upon impingement on a tube at an offset, the supersonic
jet deflects at an angle that depends on the offset. At zero offset (image a in Figure 5.1a), when
the jet impinges on the tube head-on, the jet splits into two, small symmetric jets (the lower jet
cannot be seen because of the tube stand). As the offset increases (image b onwards in Figures
5.1a and 5.1b), the interaction between the jet and the tube weakens, and the upper jet deflects
less and becomes stronger, whereas the lower jet becomes weaker. Beyond a certain offset (image
i in Figures 5.1a and 5.1b), there is no interaction between the jet and the tube, and no jet
deflection occurs.
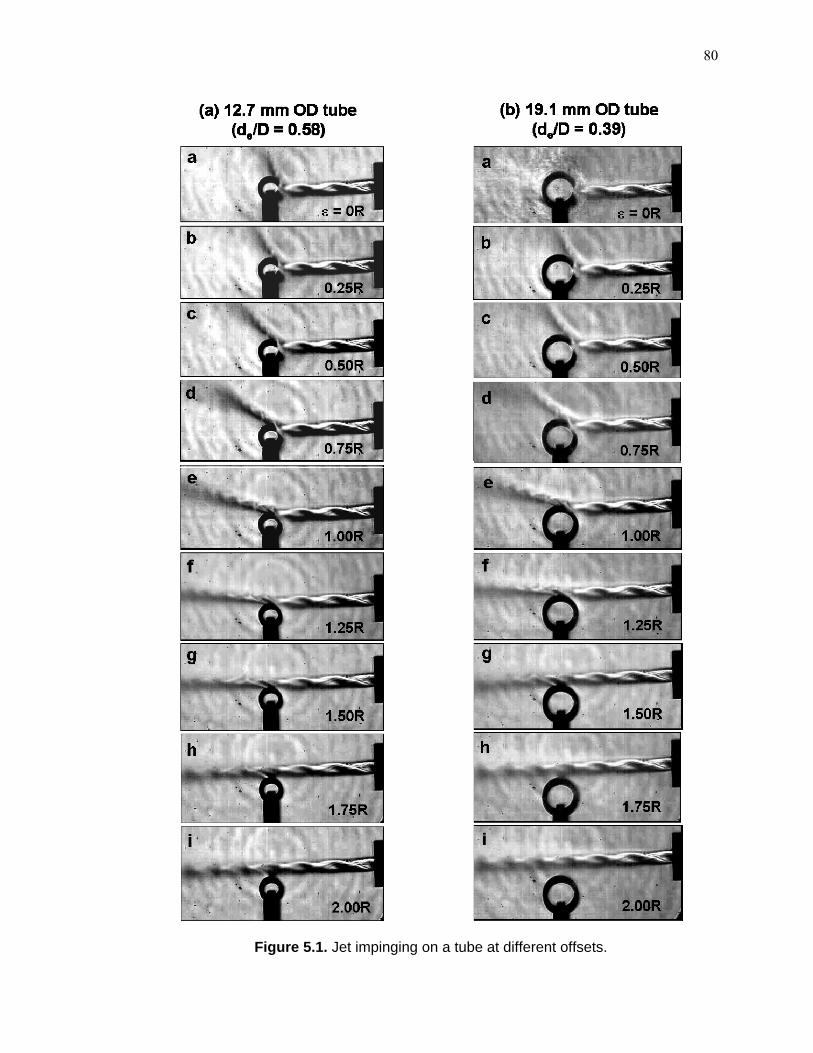
80
Figure 5.1. Jet impinging on a tube at different offsets.
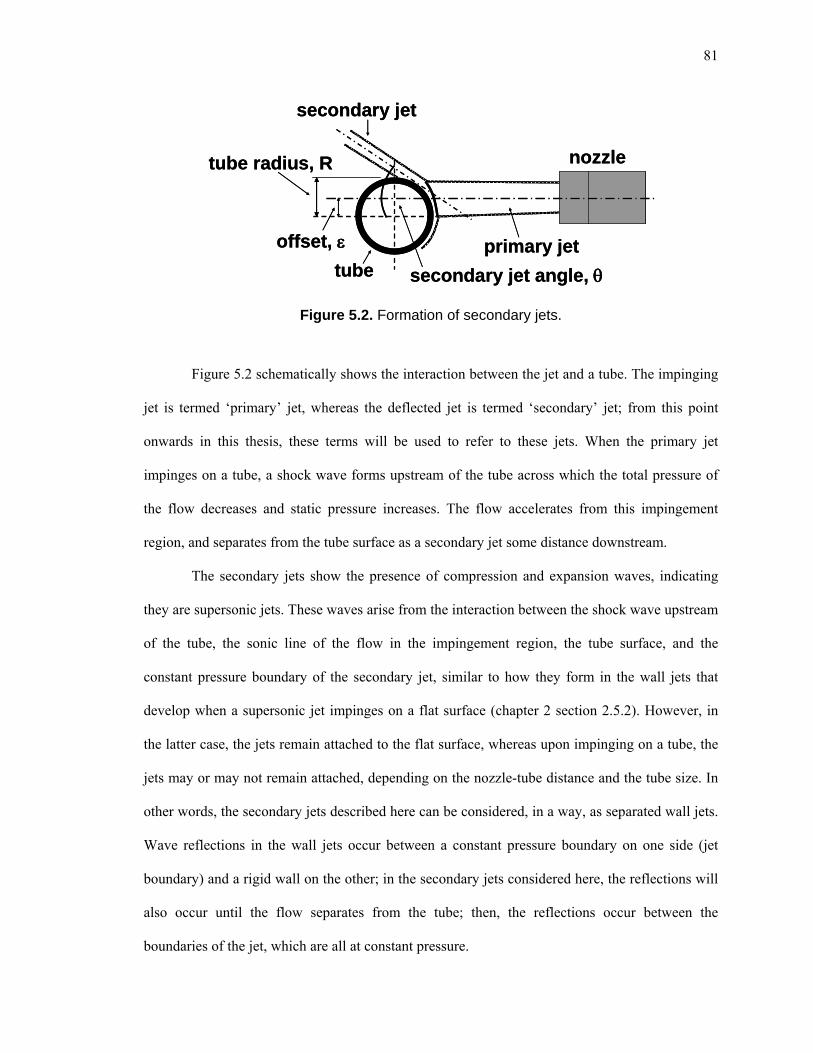
81
Figure 5.2. Formation of secondary jets.
Figure 5.2 schematically shows the interaction between the jet and a tube. The impinging
jet is termed ‘primary’ jet, whereas the deflected jet is termed ‘secondary’ jet; from this point
onwards in this thesis, these terms will be used to refer to these jets. When the primary jet
impinges on a tube, a shock wave forms upstream of the tube across which the total pressure of
the flow decreases and static pressure increases. The flow accelerates from this impingement
region, and separates from the tube surface as a secondary jet some distance downstream.
The secondary jets show the presence of compression and expansion waves, indicating
they are supersonic jets. These waves arise from the interaction between the shock wave upstream
of the tube, the sonic line of the flow in the impingement region, the tube surface, and the
constant pressure boundary of the secondary jet, similar to how they form in the wall jets that
develop when a supersonic jet impinges on a flat surface (chapter 2 section 2.5.2). However, in
the latter case, the jets remain attached to the flat surface, whereas upon impinging on a tube, the
jets may or may not remain attached, depending on the nozzle-tube distance and the tube size. In
other words, the secondary jets described here can be considered, in a way, as separated wall jets.
Wave reflections in the wall jets occur between a constant pressure boundary on one side (jet
boundary) and a rigid wall on the other; in the secondary jets considered here, the reflections will
also occur until the flow separates from the tube; then, the reflections occur between the
boundaries of the jet, which are all at constant pressure.
secondary jet angle,
nozzle
primary jet
secondary jet
tube
tube radius, R
offset,
secondary jet angle,
nozzle
primary jet
secondary jet
tube radius, R
offset,
tube
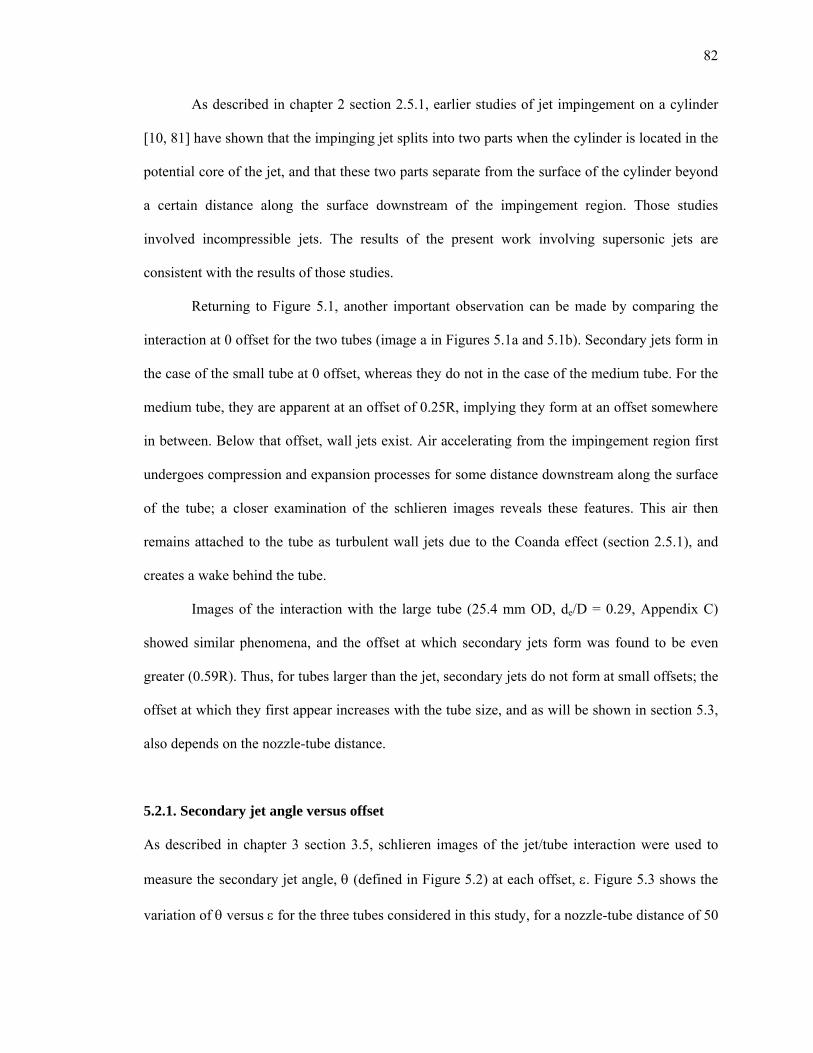
82
As described in chapter 2 section 2.5.1, earlier studies of jet impingement on a cylinder
[10, 81] have shown that the impinging jet splits into two parts when the cylinder is located in the
potential core of the jet, and that these two parts separate from the surface of the cylinder beyond
a certain distance along the surface downstream of the impingement region. Those studies
involved incompressible jets. The results of the present work involving supersonic jets are
consistent with the results of those studies.
Returning to Figure 5.1, another important observation can be made by comparing the
interaction at 0 offset for the two tubes (image a in Figures 5.1a and 5.1b). Secondary jets form in
the case of the small tube at 0 offset, whereas they do not in the case of the medium tube. For the
medium tube, they are apparent at an offset of 0.25R, implying they form at an offset somewhere
in between. Below that offset, wall jets exist. Air accelerating from the impingement region first
undergoes compression and expansion processes for some distance downstream along the surface
of the tube; a closer examination of the schlieren images reveals these features. This air then
remains attached to the tube as turbulent wall jets due to the Coanda effect (section 2.5.1), and
creates a wake behind the tube.
Images of the interaction with the large tube (25.4 mm OD, de/D = 0.29, Appendix C)
showed similar phenomena, and the offset at which secondary jets form was found to be even
greater (0.59R). Thus, for tubes larger than the jet, secondary jets do not form at small offsets; the
offset at which they first appear increases with the tube size, and as will be shown in section 5.3,
also depends on the nozzle-tube distance.
5.2.1. Secondary jet angle versus offset
As described in chapter 3 section 3.5, schlieren images of the jet/tube interaction were used to
measure the secondary jet angle, (defined in Figure 5.2) at each offset, . Figure 5.3 shows the
variation of versus for the three tubes considered in this study, for a nozzle-tube distance of 50
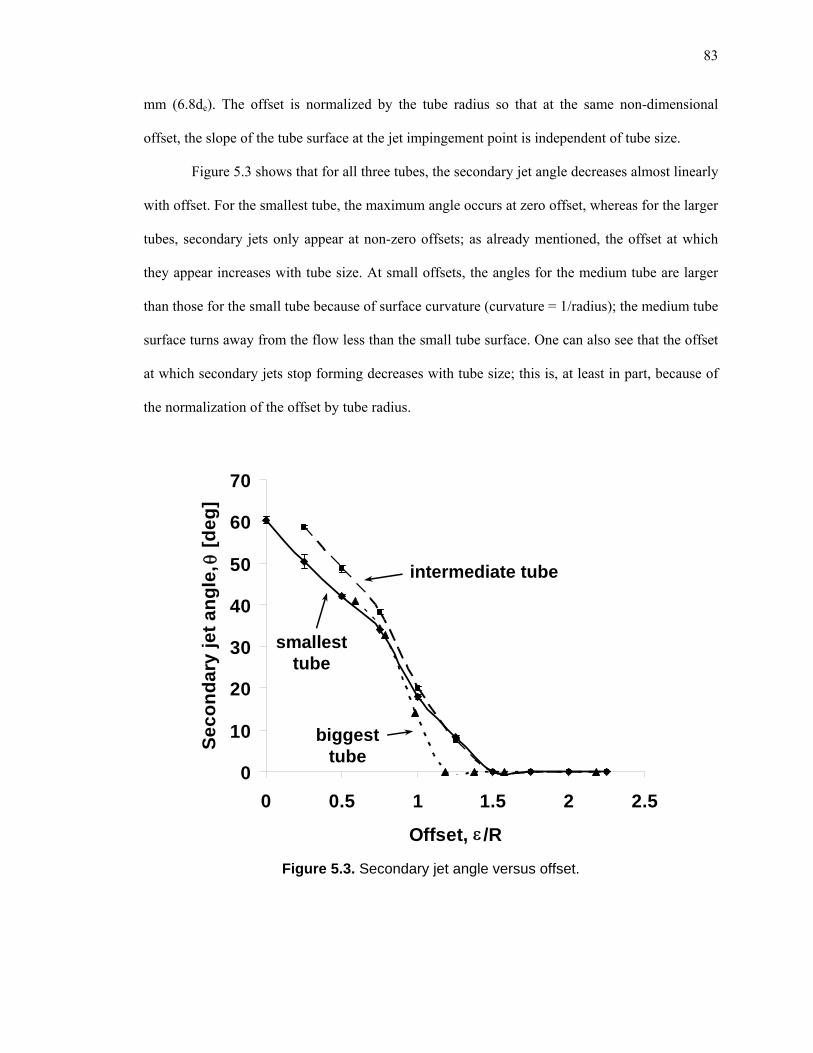
83
mm (6.8de). The offset is normalized by the tube radius so that at the same non-dimensional
offset, the slope of the tube surface at the jet impingement point is independent of tube size.
Figure 5.3 shows that for all three tubes, the secondary jet angle decreases almost linearly
with offset. For the smallest tube, the maximum angle occurs at zero offset, whereas for the larger
tubes, secondary jets only appear at non-zero offsets; as already mentioned, the offset at which
they appear increases with tube size. At small offsets, the angles for the medium tube are larger
than those for the small tube because of surface curvature (curvature = 1/radius); the medium tube
surface turns away from the flow less than the small tube surface. One can also see that the offset
at which secondary jets stop forming decreases with tube size; this is, at least in part, because of
the normalization of the offset by tube radius.
0
10
20
30
40
50
60
70
0 0.5 1 1.5 2 2.5
Offset, /R
Se
co
nd
ary
je
t a
ng
le,
[d
eg
]
smallest tube
biggest tube
intermediate tube
0
10
20
30
40
50
60
70
0 0.5 1 1.5 2 2.5
Offset, /R
Se
co
nd
ary
je
t a
ng
le,
[d
eg
]
smallest tube
biggest tube
intermediate tube
Figure 5.3. Secondary jet angle versus offset.
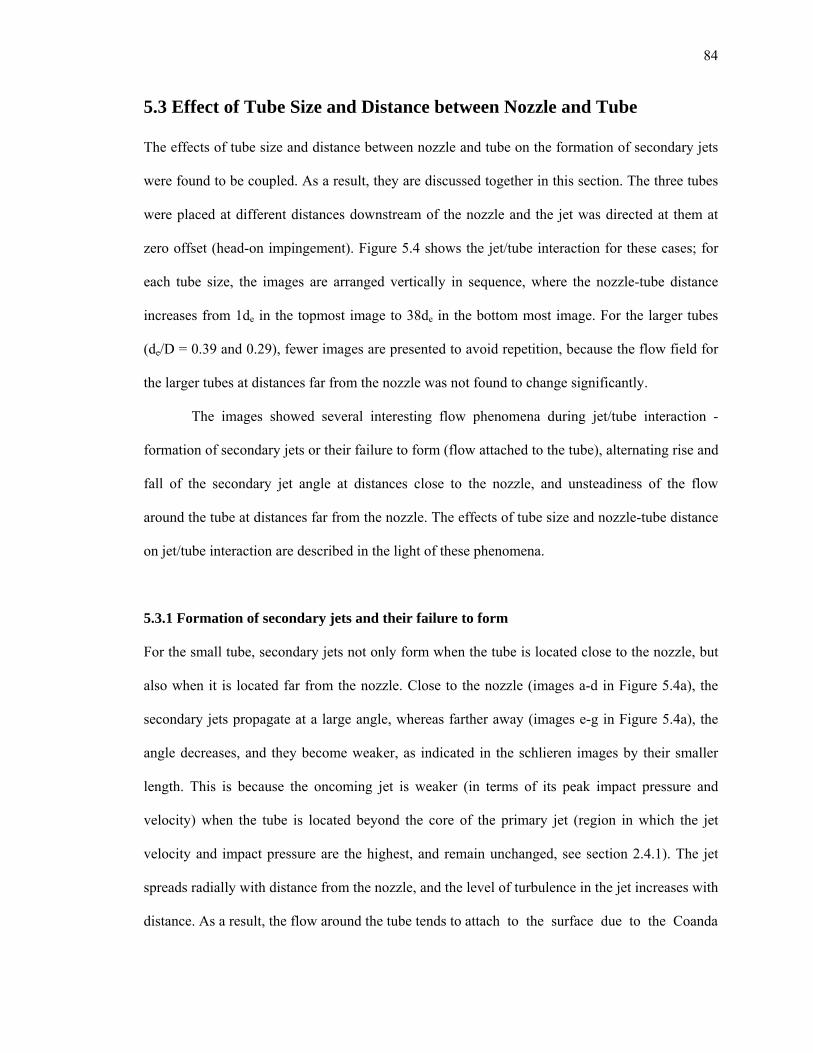
84
5.3 Effect of Tube Size and Distance between Nozzle and Tube
The effects of tube size and distance between nozzle and tube on the formation of secondary jets
were found to be coupled. As a result, they are discussed together in this section. The three tubes
were placed at different distances downstream of the nozzle and the jet was directed at them at
zero offset (head-on impingement). Figure 5.4 shows the jet/tube interaction for these cases; for
each tube size, the images are arranged vertically in sequence, where the nozzle-tube distance
increases from 1de in the topmost image to 38de in the bottom most image. For the larger tubes
(de/D = 0.39 and 0.29), fewer images are presented to avoid repetition, because the flow field for
the larger tubes at distances far from the nozzle was not found to change significantly.
The images showed several interesting flow phenomena during jet/tube interaction -
formation of secondary jets or their failure to form (flow attached to the tube), alternating rise and
fall of the secondary jet angle at distances close to the nozzle, and unsteadiness of the flow
around the tube at distances far from the nozzle. The effects of tube size and nozzle-tube distance
on jet/tube interaction are described in the light of these phenomena.
5.3.1 Formation of secondary jets and their failure to form
For the small tube, secondary jets not only form when the tube is located close to the nozzle, but
also when it is located far from the nozzle. Close to the nozzle (images a-d in Figure 5.4a), the
secondary jets propagate at a large angle, whereas farther away (images e-g in Figure 5.4a), the
angle decreases, and they become weaker, as indicated in the schlieren images by their smaller
length. This is because the oncoming jet is weaker (in terms of its peak impact pressure and
velocity) when the tube is located beyond the core of the primary jet (region in which the jet
velocity and impact pressure are the highest, and remain unchanged, see section 2.4.1). The jet
spreads radially with distance from the nozzle, and the level of turbulence in the jet increases with
distance. As a result, the flow around the tube tends to attach to the surface due to the Coanda
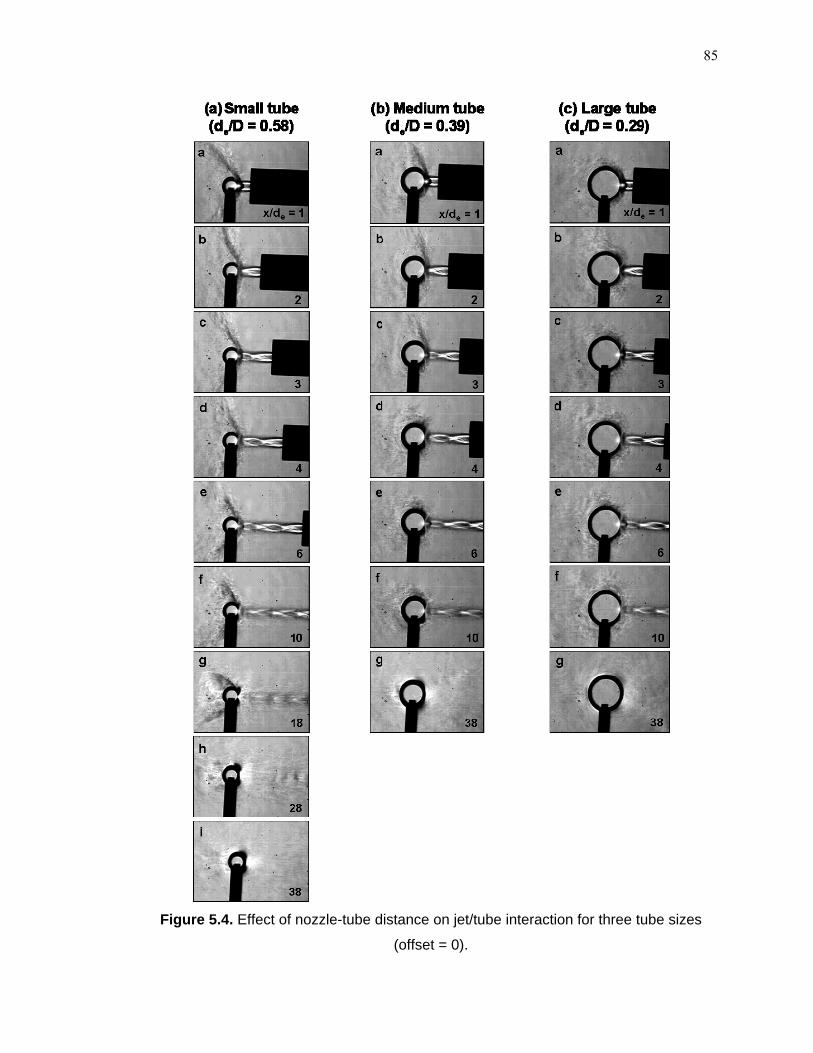
85
Figure 5.4. Effect of nozzle-tube distance on jet/tube interaction for three tube sizes
(offset = 0).
86
effect [10, 81], but inertia prevents it from attaching, resulting in an unsteady flow field around
the tube. When the tube was placed very far from the nozzle (images h and i in Figure 5.4a), the
flow attached to the tube, creating a wake behind it.
With the medium tube, the effect of distance on the formation of secondary jets becomes
visible. A secondary jet forms at zero offset only when the tube is located at distances x ≤ 3de.
Beyond 3de, the flow from the impingement region first undergoes compression and expansion on
the tube, and then remains attached to the tube as turbulent wall jets, instead of separating and
forming secondary jets (as described in section 5.2). A similar flow field exists around the tube
when the tube is located at distances farther from the nozzle.
Closer examination of the jet/tube interaction at x = 3de showed that the secondary jet
formed after a much longer time after impingement, compared to that at x = 1de and 2de, as well
as at all distances for the smallest tube. In all these cases, it was found that the secondary jet
forms as the primary jet develops, that is, the secondary jet forms before the flow field reaches
quasi steady-state. At x = 3de, the flow field reaches a ‘first’ quasi steady-state in which the flow
around the tube remains attached to the tube for a considerable length of time. The flow then
separates from the tube forming a secondary jet, which maintains itself continuously thereafter,
and thus forms a ‘second’ quasi steady-state of the flow field. And, secondary jets do not form
beyond x = 3de at zero offset for this tube. This suggests that this nozzle-tube distance (between
2de and 4de) for this tube size (de/D = 0.39) is a transition region in terms of separation of flow
from the tube. Time-resolved schlieren images of this phenomenon are presented in Appendix C,
where the time required for flow to separate from a tube and form a secondary jet is compared for
the medium tube placed 2de and 3de away from the nozzle. It should be noted that secondary jets
do form for the medium tube at greater offsets, as already shown in Figures 5.1b and 5.3. As
reported in section 5.2, Figures 5.4a and 5.4b show that the secondary jet angle at zero offset is
greater for the medium tube than for the small tube because of the slightly lower surface
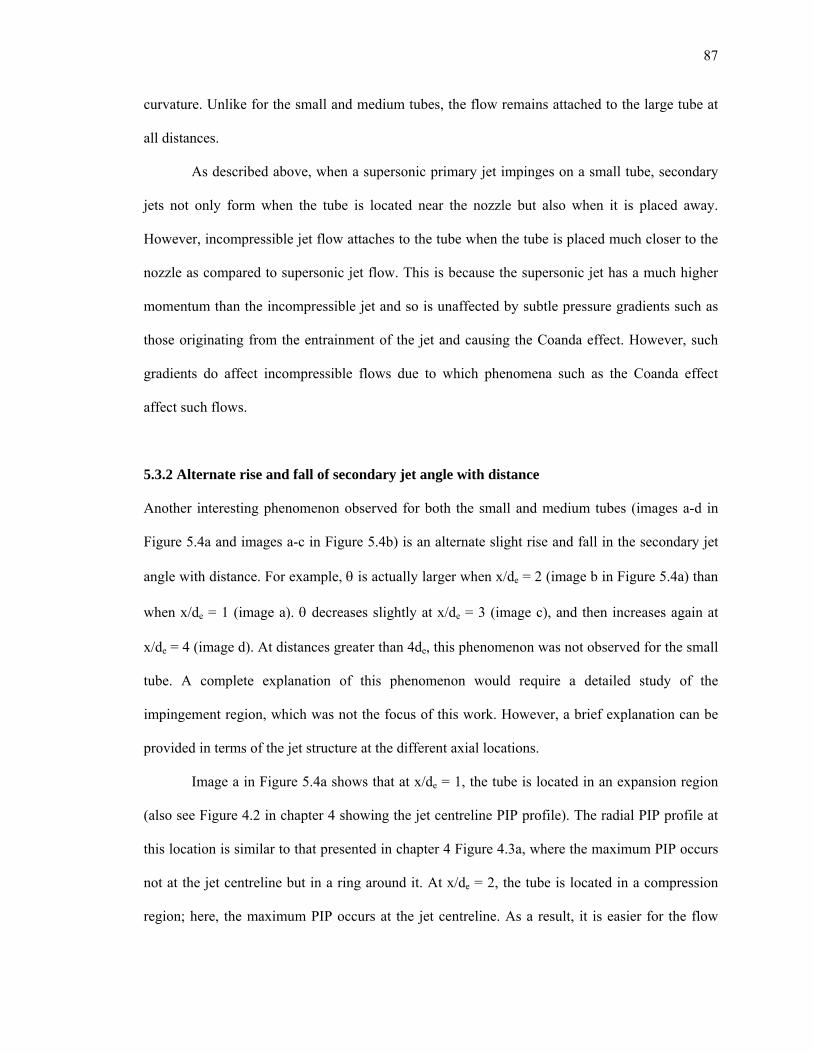
87
curvature. Unlike for the small and medium tubes, the flow remains attached to the large tube at
all distances.
As described above, when a supersonic primary jet impinges on a small tube, secondary
jets not only form when the tube is located near the nozzle but also when it is placed away.
However, incompressible jet flow attaches to the tube when the tube is placed much closer to the
nozzle as compared to supersonic jet flow. This is because the supersonic jet has a much higher
momentum than the incompressible jet and so is unaffected by subtle pressure gradients such as
those originating from the entrainment of the jet and causing the Coanda effect. However, such
gradients do affect incompressible flows due to which phenomena such as the Coanda effect
affect such flows.
5.3.2 Alternate rise and fall of secondary jet angle with distance
Another interesting phenomenon observed for both the small and medium tubes (images a-d in
Figure 5.4a and images a-c in Figure 5.4b) is an alternate slight rise and fall in the secondary jet
angle with distance. For example, is actually larger when x/de = 2 (image b in Figure 5.4a) than
when x/de = 1 (image a). decreases slightly at x/de = 3 (image c), and then increases again at
x/de = 4 (image d). At distances greater than 4de, this phenomenon was not observed for the small
tube. A complete explanation of this phenomenon would require a detailed study of the
impingement region, which was not the focus of this work. However, a brief explanation can be
provided in terms of the jet structure at the different axial locations.
Image a in Figure 5.4a shows that at x/de = 1, the tube is located in an expansion region
(also see Figure 4.2 in chapter 4 showing the jet centreline PIP profile). The radial PIP profile at
this location is similar to that presented in chapter 4 Figure 4.3a, where the maximum PIP occurs
not at the jet centreline but in a ring around it. At x/de = 2, the tube is located in a compression
region; here, the maximum PIP occurs at the jet centreline. As a result, it is easier for the flow
88
from the impingement region to separate from the tube earlier than that at x/de = 1, thus
increasing the secondary jet angle. The same phenomenon repeats at x/de = 3 and 4. Beyond 4de,
this alternate rise and fall could not be detected in the schlieren images. Farther away, the
secondary jet angle decreases monotonically.
5.3.3 Unsteadiness of flow around tube
When the small tube was located away from the nozzle, particularly towards the end of the jet
core, the flow around the tube was unsteady. This was identified by the continuous shifting of the
secondary jet separation point slightly upstream and downstream of a mean position on the tube
surface. One reason for this is the counteracting effects of secondary jet inertia creating
conditions favouring separation, and the Coanda effect creating conditions favouring attachment,
and was described earlier.
Another cause of this unsteadiness is the instability of the supersonic jet itself. As
described in chapter 2 section 2.4.2, over- and underexpanded jets undergo toroidal and/or
helical/flapping oscillations due to the interaction between large scale coherent structures (eddies)
and shock cells in the jet. Previous studies [83, 93, 96] have shown that flapping is the preferred
mode of oscillation at high jet Mach numbers (typically greater than 2), characteristic of the jet
used in the present work. A high-speed movie of the jet taken at 20,000 frames/s revealed jet
flapping. This flapping further from the nozzle caused the flow field around the tube to be
unsteady. This phenomenon was observed for all tube sizes, though it was not as remarkable as in
the case of the small tube, because the flow was attached to the larger tubes.
As is evident from the results presented above, varying the offset strongly influenced the
interaction between the jet and a single tube. The flow of secondary jets changed significantly
with offset. Practical implications of the formation of secondary jets will be discussed in the next
chapter, where it will be shown that secondary jets assume practical importance only when the
tube-spacing is small; they do not have a significant impact when the tube spacing is large.
89
A note about the implications of the present results in light of actual flow scenarios and
conditions inside a recovery boiler deserves mention. Inside an operating recovery boiler, jet/tube
interaction takes place between a particle-laden jet and fouled tubes with irregular cross-sections
formed by deposits, whereas in the present work, the interaction takes place between a jet without
particles and clean round tubes. The present results (particularly Figure 5.4) imply that even if a
tube is covered with a layer of deposit making the jet impingement surface very rough, secondary
jets will still form if the tube is of the same size as the jet or smaller; the roughness will most
likely increase the turbulence level in the secondary jets. The breakup of a thin asymmetric
deposit impinged by a supersonic jet is presented and discussed in chapter 7; the results there
provide evidence of this behaviour. On the other hand, if the tube is covered with a deposit bigger
than the jet, secondary jets will not form and the flow will remain attached to the deposit. The
rougher the deposit surface is, the flow will remain attached to the deposit for a greater length
along the deposit surface from its windward side.
In a recovery boiler, the offset between a sootblower jet and a row of tubes changes
continuously, because of sootblower translation. The distance between the first tube of a row of
tubes and a sootblower is fixed, because the sootblower is inserted through a small opening in the
boiler wall. Consequently, this distance cannot be varied in the boiler. Similarly, all tubes in a
given section of a boiler are of the same size. As a result, though the effects of all these
parameters were studied to obtain a general understanding of the interaction and have been
presented in this chapter, only the offset was varied in most of the experiments carried out in this
work using model tube arrangements and reported subsequently in this thesis. The distance
between the nozzle exit and the first tube of any tube arrangement was kept fixed at 50 mm (6.8
nozzle diameters), which at ¼ scale corresponds to the distance inside a boiler. The tube size for
each model tube arrangement was also scaled-down appropriately, and used for all the tubes in
that arrangement, but the size varied slightly between the different arrangements.
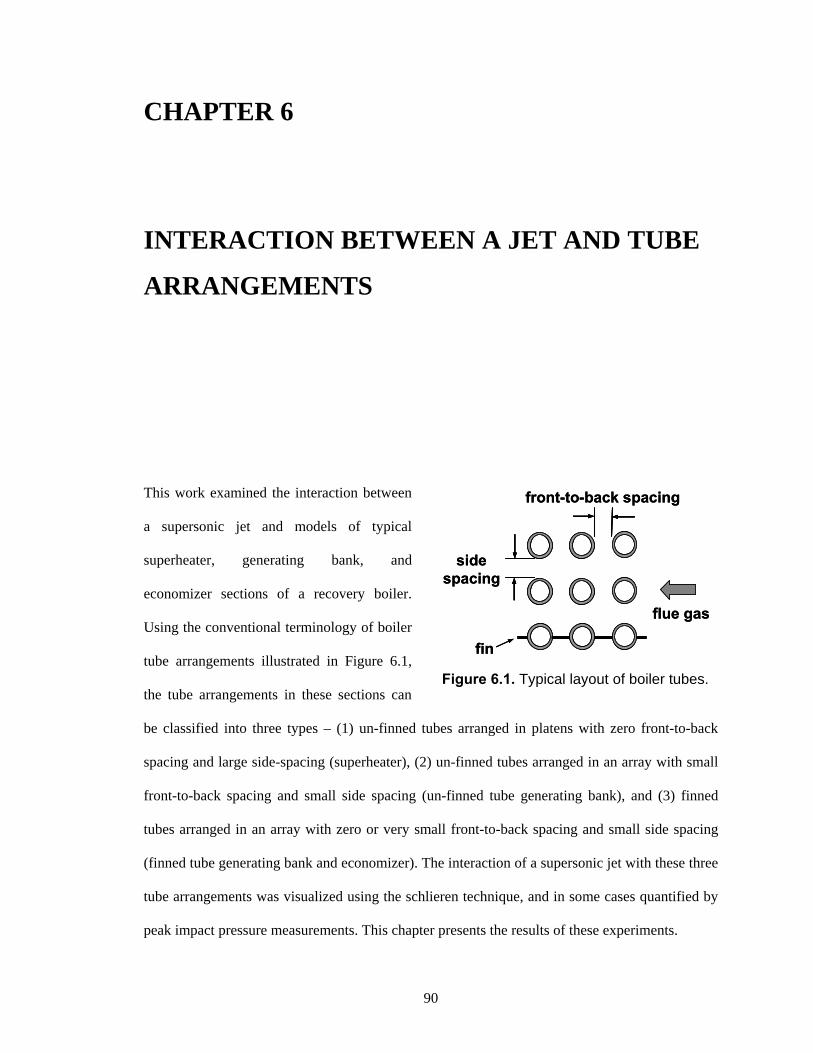
CHAPTER 6
INTERACTION BETWEEN A JET AND TUBE
ARRANGEMENTS
This work examined the interaction between
a supersonic jet and models of typical
superheater, generating bank, and
economizer sections of a recovery boiler.
Using the conventional terminology of boiler
tube arrangements illustrated in Figure 6.1,
the tube arrangements in these sections can
be classified into three types – (1) un-finned tubes arranged in platens with zero front-to-back
spacing and large side-spacing (superheater), (2) un-finned tubes arranged in an array with small
front-to-back spacing and small side spacing (un-finned tube generating bank), and (3) finned
tubes arranged in an array with zero or very small front-to-back spacing and small side spacing
(finned tube generating bank and economizer). The interaction of a supersonic jet with these three
tube arrangements was visualized using the schlieren technique, and in some cases quantified by
peak impact pressure measurements. This chapter presents the results of these experiments.
front-to-back spacing
side spacing
fin
flue gas
front-to-back spacing
side spacing
fin
flue gas
Figure 6.1. Typical layout of boiler tubes.
90
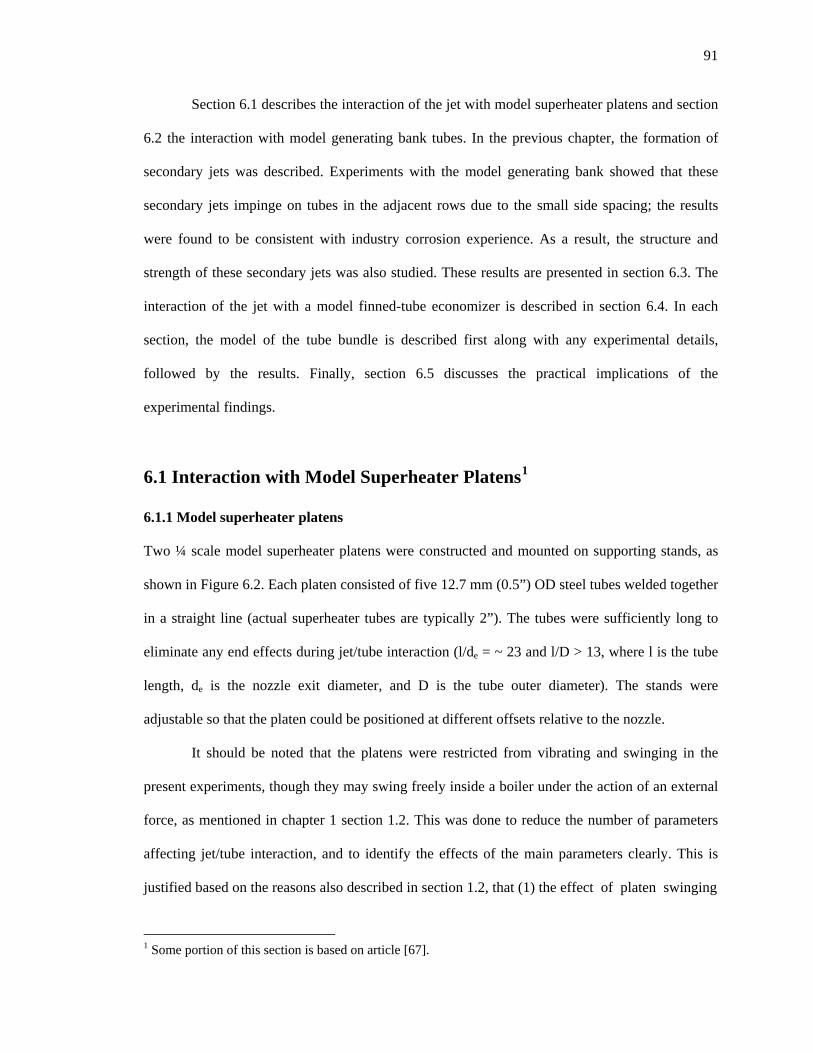
91
Section 6.1 describes the interaction of the jet with model superheater platens and section
6.2 the interaction with model generating bank tubes. In the previous chapter, the formation of
secondary jets was described. Experiments with the model generating bank showed that these
secondary jets impinge on tubes in the adjacent rows due to the small side spacing; the results
were found to be consistent with industry corrosion experience. As a result, the structure and
strength of these secondary jets was also studied. These results are presented in section 6.3. The
interaction of the jet with a model finned-tube economizer is described in section 6.4. In each
section, the model of the tube bundle is described first along with any experimental details,
followed by the results. Finally, section 6.5 discusses the practical implications of the
experimental findings.
6.1 Interaction with Model Superheater Platens1
6.1.1 Model superheater platens
Two ¼ scale model superheater platens were constructed and mounted on supporting stands, as
shown in Figure 6.2. Each platen consisted of five 12.7 mm (0.5”) OD steel tubes welded together
in a straight line (actual superheater tubes are typically 2”). The tubes were sufficiently long to
eliminate any end effects during jet/tube interaction (l/de = ~ 23 and l/D > 13, where l is the tube
length, de is the nozzle exit diameter, and D is the tube outer diameter). The stands were
adjustable so that the platen could be positioned at different offsets relative to the nozzle.
It should be noted that the platens were restricted from vibrating and swinging in the
present experiments, though they may swing freely inside a boiler under the action of an external
force, as mentioned in chapter 1 section 1.2. This was done to reduce the number of parameters
affecting jet/tube interaction, and to identify the effects of the main parameters clearly. This is
justified based on the reasons also described in section 1.2, that (1) the effect of platen swinging
1 Some portion of this section is based on article [67].
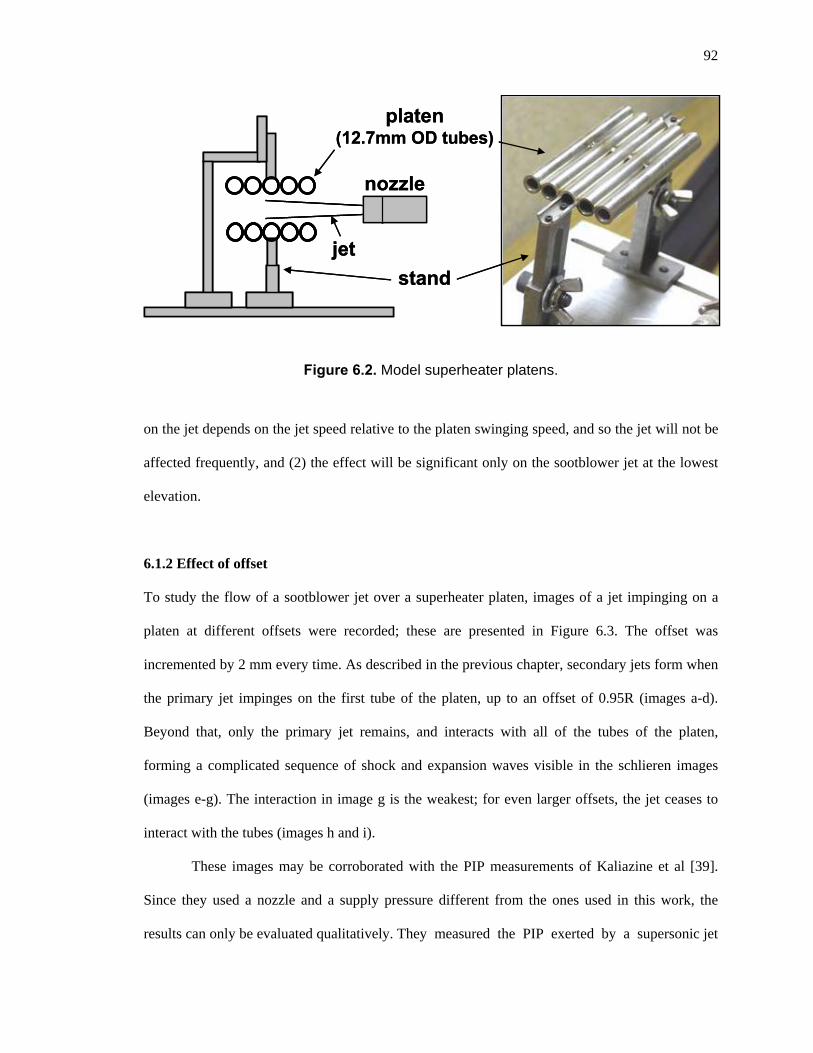
92
platen(12.7mm OD tubes)
stand
nozzle
Figure 6.2. Model superheater platens.
on the jet depends on the jet speed relative to the platen swinging speed, and so the jet will not be
affected frequently, and (2) the effect will be significant only on the sootblower jet at the lowest
elevation.
6.1.2 Effect of offset
To study the flow of a sootblower jet over a superheater platen, images of a jet impinging on a
platen at different offsets were recorded; these are presented in Figure 6.3. The offset was
incremented by 2 mm every time. As described in the previous chapter, secondary jets form when
the primary jet impinges on the first tube of the platen, up to an offset of 0.95R (images a-d).
Beyond that, only the primary jet remains, and interacts with all of the tubes of the platen,
forming a complicated sequence of shock and expansion waves visible in the schlieren images
(images e-g). The interaction in image g is the weakest; for even larger offsets, the jet ceases to
interact with the tubes (images h and i).
These images may be corroborated with the PIP measurements of Kaliazine et al [39].
Since they used a nozzle and a supply pressure different from the ones used in this work, the
results can only be evaluated qualitatively. They measured the PIP exerted by a supersonic jet
jet
platen(12.7mm OD tubes)
stand
nozzle
jet
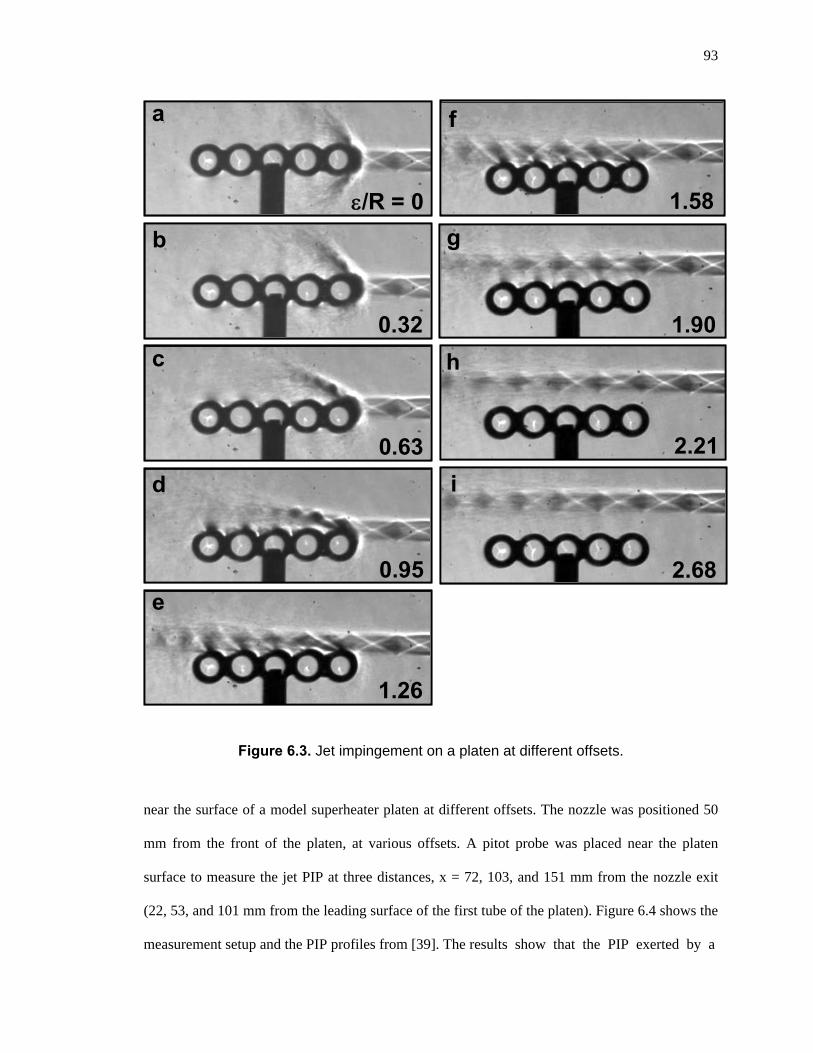
93
Figure 6.3. Jet impingement on a platen at different offsets.
near the surface of a model superheater platen at different offsets. The nozzle was positioned 50
mm from the front of the platen, at various offsets. A pitot probe was placed near the platen
surface to measure the jet PIP at three distances, x = 72, 103, and 151 mm from the nozzle exit
(22, 53, and 101 mm from the leading surface of the first tube of the platen). Figure 6.4 shows the
measurement setup and the PIP profiles from [39]. The results show that the PIP exerted by a
b
0.32
c
0.63
d
0.95
e
1.26
f
1.58
g
1.90
h
2.21
i
2.68
/R = 0
a
b
0.32
c
0.63
d
0.95
e
1.26
/R = 0
a f
1.58
g
1.90
h
2.21
i
2.68
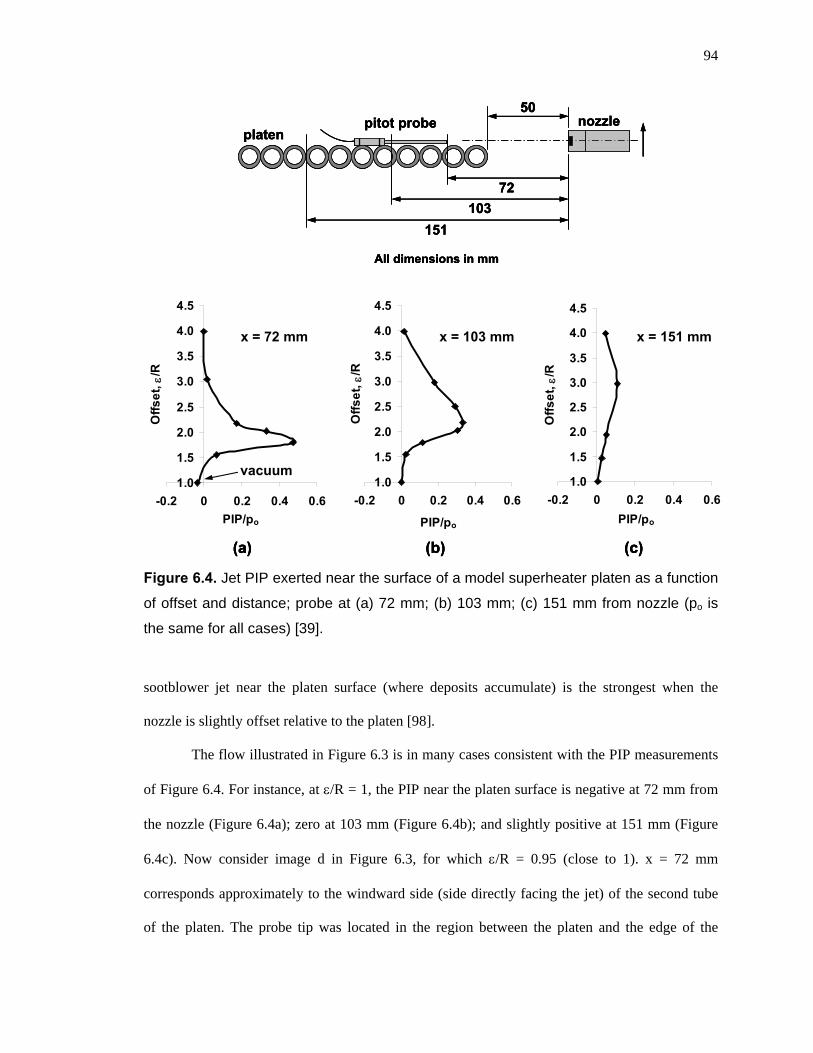
94
All dimensions in mm
50
72
103
151
pitot probe nozzleplaten
(a) (b) (c)
All dimensions in mm
50
72
103
151
pitot probe nozzleplaten
Figure 6.4. Jet PIP exerted near the surface of a model superheater platen as a function
of offset and distance; probe at (a) 72 mm; (b) 103 mm; (c) 151 mm from nozzle (po is
the same for all cases) [39].
sootblower jet near the platen surface (where deposits accumulate) is the strongest when the
nozzle is slightly offset relative to the platen [98].
The flow illustrated in Figure 6.3 is in many cases consistent with the PIP measurements
of Figure 6.4. For instance, at /R = 1, the PIP near the platen surface is negative at 72 mm from
the nozzle (Figure 6.4a); zero at 103 mm (Figure 6.4b); and slightly positive at 151 mm (Figure
6.4c). Now consider image d in Figure 6.3, for which /R = 0.95 (close to 1). x = 72 mm
corresponds approximately to the windward side (side directly facing the jet) of the second tube
of the platen. The probe tip was located in the region between the platen and the edge of the
1.0
1.5
2.0
2.5
3.0
3.5
4.0
4.5
-0.2 0 0.2 0.4 0.6
PIP/po
Off
se
t,
/R
1.0
1.5
2.0
2.5
3.0
3.5
4.0
4.5
-0.2 0 0.2 0.4 0.6
PIP/po
Off
se
t,
/R
1.0
1.5
2.0
2.5
3.0
3.5
4.0
4.5
-0.2 0 0.2 0.4 0.6
PIP/po
Off
se
t,
/R
x = 72 mm x = 103 mm x = 151 mm
vacuum
All dimensions in mm
50
72
103
151
pitot probe nozzleplaten
(a) (b) (c)
1.0
1.5
2.0
2.5
3.0
3.5
4.0
4.5
-0.2 0 0.2 0.4 0.6
PIP/po
Off
se
t,
/R
1.0
1.5
2.0
2.5
3.0
3.5
4.0
4.5
-0.2 0 0.2 0.4 0.6
PIP/po
Off
se
t,
/R
1.0
1.5
2.0
2.5
3.0
3.5
4.0
4.5
-0.2 0 0.2 0.4 0.6
PIP/po
Off
se
t,
/R
x = 72 mm x = 103 mm x = 151 mm
vacuum
(a) (b) (c)
1.0
1.5
2.0
2.5
3.0
3.5
4.0
4.5
-0.2 0 0.2 0.4 0.6
PIP/po
Off
se
t,
/R
1.0
1.5
2.0
2.5
3.0
3.5
4.0
4.5
-0.2 0 0.2 0.4 0.6
PIP/po
Off
se
t,
/R
1.0
1.5
2.0
2.5
3.0
3.5
4.0
4.5
-0.2 0 0.2 0.4 0.6
PIP/po
Off
se
t,
/R
x = 72 mm x = 103 mm x = 151 mm
vacuum
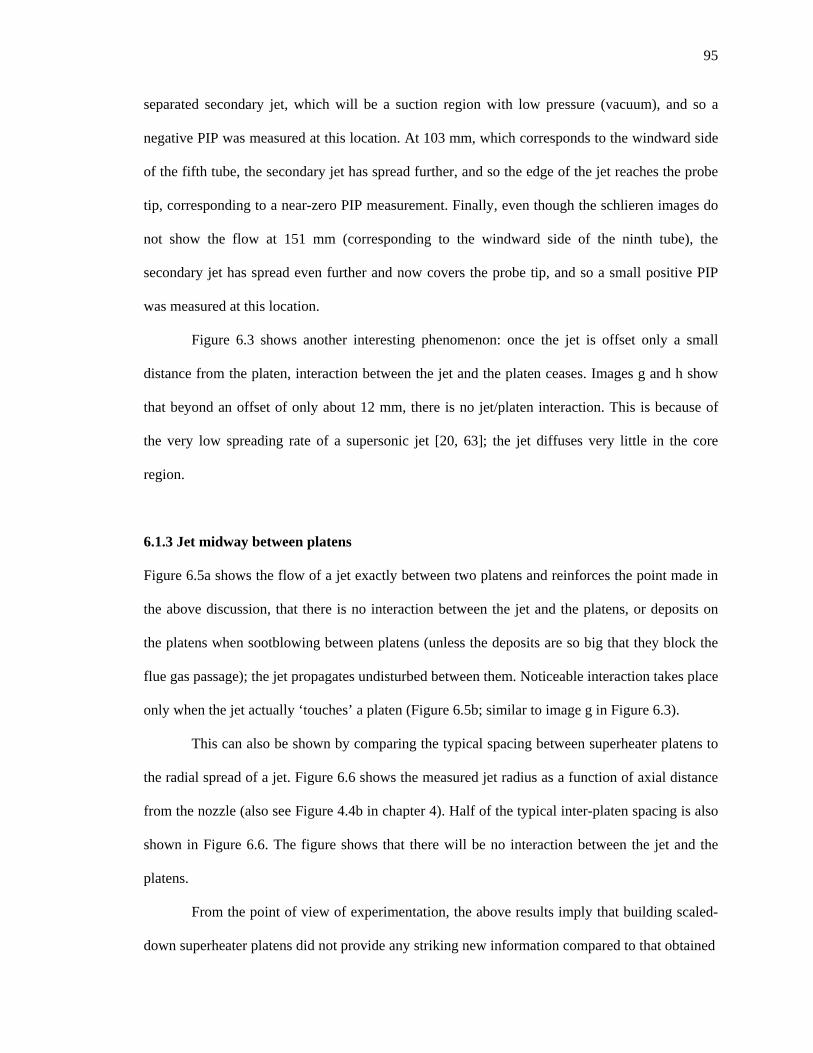
95
separated secondary jet, which will be a suction region with low pressure (vacuum), and so a
negative PIP was measured at this location. At 103 mm, which corresponds to the windward side
of the fifth tube, the secondary jet has spread further, and so the edge of the jet reaches the probe
tip, corresponding to a near-zero PIP measurement. Finally, even though the schlieren images do
not show the flow at 151 mm (corresponding to the windward side of the ninth tube), the
secondary jet has spread even further and now covers the probe tip, and so a small positive PIP
was measured at this location.
Figure 6.3 shows another interesting phenomenon: once the jet is offset only a small
distance from the platen, interaction between the jet and the platen ceases. Images g and h show
that beyond an offset of only about 12 mm, there is no jet/platen interaction. This is because of
the very low spreading rate of a supersonic jet [20, 63]; the jet diffuses very little in the core
region.
6.1.3 Jet midway between platens
Figure 6.5a shows the flow of a jet exactly between two platens and reinforces the point made in
the above discussion, that there is no interaction between the jet and the platens, or deposits on
the platens when sootblowing between platens (unless the deposits are so big that they block the
flue gas passage); the jet propagates undisturbed between them. Noticeable interaction takes place
only when the jet actually ‘touches’ a platen (Figure 6.5b; similar to image g in Figure 6.3).
This can also be shown by comparing the typical spacing between superheater platens to
the radial spread of a jet. Figure 6.6 shows the measured jet radius as a function of axial distance
from the nozzle (also see Figure 4.4b in chapter 4). Half of the typical inter-platen spacing is also
shown in Figure 6.6. The figure shows that there will be no interaction between the jet and the
platens.
From the point of view of experimentation, the above results imply that building scaled-
down superheater platens did not provide any striking new information compared to that obtained
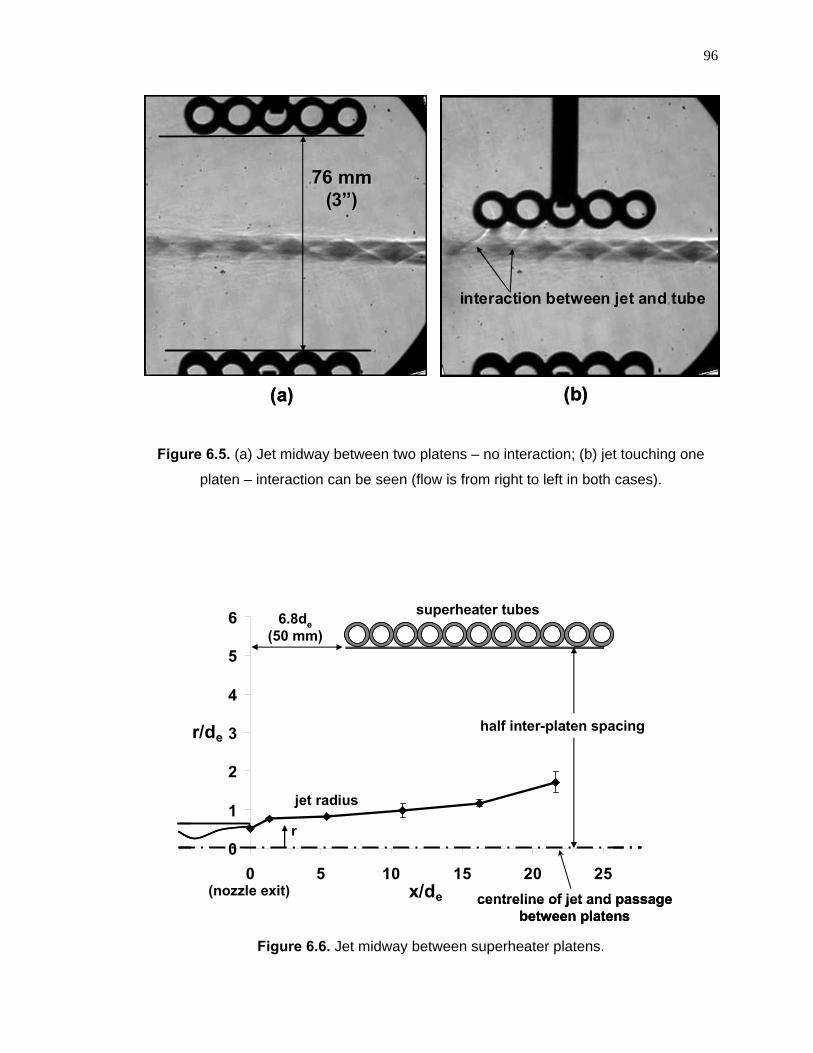
96
76 mm 76 mm (3(3””))
Figure 6.5. (a) Jet midway between two platens – no interaction; (b) jet touching one
platen – interaction can be seen (flow is from right to left in both cases).
Figure 6.6. Jet midway between superheater platens.
0
1
2
3
4
5
6
0 5 10 15 20 25x/de
r/de
(nozzle exit)
6.8de
(50 mm)
jet radius
half inter-platen spacing
centreline of jet and passage between platens
superheater tubes
r0
1
2
3
4
5
6
0 5 10 15 20 25x/de
r/de
(nozzle exit)
6.8de
(50 mm)
jet radius
half inter-platen spacing
centreline of jet and passage between platens
superheater tubes
r
(a) (b)
interaction between jet and tube
76 mm 76 mm (3(3””))
interaction between jet and tube
(a) (b)
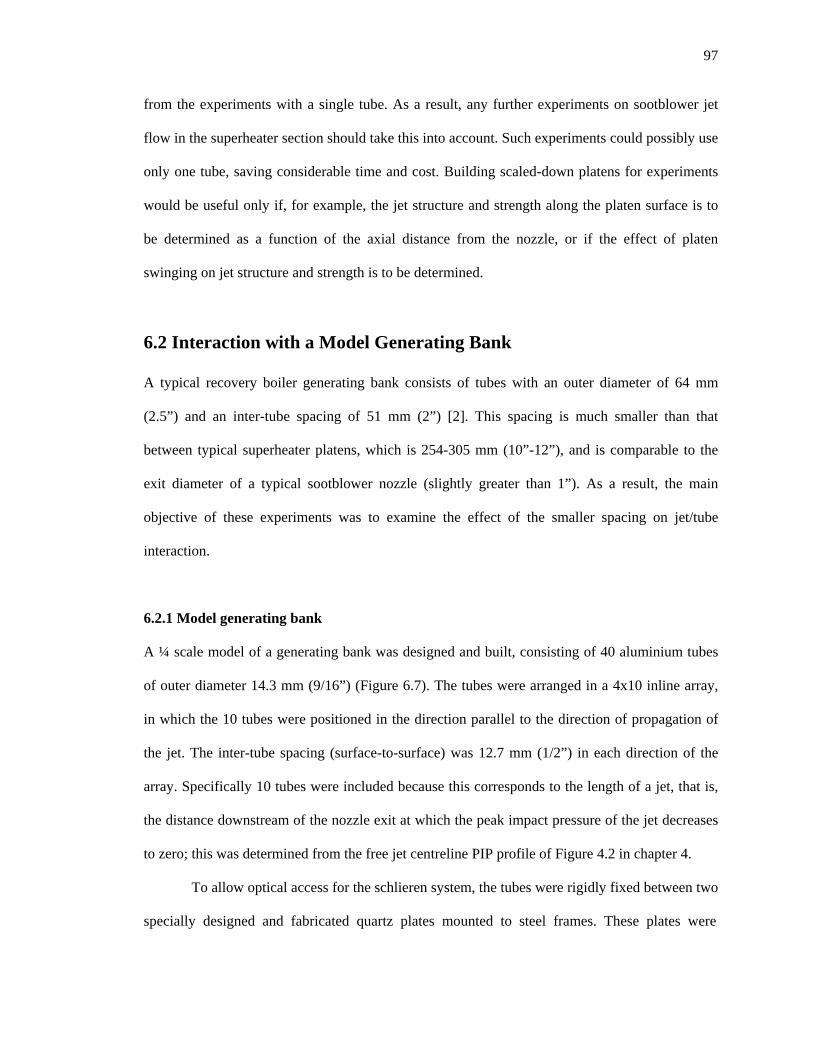
97
from the experiments with a single tube. As a result, any further experiments on sootblower jet
flow in the superheater section should take this into account. Such experiments could possibly use
only one tube, saving considerable time and cost. Building scaled-down platens for experiments
would be useful only if, for example, the jet structure and strength along the platen surface is to
be determined as a function of the axial distance from the nozzle, or if the effect of platen
swinging on jet structure and strength is to be determined.
6.2 Interaction with a Model Generating Bank
A typical recovery boiler generating bank consists of tubes with an outer diameter of 64 mm
(2.5”) and an inter-tube spacing of 51 mm (2”) [2]. This spacing is much smaller than that
between typical superheater platens, which is 254-305 mm (10”-12”), and is comparable to the
exit diameter of a typical sootblower nozzle (slightly greater than 1”). As a result, the main
objective of these experiments was to examine the effect of the smaller spacing on jet/tube
interaction.
6.2.1 Model generating bank
A ¼ scale model of a generating bank was designed and built, consisting of 40 aluminium tubes
of outer diameter 14.3 mm (9/16”) (Figure 6.7). The tubes were arranged in a 4x10 inline array,
in which the 10 tubes were positioned in the direction parallel to the direction of propagation of
the jet. The inter-tube spacing (surface-to-surface) was 12.7 mm (1/2”) in each direction of the
array. Specifically 10 tubes were included because this corresponds to the length of a jet, that is,
the distance downstream of the nozzle exit at which the peak impact pressure of the jet decreases
to zero; this was determined from the free jet centreline PIP profile of Figure 4.2 in chapter 4.
To allow optical access for the schlieren system, the tubes were rigidly fixed between two
specially designed and fabricated quartz plates mounted to steel frames. These plates were
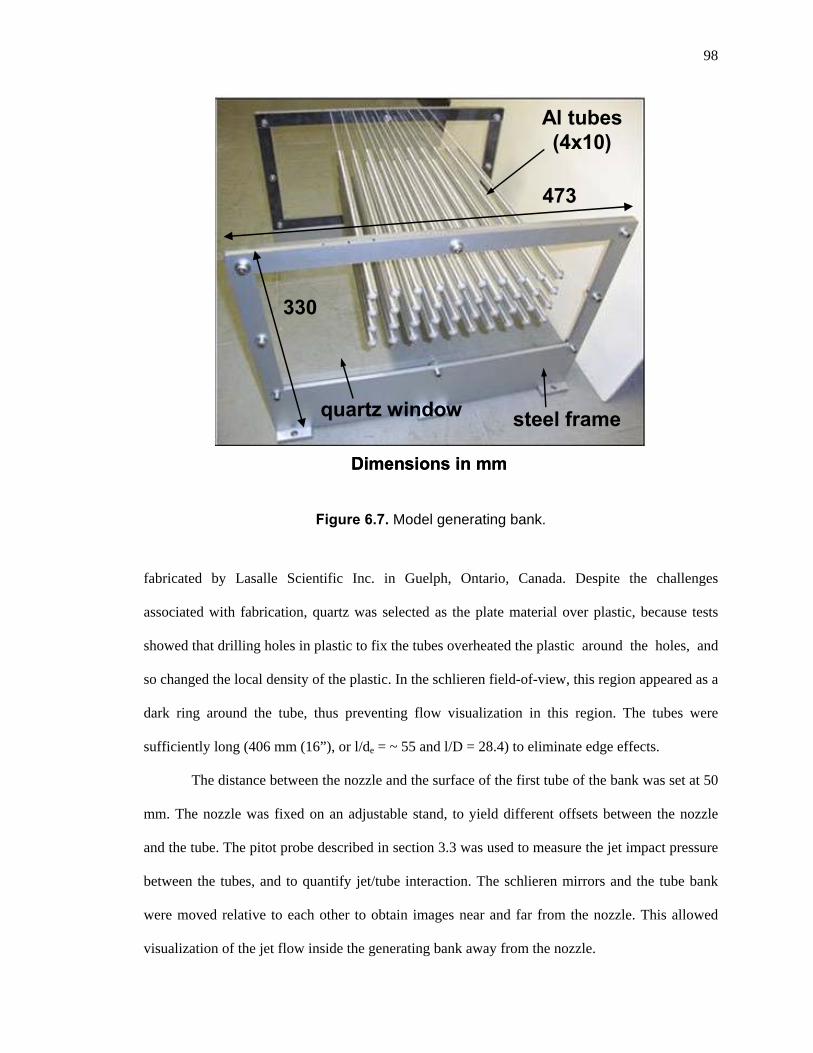
98
quartz window
Al tubes(4x10)
Figure 6.7. Model generating bank.
fabricated by Lasalle Scientific Inc. in Guelph, Ontario, Canada. Despite the challenges
associated with fabrication, quartz was selected as the plate material over plastic, because tests
showed that drilling holes in plastic to fix the tubes overheated the plastic around the holes, and
so changed the local density of the plastic. In the schlieren field-of-view, this region appeared as a
dark ring around the tube, thus preventing flow visualization in this region. The tubes were
sufficiently long (406 mm (16”), or l/de = ~ 55 and l/D = 28.4) to eliminate edge effects.
The distance between the nozzle and the surface of the first tube of the bank was set at 50
mm. The nozzle was fixed on an adjustable stand, to yield different offsets between the nozzle
and the tube. The pitot probe described in section 3.3 was used to measure the jet impact pressure
between the tubes, and to quantify jet/tube interaction. The schlieren mirrors and the tube bank
were moved relative to each other to obtain images near and far from the nozzle. This allowed
visualization of the jet flow inside the generating bank away from the nozzle.
steel frame
473
330
Dimensions in mm
quartz window
Al tubes(4x10)
steel frame
473
330
Dimensions in mm
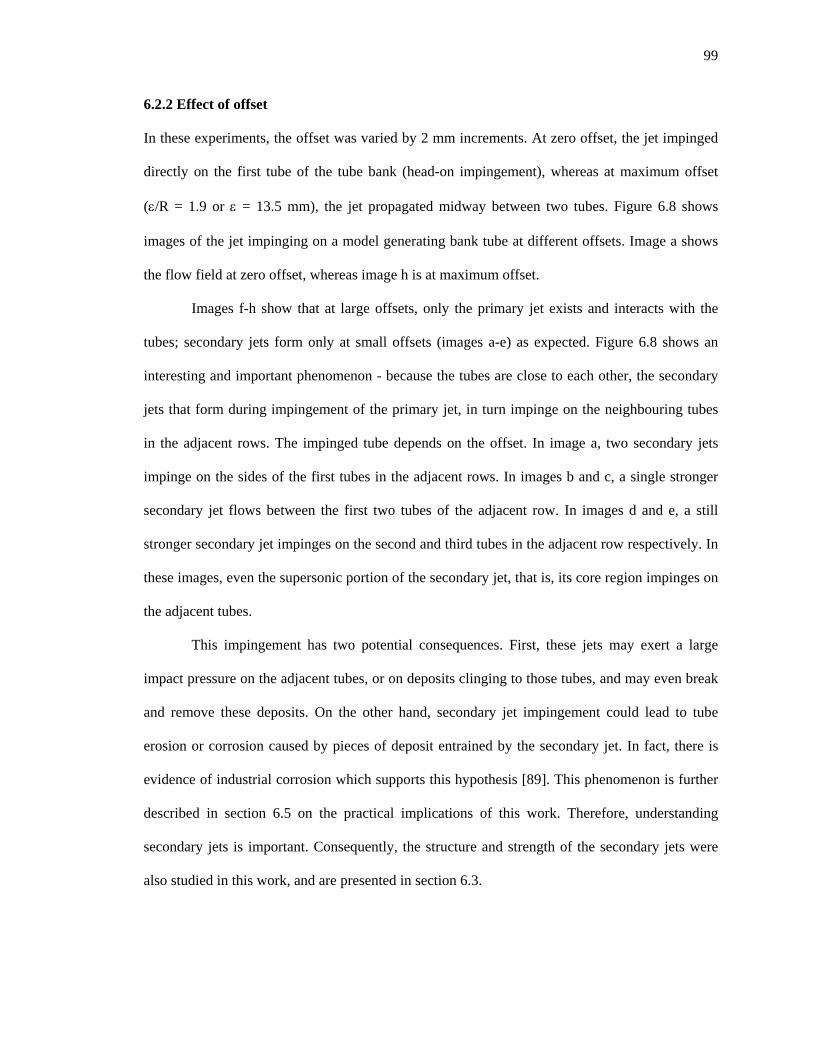
99
6.2.2 Effect of offset
In these experiments, the offset was varied by 2 mm increments. At zero offset, the jet impinged
directly on the first tube of the tube bank (head-on impingement), whereas at maximum offset
(/R = 1.9 or = 13.5 mm), the jet propagated midway between two tubes. Figure 6.8 shows
images of the jet impinging on a model generating bank tube at different offsets. Image a shows
the flow field at zero offset, whereas image h is at maximum offset.
Images f-h show that at large offsets, only the primary jet exists and interacts with the
tubes; secondary jets form only at small offsets (images a-e) as expected. Figure 6.8 shows an
interesting and important phenomenon - because the tubes are close to each other, the secondary
jets that form during impingement of the primary jet, in turn impinge on the neighbouring tubes
in the adjacent rows. The impinged tube depends on the offset. In image a, two secondary jets
impinge on the sides of the first tubes in the adjacent rows. In images b and c, a single stronger
secondary jet flows between the first two tubes of the adjacent row. In images d and e, a still
stronger secondary jet impinges on the second and third tubes in the adjacent row respectively. In
these images, even the supersonic portion of the secondary jet, that is, its core region impinges on
the adjacent tubes.
This impingement has two potential consequences. First, these jets may exert a large
impact pressure on the adjacent tubes, or on deposits clinging to those tubes, and may even break
and remove these deposits. On the other hand, secondary jet impingement could lead to tube
erosion or corrosion caused by pieces of deposit entrained by the secondary jet. In fact, there is
evidence of industrial corrosion which supports this hypothesis [89]. This phenomenon is further
described in section 6.5 on the practical implications of this work. Therefore, understanding
secondary jets is important. Consequently, the structure and strength of the secondary jets were
also studied in this work, and are presented in section 6.3.
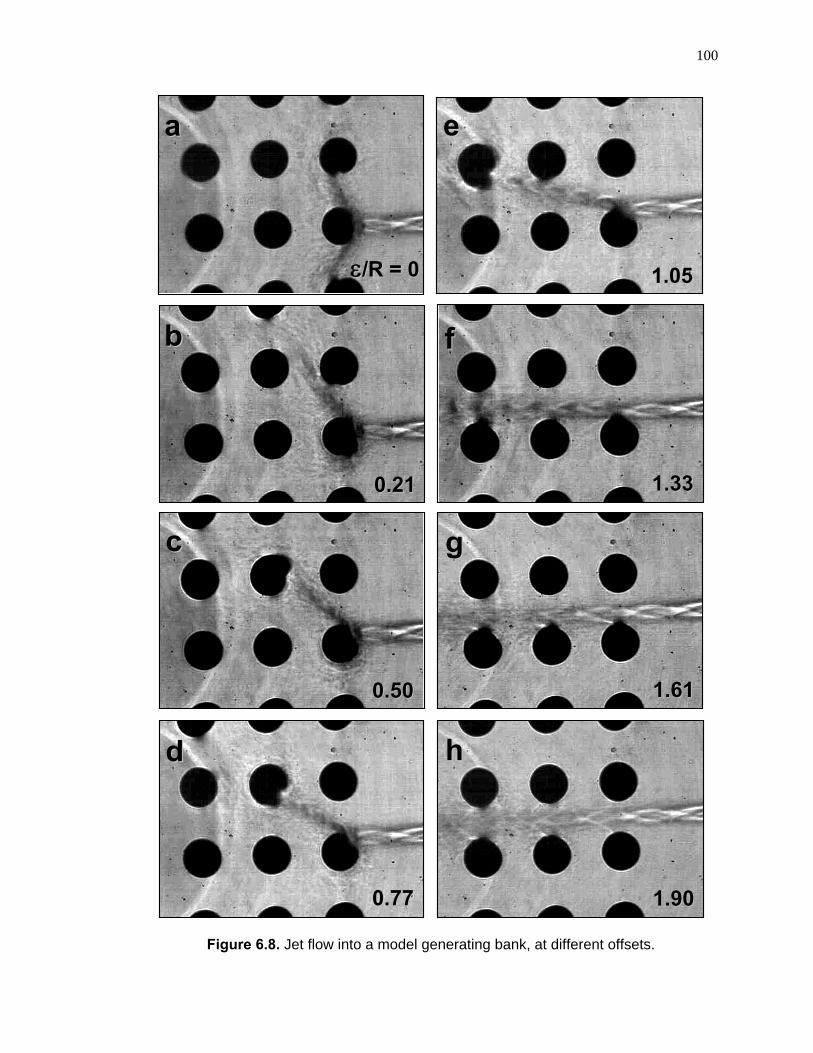
100
Figure 6.8. Jet flow into a model generating bank, at different offsets.
hh
1.901.90
gg
1.611.61
ff
1.331.33
ee
1.051.05
aa
/R = 0/R = 0
ee
1.051.05
aa
/R = 0/R = 0
bb
0.210.21
bb
0.210.21
ff
1.331.33
cc
0.500.50
cc
0.500.50
gg
1.611.61
dd
0.770.77
hh
1.901.90
dd
0.770.77
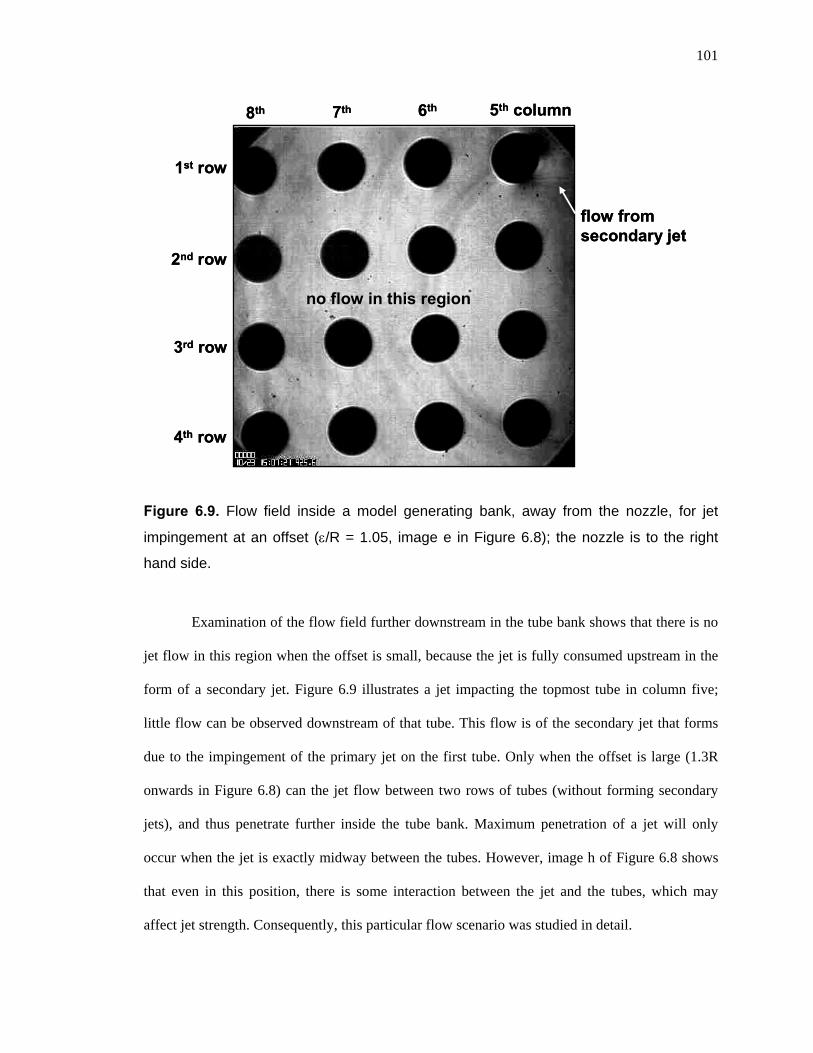
101
6th 5th column7th8th
Figure 6.9. Flow field inside a model generating bank, away from the nozzle, for jet
impingement at an offset (/R = 1.05, image e in Figure 6.8); the nozzle is to the right
hand side.
Examination of the flow field further downstream in the tube bank shows that there is no
jet flow in this region when the offset is small, because the jet is fully consumed upstream in the
form of a secondary jet. Figure 6.9 illustrates a jet impacting the topmost tube in column five;
little flow can be observed downstream of that tube. This flow is of the secondary jet that forms
due to the impingement of the primary jet on the first tube. Only when the offset is large (1.3R
onwards in Figure 6.8) can the jet flow between two rows of tubes (without forming secondary
jets), and thus penetrate further inside the tube bank. Maximum penetration of a jet will only
occur when the jet is exactly midway between the tubes. However, image h of Figure 6.8 shows
that even in this position, there is some interaction between the jet and the tubes, which may
affect jet strength. Consequently, this particular flow scenario was studied in detail.
flow from secondary jet
no flow in this region
1st row
2nd row
3rd row
4th row
6th 5th column7th8th
flow from secondary jet
no flow in this region
1st row
2nd row
3rd row
4th row
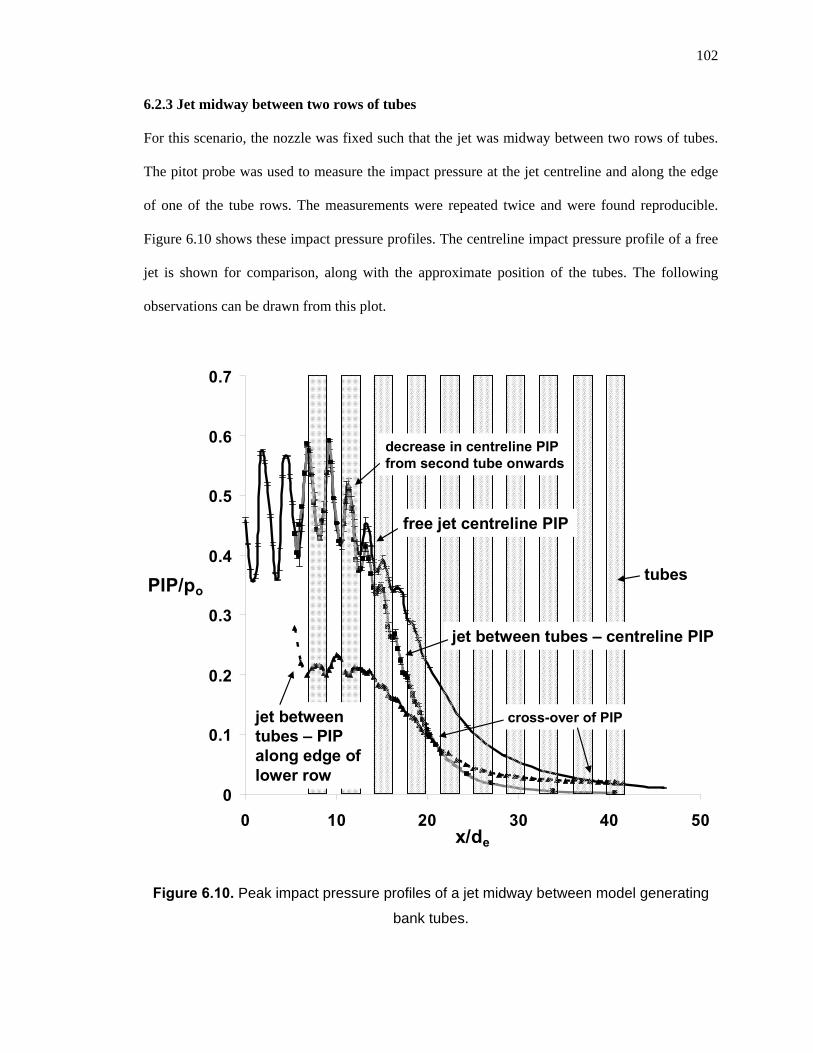
102
6.2.3 Jet midway between two rows of tubes
For this scenario, the nozzle was fixed such that the jet was midway between two rows of tubes.
The pitot probe was used to measure the impact pressure at the jet centreline and along the edge
of one of the tube rows. The measurements were repeated twice and were found reproducible.
Figure 6.10 shows these impact pressure profiles. The centreline impact pressure profile of a free
jet is shown for comparison, along with the approximate position of the tubes. The following
observations can be drawn from this plot.
0
0.1
0.2
0.3
0.4
0.5
0.6
0.7
0 10 20 30 40 50x/de
PIP/po
Figure 6.10. Peak impact pressure profiles of a jet midway between model generating
bank tubes.
free jet centreline PIP
jet between tubes – centreline PIP
decrease in centreline PIP from second tube onwards
jet between tubes – PIP along edge of lower row
tubes
cross-over of PIP
0
0.1
0.2
0.3
0.4
0.5
0.6
0.7
0 10 20 30 40 50x/de
PIP/po
free jet centreline PIP
jet between tubes – centreline PIP
decrease in centreline PIP from second tube onwards
jet between tubes – PIP along edge of lower row
tubes
cross-over of PIP
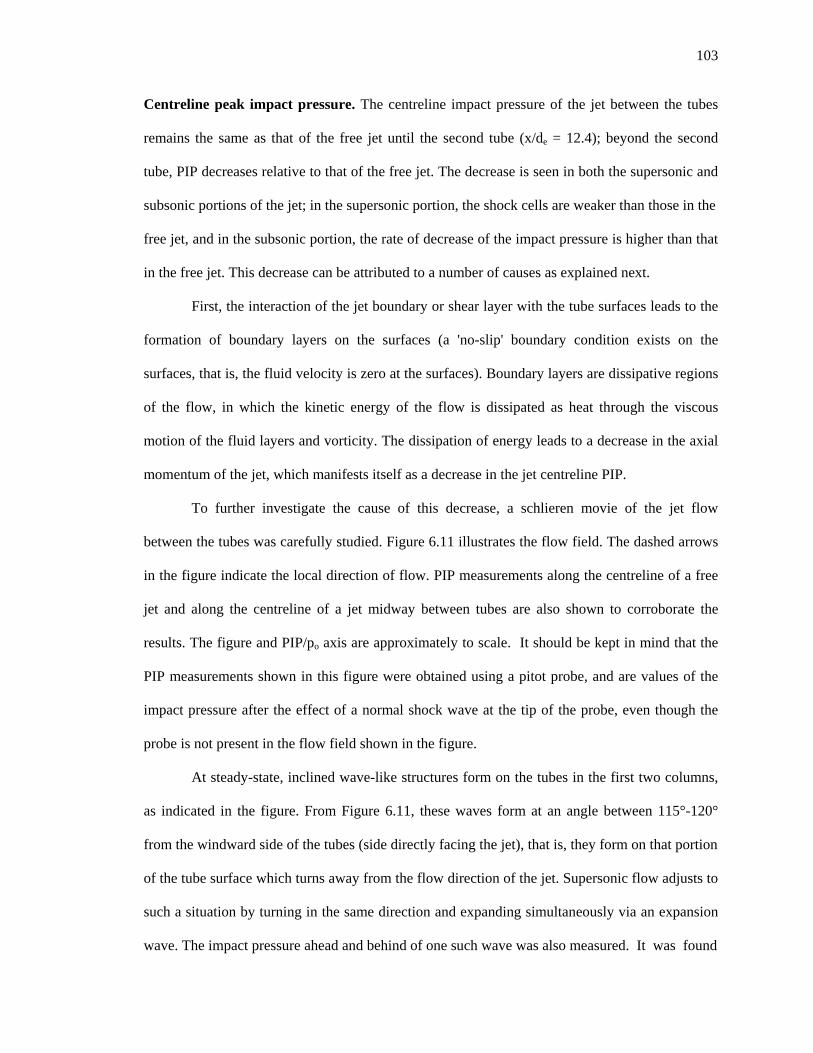
103
Centreline peak impact pressure. The centreline impact pressure of the jet between the tubes
remains the same as that of the free jet until the second tube (x/de = 12.4); beyond the second
tube, PIP decreases relative to that of the free jet. The decrease is seen in both the supersonic and
subsonic portions of the jet; in the supersonic portion, the shock cells are weaker than those in the
free jet, and in the subsonic portion, the rate of decrease of the impact pressure is higher than that
in the free jet. This decrease can be attributed to a number of causes as explained next.
First, the interaction of the jet boundary or shear layer with the tube surfaces leads to the
formation of boundary layers on the surfaces (a 'no-slip' boundary condition exists on the
surfaces, that is, the fluid velocity is zero at the surfaces). Boundary layers are dissipative regions
of the flow, in which the kinetic energy of the flow is dissipated as heat through the viscous
motion of the fluid layers and vorticity. The dissipation of energy leads to a decrease in the axial
momentum of the jet, which manifests itself as a decrease in the jet centreline PIP.
To further investigate the cause of this decrease, a schlieren movie of the jet flow
between the tubes was carefully studied. Figure 6.11 illustrates the flow field. The dashed arrows
in the figure indicate the local direction of flow. PIP measurements along the centreline of a free
jet and along the centreline of a jet midway between tubes are also shown to corroborate the
results. The figure and PIP/po axis are approximately to scale. It should be kept in mind that the
PIP measurements shown in this figure were obtained using a pitot probe, and are values of the
impact pressure after the effect of a normal shock wave at the tip of the probe, even though the
probe is not present in the flow field shown in the figure.
At steady-state, inclined wave-like structures form on the tubes in the first two columns,
as indicated in the figure. From Figure 6.11, these waves form at an angle between 115°-120°
from the windward side of the tubes (side directly facing the jet), that is, they form on that portion
of the tube surface which turns away from the flow direction of the jet. Supersonic flow adjusts to
such a situation by turning in the same direction and expanding simultaneously via an expansion
wave. The impact pressure ahead and behind of one such wave was also measured. It was found
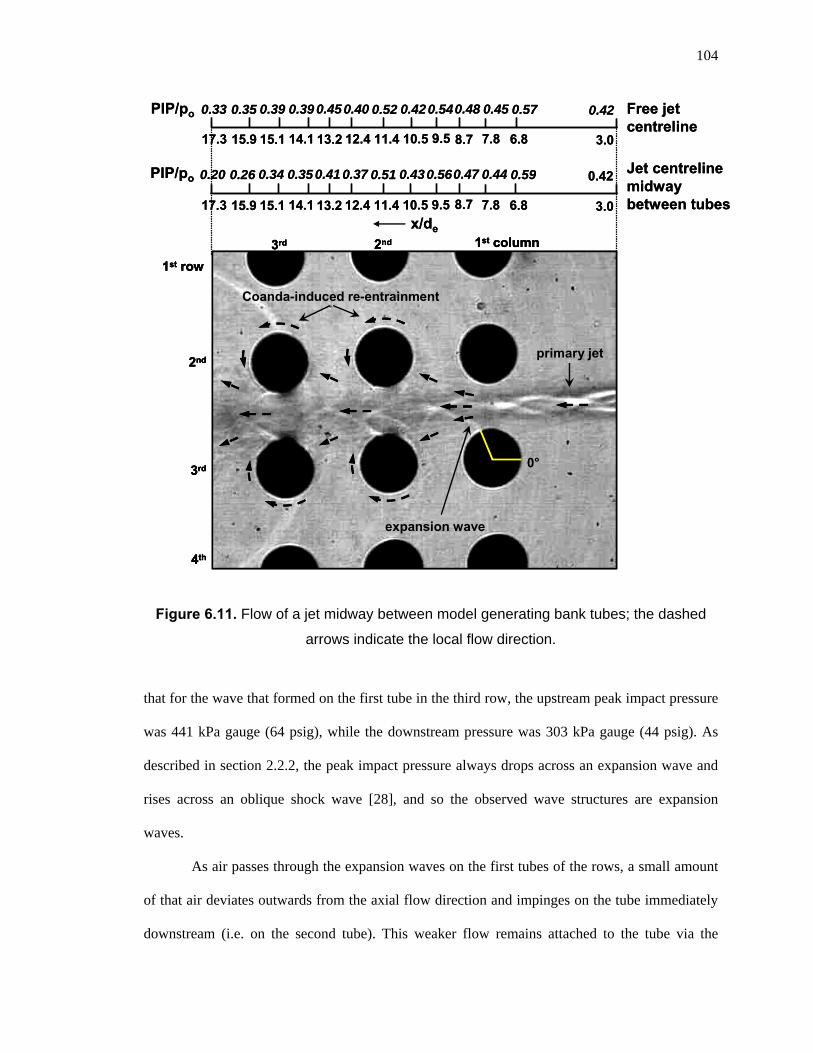
104
Figure 6.11. Flow of a jet midway between model generating bank tubes; the dashed
arrows indicate the local flow direction.
that for the wave that formed on the first tube in the third row, the upstream peak impact pressure
was 441 kPa gauge (64 psig), while the downstream pressure was 303 kPa gauge (44 psig). As
described in section 2.2.2, the peak impact pressure always drops across an expansion wave and
rises across an oblique shock wave [28], and so the observed wave structures are expansion
waves.
As air passes through the expansion waves on the first tubes of the rows, a small amount
of that air deviates outwards from the axial flow direction and impinges on the tube immediately
downstream (i.e. on the second tube). This weaker flow remains attached to the tube via the
x/de
PIP/po
PIP/po Free jet centreline
Jet centreline midwaybetween tubes
6.87.88.79.510.511.412.413.214.115.115.917.3 3.0
primary jet
0°
expansion wave
Coanda-induced re-entrainment
1st row
2nd
3rd
4th
1st column2nd3rd
6.87.88.79.510.511.412.413.214.115.115.917.3 3.0
0.42
0.420.570.450.480.540.420.520.400.450.390.390.350.33
0.590.440.470.560.430.510.370.410.350.340.260.20
x/de
PIP/po
PIP/po Free jet centreline
Jet centreline midwaybetween tubes
6.87.88.79.510.511.412.413.214.115.115.917.3 3.0
primary jet
0°
expansion wave
Coanda-induced re-entrainment
1st row
2nd
3rd
4th
1st column2nd3rd
primary jet
0°
expansion wave
Coanda-induced re-entrainment
1st row
2nd
3rd
4th
1st column2nd3rd
6.87.88.79.510.511.412.413.214.115.115.917.3 3.0
0.42
0.420.570.450.480.540.420.520.400.450.390.390.350.33
0.590.440.470.560.430.510.370.410.350.340.260.20

105
Coanda effect and is re-entrained into the jet. This process repeats itself but intensifies further
downstream because the jet spreads radially and its interaction with the tubes becomes stronger,
and then this process weakens far away from the nozzle because the overall flow slows down
substantially (flow velocity decreases and turbulence increases). Since the second tube lies in the
supersonic portion of the jet, the decrease in PIP observed in Figure 6.10 starts in the supersonic
portion of the jet, and weakens the shock cells; Figure 6.11 shows that noticeable decrease in PIP
starts from about x/de = 12.4, which corresponds to a location just downstream of the second tube.
This Coanda-induced re-entrainment is believed to increase the mixing in the jet from the second
tube onwards, to a level more than that in the free jet. Due to this, the kinetic energy of the jet is
viscously dissipated through increased vorticity leading to a decrease in the centreline PIP.
Moreover, the jet spreads laterally due to confinement by the tubes, and its momentum is
redistributed over a greater cross-sectional area. Due to all these reasons, the peak impact
pressure decreases more rapidly than in the free jet. However, the spreading of the jet between the
tubes is limited by the presence of the tubes.
Although high momentum flows such as supersonic jets are not significantly affected by
subtle pressure gradient-driven effects such as the Coanda effect, the flow situation described
above is believed to involve the Coanda effect because in this situation too, this effect apparently
affects the weak air flow originating from the jet shear layer and not the jet core. The jet shear
layer is the main cause of dissipation of the jet's energy. The vorticity and turbulence in the shear
layer propagate radially inwards towards the jet centreline as the distance away from the nozzle
exit increases. Coanda-induced re-entrainment affects the jet shear layer and hence the main
dissipation mechanism of the jet.
As was done for the superheater platens, Figure 6.12 illustrates the radial spread of the jet
superimposed on a schematic of the typical spacing between generating bank tubes. The figure
shows that for a jet directed midway between tube rows, the jet boundary just touches the first
tube of the row, and is interrupted by the second tube. As a result, jet/tube interaction is expected
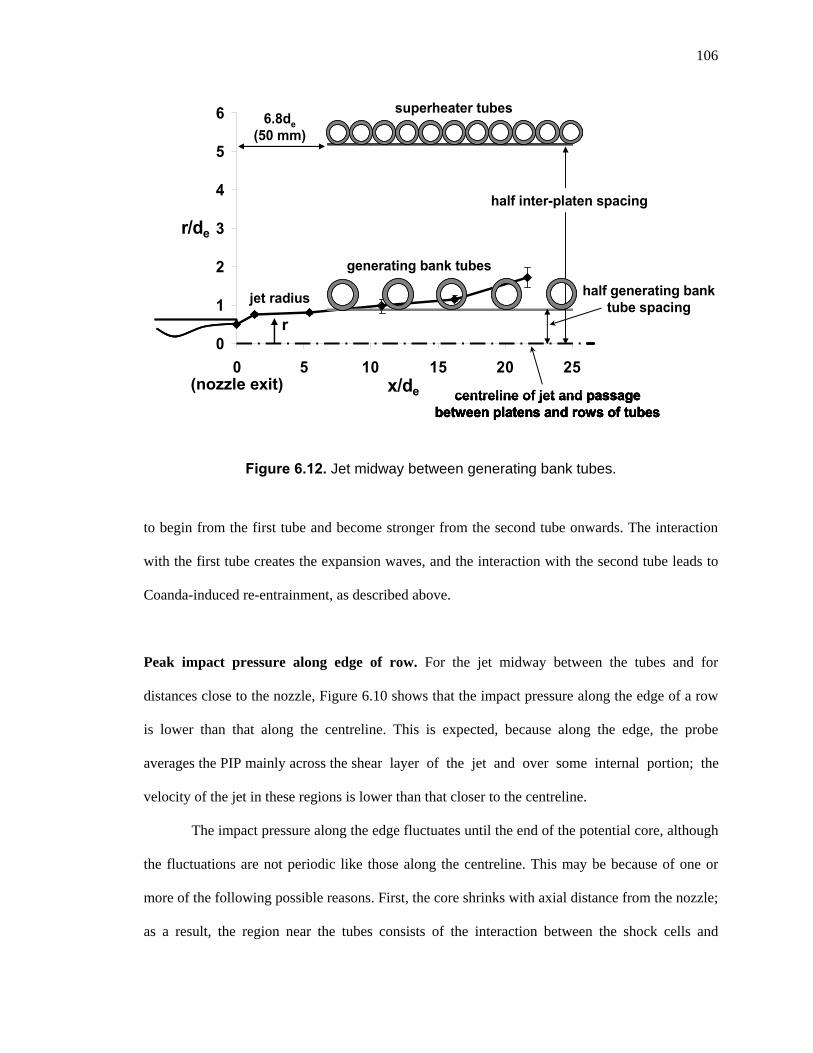
106
0
1
2
3
4
5
6
0 5 10 15 20 25x/de
r/de
superheater tubes
Figure 6.12. Jet midway between generating bank tubes.
to begin from the first tube and become stronger from the second tube onwards. The interaction
with the first tube creates the expansion waves, and the interaction with the second tube leads to
Coanda-induced re-entrainment, as described above.
Peak impact pressure along edge of row. For the jet midway between the tubes and for
distances close to the nozzle, Figure 6.10 shows that the impact pressure along the edge of a row
is lower than that along the centreline. This is expected, because along the edge, the probe
averages the PIP mainly across the shear layer of the jet and over some internal portion; the
velocity of the jet in these regions is lower than that closer to the centreline.
The impact pressure along the edge fluctuates until the end of the potential core, although
the fluctuations are not periodic like those along the centreline. This may be because of one or
more of the following possible reasons. First, the core shrinks with axial distance from the nozzle;
as a result, the region near the tubes consists of the interaction between the shock cells and
nozzle exit
6.8de
(50 mm)
jet radius
half inter-platen spacing
centreline of jet and passage between platens and rows of tubes
half generating bank tube spacing
generating bank tubes
0
1
2
3
4
5
6
0 5 10 15 20 25x/de
r/de
superheater tubes
nozzle exit
6.8de
(50 mm)
jet radius
half inter-platen spacing
centreline of jet and passage between platens and rows of tubes
half generating bank tube spacing
generating bank tubes
(nozzle exit)
r0
1
2
3
4
5
6
0 5 10 15 20 25x/de
r/de
superheater tubes
nozzle exit
6.8de
(50 mm)
jet radius
half inter-platen spacing
centreline of jet and passage between platens and rows of tubes
half generating bank tube spacing
generating bank tubes
0
1
2
3
4
5
6
0 5 10 15 20 25x/de
r/de
superheater tubes6.8de
(50 mm)
jet radius
half inter-platen spacing
nozzle exit
generating bank tubes
centreline of jet and passage between platens and rows of tubes
half generating bank tube spacing
r
(nozzle exit)
107
turbulence, which makes the flow unsteady in this region. Second, the air re-entrained in the jet
downstream of any given tube may also disturb the flow locally in that region, making it
unsteady. This may be further amplified by the interaction with the shock cells. Third, the
instability of the jet itself may contribute to this. As described in section 5.3, the jet used in this
work is known to undergo a flapping instability. As a result, the interaction of the jet with the
tubes could have been unsteady, and this would be reflected in the PIP measurements. Finally, the
size of the pitot probe orifice relative to the size of the jet and tube spacing may have also
contributed to this, by averaging the PIP over some small portion of the cross-section of the jet.
However, the contribution from this source is expected to be smaller than from the other sources,
because the first two oscillations along the edge between the first and second tubes were clearly
captured by the probe.
Cross-over of peak impact pressure profiles. Beyond the jet core (approximately 18 nozzle
diameters), in the region where the jet turns subsonic from supersonic, Figure 6.10 shows that the
PIP profile along the edge of the row of tubes crosses over the centreline profile; its PIP beyond
this distance is higher than that at the jet centreline between the tubes, and its rate of decrease is
also slower. At a larger distance, the profile along the edge also crosses over the centreline profile
of a free jet. This is considered to happen because the tubes restrict the entrainment and spreading
of the jet. Some amount of the air exiting the jet stream around the tubes is entrained back into the
jet as described above, whereas that air would mix with the ambient air in the case of a free jet.
The air below the stagnation point on the upper tube (or in the case of the lower tube, above the
stagnation point) accelerates from the stagnation zone around the lower (or upper) surface of the
tube, increasing its velocity. The jet also spreads laterally due to the confinement, redistributing
its momentum. Due to these reasons, the PIP along the edge increases. Because a free jet spreads
unrestricted with distance, the centreline PIP of a free jet decreases continuously.
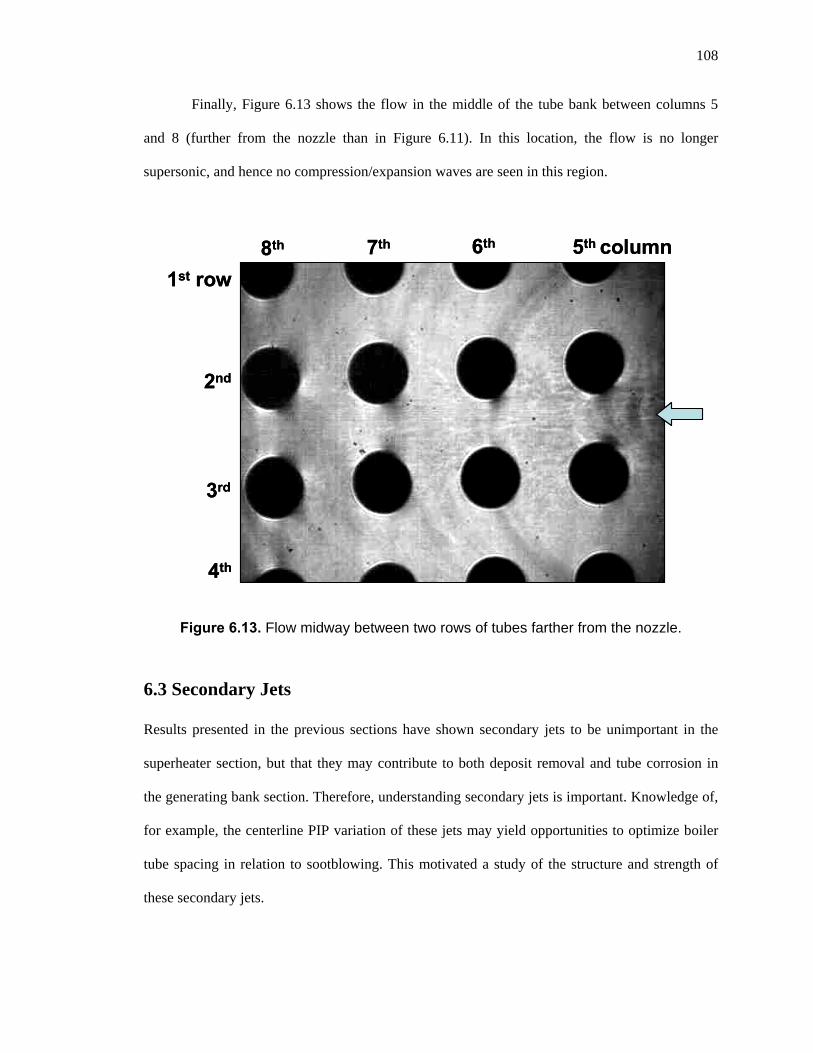
108
Finally, Figure 6.13 shows the flow in the middle of the tube bank between columns 5
and 8 (further from the nozzle than in Figure 6.11). In this location, the flow is no longer
supersonic, and hence no compression/expansion waves are seen in this region.
7th8th 6th 5th column
1st row
2nd
3rd
4th
7th8th 6th 5th column
1st row
2nd
3rd
4th
Figure 6.13. Flow midway between two rows of tubes farther from the nozzle.
6.3 Secondary Jets
Results presented in the previous sections have shown secondary jets to be unimportant in the
superheater section, but that they may contribute to both deposit removal and tube corrosion in
the generating bank section. Therefore, understanding secondary jets is important. Knowledge of,
for example, the centerline PIP variation of these jets may yield opportunities to optimize boiler
tube spacing in relation to sootblowing. This motivated a study of the structure and strength of
these secondary jets.
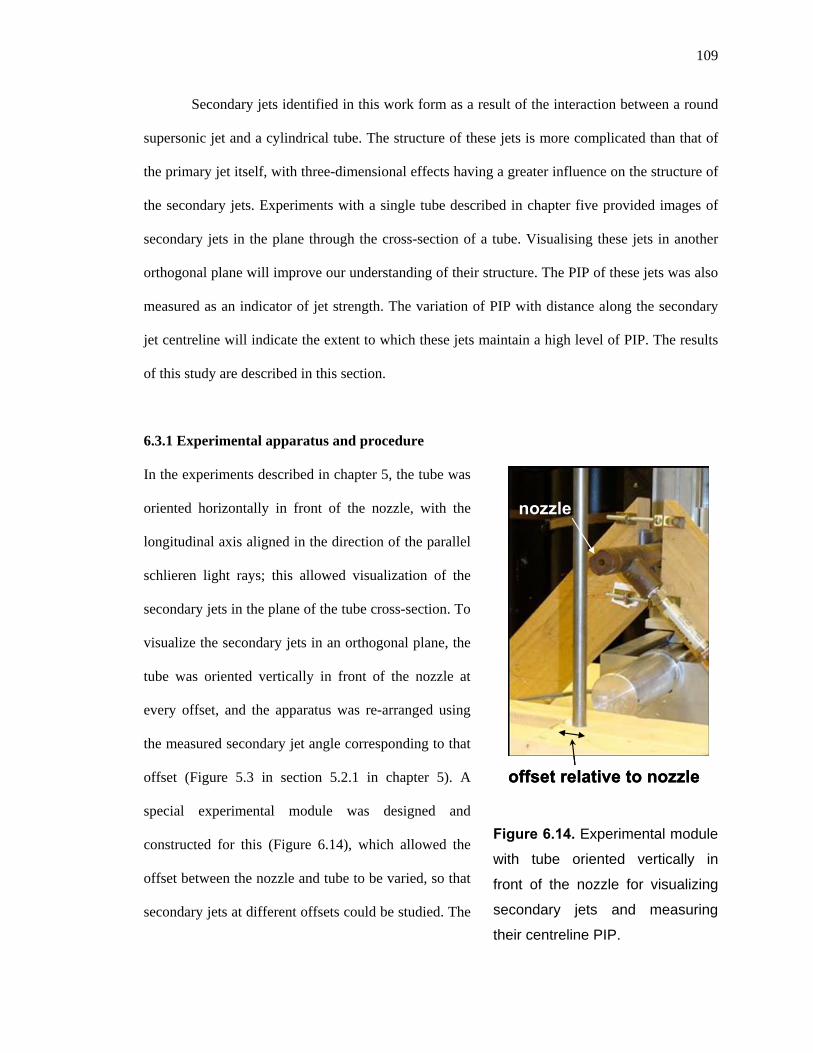
109
Secondary jets identified in this work form as a result of the interaction between a round
supersonic jet and a cylindrical tube. The structure of these jets is more complicated than that of
the primary jet itself, with three-dimensional effects having a greater influence on the structure of
the secondary jets. Experiments with a single tube described in chapter five provided images of
secondary jets in the plane through the cross-section of a tube. Visualising these jets in another
orthogonal plane will improve our understanding of their structure. The PIP of these jets was also
measured as an indicator of jet strength. The variation of PIP with distance along the secondary
jet centreline will indicate the extent to which these jets maintain a high level of PIP. The results
of this study are described in this section.
6.3.1 Experimental apparatus and procedure
In the experiments described in chapter 5, the tube was
oriented horizontally in front of the nozzle, with the
longitudinal axis aligned in the direction of the parallel
schlieren light rays; this allowed visualization of the
secondary jets in the plane of the tube cross-section. To
visualize the secondary jets in an orthogonal plane, the
tube was oriented vertically in front of the nozzle at
every offset, and the apparatus was re-arranged using
the measured secondary jet angle corresponding to that
offset (Figure 5.3 in section 5.2.1 in chapter 5). A
special experimental module was designed and
constructed for this (Figure 6.14), which allowed the
offset between the nozzle and tube to be varied, so that
secondary jets at different offsets could be studied. The
nozzle
Figure 6.14. Experimental module
with tube oriented vertically in
front of the nozzle for visualizing
secondary jets and measuring
their centreline PIP.
offset relative to nozzle
nozzle
offset relative to nozzle
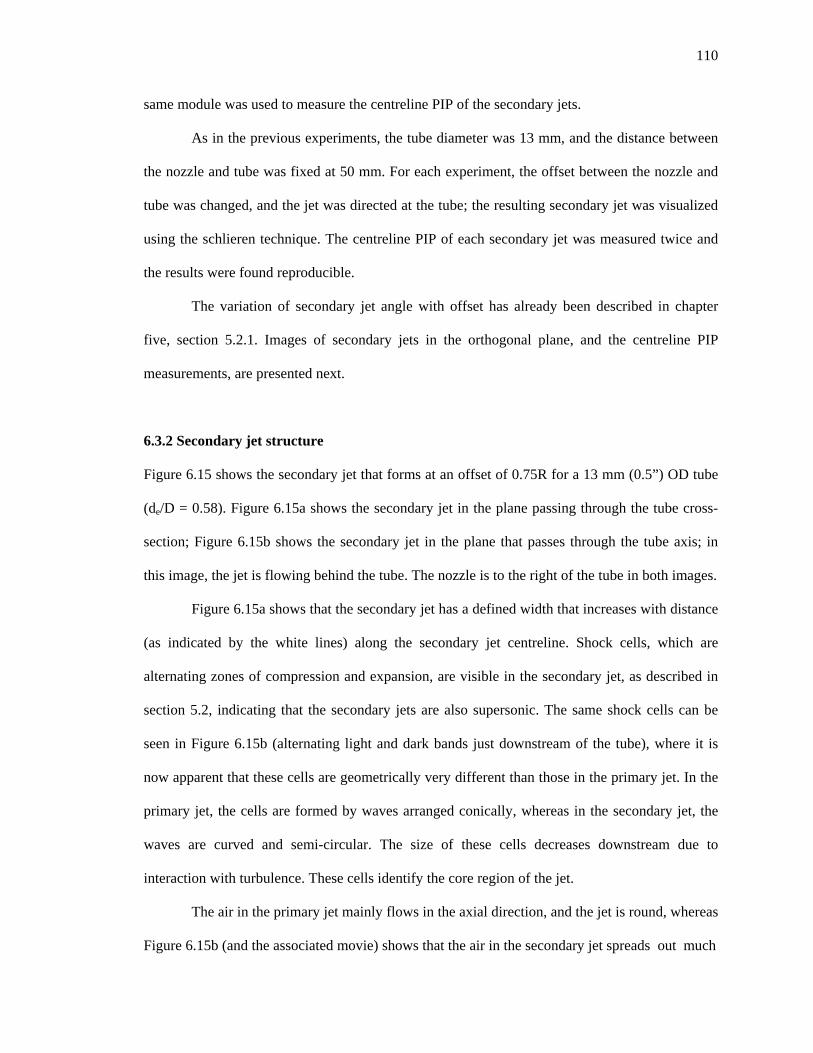
110
same module was used to measure the centreline PIP of the secondary jets.
As in the previous experiments, the tube diameter was 13 mm, and the distance between
the nozzle and tube was fixed at 50 mm. For each experiment, the offset between the nozzle and
tube was changed, and the jet was directed at the tube; the resulting secondary jet was visualized
using the schlieren technique. The centreline PIP of each secondary jet was measured twice and
the results were found reproducible.
The variation of secondary jet angle with offset has already been described in chapter
five, section 5.2.1. Images of secondary jets in the orthogonal plane, and the centreline PIP
measurements, are presented next.
6.3.2 Secondary jet structure
Figure 6.15 shows the secondary jet that forms at an offset of 0.75R for a 13 mm (0.5”) OD tube
(de/D = 0.58). Figure 6.15a shows the secondary jet in the plane passing through the tube cross-
section; Figure 6.15b shows the secondary jet in the plane that passes through the tube axis; in
this image, the jet is flowing behind the tube. The nozzle is to the right of the tube in both images.
Figure 6.15a shows that the secondary jet has a defined width that increases with distance
(as indicated by the white lines) along the secondary jet centreline. Shock cells, which are
alternating zones of compression and expansion, are visible in the secondary jet, as described in
section 5.2, indicating that the secondary jets are also supersonic. The same shock cells can be
seen in Figure 6.15b (alternating light and dark bands just downstream of the tube), where it is
now apparent that these cells are geometrically very different than those in the primary jet. In the
primary jet, the cells are formed by waves arranged conically, whereas in the secondary jet, the
waves are curved and semi-circular. The size of these cells decreases downstream due to
interaction with turbulence. These cells identify the core region of the jet.
The air in the primary jet mainly flows in the axial direction, and the jet is round, whereas
Figure 6.15b (and the associated movie) shows that the air in the secondary jet spreads out much
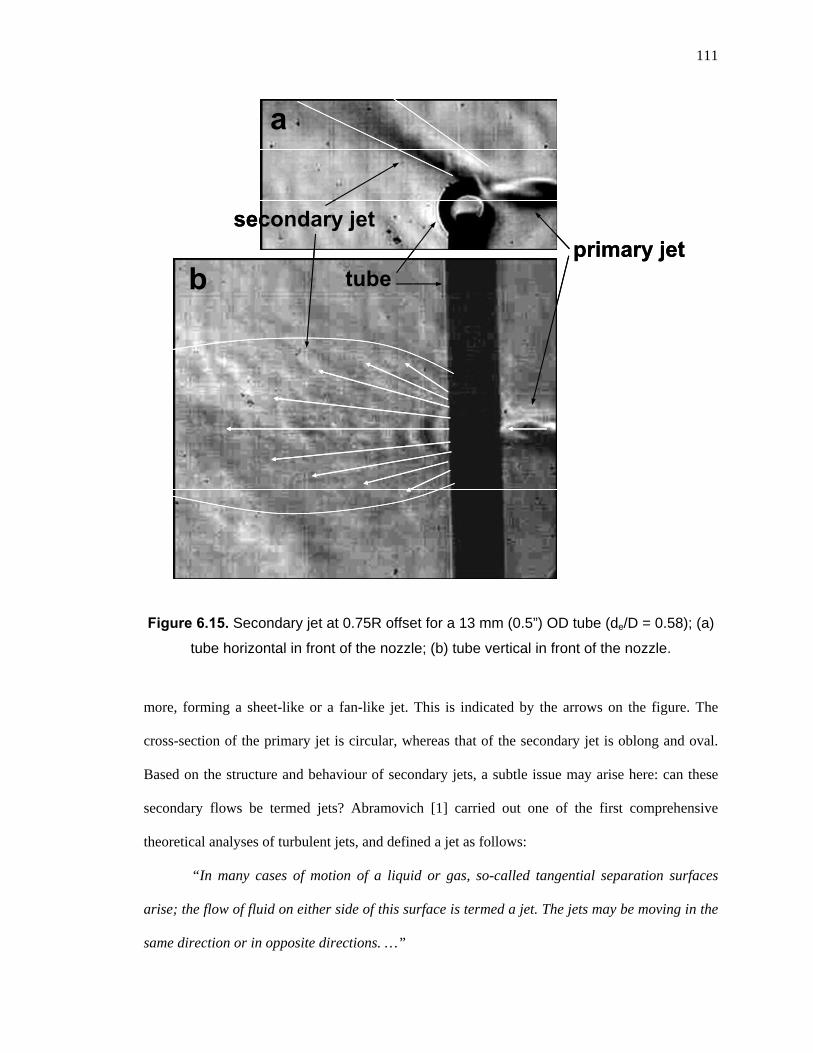
111
a
secondary jet
Figure 6.15. Secondary jet at 0.75R offset for a 13 mm (0.5”) OD tube (de/D = 0.58); (a)
tube horizontal in front of the nozzle; (b) tube vertical in front of the nozzle.
more, forming a sheet-like or a fan-like jet. This is indicated by the arrows on the figure. The
cross-section of the primary jet is circular, whereas that of the secondary jet is oblong and oval.
Based on the structure and behaviour of secondary jets, a subtle issue may arise here: can these
secondary flows be termed jets? Abramovich [1] carried out one of the first comprehensive
theoretical analyses of turbulent jets, and defined a jet as follows:
“In many cases of motion of a liquid or gas, so-called tangential separation surfaces
arise; the flow of fluid on either side of this surface is termed a jet. The jets may be moving in the
same direction or in opposite directions. …”
b tube
a
secondary jetprimary jet
b tubeprimary jet
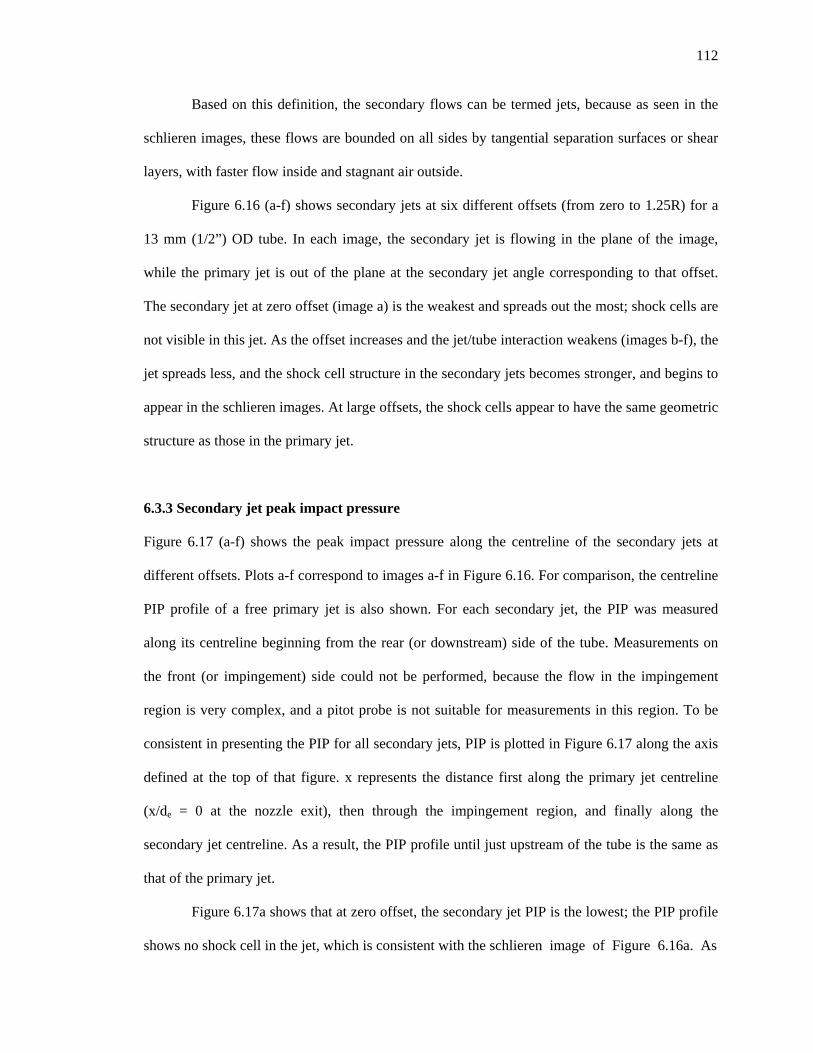
112
Based on this definition, the secondary flows can be termed jets, because as seen in the
schlieren images, these flows are bounded on all sides by tangential separation surfaces or shear
layers, with faster flow inside and stagnant air outside.
Figure 6.16 (a-f) shows secondary jets at six different offsets (from zero to 1.25R) for a
13 mm (1/2”) OD tube. In each image, the secondary jet is flowing in the plane of the image,
while the primary jet is out of the plane at the secondary jet angle corresponding to that offset.
The secondary jet at zero offset (image a) is the weakest and spreads out the most; shock cells are
not visible in this jet. As the offset increases and the jet/tube interaction weakens (images b-f), the
jet spreads less, and the shock cell structure in the secondary jets becomes stronger, and begins to
appear in the schlieren images. At large offsets, the shock cells appear to have the same geometric
structure as those in the primary jet.
6.3.3 Secondary jet peak impact pressure
Figure 6.17 (a-f) shows the peak impact pressure along the centreline of the secondary jets at
different offsets. Plots a-f correspond to images a-f in Figure 6.16. For comparison, the centreline
PIP profile of a free primary jet is also shown. For each secondary jet, the PIP was measured
along its centreline beginning from the rear (or downstream) side of the tube. Measurements on
the front (or impingement) side could not be performed, because the flow in the impingement
region is very complex, and a pitot probe is not suitable for measurements in this region. To be
consistent in presenting the PIP for all secondary jets, PIP is plotted in Figure 6.17 along the axis
defined at the top of that figure. x represents the distance first along the primary jet centreline
(x/de = 0 at the nozzle exit), then through the impingement region, and finally along the
secondary jet centreline. As a result, the PIP profile until just upstream of the tube is the same as
that of the primary jet.
Figure 6.17a shows that at zero offset, the secondary jet PIP is the lowest; the PIP profile
shows no shock cell in the jet, which is consistent with the schlieren image of Figure 6.16a. As
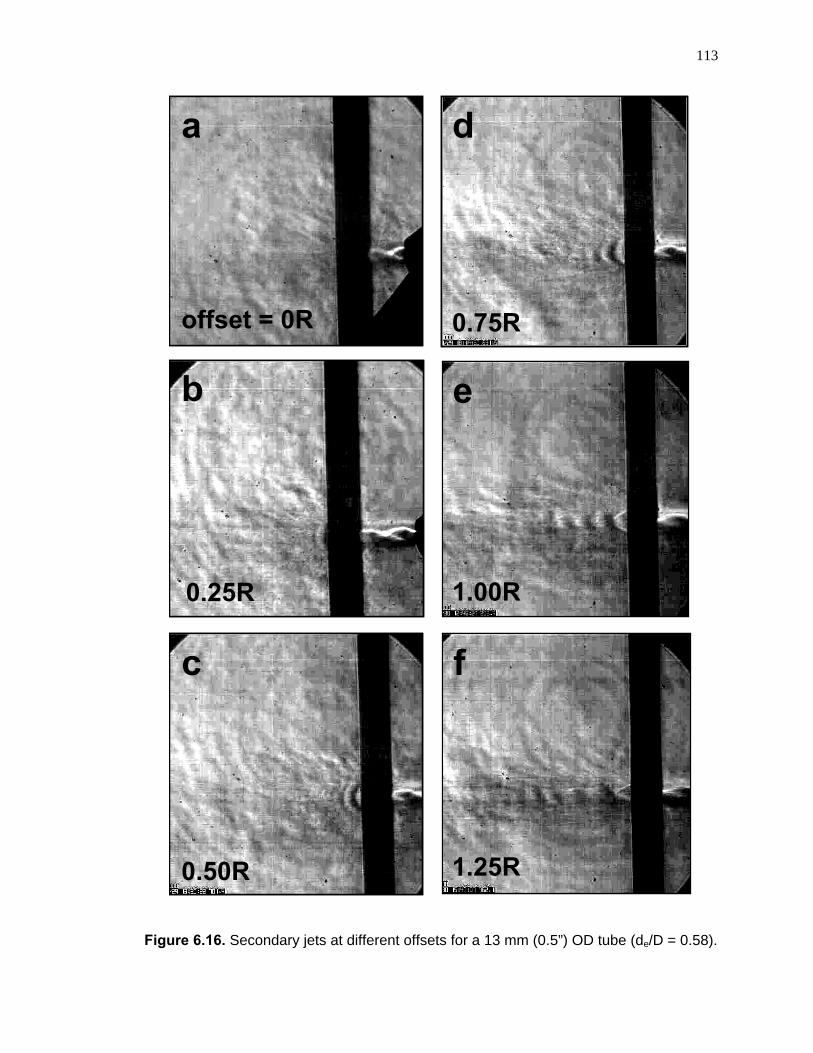
113
offset = 0R 0.75R
0.25R 1.00R
0.50R 1.25R
a
b
c
d
e
f
offset = 0R 0.75R
0.25R 1.00R
0.50R 1.25R
a
b
c
d
e
f
Figure 6.16. Secondary jets at different offsets for a 13 mm (0.5”) OD tube (de/D = 0.58).
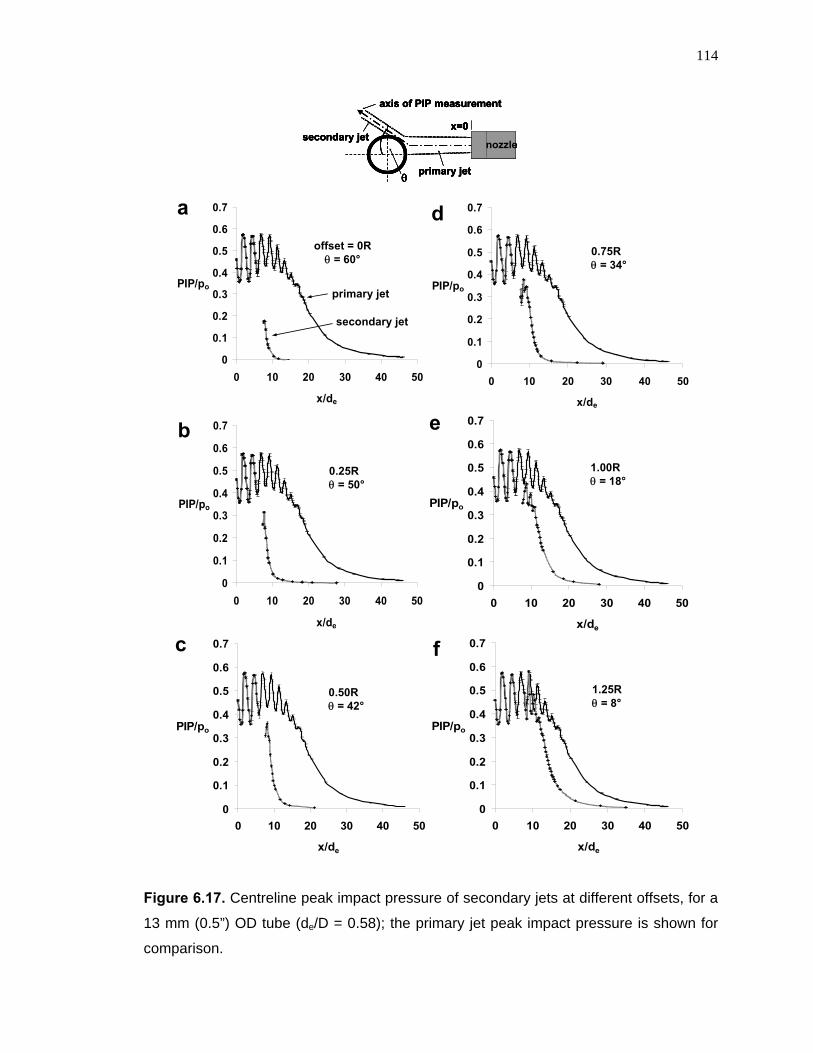
114
Figure 6.17. Centreline peak impact pressure of secondary jets at different offsets, for a
13 mm (0.5”) OD tube (de/D = 0.58); the primary jet peak impact pressure is shown for
comparison.
nozzle
primary jet
secondary jet
axis of PIP measurement
x=0
nozzle
primary jet
secondary jet
axis of PIP measurement
x=0
0
0.1
0.2
0.3
0.4
0.5
0.6
0.7
0 10 20 30 40 50
x/de
PIP/po
0
0.1
0.2
0.3
0.4
0.5
0.6
0.7
0 10 20 30 40 50
x/de
PIP/po
0
0.1
0.2
0.3
0.4
0.5
0.6
0.7
0 10 20 30 40 50
x/de
PIP/po
0
0.1
0.2
0.3
0.4
0.5
0.6
0.7
0 10 20 30 40 50
x/de
PIP/po
0
0.1
0.2
0.3
0.4
0.5
0.6
0.7
0 10 20 30 40 50
x/de
PIP/po
0
0.1
0.2
0.3
0.4
0.5
0.6
0.7
0 10 20 30 40 50
x/de
PIP/po
a d
b
c
primary jet
secondary jet
offset = 0R = 60°
0.75R = 34°
1.00R = 18°
1.25R = 8°
0.50R = 42°
0.25R = 50°
e
f
nozzle
primary jet
secondary jet
axis of PIP measurement
x=0
nozzle
primary jet
secondary jet
axis of PIP measurement
x=0
0
0.1
0.2
0.3
0.4
0.5
0.6
0.7
0 10 20 30 40 50
x/de
PIP/po
0
0.1
0.2
0.3
0.4
0.5
0.6
0.7
0 10 20 30 40 50
x/de
PIP/po
0
0.1
0.2
0.3
0.4
0.5
0.6
0.7
0 10 20 30 40 50
x/de
PIP/po
0
0.1
0.2
0.3
0.4
0.5
0.6
0.7
0 10 20 30 40 50
x/de
PIP/po
0
0.1
0.2
0.3
0.4
0.5
0.6
0.7
0 10 20 30 40 50
x/de
PIP/po
0
0.1
0.2
0.3
0.4
0.5
0.6
0.7
0 10 20 30 40 50
x/de
PIP/po
a d
b
c
primary jet
secondary jet
offset = 0R = 60°
0.75R = 34°
1.00R = 18°
1.25R = 8°
0.50R = 42°
0.25R = 50°
e
f
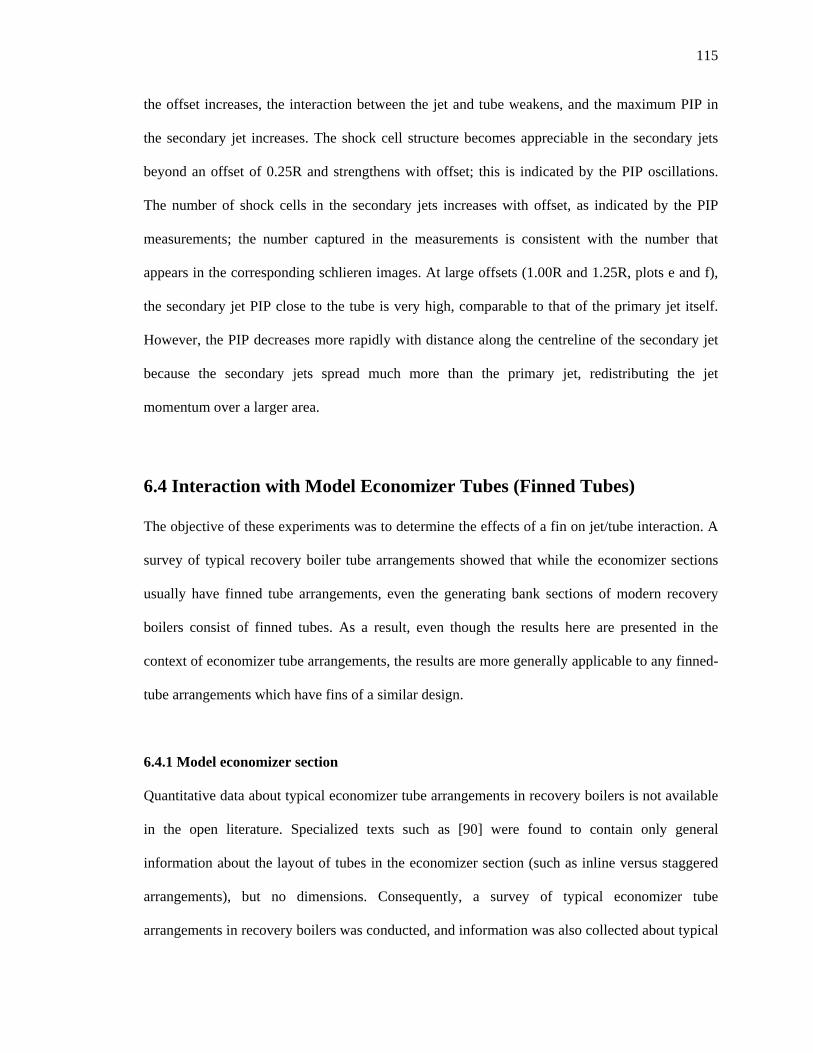
115
the offset increases, the interaction between the jet and tube weakens, and the maximum PIP in
the secondary jet increases. The shock cell structure becomes appreciable in the secondary jets
beyond an offset of 0.25R and strengthens with offset; this is indicated by the PIP oscillations.
The number of shock cells in the secondary jets increases with offset, as indicated by the PIP
measurements; the number captured in the measurements is consistent with the number that
appears in the corresponding schlieren images. At large offsets (1.00R and 1.25R, plots e and f),
the secondary jet PIP close to the tube is very high, comparable to that of the primary jet itself.
However, the PIP decreases more rapidly with distance along the centreline of the secondary jet
because the secondary jets spread much more than the primary jet, redistributing the jet
momentum over a larger area.
6.4 Interaction with Model Economizer Tubes (Finned Tubes)
The objective of these experiments was to determine the effects of a fin on jet/tube interaction. A
survey of typical recovery boiler tube arrangements showed that while the economizer sections
usually have finned tube arrangements, even the generating bank sections of modern recovery
boilers consist of finned tubes. As a result, even though the results here are presented in the
context of economizer tube arrangements, the results are more generally applicable to any finned-
tube arrangements which have fins of a similar design.
6.4.1 Model economizer section
Quantitative data about typical economizer tube arrangements in recovery boilers is not available
in the open literature. Specialized texts such as [90] were found to contain only general
information about the layout of tubes in the economizer section (such as inline versus staggered
arrangements), but no dimensions. Consequently, a survey of typical economizer tube
arrangements in recovery boilers was conducted, and information was also collected about typical

116
superheater and generating bank tube arrangements. Three boiler manufacturers - Babcock &
Wilcox, Andritz, and Metso Power, provided data on their typical tube arrangement dimensions.
Results of the survey are summarized in Appendix D, and were used to design two identical ¼
scale rows of economizer tubes with fins.
Figure 6.18a schematically shows one of these rows. It consisted of six 11 mm (7/16”)
OD tubes with fins welded on both the windward and leeward sides, with zero front-to-back
spacing. The fin width was the same as the tube outer diameter. Similar to the model superheater
platens, these tubes were sufficiently long to prevent any flow edge effects. The model was
supported on the same stands used for the model superheater platens, which allowed the offset
between them and the nozzle, as well as the spacing between the two rows, to be varied. Figure
6.18b shows the assembly. Based on the survey results, the spacing between the two rows was
fixed at 12.7 mm (0.5”), corresponding to 2” spacing in a boiler.
Figure 6.18. Model economizer tubes: (a) schematic of a row; (b) tube assembly.
6.4.2 Effect of offset
The offset was varied by 2 mm increments and the jet/tube interaction was visualized at each
offset; Figure 6.19 shows these images. Consistent with results presented earlier in this thesis,
OD 1111 1.222
All dimensions in mm
(a) (b)
standrow of finned tubes
nozzle
OD 1111 1.222
All dimensions in mm
OD 1111 1.222
All dimensions in mm
(a) (b)
standrow of finned tubes
nozzle
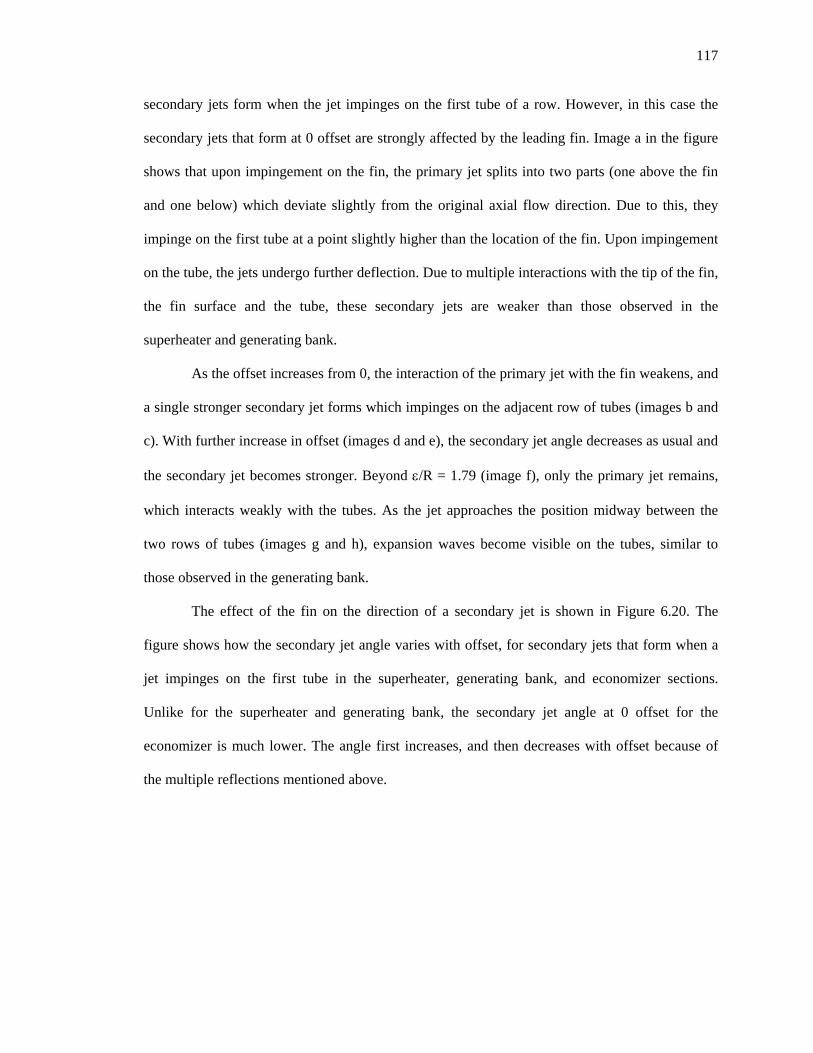
117
secondary jets form when the jet impinges on the first tube of a row. However, in this case the
secondary jets that form at 0 offset are strongly affected by the leading fin. Image a in the figure
shows that upon impingement on the fin, the primary jet splits into two parts (one above the fin
and one below) which deviate slightly from the original axial flow direction. Due to this, they
impinge on the first tube at a point slightly higher than the location of the fin. Upon impingement
on the tube, the jets undergo further deflection. Due to multiple interactions with the tip of the fin,
the fin surface and the tube, these secondary jets are weaker than those observed in the
superheater and generating bank.
As the offset increases from 0, the interaction of the primary jet with the fin weakens, and
a single stronger secondary jet forms which impinges on the adjacent row of tubes (images b and
c). With further increase in offset (images d and e), the secondary jet angle decreases as usual and
the secondary jet becomes stronger. Beyond /R = 1.79 (image f), only the primary jet remains,
which interacts weakly with the tubes. As the jet approaches the position midway between the
two rows of tubes (images g and h), expansion waves become visible on the tubes, similar to
those observed in the generating bank.
The effect of the fin on the direction of a secondary jet is shown in Figure 6.20. The
figure shows how the secondary jet angle varies with offset, for secondary jets that form when a
jet impinges on the first tube in the superheater, generating bank, and economizer sections.
Unlike for the superheater and generating bank, the secondary jet angle at 0 offset for the
economizer is much lower. The angle first increases, and then decreases with offset because of
the multiple reflections mentioned above.
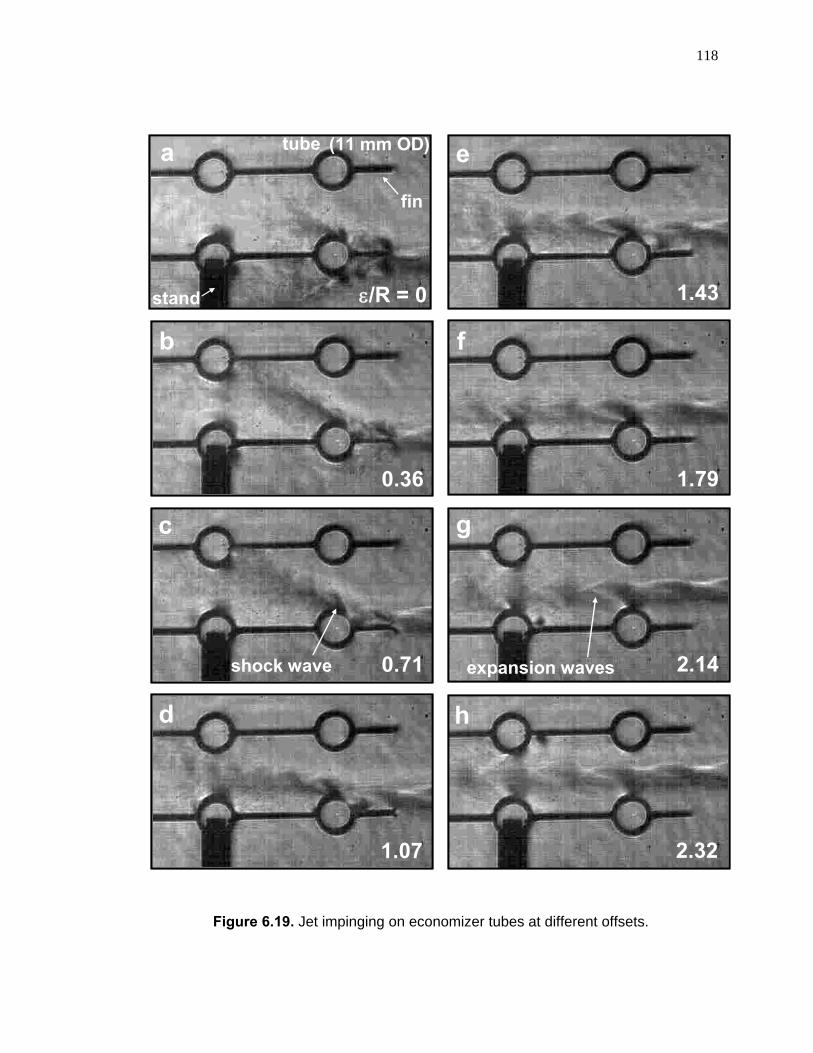
118
a
b
c
d
e
f
g
h
/R = 0
0.36
0.71
1.07
1.43
1.79
2.14
2.32
fin
tube (11 mm OD)
stand
Figure 6.19. Jet impinging on economizer tubes at different offsets.
expansion wavesshock wave
a
b
c
d
e
f
g
h
/R = 0
0.36
0.71
1.07
1.43
1.79
2.14
2.32
fin
tube (11 mm OD)
stand
expansion wavesshock wave
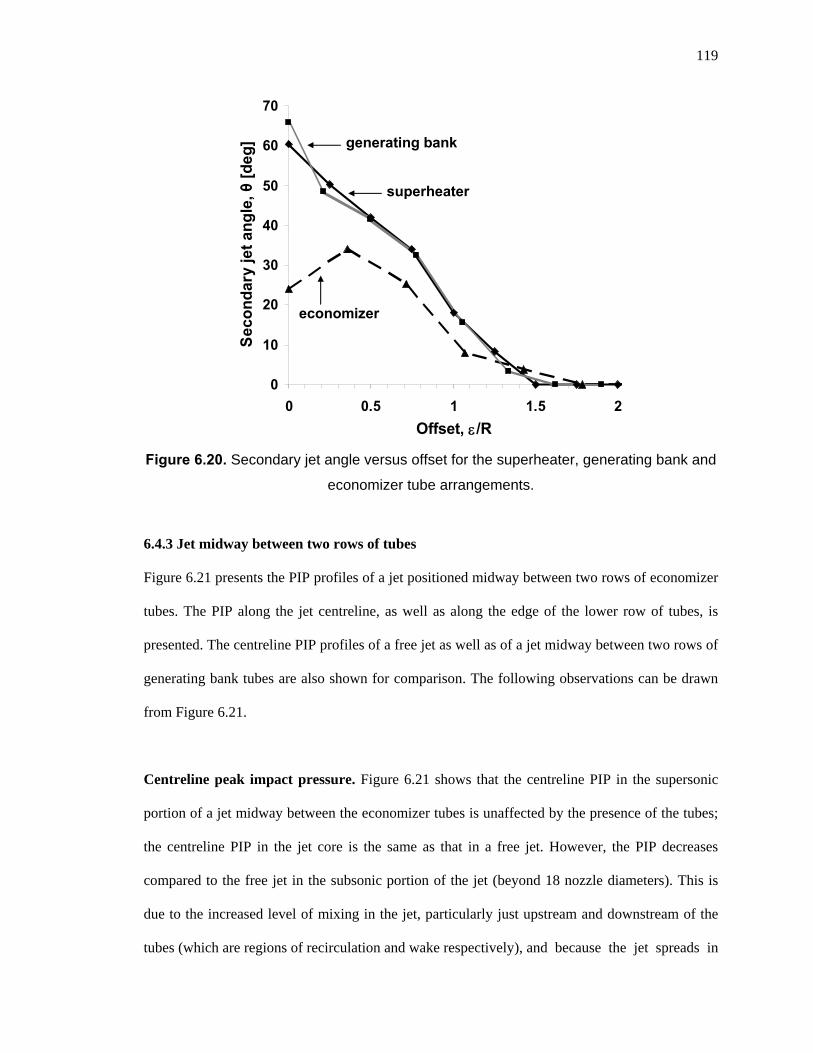
119
Figure 6.20. Secondary jet angle versus offset for the superheater, generating bank and
economizer tube arrangements.
0
10
20
30
40
50
60
70
0 0.5 1 1.5 2
Offset, /R
Sec
on
dar
y je
t an
gle
, θ [
deg
]
economizer
superheater
generating bank
0
10
20
30
40
50
60
70
0 0.5 1 1.5 2
Offset, /R
Sec
on
dar
y je
t an
gle
, θ [
deg
]
economizer
superheater
generating bank
6.4.3 Jet midway between two rows of tubes
Figure 6.21 presents the PIP profiles of a jet positioned midway between two rows of economizer
tubes. The PIP along the jet centreline, as well as along the edge of the lower row of tubes, is
presented. The centreline PIP profiles of a free jet as well as of a jet midway between two rows of
generating bank tubes are also shown for comparison. The following observations can be drawn
from Figure 6.21.
Centreline peak impact pressure. Figure 6.21 shows that the centreline PIP in the supersonic
portion of a jet midway between the economizer tubes is unaffected by the presence of the tubes;
the centreline PIP in the jet core is the same as that in a free jet. However, the PIP decreases
compared to the free jet in the subsonic portion of the jet (beyond 18 nozzle diameters). This is
due to the increased level of mixing in the jet, particularly just upstream and downstream of the
tubes (which are regions of recirculation and wake respectively), and because the jet spreads in
120
Figure 6.21. Peak impact pressure profiles of a jet midway between model economizer
tubes.
0
0.1
0.2
0.3
0.4
0.5
0.6
0.7
0 10 20 30 40 50
x/de
PIP/po
fins
the lateral direction. The finned tubes form walls confining the jet between them, and restrict the
spreading of the jet in the direction normal to the walls. The jet spreads initially until its
boundaries interact with the first tube in the upper and lower rows, forming expansion waves on
the tubes. The flow of air along the fin surfaces and around the tubes increases the mixing in the
jet. This phenomenon intensifies as the jet spreads further downstream, but weakens at large
distances from the nozzle as the overall flow slows down substantially. The jet spreads laterally to
adjust to the almost planar confinement, its momentum is redistributed over a greater cross-
sectional area, and from about the third tube onwards where the jet turns subsonic, the jet PIP
free jet – centreline PIP
jet in economizer –centreline PIP
jet in generating bank –centreline PIP
tube
jet in economizer –PIP along edge of lower row
0
0.1
0.2
0.3
0.4
0.5
0.6
0.7
0 10 20 30 40 50
x/de
PIP/po
fins
free jet – centreline PIP
jet in economizer –centreline PIP
jet in generating bank –centreline PIP
tube
jet in economizer –PIP along edge of lower row
121
decreases. Appendix E contains schlieren images of the quasi steady flow of a jet midway
between two rows of finned economizer tubes, showing the flow near and far fields.
Although the economizer and generating bank tubes are equally spaced (12.7 mm or 0.5”
in the present experiments), the jet centreline PIP between the economizer tubes remains stronger
for a greater distance because of the restricted entrainment and spreading of the jet. In the
generating bank, the open gaps between the tubes allow some small portion of the jet air to flow
around the tubes, forming wall jets (attached to the tubes) due to the Coanda effect, and
entraining air from the surrounding. The fins in the economizer, on the other hand, prevent
entrainment of surrounding air. Moreover, the jet reaches a tube sooner in the generating bank
than in the economizer, as the leading fin precedes the first tube in the economizer. As a result,
the jet centreline PIP diffuses more slowly in the economizer, and essentially, the jet is stronger
than in the generating bank.
Peak impact pressure along edge of row. The PIP along the edge of a row of tubes is much
lower than the centreline PIP, because at the edge, the pitot probe measures the PIP in the
outermost part of the jet. The PIP initially oscillates because of the compression and expansion
waves within the jet. In the outermost and weakest part of the jet, the measured oscillations are
much weaker than those captured along the centreline. The PIP then increases with distance up to
about 18 nozzle diameters (transition region from supersonic to subsonic) because of the
spreading of the jet. The PIP measured close to the first tube and fin is lower because the probe
only senses the outermost part of the jet. Further downstream, the jet spreads and the probe senses
a greater area of the jet with a higher PIP. From the transition region onwards (x/de = 18), the PIP
decreases continuously with distance due to mixing.
Cross-over of peak impact pressure profiles. As was observed in the PIP profiles of a jet in a
generating bank (Figure 6.10), the PIP along the edge of a row of tubes in the economizer
122
eventually exceeds the PIP along the jet centreline. Again, this occurs because the jet is restricted
between the tubes. Air accelerates locally around the tubes, and it also spreads laterally. This
causes the momentum to redistribute, increasing the PIP along the edge. The increase in PIP is
greater for the economizer than the generating bank, because the entrainment and spreading is
restricted much more by the fins in the economizer.
6.5 Practical Implications – Effects of the Formation of Secondary Jets
and Closer Tube Spacing
For all three tube bundles (superheater, generating bank, and economizer), secondary jets form
when a primary jet impinges on the first tube of a row of tubes (or on the leading fin in the case of
the economizer). A secondary jet becomes weaker and deviates more from the original flow
direction as the offset (distance between the jet and tube centrelines) decreases, that is, as the
interaction between the jet and tube intensifies. Consequently, there is little or no jet flow at all
beyond the first few tubes of these tube bundles whenever a secondary jet forms (third or fourth
tube in the superheater and generating bank sections and the second tube in the economizer
section). The primary jet impinges on the deposit formed on the first tube of the tube row in these
circumstances. Hence, any deposits beyond the first few tubes do not experience the sootblower
jet for a significant amount of time. These deposits include those clinging to the sides of
superheater platens, those accumulated between generating bank tubes as well as jammed
between them after being debonded by sootblowers, and those formed on economizer tubes and
fins.
Secondary jets practically become more important at closer tube spacing. Since the core
length of the secondary jet is much smaller than the spacing between two superheater platens, the
secondary jet cannot effectively remove a deposit on an adjacent platen. However, due to the
close spacing between the tubes in the generating bank and economizer, secondary jets impinge
123
on the tubes in the adjacent rows. In some situations, even their core region impinges on the
tubes. Thus, these jets may exert a large impact pressure on the adjacent tubes, or on deposits
clinging to those tubes, and may even break and remove these deposits. And even if the deposits
are too hard to break, the secondary jets may erode those deposits as they impinge on them. This
in turn would increase the effective exposure time of the deposits to the jet, which is necessary to
break big and hard deposits [69]. This is because as the primary jet impinges on the first tube of
the preceding row of tubes and continues to translate forward, the deposit on the adjacent tubes is
impinged by a secondary jet with continuously varying angle and strength; after a short period of
time, this same deposit is impinged by the primary jet that has translated forward. Thus, the
deposit is subjected to steam flow twice. Exact determination of whether secondary jets can
remove deposits in the generating bank and economizer will require information about the
physical structure of deposits (their shape and size) as well as their mechanical properties
(adhesion and tensile strengths, and porosity), which is difficult to obtain because of the
continuously changing nature of deposits. Another consequence of secondary jet impingement is
that it could lead to tube erosion as well as under-deposit corrosion.
To address these issues, secondary jet PIP was measured along the jet centreline. The
measurements showed that secondary jets retain a strong PIP for appreciable distances
downstream of the tube only at large offsets, although not as far as a primary jet. As the offset
decreases and the interaction between the jet and tube intensifies, the secondary jets become
weaker. Secondary jet PIP data shows that the PIP exerted by the secondary jets on the adjacent
tubes in the model generating bank (see Figure 6.8 c, d, and e) is slightly less than half the
average PIP in the core of the primary jet. This implies that in the generating bank and
economizer sections where the tube spacing is small, secondary jets will impinge on the tubes of
the adjacent rows, but will not exert a PIP on those tubes (or on deposits on those tubes) that is
more than half the average PIP in the primary jet core region. Nevertheless, these jets may help
erode deposits accumulated on and between the adjacent tubes. Deposits in the generating bank

124
are a mixture of carryover and fume deposits, and in some locations may be hard and brittle. But
those in the economizer are primarily fume, and are thin and powdery. As a result, secondary jets
although weaker because of the fin, may nevertheless help remove deposits even from adjacent
rows. In the superheater section, secondary jets will not be effective at all because of the large
inter-platen spacing.
On the other hand, there is evidence of industrial corrosion which supports the hypothesis
that secondary jets lead to under-deposit corrosion of tubes. This is described next.
Industry corrosion experience and relevance of the present findings
Over the years, North American recovery boiler operators have consistently reported thinning of
generating bank tubes, very near the mud-drum of the bank (lower drum containing water). Tube
thinning at sootblower elevations (slightly higher elevations than the mud drum) has also been
reported occasionally [89].
The most severe metal loss is found on the tubes closest to the sootblower lanes, and the
severity decreases in tube rows further away. The tube thinning is very localized, and only small
areas around the tube circumference are affected – at 10:00 and 2:00 with respect to the direction
from which the sootblower passes by the tube (0° in Figure 6.22). Studies conducted by the Pulp
and Paper Research Institute of Canada (PAPRICAN) [89] showed this thinning to be most likely
caused by a repeated cycle of under-deposit corrosion followed by removal of accumulated
corrosion product by sootblowers located close to the drum surface.
Although the present experiments were conducted for a different objective, their findings
appear consistent with this industry experience. As Figure 6.8 showed, secondary jets impinge
only on the first few tubes of the generating bank rows, that is, on the tubes closest to the
sootblower. Moreover, the secondary jets impinge on these tubes at an angle anywhere between
0° and 90° (Figure 6.22), which corresponds to the 10:00 and 2:00 positions reported in [89].
Although the present results have been obtained for head-on impingement (impingement
on a tube normal to the jet) and the impingement on the tube near the drum will be at an angle,
125
the results are still applicable, and show
that the secondary jets are the means by
which the sootblower steam reaches the
tubes behind the first tube of any given row.
Moreover, the schlieren movie of the
breakup of a synthetic deposit impinged by
a jet shows that deposit particles broken by
a jet are entrained by the secondary jet; this
will be presented in chapter 7. These
particles will also impinge on the adjacent tubes.
0°
90°
0°
90°
Figure 6.22. Impingement of a secondary jet
on a tube behind the first tube of a
generating bank row.
Due to the very low spreading rate of a supersonic jet, jet/tube interaction ceases when
the jet is offset only a small distance from a superheater platen. This implies deposits clinging to
the side of a platen are not exposed to the sootblower jet when it is offset only a small distance
from the surface of the deposit layer. Furthermore, much of the steam that a sootblower blows
between platens is wasted, as only small offsets yield useful interaction between a jet and a
deposit; any sootblowing strategy should take this into consideration. Continuous sootblowing
between platens is justified only if large deposits significantly block the space between platens.
Reducing the steam supply significantly or even stopping the supply when blowing between
platens will help reduce or stop such un-necessary steam consumption. However, depending on
the sootblower travel (length) and the time the blower stays in the high temperature environment
inside the boiler, steam may be required inside the blower lance for cooling the lance, and hence
for preventing excessive lance drooping and the associated large mechanical stresses and fatigue.
This points to the need for identifying ways to minimize such wasteful consumption of steam
(such as increasing the sootblower speed), and to the need for efficient online fouling monitoring
systems to identify fouled regions for targeted sootblowing. The situation is better in the
126
generating bank and economizer sections, because the tube spacing is small and the jet will
interact with the deposit more frequently than in the superheater.
However, the close spacing affects sootblower jet strength (peak impact pressure, PIP)
and penetration between generating bank and economizer tubes. A jet flows unaffected between
superheater platens. The centreline PIP of a jet between generating bank tubes decreases relative
to that of a free jet from the second tube onwards (x/de = 11.4), due to interaction with tube
surfaces and Coanda-induced re-entrainment. This phenomenon decreases the PIP in both the
supersonic and subsonic portions of the jet. For the same spacing between rows of tubes, the
centreline PIP of a jet between finned economizer tubes also decreases, but at a greater distance
from the nozzle (x/de = 18) compared to that in a generating bank. Essentially, a jet is stronger
and penetrates deeper in a tube arrangement consisting of tubes with fins, than in an arrangement
with finless tubes as the fins restrict the entrainment and spreading of the jet.

CHAPTER 7
SCHLIEREN VISUALIZATION OF
SYNTHETIC DEPOSIT BREAKUP BY JET
IMPINGEMENT
The interaction of a supersonic jet with a single tube, as well as model recovery boiler tube
arrangements, was described in previous chapters, and was visualized using the schlieren
technique. The next logical step in this work is a study of the interaction between a supersonic jet
and a deposit, using the schlieren technique. This chapter presents the results of a preliminary
investigation of this interaction.
An experiment was performed in which a synthetic deposit was formed on a tube and
impinged by a supersonic jet, and the resulting breakup of the deposit was visualized using the
schlieren technique. Whereas previous studies of deposit breakup by jet impingement [23, 24]
involved visualization of only the breakup of the deposit, this experiment involved visualization
of both the deposit and the jet. This chapter first describes the synthetic deposit used in the
experiment and the experimental procedure, and then presents schlieren images of the deposit
breakup.
127
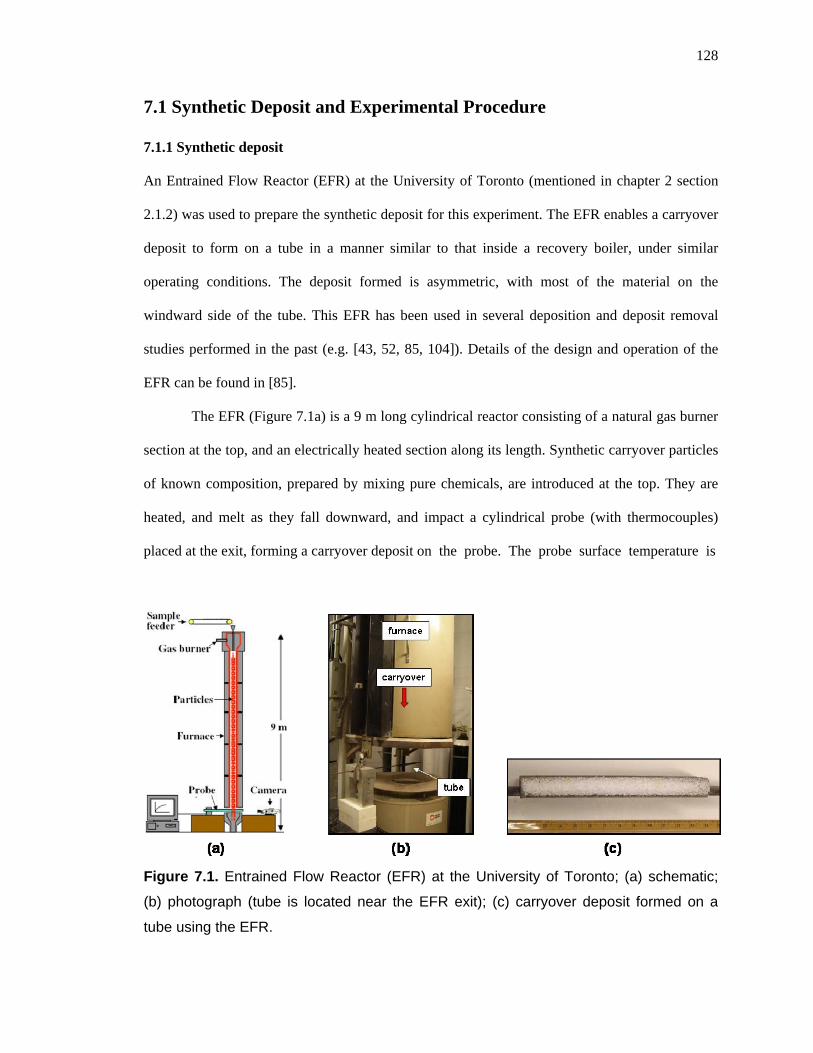
128
7.1 Synthetic Deposit and Experimental Procedure
7.1.1 Synthetic deposit
An Entrained Flow Reactor (EFR) at the University of Toronto (mentioned in chapter 2 section
2.1.2) was used to prepare the synthetic deposit for this experiment. The EFR enables a carryover
deposit to form on a tube in a manner similar to that inside a recovery boiler, under similar
operating conditions. The deposit formed is asymmetric, with most of the material on the
windward side of the tube. This EFR has been used in several deposition and deposit removal
studies performed in the past (e.g. [43, 52, 85, 104]). Details of the design and operation of the
EFR can be found in [85].
The EFR (Figure 7.1a) is a 9 m long cylindrical reactor consisting of a natural gas burner
section at the top, and an electrically heated section along its length. Synthetic carryover particles
of known composition, prepared by mixing pure chemicals, are introduced at the top. They are
heated, and melt as they fall downward, and impact a cylindrical probe (with thermocouples)
placed at the exit, forming a carryover deposit on the probe. The probe surface temperature is
Figure 7.1. Entrained Flow Reactor (EFR) at the University of Toronto; (a) schematic;
(b) photograph (tube is located near the EFR exit); (c) carryover deposit formed on a
tube using the EFR.
129
controlled by a regulated flow of air through it [52]. Depending on operating conditions including
particle chemical composition, size and temperature, combustion gas temperature and velocity,
and probe surface temperature, different types of deposits can be formed on the probe (thin/thick,
hard/soft, etc.).
In the present experiment, synthetic carryover particles were made by mixing pure
sodium chloride (NaCl) and sodium sulphate (Na2SO4) salts in a 1:10.9 ratio by weight,
respectively. The particle chemical composition was selected such that the synthetic particles
yielded carryover particles with 10 mol% Cl, which was more than sufficient to make them sticky
and form a reasonably thick deposit on the tube. This mixture of salts was melted, cooled, ground,
and sieved into a 150-300 m range. These particles were then introduced into the EFR, and a ¼
scale tube of 13 mm (0.5”) OD was mounted near the EFR exit (Figure 7.1b). The deposit (Figure
7.1c) was approximately 2 mm thick at its thickest part, with thickness decreasing along the tube
circumference away from this point. The EFR was operated at a temperature of 800°C at
atmospheric pressure. Based on the gas flow rate, the gas velocity was approximately 1.8 m/s.
The tube surface temperature was around 500°C.
7.1.2 Experimental procedure
The main objective of this experiment was to observe the breakup of a deposit impinged by a
supersonic jet using the schlieren technique, and understand the breakup mechanism as well as
the behaviour of the broken deposit particles. For this, a deposit strength was required that could
be broken by the jet. Consequently, after the deposition was complete in the manner described
above, the deposit was subjected to a thermal shock by quickly removing the tube from the hot
exit region of the EFR, into the relatively cool ambient surroundings (20°C). Then the tube was
fixed on the same adjustable stands used in the previous schlieren experiments, so that the jet
could be directed at the deposit at zero offset. The tube was located 50 mm away from the nozzle
130
exit. The jet was then impinged head-on on the thickest part of the deposit, and the resulting
breakup was captured using the schlieren system.
7.2 Deposit Breakup Images
Figure 7.2 shows the breakup of the synthetic deposit upon jet impingement. Time t=0 is
arbitrarily assigned. In some instances, very small broken deposit particles may be difficult to
distinguish from the turbulence in the flow field. This is because the field-of-view was much
larger than those particles to enable capture of the breakup of the entire deposit and the
trajectories of the broken particles. Moreover, the light source used in the schlieren system
limited the maximum achievable illumination. It should also be noted that the images in Figure
7.2 only capture the motion of the particles in the plane of the images, whereas the particles
actually travel in all three dimensions. As a result, most of the particles captured in the images are
also travelling out of the plane of the images. Despite these issues, the following phenomena
during breakup were clearly observed in the breakup movie, and Figure 7.2 presents schlieren
images derived from the movie.
(1) Even before the jet develops fully and reaches steady state, that is, before it attains maximum
strength, the jet starts eroding the surface of the deposit. Very small particles are removed
from the surface by the flow. This may be because the deposit is thin, and was weakened by
the thermal shock.
(2) Secondary jets form even during the interaction of the primary jet with a deposit (image c
onwards), because the effective de/D does not increase much due to the deposit thickness; the
roughness of the deposit surface does not influence the formation of the secondary jets,
although it will influence their turbulence characteristics. Images d-f show that the particles
eroded from the deposit surface are entrained by the secondary jets.
(3) After a certain amount of deposit has been eroded off by the jet in the form of small particles,
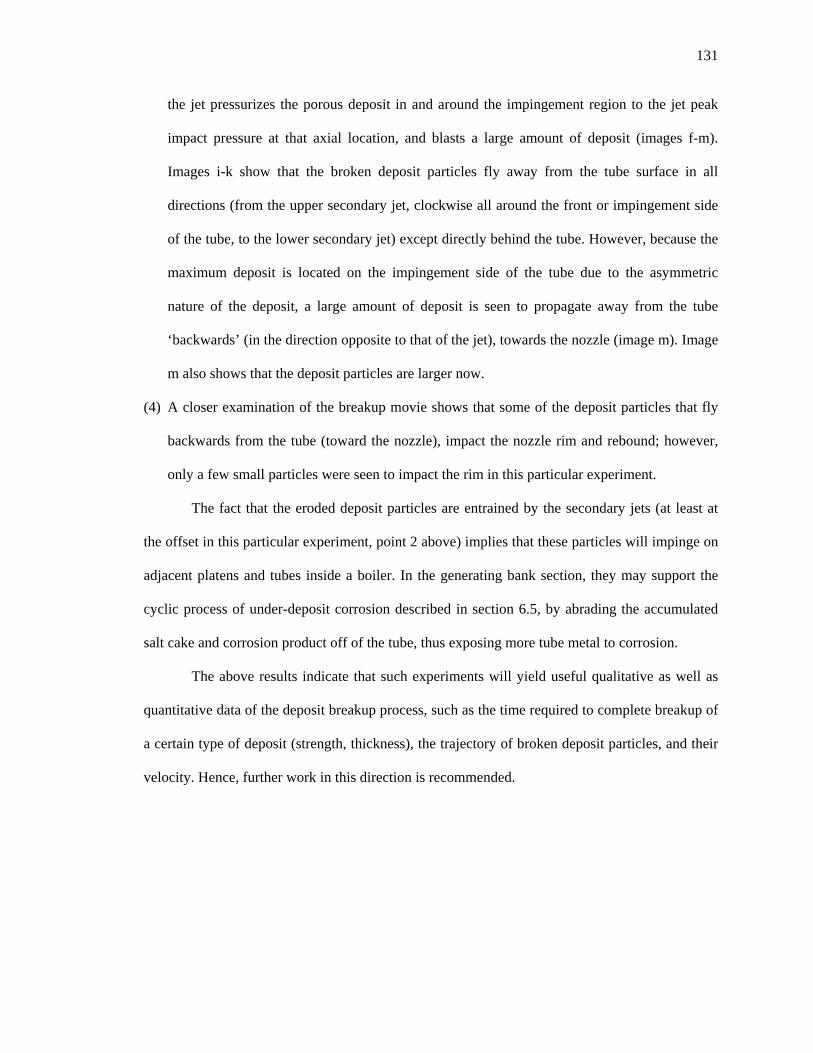
131
the jet pressurizes the porous deposit in and around the impingement region to the jet peak
impact pressure at that axial location, and blasts a large amount of deposit (images f-m).
Images i-k show that the broken deposit particles fly away from the tube surface in all
directions (from the upper secondary jet, clockwise all around the front or impingement side
of the tube, to the lower secondary jet) except directly behind the tube. However, because the
maximum deposit is located on the impingement side of the tube due to the asymmetric
nature of the deposit, a large amount of deposit is seen to propagate away from the tube
‘backwards’ (in the direction opposite to that of the jet), towards the nozzle (image m). Image
m also shows that the deposit particles are larger now.
(4) A closer examination of the breakup movie shows that some of the deposit particles that fly
backwards from the tube (toward the nozzle), impact the nozzle rim and rebound; however,
only a few small particles were seen to impact the rim in this particular experiment.
The fact that the eroded deposit particles are entrained by the secondary jets (at least at
the offset in this particular experiment, point 2 above) implies that these particles will impinge on
adjacent platens and tubes inside a boiler. In the generating bank section, they may support the
cyclic process of under-deposit corrosion described in section 6.5, by abrading the accumulated
salt cake and corrosion product off of the tube, thus exposing more tube metal to corrosion.
The above results indicate that such experiments will yield useful qualitative as well as
quantitative data of the deposit breakup process, such as the time required to complete breakup of
a certain type of deposit (strength, thickness), the trajectory of broken deposit particles, and their
velocity. Hence, further work in this direction is recommended.
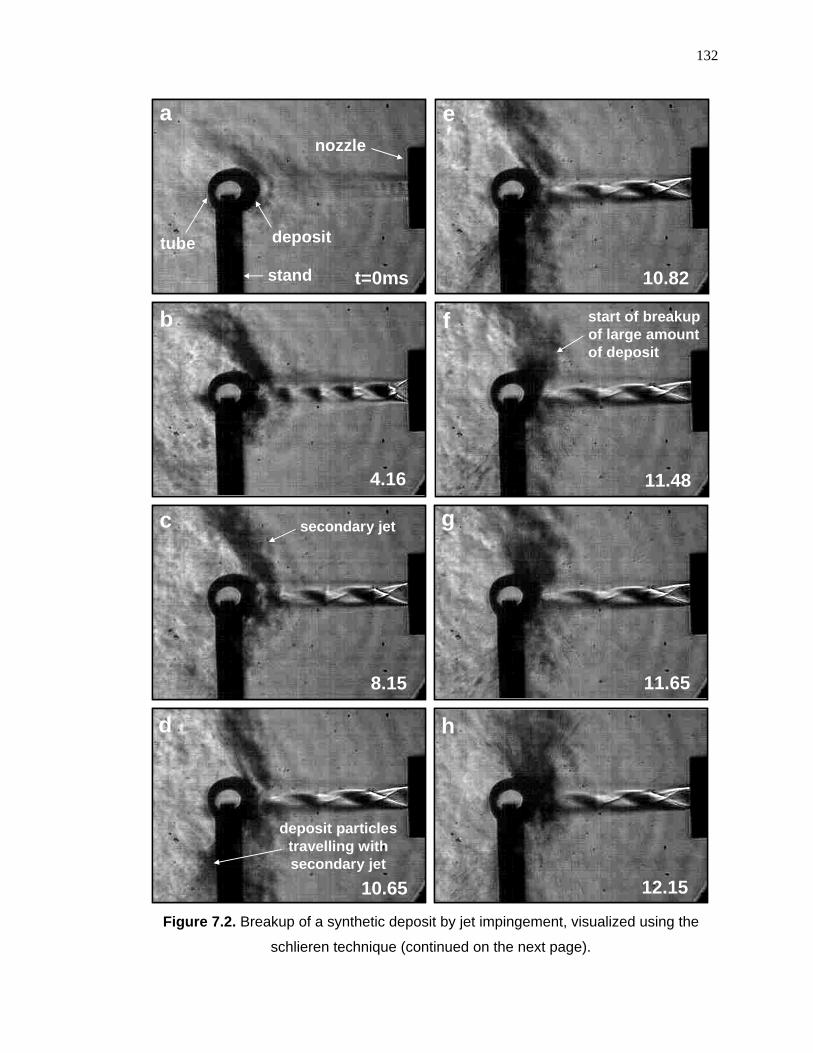
132
nozzle
tube deposit
stand
a
b
c
d
e
f
g
h
t=0ms
4.16
8.15
10.65
10.82
11.48
11.65
12.15
deposit particles travelling with secondary jet
Figure 7.2. Breakup of a synthetic deposit by jet impingement, visualized using the
schlieren technique (continued on the next page).
secondary jet
start of breakup of large amount of deposit
nozzle
tube deposit
stand
a
b
c
d
e
f
g
h
t=0ms
4.16
8.15
10.65
10.82
11.48
11.65
12.15
deposit particles travelling with secondary jet
secondary jet
start of breakup of large amount of deposit
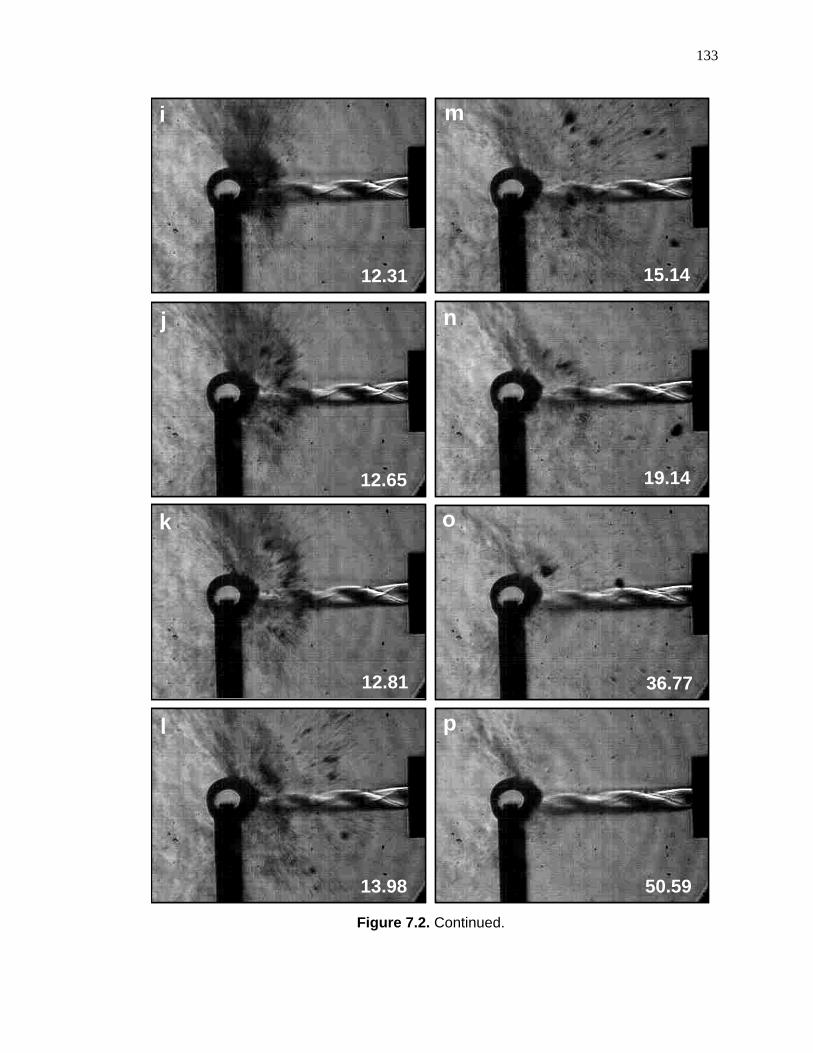
133
15.14
19.14
36.77
50.59
12.31
12.65
12.81
13.98
i
j
k
l
m
n
o
p
15.14
19.14
36.77
50.59
12.31
12.65
12.81
13.98
i
j
k
l
m
n
o
p
Figure 7.2. Continued.
CHAPTER 8
FEASIBILITY OF USING INCLINED
SOOTBLOWER NOZZLES IN RECOVERY
BOILER SUPERHEATERS
As illustrated in Figure 1.4 in chapter 1, sootblower nozzles currently used in recovery boilers are
oriented normal to the sootblower lance, and the sootblower jets exert a force that tends to push
deposits against the tubes. The resulting stresses induced by normal jet impingement are unlikely
sufficient to break strong deposits. Moreover, jets from straight nozzles travel parallel to the
platens, and cannot impinge directly on the deposits clinging to the platen sides. Only secondary
jets are directed at these deposits at an angle whenever the primary jet impinges on the first tube
of an adjacent platen. However, even the strongest of the secondary jets becomes very weak when
it reaches an adjacent platen. This can be seen in Figure 8.1, which shows the centreline peak
impact pressure of the primary and secondary jets. The figure presents the same data as Figure
6.17, but in one plot.
If a sootblower nozzle were inclined at some angle , relative to the lance as shown in
Figure 8.2a, then a component of the jet force would act normal to the platen centerline and exert
a debonding force (and moment) on a deposit. An inclined nozzle would also yield a jet that
impinged more directly on deposits accumulated on the sides of platens. Its centerline PIP would
134
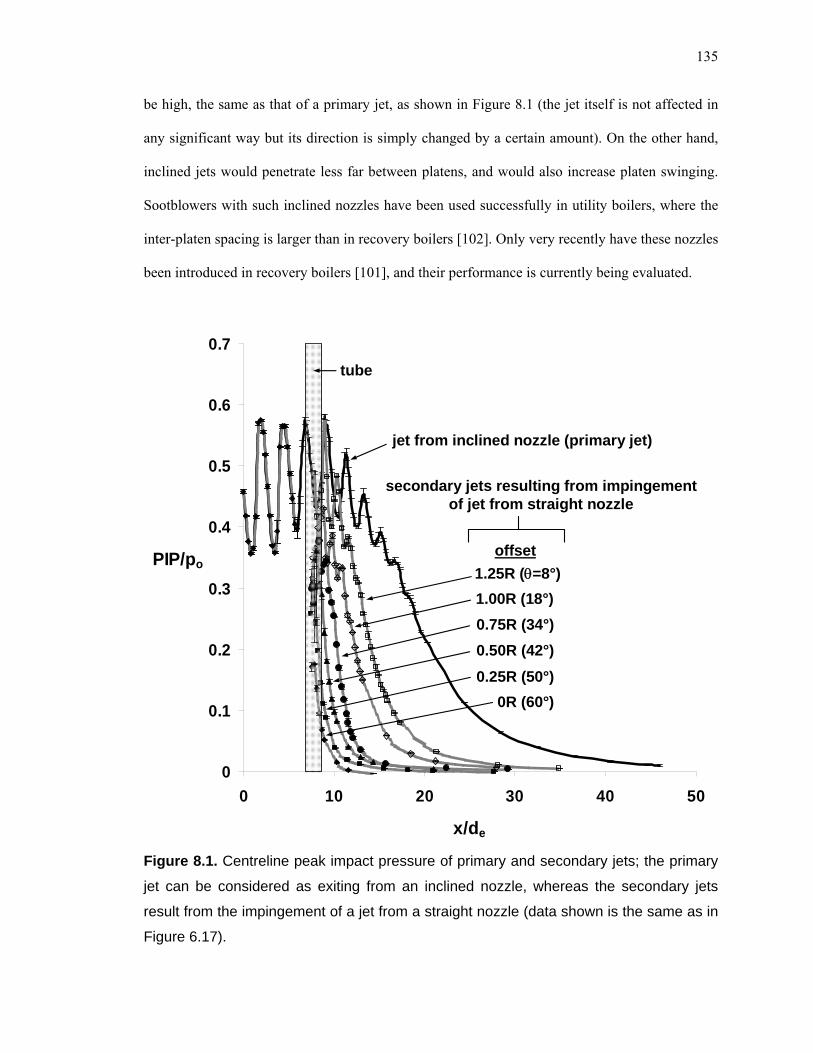
135
be high, the same as that of a primary jet, as shown in Figure 8.1 (the jet itself is not affected in
any significant way but its direction is simply changed by a certain amount). On the other hand,
inclined jets would penetrate less far between platens, and would also increase platen swinging.
Sootblowers with such inclined nozzles have been used successfully in utility boilers, where the
inter-platen spacing is larger than in recovery boilers [102]. Only very recently have these nozzles
been introduced in recovery boilers [101], and their performance is currently being evaluated.
Figure 8.1. Centreline peak impact pressure of primary and secondary jets; the primary
jet can be considered as exiting from an inclined nozzle, whereas the secondary jets
result from the impingement of a jet from a straight nozzle (data shown is the same as in
Figure 6.17).
0
0.1
0.2
0.3
0.4
0.5
0.6
0.7
0 10 20 30 40 50
x/de
PIP/po
jet from inclined nozzle (primary jet)
secondary jets resulting from impingement of jet from straight nozzle
tube
1.25R (=8°)
1.00R (18°)
offset
0.75R (34°)
0.50R (42°)
0R (60°)
0.25R (50°)
0
0.1
0.2
0.3
0.4
0.5
0.6
0.7
0 10 20 30 40 50
x/de
PIP/po
jet from inclined nozzle (primary jet)
secondary jets resulting from impingement of jet from straight nozzle
tube
1.25R (=8°)
offset
1.00R (18°)
0.75R (34°)
0.50R (42°)
0R (60°)
0.25R (50°)
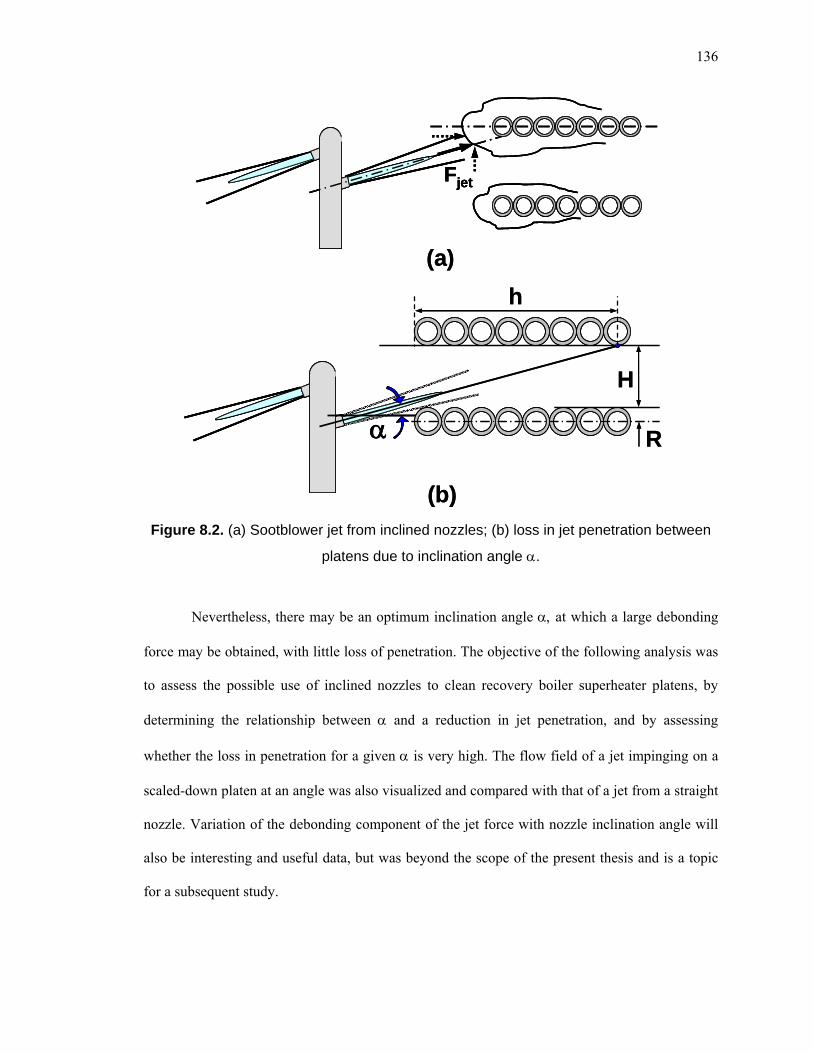
136
Fjet
Figure 8.2. (a) Sootblower jet from inclined nozzles; (b) loss in jet penetration between
platens due to inclination angle .
Nevertheless, there may be an optimum inclination angle at which a large debonding
force may be obtained, with little loss of penetration. The objective of the following analysis was
to assess the possible use of inclined nozzles to clean recovery boiler superheater platens, by
determining the relationship between and a reduction in jet penetration, and by assessing
whether the loss in penetration for a given is very high. The flow field of a jet impinging on a
scaled-down platen at an angle was also visualized and compared with that of a jet from a straight
nozzle. Variation of the debonding component of the jet force with nozzle inclination angle will
also be interesting and useful data, but was beyond the scope of the present thesis and is a topic
for a subsequent study.
(a)
FjetFjet
(a)
H
R
h
(b)
H
R
h
(b)
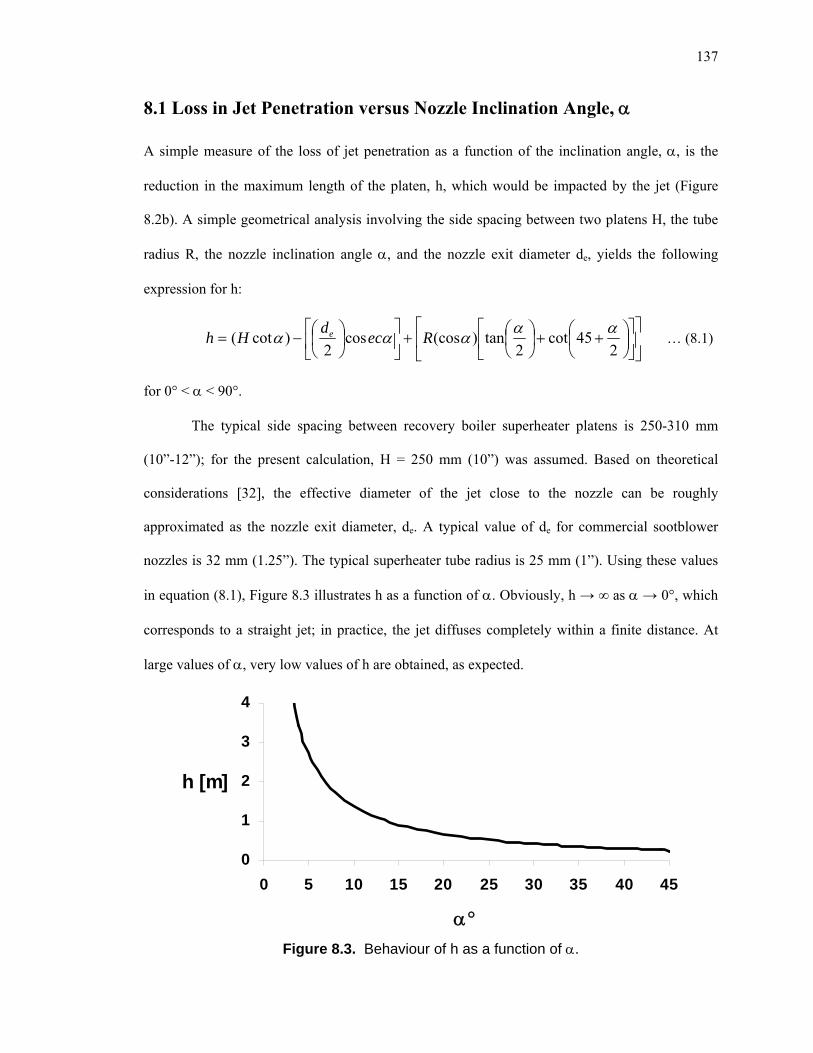
137
8.1 Loss in Jet Penetration versus Nozzle Inclination Angle,
A simple measure of the loss of jet penetration as a function of the inclination angle, , is the
reduction in the maximum length of the platen, h, which would be impacted by the jet (Figure
8.2b). A simple geometrical analysis involving the side spacing between two platens H, the tube
radius R, the nozzle inclination angle , and the nozzle exit diameter de, yields the following
expression for h:
245cot
2tan)(coscos
2)cot(
Recd
Hh e … (8.1)
for 0° < < 90°.
The typical side spacing between recovery boiler superheater platens is 250-310 mm
(10”-12”); for the present calculation, H = 250 mm (10”) was assumed. Based on theoretical
considerations [32], the effective diameter of the jet close to the nozzle can be roughly
approximated as the nozzle exit diameter, de. A typical value of de for commercial sootblower
nozzles is 32 mm (1.25”). The typical superheater tube radius is 25 mm (1”). Using these values
in equation (8.1), Figure 8.3 illustrates h as a function of . Obviously, h → ∞ as → 0°, which
corresponds to a straight jet; in practice, the jet diffuses completely within a finite distance. At
large values of , very low values of h are obtained, as expected.
0
1
2
3
4
0 5 10 15 20 25 30 35 40 45
h [m]
Figure 8.3. Behaviour of h as a function of .
138
The typical length of a superheater platen in a recovery boiler is about 1.5 m. Since
sootblowers are operated from both sides of a platen, the required cleaning radius for a
sootblower can be considered as half of the platen length or 750 mm. Figure 8.3 shows that there
is a range of that yields a penetration depth h of this length. Using equation (8.1), h = 750 mm
corresponds to ≈ 17°. Thus, it seems feasible to use a 17° inclination to exert greater debonding
force on deposits, yet still clean half of a platen, without affecting the jet cleaning power or peak
impact pressure. The results imply that the loss in jet penetration is not a serious issue, and using
slightly inclined nozzles to clean superheater platens more effectively may be possible.
8.2 Schlieren Visualization of Inclined Jet Impingement
The schlieren technique was used for a preliminary investigation of the flow field of an impinging
inclined jet. Experiments similar to those described in chapter 6 section 6.1.1 were performed
using the same apparatus, in which a supersonic jet was directed at a model superheater platen. In
the experiments, the platen position was adjusted, rather than the nozzle orientation, to achieve
different inclination angles. At each inclination angle, the jet was impinged on the platen at
different offsets.
Schlieren images of the interaction are presented in Figure 8.4 with the flow from right to
left. Compared to the interaction at 0 (Figure 8.4a, offset = 10 mm), the jet/platen interaction
at 9 and 13 is more direct, but also more complicated. Due to inclination, the jet impinges more
directly on the side of the platen. It is believed that the impingement of the jet at an angle will be
beneficial for deposit removal, for two reasons.
First, as mentioned in section 2.5.2, the maximum pressure applied on a flat surface by a
supersonic jet impinging on that surface at an angle, is higher than that exerted by the same jet on
the surface when the jet is perpendicular to the surface. This effect exists when the surface is
close to the nozzle, mainly in the supersonic portion of the jet not much affected by turbulence.
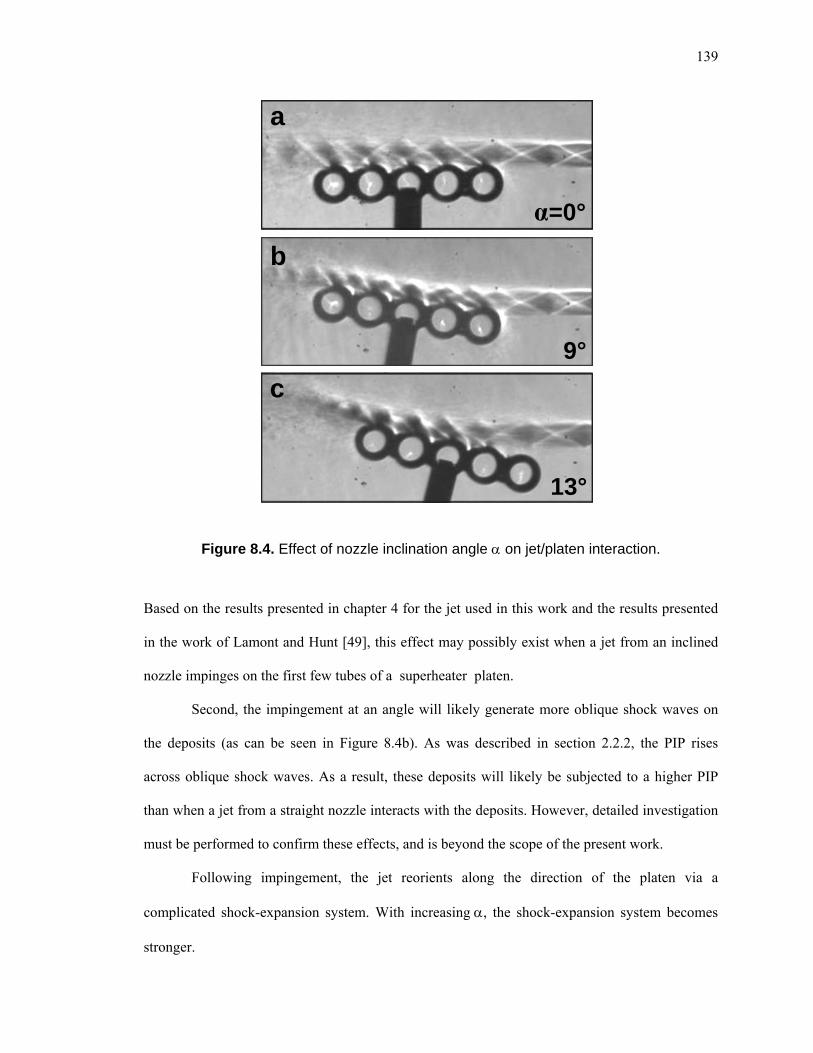
139
a
α=0°
a
α=0°
b
9°
b
9°
c
13°
c
13°
Figure 8.4. Effect of nozzle inclination angle on jet/platen interaction.
Based on the results presented in chapter 4 for the jet used in this work and the results presented
in the work of Lamont and Hunt [49], this effect may possibly exist when a jet from an inclined
nozzle impinges on the first few tubes of a superheater platen.
Second, the impingement at an angle will likely generate more oblique shock waves on
the deposits (as can be seen in Figure 8.4b). As was described in section 2.2.2, the PIP rises
across oblique shock waves. As a result, these deposits will likely be subjected to a higher PIP
than when a jet from a straight nozzle interacts with the deposits. However, detailed investigation
must be performed to confirm these effects, and is beyond the scope of the present work.
Following impingement, the jet reorients along the direction of the platen via a
complicated shock-expansion system. With increasing, the shock-expansion system becomes
stronger.
CHAPTER 9
CONCLUSIONS, CONTRIBUTIONS, AND
RECOMMENDATIONS
9.1 Conclusions and Practical Implications
Interaction between a jet and a single tube
Upon impingement on a tube, a supersonic ‘primary’ jet deflects at an angle, forming a weaker
‘secondary’ jet. The angle and strength of the secondary jet depend on the position of the primary
jet (centreline) relative to the position of the tube (centreline), that is, on the offset. As the jet
centreline moves away from the tube centreline, jet/tube interaction weakens, and the secondary
jet becomes stronger. Once the primary jet is a small distance away from the tube, interaction
between the jet and the tube ceases.
The secondary jet that forms during jet/tube interaction spreads out much more compared
to the primary jet, and is fan-like or sheet-like. Secondary jets do not form at small offsets for
tubes larger than the jet; the flow remains attached to the tube.
The results imply that during sootblowing, secondary jets will always form when the
sootblower jet impinges on the first tube of a platen or row of tubes. So long as secondary jets
form, there will be little or no sootblower jet flow at all beyond the first few tubes in that platen
or row.
140

141
Interaction between a jet and tube arrangements
Experiments with model superheater platens showed that due to the very low spreading rate of a
supersonic jet, the primary jet stops interacting with a platen when the jet is only a small distance
(offset) away from it. Thus, deposits clinging to the side of a superheater platen are not exposed
to the sootblower jet once the jet is beyond this distance from the deposit layer. The jet must be
directed close to the platens to yield useful jet/deposit interactions. Continuous sootblowing
between platens is justified only if large deposits significantly block the space between the
platens. Due to the large spacing, a secondary jet will not be of any use in removing deposit from
an adjacent platen, due to its small core length.
A jet between generating bank tubes becomes weaker than a free jet, because of
interaction with tubes and increased mixing caused by Coanda-induced re-entrainment around the
tubes. The centreline peak impact pressure begins to decrease in the core region of the jet.
Consequently, deposits beyond the first few tubes of a row experience a weaker sootblower jet,
and thus may not be removed effectively. Due to the close tube spacing, secondary jets can
impinge on tubes in adjacent rows. PIP measurements of these secondary jets showed that the PIP
exerted is not negligible. These jets may break and remove weak deposits clinging to adjacent
tubes or accumulated between them. However, this impingement may also cause tube erosion and
corrosion due to entrainment of pieces of deposit. These results are consistent with industry
experience of generating bank tube corrosion.
A jet between finned economizer tubes also decays more quickly than a free jet, but is
stronger than the same jet in the generating bank. The strength (centreline peak impact pressure)
and hence, the deposit removal capability of the jet diminish only slightly beyond the supersonic
portion of the jet. This is because the fins restrict the entrainment and spreading of the jet. As in a
generating bank, secondary jets impinge on adjacent rows of economizer tubes due to the much
closer tube spacing, and may help remove deposits accumulated on those tubes.

142
From the point of view of experimentation, results obtained using the model superheater
platens showed that building scaled-down platens did not provide any striking new information
compared to that obtained from experiments with a single tube. As a result, any further
experiments on sootblower jet flow in the superheater section should take this into account.
Feasibility of inclined sootblower nozzles to clean superheater platens
A mathematical model was developed to study the effect of jet inclination angle on the loss in jet
penetration between kraft recovery boiler superheater platens. The model suggests that the loss in
penetration is not a serious issue, and using slightly inclined nozzles to clean superheater platens
more effectively may be possible. Visualization of a jet impinging on a platen at an angle showed
the interaction to be more direct, but also more complicated than that due to a straight jet.
Schlieren visualization of synthetic deposit breakup by jet impingement
A preliminary experiment was conducted to visualize the breakup of a synthetic deposit using the
schlieren technique. The experiment showed several interesting phenomena during breakup.
Similar experiments will yield further insight into the deposit breakup process during
sootblowing, and research in this direction is recommended.
9.2 Contributions of this Work
The main contributions of this work are the following.
1. The most important contribution is that it has characterized sootblower jet flow inside a
recovery boiler, and determined how the interaction of both the primary and secondary jets
with tubes is affected in the different sections of the boiler, especially by the tube spacing.
This has shed light on how the primary jet’s deposit removal capability may be affected in
those sections. Such an extensive visualization study of jet/tube interaction has been carried
143
out for the first time through this work, yielding valuable insight into sootblower jet flow.
This work also opens doors to new opportunities for research related to sootblowing
optimization, development of advanced sootblowers, and possible sootblower-related erosion
and corrosion.
2. This work is one of the first studies to investigate the fundamental interaction between a
supersonic jet and a cylinder. The effects of most of the important parameters governing this
interaction were studied in this work. Moreover, this work is the first to examine the
behaviour and strength of secondary jets that form when a supersonic primary jet impinges on
a cylinder. Since secondary jets form during sootblowing, this work has provided secondary
jet peak impact pressure data that can be used by boiler manufacturers to design their tube
arrangements taking sootblowing into account.
3. Interaction between a supersonic jet and a finned tube has been studied for the first time. This
study is appropriate and has been conducted at the right time because finned tubes are
commonly used in modern industrial boilers.
4. This work has shown that continuous sootblowing between superheater platens is justified
only when large deposits block the passages between platens; otherwise, that steam is simply
wasted. This work highlights the need for research to minimize this wasteful consumption of
steam, and also to develop methods to monitor and locate fouling online, so that sootblowing
may be performed optimally.
5. This work sheds light on the generating bank tube corrosion problems affecting boiler
operation in many North American pulp mills.
6. Until now, inclined sootblower nozzles have been used mainly in coal-fired utility boilers due
to the large spacing between superheater platens. Such nozzles have been introduced in kraft
recovery boilers only very recently, and are currently being evaluated. This work has shown
that the loss in jet penetration between platens due to these nozzles is not a big issue, and that
144
these nozzles can be used in kraft recovery boiler superheaters to remove large deposits from
leading tubes more effectively.
7. From the point of view of experimentation, this work has shown that building scaled-down
platens to study jet/tube interaction with superheater platens does not yield any new
information compared to that obtained using only a single tube, unless, for example the effect
of platen swinging on jet structure and strength needs to be determined. As a result, any
further experiments should take this into account. Such experiments could possibly use only
one tube, saving considerable time and cost.
9.3 Recommendations for Future Work
The following are recommendations for future work related to sootblowing optimization.
1. A detailed study of deposit breakup using the schlieren technique (the experiment described
in chapter 7 of this thesis) is strongly recommended. Firstly, such a study will shed light on
how deposits are broken and removed by a sootblower jet inside a boiler. Secondly, it will
provide information about the trajectories of broken deposit particles and their velocities.
2. Artificial deposit breakup experiments should be performed to determine the exposure time
required for a supersonic jet of given strength to break a deposit of given strength and
thickness.
3. Emami [21] developed a computational fluid dynamics (CFD) model to accurately simulate
sootblower jets and their interaction with tubes. This model should be used in conjunction
with a finite element analysis (FEA) program to determine the stresses and stress distributions
created in a typical deposit by a supersonic jet impinging on that deposit.
4. Finally, as mentioned in section 6.5, the inability of mills to monitor and locate fouling on-
line is a key bottleneck to optimizing sootblowing. There is a strong need for such methods,
and further research should be carried out in this direction.

REFERENCES
[1] Abramovich, G. N., The Theory of Turbulent Jets, Chapter 1, MIT Press, 1963.
[2] Adams, T. N., “Chapter 1 - General Characteristics of Kraft Black Liquor Recovery Boilers”. In Adams, T.N. (Ed.), Kraft Recovery Boilers, TAPPI Press, 1997.
[3] Adams, T. N., “Sootblowing Control Based on Measured Local Fouling Rate”, Proceedings, 2010 TAPPI PEERS & 9th Research on Recycling Forum, Norfolk, VA, Oct. 17-21, 2010.
[4] Adamson, T. C. and Nicholls, J. A., “On the structure of jets from highly underexpanded nozzles into still air”, Journal of the Aerospace Sciences, 26, p. 16, 1959.
[5] Anderson, J. D., Modern Compressible Flow: With Historical Perspective, 3rd ed., Chapter 1, McGraw Hill, 2003.
[6] Avduevskii, V. S., Ivanov, A. V., Karpman, I. M., Traskovskii, V. D. and Yudelovich, M. Ya., “Flow in Supersonic Viscous Underexpanded Jet”, Mekhanika Zhidkosti i Gaza, 5(3), pp. 63-69, 1970.
[7] Backman, R., Hupa, M. and Uppstu, “Fouling and corrosion mechanisms in recovery boiler superheater area”, TAPPI Journal, 70(6), pp. 123-127, 1987.
[8] Barsin, J. A., “Recovery Boiler Sootblowers”, TAPPI Kraft Recovery Operations Short Course, TAPPI Press, pp. 219-227, 1992.
[9] Baxter, L. L., Abbott, M. F. and Douglas, R. E., “Dependence of Elemental Ash Deposit Composition on Coal Ash Chemistry and Combustor Environment”. In S. A. Benson (Ed.), Inorganic Transformations and Ash Deposition during Combustion, Engineering Foundation Meeting, Palm Coast, FL, pp. 679-698, 1991.
[10] Brahma, R. K., Faruque, O. and Arora, R. C., “Experimental investigation of mean flow characteristics of slot jet impingement on a cylinder”, Wärme- und Stoffübertragung, 26, pp. 257-263, 1991.
[11] Brankovic, A., Ryder, R. C. Jr., Hendricks, R. C., Liu, N., Gallagher, J. R., Shouse, D. T., Roquemore, W. M., Cooper, C. S., Burrus, D. L. and Hendricks, J. A., “Measurement and Computation of Supersonic Flow in a Lobed Diffuser-Mixer for Trapped Vortex Combustors”, NASA TM - 2002-211127, 2002.
[12] Brown, C., “Effect of SO2 on Deposit Removal in Kraft Recovery Boilers”, MASc thesis, Dept. of Chemical Engineering and Applied Chemistry, University of Toronto, Canada, 2005.
[13] Brown, G. L. and Roshko, A., “On density effects and large structures in turbulent mixing layers”, Journal of Fluid Mechanics, 64, pp. 775-781, 1974.
145

146
[14] Bryer, D. W. and Pankhurst, R. C., Pressure-probe Methods for Determining Wind Speed and Flow Direction, H. M. S. O., London, 1971.
[15] Carling, J. C. and Hunt, B. L., “The near wall jet of a normally impinging, uniform, axisymmetric, supersonic jet”, Journal of Fluid Mechanics, 66, part 1, pp. 159-176, 1974.
[16] Crist, S., Sherman, P. M. and Glass, D. R., “Study of the Highly Underexpanded Sonic Jet”, AIAA Journal, 4(1), pp. 68-71, 1966.
[17] Derbeneva, L. I., Kurshakov, M. Yu., Tillyaeva, N. I. and Shishkin, Yu. N., “Solution of the Problem of Interaction between a Supersonic Jet and an Obstacle of Finite Dimensions”, Mekhanika Zhidkosti i Gaza, 5, pp. 179-184, 1986.
[18] Donaldson, C. D. and Snedeker, R. S., “A study of free jet impingement. Part 1. Mean properties of free and impinging jets”, Journal of Fluid Mechanics, 45, part 2, pp. 281-319, 1971.
[19] Ebrahimi-Sabet, A., “A Laboratory Study of Deposit Removal by Debonding and Its Application to Fireside Deposits in Kraft Recovery Boilers”, PhD thesis, Dept. of Chemical Engineering and Applied Chemistry, University of Toronto, 2001.
[20] Eggers, J. M., “Velocity Profiles and Eddy Viscosity Distributions Downstream of a Mach 2.22 Nozzle Exhausting to Quiescent Air”, NASA TN D-3601, 1966.
[21] Emami, B., “Numerical Simulation of Kraft Recovery Boiler Sootblower Jets”, PhD thesis, Dept. of Mechanical and Industrial Engineering, University of Toronto, 2009.
[22] Erickson, T. A., Allan, S. E., McCollor, D. P., Hurley, J. P., Srinivasachar, S., Kang, S. G., Baker, J. E., Morgan, M. E., Johnson, S. A. and Borio, R., “Modeling of fouling and slagging in coal-fired utility boilers”, Journal of Fuel Processing and Technology, 44, pp. 155-171, 1995.
[23] Eslamian, M., Pophali, A., Bussmann, M. and Tran, H. N., “Breakup of brittle deposits by supersonic air jet: The effects of varying jet and deposit characteristics”, International Journal of Impact Engineering, 36(2), pp. 199-209, 2009.
[24] Eslamian, M., Pophali, A., Bussmann, M., Cormack, D. E. and Tran, H. N., “Failure of Cylindrical Brittle Deposits Impacted by a Supersonic Air Jet”, ASME Journal of Engineering Materials and Technology, 130(3), pp. 031002-1-7, 2008.
[25] Ewan, B. C. R. and Moodie, K., “Structure and Velocity Measurements in Underexpanded Jets”, Combustion Science and Technology, 45, pp. 275-288, 1986.
[26] Foster, C. R. and Cowles, F. B., “Experimental Study of Gas-flow Separation in Overexpanded Exhaust Nozzles for Rocket Motors”, Progress report no. 4-103, Jet Propulsion Laboratory, California Institute of Technology, 1949.
[27] Goto, Y., Nonomura, T., McIlroy, K. and Fujii, K., “Detailed Analysis of Flat Plate Pressure Peaks Created by Supersonic Jet Impingements”, AIAA paper 2009-1289, 2009.
147
[28] Graham, W. J. and Davis, B. M., “The Change of Pitot Pressure across Oblique Shock Waves in a Perfect Gas”, Aeronautical Research Council, C. P. No. 783, Ministry of Aviation, H. M. S. O., London, 1965; (downloaded from: aerade.cranfield.ac.uk/ara/arc/cp/0783.pdf on Mar. 1, 2011).
[29] ImageJ - http://rsbweb.nih.gov/ij/ (as of Mar. 1, 2011).
[30] Isaak, P., Tran, H. N., Barham, D. and Reeve, D. W., “Stickiness of Fireside Deposits in Kraft Recovery Units”, Journal of Pulp und Paper Science, 12(3), pp. J84-88, 1986.
[31] Ishii, R., Fujimoto, H., Hatta, N. and Umeda, Y., “Experimental and numerical analysis of circular pulse jets”, Journal of Fluid Mechanics, 392, pp. 129-153, 1999.
[32] Jameel, M.I., Cormack, D.E., Tran, H.N. and Moskal, T.E., “Sootblower Optimization Part I: Fundamental hydrodynamics of a sootblower nozzle and jet”, TAPPI Journal, 77(5), pp. 135-142, 1994.
[33] Jenkins, B. M., Baxter, L. L., Miles Jr., T. R. and Miles, T. R., “Combustion properties of biomass”, Journal of Fuel Processing and Technology, 54, pp. 17–46, 1998.
[34] Kalghatgi, G. T. and Hunt, B. L., “The Occurrence of Stagnation Bubbles in Supersonic Jet Impingement Flows”, Aeronautical Quarterly, 27, pp. 169-185, 1976.
[35] Kaliazine, A., Cormack, D.E., Ebrahimi-Sabet, A. and Tran, H.N., “The Mechanics of Deposit Removal in Kraft Recovery Boilers”, Journal of Pulp and Paper Science, 25(12), pp. 418-424, 1999.
[36] Kaliazine, A., Cormack, D. E., Tran, H. N. and Jameel, I., “Feasibility of Using Low Pressure Steam for Sootblowing”, Pulp & Paper Canada, 107(4), pp. 34-38, 2006.
[37] Kaliazine, A., Piroozmand, F., Cormack, D.E. and Tran, H.N., “Sootblower Optimization Part II: Deposit and sootblower interaction”, TAPPI Journal, 80(11), pp. 201-207, 1997.
[38] Kaliazine, A., Pophali, A. and Tran, H. N., "Thermal Effect of Sootblower Jets on Deposits", Proceedings, Annual Meeting of the Consortium on “Increasing Energy and Chemical Recovery Efficiency in the Kraft Pulping Process", University of Toronto, Canada, Nov. 2007.
[39] Kaliazine, A., Tandra, D. S., Cormack, D. E. and Tran, H. N., “Sootblower Jet Impact Pressure near Platen Surfaces”, Report no. 12, Proceedings, Annual Meeting of the Consortium on “Increasing the Throughput and Reliability of Recovery Boilers and Lime Kilns”, University of Toronto, Canada, Nov. 2003.
[40] Kaliazine, A., Tran, H.N. and Cormack, D.E., “Understanding Deposit Removal Process in Recovery Boilers”, Proceedings, TAPPI Engineering/Finishing & Converting Conference, San Antonio, TX, pp. 703-712, 2001.
[41] Katanoda, H., Handa, T., Miyazato, Y., Masuda, M. and Matsuo, K., “Effect of Reynolds Number on Pitot-Pressure Distributions in Underexpanded Supersonic Freejets”, Journal of Propulsion, 17(4): Technical Notes, pp. 940-942, 2001.
148
[42] Katanoda, H., Miyazato, Y., Masuda, M. and Matsuo, K., “Pitot pressures of correctly-expanded and underexpanded free jets from axisymmetric supersonic nozzles”, Shock Waves, 10, pp. 95-101, 2000.
[43] Khalajzadeh, A., Kuhn, D. C. S., Tran, H.N. and Wessel, R., “Composition of Carryover Particles in Recovery Boilers”, Journal of Pulp & Paper Science, 32(2), pp. 90-94, 2006.
[44] Kleinstein, G., “Mixing in Turbulent Axially Symmetric Free Jets”, Journal of Spacecraft and Rockets, 1(4), pp. 403-408, 1964.
[45] Krehl, P. and Engemann, S., “August Toepler - the first who visualized shock waves”, Shock Waves, 5, pp. 1-18, 1995.
[46] Krothapalli, A., Rajkuperan, E., Alvi, F. and Lourenco, L., “Flow field and noise characteristics of a supersonic impinging jet”, Journal of Fluid Mechanics, 392, pp. 155-181, 1999.
[47] Kweon, Y. -H., Miyazato, Y., Aoki, T., Kim, H. -D. and Setoguchi, T., “Experimental investigation of nozzle exit reflector effect on supersonic jet”, Shock Waves, 15, pp. 229-239, 2006.
[48] LabVIEW User Manual, National Instruments Corp., 2003.
[49] Lamont, P. J. and Hunt, B. L., “The Impingement of Underexpanded, Axisymmetric Jets on Perpendicular and Inclined Flat Plates,” Journal of Fluid Mechanics, 100, part 3, pp. 471–511, 1980.
[50] Lau, J. C., Morris, P. J. and Fisher, M. J., “Measurements in subsonic and supersonic free jets using a laser velocimeter”, Journal of Fluid Mechanics, 93, part 1, pp. 1-27, 1979.
[51] Love, E. S., Grigsby, C. E., Lee, L. P., and Woodling, M. J., “Experimental and Theoretical Studies of Axisymmetric Free Jets”, NASA TR R-6, 1959.
[52] Mao, X., Tran, H.N. and Cormack, D.E., “Effects of Chemical Composition on the Removability of Recovery Boiler Fireside Deposits”, TAPPI Journal, 84(6), p. 68, 2001.
[53] Mao, X., Tran, H. N., Kaliazine, A. and Cormack, D. E., “Effects of Deposit Forming and Jet Blowing Conditions on Deposit Removability”, Report no. 21, Proceedings, Annual Meeting of the Consortium on “Improving Recovery Boiler Performance, Emissions and Safety”, University of Toronto, Canada, Nov. 2000.
[54] “Model RKS Long Retractable Sootblower” brochure, Clyde Bergemann, Inc., Atlanta, 2005. Downloaded on Mar. 1, 2011 from: http://www.clydebergemann.com
[55] Nakai, Y., Fujimatsu, N. and Fujii, K., “Experimental Study of Underexpanded Supersonic Jet Impingement on an Inclined Flat Plate”, AIAA Journal, 44(11), pp. 2691-2699, 2006.
[56] Nishikawa, E., “Chapter 3 - General Planning of the Boiler Gas-side Heat Transfer
149
Surface”. In Ishigai, S. (Ed.), Steam Power Engineering: Thermal and Hydraulic Design Principles, Cambridge University Press, 1999.
[57] Norum, T. D. and Seiner, J. M., “Measurements of Mean Static Pressure and Far-Field Acoustics of Shock-Containing Supersoinc Jets”, NASA TM 84521, 1982.
[58] Pack, D. C., “A Note on Prandtl’s Formula for the Wave-length of a Supersonic Gas Jet”, Quarterly Journal of Mechanics and Applied Mathematics, 3(2), pp. 173-181, 1950.
[59] Pack, D. C., “On the Formation of Shock Waves in Supersonic Gas Jets (Two-dimensional Flow)”, Quarterly Journal of Mechanics and Applied Mathematics, 1(1), pp. 1-17, 1948.
[60] Panda, J. and Seasholtz, R. G., “Measurement of shock structure and shock-vortex interaction in underexpanded jets using Rayleigh scattering”, Physics of Fluids, 11(12), pp. 3761-3777, 1999.
[61] Panda, J., “An experimental investigation of screech noise generation”, Journal of Fluid Mechanics, 378, pp. 71-96, 1999.
[62] Papamoschou, D. and Johnson, A., “Unsteady Phenomena in Supersonic Nozzle Flow Separation”, AIAA paper 2006-3360, 2006.
[63] Papamoschou, D. and Roshko, A., “The compressible turbulent shear layer: an experimental study”, Journal of Fluid Mechanics, 197, pp. 453-477, 1988.
[64] Pinckney, S. Z., “Short Static-pressure Probe Design for Supersonic Flow”, NASA TN D-7978, 1975.
[65] Piroozmand, F., Tran, H. N., Kaliazine, A. and Cormack, D. E., “Strength Recovery Boiler Fireside Deposits at High Temperatures”, Proceedings, TAPPI Engineering Conference, Miami, FL, Sept. 13-17, 1998.
[66] Pophali, A., “Breakup Mechanisms of Brittle Deposits Impinged by a Supersonic Air Jet”, MASc thesis, Dept. of Chemical Engineering and Applied Chemistry, University of Toronto, Canada, 2008.
[67] Pophali, A., Bussmann, M. and Tran, H. N., “Visualizing the Interactions between a Sootblower Jet and a Superheater Platen”, Proceedings, International Chemical Recovery Conference, Williamsburg, VA, Mar. 29-Apr. 1, pp. 196-206, 2010.
[68] Pophali, A., Emami, B., Bussmann, M., and Tran, H. N., “Studies on Sootblower Jet Dynamics and Ash Deposit Removal in Industrial Boilers”, Journal of Fuel Processing and Technology (special ed.), accepted for publication, 2011.
[69] Pophali, A., Eslamian, M., Kaliazine, A., Bussmann, M. and Tran, H. N., “Breakup mechanisms of brittle deposits in kraft recovery boilers - a fundamental study”, TAPPI Journal, 8(9), pp. 4-9, 2009.
[70] Powell, A., “On the Mechanism of Choked Jet Noise”, Proceedings of the Physical Society, Section B, 66(12), pp. 1039-1056, 1953.

150
[71] Prandtl, L., “Über die stationaren Wellen in einem Gasstrahl”, Phys. Zeits, 5, pp. 599-601, 1904.
[72] Raask, E., Mineral Impurities in Coal Combustion, Hemisphere, 1985.
[73] Rahimi, M., Owen, I. and Mistry, J., “Heat transfer between an under-expanded jet and a cylindrical surface”, International Journal of Heat and Mass Transfer, 46, pp. 3135-3142, 2003.
[74] Rajakuperan, E. and Ramaswamy, M. A., “An experimental investigation of underexpanded jets from oval sonic nozzles”, Experiments in Fluids, 24, pp. 291-299, 1998.
[75] Raman, G., “Advances in Understanding Supersonic Jet Screech: Review and Perspective”, Progress in Aerospace Sciences, 34, pp. 45-106, 1998.
[76] Raman, G., “Cessation of screech in underexpanded jets”, Journal of Fluid Mechanics, 336, pp. 69-90, 1997.
[77] Rathakrishnan, E., Instrumentation, Measurements, and Experiments in Fluids, CRC Press, 2007.
[78] Rezvani, K., Mao, X. and Tran, H. N., “Effects of Potassium, Carbonate and Sulfide on Carryover Deposition”, Report no. 2, Proceedings, Annual Meeting of the Consortium on “Improving Recovery Boiler Performance, Emissions and Safety”, University of Toronto, Canada, Nov. 2000.
[79] Romeo, L. M. and Gareta, R., “Fouling control in biomass boilers”, Biomass and Bioenergy, 33, pp. 854-861, 2009.
[80] Saviharju, K., Kaliazine, A., Tran, H. N. and Habib, T., “In-situ measurements of sootblower jet impact in a recovery boiler”, TAPPI Journal, 10(2), pp. 27-32, 2011.
[81] Schuh, H. and Persson, B., “Heat Transfer on Circular Cylinders Exposed to Free-Jet Flow”, International Journal of Heat and Mass Transfer, 7, pp. 1257-1271, 1964.
[82] Seiner, J. M. and Norum, T. D., “Aerodynamic aspects of shock containing jet plumes”, AIAA paper 80-0965, 1980.
[83] Seiner, J. M., Manning, J. C. and Ponton, M. K., “Model and full scale study of twin supersonic plume resonance”, AIAA paper 87-0244, 1987.
[84] Settles, G. S., Schlieren and Shadowgraph Techniques: Visualizing Phenomena in Transparent Media, Springer-Verlag, 2001.
[85] Shenassa, R., “Dynamic Carryover Deposition in an Entrained Flow Reactor”, PhD thesis, Dept. of Chemical Engineering and Applied Chemistry, University of Toronto, 2000.
[86] Shenassa, R., Kuhn, D.C.S. and Tran, H. N., “The Role of Liquid Content In Carryover Deposition In Kraft Recovery Boilers - A Fundamental Study”, Journal of Pulp & Paper Canada, 29(4), pp.132-136, 2003.

151
[87] Shenassa, R., Tran, H.N. and Kuhn, D.C.S., “Dynamic Study of Carryover Deposition using an Entrained Flow Reactor”, Pulp & Paper Canada, 100(10), pp. 56-62, 1999.
[88] Sherman, P. M., Glass, D. R. and Duleep, K. G., “Jet Flow Field During Screech”, Journal of Applied Sciences Research, 32, pp. 283-303, 1976.
[89] Singbeil, D., “Corrosion of Generating Bank Tubes in Kraft Recovery Boilers”, Pulp & Paper Canada, 95(12), pp. 132-135, 1994.
[90] Stultz, S. C. and Kitto, J. B. (Eds.), Steam: Its Generation and Use, 41st ed., The Babcock & Wilcox Co., Barberton, OH, 2005.
[91] “Summary Report of Energy Use in the Canadian Manufacturing Sector 1995-2008”, Industrial Consumption of Energy (ICE) Survey, Natural Resources Canada, Oct. 2010; downloaded on Mar. 1, 2011 from: http://oee.nrcan.gc.ca/publications/statistics/ice08/index.cfm
[92] Tabrizi, S. P. A., “Jet Impingement onto a Circular Cylinder”, PhD thesis, University of Liverpool, 1996.
[93] Tam, C. K. W. and Ahuja, K. K., “Theoretical model of discrete tone generation by impinging jets”, Journal of Fluid Mechanics, 214, pp. 67-87, 1990.
[94] Tam, C. K. W., Jackson, J. A. and Seiner, J. M., “A Multiple-scales Model of the Shock-cell Structure of Imperfectly Expanded Supersonic Jets”, Journal of Fluid Mechanics, 153, pp. 123-149, 1985.
[95] Tam, C. K. W., “On the Noise of a Nearly Ideally Expanded Supersonic Jet”, Journal of Fluid Mechanics, 51, pp. 69-95, 1972.
[96] Tam, C. K. W., “Supersonic Jet Noise”, Annual Review of Fluid Mechanics, 27, pp. 17-43, 1995.
[97] Tandra, D.S., “Development and Application of a Turbulence Model for a Sootblower Jet Propagating Between Recovery Boiler Superheater Platens”, PhD thesis, Dept. of Chemical Engineering and Applied Chemistry, University of Toronto, 2005.
[98] Tandra, D. S., Kaliazine, A., Cormack, D. E. and Tran, H. N., “Interaction between sootblower jet and superheater platens in recovery boilers”, Pulp & Paper Canada, 108(5), pp. 43-46, 2007.
[99] Tandra, D. S., Kaliazine, A., Cormack, D. E. and Tran, H. N., “Numerical simulation of supersonic jet flow using a modified k-ε model”, International Journal of Computational Fluid Dynamics, 20(1), pp. 19-27, 2006.
[100] Tandra, D. S., Manay, A. and Edenfield, J., “The Use of Energy Balance Around Recovery Boiler Heat Exchangers to Intelligently Manage Sootblower Operations: A Case Study”, Proceedings, 2010 TAPPI PEERS & 9th Research on Recycling Forum, Norfolk, VA, Oct. 17-21, 2010.
[101] Tandra, D. S., Manay, A., Thabot, A., and Jones, A., “Mill Trial on New Sootblower Design and Strategy to Combat Plugging in a Recovery Boiler”, Proceedings, 2010
152
TAPPI PEERS & 9th Research on Recycling Forum, Norfolk, VA, Oct. 17-21, 2010.
[102] Tandra, D. S., Personal communication, 2008.
[103] Tawfek, A. A., “Heat transfer due to a round jet impinging normal to a circular cylinder”, Heat and Mass Transfer, 35, pp. 327-333, 1999.
[104] Theis, M., Skrifvars, B.-J., Hupa, M. and Tran, H.N., “Fouling Tendency of Ash Resulting from Burning Mixtures of Biofuels. Part 1: Deposition Rates”, Fuel, 85, pp. 1125-1130, 2006.
[105] Tran, H. N. and Vakkilainnen, E. K., “The Kraft Chemical Recovery Process”, TAPPI Kraft Recovery Operations Short Course, TAPPI Press, pp. 1.1-1 – 1.1-8, 2011.
[106] Tran, H.N., Barham, D. and Reeve, D.W., “Sintering of fireside deposits and its impact on plugging in kraft recovery boilers”, TAPPI Journal, 70(4), pp. 109-113, 1988.
[107] Tran, H.N., “Chapter 9 - Upper Furnace Deposition and Plugging”. In Adams, T.N. (Ed.), Kraft Recovery Boilers, TAPPI Press, 1997.
[108] Tran, H. N., “Kraft Recovery Boiler Plugging and Prevention”, TAPPI Kraft Recovery Operations Short Course, TAPPI Press, pp. 209-217, 1992.
[109] Tran, H. N., Personal communication, 2011.
[110] Tran, H.N., Reeve, D.W. and Barham, D., “Formation of kraft recovery boiler superheater deposits”, Pulp & Paper Canada, 84(1), T7-T12, 1983.
[111] Tran, H. N., Tandra, D. S. and Jones, A., “Development of Low-Pressure Sootblowing Technology”, Proceedings, International Chemical Recovery Conference, PAPTAC & TAPPI, Quebec City, Canada, May 29-June 1, 2007.
[112] Tritton, D. J., Physical Fluid Dynamics, Van Nostrand Reinhold Co., 1977.
[113] Umeda, Y., Maeda, H. and Ishii, R., “Discrete tones generated by the impingement of a high-speed jet on a circular cylinder”, Physics of Fluids, 30(8), pp. 2380-2388, 1987.
[114] Venkatakrishnan, L., “Density Measurements in an Axisymmetric Underexpanded Jet by Background-Oriented Schlieren Technique”, AIAA Journal, 43(7), pp.1574-1579, 2005.
[115] “Wall Blowers”, from: http://www.clydebergemann.com/ (Products>Cleaning Devices>Wall Blowers) on Nov. 30, 2008.
[116] Warren, W. R., “An analytical and experimental study of compressible free jets”, Report no. 381, Aeronautical Engineering Laboratory, University of Princeton, 1957.
[117] White, F. M., Fluid Mechanics, 5th ed., McGraw Hill, 2003.
[118] Witze, P. O., “A Generalized Theory for The Turbulent Mixing of Axially Symmetric Compressible Free Jets”, Fluid Mechanics of Mixing, Proceedings, Joint Meeting of the Fluids Engineering and Applied Mechanics Divs., ASME, Atlanta, GA, p. 63, 1973.
153
[119] Zapryagaev, V. I. and Solotchin, A. V., “Three-dimensional structure of flow in a supersonic underexpanded jet”, J. Appld. Mech. Tech. Phys., 32(4), pp. 503-507, 1991.
[120] Zdravkovich, M. M., Flow Around Circular Cylinders: Vol. I Fundamentals, Oxford University Press, 2003.

APPENDICES
154
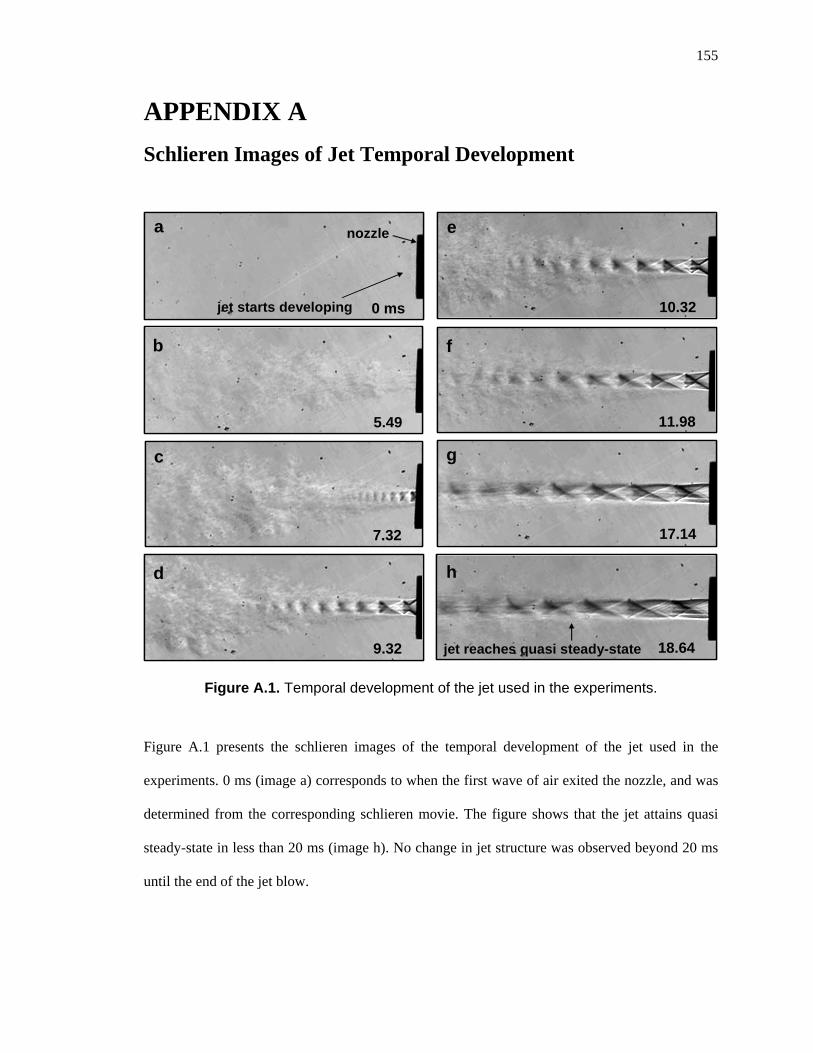
155
APPENDIX A
Schlieren Images of Jet Temporal Development
9.32 18.64
17.14
10.32
11.98
a
b
c
d
g
h
f
e
7.32
0 ms
5.49
jet starts developing
nozzle
Figure A.1. Temporal development of the jet used in the experiments.
Figure A.1 presents the schlieren images of the temporal development of the jet used in the
experiments. 0 ms (image a) corresponds to when the first wave of air exited the nozzle, and was
determined from the corresponding schlieren movie. The figure shows that the jet attains quasi
steady-state in less than 20 ms (image h). No change in jet structure was observed beyond 20 ms
until the end of the jet blow.
jet reaches quasi steady-state9.32 18.64
17.14
10.32
11.98
a
b
c
d
g
h
f
e
7.32
0 ms
5.49
jet starts developing
nozzle
jet reaches quasi steady-state
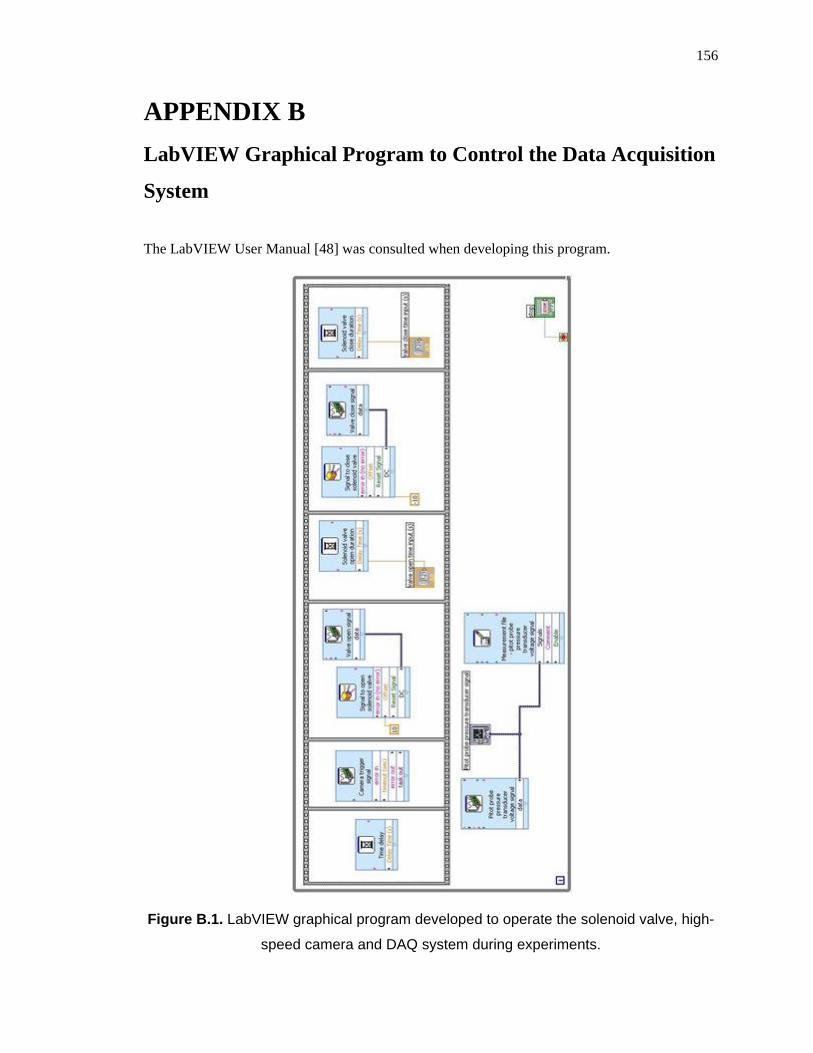
156
APPENDIX B
LabVIEW Graphical Program to Control the Data Acquisition
System
The LabVIEW User Manual [48] was consulted when developing this program.
Figure B.1. LabVIEW graphical program developed to operate the solenoid valve, high-
speed camera and DAQ system during experiments.
157
APPENDIX C
Interaction between a Jet and a Single Tube: Supplementary
Results
This appendix contains supplementary results obtained from experiments performed to study the
interaction between a supersonic jet and a single tube. The main results related to these
interactions are presented in chapter 5. The results presented here are specifically schlieren
images of (1) the interaction when a primary jet impinges on a large tube (25.4 mm OD, de/D =
0.29) located 50 mm (6.8de) from the nozzle exit, at different offsets (section C.1), and (2) the
instability of the flow when a primary jet impinges at 0 offset on a medium tube (19.1 mm OD,
de/D = 0.39) located 3de away from the nozzle (section C.2). In this case, a secondary jet forms
after a much longer time period as compared to all other cases in which it forms. To present this
clearly, the time required for flow to separate from a tube and form a secondary jet is compared
for the medium tube when it is placed 2de and 3de away from the nozzle. To present these images
properly, each figure containing a set of images is presented on a new page, starting from the next
page, since these figures require considerable space.
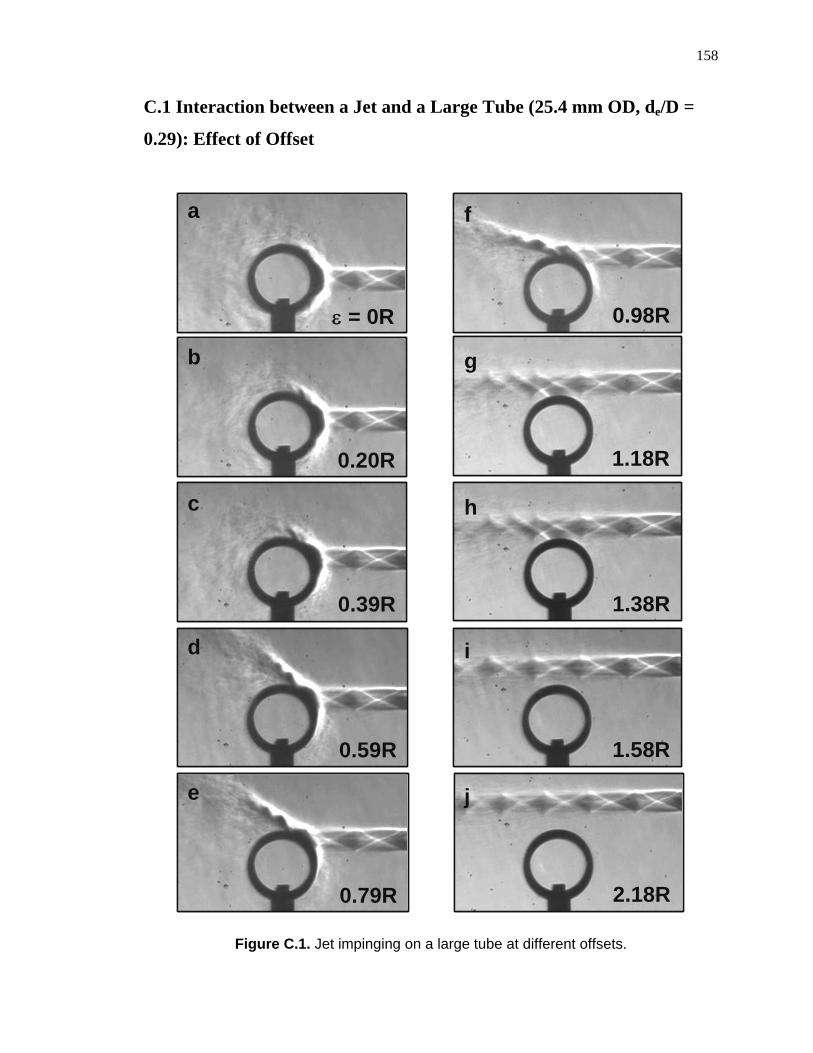
158
C.1 Interaction between a Jet and a Large Tube (25.4 mm OD, de/D =
0.29): Effect of Offset
a
b
c
d
e
f
g
h
i
j
= 0R
0.20R
0.39R
0.59R
0.79R
1.18R
1.38R
1.58R
2.18R
0.98R
a
b
c
d
e
f
g
h
i
j
= 0R
0.20R
0.39R
0.59R
0.79R
1.18R
1.38R
1.58R
2.18R
0.98R
Figure C.1. Jet impinging on a large tube at different offsets.

159
C.2 Flow Instability: Primary Jet Impinging at 0 Offset on a Medium
Tube (19.1 mm OD, de/D = 0.39) Located 3 Nozzle Exit Diameters from
the Nozzle Exit
Figures C.2 and C.3 show the temporal development of the flow field when a primary jet
impinges on a medium tube (19.1 mm OD, de/D = 0.39) placed 2de and 3de away from the nozzle
respectively. Time 0 is arbitrarily selected, but corresponds to nearly the same stage of flow
development in both cases. The uncertainty in determining the time 0 in these cases is 1 frame
or 0.17 ms.
Figures C.2 and C.3 show that the secondary jet that forms when the medium tube is
placed 3de away from the nozzle, forms after a much longer period of time compared to when the
tube is placed 2de away, as well as in all other situations (for the small and medium tubes, at
different offsets and different distances). In all other cases, the secondary jet forms as the primary
jet develops, that is, the secondary jet forms before the flow field reaches quasi steady-state. For
the case shown in Figure C.2, the time required for the secondary jet to form from time 0 is about
16 ms. Together with the time required for the jet to reach the stage at time 0, the time required
for a secondary jet to form is approximately the same as that required for the primary jet to fully
develop, which is around 20 ms, described in chapter 3 section 3.1 and in Appendix A.
At x = 3de (Figure C.3), the flow field reaches a ‘first’ quasi steady-state in which the
flow around the tube remains attached to the tube for a considerable length of time (images d and
e). Thereafter, the flow separates from the tube forming a stable secondary jet, and hence the flow
field attains a ‘second’ quasi steady-state (images f-h). The total time required for the secondary
jet to form in this case (time required to reach the stage at time 0 + the time from time 0) is about
60 ms, which is much higher than that at x = 2de. Beyond x = 3de, secondary jets do not form at 0
offset for this tube, as indicated in chapter 5 section 5.3.1. This indicates that this nozzle-tube

160
distance (between 2de and 4de) for this tube size (de/D = 0.39) is a transition region in terms of
flow separation from the tube.

161
a
b
c
d
e
f
g
h
time=0ms
3.74
8.33
12.75
13.43
14.11
14.79
15.81
secondary jet
tube
stand
nozzle
25mm
a
b
c
d
e
f
g
h
time=0ms
3.74
8.33
12.75
13.43
14.11
14.79
15.81
secondary jet
tube
stand
nozzle
25mm
Figure C.2. Temporal development of the flow field when a primary jet impinges on a
medium tube placed 2de away from the nozzle; the secondary jet forms as the primary
jet develops.
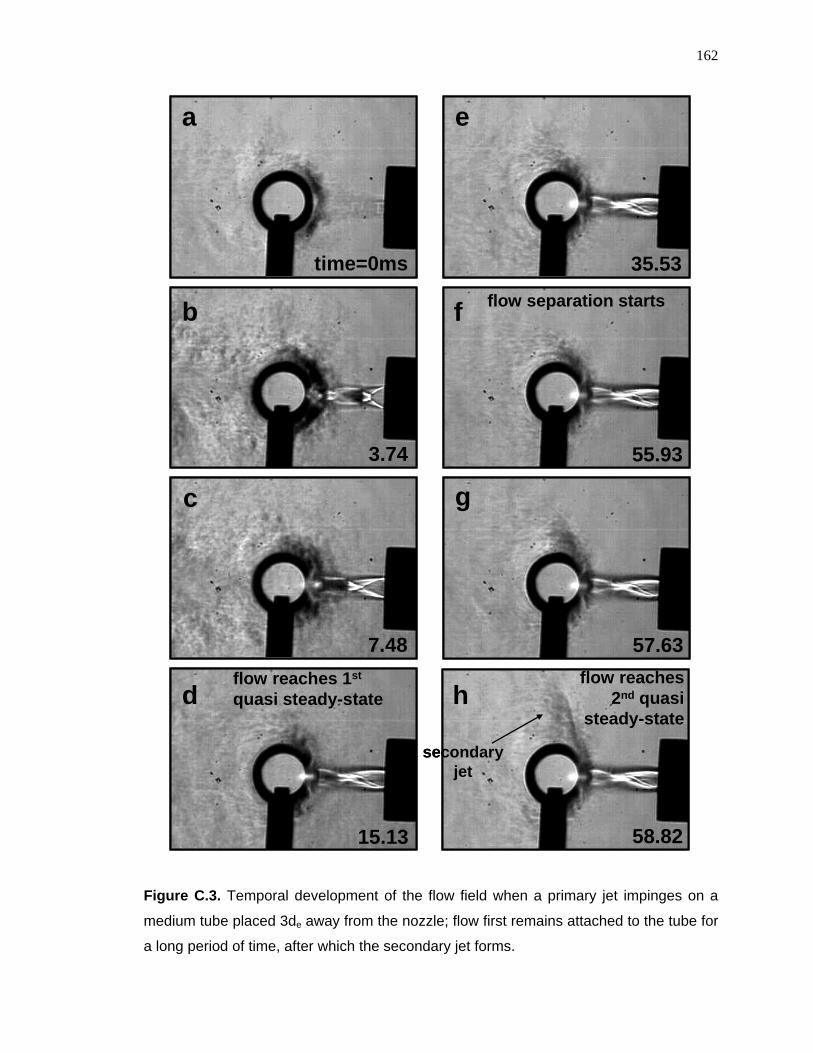
162
a
b
c
d
e
f
g
h
time=0ms
3.74
7.48
15.13
35.53
55.93
57.63
58.82
secondary jet
flow reaches 1st
quasi steady-stateflow reaches
2nd quasi steady-state
flow separation starts
a
b
c
d
e
f
g
h
time=0ms
3.74
7.48
15.13
35.53
55.93
57.63
58.82
secondary jet
flow reaches 1st
quasi steady-stateflow reaches
2nd quasi steady-state
flow separation starts
Figure C.3. Temporal development of the flow field when a primary jet impinges on a
medium tube placed 3de away from the nozzle; flow first remains attached to the tube for
a long period of time, after which the secondary jet forms.
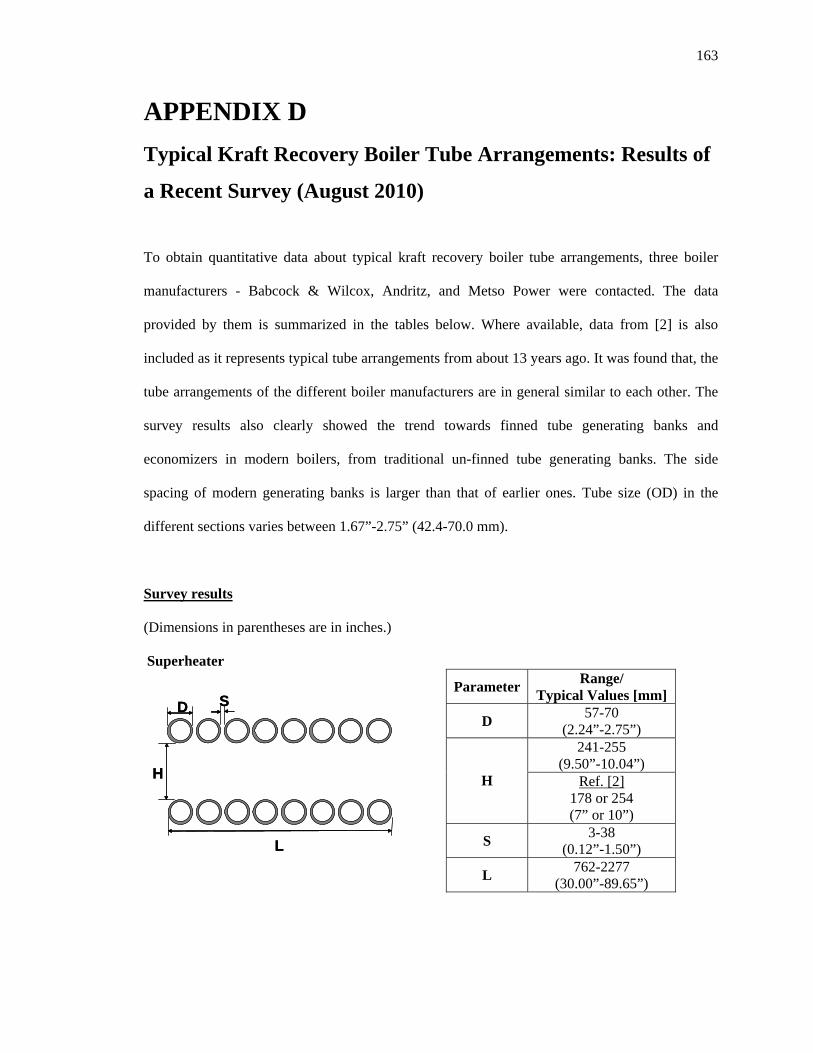
163
APPENDIX D
Typical Kraft Recovery Boiler Tube Arrangements: Results of
a Recent Survey (August 2010)
To obtain quantitative data about typical kraft recovery boiler tube arrangements, three boiler
manufacturers - Babcock & Wilcox, Andritz, and Metso Power were contacted. The data
provided by them is summarized in the tables below. Where available, data from [2] is also
included as it represents typical tube arrangements from about 13 years ago. It was found that, the
tube arrangements of the different boiler manufacturers are in general similar to each other. The
survey results also clearly showed the trend towards finned tube generating banks and
economizers in modern boilers, from traditional un-finned tube generating banks. The side
spacing of modern generating banks is larger than that of earlier ones. Tube size (OD) in the
different sections varies between 1.67”-2.75” (42.4-70.0 mm).
Survey results
(Dimensions in parentheses are in inches.)
Superheater
ParameterRange/
Typical Values [mm]
D 57-70
(2.24”-2.75”) 241-255
(9.50”-10.04”) H Ref. [2]
178 or 254 (7” or 10”)
S 3-38
(0.12”-1.50”)
L 762-2277
(30.00”-89.65”)
D S
H
L
D S
H
L
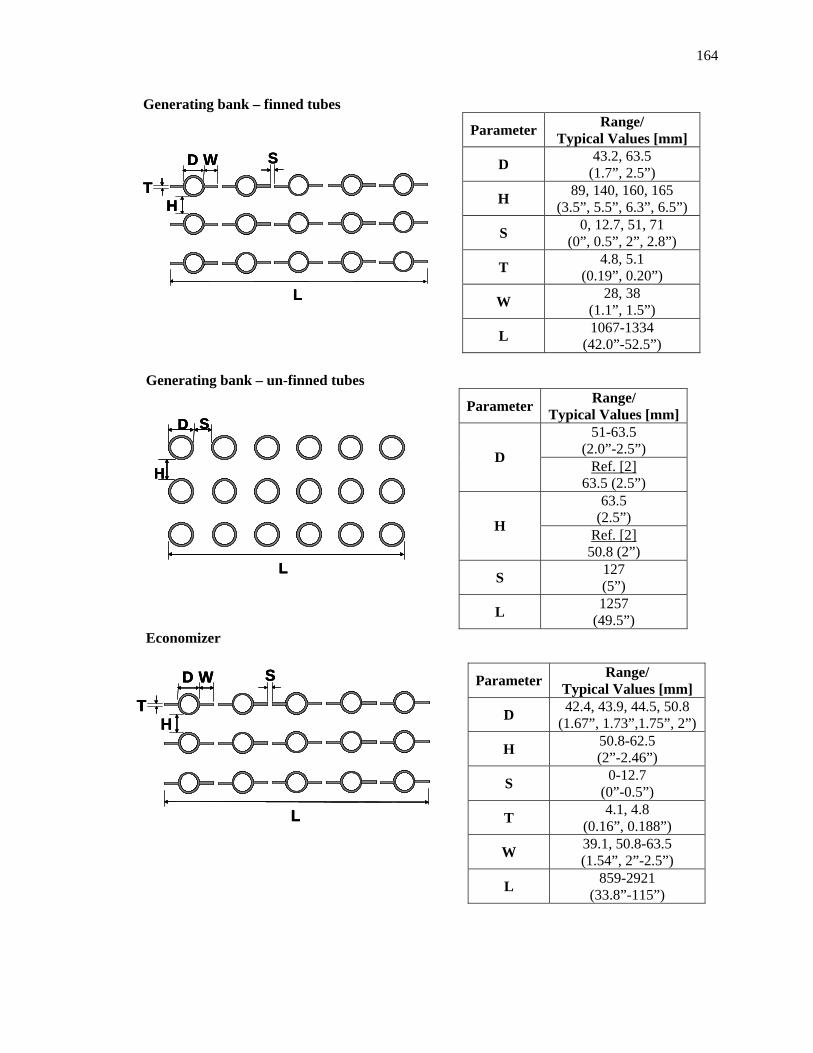
164
Generating bank – finned tubes
ParameterRange/
Typical Values [mm]
D 43.2, 63.5
(1.7”, 2.5”)
H 89, 140, 160, 165
(3.5”, 5.5”, 6.3”, 6.5”)
S 0, 12.7, 51, 71
(0”, 0.5”, 2”, 2.8”)
T 4.8, 5.1
(0.19”, 0.20”)
W 28, 38
(1.1”, 1.5”)
L 1067-1334
(42.0”-52.5”)
D S
H
L
W
T
D S
H
L
W
T
D S
H
L
W
T
Generating bank – un-finned tubes
ParameterRange/
Typical Values [mm] 51-63.5
(2.0”-2.5”) D
Ref. [2] 63.5 (2.5”)
63.5 (2.5”)
H Ref. [2]
50.8 (2”)
S 127 (5”)
L 1257
(49.5”) Economizer
ParameterRange/
Typical Values [mm]
D 42.4, 43.9, 44.5, 50.8
(1.67”, 1.73”,1.75”, 2”)
H 50.8-62.5 (2”-2.46”)
S 0-12.7
(0”-0.5”)
T 4.1, 4.8
(0.16”, 0.188”)
W 39.1, 50.8-63.5 (1.54”, 2”-2.5”)
L 859-2921
(33.8”-115”)
D S
H
L
D S
H
L
D S
H
L
D S
H
L
W
T
D S
H
L
W
T
D S
H
L
W
T
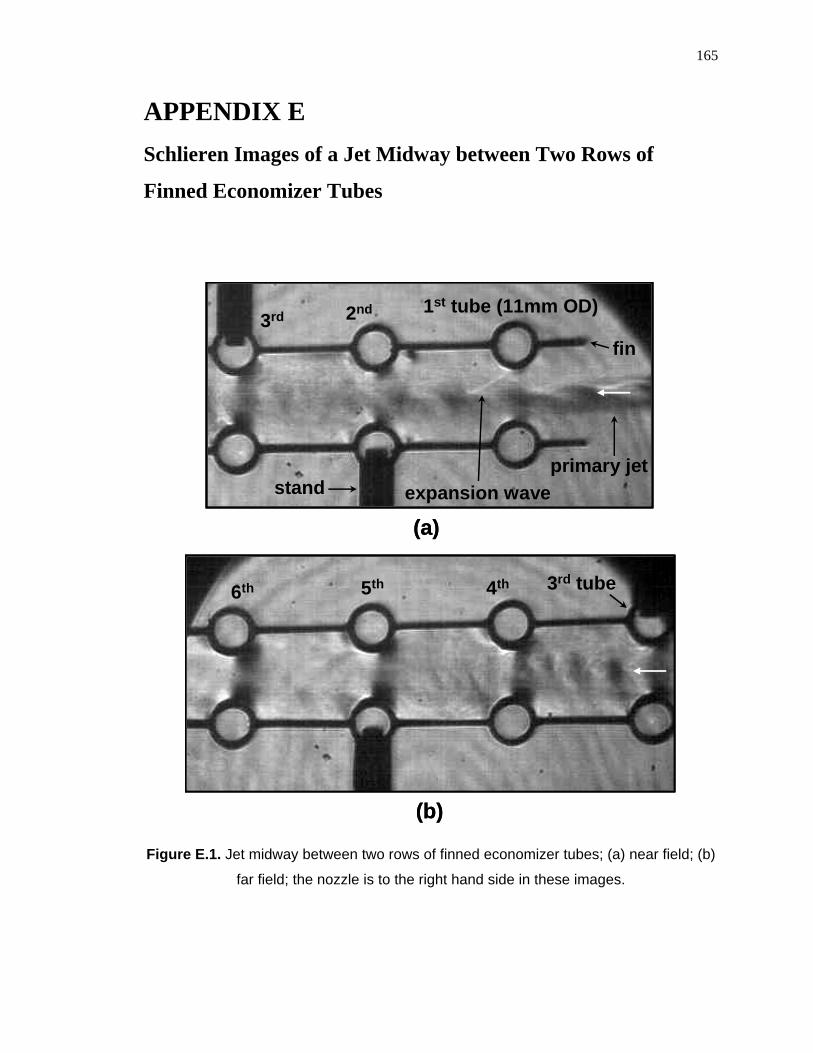
165
APPENDIX E
Schlieren Images of a Jet Midway between Two Rows of
Finned Economizer Tubes
primary jet
1st tube (11mm OD)
fin
stand expansion wave
2nd3rd
primary jet
1st tube (11mm OD)
fin
stand expansion wave
2nd3rd
primary jet
1st tube (11mm OD)
fin
stand expansion wave
2nd3rd
3rd tube4th5th6th
(a)
(b)
Figure E.1. Jet midway between two rows of finned economizer tubes; (a) near field; (b)
far field; the nozzle is to the right hand side in these images.
3rd tube4th5th6th 3rd tube4th5th6th
(a)
(b)