integrated report 2012 - kap industrial · welcome to the kap international 2012 integrated report...
TRANSCRIPT

INTEGRATED REPORT 2012
Welcome to the Kap InternatIonal 2012 Integrated report
about this report IFc
at a glance 1
Group overview 2
operating divisions at a glance 4
Board of directors 6
Investment case 10
Strategic objectives 11
Stakeholders 14
Reports to stakeholders 16
chairman’s report 18
chief executive officer’s report 20
chief financial officer’s report 24
Operational review 28
logistics 30
passenger 34
Integrated timber 38
manufacturing 42
Corporate responsibility reports 46
corporate governance report 48
remuneration report 55
Sustainability report 58
Annual financial statements 72
Independent auditor’s report 74
directors’ report 75
company secretary’s report 77
report of the audit and risk committee 78
consolidated statement of financial position 80
consolidated income statement 81
consolidated statement of comprehensive income 82
consolidated statement of cash flows 83
consolidated statement of changes in equity 84
Segmental reporting 86
Summary of accounting policies 88
notes to the annual financial statements 101
annexure a: Shareholders’ profile 149
annexure B: Special resolutions 150
notice to shareholders included
corporate information IBc
Shareholders’ diary IBc
contents
We are pleased to provide you with the integrated report of Kap
International as recommended in the King code of governance
principles for South africa 2009 (King III). the objective of our
integrated report is to provide our stakeholders with better
insight into our performance and the way we manage our
business. In this report, our business reporting focuses on our
strategy and our ability to create long-term sustainable value.
In compiling this report we were guided by the principles of
integrated reporting which in turn address the needs of our
various stakeholders. the integrated report should provide
a greater understanding of the group’s strategy, its business
model and its impact across economic, social and environmental
areas and insight into how the group’s business is managed.
aligned with our business strategy, we describe the strategic
risks and priorities of the group and show how our business and
sustainability issues underpin and support a common strategy.
aspects of social and environmental sustainability have been
part of the group’s strategy and business practices for many
years. recently we started monitoring and reporting on the data
relevant and material to these matters. We are on a journey to
fully implement processes of data collection and management
throughout the group that will provide information relevant to
material and strategic issues to make our reporting process
aligned with global best practice. the sustainability report
relates to the full financial year.
the annual financial statements have been prepared in
accordance with International Financial reporting Standards
(IFrS).
Following the reverse acquisition of the Steinhoff Industrial
assets as disclosed in more detail in the cFo’s report, and in
line with IFrS reporting standards, the comparative results for
2011 now relate only to the Steinhoff Industrial assets.
management has considered and applied the principles of
King III on integrated reporting and the discussion paper of
the Integrated reporting committee of South africa in the
preparation of this report to the extent possible. as the concepts
and practices of integrated reporting develop, management
will aim to enhance disclosures and application as deemed
appropriate.
the principle of materiality has been applied in determining the
content and extent of disclosure in the integrated report.
cFo’s report
p.24
passenger
p.34
Integrated timber
p.38
manufacturing
p.42
ceo’s report
p.20logistics
p.30
chairman’s report
p.18
corporateresponsibility
reports
p.46

Scope and boundary
The scope of the report includes all our operating subsidiaries and covers the reporting period 1 July 2011 to 30 June 2012. The audited annual financial statements were approved on 3 September 2012. This integrated report was approved for distribution on 1 October 2012 and includes reference to pertinent events subsequent to year-end up to the approval date. All references to KAP, the group, the company, the business, “our” and “we” refer to KAP International holdings limited and its subsidiaries.
Approval of the integrated report
The board acknowledges its responsibility to ensure the integrity of the integrated report. The directors confirm they have collectively reviewed the content of the integrated report and believe it addresses the material issues and is a fair presentation of the integrated performance of the group.
External assurance
Assurance and the contents of the integrated report were considered throughout the process. The board, assisted by the audit committee, is ultimately responsible for overseeing the integrity of the integrated report. This was achieved through setting up appropriate teams and structures to undertake the reporting process and the review and approval of the integrated report. A combined assurance approach will be developed in future years to ensure the appropriate application of integrated reporting principles and the integrity of data contained in the report. External assurance obtained in the current year was limited to the audit opinion on the group annual financial statements.
More information
The integrated report is available on-line at: www.kap.co.zaA printed copy of the annual financial statements is available on request from: [email protected] value your opinion on this integrated report – for further information, feedback or assistance, please contact us at: [email protected]
About this report
Forward-looking information
This integrated report contains certain forward-looking statements which relate to the financial position and results of the operations of the group. These statements are solely based on the view and considerations of the directors. These statements by their nature involve risk and uncertainty as they relate to events and depend on circumstances that may occur in the future. Factors that could cause actual results to differ materially from those in the forward-looking statements include, but are not limited to, global and national economic and market conditions including interest and foreign exchange rates, gross and operating margins achieved, competitive conditions and regulatory factors. These forward-looking statements have not been reviewed or reported on by the group’s external auditors.

KAP Integrated Annual Report 2012 1
At A glAnce
Revenue Operating profit before capital items Operating margin %
R6,8bLogistics
R701mLogistics
R2,3bIntegrated timber
R273mIntegrated timber
R2,0bManufacturing
R132mManufacturing
10%
14
12
10
8
6
4
2
0
12%
Inte
gra
ted
tim
ber
Lo
gis
tics
Segmental performance
Headline earnings of24,2 cents per share
Highlights
Dividend of 6 cents per share
Operating cash flow grows by 31% to
R1 906m
Acquisition of Steinhoff industrialand logistics assets completed
listed on the JSe limited, KAP is an industrial group, predominantly located in and focused on business in emerging African markets.
KAP delivers services and manufactures products to a wide customer base through four main operating divisions.*
A passenger transport division providing personnel, tourist and commuter transport services
An industrial manufacturing division which manufactures automotive components, Pet (resin), furniture and bedding components, footwear, towelling and food products
A specialist logistics division that designs, implements and manages supply chain and logistics services
An integrated timber division incorporating timber plantations, sawmills and production facilities
* For financial reporting purposes, our supply chain solutions and passenger divisions have been combined into one logistics division
7%
Man
ufa
ctu
rin
g

2 KAP Integrated Annual Report 2012
groupoverview

KAP Integrated Annual Report 2012 3
groupoverview
group overview

4 KAP Integrated Annual Report 2012
Unitrans Supply chain Solutions (UScS) designs, implements and manages supply chain and logistics solutions for a diverse range of blue chip customers in sub-Saharan African countries. Services include transportation, warehousing, clearing and forwarding, supply chain re-engineering and consulting services. UScS consists of three divisions: Unitrans Agriculture and Mining; Unitrans Fuel and chemical; and Unitrans Freight and logistics. UScS adds value to the supply chain through operational excellence, cost-effectiveness, customer knowledge and sustainable solutions.
gROUP OveRvIewOperating divisions at a glance
the Unitrans Passenger division provides transport to the public, tourist and personnel market segments, supplying an essential service to an estimated 11,2 million passengers per annum. the various brands, which cover personnel, commuter, intercity and tourism transport include Mega Bus, Mega coach, Magic Bus, Mega express, greyhound, citiliner and Bojanala Bus. within the personnel and commuter businesses the focus is on long-term customer contracts. these contracts provide the group with long-term sustainable revenue and margins while the tourist and intercity markets support passenger volumes and profits. the gautrain feeder and distribution service provides transport to daily commuter passengers between Johannesburg, Pretoria and OR tambo International Airport.
Passengerlogistics
Operates out of 133 locations in 10 African countries
200 million km travelled per annum
420 000 m2 warehouse space under management
2 900 vehicles in operating fleet
11 800 employees
1,2 million tourist passengers transported for the year under review
10 million commuter passengers transported annually
1 207 vehicles comprising semi-luxury commuter buses, train buses, luxury coaches and minibuses
More than 20 million km travelled annually
23 depots and 15 passenger terminals throughout South Africa, Zimbabwe and Mozambique
3 400 employees

KAP Integrated Annual Report 2012 5
group overview
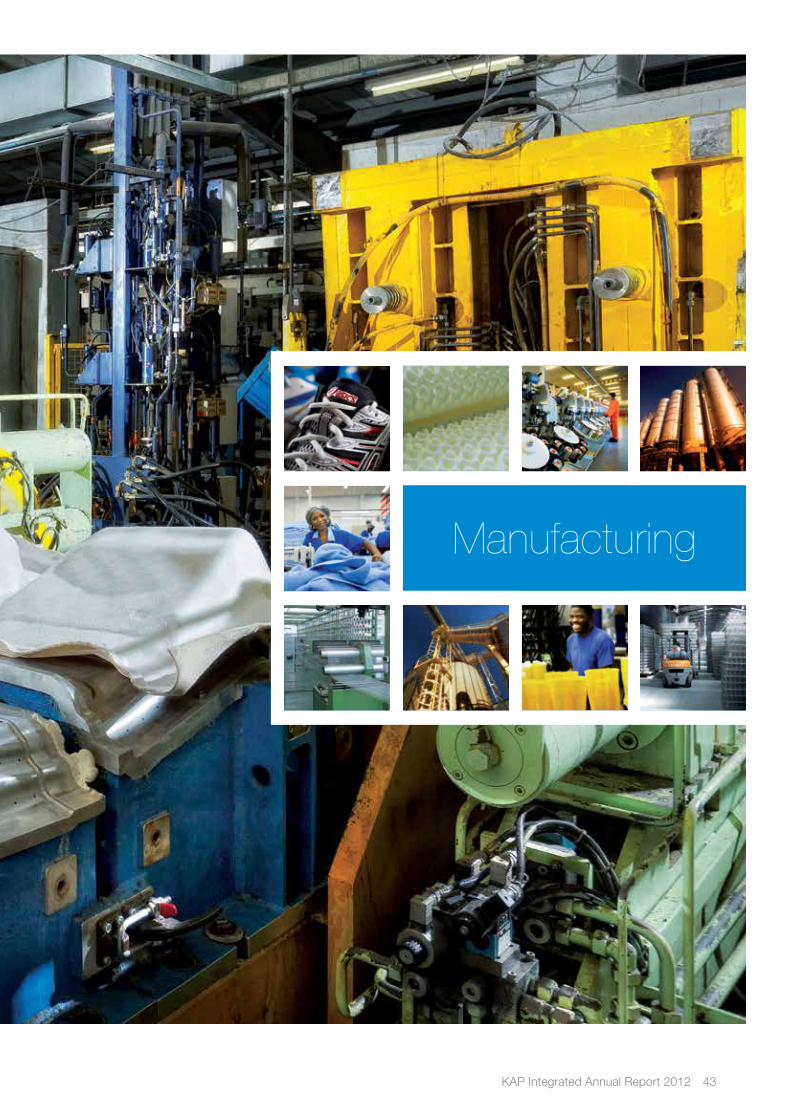
the Manufacturing division manufactures a diverse range of products including various components used in the assembly of automotive vehicles; the raw material polyethylene terephthalate (Pet/resin) used to produce packaging for the beverage and other industries; materials and components for the furniture and bedding industry; fashion and industrial footwear and food. the manufacturing businesses are well-known, established companies and the division has a proud history of manufacturing quality products. these businesses are all based in southern Africa, operate from 24 manufacturing facilities and are focused on capitalising on the growth opportunities within the industries and markets they serve.
Pg Bison manufactures and distributes sawn timber, poles, upgraded wood-based panel products and solid surfacing materials, and distributes decorative laminates, all with the strategic intent of being the no.1 manufacturer and upgrader of timber-based products in its chosen markets. “From seedling to lifestyle” encapsulates the vertical integration of this business; from the seedlings, through the forest plantations, the sawmills, poles plants, the resin plant, and the board manufacturing and upgrading facilities, it owns and manages its entire value chain, whilst behaving in a socially and environmentally responsible and sustainable manner.
Integrated timber Manufacturing
42 600 ha of plantations in KwaZulu-Natal, North Eastern Cape and Southern Cape
7 Manufacturing facilities
110 000 m² of panel products manufactured each day
60 000 m² of panel products upgraded each day
1,5 million new seedlings grown in the North Eastern Cape Forest (NECF) nursery each year
R44 million spent per annum on Corporate Social Investment and Enterprise Development in and around Ugie rural areas
2 400 employees
Hosaf produces 130 000 tonnes of PET per annum
Feltex produces and supplies certain components for all cars manufactured in South Africa (approximately 490 000 units) annually
Vitafoam produces 14 800 tonnes of foam annually
BCM produces bed springs for 3 000 mattresses per day
More than 30 well-known household brands complete the division’s product offering
6 100 employees
6 KAP Integrated Annual Report 2012
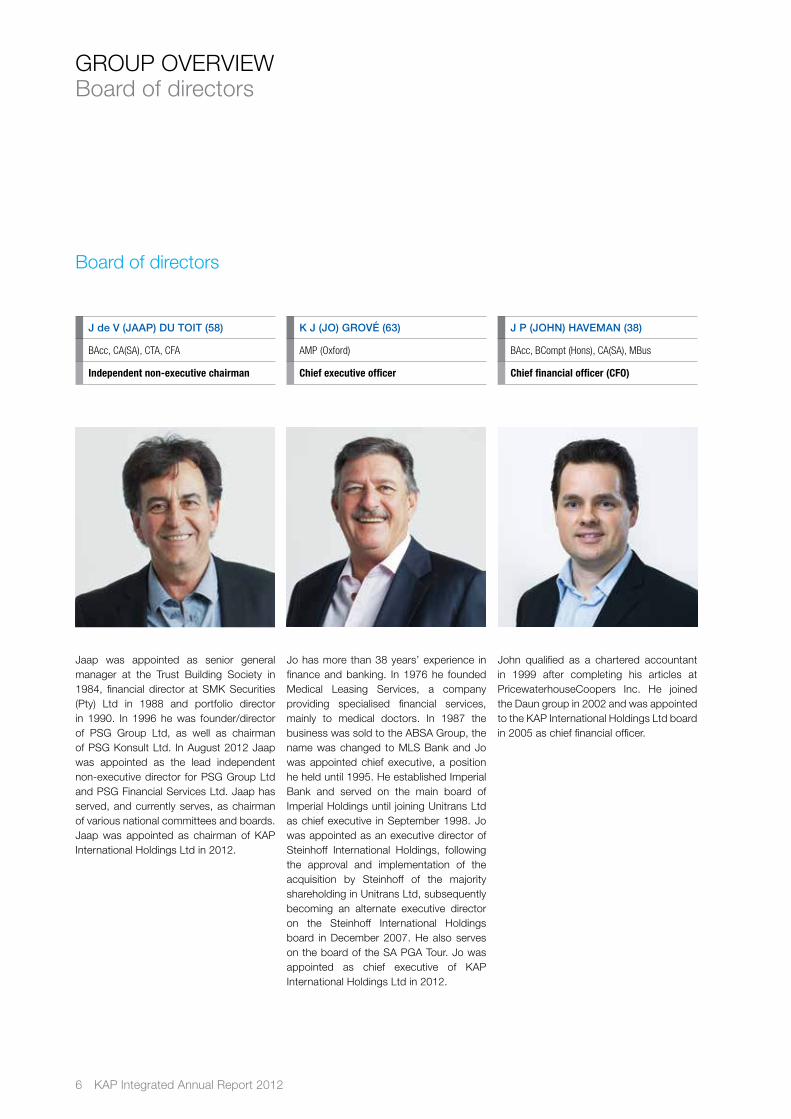
Jaap was appointed as senior general manager at the trust Building Society in 1984, financial director at SMK Securities (Pty) ltd in 1988 and portfolio director in 1990. In 1996 he was founder/director of PSg group ltd, as well as chairman of PSg Konsult ltd. In August 2012 Jaap was appointed as the lead independent non-executive director for PSg group ltd and PSg Financial Services ltd. Jaap has served, and currently serves, as chairman of various national committees and boards. Jaap was appointed as chairman of KAP International Holdings ltd in 2012.
J de V (Jaap) du TOiT (58)
BAcc, CA(SA), CTA, CFA
Independent non-executive chairman
K J (JO) GROVÉ (63)
AMP (Oxford)
Chief executive officer
Jo has more than 38 years’ experience in finance and banking. In 1976 he founded Medical leasing Services, a company providing specialised financial services, mainly to medical doctors. In 1987 the business was sold to the ABSA group, the name was changed to MlS Bank and Jo was appointed chief executive, a position he held until 1995. He established Imperial Bank and served on the main board of Imperial Holdings until joining Unitrans ltd as chief executive in September 1998. Jo was appointed as an executive director of Steinhoff International Holdings, following the approval and implementation of the acquisition by Steinhoff of the majority shareholding in Unitrans ltd, subsequently becoming an alternate executive director on the Steinhoff International Holdings board in December 2007. He also serves on the board of the SA PgA tour. Jo was appointed as chief executive of KAP International Holdings ltd in 2012.
J p (JOhn) haVeman (38)
BAcc, BCompt (Hons), CA(SA), MBus
Chief financial officer (CFO)
John qualified as a chartered accountant in 1999 after completing his articles at Pricewaterhousecoopers Inc. He joined the Daun group in 2002 and was appointed to the KAP International Holdings ltd board in 2005 as chief financial officer.
gROUP OveRvIewBoard of directors
Board of directors
KAP Integrated Annual Report 2012 7
group overview
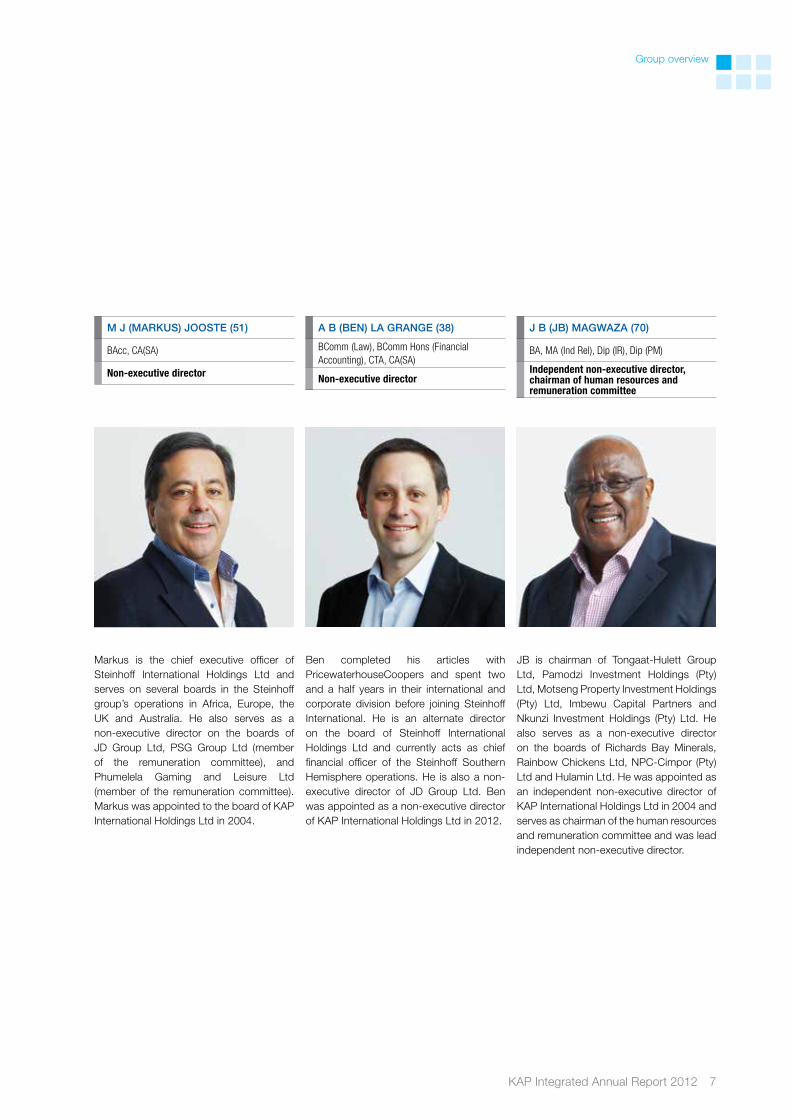
a B (Ben) la GRanGe (38)
BComm (Law), BComm Hons (Financial Accounting), CTA, CA(SA)
Non-executive director
Ben completed his articles with Pricewaterhousecoopers and spent two and a half years in their international and corporate division before joining Steinhoff International. He is an alternate director on the board of Steinhoff International Holdings ltd and currently acts as chief financial officer of the Steinhoff Southern Hemisphere operations. He is also a non-executive director of JD group ltd. Ben was appointed as a non-executive director of KAP International Holdings ltd in 2012.
m J (maRKus) JOOsTe (51)
BAcc, CA(SA)
Non-executive director
Markus is the chief executive officer of Steinhoff International Holdings ltd and serves on several boards in the Steinhoff group’s operations in Africa, europe, the UK and Australia. He also serves as a non-executive director on the boards of JD group ltd, PSg group ltd (member of the remuneration committee), and Phumelela gaming and leisure ltd (member of the remuneration committee). Markus was appointed to the board of KAP International Holdings ltd in 2004.
J B (JB) maGwaza (70)
BA, MA (Ind Rel), Dip (IR), Dip (PM)
Independent non-executive director, chairman of human resources and remuneration committee
JB is chairman of tongaat-Hulett group ltd, Pamodzi Investment Holdings (Pty) ltd, Motseng Property Investment Holdings (Pty) ltd, Imbewu capital Partners and nkunzi Investment Holdings (Pty) ltd. He also serves as a non-executive director on the boards of Richards Bay Minerals, Rainbow chickens ltd, nPc-cimpor (Pty) ltd and Hulamin ltd. He was appointed as an independent non-executive director of KAP International Holdings ltd in 2004 and serves as chairman of the human resources and remuneration committee and was lead independent non-executive director.
8 KAP Integrated Annual Report 2012
s h (sandile) nOmVeTe (39)
EDP (Wits), Prop Dev. Prog. (UCT)
Independent non-executive director, member of audit and risk committee
Sandile has a computer programming diploma and has completed the executive Development Programme (wits Business School) and the Property Development Programme (Uct Business School). After working for nBS Bank and tongaat Hulett group, Sandile started Motseng Investment Holdings in 1998 and played an important role in developing Motseng into a major Bee player in the field of property and facilities management and industrial investments. Sandile is a director of all Motseng group subsidiaries, and is a co-founder and shareholder of Motseng Investment Holdings. Sandile was appointed as an independent non-executive director of KAP International Holdings ltd in 2004 and serves on the audit and risk committee.
s h (sTeVe) mÜlleR (51)
BAcc (Hons), CA(SA), Sanlam Executive Development Programme
Independent non-executive director, member of audit and risk committee
Steve qualified as a chartered accountant in 1985. In 1993 he joined Rand Merchant Bank as a senior credit manager and in 1995 he joined genbel Investments. Over the next 13 years he fulfilled various capacities within that group, including chief operating officer: equities of genbel Securities ltd and executive director of gensec Bank ltd, serving as a non-executive director and member of the audit and remuneration committees of various investee companies within the genbel Securities group. During 2008 he left the group to pursue his own interests. He is currently an independent non-executive director and serves as the chairman of the audit and risk committees of Amalgamated Appliances ltd. Steve was appointed as an independent non-executive director of KAP International Holdings ltd in 2012 and serves on the audit and risk committee.
gROUP OveRvIewBoard of directors continued
i n (ipelenG) mKhaRi (38)
BSoc Sci
Independent non-executive director, member of human resources and remuneration committee
Ipeleng holds a BA Social Science Degree from the University of natal and has completed the executive Development Programme (wits 2004). She co-founded Motseng Investment Holdings where she is currently the chief operations officer and a shareholder. She has previously served as a non-executive director of Ambit Properties and the SA corporate Real estate Fund. She was appointed as an independent non-executive director of KAP International Holdings ltd in 2004 and serves on the human resources and remuneration committee.
Board of directors

KAP Integrated Annual Report 2012 9
group overview
p K (paTRicK) QuaRmBy (58)
CA(SA) (Hons)
Independent non-executive director, chairman of audit and risk committee
Patrick was a partner at ernst & Young until moving overseas in 1987. During his nine years overseas he was employed in the corporate Finance Department of Schroders in london. He was one of the founding directors of Standard Bank in london and established Standard Bank’s presence in Hong Kong. Patrick returned to South Africa and was appointed a director of Dimension Data Holdings ltd in 1996, responsible for the global expansion of the group. He was the non-executive chairman of Datacraft Asia, an It services company listed in Singapore, until it delisted in 2008, and an independent non-executive director of Unitrans ltd until the acquisition by Steinhoff of Unitrans in 2007. Patrick was appointed as an independent non-executive director of KAP International Holdings ltd in 2012 and serves as the chairman of the audit and risk committee.
The board of directors is supported by an executive committee comprising executive directors and senior management of KAP International. This team carries out the day-to-day management of the group and the tasks delegated to it by the board. An overview of the executive team and their management is provided in the accompanying management booklet.
c J h (chRis) Van nieKeRK (64)
BA
Non-executive director
After a long career in the chemical industry with Sentrachem group, where chris managed several operations, he was appointed to the board of Pg Bison in May 1998 as chief executive officer. chris led the successful management buy-out of Pg Bison from PgSI. Steinhoff Africa Holdings acquired Pg Bison in 2006, expanding the business into sawmilling and forestry. chris also holds several other directorships including those at ncP chlorkem, chlor Alkali Holdings, walvis Bay Salt Holdings and Phumelela gaming and leisure ltd. chris was appointed as a non-executive director of KAP International Holdings ltd in 2012.
d m (danie) Van deR meRwe (54)
BComm, LLB
Non-executive director, member of human resources and remuneration committee
Danie is the chief executive of Steinhoff Africa and Asia Pacific and was appointed to the Steinhoff International Board in 1999. He was admitted as an attorney of the High court of South Africa in 1986 and practised as an attorney, specialising in commercial and labour law. In 1990, Danie joined the Roadway transport group and was instrumental in developing the strategic direction and growth of this group. In early 1998, following the merger of Roadway transport group with Steinhoff Africa, Danie joined the Steinhoff group. He currently serves on several Steinhoff group companies including Pg Bison (Pty) ltd and JD group ltd. Danie was appointed to the board of KAP International Holdings ltd in 2005 and serves on the human resources and remuneration committee.

10 KAP Integrated Annual Report 2012
gROUP OveRvIewInvestment case
KAP’s investment case
Market share leadership
enhances KAP’s competitive position.
KAP concentrates on businesses that are the
largest or second-largest business in a specific
industrial sector, or that have the potential to reach
that level in the short to medium term.
Market shareleadership
Industry diversification
Our model is one of diversification within industrial industries. Within our portfolio, certain cyclical industries are balanced by less cyclical businesses. This versatility facilitates the management of concentration risk and protects and enhances margins.
Emerging market appeal
Our operations are positioned towards emerging markets, with a specific focus towards Africa. Growth prospects in Africa should be more favourable than in a depressed developed market environment.
Supply chain services
Specialist knowledge and experience in operating efficient supply chain solutions and effective management of warehouses and distribution networks is a key strategic advantage for the group. This positioning gives the group an industry-wide overview of the market, resulting in greater economic impact.
Sustainability
The importance of sustainability remains key. We regularly review and adapt our policies and processes to reinforce our ability to be economically viable, socially responsible and environmentally sound. It is important for us to balance these three pillars of sustainability while still being competitive in our chosen business markets.
the group remains focused on managing the long-term sustainability of its businesses and business practices to maintain and grow the benefits it provides to its stakeholders.
Our strategy is to capitalise on the industrial advantages within emerging African markets and aim to be leaders in the markets that we serve.
Our business activities are underpinned by our responsibility to:
Our customers and partners who rely on our ability as a business to remain competitive
Our employees and their communities to be part of a fair, transparent and successful business
The environment and our ability to manage our impact on it

KAP Integrated Annual Report 2012 11
group overview
Strategic objective #1 / Profitable revenue growth
Emerging consumer
growth
The group’s customer-focused businesses aim to capitalise on increased passenger transport opportunities (Unitrans Passenger) and increased demand for food, footwear, furniture and textiles (Jordan, Bull Brand, Brenner Mills and Glodina).
Hosaf (PET) and Feltex (automotive components) should also benefit as the demand by customers for their product increases through their supply to growing consumer numbers.
African infrastructural
growth and development
In line with economic growth expectations, infrastructural growth in southern Africa is expected to continue. The group is well positioned to capitalise on these developments through USCS, PG Bison (integrated timber), Hosaf (PET production), Feltex (automotive component production) and its industrial footwear businesses.
Our strategy should ultimately result in measurable revenue growth in emerging African markets and unlock sustainable value for all stakeholders.
The logistics business remains dedicated to maintaining and increasing its specialised supply chain contracts by focusing on innovation and adding value through world-class service delivery. In addition, USCS provides various degrees of logistical infrastructure and operational support to customers in challenging emerging African markets.
Strategic objectives

12 KAP Integrated Annual Report 2012
Strategic objective #2 / Solid returns on capital employed
Experience in emerging
markets
Access to scarce raw
material
Established in high-barrier to entry industries
To unlock sustainable value for all stakeholders, our strategy should ultimately result in measurable solid returns on capital employed.
Experience and knowledge in the timber, foam and chemical industries afford the group a competitive advantage in our manufacturing and sourcing operations.
Logistics is a key component within supply chains and the group’s experience and scale on this key process will continue to benefit our internal businesses and external customers.
Owning and investing in key raw material businesses provides the group access to raw materials (timber, foam and chemicals), which remain under threat. To build on this, we explore and successfully maintain sustainable long-term partnerships and contracts with key strategic suppliers.
Worldwide volatility in fuel prices, pressure on natural resources, greater emphasis on sustainability and more stringent health and safety requirements have increased the barriers to entry within the logistics industry. In order to be competitive in this highly regulated industry, a significant degree of experience, scale and specialisation is required.
We manage and minimise our carbon emissions and place emphasis on environmental initiatives and output efficiencies.
Market leadership
All the divisions are already prominent players in their markets, affording the group the opportunity to capitalise on its African experience and knowledge.
The specialised nature of supply chain applications and our knowledge and expertise in logistics and warehouse platforms, assist in containing and where possible reducing the impact and costs associated with distribution, fuel and energy.
Investment in technology
and infrastructure
Diversification
Investment in technology results in improved use of raw materials, increased efficiencies, cost reductions and more market-focused products.
A diverse and enhanced product range and industry spread supports growth plans in South Africa and other selected African countries.
Growing sustainable
earnings
We invest in properties key to our underlying operations. Ownership of strategic industrial properties protects our competitive advantage and also sustains the long-term cost structures of our business.
Strategic objectives continued

KAP Integrated Annual Report 2012 13
group overview
creating the right platform
KAP supports the policy of the South African Government towards an “integrated and coherent socio-economic process that directly contributes to the economic transformation of South Africa, brings about significant increases in the number of black people that manage, own and control the country’s economy, and results in significant decreases in income inequalities”.
We observe and proactively align our day-to-day business practices in South Africa with the broad-based black economic empowerment (B-BBEE) codes and guidelines. It is our commitment to make the principles of B-BBEE real and tangible for our group.
Many citizens in South Africa have already benefited from the implementation of B-BBEE, but we want to ensure that our employees and their long-term welfare are part of our strategy. Approximately 14 000 KAP employees (part of the previous Steinhoff Industrial assets’ operations) participate in a Steinhoff International share scheme holding more than 40 000 000 Steinhoff International shares.
Multifunctional skills are required for our specialised and diverse businesses. Access to the best skills in our industries will result in the ability to bring products to market at the best prices, while maintaining value and quality.
Retaining experienced employees and recruiting specialised and critical skill sets support our strategic objectives. By actively managing talent, we ensure that critical workforce segmentations are maintained and developed, and that succession is ensured. Talent management actively enforces knowledge sharing programmes, while upgrading skills through continuous training.
Skills and talent management
Market growth in emerging African markets should be a key contributor to our future growth. We support the development of the consumer in emerging African countries by contributing to economic growth.
We further believe in our contribution towards community development and corporate responsibility investment and will continue to support the communities that we serve through sustainable initiatives.
Social awareness Transformation
To grow revenue and earn solid returns on capital employed, the management teams of each division and underlying businesses have the autonomy to employ the appropriate people for their businesses to implement group strategy in a way that best align with their businesses.
This decentralised structure supports the retention and developments of in-depth industry, market and consumer knowledge and relevant experience that the group has acquired within the divisions. It further enhances sustainable earnings growth in each division.
Each division is empowered to innovate and change in a way that is responsive, responsible and within the group’s centralised governance structures. The empowerment of divisional management and employees enhances and sustains the entrepreneurial culture, to ultimately add value to the group.
Decentralised management structure and
entrepreneurial culture

14 KAP Integrated Annual Report 2012
gROUP OveRvIewStakeholders
Surveys
Road shows
Investor days
One-on-one meetings
Publications of results
Dedicated analyst and investor presentations
Dedicated communication channels
Shareholders and investors
One-on-one meetings
Supplier conferences
Supplier reviews and audits
Tender and procurement processes
Supplier performance management assessments
Suppliers/ service
providers
Financial institutions
Finance applications
Media publication of financial results
One-on-one meetings
Road shows
Credit participation
Dedicated analyst and investor presentations
Dedicated communication channels
Customer relationship managers
Trade fairs and expos
Satisfaction surveys
Market research
Customer liaison, complaints and returns
Dedicated customer accounting and analysis
Customers
Our key stakeholders have been identified through ongoing engagement with various individuals, groups and organisations. we acknowledge the importance of the intelligence we as a group gain from their insights, questions and continued interest in our business activities.
Stakeholder engagement is a partnership that we rely on. we strive to engage in a manner that is personal, open and honest. we use various platforms and methods of communication to reach, respond and listen.
there are no stakeholders with whom the group is not prepared to engage.
KAP has identified the following key stakeholders
Expectations:that sustainable and profitable long-term growth is achieved through ethical and responsible business practices.
Expectations:to supply and receive quality products and services. It is the group’s responsibility to continuously improve on the quality of our products and services, at a reasonable price to deliver on our customers’ expectations and to expect the same from suppliers.

KAP Integrated Annual Report 2012 15
group overview
Establish constructive relationships
Comment on developments in legislation
Participate in forums
Trade missionsGovernments
Establish constructive relationships
Comment on developments in regulations
Participate in forums
Regulatory reportingRegulators
Employer associations
Industry associations
Lobby groups on various matters
Trade unions
Industry bodies and
advisory councils
Trade union meetings
Employee representative forums
Operational workforce committees
Management and employee representative interaction
Bargaining councils
Trade unions
Expectations: that the business operates in accordance with all relevant legislative and regulatory requirements.
Interviews and publications
Presentations
Road shows
Press & media
Communications from chief executives
Newsletters
Intranet
Induction programmes
Training sessions
Road shows and briefings
Employee surveys
Performance management programmes
Anti-fraud, ethics and corruption hot line
Employer associations
Employees
Participating forums
Events and sponsorships
Media channels
Communities
Expectations:Open and robust communication, transparency and the long-term sustainability of the business.

16 KAP Integrated Annual Report 2012
KAP Integrated Annual Report 2012 17
Reports to stakeholders
reports to stakeholders

18 KAP Integrated Annual Report 2012
RePORtS tO StAKeHOlDeRSchairman’s report
with a difficult year just past, uncertain prospects for the developed global economy, with strong economic growth predicted for African economies, nevertheless are placing pressure on companies across the world to ensure they are resilient yet able to capitalise on opportunities.
the management at KAP has, we believe, responded well to these trading conditions. change has been prescribed and implemented so that your company today is stronger, and better positioned for future growth.
In April 2012, Steinhoff sold its African industrial assets to KAP – assets with an enterprise value of R8,9 billion. the acquisition will see the business rebrand itself, subject to shareholders’ approval, as KAP Industrial Holdings limited, in order to appropriately reflect the business’s diversified focus areas and in line with the nature of its major assets.
KAP is now one of Africa’s largest industrial companies, providing logistics, integrated timber and manufacturing services in a fast-moving emerging environment.
All of KAP’s divisions delivered strong annual results for the twelve months ending 30 June 2012, despite our integrated timber operator, Pg Bison, experiencing challenging trading conditions in a weakened market.
It is pleasing to note that revenues are up strongly; operating profits, likewise, have improved and the key eBItDA measure was up 8% on the prior year.
cash flow from operations (R1,9 billion) exceeded operating profit (R1,1 billion) by 72%, thereby underscoring the group’s quality of earnings and future growth prospects within prudent financial covenants and norms. these good cash flows have, in turn, effectively reduced the group’s net finance costs.
eBItDA interest cover ratio has improved from 3,4 times to 4,5 times and the group’s debt-to-equity ratio has also improved, from 94% to 64%.
we’re also very pleased to announce that due to excellent cash flows this year, the board has declared a final dividend of six cents per share, from income reserves. this reinforces our commitment to deliver value to our shareholders and it demonstrates our confidence in the group’s future performance, given the current market conditions.
Being a corporate citizen of good standing has been part of the KAP group’s responsibility for many years. In the past we have reported on governance, social and environmental initiatives.the objective this year, is to re-evaluate and align group-wide
projects with our overall strategy, thereby streamlining the interdependency of these business pillars. good progress in this regard has already been made. In the 2013 year our biggest task will be to evaluate the baseline of the newly-integrated KAP group to better understand our impact on the environment and to, in future, develop an appropriate sustainable strategy in order to better manage this impact, set realistic targets and measure our performance. By doing so we will aim to address all requirements of King III and the JSe’s Socially Responsible Investment Index. All stakeholders are important to us – investors, employees and all other external groups we interact with. no strategy or initiative will be implemented without due consideration of all these stakeholders. All these aspects have been fully addressed in this integrated report and more information on our current position is available in the stakeholder, governance and sustainability reports.
I would like to congratulate and formally welcome Jo grové as KAP’s newly-appointed group ceO. Jo was in charge of Unitrans for nearly 15 years. On behalf of all staff, shareholders and other stakeholders, we look forward to working closely with him and enjoying the benefit of his experience and expertise in the years ahead.
I further extend a warm welcome to our two newly-appointed independent non-executive directors to the board, Patrick Quarmby and Steve Muller. Our board of directors now comprises a powerful combination of leaders that will bring a broad range of insight, expertise, skills and in-depth experience of good corporate governance practices that, together, will help drive KAP to increased success.
the board is committed to continue to provide stakeholders and other interested parties access to our integrated report process and performance, incorporating the principles of King III in our governance practices as we continue to implement sustainable leadership practices.
Africa is a fast-moving emerging market that requires us to constantly review the strategic direction best suited for our business. the group has now been established as a significant emerging market industrial player with good positioning in growth markets and industries, a strong balance sheet and the support of a large controlling shareholder. we believe that the group is well positioned to delivery satisfactory returns to shareholders.
Jaap du Toitnon-executive chairman
It is with pleasure that I present my first report as the chairman of KAP International Holdings for the financial year ended 30 June 2012.

KAP Integrated Annual Report 2012 19
Jaap du TOiTindependent non-executive chairman
Strategic transactions have led to the establishment of the new diversified business
the final dividend award of 6 cents per share underscores KAP’s commitment to shareholders
Our skilled board will help to drive future growth targets

20 KAP Integrated Annual Report 2012
RePORtS tO StAKeHOlDeRSchief executive officer’s report
Strategic developments and corporate activitythe acquisition of the Steinhoff Industrial assets in April 2012 included the acquisition of Unitrans, Pg Bison, vitafoam, BcM (Bedding component Manufacturers) and DesleeMattex. the acquisition strengthened our strategic position and market leadership in our chosen industries. It also diversified our industrial presence in line with our strategic priority in this regard.
with the acquisition of the Steinhoff Industrial assets, our core manufacturing business is now enhanced by logistics and timber, making KAP International Holdings one of Africa’s largest industrial companies.
Our significantly higher market capitalisation positively positions the group to capitalise on future growth opportunities, particularly across the African continent. the combined business reduces the risk of cyclicality, with all four divisions of KAP well positioned to benefit from normal business cycles.
KAP now comprises four divisions and three reporting segments, namely logistics, manufacturing and integrated timber.
Former KAP group ceO, Paul Schouten, now leads the group’s enhanced manufacturing division, producing key technical products and iconic brands across key strategic industries in South Africa.
the logistics division includes Unitrans Supply chain Solutions (UScS), headed up by Frank wagner and Unitrans Passenger under the leadership of nico Boshoff.
Finally, the integrated timber division, Pg Bison, is led by ceO, gary chaplin, where their focus is on forestry, timber beneficiation, board production and upgrading.
In line with our decentralised management structure, these leaders and their management teams are empowered to independently implement group strategy within the group’s
this opportunity that we’ve been handed to take this business to the next level is just remarkable, and we have a great responsibility in terms of how we build this business and grow it into the future.
centralised governance structures. this empowerment of divisional management proved very successful in supporting the existing entrepreneurial culture of the group, ultimately resulting in sustainable earnings growth. I am confident that the divisional management teams will continue to build on their successful track record in the year to come. Appropriate incentive structures are in place to drive the sustainable performance of all divisions to reward the achievement of both short- and long-term targets. cash flow targets, amongst others, form an integral part of these incentive structures as is discussed in more detail in the remuneration report on page 55.
group operational review
Logistics
Revenue R6 822m 13%
Operating profit R701m 14%
Integrated timber
Revenue R2 286m 2%
Operating profit R273m (24%)
Manufacturing
Revenue R1 993m >100%
Operating profit R132m >100%

KAP Integrated Annual Report 2012 21
JO GROVÉchief executive officer
Acquisition of Steinhoff Industrial assets completed, positioning the business for future growth
Strong cash flows help reduce the group’s net finance costs
Headline earnings improve 16% to R490 million

22 KAP Integrated Annual Report 2012
Revenue and operating profit improvements were due primarily to a strong performance in the logistics division and to an impressive performance in the manufacturing division. KAP reported a 24% increase in revenue to R11 billion and a 7% improvement in operating profit before capital items to R1,1 billion. eBItDA before capital items was 8% up on the prior year at R1,7 billion.
the construction and timber industries were negatively affected by challenging market conditions which specifically affected profit growth at Pg Bison.
Segmental performanceLogistics KAP International Holdings’ logistics business, incorporating UScS and Unitrans Passenger, grew revenues by 13% to R6 822 million (2011: R6 044 million). the strategic positioning, high barriers to entry and experience in African markets again proved key in the improved results of the logistics division.
UScS secured various new contracts on good terms during the year with favourable underlying margins contributing to good returns on capital. the passenger division’s growth stemmed from new contracts concluded in the mining sector and through organic growth at the intercity operations. the opening of new passenger routes proved successful.
Integrated timberPg Bison, KAP’s timber operations, comprise forestry plantations and various manufacturing and distribution plants for sawn timber, poles, wood-based panel products, decorative laminates and solid surfacing materials, experienced weak market conditions and significant margin pressure. Revenues increased slightly to R2 286 million in 2012, from R2 240 million in 2011.
this division underwent a strategic review earlier this year and since then a major restructuring of the panel operation was completed.
chief executive officer’s report continued
Our intention is to reposition the division as the number one flat sheet board manufacturer and upgrader in Africa. the continued investment in this business, coupled with their unique ability to secure raw materials, will further enhance their competitive position.
Manufacturinggiven the acquisition the comparative numbers for the manufacturing division are distorted. However on a comparable basis, the automotive components, Pet (resin), footwear and food businesses reported a strong performance for the group.
this performance was led by good returns in Feltex, supported mostly by higher vehicle volumes, good operational efficiencies and very low reject rates. In addition, good volumes in carbonated soft drinks and increased demands in Pet buoyed Hosaf’s manufacturing performance.
However, the textile and raw materials operations experienced challenging trading conditions during the financial year.
Future outlookthe corporate activity undertaken during the year has established KAP as one of Africa’s largest industrial companies, and thus as a significant emerging market organisation.
we are excited about the prospects for our manufacturing operations with a new BMw, Mercedes and Ford/Mazda build on the cards which will benefit KAP’s Feltex business. Hosaf is expected to experience potential capacity increases in order to satisfy the recent increase in Pet market demand. Our newly-consolidated footwear group is also expected to experience growth as a result of its new organisational structure.
we are focused on renewing and acquiring logistics contracts at our UScS operations. In addition, it will be vital to capitalise on increased supply chain contracts across Africa in the year ahead. Our Unitrans Passenger services will also be targeting increased passenger contract growth.

KAP Integrated Annual Report 2012 23
Reports to stakeholders
Our newly-restructured Pg Bison business, and a planned upgrade of our medium-density fibre board, will certainly deliver growth.
In addition, the potential of disposing of non-core assets can create the opportunity to reinvest capital into strategic assets, despite weakened market conditions.
we look forward to Steinhoff adding significant value to our investment portfolio through its expertise in identifying and prioritising core growth opportunities.
AppreciationAs always, we are grateful to our shareholders, employees and other stakeholders for their continued support.
the past twelve months have been challenging and I appreciate the efforts and commitment of all leaders and staff, particularly during the restructuring of our business into the formidable group we have.
Finally, on behalf of all at KAP, I wish to thank our new chairman, Jaap du toit, and independent non-executives, Patrick Quarmby and Steve Muller, for joining us on the board of directors. I also want to thank the rest of the board for their dedication to the group and their support and guidance during the year.
I look forward to working with my fellow board members, executive committee, their management teams and our staff – delivering on our strategy.
Jo Grovéchief executive officer

24 KAP Integrated Annual Report 2012
RePORtS tO StAKeHOlDeRSchief financial officer’s report
Impact of the acquisition of the Steinhoff Industrial assetsthe acquisition of the Steinhoff Industrial assets, effective 2 April 2012, is classified as a reverse acquisition under IFRS 3 Business combinations, which has the following implications:
Income statement – the results for the traditional KAP assets are included for three months, while the results for the Steinhoff Industrial assets are included for 12 months. The comparative figures have been restated to reflect only the Steinhoff Industrial assets’ businesses.
Balance sheet – the net assets of the traditional KAP business were measured at fair value at the date of the acquisition, and the Steinhoff Industrial assets remain at carrying amounts as before the acquisition.
Operating profitOperating profit before capital items increased by 7% year on year, while eBItDA before capital items of R1 738 million increased by 8% year on year.
Performancethe increase in operating profit was due to a strong performance in the logistics division and improved performance in the manufacturing division. challenging market conditions in the construction and timber industries hindered profit growth at Pg Bison, but the restructuring referred to in the operational overview will restore the ability of this business to generate profitable growth.
the operating margin, at 10,0% (2011: 11,6%), declined as a result of the margin pressures experienced by Pg Bison, as well as the lower margins of the acquired KAP businesses which were included in the results for the first time.
Operating margins in the logistics division improved to 10,3% (2011: 10,2%).
the manufacturing division’s margins declined to 6,6% (2011: 6,8%) mainly due to the lower margins applicable to the acquired KAP businesses included for three months.
the timber division’s margins declined to 11,9% from 16,1% in the previous financial year, which reflects the restructuring charges and bears testimony to the market challenges that this division experienced during the year under review.
Finance costsgood cash flows during the year have resulted in net finance costs reducing to R382 million for the year (2011: R475 million). the eBItDA/interest cover ratio is at a comfortable 4,5 times (2011: 3,4 times).
taxationthe taxation rate of 27,3% (2011: 28,7%) approximates the South African statutory rate, which is appropriate given the jurisdictions in which the group operates. In the medium term we expect the effective tax rate to continue approximating statutory rates.
earnings per share (ePS) and headline earnings per share (HePS)ePS increased by 100% to 28,4 cents, while HePS increased by 10% to 24,2 cents. the difference between ePS and HePS relates mainly to the effects of the change in capital items from a loss of R157 million in 2011 (largely as a result of the disposal of investments) to a profit of R81 million in 2012 (largely as a result of negative goodwill of R93 million arising from the reverse acquisition).
the acquisition of Unitrans, Pg Bison, vitafoam, BcM and DesleeMattex (the Steinhoff Industrial assets) became effective on 2 April 2012. For accounting purposes the transaction is regarded as a reverse acquisition.

KAP Integrated Annual Report 2012 25
JOhn haVemanchief financial officer
26 KAP Integrated Annual Report 2012
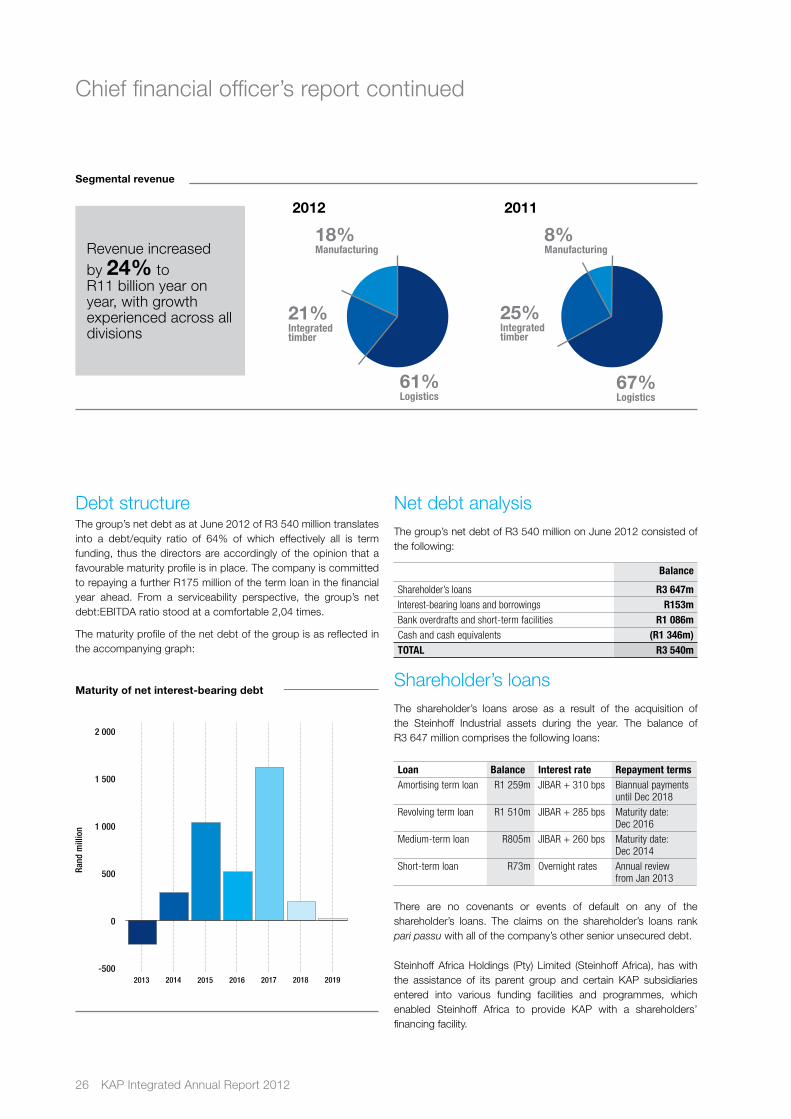
chief financial officer’s report continued
net debt analysisthe group’s net debt of R3 540 million on June 2012 consisted of the following:
Balance
Shareholder’s loans R3 647mInterest-bearing loans and borrowings R153mBank overdrafts and short-term facilities R1 086mCash and cash equivalents (R1 346m)TOTAL R3 540m
Shareholder’s loansthe shareholder’s loans arose as a result of the acquisition of the Steinhoff Industrial assets during the year. the balance of R3 647 million comprises the following loans:
Loan Balance Interest rate Repayment termsAmortising term loan R1 259m JIBAR + 310 bps Biannual payments
until Dec 2018
Revolving term loan R1 510m JIBAR + 285 bps Maturity date: Dec 2016
Medium-term loan R805m JIBAR + 260 bps Maturity date: Dec 2014
Short-term loan R73m Overnight rates Annual review from Jan 2013
there are no covenants or events of default on any of the shareholder’s loans. the claims on the shareholder’s loans rank pari passu with all of the company’s other senior unsecured debt.
Steinhoff Africa Holdings (Pty) limited (Steinhoff Africa), has with the assistance of its parent group and certain KAP subsidiaries entered into various funding facilities and programmes, which enabled Steinhoff Africa to provide KAP with a shareholders’ financing facility.
Debt structurethe group’s net debt as at June 2012 of R3 540 million translates into a debt/equity ratio of 64% of which effectively all is term funding, thus the directors are accordingly of the opinion that a favourable maturity profile is in place. the company is committed to repaying a further R175 million of the term loan in the financial year ahead. From a serviceability perspective, the group’s net debt:eBItDA ratio stood at a comfortable 2,04 times.
the maturity profile of the net debt of the group is as reflected in the accompanying graph:
Maturity of net interest-bearing debt
2 000
1 500
1 000
500
0
-5002013 2014 2015 2016 2017 2018 2019
61%Logistics
21%Integrated timber
18%Manufacturing
67%Logistics
25%Integrated timber
8%Manufacturing
Segmental revenue
2012 2011
Revenue increased by 24% to R11 billion year on year, with growth experienced across all divisions
Rand
mill
ion

KAP Integrated Annual Report 2012 27
Reports to stakeholders
Segmental operating profit before capital items
63%Logistics
25%Integrated timber
12%Manufacturing
5%Manufacturing
60%Logistics
35%Integrated timber
2012 2011
Operating profit before capital items increased by 7% year on year, while eBItDA before capital items increased by 8%
the new subsidiaries of KAP International Holdings limited have provided suretyships, guarantees and indemnities in respect of the liabilities of Steinhoff and Steinhoff Africa Holdings (Pty) limited in respect of pre-existing funding and other funding.
given the benefits arising from the cost of funding from Steinhoff and the fact that Steinhoff Africa also remains bound as guarantor of some of the existing funding arrangement of the new KAP subsidiaries, KAP has agreed to keep these arrangements in place.
net asset valuenotwithstanding the increase in the number of shares notionally issued in terms of IFRS 3 of 424,5 million shares, as at 30 June 2012 the net asset value per share increased by 16% from 206 cents to 238 cents.
working capitalnotwithstanding the inclusion of the traditional KAP’s net working capital in the balance sheet, the group was able to limit the increase in working capital to R358 million.
cash flowcash flow from operations of R1 906 million exceeded operating profit of R1 106 million by 72%, which underscores the group’s quality of earnings and is an encouraging signal with reference to the group’s growth prospects within prudent financial covenants and norms.
Final dividend announcementIn light of the good cash flows for the year, the board has declared a final dividend of 6 cents per share from income reserves, for the period ended 30 June 2012, which amounts to approximately 4 times headline earnings cover.
John Havemanchief financial officer

28 KAP Integrated Annual Report 2012
South Africa
namibia
Botswana
lesothoSwazilandMozambique
Madagascar
tanzania
MalawiZambia
Kenya
Zimbabwe

KAP Integrated Annual Report 2012 29
operational review
Operational review
30 KAP Integrated Annual Report 2012
Integrated and diversified
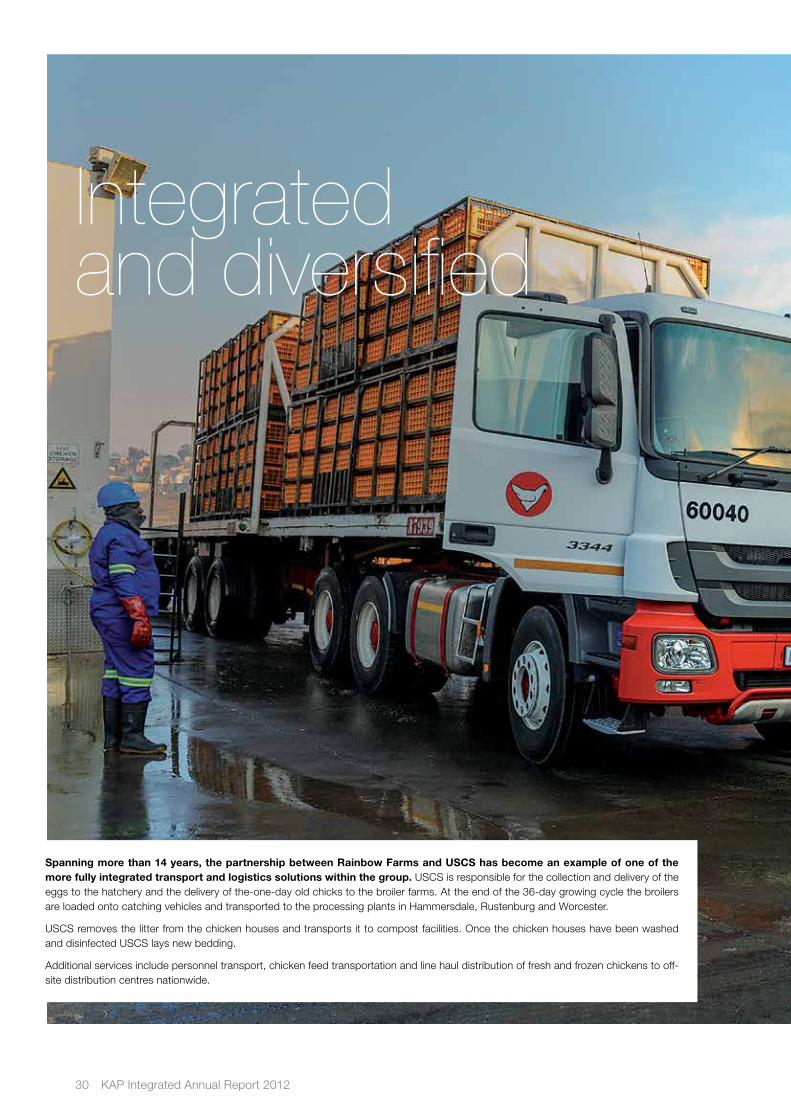
Spanning more than 14 years, the partnership between Rainbow Farms and USCS has become an example of one of the more fully integrated transport and logistics solutions within the group. UScS is responsible for the collection and delivery of the eggs to the hatchery and the delivery of the-one-day old chicks to the broiler farms. At the end of the 36-day growing cycle the broilers are loaded onto catching vehicles and transported to the processing plants in Hammersdale, Rustenburg and worcester.
UScS removes the litter from the chicken houses and transports it to compost facilities. Once the chicken houses have been washed and disinfected UScS lays new bedding.
Additional services include personnel transport, chicken feed transportation and line haul distribution of fresh and frozen chickens to off-site distribution centres nationwide.

KAP Integrated Annual Report 2012 31
Logistics
Integrated and diversified

32 KAP Integrated Annual Report 2012
OPeRAtIOnAl RevIewlogistics
we strive to be much more than just a transporter. we make sure that in any
solution to our customer there is an element of innovation and that what we deliver is
excellence, in whatever we do.
Services include
Supply chain and network design
Warehouse design and optimisation
Inventory management and optimisation
Supply chain consulting
Warehousing and distribution
Transportation and logistics
Clearing and forwarding
Hazardous goods supply chain design and execution
Diversified agricultural and mining services
Operational execution across the supply chain
133 locations
in 10 African countries
11 800employees
Strategic priorities
Build on our existing specialist skills and business model to differentiate against competitors
Managing our industry and customer exposure to guard against concentration rsik
Continued focus on operational excellence and the retention of existing customers
Continuous improvement and innovation to ensure that our solutions remain competitive and are sustainable
Introduction of niche multi-party warehousing solutions
Continued management of risks with specific emphasis on health and safety, employee training and environmental impact
49%Freight and Logistics
30%Fuel and
Chemical
21%Agriculture and
Mining
Revenue

KAP Integrated Annual Report 2012 33
Operational review
Period under reviewthe division achieved good operational results in the year under review. Revenue increased due to various new contracts entered into during the year. All major contracts due for renewal during the year were successfully renewed or restructured.
Service standards remained high and customer satisfaction levels were good.
new contracts have been secured on good terms and underlying margins have been favourable, producing good returns on capital. Strong cash generation, good working capital management and cost control further contributed to the positive results.
A star performance for the year was achieved in health, safety and environmental management. A positive trend was achieved in the number of incidents and accidents recorded, which resulted in a reduction in the cost of incidents, accidents and insurance despite the significant expansion of the business during the year.
the road freight industry enjoyed relative stability on the labour front due to the two-year industry wage agreement entered into during the early part of 2011. Industrial relations within UScS remains good with only a few minor work stoppages recorded during the year. However, wage negotiations had some effect on the business during September 2012. All necessary arrangements were in place to minimise the impact on trading during the strike action.
the decision by some of our major customers in the oil industry to exit some of their downstream distribution and retailing activities has presented new challenges to the Fuel and chemical division. nevertheless, further new business was secured during the year under review and the business unit recorded good growth in this challenging environment.
Adverse weather conditions affected the sugar cane crop in South Africa during the season, which had a negative impact on the activities of the agricultural division during this year. However, management did well to mitigate the impact of these reduced volumes by securing other short-term work to utilise all available capacity.
the mining division experienced strong results due to increased volumes and good cost controls.
currency volatility in other African countries and political instability in Malawi created additional challenges for management in these territories. Further mitigating controls have been introduced and management is comfortable with the residual risk associated with operating in these countries.
ProspectsA major new mining contract was secured in Mozambique during the past year and we commenced operations during the latter part of the year under review. Year-on-year profit growth from this region will therefore be good and we expect further business from the mining industry in Mozambique in the future.
new business development resources have been deployed in Zambia, tanzania and Mozambique and we expect to secure significant growth from opportunities presented in these fast-growing territories. It is our strategy to follow existing customers into these countries and to secure further relationships with large multinational companies active there. Agriculture, mining and infrastructure development are the sectors targeted which offer good potential.
Further new contracts secured in the beverage, household goods, and petrochemical industries in South Africa will assist to counter the lower gDP growth expected for the year ahead.
In 1986 Frank completed his studies as a chartered accountant while doing his articles at
Greenwood Ironside Chartered Accountants. In 1987 he moved to Trencor Transport where he became the financial manager. In 1997 he was part of the management group that together
with a BEE partner, acquired that division to form Crossroads Distribution.
Frank has been with Unitrans Supply Chain Solutions since 2006. In 2006 he became a director of the Road Freight
Association, and served as chairman for two years.
FRanK waGneRceO, uscs

34 KAP Integrated Annual Report 2012
Service through transport
Mega Bus, the personnel and commuter transport division of Unitrans Passenger is proud of its longstanding partnerships and relationships with large key customers and government. Mega Bus provides them with a service that addresses their requirements regarding the transportation, health and safety of their employees during transportation. the buses provided for customer contracts are built to the safety specifications required by the customer and by law, which in turn, is in keeping with the health and safety standards of Unitrans. Mega Bus has very stringent measures and processes in place at all depots – ensuring the highest levels of safety and service. critical safety factors include that all vehicles undergo thorough and regular mechanical inspection, driver medicals, ongoing driver training, regular induction, operational and management meetings, safety audits, radio communication and real-time vehicle monitoring.
Drivers play an integral role in the safe transportation of passengers and their working hours are managed according to South African law, preventing driver fatigue. vehicle tracking is done from a 24/7 central control room at each operating depot. tracking monitors the route and the speed of each bus. this control measure decreases traffic rule infringements and increases safety and overall control of each vehicle, assists route inspectors and improves response times in case of any unforeseen emergency. All buses are fitted with seat-belts and passengers are required to buckle up when taking a seat.

KAP Integrated Annual Report 2012 35
Passenger
Service through transport

36 KAP Integrated Annual Report 2012
OPeRAtIOnAl RevIewPassenger
Bolt-on contracts are key to our organic growth strategy. Our ability to utilise
existing infrastructure to incorporate new contracts, has added value and a pricing
benefit to remote commuter contracts.
3 400employees
Operating divisionsTourism transport: Mega Coach, Magic Bus
Commuter transport: Bonjanala Bus, Mega Bus
Personnel transport: Mega Bus
Intercity: Citiliner, Greyhound
Gautrain feeder and distribution service: Mega Express
Strategic priorities
Expansion of national ticket distribution network by means of adding 500 additional outlets through our ticket sales arrangement with major national food outlets
Continued focus on maintaining and expanding a nationwide footprint within niche markets
Maintain competitively priced products with due regard for fluctuating input prices
Continued focus on health and safety by prioritising training and development of drivers and technical staff
Revenue
56%Commuter and
personnel transport
28%Intercity
9%Gautrain
7%Tourism
1 207 buses in fleet

KAP Integrated Annual Report 2012 37
Operational review
Period under reviewthe passenger division delivered a strong set of results for the year with revenue growth achieved and margin protected in a volatile fuel price environment. these results were achieved despite extremely difficult trading conditions, with the increased fuel price being one of our major challenges.
Operating divisions showed good growth, however, the tourism division declined as a result of slower inbound volume compared to that of the previous year. contributions from new contracts that commenced during the year enhanced our earnings and additionally, organic growth at some existing operations also played an important role in generating additional revenue and profit. the intercity division benefited from a new citiliner route between Johannesburg and cape town via Bloemfontein and from the extension of the greyhound service between Johannesburg and Kimberley to Bloemfontein. Mega express (gautrain feeder and distribution service) also benefited from operating a shuttle service between Rosebank Station and Park Station during times when no train service was operable due to maintenance procedures.
the following factors remain a challenge and management has already put strategies in place to address them:
The decreased tourism demand has increased competition for this division and has affected margins. In addition, demand for larger vehicles is decreasing in favour of smaller vehicles as tour groups are getting smaller. This trend has led to a strategic review of our own asset strategy.
Although some respite in the fuel price was seen in June 2012, the market remains volatile and adverse fuel price increases remain a risk to the business meeting its set objectives.
throughout our business we embarked on an efficiency drive and continued to focus on reducing operating and fixed overhead costs. these initiatives ensured that we were in a position to deliver good results.
Our carbon footprint is an area of focus, both from a cost and environmental perspective. certain design changes to combustion engines were introduced by manufacturers and are aligned to the euro emission standards. Although compliance with the euro I standard still needs to be implemented by the South African authorities, a large portion of the passenger fleet is already euro III compliant.
ProspectsOrganic growth has been a success area for the passenger division and this will continue to be our focus for the year ahead. we have submitted a number of proposals in response to tenders issued and we await the outcome of these. Should we be successful, most of these will be operated out of our existing infrastructure, without much additional overhead cost.
On the intercity side, we are busy with feasibility exercises for expansion into Africa. these will have to be carefully considered as they come with their own set of risks.
Nico joined Unitrans Limited in 1995 after the passenger transport business he owned was
acquired by the Unitrans group. He was instrumental in developing the
passenger business and its brands.
He comes with many years’ experience in the passenger transport industry. He was
instrumental in the development of the Gautrain feeder and distribution project in
Johannesburg, Gauteng.
nicO BOshOFFceO, unitrans passenger

38 KAP Integrated Annual Report 2012
Recycling waste to energy
The production process of particle board requires that the wood fibre (wood chips that are used in particle board) be dried before it enters the production process. the resin that is used to bind the particle board also needs to be heat activated after the particle board mattress has been compressed. to supply the heat needed for these two processes, a 45 Mw step grade thermal energy plant was specifically designed and built for Pg Bison’s production facility in Ugie.
the energy plant is fuelled by using recycled packaging material and wood residue (waste) (bark and sanding dust generated from other processes in the facility). Hot air (300 000m3/h flue gas), is generated in a mixing chamber at a temperature of 750oc which in turn heats up the Recalor rotary wood dryer and the thurbex oil heater. the vyncke energy plant generates 32 500 000 kcal/h of energy to heat 72 000 litres of thermal oil to 280oc and to dry 38 tons of wood fibre from 120% bd to approximately 1,5% bd per hour. the resin activation process requires 68 000 litres of heated oil to be continuously fed through the “contiroll” press and MFB press, after which it recycles back into the system to be reheated and reused.
the heat:mass balance of the thermal plant was specifically calculated and predetermined in accordance with the amount of fuel (waste material) the thermal plant would need. this ensures that the production facility will only be supplied with material from its own processes without having to buy or supplement the plant with additional material for fuel. By using self-generated and 100% sustainable residue (bio-waste) material, a cost saving of an estimated R13,2 million per year is achieved.

KAP Integrated Annual Report 2012 39
Integrated timber

40 KAP Integrated Annual Report 2012
OPeRAtIOnAl RevIewIntegrated timber
Our panel strategy is ultimately very simple; we
strive to be the number one flat sheet manufacturer and
upgrader in Africa.
Business divisions include
Panel products: production and sale of raw and upgraded particle board and medium-density fibre board (MDF), and sale of high-pressure laminate products
Southern Cape Timber: production and sale of sawlogs, treated poles and sawn timber
Woodchem: production and sale of formaldehyde and UF resins for consumption in its board manufacturing and board upgrading processes
Weatherboard: production and sale of sawlogs, sawn timber and packaging materials
91 000hectares of forestry land
2 400 employees
Strategic priorities
Renewed focus to becoming the number one flat sheet board manufacturer and upgrader (value adding) in Africa
Streamlining product ranges, marketing and sales activities and manufacturing assets
Realigning and optimising logistics infrastructure, focus and costs
Investment in strategic manufacturing and upgrading technology
70%Panel products
30%Other
Revenue*
* Includes intercompany turnover

KAP Integrated Annual Report 2012 41
Operational review
Period under reviewMarket conditions for the period under review were very competitive with soft demand from the construction, furniture, packaging and agriculture sectors, and robust competition for market share. An influx of imported products put market prices under further pressure.
the division showed satisfactory growth in market share, which assisted in recovering manufacturing overheads. In addition, in line with the company’s strategy of increasing its ratio of value adding/upgrading its board products, the volume of value adding was increased by 18% over the prior year.
cost pressure was experienced due to an increase in the global commodity prices of underlying raw material components of resin manufacture, and in energy costs (electricity, fuel, gas and coal), both of which also affected competitors.
Increased production volumes were achieved through slightly increased market share, and increased volumes of value adding largely off-set the effects of cost increases and price pressures.
trading profit was negatively affected by two main issues, firstly, the company experienced industrial action in the form of a 28-day industry strike during July and August 2011, costs of which are estimated to be R22 million; and secondly, restructuring costs of implementing the above-mentioned strategy.
ProspectsIn order to implement our strategy, the division restructured its balance sheet and operations to focus on key investments into strategic long-term assets, concentrating primarily on the manufacture and upgrading of flat sheet board products.
the renewed business model following the restructuring, should reduce Pg Bison’s cost of production and delivery to market, and provide sustainability of this competitive cost base over the long term.
the division has therefore entered the new financial year as a leaner and more focused business. cost of product to market will continue to be improved as its streamlined business model becomes fully operational.
we will continue to pursue market share growth, and to grow the ratio of value adding/upgrading. this will be facilitated through the increased focus on product development, product and relationship marketing activities, and improved sales competencies.
the division will substantially complete installation of the new MDF forming line and “contiroll” press during the 2013 year. It will also conclude investigations early in the new year into additional investment in strategic assets to further enhance its value adding/upgrading strategy.
Gary was appointed to the board of PG Bison on 1 August 2006, and was
appointed as chief executive officer in October 2011. After qualifying as a chartered accountant in 1992,
Gary completed his articles and was seconded to the United States with Deloitte in 1995.
In 1996, he joined a private family business prominent in the timber industry, which was soon thereafter acquired by the Steinhoff group. During his 15 years within the Steinhoff group, Gary has
managed a range of businesses and divisions across forestry, sawmilling (poles, furniture and doors), and manufacturing, which service both the domestic and
international markets. GaRy chaplinceO, pG Bison

42 KAP Integrated Annual Report 2012
Customer partnerships enhance sustainable growth
To secure and enhance future growth, Feltex Automotive has partnered with one of its key vehicle manufacturing customers. with a long-term contract in place, Feltex Automotive has custom designed and built an automotive trim factory in garankuwa to exclusively supply all the soft trim components to a newly-launched german-designed vehicle. this investment in technology and infrastructure is indicative of our commitment to meeting the specific demands of our entire customer base, and is supported by our relationships with a number of technology partners.
this uniquely focused approach fully supports the group’s drive to grow and invest in African markets and complements our motor manufacturing partners in their expansion of their productive capacity in Africa.
KAP Integrated Annual Report 2012 43
Manufacturing

44 KAP Integrated Annual Report 2012
OPeRAtIOnAl RevIewManufacturing
we continue to maintain and improve our standards and customer service,
focusing on a philosophy of continuous improvement. through this we give our customers a solid reason to buy locally
produced products.
Business units include the manufacture and production of
Automotive components
Polyethylene terephthalate (PET/resin)
Footwear and towelling
Furniture and bedding components
Food products
Strategic priorities
To be a market leader within the underlying industry sectors
Maintain and improve our standards of customer service
Continuously explore growth opportunities
Maintain and improve on compliance and international standards and accreditations
Revenue
24%*Other
22%*Hosaf
14%*Feltex
40%Furniture
and bedding components
6 100employees
24 production facilities
* Consolidated for three months only
PET (resin)Automotive components Furniture and bedding componentsFootwear and towelling Food products
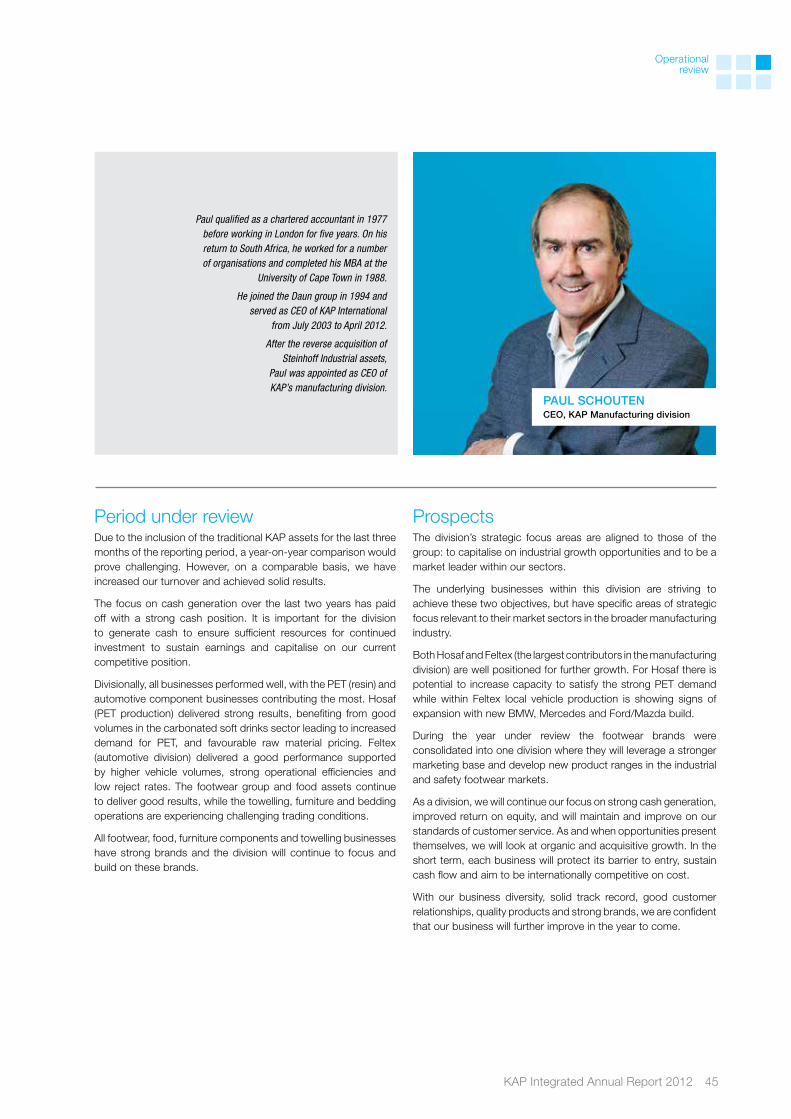
KAP Integrated Annual Report 2012 45
Operational review
Period under reviewDue to the inclusion of the traditional KAP assets for the last three months of the reporting period, a year-on-year comparison would prove challenging. However, on a comparable basis, we have increased our turnover and achieved solid results.
the focus on cash generation over the last two years has paid off with a strong cash position. It is important for the division to generate cash to ensure sufficient resources for continued investment to sustain earnings and capitalise on our current competitive position.
Divisionally, all businesses performed well, with the Pet (resin) and automotive component businesses contributing the most. Hosaf (Pet production) delivered strong results, benefiting from good volumes in the carbonated soft drinks sector leading to increased demand for Pet, and favourable raw material pricing. Feltex (automotive division) delivered a good performance supported by higher vehicle volumes, strong operational efficiencies and low reject rates. the footwear group and food assets continue to deliver good results, while the towelling, furniture and bedding operations are experiencing challenging trading conditions.
All footwear, food, furniture components and towelling businesses have strong brands and the division will continue to focus and build on these brands.
Prospectsthe division’s strategic focus areas are aligned to those of the group: to capitalise on industrial growth opportunities and to be a market leader within our sectors.
the underlying businesses within this division are striving to achieve these two objectives, but have specific areas of strategic focus relevant to their market sectors in the broader manufacturing industry.
Both Hosaf and Feltex (the largest contributors in the manufacturing division) are well positioned for further growth. For Hosaf there is potential to increase capacity to satisfy the strong Pet demand while within Feltex local vehicle production is showing signs of expansion with new BMw, Mercedes and Ford/Mazda build.
During the year under review the footwear brands were consolidated into one division where they will leverage a stronger marketing base and develop new product ranges in the industrial and safety footwear markets.
As a division, we will continue our focus on strong cash generation, improved return on equity, and will maintain and improve on our standards of customer service. As and when opportunities present themselves, we will look at organic and acquisitive growth. In the short term, each business will protect its barrier to entry, sustain cash flow and aim to be internationally competitive on cost.
with our business diversity, solid track record, good customer relationships, quality products and strong brands, we are confident that our business will further improve in the year to come.
Paul qualified as a chartered accountant in 1977 before working in London for five years. On his return to South Africa, he worked for a number of organisations and completed his MBA at the
University of Cape Town in 1988.
He joined the Daun group in 1994 and served as CEO of KAP International
from July 2003 to April 2012.
After the reverse acquisition of Steinhoff Industrial assets,
Paul was appointed as CEO of KAP’s manufacturing division.
paul schOuTenceO, Kap manufacturing division

46 KAP Integrated Annual Report 2012

KAP Integrated Annual Report 2012 47
corporate responsibility
reports
corporateresponsibility
reports

48 KAP Integrated Annual Report 2012
corporate governance forms an integral component of the group’s sustainability strategy. Our consolidated approach, at both divisional and group level, remains that of ensuring that the businesses and affairs of the group are managed in a responsible and ethical manner.
cORPORAte ReSPOnSIBIlItYcorporate governance report
the businesses of Pg Bison, Unitrans and Steinhoff Raw Materials
that were acquired with effect from 2 April 2012, (“the Steinhoff
Industrial assets”) were governed prior to that date by the corporate
governance policies and procedures of Steinhoff International
Holdings limited (Steinhoff), which is rated as a best performer on
the JSe limited’s Socially Responsible Investment Index (SRI). the
divisional policies and procedures of the Steinhoff Industrial assets
are substantially in line with the existing divisional KAP corporate
governance policies and procedures and with the requirements of
the King code of corporate Practices and governance (King III).
the corporate governance structures of the Steinhoff Industrial
assets are in the process of being assimilated into KAP’s corporate
governance structures and a unified approach to corporate
governance across the enlarged group is currently being developed.
A full review of the group’s corporate governance systems will be
undertaken during the year ahead, to ensure that the company and
each of the group’s businesses continue to create value for the
group’s stakeholders in a balanced, ethical and sustainable manner
and to maintain their compliance with the applicable laws and
regulations governing their operations.
the group has adopted a decentralised management approach and
day-to-day responsibility for ensuring that the group’s businesses
are managed appropriately rests with divisional management. there
are defined reporting lines from divisional level to the board of KAP
to ensure that the divisions’ approach to corporate governance
remains in line with group policies. the ultimate responsibility for
ensuring full and effective control of the group’s businesses rests
with the board.
Decisions on material matters are reserved for the board, including
but not limited to decisions on the allocation of capital resources to
ensure an optimal return on shareholders’ funds, the authorisation
of procurement capital expenditure, property transactions,
borrowings and investments, save where preapproved materiality
levels apply.
Compliance with King III
During the period under review, KAP continued to make progress
towards its King III compliance and is substantially compliant. the
following areas, for which explanations are provided, will receive
ongoing attention:
Internal audit: The Steinhoff Africa internal audit team fulfilled the internal audit function for the Steinhoff Industrial assets during the period under review, with KPMG having fulfilled the internal audit function for the balance of the KAP businesses. With effect from 1 July 2012, internal audit of the KAP businesses will be undertaken by the Steinhoff Africa internal audit team, assisted by KPMG, to ensure a comprehensive and unified approach.
The standardisation of documentation and the implementation of group processes and systems to validate and improve reporting on management’s ongoing initiatives on IT risk and strategy, risk management, assurance and quantification, ethics and legal and regulatory compliance will form part of the exercise towards adopting a unified group approach to corporate governance that will be conducted in the year ahead. This exercise will inter alia encompass a review of all committee mandates and charters.
Although there is a formal evaluation process in place, following the acquisition of the Steinhoff Industrial assets and the subsequent restructuring of the board and its committees, evaluations of the board, the individual directors and the board committees were not conducted during the year under review. Evaluations of the reconstructed board, the board’s members and its committees will be undertaken at an appropriate stage during the year ahead.
Sustainability reporting has been prepared in accordance with the global Reporting Initiative Index (“gRI”).
the board of directorsThe board charter
the detailed responsibilities of the board are set out in a formal board charter which will be reviewed in the ensuing year. the charter sets out the powers of the board and provides a clear division of responsibilities and the accountability of board members, both collectively and individually. As part of the overall review of the group systems and reporting to be undertaken in the year ahead, attention will be given to incrementally improving reporting via the gRI index guidelines.
the responsibilities of the board include responsibility for:
approving the strategic direction of KAP;
approving the budgets necessary for the implementation of KAP’s strategic direction;
ensuring that procedures are in place to monitor and evaluate the implementation of KAP’s corporate vision, strategies, policies, senior management performance criteria and business plans;
monitoring business and operational performance;
defining levels of materiality, reserving specific powers to itself;
ensuring that an adequate and effective process of corporate governance, which includes the process of risk management, is established and maintained;
ensuring that, at all times, the group is compliant with the letter and the spirit of the law, regulations, policies and relevant codes; and
subject to shareholder approval, selecting and appointing directors.
KAP Integrated Annual Report 2012 49
corporateresponsibility
reports
Composition
Details of the board of directors, including brief curricula vitae for each director are given on pages 6 to 9 of this integrated report.
Pursuant to the acquisition of the Steinhoff Industrial assets, the board has been restructured and is currently comprised of twelve directors, with two executive directors and ten non-executive directors, of whom six are independent non-executive directors. the composition of the board is accordingly in line with King III, which requires the majority of directors to be non-executive and the majority of non-executive directors to be independent.
there is a clear division of responsibilities at board level to ensure an appropriate balance of power and authority and no individual director has unfettered powers of decision-making.
Chairman and chief executive officer
Following the enlargement of the group on 2 April 2012 by the acquisition of the Steinhoff Industrial assets:
on 25 April 2012, Mr P C T Schouten stepped down as chief executive officer and was succeeded by Mr K J Grové. Mr Schouten resigned as an executive director but remains as a member of the KAP executive committee, with responsibility for the manufacturing assets which comprised KAP prior to the acquisition of the Steinhoff Industrial assets, as well as for the raw materials division of the Steinhoff Industrial assets. The board places on record its appreciation of the exceptional role that Mr Schouten played as chief executive officer of KAP since his appointment in 2003.
Mr C E Daun stepped down as chairman of the board on 24 May 2012 and as a non-executive director on 25 June 2012. The board pays tribute to Mr Daun for his invaluable contribution to the group over the many years in which he led and built the KAP industrial businesses into the successful assets that they have become. Mr Daun is succeeded by Mr J de V (Jaap) du Toit who was appointed as an independent non-executive director and chairman on 24 May 2012.
the roles of the chairman and the chief executive officer have been formally defined and are separate. the chairman is responsible for leadership of the board and for ensuring that the board plays an effective role, facilitating communication with shareholders and constructive relations between the executive and non-executive directors. the chief executive officer provides leadership to the executive team in managing the group’s businesses. the chairman and the chief executive officer are appointed by the board and the chairman is re-elected by the board on an annual basis.
Appointment requirements
Appointments to the board are based on levels of skill, acumen, experience and actual or potential contributions to the group. non-executive directors are required to dedicate sufficient time to board matters and may serve on other boards, provided that such other appointments do not or will not interfere with their duties to the KAP board, but rather afford the ability to add value by bringing a broader dimension to board deliberations.
the directors assist the group to realise its strategic objectives, to manage the risks that could threaten the group’s ability to provide sustainable long-term growth to stakeholders, to maintain and
enhance efficiencies within the group’s businesses and to support the people who rely on its businesses.
the reconstitution of the KAP board allows for the chairman and each of the directors, in their individual roles, to bring significant influence to bear on board and committee deliberations on the strategic direction of the enlarged group.
Appointment process
Appointments to the board and proposals for re-election to the board are recommended by ad hoc nomination committees, formed from time to time for such purpose, and are considered by the board as a whole. consideration will be given in the ensuing year ahead to establishing a formal nominations committee.
At every annual general meeting, at least one-third of the non-executive directors shall retire from the board by rotation. If eligible, such directors may offer themselves for re-election.
All director appointments are subject to shareholder approval/ratification.
At the annual general meeting of shareholders to be held on 14 november 2012, shareholders will be asked to confirm the reappointment of the following directors, who will be retiring by rotation:
M J JoosteS H nomvete
In addition, shareholders will be asked to ratify the following appointments to the board made since the previous annual general meeting:
K J Grové Appointed 25 April 2012
A B la Grange Appointed 25 April 2012
C J H van Niekerk Appointed 25 April 2012
J de V du Toit Appointed 24 May 2012*
P K Quarmby Appointed 25 June 2012**
S H Müller Appointed 25 June 2012***
* Appointed as chairman** Appointed as chairman of the audit and risk committee*** Appointed as a member of the audit and risk committee
Brief curricula vitae of the directors seeking reappointment and the directors for whom ratification of their appointments will be sought are contained on pages 6 to 9 of this integrated report.
Classification of independent non-executive directors
Mr J B Magwaza, Ms I n Mkhari, Mr S H nomvete, Mr J de v du toit, Mr P K Quarmby and Mr S H Müller are classified as independent non-executive directors in accordance with the classification specifications detailed in King III.
the board is satisfied that these directors are independent in character and judgement and that there are no relationships or circumstances which could affect, or could appear to affect, their independence.
there are no directors on the board who have served for longer than nine years.

50 KAP Integrated Annual Report 2012
corporate governance report continued
Resignations from the board: non-executive directors
Pursuant to the acquisition of the Steinhoff Industrial assets, the following non-executive directors resigned from the board with effect from 25 June 2012:
c e Daun K e SchmidtU Schäckermann F Möller
the board thanks these directors for the extensive role that they have played as board members and as members of various board committees and for their contributions to the growth and development of KAP.
Chief financial officer
the chief financial officer of the company is Mr J P Haveman. A review of his function was undertaken by the audit and risk
2011 2012
5 September 17 October 2 December 5 March 16 May
C E Daun (Chairman)1 √ √* √ √ √
J de V du Toit (Chairman)2 N/a N/a N/a N/a N/a
K J Grové3 N/a N/a N/a N/a √
J P Haveman √ √ √ √ √
M J Jooste √ Apology √ √ √
A B la Grange4 N/a N/a N/a √ (Attended as an invitee)
√
JB Magwaza √ √* √ √ Apology
I N Mkhari √ √* √ Apology Apology
F Möller7 Apology √* √ √ √
S H Müller5 N/a N/a N/a N/a N/a
S H Nomvete √ √* √ √ √
P K Quarmby5 N/a N/a N/a N/a N/a
U Schäckermann7 √ √* √ √ √
K E Schmidt7 √ √* √ √ √
P C T Schouten6 √ √ √ √ N/a
D M van der Merwe √ Apology √ √ √
C J H van Niekerk4 N/a N/a N/a N/a √
* Per teleconference1 Resigned as chairman on 24 May 2012 and as a director on 25 June 20122 Appointed as independent non-executive chairman on 24 May 20123 Appointed as chief executive officer on 25 April 20124 Appointed as non-executive director on 25 April 2012 5 Appointed as independent non-executive director on 25 June 20126 Resigned on 25 April 20127 Resigned on 25 June 2012
committee on 31 August 2012 as detailed in the report of the audit and risk committee on pages 78 and 79. the board and the audit and risk committee are satisfied that Mr Haveman possesses the appropriate experience and qualifications for this position.
Board meetings and attendance
the board meets at least four times a year or more often if necessary. Should circumstances so require, non-executive directors may meet without the executive directors being present.
Directors declare their interests in contracts and other appointments at all board meetings. Meetings are conducted according to a formal agenda, ensuring that the board properly addresses and follows up on all substantive matters.
the following table indicates the attendance by each director at meetings of the KAP International Holdings ltd board held during the period under review.
Board meetings and attendance

KAP Integrated Annual Report 2012 51
corporateresponsibility
reports
Director induction and development
On appointment, directors are provided with an induction manual and guidelines on their duties. Meetings are arranged with other directors and senior executives to enable directors to familiarise themselves with all aspects of the group’s businesses. Ongoing development includes internally and externally run seminars, management forums and the circulation of relevant industry, regulatory and economic news and analyses.
Directors’ access to management/information
All directors are afforded unrestricted access to management, including the company secretariat. Independent professional advice is available in appropriate circumstances and at the company’s expense. During the year under review, none of the directors independently sought external advice paid for by the company.
Board and committee evaluations
An annual self-evaluation process to review the effectiveness of the board, the individual directors and the board committees is in place. the chairman is required to assess the performance of the individual board members and the board is required to assess the performance of the chairman.
Assessments take into account several factors, including relevant expertise, enquiring attitude, judgement, commitment, objectivity, independence and an understanding of the group’s businesses.
Following the acquisition of the Steinhoff Industrial assets and the subsequent extensive restructuring of the board and its committees, the board decided that annual evaluations for the period under review would not be appropriate but would take place in the year ahead.
Directors’ remuneration
Details of the remuneration for executive directors are contained in the remuneration report on page 57. The executive directors do not earn fees for their services as directors.
Non-executive directors receive fees for their board and committee participation. Details of the proposed fees payable to the non-executive directors, including fees for serving on the board’s committees, in respect of the period 15 November 2012 to the date of the 2013 annual general meeting are included in the remuneration report on page 57. All reasonable travelling and accommodation expenses to attend board and committee meetings are paid by the company. The fees for non-executive directors are reviewed and recommended by the board, benchmarked against the fees paid to non-executive directors of comparable companies.
the non-executive directors do not have service contracts and are not members of the group’s retirement funding schemes. there are no shares or options under the group’s share incentive schemes held by the non-executive directors.
the remuneration and fees paid to directors for the period under review and details of any share rights granted are reflected in note 31 to the annual financial statements.
Directors’ fees paid to A B la grange and D M van der Merwe is paid to Steinhoff International Holdings limited as a management fee.
executive committeeA new executive committee, with primary responsibilty for assisting and advising the chief executive officer in implementing the strategies and policies determined by the board, managing the business and affairs of the company, prioritising the allocation of capital, technical and human resources and ensuring best management practices, was established in May 2012.
the committee is comprised of the chief financial officer, four divisional chief executives and the human resources executive under the chairmanship of the chief executive officer Mr K J (Jo) grové. the committee meets regularly on a monthly basis. the chairman of the board is invited to attend committee meetings.
Board committees Audit and risk committee
the audit and risk committee has the responsibility of reviewing the finance function and has satisfied itself as to the expertise, resources and experience of the company’s finance function. It is inter alia the responsibility of the committee to ensure the integrity of the group’s financial reporting and that risk management and control systems are maintained, to consider significant risk and control issues, to recommend the appointment of the external auditors and to appoint and to review the performance of the internal auditors.
the chairman of the committee is elected by the board. the members of the audit and risk committee during the period under review and up to the date of this integrated report were/are as follows:
P K Quarmby* (chairman) Appointed 25 June 2012
S H Müller* Appointed 25 June 2012
S H Nomvete*
K E Schmidt* (chairman) Resigned 25 June 2012
U Schäckermann* Resigned 25 June 2012
* Independent non-executive directors
Mr A B la grange resigned from the committee on 31 August 2012, but will in future attend as invitee.
During the period under review, three committee meetings were held, which were attended by all members.
Further details on the structure and duties of the committee are contained in the report of the audit and risk committee on pages 78 and 79 of this integrated report. the appointment of the committee members is subject to shareholder approval.
Human resources and remuneration committee
the human resources and remuneration committee is responsible for determining and approving the group’s general remuneration policy, which is presented at each annual general meeting for a non-binding advisory vote by shareholders. the committee performs the functions as envisaged in the guidelines contained in King III. It is responsible for making recommendations to the board on the company’s framework of executive remuneration, including the remuneration packages of certain senior managers
52 KAP Integrated Annual Report 2012
and recommends to the board the packages for each of the executive directors. the committee is responsible for ensuring that incentives are appropriately structured and awarded in order to drive the group’s performance and to assist the group in reaching its strategic goals.
Details of the group’s remuneration policy are contained in the remuneration report on pages 55 to 57 of this integrated report.
the members of the committee during the period under review and up to the date of this integrated report were as follows:
J B Magwaza (chairman)*
I N Mkhari*
D M van der Merwe** Appointed 5 September 2011
P C T Schouten Resigned 25 April 2012
M J Jooste Resigned 5 September 2011
* Independent non-executive director** Non-executive director
the composition of the committee accordingly meets with the requirements of King III which requires that the committee be comprised of non-executive directors, the majority of whom are independent non-executive directors.
All members attended the committee meeting held on 5 September 2011, other than Mr Jooste who tendered his apology. Mr van der Merwe, whose appointment to the committee was approved at the ensuing board meeting on 5 September 2011, attended the meeting as an invitee.
Social and ethics committee
the board recognises that social and transformation issues are crucial for the sustainability of the group and that investment in its employees and the communities it serves is key to the ongoing viability of the group’s businesses.
On 5 September 2011 the board approved the reconstitution of the transformation committee as the social and ethics committee, in compliance with the requirements of the companies Act 71 of 2008 (the companies Act).
During the period from 5 September 2011 to 30 June 2012, and up to the date of its disbandment, this committee comprised:
J B Magwaza*#
I N Mkhari*#
K J Grové Appointed 25 April 2012
P C T Schouten# Resigned 25 April 2012
* Independent non-executive director# Former members of the transformation committee
the last meeting of the transformation committee was held on 31 August 2011, at which meeting the committee considered employment equity, the group’s B-BBee scorecard and action plans, staff movements, fast-track candidates, bursaries and the development of an HIv/AIDS policy. the meeting on 31 August 2011 was attended by all members other than Ms Mkhari who tendered her apologies.
Subsequently, at the board meeting of 3 September 2012 and as permitted by the companies Act, it was agreed that the role of the social and ethics committee be fulfilled by the Steinhoff
International social and ethics committee with immediate effect. KAP management will have a reporting line into this committee.
Nomination committee
the board constitutes ad hoc nomination committees as and when required. this will be formalised as part of the overall review of the corporate governance structures to be undertaken in the year ahead.
Accountabilitythe chief executive officer (ceO) is responsible for and accountable to the board for all group operations. As the group operates on a decentralised basis, divisional ceO’s of the group’s main operating divisions have been appointed to the executive committee to assist the ceO in fulfilling his responsibilities.
Although the board has delegated certain powers and authorities to executive management, the ultimate responsibility for retaining full and effective control of the group rests with the board.
company secretarythe company secretary is appointed by the board. On 24 May 2012, Mr Mark Balladon relinquished his position as company secretary, remaining as chief financial officer of the group’s automotive division. Mr Balladon has filled the position of company secretary since 2004 and has made a valuable contribution to the affairs of the group in this role. Mr Balladon is succeeded as company secretary by a juristic person, Steinhoff Africa Secretarial Services (Pty) ltd, whose directors are, in the board’s opinion, competent and suitably qualified to act as company secretary.
All directors have access to the advice and services of the company secretary. the company secretary is responsible for the duties set out in section 88 of the companies Act and for ensuring compliance with the listings Requirements of the JSe limited.
the certificate required to be signed in terms of section 88(2) of the companies Act appears on page 77 of this integrated report.
ReportingManagement reporting
Divisional management reporting disciplines include defined parameters for the reporting of litigation matters, compliance with legislation, any penalties incurred and risk analyses. Management reporting disciplines include the preparation of annual budgets, which are approved by the board. Operational and financial performance against the approved budgets is reported by the divisions to corporate office on a monthly basis. Profit and balance sheet projections are reviewed regularly and capital and borrowing levels are monitored on an ongoing basis.
Divisional management is additionally charged with the responsibility of reporting on risks and opportunities and on social, ethical and environmental concerns. Risk reports are reviewed by the divisional boards/management boards/executive committees and major risks identified are brought to the attention of the board. Any significant social, ethical or environmental concerns
corporate governance report continued

KAP Integrated Annual Report 2012 53
corporateresponsibility
reports
will be brought to the attention of the Steinhoff International social and ethics committee.
Financial control and reporting
the board is responsible for ensuring that the group companies maintain adequate records, and for the reasonable, accurate, timeous and reliable reporting on the financial position of the group and on the results of its activities. to assist the board in effectively discharging this duty, financial reporting procedures have been put in place at all levels across the group.
Risk managementthe board is accountable for the governance of risk management within the group and for ensuring compliance. the board monitors the adequacy and effectiveness of the divisions’ risk management procedures, reviews any significant risks identified and considers the possible further investigation of opportunities revealed.
the audit and risk committee oversees group risk management and the role of internal audit is to examine, evaluate and report on and make recommendations to the audit and risk committee and the board regarding the adequacy and effectiveness of the group’s risk management processes.
Financial risks such as exchange rate risk, interest rate risk and liquidity risk are largely controlled centrally.
A review of the enlarged group’s risk management policy and framework will form part of the corporate governance review to be undertaken in the forthcoming year.
Internal control systemsthe group’s systems of internal controls, which are embedded in all key operations, provide reasonable albeit not absolute assurance that the company’s business objectives will be achieved, subject to defined risk tolerance levels. the board has delegated implementation of the group’s systems of risk management and internal financial control to executive management. the responsibility for ensuring the effectiveness of the internal control systems across the group rests with the board.
the group undergoes a comprehensive annual planning and budgeting system and divisional annual budgets are approved by the board. there is a financial reporting system which compares actual results achieved with monthly budgets, to identify any deviations from approved plans and to allow for timely corrective action to be taken.
During the forthcoming year, a comprehensive review will be undertaken to ensure that the control systems of the enlarged group remain robust and relevant to the businesses that they serve, adopting a unified group approach where practical.
Internal auditInternal audit is responsible for assessing the effectiveness of the group’s risk management process and internal control framework.
Internal audit reports directly to the audit and risk committee and to divisional management and divisional audit and risk committees. the internal audit function assists executive management and the
respective audit and risk committees in the effective discharge of their responsibilities by means of independent reviews of financial and information technology, internal controls and operational systems. compliance with applicable legislation is an item on board agendas and is evaluated by internal audit as part of their audit programme and is formally reported on.
As reported above in the section of the report addressing compliance with King III, following the acquisition of the Steinhoff Industrial assets, the Steinhoff Africa internal audit team fulfils the internal audit function for the enlarged group, assisted by KPMg.
During the period under review, the internal audit process, which was conducted by the Steinhoff Africa internal audit team in respect of the Steinhoff Industrial assets and by KPMg in respect of the balance of the group’s businesses, did not highlight any material breakdowns in internal controls across the group.
external auditthe external auditors report on their audit findings to the divisional audit and risk committees that are in place within the group and to the audit and risk committee of KAP. Should the external auditors wish to discuss any findings, they have unrestricted access to the chairman of the audit and risk committee and are afforded the opportunity to meet with committee members without any executives or management representatives being present.
the reappointment of Deloitte & touche, with Mr Michael van wyk, a registered auditor and designated audit partner of Deloitte & touche, as the individual who will undertake the audit for the financial year ending 30 June 2013, will be a matter for consideration by shareholders at the annual general meeting to be held on 14 november 2012.
Further information on the external auditors is contained in the report of the audit and risk committee on pages 78 and 79 of this integrated report.
Information technology (It)King III places emphasis on the area of It and this will receive heightened management attention in the forthcoming year, as It forms an integral part of the group’s management and reporting processes.
the value delivery of It across the group is driven by informal processes at divisional level. A standardised group It internal framework has not been adopted, due to the greatly varying It requirements across the divisions, but it is under consideration.
Following the acquisition of the Steinhoff Industrial assets, an It executive has been appointed at corporate level to review and report on the efficacy, suitability and reliability of the It systems employed by the group’s businesses, with a particular emphasis on risk. this will be an ongoing exercise during the year ahead.
ethicsKAP has adopted a formal code of ethics which will be reviewed in the year ahead. the code commits the group and its employees to the highest ethical standards of conduct and inter alia contains a prohibition against the acceptance of gifts, payments, incentives,

54 KAP Integrated Annual Report 2012
corporate governance report continued
favours or any other business courtesies that may affect the actions of employees with regard to a third party.
Major suppliers of goods and services are required to ensure that they comply substantially with the code.
the group has established various confidential whistle-blowing facilities, using dedicated hot lines for the reporting of suspected frauds or irregularities. All reports received are followed up on a confidential basis. employees are regularly reminded of these facilities and are urged to report all circumstances or situations where they have reason to suspect fraudulent activity.
Stakeholder communications and investor relationsKAP values its relationships with both institutional and private investors and a proactive approach to ensure that communications relating to the new group structure and strategies are handled appropriately has been put in place.
Regular and open dialogue with internal and external stakeholders not only informs stakeholders of the group’s strategies and goals but also provides the group with input from stakeholders and informs the group’s decision-making, facilitating sustainable, stable and mutually beneficial relationships.
For more information, please refer to the stakeholder reports on pages 14 to 27 of this integrated report.
Insider tradingKAP has an insider trading policy which prohibits directors, prescribed officers and officers of the company and its material subsidiaries from dealing in the company’s shares, either directly or indirectly, whilst in the possession of unpublished price-
sensitive information concerning the business and affairs of the group and its subsidiaries.
no director, prescribed officer or officer who is privy to such information may trade in the company’s shares during embargo periods determined by the board, or during closed periods, and all dealings by such persons in the company’s shares must receive the approval of the chief executive officer. Dealings in the company’s shares by the chief executive officer must receive the prior approval of the chairman and dealings in such shares by the chairman must receive the prior approval of the chief executive officer.
A report of any dealings in the company’s shares by directors, prescribed officers and officers is tabled at each board meeting and all share dealings by the directors of the company, directors of any major subsidiaries and the company secretary are notified to the JSe limited for publication on the Securities exchange news Service (SenS).
Interest in contractsAll employees must disclose, as and when appropriate, any interest in contracts to allow for the assessment of any conflict of interest. this policy extends to directors and prescribed officers and declarations of interest are tabled at the commencement of board meetings.
going concern statementthe group annual financial statements set out on pages 72 to 149 have been prepared on the going concern basis as the directors, after making enquiries, have a reasonable expectation that the group has adequate resources to continue in operation for the foreseeable future.
KAP Integrated Annual Report 2012 55
corporateresponsibility
reports
KAP is a predominantly South African-based business with revenue also earned in some sub-Saharan countries. KAP expects its executives to be mobile and to have knowledge and experience across borders. As a result, KAP competes for management skills and talent in a challenging market-place and its approach to remuneration needs to remain competitive.
to facilitate this, the board has established a human resources and remuneration committee (remuneration committee) which operates within defined terms of reference and authority granted to them by the board.
the KAP group remuneration committee comprises only non-executive directors, the majority of whom are independent non-executive directors. the chairman of the committee is an independent non-executive director. executive directors and certain members of management attend meetings by invitation. this committee meets at least once a year and, should this be required, additional ad hoc meetings are convened.
Following the reconstitution of KAP, key considerations for the group remuneration committee will be to:
review the group’s general remuneration policy, to be presented annually for a non-binding advisory vote by shareholders;
review and approve annually the remuneration packages of the most senior executives, including incentive schemes, ensuring they are appropriate and in line with the remuneration policy;
annually appraise the performance of the chief executive officer;
fulfil delegated responsibilities on KAP’s share-based incentive plans, e.g. the appointment of trustees and compliance officers;
approve the appointments and promotions of key executives;
approve amendments to the KAP share-based incentive schemes, after consultation with shareholders and the JSE Limited;
review the human capital management practices in place with reference to key focus areas and those specifically required by the South African labour legislation;
review incidents (if any) of unethical behaviour by senior managers or the chief executive officer;
review annually the company’s code of ethics;
review annually the remuneration committee’s terms of reference and recommend amendments thereto as required;
undertake an annual assessment of the effectiveness of the committee and report these findings to the board and the committee;
review annually the recommendations of the group’s divisional remuneration subcommittees and their annual assessment of compliance with the terms of reference prescribed by the group remuneration committee in order to establish if it can rely on the work of the subsidiary divisions’ remuneration committees; and
prepare an annual remuneration report for inclusion in the company’s integrated annual report.
Due to the diversity of the group and the decentralised management structures in the operating divisions, the remuneration committee has established divisional subcommittees with standard terms of reference which are in line with the overseeing committee’s terms of reference. these committees are responsible for all human capital management and employee remuneration matters at divisional level.
the remuneration committee and divisional subcommittees are supported by established human resource departments at group and divisional level, responsible for the implementation and management of human resource and remuneration strategies, policies and practices.
Key considerations for the divisional subcommittees are to:
review the pay structures and equitable base salary increases for all employees;
review the performance management systems and processes;
review the divisional annual performance incentive schemes and the measurement criteria;
review the longer-term cash-settled incentive scheme for management staff; and
review talent management and succession planning taking due cognisance of employment equity targets.
Alignment with strategyKAP’s group and divisional remuneration structures remain appropriate and are aligned with the group’s long-term strategic business priorities, namely:
to develop and grow our diversified industrial business in southern Africa;
to sustain and improve our leading positions in the markets where we operate;
to sustainably raise our operating profit;
to expand revenue and manufacturing product ranges in Africa with more value-added products; and
to grow sustainable long-term revenue having due regard to the sustainable longevity of the business.
Remuneration policyto assist the achievement of the group’s business goals, the remuneration committee has put a remuneration policy in place.
the remuneration policy aims to follow the recommendations of King III and is based on the following principles:
remuneration practices throughout the group are aligned with the applicable business strategies and objectives;
At KAP our policy is to reward all employees fairly for their individual and joint contributions in the execution of the KAP business strategy and delivery of the group’s operating and financial performance. KAP’s remuneration philosophy is to remunerate all employees in a market-related, competitive manner to attract, motivate and retain a competent workforce.
cORPORAte ReSPOnSIBIlItYRemuneration report

56 KAP Integrated Annual Report 2012
total rewards are set at levels that are competitive and relative within the specific market and industry;
incentive-based awards are earned through achieving demanding performance measures and targets with due regard for the sustainable well-being of all stakeholders over the short, medium and long term;
incentive plans, performance measures and targets are structured to operate effectively throughout the business cycle; and
the design of longer-term incentives is prudent and does not expose stakeholders to a position where the sustainability of the company is placed at risk.
elements of remunerationthe four elements of managerial remuneration consist of a base salary, benefits, annual bonus and longer-term incentives. the remuneration committee seeks to ensure an appropriate balance between the fixed and performance-related elements of managerial remuneration and between those aspects of the package linked to short-term financial performance and those aspects linked to longer-term sustainable stakeholder value creation. A further consideration is the need to attract, motivate and retain critical skills in the group. the remuneration committee considers each element of remuneration relative to the market and in determining its quantum, takes into account the performance of the company, the management team and the individual executive.
Base salarythe fixed element of remuneration is referred to as a base salary which incorporates all guaranteed cash benefits. Its purpose is to provide a competitive level of remuneration for each level of manager. the base salary is subject to annual review. It is set to be competitive with reference to market practice in companies comparable in size, market sector, business complexity and geographical location. company performance, individual performance and changes in responsibilities are also taken into consideration when determining annual base salaries.
Benefits provide security for managerial employees and their families and include compulsory membership of a retirement fund and medical aid scheme. employees have the flexibility of deciding on the level of their contributions to both benefits.
Remuneration and other benefits for bargaining council and related levels of employees are set through a process of collective bargaining with the major labour unions active in the various industries and countries in which we operate.
Annual bonusAn annual short-term incentive plan provides management teams with incentives to achieve their business’s short and medium-term goals. the annual cash bonus is based upon the achievement of group, divisional or company financial targets as well as strategic and personal performance objectives agreed to by the remuneration committee.
Annual bonus potentials are set for management teams and are based on a percentage of team members’ individual annual base salary. the remuneration committee retains the discretion to make adjustments to bonuses earned at the end of the financial year, taking into account both company performance and the overall
and specific contribution of the management teams to meeting the group’s objectives.
Bonuses are determined and recorded in the financial year following that to which the performance relates. For members of the group’s executive team, the performance measures for the annual bonus plan will include:
Achievement of operational and financial growth objectives:– performance against budgeted profit target; and– cash flow performance.
Implementation of key strategic initiatives related to the strategic development and competitive positioning of KAP. In particular: – securing an appropriate and flexible capital and debt structure in order
to minimise the risk of stressed debt or equity issuance in this volatile economic environment;
– implementation of risk management policy and framework; and– successful conclusion and implementation of strategic mergers and
acquisitions.
the remuneration committee reviews measures annually, to ensure that the performance measures and the targets set are appropriate within the economic context and the performance expectations for the division or group.
longer-term incentives (ltIs)KAP competes for management skills and talent in the African market-place and its approach to remuneration takes account of the need to be competitive.
ltIs are awarded with the primary aim of retaining key staff members and aligning performance with the interests of investors over longer-term periods.
the allocation and target criteria of incentives are at the discretion of the remuneration committee and are subject to the approval of the KAP board.
Allocation
the allocation of ltIs i.e. the KAP share rights scheme and divisional longer-term cash-settled bonus scheme is based on the responsibility of individuals who:
are key to driving the long-term business strategy at group and/or divisional levels; and
are part of the group’s succession and talent development plans for high potential and scarce competencies.
Target criteria
the targets for the longer-term cash-settled bonus scheme are set with reference to the accumulative profit and growth targets for the applicable division or company for the duration of the measurement period.
the targets for the share rights incentives are set with reference to industry and market-related performance criteria for the duration of the measurement period.
Benchmark performance criteria are aligned with the group’s long-term strategic priorities as detailed on page 55.
Performance criteria and the quantum of allocations are benchmarked annually against market practices taking due
Remuneration report continued

KAP Integrated Annual Report 2012 57
corporateresponsibility
reports
cognisance of base salary, annual incentives and longer-term incentives in practice in the market.
Scheme rules and the application thereof are evaluated annually to ensure compliance with legislative and regulatory requirements.
For more details on the historical long-term incentives, refer to note 18.3 of the annual financial statements.
Proposed changes to long-term incentives
the board has proposed that, subject to shareholder approval, the current KAP performance share plan be replaced by a share plan similar to that adopted by Steinhoff. the proposed new share plan, as per Annexure A to the notice of annual general meeting, circulated with this integrated report, will be considered at the annual general meeting to be held on 14 november 2012.
Employee share ownership and “black” management share ownership plans
In accordance with its strategic transformation objectives, Steinhoff International Holdings limited, KAP’s new majority shareholder, has recognised the importance of affording all of South African employees an opportunity to participate in the success of its business.
Accordingly, during 2009, Steinhoff implemented its employee and “black” management share participation schemes that effectively empowered all South African employees, the majority of whom are “black” (as defined in the Broad-based Black economic empowerment Act 53 of 2003, as amended (the B-BBee Act) other than senior executives participating in the Steinhoff share rights scheme. therefore, apart from the majority of the manufacturing division’s employees, who were previous KAP employees, the former Steinhoff South African employees who participated in these schemes and who are now KAP employees, (approximately 14 000), are still recognised for purposes of the B-BBee Act as Steinhoff shareholders. the KAP group, in liaison with Steinhoff, is considering the extension of such scheme to all qualifying KAP employees.
Service contracts
executives’ contracts generally are subject to terms and conditions of employment in the local jurisdiction. top executive and non-executive directors’ contracts do not contain “golden parachute” clauses.
non-executive directors are subject to regulations on appointment and rotation in terms of the company’s memorandum of incorporation and the companies Act. there are no executive directors with a notice period of more than a month. there are no executive directors’ service contracts that include predetermined compensation as a result of termination exceeding one month’s salary and benefits.
the executive directors and senior management have indefinite employment contracts.
Non-executive directors’ remuneration
the board, in reviewing non-executive directors’ fees, makes recommendations to shareholders in light of, firstly, fees payable to non-executive directors of comparable companies and, secondly, the importance attached to the retention and attraction of high-calibre individuals as non-executive directors. Remuneration is reviewed annually, with reference to competitors and peer companies. Independent advice is obtained from specialist human resources consultants to review non-executive directors’ remuneration. this remuneration is not linked to the company’s share price or performance. levels of fees are also set by reference to the responsibilities assumed by the non-executive directors in chairing the board and in chairing or participating in its committees. non-executive directors do not qualify for shares in terms of the group’s share incentive schemes. the board annually recommends remuneration of non-executive directors for approval by shareholders in advance.
2012R000
2013R000
*Board
Chairman (all-inclusive fees) 180 600
Member 88 240
Committee feesAudit and risk
Chairman 120 200
Member 33 100
Human resources and remunerationChairman 100 110
Member 30 50
Social and ethics Chairman 42 –
Member 23 –
* The social and ethics committee was incorporated into the Steinhoff International social and ethics committee on 3 September 2012
Refer to note 31 of the annual financial statements for details on the fees earned by non-executive directors for the year ended 30 June 2012.
Executive directors’ remuneration
Refer to note 31 of the annual financial statements for details on the remuneration earned by executive directors for the year ended 30 June 2012.

58 KAP Integrated Annual Report 2012
Overview and sustainability contextwe are pleased to present the 2012 sustainability report as part of the group’s integrated report.
the incorporation of the Steinhoff Industrial assets into the group in April 2012 added a substantial number of businesses to the group. these include Unitrans Supply chain Solutions, Unitrans Passenger, Pg Bison and the raw material businesses: vitafoam, BcM and DesleeMattex.
these divisions were governed by the policies and procedures of Steinhoff International Holdings limited which is rated as a best performer on the JSe limited’s Socially Responsible Investment Index. the divisional policies and procedures of the Steinhoff Industrial assets are substantially in line with that of the group.
cORPORAte ReSPOnSIBIlItYSustainability report
All references to KAP, the group, the company, the business, “our” and “we” refer to KAP International Holdings limited and its operating divisions.
this report has been prepared in accordance with the guidelines of the global Reporting Initiative (gRI) Index. the group will review its future application with gRI reporting standards.
Materialitythe principle of materiality has been applied in determining the extent of disclosure with regard to the reporting on sustainability aspects. the diversity of the group’s businesses influence how the materiality of sustainability aspects is determined and how such issues are addressed, with varying levels of materiality applicable at group level and at divisional level.
Decisions around materiality take into account the potential impact of risks and opportunities and the effect thereof on the division and stakeholders. this has resulted in more prominence over certain matters than others.
Assurancethe board, assisted by the audit committee, is ultimately responsible for overseeing the integrity of the integrated report. this is achieved through appropriate teams and structures that manage the reporting process.
A combined assurance approach, with Steinhoff International, will be developed in future to ensure the appropriate application of integrated reporting principles and the integrity of data contained in the report.
Sustainability approach and strategyManagement and reporting
the group requires high standards of corporate responsibility at divisional and corporate level.
Reporting lines are defined from divisional level to the board of KAP International, ensuring that the divisional operations’ approach to sustainability and corporate governance is in line with group policies. However, the ultimate responsibility for retaining full and effective control rests with the KAP International board of directors.
Day-to-day management responsibility is placed with divisional management, their individual boards of directors and/or their executive teams. this allows these teams the freedom to manage their businesses to best align with group strategy and to implement and act with immediacy.
each division is responsible for developing its own sustainability strategy within the framework set by the group, while considering stakeholder needs and social and environmental obligations within their sphere of business. group committees support the divisions
this report is intended to provide stakeholders with insight into the way we manage the group’s businesses specifically related to sustainability. we describe how sustainability efforts underpin and support a strategy to create long-term sustainable value for stakeholders.
KAP (pre April 2012) accounting for 21% of employees
Steinhoff Industrial
assets accounting for 79% of employees
Steinhoff Industrial Assets, due to their scale and nature, are more advanced with collecting and reporting on sustainability data. we have therefore started a process to align the KAP manufacturing businesses (pre April 2012) and that of the newly-acquired divisions. It will be part of our journey to fully implement and improve processes of data collection and management throughout the group to provide information relevant and material to the group.Internal reporting structures will be reviewed to put in place a structure that would best address the group’s strategy.
Scope and boundary
the sustainability report forms part of the group’s integrated report.
the scope of the report includes all operating divisions and covers the reporting period 1 July 2011 to 30 June 2012. the audited annual financial statements were approved on 3 September 2012. the integrated report was approved for distribution on 1 October 2012 and includes reference to pertinent events subsequent to year-end, up to the approval date. the effective date of incorporation of the Steinhoff Industrial assets is 2 April 2012. All non-financial data is for the full financial year as at 30 June 2012.
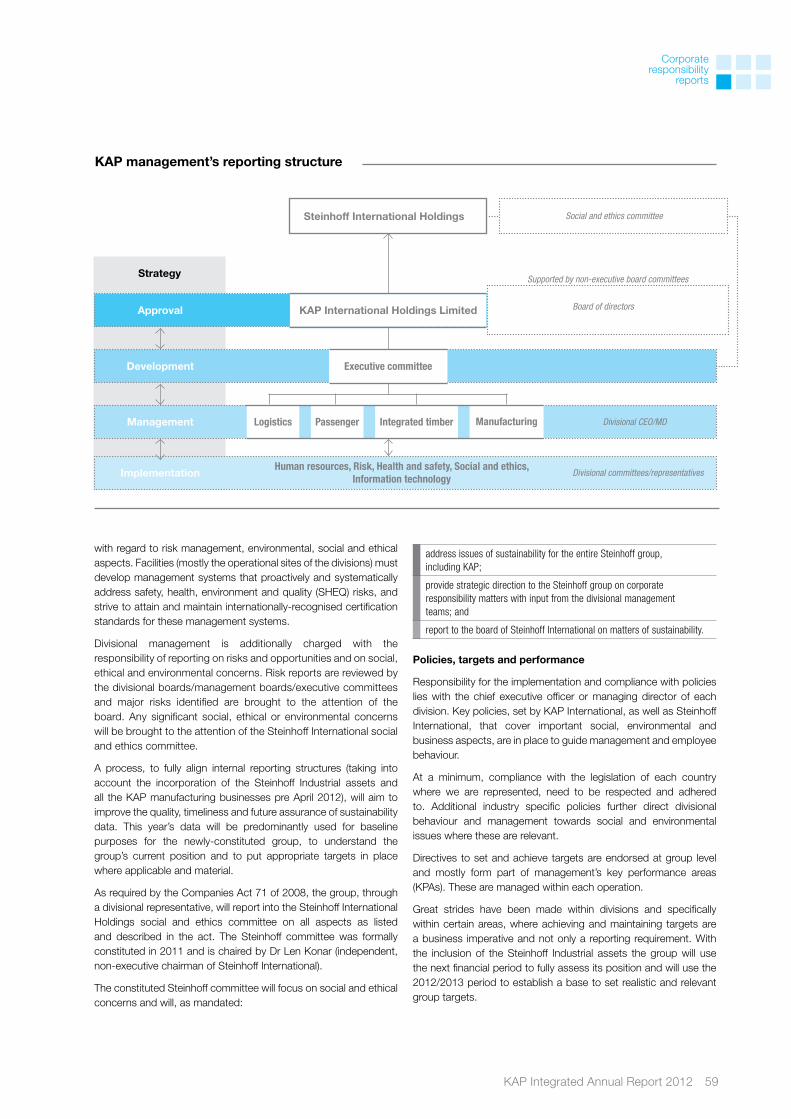
KAP Integrated Annual Report 2012 59
corporateresponsibility
reports
Strategy
with regard to risk management, environmental, social and ethical aspects. Facilities (mostly the operational sites of the divisions) must develop management systems that proactively and systematically address safety, health, environment and quality (SHeQ) risks, and strive to attain and maintain internationally-recognised certification standards for these management systems.
Divisional management is additionally charged with the responsibility of reporting on risks and opportunities and on social, ethical and environmental concerns. Risk reports are reviewed by the divisional boards/management boards/executive committees and major risks identified are brought to the attention of the board. Any significant social, ethical or environmental concerns will be brought to the attention of the Steinhoff International social and ethics committee.
A process, to fully align internal reporting structures (taking into account the incorporation of the Steinhoff Industrial assets and all the KAP manufacturing businesses pre April 2012), will aim to improve the quality, timeliness and future assurance of sustainability data. this year’s data will be predominantly used for baseline purposes for the newly-constituted group, to understand the group’s current position and to put appropriate targets in place where applicable and material.
As required by the companies Act 71 of 2008, the group, through a divisional representative, will report into the Steinhoff International Holdings social and ethics committee on all aspects as listed and described in the act. the Steinhoff committee was formally constituted in 2011 and is chaired by Dr len Konar (independent, non-executive chairman of Steinhoff International).
the constituted Steinhoff committee will focus on social and ethical concerns and will, as mandated:
address issues of sustainability for the entire Steinhoff group, including KAP;
provide strategic direction to the Steinhoff group on corporate responsibility matters with input from the divisional management teams; and
report to the board of Steinhoff International on matters of sustainability.
Policies, targets and performance
Responsibility for the implementation and compliance with policies lies with the chief executive officer or managing director of each division. Key policies, set by KAP International, as well as Steinhoff International, that cover important social, environmental and business aspects, are in place to guide management and employee behaviour.
At a minimum, compliance with the legislation of each country where we are represented, need to be respected and adhered to. Additional industry specific policies further direct divisional behaviour and management towards social and environmental issues where these are relevant.
Directives to set and achieve targets are endorsed at group level and mostly form part of management’s key performance areas (KPAs). these are managed within each operation.
great strides have been made within divisions and specifically within certain areas, where achieving and maintaining targets are a business imperative and not only a reporting requirement. with the inclusion of the Steinhoff Industrial assets the group will use the next financial period to fully assess its position and will use the 2012/2013 period to establish a base to set realistic and relevant group targets.
KAP International Holdings Limited Approval
Implementation Divisional committees/representativesHuman resources, Risk, Health and safety, Social and ethics,
Information technology
Development Executive committee
Logistics Passenger ManufacturingIntegrated timberManagement Divisional CEO/MD
Supported by non-executive board committees
KAP management’s reporting structure
Board of directors
Steinhoff International Holdings Social and ethics committee

60 KAP Integrated Annual Report 2012
Sustainability report continued
Our strategy is to capitalise on the industrial advantages within emerging African markets and aim to be leaders in the markets that we serve.
Our business activities are underpinned by our responsibility to:
Our customers and partners who rely on our ability as a business to remain competitive
Our employees and their communities to be part of a fair, transparent and successful business
The environment and our ability to manage our impact on it
training and development
employee relations
Health and safety
HIv/AIDS
Product and service delivery
carbon footprint (energy/fuel)
Air, water and waste
B-BBee
community and cSI
Strategy and sustainability
Each division is responsible for developing its own sustainability strategy within the framework set by the group, while considering stakeholder needs and social and environmental obligations within their specific sphere of business.

KAP Integrated Annual Report 2012 61
corporateresponsibility
reports
In association with The Endangered Wildlife Trust, PG Bison supports the “Eastern Cape Crane Conservation Project” which was established in 2000. PG Bison announced in January 2009 that it would be a co-sponsor of the South African Crane Conservation Working Group. The Eastern Cape Crane Conservation project concentrates on the Grey Crowned Crane, with more than half the country’s population of this species being found in this region.
Conservation
Jordan has a footwear training school that is accredited by the Department of Education. This is the only accredited school for footwear training in the Western Cape. Currently Jordan has 44 trainees. The division is increasing its investment in training to improve the quality of employee output and increase skills.
Feltex installed an additional chopping machine for the trim manufacturing facility in Rosslyn. Here they reduce the volume of waste designated for disposal to the Durban non-woven plant. Approximately 1 000 tons of recycled textiles is consumed per annum. This supplements the material used for the production of the more than 2 000 vehicle floor carpets that are supplied per day.
The Isihlahla Sempilo (Tree of Life) HIV/AIDS initiative programme was established in 2007 by PG Bison. This programme is managed independently by Right to Care and has had huge success over the years with the uptake of employees regarding training, voluntary testing and counselling. Access to the service is available to all employees and their spouses and contractors, and is completely confidential.
With the development of the PG Bison Ugie production facility, the focus was on the capital investment in the area, the partnership with government and local authorities, and the projected development that was planned for the greater Ugie/Maclear area. A capital investment of R1,5 billion ensured the building of one of the most modern particle board plants, and included the acquisition of 82 000 hectares of land inclusive of 33 000 hectares of plantations. Construction began in April 2006 and the plant commenced production 13 months later. To date approximately R100 million has been indirectly invested in Ugie and the surrounding communities.
A 24-hour Steinhoff International hotline is in place whereby employees can report any incidents of fraud, corruption or unethical behaviour. This hotline is managed by KPMG. A similar service is available in Botswana, Lesotho, Namibia and Swaziland. The current reported call rate is testament to the success of the hotline implementation and the pre-emptive strategy it supports. Although not all calls are relevant to issues of fraud, all calls are followed up. Incidences are reported at divisional board level on a quarterly basis and are mostly dealt with at operational level. Material issues are escalated to the audit and risk committee.
Training and development
Recycling HIV/AIDS Economic impactRisk management
Sponsorship Community involvement
Jordan, through the Asics brand, sponsors an amateur cycling team which operates as an informal academy where young aspiring cyclists between the ages of 18 – 23 are afforded the opportunity to learn and grow within a competitive setting and hopefully attract the attention of professional teams in the process. Although based 100% on merit, the Asics team supersedes Cycling SA’s criteria regarding age and race and has a 50% inclusion of previously disadvantaged members. This year saw the team secure six top 10 finishes.
Amongst other initiiatives, Feltex donated hides to the value of R400 000 to the Durban Skills Development centre. This opportunity provided the women of this centre with the raw material required to make leather goods including hand bags, shoes and even furniture, selling the items at a profit, empowering them economically. The hide donation is now being re-evalutated to make this a long-term and sustainable partnership between Feltex and the development centre.
Group-wide initiatives include, amongst others:

62 KAP Integrated Annual Report 2012
Operating decisions are made at appropriate levels, with divisional HR committees being responsible for the development of their people. Participative management lies at the heart of this strategy. this relies on building effective employee partnerships at every level, fostering mutual trust and encouraging employees to act in a way that will add to the success of the business and their own development. Management, through the divisional HR committees, considers and advises on employee remuneration, medical and retirement benefits, employment equity/equal opportunities, black economic empowerment, succession planning, training and development, industrial relations and performance management.
training and development
Sustainability reportSocial
50%Logistics
10%Integrated timber
14%Passenger
26%Manufacturing
Employee split for KAP International
Employee split for Logistics
45%Freight and
Logistics
35%Agriculture and Mining
20%Fuel and Chemical
Employee split for Manufacturing
29% Footwear
26%Automotive
components
20%Furniture and bedding components
15%Food
7%Towelling
3%PET
Investing in people is key to the group’s efforts to attract and retain competent staff to achieve its strategic objectives. Human resources (HR) and industrial relations activities of all group divisions have been structured to promote effective employee relations and identify and resolve areas of potential concern and/or conflict.
The group’s employee numbers
TotalSouth Africa
Other African
countries
Logistics
USCS Freight and Logistics 5 300 5 300
USCS Agriculture and Mining 4 100 900 3 200
USCS Fuel and Chemical 2 400 1 600 800
Passenger
Unitrans Passenger 3 400 3 400
Manufacturing
Footwear 1 800 1 800
Automotive components 1 600 1 600
Furniture and bedding components 1 200 1 100 100
Food 900 900
Towelling 400 400
PET 200 200
Integrated Timber
PG Bison 2 400 2 400
Total 23 700 19 600 4 100

KAP Integrated Annual Report 2012 63
corporateresponsibility
reports
An appropriately skilled workforce is central to the achievement of the strategic goals of the group.
the need for skilled people, particularly in the technical and engineering disciplines, is ongoing. It is therefore vital to ensure an appropriate pipeline of skilled people to meet future skills requirements. targeted recruitment and remuneration practices, coupled with effective performance and talent management, play an integral part in ensuring that the organisation continues to have access to a competent workforce at all levels.
Divisional chief executive officers and managing directors are responsible for the training and development of their employees. employees are informed of and have equitable access to training and development opportunities, as far as reasonably practical. Divisional targets for employee development are incorporated into the KPAs of each divisional chief executive officer and managing director.
Managers are encouraged to participate in management development programmes, where available. learnerships and trainee programmes are sponsored by the group to assist with the meeting of future skills requirements. competency gaps and individual training and development needs are identified and action plans developed to address these needs. the development needs of high-performing individuals, with particular emphasis on black employees, are receiving special attention.
Skills development and training throughout the group includes supervisory, management and leadership development, learnerships, in-service training, operator training, general skills development of shop-floor employees, ongoing on-the-job training, health and safety training and effective coaching and mentoring processes. to support these programmes, strong partnerships have been formed with relevant educational institutions and Sector education and training Authorities (SetAs). workplace skills plans and implementation reports are submitted to the relevant SetAs on an annual basis.
Approximately R30 million was invested in employee training and 32% of total employees received training additional to the required health and safety, induction and “on-the-job” training.
260 employees received learnerships.
employee relationsCode of ethics
the group’s code of ethics commits it to the highest standards of integrity, behaviour and ethics when dealing with its stakeholders, including directors, management, employees, customers, suppliers, competitors, investors, shareholders and society at large. Directors and staff are expected to observe their ethical obligations to ensure all business is conducted using fair commercially competitive practices. executive management is required to exercise due care when delegating authority to subordinates.
employees are required to maintain the highest ethical standards in ensuring that business practices are conducted in a manner which, in all reasonable circumstances, is above reproach.
In turn, employees expect to be fairly compensated in a group that operates ethically and responsibly in a safe environment. It is the group’s responsibility to ensure that ethical management procedures are in place to protect employees, support diversity and reward performance.
Human rights
South Africa is a signatory to the Universal Declaration of Human Rights, which in turn, is reflected in the country’s progressive constitution. KAP has incorporated human rights principles into its practices, which is incorporated into its code of ethics, supporting its commitment of acting equitably and honestly in the conduct of its business.
the group supports the ten principles of the global compact, as described by the companies Act, which puts legal responsibility on companies to take cognisance of all aspects of human rights. the group does not support or encourage any behaviour that would infringe on any of these principles and would take serious action against any person or group that do not act within the boundaries of these principles.
As part of the group’s responsibility towards Steinhoff’s social and ethics committee (as previously described), the ten principles of the global compact, together with the other requirements, will be reviewed. the group should, within the next reporting period, be in a position to expand on this matter.
Labour practices, trade unions and employee participation
All divisions have disciplinary policies and procedures in place, which are communicated appropriately. Instances of misconduct are addressed by implementing the provisions of disciplinary codes that allow for corrective behaviour as a first step towards resolving disciplinary issues. the codes have been drawn up in order to apply discipline in a fair and consistent manner, in line with the relevant labour legislation. If employees feel unjustly treated, they can exercise their rights in terms of the particular division’s internal appeal procedure and the relevant legislation. Site-specific disciplinary codes and procedures have been negotiated with the relevant trade unions, where applicable.
the group’s grievance procedures are intended to create an environment that is condusive to constructive employee relations, by facilitating prompt and fair action by the group when employees raise legitimate complaints. the intention of the grievance procedures is to ensure that grievances are resolved as near to their point of origin as possible, and as fast as possible.
Management actions in this regard are required to be timeous, consistent, objective, fair and based on the merits of each case. However, circumstances and legislation vary from country to country, which calls for some flexibility in the group’s labour philosophy to accommodate specific dispensation requirements.
employees are introduced to these policies and procedures during induction sessions, interaction with HR departments and through newsletters, divisional intranets and written contracts of employment. All employees are managed according to the procedures stipulated in the labour laws of each operating country. Operational workplace committees foster regular interaction between management and employee representatives on various issues.

64 KAP Integrated Annual Report 2012
employee forums with elected representatives, or employee committees for employee complaints and communication both to and from employees are used in some divisions. these workplace forums address conditions of employment and facilitate the consultation of employees within problem-solving sessions.
consultative workplace interactions have proved to be instrumental in introducing flexible working arrangements and in securing a reciprocal higher level of commitment towards the group.
Procedures and divisional policies support the group directive and assist with the regulation of workplace relationships. Many of the group’s employees form part of labour groups or unions.
throughout the group 45% of the workforce belong to unions. where required, we have concluded recognition agreements with majority representative unions within the divisional business units. Should any union obtain majority representation within a division, similar agreements would be negotiated.
During the financial year there were labour strikes in the passenger and timber divisions. these only affected one passenger contract and one production facility with no significant financial impact.
Health and safetyA key objective for the group is the creation and maintenance of an injury-free and safe workplace.
Health and safety are managed through committees by HR managers, divisional, and regional health and safety managers, risk managers and occupational health and safety representatives. external consultants and administrators are appointed when specialised expertise is required or when audits are conducted.
these committees ensure that the guidelines set at group level are complied with. the guidelines require that all operations comply with applicable legislation, regulations and codes of practice and standards, to retain their licence to operate and function in a responsible way. Included in their sphere of responsibility and process are regular hazard identification and risk assessments, internal audits, safety training, management reviews and third-party audits.
All new employees receive health and safety induction training with regular and continuous reviews. In the logistics businesses where operational risks could have a direct public impact, ongoing training includes driver training, the conveyance of dangerous goods by road, safe work procedures, defensive driving training and fatigue management. this training operates alongside programmes such as driver management programmes which regulate hours and shifts worked, and include first aid, food safety, fire-fighting and general safety awareness.
Risk assessments and the implementation of workplace systems are undertaken and are reported on to measure improvement and to identify areas of potential risk and additional focus areas. Regular assessments, reviews and independent audit results are compiled by divisional committees, safety representatives and management. this process follows established reporting channels, up to board level. Integrated computerised safety, health, environmental and quality (SHeQ) management systems have been introduced by certain divisions, and assist greatly in the compilation of accurate and timeous SHeQ reports.
we strive to go beyond mere compliance with relevant legislation. Accordingly, most of the divisions have been certified with international and national standards. the majority of the divisional businesses are compliant with standards relevant to their sectors, assuring their customers that international and/or local standards of quality and best practice have been implemented. Regular supplier and standard audits are carried out at these certified sites to ensure the retention of certifications.
none of the group’s divisions failed certification compliance audits during the year. One employee fatality occurred during the reporting period and no significant fines were incurred. In-depth investigations are conducted into all incidents and mitigation procedures are continuously reviewed.
Sustainability reportSocial continued
Division AccreditationLo
gist
ics
USCS Fuel and Chemical
ISO 9001
ISO 14001
OHSAS 18001
USCS Agriculture and Mining
NOSA CNB 253 Integrated System (11 Agricultural sites)
ISO 9001 (7 Mining sites)
OHASA 18001 (7 Mining sites)
Road Traffic Management System (RTMS) (1 Agric. and 1 mining site)
ISO 14001 (7 Mining Sites)
Inte
grat
ed
timbe
r
PG Bison
ISO 9000
ISO 14000
ISO 18000
SABS
Man
ufac
turin
g
Hosaf ISO 9001:2008
Feltex
ISO 9001
ISO 14001
OHSAS 18001
TS 16469
Cisema China Certification
VitafoamSANS 883:2009 (PU foam)
SANS 12911-2 (mattress)
DesleeMattex ISO 9001
JordanISO 9001:2008
SANS 421:2008
United Fram ISO 9001:2008
Wayne Plastics ISO 9001:2008
Bull Brand HACCP (SANS 10330)
Glodina
ISO 9001
ISO 14001
OHSAS 18001
* Standards and certifications cover approximately 60% of the group’s employees
Standards and certifications*
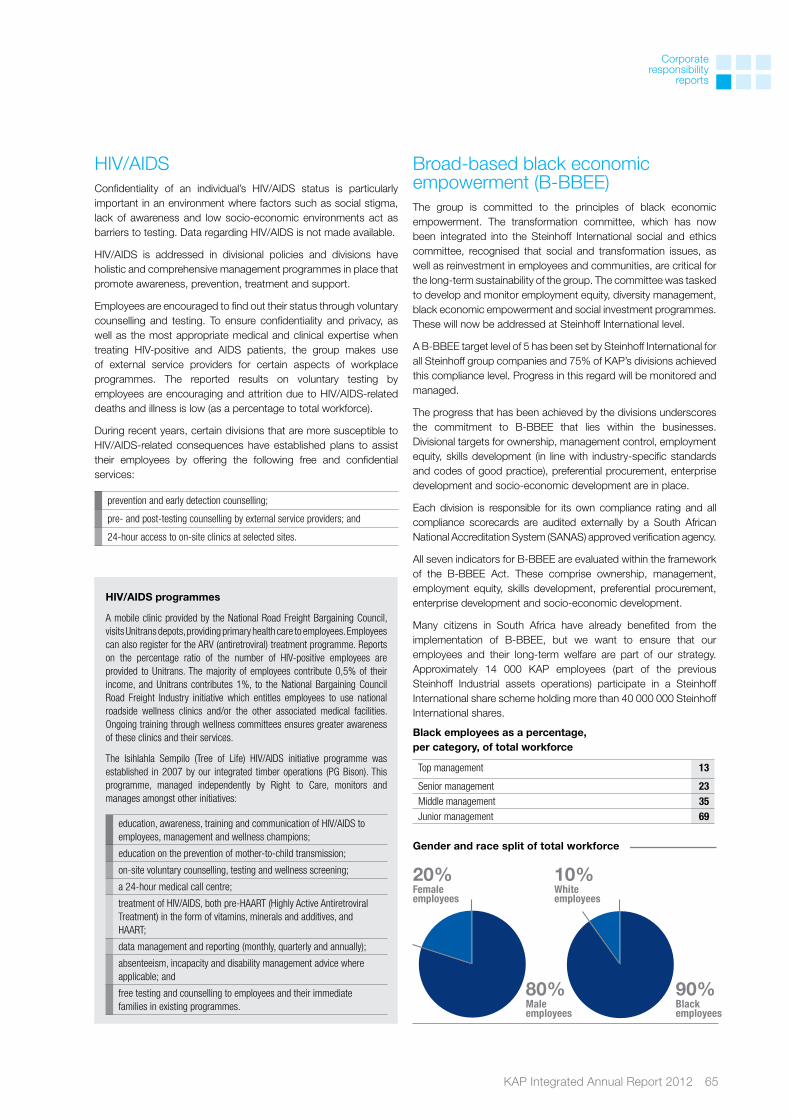
KAP Integrated Annual Report 2012 65
corporateresponsibility
reports
HIV/AIDS programmes
A mobile clinic provided by the National Road Freight Bargaining Council, visits Unitrans depots, providing primary health care to employees. Employees can also register for the ARV (antiretroviral) treatment programme. Reports on the percentage ratio of the number of HIV-positive employees are provided to Unitrans. The majority of employees contribute 0,5% of their income, and Unitrans contributes 1%, to the National Bargaining Council Road Freight Industry initiative which entitles employees to use national roadside wellness clinics and/or the other associated medical facilities. Ongoing training through wellness committees ensures greater awareness of these clinics and their services.
The Isihlahla Sempilo (Tree of Life) HIV/AIDS initiative programme was established in 2007 by our integrated timber operations (PG Bison). This programme, managed independently by Right to Care, monitors and manages amongst other initiatives:
education, awareness, training and communication of HIV/AIDS to employees, management and wellness champions;
education on the prevention of mother-to-child transmission;
on-site voluntary counselling, testing and wellness screening;
a 24-hour medical call centre;
treatment of HIV/AIDS, both pre-HAART (Highly Active Antiretroviral Treatment) in the form of vitamins, minerals and additives, and HAART;
data management and reporting (monthly, quarterly and annually);
absenteeism, incapacity and disability management advice where applicable; and
free testing and counselling to employees and their immediate families in existing programmes.
HIv/AIDSconfidentiality of an individual’s HIv/AIDS status is particularly important in an environment where factors such as social stigma, lack of awareness and low socio-economic environments act as barriers to testing. Data regarding HIv/AIDS is not made available.
HIv/AIDS is addressed in divisional policies and divisions have holistic and comprehensive management programmes in place that promote awareness, prevention, treatment and support.
employees are encouraged to find out their status through voluntary counselling and testing. to ensure confidentiality and privacy, as well as the most appropriate medical and clinical expertise when treating HIv-positive and AIDS patients, the group makes use of external service providers for certain aspects of workplace programmes. the reported results on voluntary testing by employees are encouraging and attrition due to HIv/AIDS-related deaths and illness is low (as a percentage to total workforce).
During recent years, certain divisions that are more susceptible to HIv/AIDS-related consequences have established plans to assist their employees by offering the following free and confidential services:
prevention and early detection counselling;
pre- and post-testing counselling by external service providers; and
24-hour access to on-site clinics at selected sites.
Broad-based black economic empowerment (B-BBee)the group is committed to the principles of black economic empowerment. the transformation committee, which has now been integrated into the Steinhoff International social and ethics committee, recognised that social and transformation issues, as well as reinvestment in employees and communities, are critical for the long-term sustainability of the group. the committee was tasked to develop and monitor employment equity, diversity management, black economic empowerment and social investment programmes. these will now be addressed at Steinhoff International level.
A B-BBee target level of 5 has been set by Steinhoff International for all Steinhoff group companies and 75% of KAP’s divisions achieved this compliance level. Progress in this regard will be monitored and managed.
the progress that has been achieved by the divisions underscores the commitment to B-BBee that lies within the businesses. Divisional targets for ownership, management control, employment equity, skills development (in line with industry-specific standards and codes of good practice), preferential procurement, enterprise development and socio-economic development are in place.
each division is responsible for its own compliance rating and all compliance scorecards are audited externally by a South African national Accreditation System (SAnAS) approved verification agency.
All seven indicators for B-BBee are evaluated within the framework of the B-BBee Act. these comprise ownership, management, employment equity, skills development, preferential procurement, enterprise development and socio-economic development.
Many citizens in South Africa have already benefited from the implementation of B-BBee, but we want to ensure that our employees and their long-term welfare are part of our strategy. Approximately 14 000 KAP employees (part of the previous Steinhoff Industrial assets operations) participate in a Steinhoff International share scheme holding more than 40 000 000 Steinhoff International shares.
Black employees as a percentage, per category, of total workforce
Top management 13
Senior management 23Middle management 35Junior management 69
90%Black employees
10%White employees
80%Male employees
20%Female employees
Gender and race split of total workforce
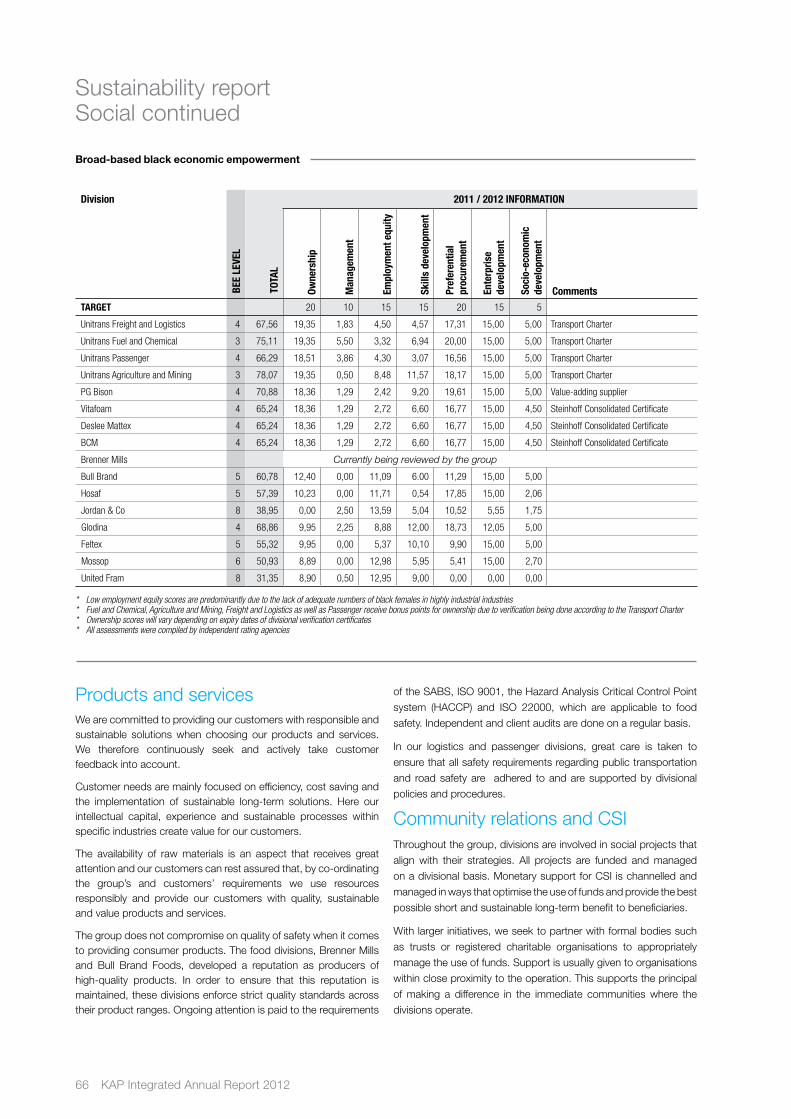
66 KAP Integrated Annual Report 2012
Products and services we are committed to providing our customers with responsible and sustainable solutions when choosing our products and services. we therefore continuously seek and actively take customer feedback into account.
customer needs are mainly focused on efficiency, cost saving and the implementation of sustainable long-term solutions. Here our intellectual capital, experience and sustainable processes within specific industries create value for our customers.
the availability of raw materials is an aspect that receives great attention and our customers can rest assured that, by co-ordinating the group’s and customers’ requirements we use resources responsibly and provide our customers with quality, sustainable and value products and services.
the group does not compromise on quality of safety when it comes to providing consumer products. the food divisions, Brenner Mills and Bull Brand Foods, developed a reputation as producers of high-quality products. In order to ensure that this reputation is maintained, these divisions enforce strict quality standards across their product ranges. Ongoing attention is paid to the requirements
Sustainability reportSocial continued
Division
BEE
LEVE
L
TOTA
L
2011 / 2012 INFORMATION
Owne
rshi
p
Man
agem
ent
Empl
oym
ent e
quity
Skill
s de
velo
pmen
t
Pref
eren
tial
proc
urem
ent
Ente
rpris
e de
velo
pmen
t
Soci
o-ec
onom
ic
deve
lopm
ent
Comments
TARGET 20 10 15 15 20 15 5
Unitrans Freight and Logistics 4 67,56 19,35 1,83 4,50 4,57 17,31 15,00 5,00 Transport Charter
Unitrans Fuel and Chemical 3 75,11 19,35 5,50 3,32 6,94 20,00 15,00 5,00 Transport Charter
Unitrans Passenger 4 66,29 18,51 3,86 4,30 3,07 16,56 15,00 5,00 Transport Charter
Unitrans Agriculture and Mining 3 78,07 19,35 0,50 8,48 11,57 18,17 15,00 5,00 Transport Charter
PG Bison 4 70,88 18,36 1,29 2,42 9,20 19,61 15,00 5,00 Value-adding supplier
Vitafoam 4 65,24 18,36 1,29 2,72 6,60 16,77 15,00 4,50 Steinhoff Consolidated Certificate
Deslee Mattex 4 65,24 18,36 1,29 2,72 6,60 16,77 15,00 4,50 Steinhoff Consolidated Certificate
BCM 4 65,24 18,36 1,29 2,72 6,60 16,77 15,00 4,50 Steinhoff Consolidated Certificate
Brenner Mills Currently being reviewed by the group
Bull Brand 5 60,78 12,40 0,00 11,09 6.00 11,29 15,00 5,00
Hosaf 5 57,39 10,23 0,00 11,71 0,54 17,85 15,00 2,06
Jordan & Co 8 38,95 0,00 2,50 13,59 5,04 10,52 5,55 1,75
Glodina 4 68,86 9,95 2,25 8,88 12,00 18,73 12,05 5,00
Feltex 5 55,32 9,95 0,00 5,37 10,10 9,90 15,00 5,00
Mossop 6 50,93 8,89 0,00 12,98 5,95 5,41 15,00 2,70
United Fram 8 31,35 8,90 0,50 12,95 9,00 0,00 0,00 0,00
* Low employment equity scores are predominantly due to the lack of adequate numbers of black females in highly industrial industries* Fuel and Chemical, Agriculture and Mining, Freight and Logistics as well as Passenger receive bonus points for ownership due to verification being done according to the Transport Charter* Ownership scores will vary depending on expiry dates of divisional verification certificates* All assessments were compiled by independent rating agencies
of the SABS, ISO 9001, the Hazard Analysis critical control Point
system (HAccP) and ISO 22000, which are applicable to food
safety. Independent and client audits are done on a regular basis.
In our logistics and passenger divisions, great care is taken to
ensure that all safety requirements regarding public transportation
and road safety are adhered to and are supported by divisional
policies and procedures.
community relations and cSIthroughout the group, divisions are involved in social projects that
align with their strategies. All projects are funded and managed
on a divisional basis. Monetary support for cSI is channelled and
managed in ways that optimise the use of funds and provide the best
possible short and sustainable long-term benefit to beneficiaries.
with larger initiatives, we seek to partner with formal bodies such
as trusts or registered charitable organisations to appropriately
manage the use of funds. Support is usually given to organisations
within close proximity to the operation. this supports the principal
of making a difference in the immediate communities where the
divisions operate.
Broad-based black economic empowerment
KAP Integrated Annual Report 2012 67
corporateresponsibility
reports
Socio-economic development
Our social investment continues to benefit the communities
geographical expansion and growth directly affects the immediate communities within which the group operates. the most outstanding example of this is Ugie – a small town nestled in the mountains of the north eastern cape.
For the last four years we have reported on the investment and subsequent progress of the Pg Bison particle board manufacturing plant in Ugie and the north eastern cape Forest (necF) cluster.
In the first year, our focus was on the capital investment in the area, the partnership with government and local authorities, and the projected development that was planned for the greater Ugie/Maclear area. A capital investment of R1,5 billion ensured the building of one of the most modern particle board plants, and included the acquisition of 82 000 hectares of land inclusive of 33 000 hectares of plantations. construction began in April 2006 and the plant commenced production 13 months later.
to date, approximately R100 million has been indirectly invested in Ugie and the surrounding communities.
Creating opportunities
with the Ugie plant and the necF forestry operations now fully operational, Pg Bison continues to contribute and invest in the local community. this investment has focused mainly on enterprise development, bursary schemes and local business support.
Many specialists and technical experts from the Pg Bison group were redeployed to the area.
this operation now employs more than 400 permanent employees and a number of contractors from the immediate community. the annual salary and wage bill amounts to, in excess of R70 million. with most of the employees living in the towns of Ugie and Maclear, the local businesses and municipalities have also benefited from increased business.
Many of the services required by the operations have created opportunities for local business and entreprteneurs. this lead to the growth and development of existing businesses and the establishment of new businesses to fulfil Pg Bison’s demands.
the peripheral service requirements of the board plant and plantations have secured employment contracts for more than 140 people, amounting to a value of more than R20 million per annum. these enterprise development initiatives include elements such as garden services, waste management, office cleaning, security, road construction and maintenance, and catering services.
Silvicultural activities and other related services are contracted to five community-based service providers, three of which are black-owned enterprises. these services include fire protection and the planting and tending of trees. the five local businesses employ more than 500 local residents.
More than 150 small timber suppliers have been developed. these initiatives benefit approximately 760 individuals and approximately R10 million was spent on additional timber procurement.
to further enhance the livelihoods of rural communities, Pg Bison, necF and ASgISA (Accelerated and Shared growth – South Africa) are working on future development programmes such as the establishment of community-based plantations.
with the development and increasing number of small timber suppliers, the need for additional transport and opportunities for residue usage will also grow. new opportunities for entrepreneurs constantly arise and lead to the establishment of a skills development centre, focusing on agriculture and forestry training.
the development of the Ugie plant and necF plantations and the subsequent expansion of the immediate infrastructure, have also resulted in the upliftment of the greater elundini region. new shops within the township opened and it is estimated that about 5 000 jobs were created indirectly by the Ugie development. As opportunities continue to be presented, the residents of Ugie, Maclear and the whole elundini region will be positively influenced.
Community fun and participation
Pg Bison and necF are now an integral part of the community. the continuous investment of time and money in the form of various actions enhances our involvement in the community on all levels.
these investments include: ad hoc donations, fuel for sport tours, building supplies for school maintenance, support for Arbour week, assistance in local vegetable gardens and the hosting of the annual Pg Bison soccer knock-out cup and netball tournament.
the annual Pg Bison soccer knock-out cup and netball tournament creates a platform for communication, community participation and additional partnership development. the tournament serves to unite the residents of Ugie, Maclear, Mount Fletcher and elliot. we also use this event to communicate important messages regarding local activities, HIv/AIDS education and community projects.
Set against the background of sport, fitness and fun, approximately 4 000 people are involved either as players, referees, coaches, supporters, performers, service providers, volunteers, charities or as supporting employees. Of this number, 2 000 people are direct beneficiaries through their involvement over the course of the weekend, and all 4 000 people present receive cooked meals, with supplies provided by the local stores.
through hard work, dedication and continuous community involvement, “Building winning partnerships” has become a recognised slogan of the event, further enhancing Pg Bison’s reputation in this community that holds great promise.

68 KAP Integrated Annual Report 2012
Sustainability reportenvironment
Policy and approachKAP is mindful of the earth’s resources and in the way we use those resources in our day-to-day operational activities. we consequently recognise our responsibility to manage and, where possible, reduce our environmental impact and carbon emissions through appropriate fuel and energy efficiency, pollution reduction and water conservation measures. varying levels of potential impact on the environment exist throughout the group and each division has the responsibility to, within their context and sphere of influence, to manage their impact.
the group therefore:
focuses on calculating, managing and optimising its energy usage and fuel consumption;
strives to keep waste materials to a minimum and to recycle and dispose of waste in safe and responsible ways; and
is mindful of its impact on water resources, which, within the African context, has become a focus area.
environmental regulatory requirements are constantly evolving and are becoming increasingly stringent. we have managed to keep abreast of these changes and have an established track record of meeting required environmental standards and implementing international environmental management systems.
Policies and practices are in place to ensure that the divisions are managed within relevant statutory and legal parameters and KAP’s self-defined best practice requirements. Key environmental risks continue to be identified and appropriate action taken to reduce or eliminate risks.
Divisional initiatives are in place to address risks and to leverage opportunities relating to material environmental issues, which are identified, reported and monitored through established risk management and internal reporting structure.
All our divisions record data relating to energy consumption, waste management and water usage. targets have been set at operational level within the divisions and are being aligned to the ISO 14001, OHSAS 18001 and nOSA requirements. Accredited auditors including the SABS and Alexander Forbes Risk Services, monitor the achievement of objectives. the group commits to managing and assessing divisional targets. In future, when all divisions have been aligned and fully incorporated with regard to data collection and improved understanding of our environmental impact, the group will be in a better position to set non-financial group targets.
environmental impact assessments (eIAs) and the implementation of resultant environmental management plans (eMPs) are standard practice. Research is regularly undertaken to measure and monitor the impact of operations on the environment.
environmental incidents and complaints are continuously monitored and, when an incident is recorded, corrective action is a priority. there were no material incidents reported during the period under review.
KAP subscribes to and endorses the Steinhoff International environmental policy that is supported, in turn, by divisional policies. At a group level KAP is committed to proactively promote awareness of environmental management and to maintaining proper standards of environmental management in all its divisions. the group aims to employ and improve practices within the divisions to benefit the environment, our shareholders and the community at large.
carbon footprintthe group operates in industries where energy and fuel consumption are the two main contributors of Scope 1 and Scope 2 carbon emissions. Managing these two environmental aspects is therefore a focus area. group-wide awareness helps to manage fuel and energy consumption as costs have come under scrutiny.
the Steinhoff Industrial assets formed part of Steinhoff’s carbon footprint for the past two reporting periods. this year, the businesses within the manufacturing division: automotive components; Pet (resin); footwear; food and towelling have been added to a carbon footprint calculation – a first for the KAP group. the carbon footprint is done in accordance with the greenhouse gas Protocol (gHg).
there are various levels of data maturity throughout the group and we expect the results to improve with time. we will use this year’s calculation process:
to get a fair understanding of our baseline;
as an additional management tool to highlight and manage areas of high consumption;
to put strategies in place to minimise input costs, while containing or decreasing carbon emissions wherever viable; and
to determine areas of improvement in data collection.
Fuel
Fuel usage is material in the logistics and passenger divisions where cost savings and improving fuel efficiency are key to their sustainability strategies. Fuel efficiency is mostly measured by comparing fuel usage per kilometre. Overall fuel usage (from year to year) cannot be compared as the extent of contracts, inclusion of new contracts, increase in fleet size, etc. are all factors that could distort overall/average performance numbers. Fuel consumption is managed through compliance with manufacturer’s maintenance standards.
KAP is committed to proactively promote awareness of environmental management throughout the group and to maintain proper standards of environmental management in all its divisions.

KAP Integrated Annual Report 2012 69
corporateresponsibility
reports
Generating energy, reducing emissions
Programmes for energy optimisation have been established at our largest board production plant, recycling all waste material to produce additional sources of energy. this has resulted in no fossil fuel being used to fuel the plant’s boilers.
KAP group’s carbon footprint
Scope SourceTonnes CO2e
2011/2012
Scope 11 Company-owned/controlled vehicles 332 991,88
Mobile machinery 13 382,13
Stationary fuels 59 642,24
Fugitive emissions 3 562,29
Sub-total Scope 11 409 578,54
Other2 Other fugitive emissions (non-Kyoto gases) 144,80
Scope 23 Electricity 268 684,12
Heating 4 704,69
Sub-total Scope 23 273 388,81
Total 683 112,14
1 All direct GHG emissions*2 Other indirect emissions, such as the extraction and production of purchased
materials and fuels, transport-related activities in vehicles not owned or controlled by the reporting entity, electricity-related activities not covered in Scope 2, outsourced activities, waste disposal, etc.
3 Indirect GHG emissions** from consumption of purchased electricity, heat or steam
* Emissions from sources that are owned or controlled by the reporting entity** Emissions that are a consequence of the activities of the reporting entity, but
occur at sources owned or controlled by another entity
Scope 3 emissions were not measured in this assessment. the group will focus on Scope 1 and 2 for the foreseeable future to establish a solid track record, while we will continue to implement processes to record Scope 3 data.
Fuel saving and efficiency in the logistics division (UScS) are achieved through:
the optimum use of supply chain technologies and innovation;
customer partnerships;
replacing and recapitalising older technology in vehicles and equipment with new technology;
introducing more fuel-efficient vehicles;
the use of driver/operator behaviour monitoring technology and systems to reduce fuel consumption (reducing over-revving, over-speeding, excessive idling, etc.);
research and development of high-efficiency vehicle combination designs where efficient;
safe, maximum payload transport solutions are developed that reduce the amount of fuel burnt per unit of cargo transported; and
behaviour change initiatives.
South African legislators are targeting emission standards set by europe where euro Iv standard is currently compulsory. emission standards play a vital role in the specification of new vehicles in the passenger division and a large portion of the fleet is already euro III compliant. nationally, South Africa still has to enforce euro I compliancy. the quality of fuel in Africa also limits the use of euro Iv compliant engines, however certain design changes to combustion engines were introduced by manufacturers to limit emissions.
Fuel usage in the other divisions is either insignificant or is outsourced to third-party suppliers. All fuel usage is accounted for in the carbon footprint Scope 1 calculation.
Energy
Programmes are in place across the group to create awareness and change behaviour to optimise and save on electricity. Many of the Steinhoff Industrial assets sites formed part of the Steinhoff programme to install electricity meters and to monitor and manage electricity usage (this remains an ongoing Steinhoff group process). As part of the larger group, this programme will be rolled out to all the divisional sites over time to include all KAP’s divisional sites. the goal of this programme is to establish a reliable system throughout the Steinhoff group in preparation for the South African Power conservation Programme’s (PcP) national 10% electricity reduction initiative. Initial findings in the divisions (at selected locations) already showed a saving of approximately 5,9 million kwh.
A power purchase agreement was signed with a company to supply clean power to one of Pg Bison’s manufacturing facilities. the power will be generated from waste wood products.
examples of energy efficiency and saving programmes at divisional site level includes:
installing electricity meters, converters and time switches;
initiating shut-down/power-down times;
introducing shift changes to production times outside of peak energy usage periods;
switching off of all components not in use; and
installing LED lights and light movement sensors in buildings.
60%Scope 1
40%Scope 2
Total emissions

70 KAP Integrated Annual Report 2012
Sustainability reportenvironment continued
Air, water and waste Air
All divisions have to comply with environmental regulations and many business licences are dependent on regulatory assessments. An example of such legislation is the national environment Management: Air Quality Act (neM AQA) in South Africa.
Only a small number of the group’s manufacturing facilities are responsible for minimal stack emissions. these stack emissions occur mainly in the timber operations and specifically in the pole manufacturing plants. emissions are mostly from the boilers which generate the steam used for the wood-drying process. Although a few smaller facilities have boilers running off fossil fuel (and are reported on in the carbon footprint), all wood waste material (wood chips and sawdust) is used to fuel the boilers. current emissions
Scope 1 emissions
67%Logistics
20%Unitrans Passenger
8%Integrated timber
5%Manufacturing
55%Integrated timber
42%Manufacturing
2%Logistics 1%
Passenger
Scope 2 emissions
levels from these operations continue to remain well within the permitted levels.
emission reduction initiatives include:
Jordan has been certified as an emission-free factory.
United Fram improved air extraction from the spray room to reduce air pollution.
Bull Brand treats its boiler coal with a chemical called Sapex resulting in better combustion and a lowering of CO
2 emissions. It is also looking into more
effective steam generation to reduce coal consumption – to further reduce stack emissions.
A switch from boiler fuel to electric alternatives in some instances have been evaluated, but the cost is prohibitive due to ongoing high price increases for electricity being implemented in South Africa.
Water
the group acknowledges the potential future risks associated with water usage. globally, organisations are becoming more aware of the impact that a lack of water availability and increased water costs could have on business processes. through our risk management structure, water management is regularly reviewed on a divisional basis.
the group has introduced the measurement of water and will be in a position to report on its usage in time to come. Managing and reducing water usage is already part of the divisional processes where water usage is critical. water is recycled and reused where possible.
Effluent and waste
effluent and waste are highly regulated and regular site inspections are conducted by relevant government departments or standards authorities. without the appropriate systems in place to manage effluent and waste, the group’s licences to operate would be under risk and this is an area that receives particular attention.
effluent from the manufacturing operations is mainly treated at local authority treatment plants, where effluent quality is constantly monitored. where large quantities of water are used, effluent plants are in place to clean the used water, either for recycling back into the manufacturing process or, before discharge into the main water outlet systems. In the timber operations, most of the water used in one process is captured, cleaned and recycled into another process.
waste water from the logistics operations is limited to the wash bays at the vehicle depots. the water used to wash the vehicles is cleaned and recycled. changes in legislation have made the management of waste streams more critical and any non-compliance would be costly.
Hazardous effluent may result from substances carried on behalf of customers, specifically in the Fuel and chemical division of UScS. the division has stringent policies in place and works closely with the relevant authorities and approved consultants to ensure any such effluent is disposed of responsibly. to meet the environmental concerns of the future and to manage the different effluent processes associated with specific and varied product mixes, the Durban operation is investing R12 million in a new wash bay.

KAP Integrated Annual Report 2012 71
corporateresponsibility
reports
Weighing up the risk
the risk related to the transportation of fuel and chemicals is higher than the risk of effluent contamination. the Fuel and chemical division has a robust risk management process in place to reduce the risk of harmful effects resulting from the transportation and spillages of hazardous materials. Ongoing health and safety, and driver training play a vital role in addressing these risks. Should spillages occur, detailed procedures are followed to contain, clean and rehabilitate any exposed areas. clearance certificates by the relevant authorities regarding contamination of the land are obtained. During the year under review there were no significant incidences of spillage.
Waste
Divisional waste management and reduction initiatives are in place that sort, compact, reuse, sell and discard waste in a sustainable manner. this is done through:
revisiting upstream and downstream contracts and working with customers and suppliers to reduce waste material where possible;
installing new equipment to improve processes; and
implementing working methods, process changes and awareness to reduce/improve the use of material.
Most of the waste produced from the manufacturing operations is bio-product and is reused or recycled.
Hazardous residual waste is disposed of through certified processes and by specialist and ethical waste disposal companies. these include waste from the limited chemical processes, mostly from foam production and the disposal of waste from the logistics operations (tyres, oil, batteries etc.). each disposal is effected at approved dump sites, through approved waste management suppliers against the issue of certificates in compliance with the law and ISO standards.
Some of the divisions reuse and/or recycle their own waste material and in other instances buy additional waste material which is used in the manufacturing process.
Feltex recycles its Automotive trim waste into felt production, using almost 1 000 tons of recycled textiles per year.
Vitafoam acquires an additional 590 tonnes of recycled PU trim foam to supplement its foam requirements for the production of foam chip mattresses.
Biodiversity/Forestry
Although biodiversity is not material for the group it has:
an indirect impact through how we manage and monitor our own use and procurement of sustainable raw materials; and
a direct impact through the management of our plantations, forestry land and wood products.
All our forests are managed according to the principles set out by the FSc (Forestry Stewardship council) that calls for responsible forest management and is an international best practice guideline.
the only area where our land ownership could have a direct effect on the biodiversity of the surrounding land is in our timber operations at the necF cluster. these plantations are known as mosaic plantations which means that the cultivated land used for forestry is shared with protected land areas. the Pg Bison Ugie plantation boasts six natural heritage sites covering 5 700 hectares. the group is very involved in the immediate communities in this area in terms of education on environmental protection and management.
to manage and decrease the risk of fire in these areas:
Neighbouring communities get involved and are incentivised when no fires are recorded during certain periods;
grazing Nguni cattle herds keep the grasslands maintained;
an electronic fire detection system was installed and identifies heat variances through infra-red heat detection; and
fire-fighting helicopters are on stand-by for a three-month period during the dry season.
In association with the endangered wildlife trust, the group supports the Drakensberg crane conservation Project. wattled cranes are among South Africa’s most endangered bird species and are dependent on permanent wetlands for breeding and foraging. with Pg Bison’s support, this programme aims to identify priority sites for rehabilitation. these sites will be monitored over time to ensure that the crane population remains stable and shows growth.

72 KAP Integrated Annual Report 2012

KAP Integrated Annual Report 2012 73
Annual financial statements
Annual financial
statements

74 KAP Integrated Annual Report 2012
INDEPENDENT AUDITOR’S REPORT to the shareholders of KAP International Holdings Limited
We have audited the group financial statements of KAP International Holdings Limited set out on pages 80 to 149, which comprise the statement of financial position as at 30 June 2012, and the statement of comprehensive income, statement of changes in equity and statement of cash flows for the year then ended, and the notes, comprising a summary of significant accounting policies and other explanatory information.
Directors’ responsibility for the financial statementsThe company’s directors are responsible for the preparation and fair presentation of these financial statements in accordance with International Financial Reporting Standards and the requirements of the Companies Act of South Africa, and for such internal control as the directors determine is necessary to enable the preparation of financial statements that are free from material misstatement, whether due to fraud or error.
Auditors’ responsibility Our responsibility is to express an opinion on these financial statements based on our audit. We conducted our audit in accordance with International Standards on Auditing. Those standards require that we comply with ethical requirements and plan and perform the audit to obtain reasonable assurance about whether the financial statements are free from material misstatement.
An audit involves performing procedures to obtain audit evidence about the amounts and disclosures in the financial statements. The procedures selected depend on the auditor’s judgement, including the assessment of the risks of material misstatement of the financial statements, whether due to fraud or error. In making those risk assessments, the auditor considers internal control relevant to the entity’s preparation and fair presentation of the financial statements in order to design audit procedures that are appropriate in the circumstances, but not for the purpose of expressing an opinion on the effectiveness of the entity’s internal control. An audit also includes evaluating the appropriateness of accounting policies used and the reasonableness of accounting estimates made by management, as well as evaluating the overall presentation of the financial statements.
We believe that the audit evidence we have obtained is sufficient and appropriate to provide a basis for our audit opinion.
Opinion In our opinion, the group financial statements presents fairly, in all material respects, the financial position of KAP International Holdings Limited as at 30 June 2012, and its financial performance and cash flows for the year then ended, in accordance with International Financial Reporting Standards and the requirements of the Companies Act of South Africa.
Other reports required by the Companies ActAs part of our audit of the financial statements for the year ended 30 June 2012, we have read the Directors’ Report, the Audit and Risk Committee’s Report and the Company Secretary’s Certificate for the purpose of identifying whether there are material inconsistencies between these reports and the audited financial statements. These reports are the responsibility of the respective preparers. Based on reading these reports we have not identified material inconsistencies between these reports and the audited financial statements. However, we have not audited these reports and accordingly do not express an opinion on these reports.
Deloitte & Touche Registered Auditors Per M A van Wyk Partner 3 September 2012
Unit 11 Ground FloorLa Gratitude97 Dorp StreetStellenbosch, 7600Western Cape
National Executive: LL Bam Chief Executive AE Swiegers Chief Operating Officer GM Pinnock Audit DL Kennedy Risk Advisory NB Kader Tax L Geeringh Consulting & Clients & Industries JK Mazzocco Talent & Transformation CR Beukman Finance M Jordan Strategy S Gwala Special Projects TJ Brown Chairman of the Board MJ Comber Deputy Chairman of the Board Regional Leader: BGC Fannin
A full list of partners and directors is available on request

KAP Integrated Annual Report 2012 75
Annual Financial StatementsDIRECTORS’ REPORT
for the year ended 30 June 2012
Holding companyAt the date of this report, the controlling shareholder of the company is Steinhoff International Holdings Limited (“Steinhoff Africa”) which, through one of its wholly-owned subsidiaries, owns 61,86% of the group.
Nature of business More information on the nature of the business of the group may be found in the “Overview” section of the Integrated Report.
KAP/Steinhoff Industrial mergerAt the general meeting of shareholders held on 18 January 2012, shareholders approved the acquisition of the Steinhoff Industrial assets for an aggregate consideration of R8 921 million less the net of third party debt and cash balances on the effective date (2 April 2012). KAP International Holdings Limited (“KAP”) acquired all of the ordinary shares in the Steinhoff Industrial assets from Steinhoff Africa Holdings (Pty) Limited. The consideration for the Steinhoff Industrial assets consisted of the issue of 1 913 million KAP ordinary shares and the creation of a loan account for R3 875 million with Steinhoff Africa. For accounting purposes, the acquisition is accounted for as a reverse acquisition in terms of IFRS 3 (revised) Business Combinations, with the Steinhoff Industrial assets being treated as the acquirer and KAP as the acquiree. The relevant approvals for the transaction were received on 30 March 2012 (transaction unconditional). The consideration shares were issued on 4 April 2012 and a new KAP board was constituted as detailed below.
Presentation of the financial statements The statutory results presented for the current period comprise Steinhoff Industrial assets’ results for the 12 months ended 30 June 2012 and the traditional KAP results for the three months ended 30 June 2012. The comparatives consist of Steinhoff Industrial assets’ results for the 12 months ended 30 June 2011.
Financial results Commentary on the financial results is included in the Chief Executive Officer’s and Chief Financial Officer’s reports of the integrated report.
Distribution The board has recommended a dividend of 6 cents per share dividends withholdings tax at 15% amounts to R21 035 292.
Stated share capitalThe authorised share capital of the company was increased during the year to 6 000 million shares (2011: 1 200 million shares) which were converted to no par value shares (2011: 20 cents nominal value per share). The effect of the reverse acquisition on share capital is disclosed in note 18 to the annual financial statements.
10% of the unissued shares are under the control of the directors. This authority is subject to renewal by ordinary resolution at the annual general meeting to be held on 14 November 2012.
Directorate
The directors of the company are:
Name Appointment ResignationJohn Peter Haveman 22 November 2005Karel Johan Grové 25 April 2012Jacob de V du Toit 24 May 2012Markus Johannes Jooste 12 November 2004Andries Benjamin la Grange 25 April 2012Johannes Bhekumuzi Magwaza 12 November 2004Ipeleng Nonkululeko Mkhari 12 November 2004Stephanus Hilgard Müller 25 June 2012Sandile Hopeson Nomvete 12 November 2004Patrick Keith Quarmby 25 June 2012Christiaan Johannes Hattingh van Niekerk 25 April 2012Daniel Maree van der Merwe 22 November 2005Claas Edmund Daun 1 December 2003 25 June 2012Fried Möller 12 November 2004 25 June 2012Karl Ernst Schmidt 1 March 2010 25 June 2012Paul Cornelis Thomas Schouten 31 July 2003 25 April 2012Ulrich Schäckermann 1 March 2010 25 June 2012
The directors are pleased to present the audited annual financial statements of the group for the year ended 30 June 2012.

76 KAP Integrated Annual Report 2012
DIRECTORS’ REPORT for the year ended 30 June 2012 (continued)
Subsequent events No material change has taken place in the affairs of the group between the end of the financial year and the date of this report.
Responsibility of directors It is the directors’ responsibility to ensure that the annual financial statements fairly present the state of affairs of the group. The external auditors are responsible for independently auditing and reporting on the financial statements.
The directors are also responsible for the systems of internal control. These are designed to provide reasonable, but not absolute, assurance on the reliability of the financial statements, to adequately safeguard, verify and maintain accountability of assets, and to prevent and detect material misstatement and loss. The systems are implemented and monitored by suitably trained personnel with an appropriate segregation of authority and duties. Nothing has come to the attention of the directors to indicate that any material breakdown in the functioning of these controls, procedures and systems has occurred during the year under review.
The financial statements set out in this report have been prepared by management on the basis of appropriate accounting policies which have been consistently applied except where stated otherwise. The financial statements have been prepared in accordance with International Financial Reporting Standards (IFRS).
Annual financial statements The financial statements set out in this report have been prepared by management in accordance with IFRS, the AC 500 Standards as issued by the Accounting Practices Board and the requirements of the Companies Act and incorporate responsible disclosure based on appropriate accounting policies consistently applied and supported by reasonable and prudent judgements and estimates. The preparation of the financial statements was supervised by the chief financial officer, Mr J P Haveman. The directors have a reasonable expectation that the group has adequate resources to continue in operation for the foreseeable future and the annual financial statements have therefore been prepared on a going concern basis.
Report of the audit and risk committee The Report of the audit and risk committee, as required in terms of section 94(7)(f) of the Companies Act, is set out on pages 78 and 79 of these annual financial statements.
Non-current assets The group incurred significant capital expenditure as part of its expansion plans.
Capital additions for the group amounted to R950 million (2011: R803 million) while additions through business combinations amounted to R1 120 million (2011: R21 million).
Directors’ shareholdingAt 30 June 2012 the present directors of the company held no direct or indirect interests in the company’s issued ordinary shares (2011: C E Daun held a beneficial indirect shareholding of 175 872 159 or 41,4% of the company’s issued ordinary shares).
Directors’ contracts No contracts were entered into during the year in which directors and officers of the company had an interest and which significantly affected the affairs and business of the company or any of its subsidiaries.
Corporate governance The directors subscribe to the principles incorporated in the King Code of Corporate Practices and Conduct as set out in King III and save as disclosed in the Corporate Governance review have complied as far as practical with principles contained therein throughout the reporting period. The directors recognise the need to conduct the enterprise with integrity and in accordance with generally accepted corporate practices. Following the acquisition of the Steinhoff Industrial assets and the restructuring of the board and the board committees a comprehensive review of the group’s corporate governance policies and procedures will be undertaken in the year ahead.
Subsidiary companies and joint ventures The principal subsidiaries and joint ventures of the group are reflected in notes 30 and 12.
Borrowing facilities and limitsThe group’s borrowing facilities and usage thereof are set out in notes 19 and 24. In terms of the memorandum of incorporation of the company and its subsidiaries, there is no limitation of borrowing powers.
Special resolutionsRefer to page 150.

KAP Integrated Annual Report 2012 77
Annual Financial Statements
Board evaluation of audit and risk committee The board of directors believes that the committee has satisfied its responsibilities for the year in compliance with its terms of reference and with the Companies Act.
Auditor It is recommended that, subject to the approval of the shareholders at the annual general meeting of the company, Deloitte & Touche continue in office in accordance with section 90 of the Companies Act.
Going concern The group annual financial statements set out on pages 80 to 149 have been prepared on the going concern basis since the directors have every reason to believe the group has adequate resources in place to continue in operation for the foreseeable future.
Sponsor PSG Capital (Pty) Limited acts as sponsor for the group, providing advice on the interpretation and compliance with the Listings Requirements of the JSE Limited (“JSE”) and
COMPANy SECRETARy’S REPORT The company secretary certifies, in accordance with section 88(2)(e) of the Companies Act of South Africa No. 71 of 2008, as amended (the “Companies Act”) that the company has lodged with the Registrar of Companies all such returns as are required for a public company in terms of the Companies Act and that all such returns are true, correct and up to date.
Steinhoff Africa Secretarial Services (Pty) Limited Company Secretary
3 September 2012
28 Sixth Street, Wynberg, Sandton
reviewing notices required in terms of the company’s memorandum of incorporation and the JSE’s rules and regulations.
Approval of annual financial statements The group annual financial statements for the year ended 30 June 2012, set out on pages 80 to 149, were approved by the board of directors and are signed on its behalf by:
J de V du Toit K J Grové Independent non-executive Chief executive officer chairman
3 September 2012

78 KAP Integrated Annual Report 2012
REPORT OF THE AUDIT AND RISK COMMITTEE for the year ended 30 June 2012
• considered the independence and objectivity of the external auditors and ensured that the scope of their additional services provided was not such that they could be seen to have impaired their independence;
• reviewed and recommended for adoption by the board such financial information that is publicly disclosed which for the year included:
– the integrated report for the year ended 30 June 2012; and
– the interim results for the six months ended 31 December 2011;
• considered the effectiveness of internal audit, approved the one-year operational strategic internal audit plan and monitored adherence of internal audit to its annual plan; and
• meetings were held with the internal and external auditors where management was not present and no significant matters of concern were raised.
The audit and risk committee is of the opinion that the objectives of the committee were met during the year under review.
Where weaknesses in specific controls were identified, management undertook to implement appropriate corrective actions to mitigate the weakness identified.
Membership The members of the audit and risk committee are all independent non-executive directors of the group and include:
P K Quarmby (chairman)
S H Muller
S H Nomvete
The committee members until 25 June 2012 were K E Schmidt, U Schäckermann and S H Nomvete.
The committee is satisfied that the members thereof have the required knowledge and experience as set out in section 94(5) of the Companies Act and regulation 42 of the Companies Regulation, 2011.
The company secretary is the secretary of this committee.
The committee comprises three independent, non-executive directors and is considered to have sufficient financial skills and knowledge to carry out its duties and responsibilities. Attendance at meetings by other directors or officers is by way of invitation.
Objective and scope The overall objectives of the committee are as follows:
• to review the principles, policies and practices adopted in the preparation of the accounts of companies in the group and to ensure that the annual financial statements of the group and any other formal announcements relating to the financial performance comply with all statutory and regulatory requirements as may be required;
• to ensure that the consolidated interim abridged financial statements of the group, in respect of the first six-month period, comply with all statutory and regulatory requirements;
• to ensure that all financial information contained in any consolidated submissions to KAP is suitable for inclusion in its consolidated financial statements in respect of any reporting period;
• to annually assess the appointment of the auditors and confirm their independence, recommend their appointment to the annual general meeting and approve their fees;
• to review the work of the group’s external and internal auditors to ensure the adequacy and effectiveness of the group’s financial, operating compliance and risk management controls;
• to review the management of risk and the monitoring of compliance effectiveness within the group; and
• to perform duties that are attributed to it by the Companies Act, the JSE Limited and King III.
The committee performed the following activities:
• received and reviewed reports from both internal and external auditors concerning the effectiveness of the internal control environment, systems and processes;
• reviewed the reports of both internal and external auditors detailing their concerns arising out of their audits and requested appropriate responses from management resulting in their concerns being addressed;
• made appropriate recommendations to the board of directors regarding the corrective actions to be taken as a consequence of audit findings;
Background The committee’s operation is guided by a formal detailed charter that is in line with the Companies Act and has been approved by the board. The committee has discharged all its responsibilities as contained in the charter. This process is supported by the audit and risk subcommittees which are in place for all operating divisions. These subcommittees meet regularly in terms of formal mandates and deal with all issues arising at the operational division or subsidiary level. The subcommittees then elevate any unresolved issues of concern to the KAP audit and risk committee.
The committee is pleased to present its report for the financial year ended 30 June 2012 as recommended by the King Report on Corporate Governance and King III in line with the Companies Act 71 of 2008 of South Africa (“the Companies Act”).
KAP Integrated Annual Report 2012 79
Annual Financial Statements
Meetings The audit and risk committee was reconstituted pursuant to the implementation of the reverse acquisition.
The audit committee performs the duties required of it by section 94(7) of the Companies Act by holding meetings with the key role players on a regular basis and by the unrestricted access granted to the external auditor.
Three meetings were held during the year by the audit and risk committee.
Internal audit The group’s independent internal auditors operate in terms of the internal audit charter and under the direction of the committee which approves the scope of the work to be performed. Significant findings are reported to both executive management and the committee, and corrective action is taken to address identified internal control deficiencies.
The committee is satisfied with the effectiveness and performance of the internal auditors and compliance with their mandate. The committee is also satisfied that the internal auditors have the necessary resources, budget, standing and authority to enable them to discharge their functions.
External audit The committee has satisfied itself through enquiry that the auditors of KAP are independent as defined by the Companies Act.
The committee, in consultation with executive management, has agreed an audit fee for the 2012 financial year. The fee is considered appropriate for the work that could reasonably have been foreseen at that time. Audit fees are disclosed in note 2.2 to the financial statements.
There is a formal procedure that governs the process whereby the external auditor is considered for the provision of non-audit services and each engagement letter for such work is reviewed in accordance with set policy and procedure.
Meetings were held with the external auditor where management was not present and no significant matters of concern were raised.
The committee has reviewed the performance of the external auditors and has nominated, for approval at the annual general meeting, Deloitte & Touche as the external auditor for the
2013 financial year with Mr Michael van Wyk as the designated auditor. This will be his second year as auditor of the company.
Accounting practices and internal controlInternal controls and systems have been designed to provide reasonable assurance as to the integrity and reliability of the financial information represented in the financial statements, and to safeguard, verify and maintain the assets of the group.
Nothing has come to the attention of the committee or the directors to indicate that any material breakdown in the functioning of the group’s key internal control systems has occurred during the year under review. The committee considers the group’s accounting policies, practices and financial statements to be appropriate.
Annual financial statementsThe audit committee has evaluated the consolidated annual financial statements for the year ended 30 June 2012 and considers that they comply, in all material aspects, with the requirements of the Companies Act and International Financial Reporting Standards. The committee has therefore recommended the annual financial statements for approval to the board. The board has subsequently approved the financial statements, which will be open for discussion at the forthcoming annual general meeting.
Evaluation of chief financial officerAs required by JSE Listing Requirement 3.84(h), as well as the recommended practice as per King III, the committee has assessed the competence and performance of the group chief financial officer and believes that he possesses the appropriate expertise and experience to meet his responsibilities in that position. The committee is satisfied with the expertise and adequacy of resources within the finance function and the experience of financial staff in this function.
P K Quarmby Audit and risk committee chairman
3 September 2012

80 KAP Integrated Annual Report 2012
CONSOLIDATED STATEMENT OF FINANCIAL POSITION as at 30 June 2012
Notes2012
Rm2011
Rm
ASSETS
Non-current assets
Goodwill 6 183 183
Intangible assets 7 1 128 1 048
Property, plant and equipment 8 6 090 4 925
Investment property 9 39 –
Consumable biological assets 10 1 656 1 450
Investments and loans in associate companies 11 74 62
Investments and loans 13 9 126
Deferred taxation assets 14 76 96
9 255 7 890
Current assets
Inventories 16 1 367 588
Trade and other receivables 17 2 457 1 699
Bank balances and cash including funds on call 1 346 770
5 170 3 057
Assets classified as held for sale 15 –
5 185 3 057
Total assets 14 440 10 947
EQUITY AND LIABILITIES
Capital and reserves
Ordinary stated share capital 18 6 969 6 111
Reserves (1 405) (2 163)
Total equity attributable to equity holders of the parent 5 564 3 948
Non-controlling interests 119 51
Total equity 5 683 3 999
Non-current liabilities
Interest-bearing loans and borrowings 19 3 800 2 380
Interests and loans in joint venture companies 12 – 2
Equalisation of operating lease payments 20 22
Provisions 21 69 –
Employee benefits 20 12 –
Deferred taxation liabilities 14 723 562
Deferred government grants – 1
4 624 2 967
Current liabilities
Interest-bearing loans and borrowings 19 343 726
Employee benefits 20 264 291
Provisions 21 96 68
Trade and other payables 22 2 584 1 457
Share scheme settlement provision 23 103 52
Bank overdrafts and short-term facilities 743 1 387
4 133 3 981
Total equity and liabilities 14 440 10 947

KAP Integrated Annual Report 2012 81
Annual Financial StatementsCONSOLIDATED
INCOME STATEMENTfor the year ended 30 June 2012
Notes2012
Rm2011
Rm
Revenue 11 018 8 861
Cost of sales (8 447) (6 631)
Gross profit 2 571 2 230
Other operating income 410 430
Distribution expenses (466) (405)
Other operating expenses (1 409) (1 226)
Capital items 1 81 (157)
Operating profit 2 1 187 872
Finance costs 3 (499) (629)
Income from investments 3 117 154
Share of profit of associate companies 11 11 6
Profit before taxation 816 403
Taxation 4 (220) (114)
Profit for the year 596 289
Profit attributable to:
Owners of the parent 574 272
Non-controlling interests 22 17
Profit for the year 596 289
Earnings per share
Earnings per share 5 28,4 14,2
Diluted earnings per share 5 28,2 14,2

82 KAP Integrated Annual Report 2012
CONSOLIDATED STATEMENT OF COMPREHENSIVE INCOME for the year ended 30 June 2012
2012Rm
2011Rm
Profit for the year 596 289
Other comprehensive income/(loss)
Actuarial gains on defined benefit plans 2 5
Exchange differences on translation of foreign operations (11) (27)
Net fair value gain on available-for-sale financial assets – 2
Total comprehensive loss for the year (9) (20)
Deferred taxation (1) (1)
Total other comprehensive loss for the year, net of taxation (10) (21)
Total comprehensive income for the year, net of taxation 586 268
Total comprehensive income attributable to:
Owners of the parent 564 251
Non-controlling interests 22 17
Total comprehensive income for the year 586 268

KAP Integrated Annual Report 2012 83
Annual Financial StatementsCONSOLIDATED STATEMENT
OF CASH FLOWS for the year ended 30 June 2012
Notes2012
Rm2011
Rm
CASH FLOWS FROM OPERATING ACTIVITIES
Cash generated from operations 26 1 906 1 460
Dividends received 1 –
Interest received 69 125
Interest paid (444) (619)
Dividends paid (4) (11)
Taxation paid (68) (57)
Net cash inflow from operating activities 1 460 898
CASH FLOWS FROM INVESTING ACTIVITIES
Additions to property, plant and equipment (950) (803)
Proceeds on disposal of property, plant and equipment 211 87
Additions to intangible assets (26) (15)
Acquisition of subsidiary companies, net of cash and cash equivalents on hand at acquisition 27 43 (31)
Disposal of subsidiaries and businesses, net of cash disposed 28 – 23
Decrease in investments and loans 125 119
Decrease in short-term loans receivable – 19
Net (increase)/decrease in interest and loans in joint venture companies (2) 7
Net increase in investments in associate companies (17) (8)
Transactions with non-controlling interests (1) –
Net cash outflow from investing activities (617) (602)
CASH FLOWS FROM FINANCING ACTIVITIES
(Decrease)/increase in bank overdrafts and short-term facilities (950) 517
Increase/(decrease) in long-term interest-bearing loans and borrowings 611 (662)
Increase/(decrease) in short-term interest-bearing loans and borrowings 86 (121)
Net cash outflow from financing activities (253) (266)
NET INCREASE IN CASH AND CASH EQUIVALENTS 590 30
Cash and cash equivalents at the beginning of the year 770 756
Effects of exchange rate translations on cash and cash equivalents (14) (16)
CASH AND CASH EQUIVALENTS AT THE END OF THE YEAR 1 346 770

84 KAP Integrated Annual Report 2012
CONSOLIDATED STATEMENT OFCHANGES IN EQUITyfor the year ended 30 June 2012
Ordinary stated
share capital Rm
Distributable reserves
Rm
Share-based payment
reserve Rm
Reverse acquisition
reserve Rm
Other reserves
Rm
Total equity attributable
to owners of the parent
Rm
Non-controlling
interests Rm
Total Rm
Balance at 30 June 2010 6 111 2 031 40 (5 055) (1) 3 126 44 3 170
Total comprehensive income/(loss) for the year – 272 – – (21) 251 17 268
Profit for the year – 272 – – – 272 17 289
Other comprehensive loss for the year – – – – (21) (21) – (21)
Dividends paid – – – – – – (10) (10)
Reverse acquisition adjustment: movement in share capital and premium of acquirer pre-acquisition – – – 579 – 579 – 579
Capital distribution to Steinhoff International Holdings Limited for share-based payments – (11) – – – (11) – (11)
Share-based payments – – 3 – – 3 – 3
Balance at 30 June 2011 6 111 2 292 43 (4 476) (22) 3 948 51 3 999
Reverse acquisition adjustment: pre-reverse acquisition share capital of legal parent 858 – – – – 858 – 858
Reverse acquisition adjustment: movement in share capital of acquirer – – – 24 – 24 – 24
Total comprehensive income/(loss) for the year – 574 – – (10) 564 22 586
Profit for the year – 574 – – – 574 22 596
Other comprehensive loss for the year – – – – (10) (10) – (10)
Dividends paid in specie – (281) – – – (281) – (281)
Other dividends paid – (17) – – – (17) – (17)
Capital distribution to Steinhoff International Holdings Limited for share-based payments – (37) – – – (37) – (37)
Reverse acquisition adjustment: elimination of pre-acquisition reserves of legal parent – – – 500 – 500 46 546
Share-based payments – – 6 – – 6 – 6
Other reserve movements – – – – (1) (1) – (1)
Balance at 30 June 2012 6 969 2 531 49 (3 952) (33) 5 564 119 5 683

KAP Integrated Annual Report 2012 85
Annual Financial Statements
Ordinary stated
share capital Rm
Distributable reserves
Rm
Share-based payment
reserve Rm
Reverse acquisition
reserve Rm
Other reserves
Rm
Total equity attributable
to owners of the parent
Rm
Non-controlling
interests Rm
Total Rm
Balance at 30 June 2010 6 111 2 031 40 (5 055) (1) 3 126 44 3 170
Total comprehensive income/(loss) for the year – 272 – – (21) 251 17 268
Profit for the year – 272 – – – 272 17 289
Other comprehensive loss for the year – – – – (21) (21) – (21)
Dividends paid – – – – – – (10) (10)
Reverse acquisition adjustment: movement in share capital and premium of acquirer pre-acquisition – – – 579 – 579 – 579
Capital distribution to Steinhoff International Holdings Limited for share-based payments – (11) – – – (11) – (11)
Share-based payments – – 3 – – 3 – 3
Balance at 30 June 2011 6 111 2 292 43 (4 476) (22) 3 948 51 3 999
Reverse acquisition adjustment: pre-reverse acquisition share capital of legal parent 858 – – – – 858 – 858
Reverse acquisition adjustment: movement in share capital of acquirer – – – 24 – 24 – 24
Total comprehensive income/(loss) for the year – 574 – – (10) 564 22 586
Profit for the year – 574 – – – 574 22 596
Other comprehensive loss for the year – – – – (10) (10) – (10)
Dividends paid in specie – (281) – – – (281) – (281)
Other dividends paid – (17) – – – (17) – (17)
Capital distribution to Steinhoff International Holdings Limited for share-based payments – (37) – – – (37) – (37)
Reverse acquisition adjustment: elimination of pre-acquisition reserves of legal parent – – – 500 – 500 46 546
Share-based payments – – 6 – – 6 – 6
Other reserve movements – – – – (1) (1) – (1)
Balance at 30 June 2012 6 969 2 531 49 (3 952) (33) 5 564 119 5 683

86 KAP Integrated Annual Report 2012
SEGMENTAL REPORTING for the year ended 30 June 2012
2012Rm
2011Rm
REVENUE
Logistics 6 822 6 044
Manufacturing 1 993 761
Integrated Timber 2 286 2 240
11 101 9 045
Intersegment revenue eliminations (83) (184)
11 018 8 861
OPERATING PROFIT BEFORE CAPITAL ITEMS
Logistics 701 617
Manufacturing 132 52
Integrated Timber 273 360
1 106 1 029
RECONCILIATION BETWEEN OPERATING PROFIT PER INCOME STATEMENT AND OPERATING PROFIT BEFORE CAPITAL ITEMS PER SEGMENTAL ANALYSIS
Operating profit per income statement 1 187 872
Capital items (note 1) (81) 157
Operating profit before capital items per segmental analysis 1 106 1 029
TOTAL ASSETS
Logistics 4 722 4 467
Manufacturing 3 767 853
Integrated Timber 4 449 4 496
12 938 9 816
RECONCILIATION BETWEEN TOTAL ASSETS PER STATEMENT OF FINANCIAL POSITION AND TOTAL ASSETS PER SEGMENTAL ANALYSIS
Total assets per statement of financial position 14 440 10 947
Less: Cash and cash equivalents (1 346) (770)
Less: Investments and loans in associate companies (74) (62)
Less: Investments in joint venture companies – 2
Less: Interest-bearing loans receivable (9) (126)
Less: Related party receivables (73) (175)
Total assets per segmental analysis 12 938 9 816
GEOGRAPHICAL ANALYSIS
Revenue
Southern Africa 11 018 8 861
Non-current assets
Southern Africa 9 255 7 890

KAP Integrated Annual Report 2012 87
Annual Financial Statements
Basis of segmental presentation
The segmental information has been prepared in accordance with IFRS 8 Operating Segments (IFRS 8) which defines requirements for the disclosure of financial information of an entity’s operating segments. The standard requires segmentation based on the group’s internal organisation and reporting of revenue and operating income based upon internal accounting methods.
Identification of segments
The group discloses its operating segments according to the entity components regularly reviewed by the chief operating decision-makers. The components comprise various operating segments located in southern Africa. The revenue and non-current assets are further disclosed within the geographical areas in which the group operates. Segmental information is prepared in conformity with the measure that is reported to the chief operating decision-makers. These values have been reconciled to the consolidated financial statements. The measures reported by the group are in accordance with the accounting policies adopted for preparing and presenting the consolidated financial statements.
Segment revenue excludes value-added taxation and includes intersegment revenue. Net revenue represents segment revenue from which intersegment revenue has been eliminated. Sales between segments are made on a commercial basis. Segment operating profit before capital items represents segment revenue less segment expenses, excluding capital items included in note 1. Segment expenses include distribution expenses and other operating expenses. Depreciation and amortisation have been allocated to the segments to which they relate.
The segment assets comprise all assets of the different segments that are employed by the segment and that either are directly attributable to the segment, or can be allocated to the segment on a reasonable basis.
Operational segments
Logistics
Unitrans Supply Chain Solutions includes Unitrans Freight (specialised distribution and warehousing services to the manufacturing, industrial and allied sectors of the economy), Unitrans Fuel and Chemical (specialised transportation and fuel logistics services to the petrochemical and gas industries), Unitrans Agriculture and Mining Services (transport and related logistics services to the agricultural and mining industries, including the sugar industry).
Unitrans Passenger derives its revenue through the transport of passengers under contract and through services to the public at large.
Manufacturing
Revenue is derived from the manufacturing and supply of raw materials, including automotive components, footwear, polyethylene terephthalate resin (PET), towelling, foam and bedding springs.
Timber
PG Bison’s integrated value chain is built on forestry, timber beneficiation, board production and upgrading. Revenue is derived mainly from the manufacturing and upgrading of flat sheet board products.
Major customers
No single customer contributes 10% or more of the group’s revenue.

88 KAP Integrated Annual Report 2012
SUMMARy OF ACCOUNTING POLICIES for the year ended 30 June 2012
KAP is a South African registered company. The consolidated annual financial statements of KAP for the year ended 30 June 2012, comprise KAP and its subsidiaries (together referred to as the KAP Group) and the group’s interest in associate companies and joint venture companies.
Statement of compliance
The consolidated annual financial statements have been prepared in accordance with International Financial Reporting Standards (IFRS), the interpretations adopted by the International Accounting Standards Board (IASB), the Interpretations Committee of the IASB (IFRIC) and the requirements of the Companies Act of South Africa, as amended.
Adoption of new and revised standards
During the current year the group has adopted and early adopted all of the new and revised standards and interpretations issued by the IASB and the IFRIC that are relevant to its operations and effective for annual reporting periods beginning on 1 July 2011. The adoption of these new and revised standards and interpretations has not resulted in material changes to the group’s accounting policies.
The group adopted the following standards, interpretations and amended standards during the year: IFRS 7 Financial Instruments: Disclosures: Transfers of Financial AssetsCircular 3/2012 Headline Earnings
The group adopted the following Annual Improvements to IFRSs: 2009 – 2011 Cycle during the year: IAS 1 Presentation of Financial Statements: Clarification of the Requirements for Comparative InformationIAS 16 Property, Plant and Equipment: Classification of Servicing EquipmentIAS 32 Financial Instruments: Presentation: Tax Effect of Distribution to Holders of Equity InstrumentsIAS 34 Interim Financial Reporting: Clarification of the Requirements for Comparative InformationIAS 34 Interim Financial Reporting: Interim Financial Reporting and Segmental Information for Total Assets and Liabilities
Basis of preparation
The annual financial statements are prepared in millions of South African Rand (Rm) on the historical-cost basis, except for certain assets and liabilities which are carried at amortised cost, and derivative financial instruments and consumable biological assets which are stated at their fair value.
The preparation of financial statements in conformity with IFRS requires management to make judgements, estimates and assumptions that may affect the application of policies and reported amounts of assets, liabilities, income and expenses. The estimates and associated assumptions are based on historical experience and various other factors that are believed to be reasonable under the circumstances, the results of which form the basis of making the judgements about carrying values of assets and liabilities that are not readily apparent from other sources.
The estimates and underlying assumptions are reviewed on an ongoing basis. Revisions to accounting estimates are recognised in the period in which the estimate is revised if the revision only affects that period, or in the period of the revision and future periods if the revision affects both current and future periods.
Judgements made by management in the application of IFRS that have a significant effect on the financial statements and estimates with a significant risk of material adjustment in the next financial year are discussed in note 25.
The accounting policies set out below have been applied consistently to the periods presented in these consolidated annual financial statements, except where stated otherwise.
The accounting policies have been applied consistently by all group entities.

KAP Integrated Annual Report 2012 89
Annual Financial Statements
Basis of consolidation
Subsidiaries
Subsidiaries are entities controlled by the group (including special purpose entities). Control exists when the group has the power to, directly or indirectly, govern the financial and operating policies of an entity so as to obtain benefits from its activities. In assessing control, potential voting rights that are presently exercisable or convertible are taken into account.
On acquisition, the assets, liabilities and contingent liabilities of a subsidiary are measured at their fair value at the date of acquisition. Any excess of the cost of acquisition over the fair values of the identifiable net assets acquired is recognised as goodwill. If the group’s interest in the fair values of the identifiable net assets acquired exceeds the cost of acquisition (negative goodwill), the excess is recognised in profit or loss in the period of acquisition. The interest of non-controlling shareholders is stated at the non-controlling interests’ proportion of the fair values of the assets and liabilities recognised.
Non-controlling interests in the net assets (excluding goodwill) of consolidated subsidiaries are identified separately from the group’s equity therein. Non-controlling interests consist of the amount of those interests at the date of the original business combination and the non-controlling interests’ share of changes in equity since the date of the combination.
Subsequently, any losses applicable to the non-controlling interest are allocated to the non-controlling interest even if this results in the non-controlling interest having a deficit balance.
The financial statements of subsidiaries are included in the consolidated financial statements from the date that control commences until the date that control ceases.
All material intergroup transactions, balances, income and expenses and unrealised gains and losses between group companies are eliminated on consolidation.
Associate companies
An associate company is an entity over which the group is in a position to exercise significant influence, through participation in the financial and operating policy decisions of the entity, but which it does not control or jointly control.
The results of associate companies are incorporated in the consolidated financial statements using the equity method of accounting, from the date that significant influence commences until the date that significant influence ceases, except when the investment is classified as held for sale, in which case it is accounted for under IFRS 5 Non-current Assets Held for Sale and Discontinued Operations (IFRS 5). When the group’s share of losses exceeds its investment in the associate company, the group’s carrying amount is reduced to nil and recognition of further losses is discontinued except to the extent that the group has incurred legal or constructive obligations or made payments on behalf of an associate company.
Where a group entity transacts with an associate company, unrealised profits and losses are eliminated to the extent of the group’s interest in the relevant associate company, except where unrealised losses provide evidence of an impairment of the asset transferred.
Any difference between the cost of acquisition and the group’s share of the net identifiable assets, liabilities and contingent liabilities, fairly valued, is recognised and treated according to the group’s accounting policy for goodwill and is included in the carrying value of the investment in associate companies.
Joint venture companies
A joint venture company is defined as a contractual arrangement whereby two or more entities undertake an economic activity, which is subject to joint control. Joint control implies that neither of the contracting parties is in a position to unilaterally control the assets of the venture. Joint venture companies are accounted for by the proportionate consolidation method whereby the attributable share of each of the assets, liabilities, income and expenses and cash flows of the joint venture company is combined on a line-by-line basis with similar items in the group’s consolidated financial statements, from the date that joint control commences until the date joint control ceases, except when the investment is classified as held for sale, in which case it is accounted for under IFRS 5. A proportionate share of intergroup items is eliminated and unrealised profits and losses are eliminated to the extent of the group’s interest in the relevant joint venture company, except where unrealised losses provide evidence of an impairment of the asset transferred.
Any difference between the cost of acquisition and the group’s share of the net identifiable assets, liabilities and contingent liabilities, fairly valued, is recognised and treated according to the group’s accounting policy for goodwill.

90 KAP Integrated Annual Report 2012
SUMMARy OF ACCOUNTING POLICIES for the year ended 30 June 2012 (continued)
Deferred contingent purchase consideration
Where a structured business combination contains a puttable instrument on the interest of an apparent non-controlling shareholder, a financial liability for the present value of the best estimate thereof is recognised upon initial accounting for the business combination.
The liability arising is regarded as a deferred contingent purchase consideration and the unwinding of the present value of the liability is presented as an interest expense. Any other change in the liability is recognised through profit and loss if the acquisition was effective after the adoption of the revised IFRS 3 Business Combination (IFRS 3), including the impact of changes in interest rates on liabilities measured at fair value.
If the puttable arrangement is not exercised and settled, the derecognition of the financial liability is treated as a disposal of the anticipated interest in the subsidiary in accordance with the group’s accounting policy for common control transactions.
Common control transactions – premiums and discounts arising on subsequent purchases from, or sales to non-controlling interests in subsidiaries
Unless a purchase price allocation has been performed for separate financial statements and reversed for group consolidated accounts, any increases or decreases in ownership interest in subsidiaries without a change in control are recognised as equity transactions. The carrying amounts of the group’s interests and the non-controlling interests are adjusted to reflect the changes in their relative interests in the subsidiaries. Any differences between the amount by which the non-controlling interests are adjusted and the fair value of the consideration paid or received is recognised directly in equity and attributed to owners of the company.
Goodwill
All business combinations are accounted for by applying the purchase method. Goodwill arising on the acquisition of a subsidiary, associate company or joint venture company represents the excess of the aggregate consideration transferred, non-controlling interest in the acquiree and in business combinations achieved in stages, the acquisition-date fair value of the acquirer’s previously held equity interest in the acquiree over the group’s interest in the net fair value of the identifiable assets, liabilities and contingent liabilities of the subsidiary, associate company or joint venture company recognised at the date of acquisition. Goodwill is initially recognised as an asset at cost and is subsequently measured at cost less any accumulated impairment losses.
Goodwill is allocated to cash-generating units (CGUs) and is tested annually for impairment or more frequently when there is an indication that the unit may be impaired. If the recoverable amount of the CGU is less than the carrying amount of the unit, the impairment loss is allocated first to reduce the carrying amount of any goodwill allocated to the unit and then to the other assets of the unit pro rata on the basis of the carrying amount of each asset in the unit. In respect of associate companies, the carrying amount of goodwill is included in the carrying amount of the investment in the associate company.
On disposal of a subsidiary, associate company or joint venture company, the attributable amount of goodwill is included in the determination of the profit or loss on disposal.
Negative goodwill arising on acquisition is recognised directly as a capital item in profit or loss.
Reverse takeover acquisition accounting
IFRS 3 defines the acquirer in a business combination as the entity that obtains control. Accordingly, a corporate action or business combination where another legal entity will obtain control of the entity itself is accounted for as a reverse acquisition.
A reverse acquisition is a business combination in which the legal acquirer (i.e. that entity that issues shares) becomes the acquiree for accounting purposes and the legal acquiree becomes the acquirer for accounting purposes. The accounting acquiree must meet the definition of a business for the transaction to be accounted for as a reverse acquisition. Guidance in IFRS 3 concludes that this is a reverse acquisition and that the Steinhoff Industrial assets is therefore the accounting acquirer and KAP the accounting acquiree for IFRS 3 purposes.
Reverse acquisitions are accounted for using the acquisition method under IFRS 3. Effectively, the financial results presentation will reflect the Steinhoff Industrial assets acquiring KAP at fair value. Consequently, for consolidation purposes, a fair value exercise is performed on KAP. The equity structure appearing in the consolidated statement of financial position must reflect the equity structure of the legal parent, including the shares issued by the legal parent to effect the business combination.

KAP Integrated Annual Report 2012 91
Annual Financial Statements
The consolidated financial results and position will reflect:
• assets and liabilities of the Steinhoff Industrial assets recognised and measured at their pre-combination carrying amounts;
• the assets and liabilities of KAP recognised and measured at fair value in terms of the requirements of IFRS 3 at the effective date of the transaction;
• retained earnings and other reserves of the Steinhoff Industrial assets before the business combination;
• the amount recognised as issued equity interests in the consolidated financial statements which is determined by adding the issued equity interest of the Steinhoff Industrial assets outstanding immediately before the business combination to the fair value of the consideration transferred; and
• the creation of a reverse acquisition reserve to enable the presentation of the consolidated statement of financial position which combines the equity structure of the legal parent with the non-statutory reserves of the legal parent. Effectively, this reserve is required to ensure the correct equity structure of the legal parent is reflected after the business combination.
Intangible assets
Research and development
Expenditure on research activities, undertaken with the prospect of gaining new scientific or technical knowledge and understanding, is recognised in profit or loss as an expense as it is incurred.
Expenditure on development activities, whereby research findings are applied to a plan or design for the production of new or substantially improved products and processes, is capitalised if the product or process can be identified, the products and processes are technically and commercially feasible, it is probable that the asset created will generate future economic benefits, the cost can be measured reliably and the group intends to and has sufficient resources to complete development.
The expenditure capitalised includes the cost of materials, direct labour and an appropriate proportion of overheads. Other development expenditure is recognised in profit or loss as an expense as incurred. Capitalised development expenditure is stated at cost less accumulated amortisation and impairment losses.
Other intangible assets
Other intangible assets that are acquired by the group are stated at cost less accumulated amortisation and impairment losses. If an intangible asset is acquired in a business combination, the cost of that intangible asset is measured at its fair value at the acquisition date.
Expenditure on internally generated goodwill and brands is recognised in profit or loss as an expense as incurred.
Subsequent expenditure
Subsequent expenditure on capitalised intangible assets is capitalised only when it increases the future economic benefits embodied in the specific asset to which it relates. All other expenditure is expensed as incurred.
Amortisation
Amortisation of intangible assets is recognised in profit or loss on a straight-line basis over the assets’ estimated useful lives, unless such lives are indefinite. An intangible asset is regarded as having an indefinite useful life when, based on analysis of all relevant factors, there is no foreseeable limit to the period over which the asset is expected to generate net cash inflows. Intangible assets with indefinite useful lives and intangible assets not yet available for use are not amortised but are tested for impairment annually or more often when there is an indication that the asset may be impaired. Other intangible assets are amortised from the date they are available for use.
The amortisation methods, estimated useful lives and residual values are reassessed annually, with the effect of any changes in estimate being accounted for on a prospective basis.

92 KAP Integrated Annual Report 2012
SUMMARy OF ACCOUNTING POLICIES for the year ended 30 June 2012 (continued)
Property, plant and equipment
Owned assets
Property, plant and equipment are stated at cost to the group, less accumulated depreciation and impairment losses. The cost of self-constructed assets includes the costs of materials, direct labour, the initial estimate, where relevant, of the cost of dismantling and removing the items and restoring the site on which they are located, borrowing costs capitalised and an appropriate proportion of production overheads.
Where components of an item of property, plant and equipment have different useful lives, they are accounted for as separate items of property, plant and equipment.
The gain or loss on disposal or retirement of an item of property, plant and equipment is determined as the difference between the sale proceeds and the carrying amount of the asset and is recognised as a capital item in profit or loss.
Leased assets
Leases that transfer substantially all the risks and rewards of ownership of the underlying asset to the group are classified as finance leases. Assets acquired in terms of finance leases are capitalised at the lower of fair value and the present value of the minimum lease payments at inception of the lease.
The capital element of future obligations under the leases is included as a liability in the statement of financial position. Lease payments are allocated using the effective interest method to determine the lease finance costs, which are charged against income over the lease period, and the capital repayment, which reduces the liability to the lessor.
Subsequent costs
The group recognises in the carrying amount of an item of property, plant and equipment the cost of replacing part of such an item when the cost is incurred, if it is probable that additional future economic benefits embodied within the item will flow to the group and the cost of such item can be measured reliably. Costs of the day-to-day servicing of property, plant and equipment are recognised in profit or loss as an expense when incurred.
Depreciation
Depreciation is recognised in profit or loss on a straight-line basis at rates that will reduce the book values to estimated residual values over the estimated useful lives of the assets.
Land is not depreciated. Leasehold improvements on premises occupied under operating leases are written off over their expected useful lives or, where shorter, the term of the relevant lease.
The depreciation methods, estimated useful lives and residual values are reassessed annually.
Assets held under finance leases are depreciated over their expected useful lives on the same basis as owned assets or, where shorter, the term of the relevant lease.
Investment property
Investment property is land and buildings which are held to earn rental income or for capital appreciation, or both.
Investment property is initially recognised at cost, including transaction costs, when it is probable that future economic benefits associated with the investment property will flow to the group and the cost of the investment property can be measured reliably. The cost of a purchased investment property comprises its purchase price and any directly attributable expenditure. The cost of a self-constructed investment property is its cost at the date when the construction development is complete.
Investment property is accounted for under the cost model and the accounting treatment after initial recognition follows that applied to property, plant and equipment.
Any gains or losses on the retirement or disposal of an investment property are recognised in profit or loss in capital items in the year of retirement or disposal. Transfers are made to investment property when there is a change in use of the property. Transfers are made from investment property when there is a change in use or when the amount will be recovered principally through a sale transaction.
Consumable biological assets
The group’s timber plantations and livestock are classified as consumable biological assets. These assets are measured on initial recognition and at each reporting date at their fair value less estimated costs to sell. Costs to sell include all costs that would be necessary to sell the assets, excluding costs necessary to get the assets to the market. Gains and losses arising from changes in the fair value of the plantations less estimated costs to sell are recorded in profit or loss.

KAP Integrated Annual Report 2012 93
Annual Financial Statements
Borrowing costs
Borrowing cost is recognised as an expense in the period in which it is incurred, except to the extent that it is directly attributable to the acquisition, construction or production of assets that necessarily take a substantial period to prepare for their intended use or sale. Borrowing costs directly attributable to these qualifying assets are capitalised as part of the costs of those assets.
To the extent that funds are borrowed specifically for the purpose of obtaining a qualifying asset, the amount of borrowing costs capitalised are the actual borrowing costs incurred on that borrowing during the period less any investment income on the temporary investment of those borrowings. To the extent that funds are borrowed generally and used for the purposes of obtaining a qualifying asset, the amount of borrowing costs capitalised is determined by applying a capitalisation rate to the expenditures on that asset. The capitalisation rate applied is the weighted average of the borrowing costs applicable to the borrowings of the group that are outstanding during the period, other than borrowings made specifically for the purpose of obtaining a qualifying asset.
Capitalisation of borrowing costs is suspended during extended periods in which active development is interrupted.
Capitalisation of borrowing costs ceases when the assets are substantially ready for their intended use or sale.
Impairment of assets
The carrying amounts of the group’s assets, other than assets carried at fair value, are reviewed at each reporting date to determine whether there is any indication of impairment.
If such indication exists, the recoverable amount of the asset is estimated in order to determine the extent of the impairment loss. For goodwill, assets that have an indefinite useful life and intangible assets that are not yet available for use, the recoverable amount is estimated annually and when there is an indication of impairment.
An impairment loss is recognised whenever the carrying amount of an asset or its cash-generating unit (CGU) exceeds its recoverable amount. Impairment losses are recognised in profit or loss as capital items.
Financial assets are considered to be impaired if objective evidence indicates one or more events have had a negative effect on the estimated future cash flows of that asset. Impairment losses recognised in respect of CGUs are allocated first to reduce the carrying amount of any goodwill allocated to CGUs (group of units) and then to reduce the carrying amounts of the other assets in the unit (group of units) on a pro rata basis.
When a decline in the fair value of an available-for-sale financial asset has been recognised directly in other comprehensive income and there is objective evidence that the asset is impaired, the cumulative loss that has been recognised directly in other comprehensive income is recognised in profit or loss even though the financial asset has not been derecognised. The amount of the cumulative loss that is recognised in profit or loss is the difference between the acquisition cost and current fair value, less any impairment loss on that financial asset previously recognised in profit or loss.
Calculation of recoverable amount
The recoverable amount of the group’s loans and receivables carried at amortised cost is calculated as the present value of estimated future cash flows, discounted at the original effective interest rate (i.e. the effective interest rate computed at initial recognition of these financial assets).
The recoverable amount of non-financial assets is the greater of an asset’s fair value less costs to sell and value in use. In assessing value in use, the estimated future cash flows are discounted to their present value using a pre-tax discount rate that reflects current market assessments of the time value of money and the risks specific to the asset. For an asset that does not generate cash inflows largely independent of those from other assets, the recoverable amount is determined for the CGU to which the asset belongs.
Reversal of impairment losses
An impairment loss in respect of loans and receivables carried at amortised cost is reversed if the subsequent increase in recoverable amount can be related objectively to an event occurring after the impairment loss was recognised.
An impairment loss in respect of goodwill is not reversed.
In respect of other assets, an impairment loss is only reversed if there is an indication that the impairment loss may no longer exist and there has been a change in the estimates used to determine the recoverable amount, however, not to an amount higher than the carrying amount that would have been determined (net of depreciation or amortisation) had no impairment loss been recognised in previous years.

94 KAP Integrated Annual Report 2012
SUMMARy OF ACCOUNTING POLICIES for the year ended 30 June 2012 (continued)
Taxation
Current taxation
Income taxation on the profit or loss for the year comprises current and deferred taxation. Income taxation is recognised in profit or loss except to the extent that it relates to items recognised directly in other comprehensive income or equity, in which case it is recognised directly in other comprehensive income or equity. Taxable profit differs from profit as reported in the income statement because it excludes items of income or expense that are taxable or deductible in other years and it further excludes items that are never taxable or deductible.
Current taxation is the expected taxation payable on the taxable income for the year, using taxation rates enacted or substantially enacted at the reporting date, and any adjustment to taxation payable in respect of previous years.
Deferred taxation
Deferred taxation is provided for using the statement of financial position liability method in respect of temporary differences arising from differences between the carrying amount of assets and liabilities for financial reporting purposes and the amounts used in the computation of taxable income. The following temporary differences are not provided for: goodwill not deductible for taxation purposes, the initial recognition of assets or liabilities that affect neither accounting nor taxable profit and differences relating to investments in subsidiaries to the extent that they will not reverse in the foreseeable future. The amount of deferred taxation provided is based on the expected manner of realisation or settlement of the carrying amount of assets and liabilities, using taxation rates enacted or substantially enacted at the reporting date.
Deferred taxation liabilities are recognised for taxable temporary differences arising on investments in subsidiaries and associate companies and interest in joint venture companies, except where the group is able to control the reversal of the temporary differences and it is probable that the temporary differences will not reverse in the foreseeable future.
Deferred taxation assets and liabilities are off-set when there is a legally enforceable right to set off current taxation assets against current taxation liabilities and when they relate to income taxes levied by the same taxation authority and the group intends to settle its current taxation assets and liabilities on a net basis.
Deferred taxation assets and liabilities are measured at the taxation rates that are expected to apply in the period in which the liability is settled or the asset realised, based on the taxation rates (and taxation laws) that have been enacted or substantively enacted by the reporting date. The measurement of deferred taxation liabilities and assets reflects the taxation consequences that would follow from the manner in which the group expects, at the reporting date, to recover or settle the carrying amount of its assets and liabilities.
A deferred taxation asset is recognised only to the extent that it is probable that future taxable profits will be available against which the asset will be utilised. Deferred taxation assets are reduced to the extent that it is no longer probable that the related taxation benefit will be realised.
Secondary taxation on companies (STC) on distribution of dividends
STC arising from the distribution of dividends (declared prior to 1 April 2012) are recognised in the year dividends are declared.
Inventories
Inventories are stated at the lower of cost and net realisable value. Net realisable value is the estimated selling price in the ordinary course of business, less the estimated costs of completion, and selling and distribution expenses.
The cost of harvested timber is its fair value less estimated costs to sell at the date of harvest, determined in accordance with the accounting policy for consumable biological assets. Any change in fair value at the date of harvest is recognised in profit or loss. The cost of other inventories is based on the first-in first-out principle and includes expenditure incurred in acquiring the inventories and bringing them to their existing location and condition. In the case of manufactured inventories and work-in-progress, cost includes an appropriate share of overheads based on normal operating capacity.
Where necessary, the carrying amounts of inventory is adjusted for obsolete, slow-moving and defective inventories.
Cash and cash equivalents
Cash and cash equivalents are defined as bank and cash and short-term, highly liquid investments that are readily convertible to known amounts of cash and which are subject to an insignificant risk of changes in value. Bank overdrafts are only included where the group has a legal right of set-off due to cash management.

KAP Integrated Annual Report 2012 95
Annual Financial Statements
Non-current assets held for sale and discontinued operations
Non-current assets and disposal groups are classified as held for sale if their carrying amount will be recovered principally through a sale transaction rather than through continuing use. This condition is regarded as met only when the sale is highly probable and the asset (or disposal group) is available for immediate sale in its present condition. Management must be committed to the sale, which should be expected to qualify for recognition as a completed sale within one year from the date of classification. These assets may be a component of an entity, a disposal group or an individual non-current asset. Upon initial classification as held for sale, non-current assets and disposal groups are recognised at the lower of carrying amount and fair value less costs to sell.
A discontinued operation is a component of the group’s business that represents a separate major line of business or geographical area of operation or a subsidiary acquired exclusively with a view to resell. Classification as a discontinued operation occurs upon disposal or when the operation meets the criteria to be classified as held for sale. A disposal group that is to be abandoned may also qualify as a discontinued operation, but not as assets held for sale.
Discontinued operations are separately recognised in the financial statements once management has made a commitment to discontinue the operation without a realistic possibility of withdrawal which should be expected to qualify for recognition as a completed sale within one year from date of classification.
Share-based payment transactions
Equity-settled
The fair value of the deferred delivery shares and the share rights granted to employees is recognised as an employee expense with a corresponding increase in equity. The fair value is measured at grant date and is expensed over the period during which the employees are required to provide services in order to become unconditionally entitled to the equity instruments. The fair value of the instruments granted is measured using generally accepted valuation techniques, taking into account the terms and conditions upon which the instruments are granted. The amount recognised as an expense is adjusted to reflect the actual number of deferred delivery shares and the share rights that vest, except where forfeiture is only due to share prices not achieving the threshold for vesting.
Group share-based payment transactions
Transactions in which a parent grants rights to its equity instruments directly to the employees of its subsidiaries are classified as equity-settled in the financial statements of the subsidiary, provided the share-based payment is classified as equity-settled in the consolidated financial statements of the parent.
The subsidiary recognises the services acquired with the share-based payment as an expense and recognises a corresponding increase in equity representing a capital contribution from the parent for those services acquired. The parent recognises in equity the equity-settled share-based payment and recognises a corresponding increase in the investment in subsidiary.
A recharge arrangement exists whereby the subsidiary is required to fund the difference between the exercise price on the share right and the market price of the share at the time of exercising the right. The recharge arrangement is accounted for separately from the underlying equity-settled share-based payment as follows upon initial recognition:
• The subsidiary recognises a recharge liability at fair value, using cash-settled share-based payment principles, and a corresponding adjustment against equity for the capital contribution recognised in respect of the share-based payment.
• The parent recognises a corresponding recharge asset at fair value and a corresponding adjustment to the carrying amount of the investment in the subsidiary.
Subsequent to initial recognition, the recharge arrangement is remeasured at fair value at each subsequent reporting date until settlement date to the extent vested. Where the recharge amount recognised is greater than the initial capital contribution recognised by the subsidiary in respect of the share-based payment, the excess is recognised as a net capital distribution to the parent. The amount of the recharge in excess of the capital contribution recognised as an increase in the investment in subsidiary is deferred and recognised as dividend income by the parent when settled by the subsidiary.

96 KAP Integrated Annual Report 2012
SUMMARy OF ACCOUNTING POLICIES for the year ended 30 June 2012 (continued)
Employee benefits
Short-term employee benefits
The costs of all short-term employee benefits are recognised during the period in which the employee renders the related service. The provisions for employee entitlements to salaries, performance bonuses and annual leave represent the amounts which the group has a present obligation to pay as a result of the employee’s services provided. The provisions have been calculated at undiscounted amounts based on current salary levels.
Defined contribution plans
Obligations for contributions to defined contribution pension plans and provident funds are recognised as an expense in profit or loss as incurred.
Defined benefit plans
The group’s net obligation in respect of defined benefit pension plans is calculated separately for each plan by estimating the amount of future benefits that employees have earned in return for their service in the current and prior periods; those benefits are discounted to determine their present values, and the fair values of any plan assets are deducted. The calculations are performed by qualified actuaries using the projected unit credit method with actuarial updates being carried out at each reporting date.
When the benefits of a plan are improved, the portion of the increased benefit relating to past service by employees is recognised as an expense in profit or loss on a straight-line basis over the average period until the benefits become vested. To the extent that benefits vest immediately, the expense is recognised immediately in profit or loss.
Actuarial gains and losses are recognised in other comprehensive income in the period in which they occur.
Where the calculation results in a benefit to the group, the recognised asset is limited to the net total of any unrecognised actuarial losses and past-service costs and the present value of any future refunds from the plan or reductions in future contributions to the plan.
Long-term service benefits
The group’s net obligation in respect of long-term service benefits, other than pension plans, is the amount of future benefits that employees have earned in return for their service in the current and prior periods. The obligation is calculated using the projected unit credit method and is discounted to its present value and the fair value of any related assets is deducted.
Provisions
Provisions are recognised when the group has a present constructive or legal obligation as a result of a past event, and it is probable that it will result in an outflow of economic benefits that can be reasonably estimated.
If the effect is material, provisions are determined by discounting the expected future cash flows that reflect current market assessments of the time value of money and, where appropriate, the risks specific to the liability.
Restructuring
A provision for restructuring is recognised when the group has approved a detailed and formal restructuring plan, and the restructuring either has commenced or has been announced publicly. Future operating costs are not provided for.
Onerous contracts
A provision for onerous contracts is recognised when the expected benefits to be derived by the group from a contract are lower than the unavoidable cost of meeting the obligation under the contract.

KAP Integrated Annual Report 2012 97
Annual Financial Statements
Foreign currency
Foreign currency transactions
Transactions in currencies other than the functional currency of entities are initially recorded at the rates of exchange ruling on the dates of the transactions. Monetary assets and liabilities denominated in such currencies are translated at the rates ruling on the reporting date. Foreign exchange differences arising on translation are recognised in profit or loss. Non-monetary assets and liabilities that are measured in terms of historical cost in a foreign currency are translated using the exchange rate at the date of the transaction. Non-monetary assets and liabilities denominated in foreign currencies that are stated at fair value are translated at rates ruling at the dates the fair value was determined.
Financial statements of foreign operations
The assets and liabilities of all foreign operations, including goodwill and fair value adjustments arising on consolidation, are translated at rates of exchange ruling at the reporting date. The revenues and expenses of foreign operations are translated at rates approximating the foreign exchange rates ruling at the date of the transactions.
Foreign exchange differences arising on translation are recognised in other comprehensive income and aggregated in the foreign currency translation reserve (FCTR). The FCTR applicable to a foreign operation is released to profit or loss as a capital item upon disposal of that foreign operation.
Net investment in foreign operations
Exchange differences arising from the translation of the net investment in foreign operations, and of related hedges, are recognised in other comprehensive income and accumulated in the FCTR. They are released to profit or loss as a capital item upon disposal of that foreign operation.
Goodwill and fair value adjustments arising on the acquisition of foreign operations are treated as assets and liabilities of the foreign operation and translated at the rates of exchange ruling at the reporting date.
Financial instruments
Financial assets and financial liabilities are recognised on the group’s statement of financial position when the group becomes a party to the contractual provisions of the instrument.
Effective interest method
The effective interest method is a method of calculating the amortised cost of a financial instrument and of allocating interest income over the relevant period. The effective interest rate is the rate that exactly discounts estimated future cash receipts (including all fees on points paid or received that form an integral part of the effective interest rate, transaction costs and other premiums or discounts) through the expected life of a financial instrument, or, where appropriate, a shorter period.
Financial assets
Financial assets are classified into the following specified categories: financial assets “at fair value through profit or loss” (FVTPL) and “loans and receivables”. The classification depends on the nature and purpose of the financial assets and is determined at the time of initial recognition.
Financial assets at FVTPL Financial assets are classified as at FVTPL where the financial asset is either held for trading or it is designated as at FVTPL.
A financial asset is held for trading if: • It has been acquired principally for the purpose of selling in the near future.
• It is part of an identified portfolio of financial instruments that the group manages together and has a recent actual pattern of short-term profit-taking.
• It is a derivative that is not designated and effective as a hedging instrument.

98 KAP Integrated Annual Report 2012
SUMMARy OF ACCOUNTING POLICIES for the year ended 30 June 2012 (continued)
Financial assets at FVTPL are stated at fair value, with any resultant gain or loss recognised in profit or loss. The net gain or loss recognised in profit or loss incorporates any dividend or interest earned on the financial asset, fair value adjustments and foreign exchange gains or losses. Fair value is determined in the manner described in note 15.
Loans and receivables Trade receivables, loans and other receivables that have fixed or determinable payments that are not quoted in an active market are classified as loans and receivables. Loans and receivables are measured at amortised cost using the effective interest method, less any impairment. Interest income is recognised by applying the effective interest rate, except for short-term receivables when the recognition of interest would be immaterial.
The net gain or loss recognised in profit or loss incorporates any dividends and interest earned on the financial assets, profit sharing, impairments and foreign exchange gains or losses.
Impairment of financial assets Financial assets, other than those at FVTPL, are assessed for indicators of impairment at each reporting date. Financial assets are impaired where there is objective evidence that, as a result of one or more events that occurred after the initial recognition of the financial asset, the estimated future cash flows of the investment have been impacted.
For all other financial assets, including finance lease receivables, objective evidence of impairment could include:
• significant financial difficulty of the issuer or counterparty;
• default or delinquency in interest or principal payments; and
• it becoming probable that the borrower will enter bankruptcy or financial reorganisation.
For certain categories of financial assets, such as trade receivables, assets that are assessed not to be impaired individually are subsequently assessed for impairment on a collective basis. Objective evidence of impairment for a portfolio of receivables could include the group’s past experience of collecting payments, an increase in the number of delayed payments in the portfolio past the average credit period, as well as observable changes in national or local economic conditions that correlate with default on receivables.
For financial assets carried at amortised cost, the amount of the impairment is the difference between the asset’s carrying amount and the present value of estimated future cash flows, discounted at the financial asset’s original effective interest rate.
The carrying amount of the financial asset is reduced by the impairment loss directly for all financial assets, with the exception of trade and other receivables, where the carrying amount is reduced through the use of an allowance account. When trade and other receivables are considered uncollectible, they are written off against the allowance account. Changes in the carrying amount of the allowance account are recognised in profit or loss.
If, in a subsequent period the amount of the impairment loss decreases and the decrease can be related objectively to an event occurring after the impairment was recognised, the previously recognised impairment loss is reversed through profit or loss to the extent that the carrying amount of the investment at the date the impairment is reversed does not exceed what the amortised cost would have been had the impairment not been recognised.
Financial assets that would otherwise have been impaired or past due but have been renegotiated are accounted for by rolling over the old financial asset into the new financial asset with no resultant gain or loss from the renegotiation of the financial instrument.
Derecognition of financial assetsThe group derecognises a financial asset only when the contractual rights to the cash flows from the asset expires or it transfers the financial asset and substantially all the risks and rewards of ownership of the asset to another entity. If the group neither transfers nor retains substantially all the risks and rewards of ownership and continues to control the transferred asset, the group recognises its retained interest in the asset and an associated liability for amounts it may have to pay. If the group retains substantially all the risks and rewards of ownership of a transferred financial asset, the group continues to recognise the financial asset and also recognises a collateralised borrowing for the proceeds received.
KAP Integrated Annual Report 2012 99
Annual Financial Statements
Financial liabilities and equity instruments issued by the group
Classification as debt or equity Debt and equity instruments are classified as either financial liabilities or as equity in accordance with the substance of the contractual arrangement.
Equity instruments An equity instrument is any contract that evidences a residual interest in the assets of an entity after deducting all of its liabilities. Equity instruments issued by the group are recorded at proceeds received, net of direct issue costs.
Financial guarantee contract liabilities Financial guarantee contract liabilities are measured initially at their fair values and are subsequently measured at the higher of:
• the amount of the obligation under contract, as determined in accordance with IAS 37 Provisions, Contingent Liabilities and Contingent Assets; and
• the amount initially recognised less, where appropriate, cumulative amortisation recognised in accordance with the revenue recognition policies.
Financial liabilities Financial liabilities are classified as either financial liabilities “at FVTPL” or “other financial liabilities”.
Financial liabilities at FVTPL Financial liabilities are classified as at FVTPL where the financial liability is either held for trading or is designated as at FVTPL.
A financial liability is classified as held for trading if:
• it has been incurred principally for the purpose of repurchasing in the near future;
• it is part of an identified portfolio of financial instruments that the group manages together and has a recent actual pattern of short-term profit-taking; and
• it is a derivative that is not designated and effective as a hedging instrument.
Financial liabilities at FVTPL are stated at fair value, with any resultant gain or loss recognised in profit or loss. The net gain or loss recognised in profit or loss incorporates any interest accrued or paid on the financial liability, fair value adjustments and foreign exchange gains and losses. Fair value is determined in the manner described in note 15.
Other financial liabilities Other financial liabilities, including borrowings, are initially measured at fair value, net of transaction costs.
Other financial liabilities are subsequently measured at amortised cost using the effective interest method, with interest expense recognised on an effective yield basis.
The net gain or loss recognised in profit or loss incorporates any interest accrued or paid on the financial liability and foreign exchange gains or losses.
Derecognition of financial liabilities The group derecognises financial liabilities when, and only when, the group’s obligations are discharged, cancelled or they expire.
Derivative financial instruments
The group enters into a variety of derivative financial instruments to manage its exposure to interest rate and foreign exchange rate risk, namely foreign exchange forward contracts. Further detail of derivative financial instruments are disclosed in note 15.
Derivatives are initially recognised at fair value at the date a derivative contract is entered into and are subsequently remeasured to their fair value at each reporting date. The resulting gain or loss is recognised in profit or loss immediately unless the derivative is designated and effective as a hedging instrument, in which event the timing of the recognition in profit or loss depends on the nature of the hedge relationship. The group designates certain derivatives as either hedges of the fair value of recognised assets or liabilities of firm commitments (fair value hedges), hedges of highly probable forecast transactions or hedges of foreign currency risk of firm commitments (cash flow hedges), or hedges of net investments in foreign operations.

100 KAP Integrated Annual Report 2012
SUMMARy OF ACCOUNTING POLICIES for the year ended 30 June 2012 (continued)
A derivative is presented as a non-current asset or a non-current liability if the remaining maturity of the instrument is more than 12 months and it is not expected to be realised or settled within 12 months. Other derivatives are presented as current assets or current liabilities.
Embedded derivatives Derivatives embedded in other financial instruments or other host contracts are treated as separate derivatives when their risk and characteristics are not closely related to those of the host contracts and the host contracts are not measured at fair value with changes in fair value recognised in profit or loss.
Revenue recognition
Revenue is measured at the fair value of the consideration received or receivable. Revenue is reduced for estimated customer returns, rebates and other similar allowances.
Goods sold and services rendered Revenue from the sale of goods is recognised when the significant risks and rewards of ownership have been transferred to the buyer. Revenue from services rendered is recognised in profit or loss in proportion to the stage of completion of the transaction at reporting date. The stage of completion is assessed by reference to surveys of the work performed.
Revenue is not recognised if there are significant uncertainties regarding recovery of the consideration due, associated costs or the possible return of goods as well as continuing management involvement with goods to a degree usually associated with ownership. Where the group acts as an agent and is remunerated on a commission basis, only the commission income, and not the value of the business transaction, is included in revenue.
Rental income
Rental income is recognised in profit or loss on a straight-line basis over the term of the lease.
Interest
Interest is recognised on the time proportion basis, taking account of the principal debt outstanding and the effective rate over the period to maturity.
Dividend income
Dividend income from investments is recognised when the right to receive payment has been established.
Operating leases
Payments and receipts under operating leases are recognised in profit or loss on a straight-line basis over the term of the lease.
Segmental reporting
A segment is a distinguishable component of the group that is engaged in providing products or services which are subject to risks and rewards that are different from those of other segments. The basis of segmental reporting is representative of the internal structure used for management reporting as well as the structure in which the chief operating decision-makers review the information.
The basis of segmental allocation is determined as follows:
• revenue that can be directly attributed to a segment and the relevant portion of the profit that can be allocated on a reasonable basis to a segment, whether from sales to external customers or from transactions with other segments of the group;
• operating profit that can be directly attributed to a segment and a relevant portion of the operating profit that can be allocated on a reasonable basis to a segment, including profit relating to external customers and expenses relating to transactions with other segments of the group; and
• total assets are those assets that are employed by a segment in its operating activities and that are either directly attributable to the segment or can be allocated to the segment on a reasonable basis. Total assets exclude investments in associate companies, and cash and cash equivalents.

KAP Integrated Annual Report 2012 101
Annual Financial StatementsNOTES TO THE
ANNUAL FINANCIAL STATEMENTS for the year ended 30 June 2012
Gross oftaxation
and non-controlling
interests2012
Rm
Net of taxation
and non- controlling
interests2012
Rm
Gross of taxation
and non-controlling
interests2011
Rm
Net of taxation
and non-controlling
interests2011
Rm
1. CAPITAL ITEMS
Capital items reflect and affect the resources committed in producing operating/trading performance and are not the performance itself. These items deal with the platform/capital base of the entity.
(Income)/expenses of a capital nature are included in the “capital items” line in the income statement. These (income)/expense items are:
1.1 Foreign currency translation reserve released on disposal of subsidiary (6) (6) (2) (2)
1.2 Impairment/(reversal of impairment) 24 22 46 47
Associate companies 14 14 – –
Goodwill – – 21 21
Intangible assets – – 16 16
Investments – – 14 14
Property, plant and equipment 8 6 (5) (4)
Other 2 2 – –
1.3 Negative goodwill (93) (93) – –
1.4 Net loss on sale of investments and subsidiaries – – 85 87
1.5 (Profit)/loss on disposal of property, plant and equipment (6) (7) 28 20
(81) (84) 157 152

102 KAP Integrated Annual Report 2012
NOTES TO THEANNUAL FINANCIAL STATEMENTS for the year ended 30 June 2012 (continued)
2012Rm
2011Rm
2. OPERATING PROFIT
Operating profit is stated after taking account of the following items:
2.1 Amortisation and depreciation
Amortisation 9 9
Depreciation 623 566
632 575
Recognised in:
Cost of sales 458 413
Distribution expenses 4 4
Other operating expenses 170 158
632 575
2.2 Auditors’ remuneration
Audit fees 19 17
Over provision in prior year – (1)
19 16
2.3 Personnel expenses
Retirement plans (note 2.4) 153 138
Salaries and wages 2 483 2 173
Share-based payments – equity-settled (notes 18.3 and 23) 23 17
2 659 2 328
2.4 Post-retirement benefit expenses
Contributions to defined benefit plans 3 12
Contributions to defined contribution plans 150 126
153 138
2.5 Net foreign exchange (gains)/losses
Net gain on forward exchange contracts (9) (2)
Net (gain)/loss on conversion of monetary assets (2) 11
(11) 9
2.6 Operating lease charges
Rental of properties 103 99
Leases of plant, equipment, vehicles and other 81 56
184 155
2.7 Fair value adjustment on consumable biological assets (note 10) (308) (271)
2.8 Expenses directly attributable to timber plantations
Harvesting expenses 177 146
Other operating expenses 105 85
282 231
2.9 Government grants recognised in income (6) (7)
2.10 Number of employees 23 692 18 094
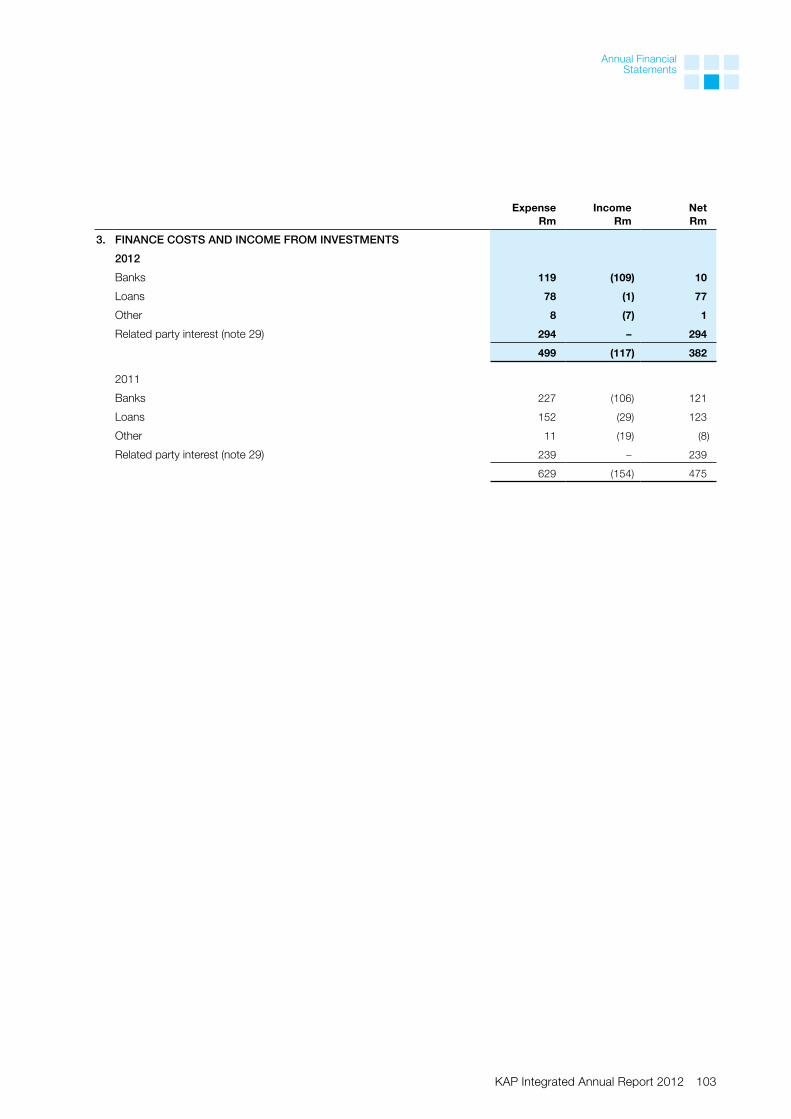
KAP Integrated Annual Report 2012 103
Annual Financial Statements
ExpenseRm
IncomeRm
NetRm
3. FINANCE COSTS AND INCOME FROM INVESTMENTS
2012
Banks 119 (109) 10
Loans 78 (1) 77
Other 8 (7) 1
Related party interest (note 29) 294 – 294
499 (117) 382
2011
Banks 227 (106) 121
Loans 152 (29) 123
Other 11 (19) (8)
Related party interest (note 29) 239 – 239
629 (154) 475
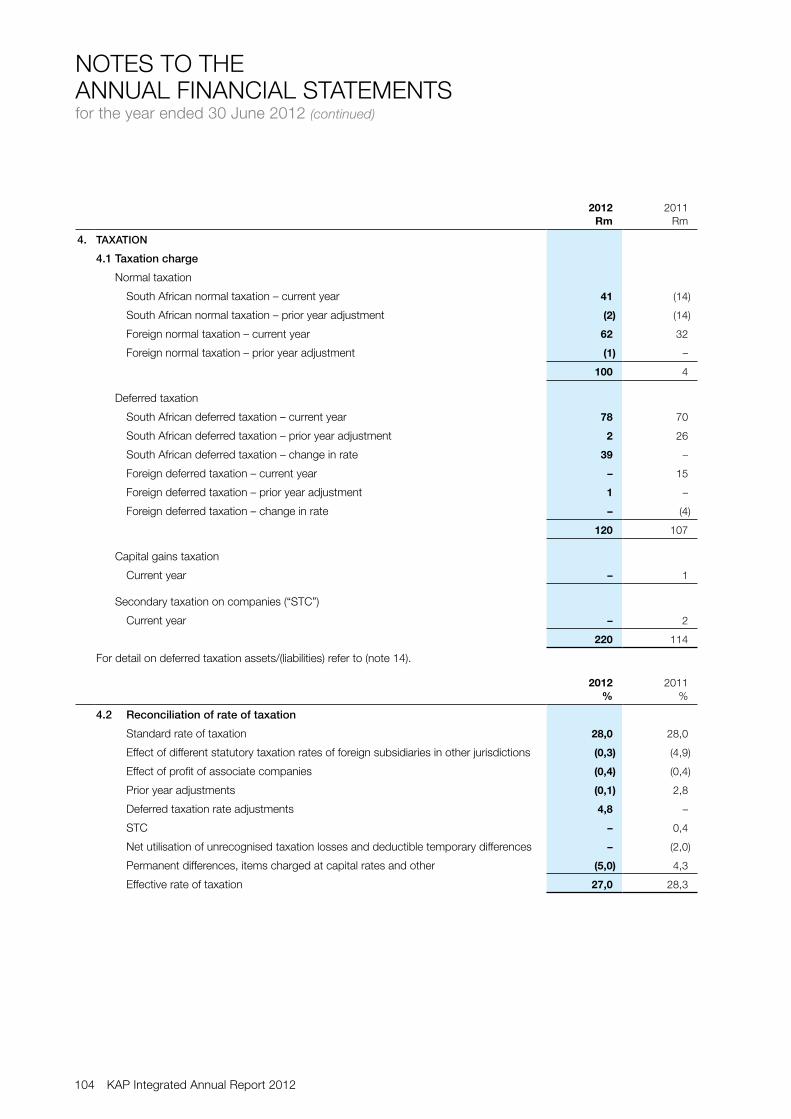
104 KAP Integrated Annual Report 2012
NOTES TO THEANNUAL FINANCIAL STATEMENTS for the year ended 30 June 2012 (continued)
2012Rm
2011Rm
4. TAXATION
4.1 Taxation charge
Normal taxation
South African normal taxation – current year 41 (14)
South African normal taxation – prior year adjustment (2) (14)
Foreign normal taxation – current year 62 32
Foreign normal taxation – prior year adjustment (1) –
100 4
Deferred taxation
South African deferred taxation – current year 78 70
South African deferred taxation – prior year adjustment 2 26
South African deferred taxation – change in rate 39 –
Foreign deferred taxation – current year – 15
Foreign deferred taxation – prior year adjustment 1 –
Foreign deferred taxation – change in rate – (4)
120 107
Capital gains taxation
Current year – 1
Secondary taxation on companies (“STC”)
Current year – 2
220 114
For detail on deferred taxation assets/(liabilities) refer to (note 14).
2012%
2011%
4.2 Reconciliation of rate of taxation
Standard rate of taxation 28,0 28,0
Effect of different statutory taxation rates of foreign subsidiaries in other jurisdictions (0,3) (4,9)
Effect of profit of associate companies (0,4) (0,4)
Prior year adjustments (0,1) 2,8
Deferred taxation rate adjustments 4,8 –
STC – 0,4
Net utilisation of unrecognised taxation losses and deductible temporary differences – (2,0)
Permanent differences, items charged at capital rates and other (5,0) 4,3
Effective rate of taxation 27,0 28,3

KAP Integrated Annual Report 2012 105
Annual Financial Statements
2012cents
2011cents
5. EARNINGS PER SHARE
The calculation of per share numbers uses the exact unrounded numbers which may result in differences when compared to calculating the numbers using the rounded number of shares and earnings as disclosed below.
Basic earnings per share 28,4 14,2
Basic earnings per share is calculated by dividing the net earnings attributable to ordinary shareholders by the weighted average number of ordinary shares in issue during the year.
Diluted earnings per share 28,2 14,2
Diluted earnings per share is calculated by dividing the diluted earnings attributable to ordinary shareholders by the diluted weighted average number of ordinary shares in issue during the year. The calculation assumes conversion of all dilutive potential shares.
Headline earnings per share 24,2 22,1
Headline earnings per share is calculated by dividing the headline earnings by the weighted average number of ordinary shares in issue during the year.
Diluted headline earnings per share 24,1 22,1
Diluted headline earnings per share is calculated by dividing the headline earnings by the diluted weighted average number of shares in issue during the year.
Net asset value per ordinary share 238,1 206,4
Net asset value per ordinary share is calculated by dividing the ordinary shareholders’ equity by the number of ordinary shares in issue at year-end.
2012million
2011million
5.1 Weighted average number of ordinary shares
Issued ordinary shares at the beginning of the year 1 913 1 9131
Effect of shares issued 106 – 2
Weighted average number of ordinary shares at the end of the year for the purpose of basic earnings per share and headline earnings per share 2 019 1 913
Effect of dilutive potential ordinary shares – KAP share options 13 –
Weighted average number of ordinary shares for the purpose of diluted earnings per share and diluted headline earnings per share 2 032 1 913
1 The number of shares issued to the accounting acquirer (established in the acquisition agreement).
2 The actual number of ordinary shares of the accounting acquiree on date of acquisition prior to issue of additional shares, weighted for the period of inclusion.
2012Rm
2011Rm
5.2 Earnings attributable to owners of the parent and diluted earnings 574 272
5.3 Reconciliation between earnings and headline earnings and diluted headline earnings
Earnings attributable to owners of the parent 574 272
Adjusted for capital items (note 1) (84) 152
Headline earnings attributable to owners of the parent and diluted headline earnings 490 424
5.4 Net asset value
Attributable to ordinary shareholders 5 564 3 948
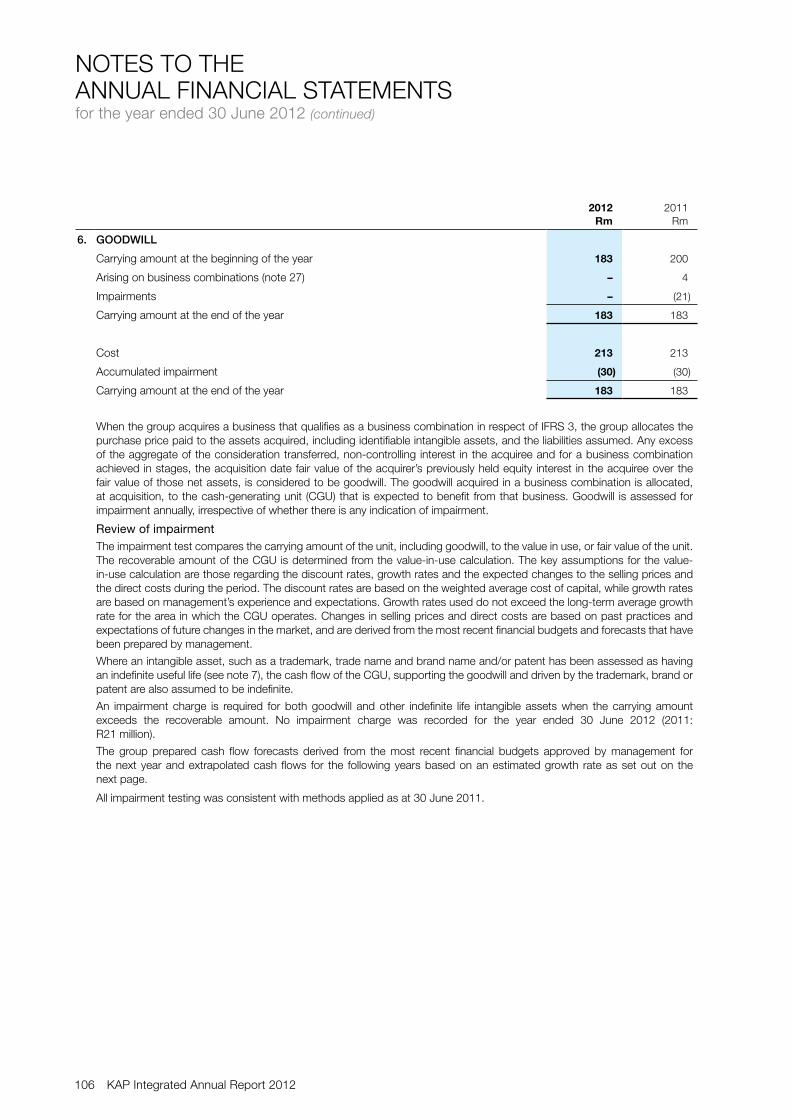
106 KAP Integrated Annual Report 2012
NOTES TO THEANNUAL FINANCIAL STATEMENTS for the year ended 30 June 2012 (continued)
2012Rm
2011Rm
6. GOODWILL
Carrying amount at the beginning of the year 183 200
Arising on business combinations (note 27) – 4
Impairments – (21)
Carrying amount at the end of the year 183 183
Cost 213 213
Accumulated impairment (30) (30)
Carrying amount at the end of the year 183 183
When the group acquires a business that qualifies as a business combination in respect of IFRS 3, the group allocates the purchase price paid to the assets acquired, including identifiable intangible assets, and the liabilities assumed. Any excess of the aggregate of the consideration transferred, non-controlling interest in the acquiree and for a business combination achieved in stages, the acquisition date fair value of the acquirer’s previously held equity interest in the acquiree over the fair value of those net assets, is considered to be goodwill. The goodwill acquired in a business combination is allocated, at acquisition, to the cash-generating unit (CGU) that is expected to benefit from that business. Goodwill is assessed for impairment annually, irrespective of whether there is any indication of impairment.
Review of impairment The impairment test compares the carrying amount of the unit, including goodwill, to the value in use, or fair value of the unit. The recoverable amount of the CGU is determined from the value-in-use calculation. The key assumptions for the value-in-use calculation are those regarding the discount rates, growth rates and the expected changes to the selling prices and the direct costs during the period. The discount rates are based on the weighted average cost of capital, while growth rates are based on management’s experience and expectations. Growth rates used do not exceed the long-term average growth rate for the area in which the CGU operates. Changes in selling prices and direct costs are based on past practices and expectations of future changes in the market, and are derived from the most recent financial budgets and forecasts that have been prepared by management.
Where an intangible asset, such as a trademark, trade name and brand name and/or patent has been assessed as having an indefinite useful life (see note 7), the cash flow of the CGU, supporting the goodwill and driven by the trademark, brand or patent are also assumed to be indefinite.
An impairment charge is required for both goodwill and other indefinite life intangible assets when the carrying amount exceeds the recoverable amount. No impairment charge was recorded for the year ended 30 June 2012 (2011: R21 million).
The group prepared cash flow forecasts derived from the most recent financial budgets approved by management for the next year and extrapolated cash flows for the following years based on an estimated growth rate as set out on the next page.
All impairment testing was consistent with methods applied as at 30 June 2011.

KAP Integrated Annual Report 2012 107
Annual Financial Statements
6. GOODWILL (continued)
Impairment tests for CGUs containing goodwill
The following units have significant carrying amounts of goodwill:
Pre-tax
discount rateForecasted cash flows
2012Rm
2011Rm
Timber (PG Bison) 13,06% Budget year 1, thereafter 15% growth rate up to 30 June 2015. The estimated subsequent cash flows were based on declining growth rates. 116 116
Logistics (Unitrans) 11,11% Budget year 1, thereafter 6% growth rate. 52 52
Various other units 13,06% – 13,98% Budget year 1, thereafter 13% to 15% growth rate up to 30 June 2015. The estimated subsequent cash flows were based on declining growth rates. 15 15
Carrying amount at the end of the year 183 183
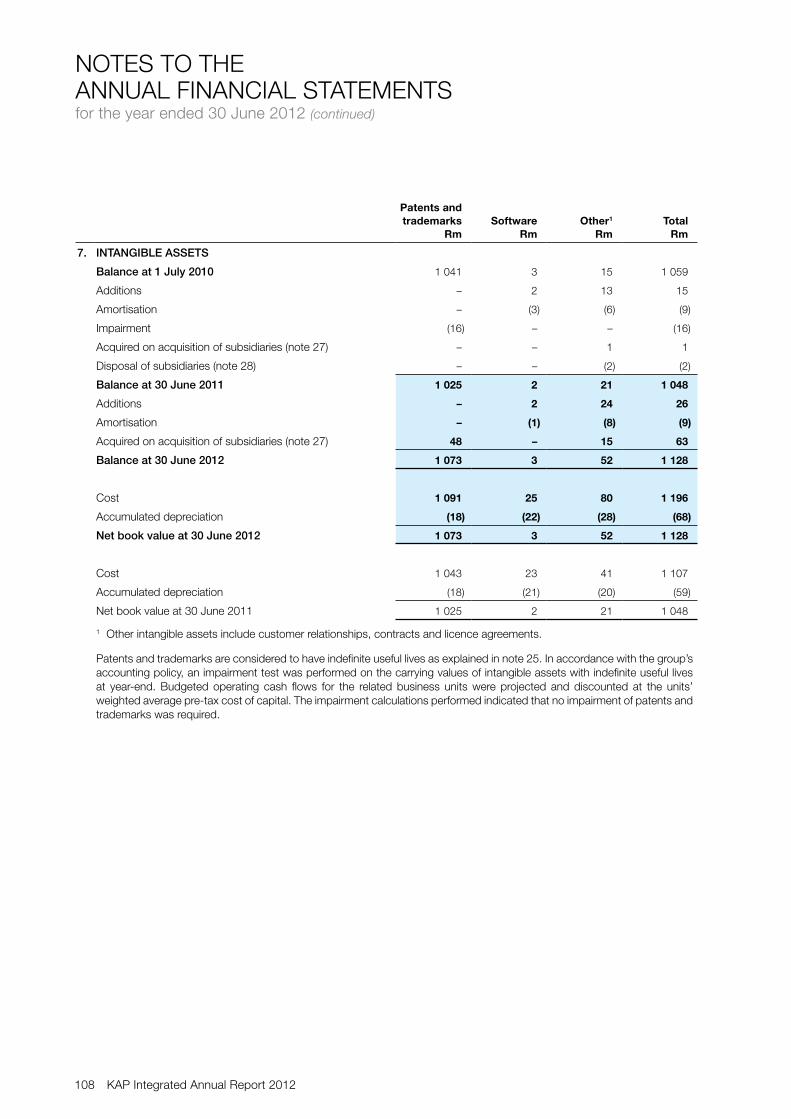
108 KAP Integrated Annual Report 2012
NOTES TO THEANNUAL FINANCIAL STATEMENTS for the year ended 30 June 2012 (continued)
Patents and trademarks
Rm Software
Rm Other1
Rm Total
Rm
7. INTANGIBLE ASSETS
Balance at 1 July 2010 1 041 3 15 1 059
Additions – 2 13 15
Amortisation – (3) (6) (9)
Impairment (16) – – (16)
Acquired on acquisition of subsidiaries (note 27) – – 1 1
Disposal of subsidiaries (note 28) – – (2) (2)
Balance at 30 June 2011 1 025 2 21 1 048
Additions – 2 24 26
Amortisation – (1) (8) (9)
Acquired on acquisition of subsidiaries (note 27) 48 – 15 63
Balance at 30 June 2012 1 073 3 52 1 128
Cost 1 091 25 80 1 196
Accumulated depreciation (18) (22) (28) (68)
Net book value at 30 June 2012 1 073 3 52 1 128
Cost 1 043 23 41 1 107
Accumulated depreciation (18) (21) (20) (59)
Net book value at 30 June 2011 1 025 2 21 1 048
1 Other intangible assets include customer relationships, contracts and licence agreements.
Patents and trademarks are considered to have indefinite useful lives as explained in note 25. In accordance with the group’s accounting policy, an impairment test was performed on the carrying values of intangible assets with indefinite useful lives at year-end. Budgeted operating cash flows for the related business units were projected and discounted at the units’ weighted average pre-tax cost of capital. The impairment calculations performed indicated that no impairment of patents and trademarks was required.

KAP Integrated Annual Report 2012 109
Annual Financial Statements
7. INTANGIBLE ASSETS (continued)
Review of impairment
In determining the appropriate methodology to be adopted in the valuation of the value in use of the majority of the group’s intangible assets, the relief from royalty approach was considered to be the most applicable as a primary valuation methodology because it is predominantly and widely used as a basis for the structuring of licensing agreements both locally in the countries where these intangible assets originate and internationally, and this approach is generally accepted internationally as a reliable means of valuing trademarks.
IAS 38 Intangible Assets (IAS 38) gives guidance on how the fair value of intangible assets can be determined. The guidance has been applied throughout the valuation of the trade names, brand names and trademarks. Impairment tests typically take into account the most recent management forecast whereafter a reasonable rate of growth is applied based on market and industry conditions. Discount rates used in the discounted cash flow models are based on a weighted average cost of capital, while royalty rates used are determined with reference to industry benchmarks.
Impairment
All intangible assets, except those arising on the reverse acquisition, were tested for impairment during the year under review and no impairments were recognised (2011: R16 million). The intangible assets arising on the reverse acquisition, arose within three months of year-end and there were no market indications of a possible impairment, so no additional impairment test was performed at year-end.
All impairment testing was done consistently with methods used in the prior years.
Useful lives
Under IAS 38 the useful life of an asset is either finite or indefinite. An indefinite life does not mean an infinite useful life, but rather that there is no foreseeable limit to the period over which the asset can be expected to generate cash flows for the entity. Intangible assets with an indefinite useful life are not amortised; they are tested for impairment at least annually.
The intangible assets acquired in the Unitrans, PG Bison and KAP business combinations, have been assessed as having indefinite useful lives. The majority of these trade names and brand names were assessed independently at the time of the acquisition, and the indefinite useful life assumptions were supported by the following evidence:
• The industry is a mature, well-established industry.
• The trade names, brand names and/or trademarks are long-established relative to the market and have been in existence for a long time.
• The intangible assets relate to trade names, brand names, trademarks and patents rather than products and are therefore not vulnerable to typical product life cycles or to the technical, technological, commercial or other types of obsolescence that can be seen to limit the useful lives of other trade names and brand names.
• There is a relatively low turnover of comparable intangible assets implying stability within the industry.
Royalty rates
The royalty rate represents the assumed amount which would be paid to the owner of the intangible asset as a royalty fee, expressed as a percentage of revenue, for the use of the intangible asset. It is necessary to look to the industry in which the brand is operational to determine an appropriate notional royalty rate.

110 KAP Integrated Annual Report 2012
NOTES TO THEANNUAL FINANCIAL STATEMENTS for the year ended 30 June 2012 (continued)
Land and buildings
Rm
Plant and machinery
Rm
Long-haul motor
vehicles, motor
vehicles and equipment
Rm
Capital workin progress
Rm
Leasehold improvements
Rm
Office and computer
equipment, furniture and other assets
RmTotal
Rm
8. PROPERTY, PLANT AND EQUIPMENT
Balance at 1 July 2010 1 244 1 053 2 328 51 17 75 4 768
Additions 1 12 725 37 3 25 803
Assets held for sale – 20 – – – – 20
Depreciation (17) (81) (444) – (4) (20) (566)
Disposals (9) (22) (73) (6) (1) – (111)
(Impairment)/reversal of impairment – (1) – 6 – – 5
Acquisition of subsidiary companies (note 27) 17 – 3 – – 1 21
Disposal of subsidiary companies (note 28) – (2) – – – – (2)
Reclassification (1) 42 26 (51) 2 (18) –
Exchange differences on consolidation of foreign subsidiaries – 1 (16) 2 – – (13)
Balance at 30 June 2011 1 235 1 022 2 549 39 17 63 4 925
Additions 15 66 818 18 7 26 950
Assets held for sale (2) (12) – – (1) (1) (16)
Depreciation (20) (96) (478) – (4) (25) (623)
Disposals (106) (10) (83) – – (3) (202)
Impairment – (8) – – – – (8)
Acquisition of subsidiary companies (note 27) 413 585 5 41 – 37 1 081
Reclassification 14 12 9 (28) 3 (10) –
Exchange differences on consolidation of foreign subsidiaries – 1 (18) – – – (17)
Balance at 30 June 2012 1 549 1 560 2 802 70 22 87 6 090
Cost 1 649 2 318 4 708 70 36 276 9 057
Accumulated depreciation (100) (758) (1 906) – (14) (189) (2 967)
Net book value at 30 June 2012 1 549 1 560 2 802 70 22 87 6 090
Cost 1 323 1 569 4 371 39 29 186 7 517
Accumulated depreciation (88) (547) (1 822) – (12) (123) (2 592)
Net book value at 30 June 2011 1 235 1 022 2 549 39 17 63 4 925
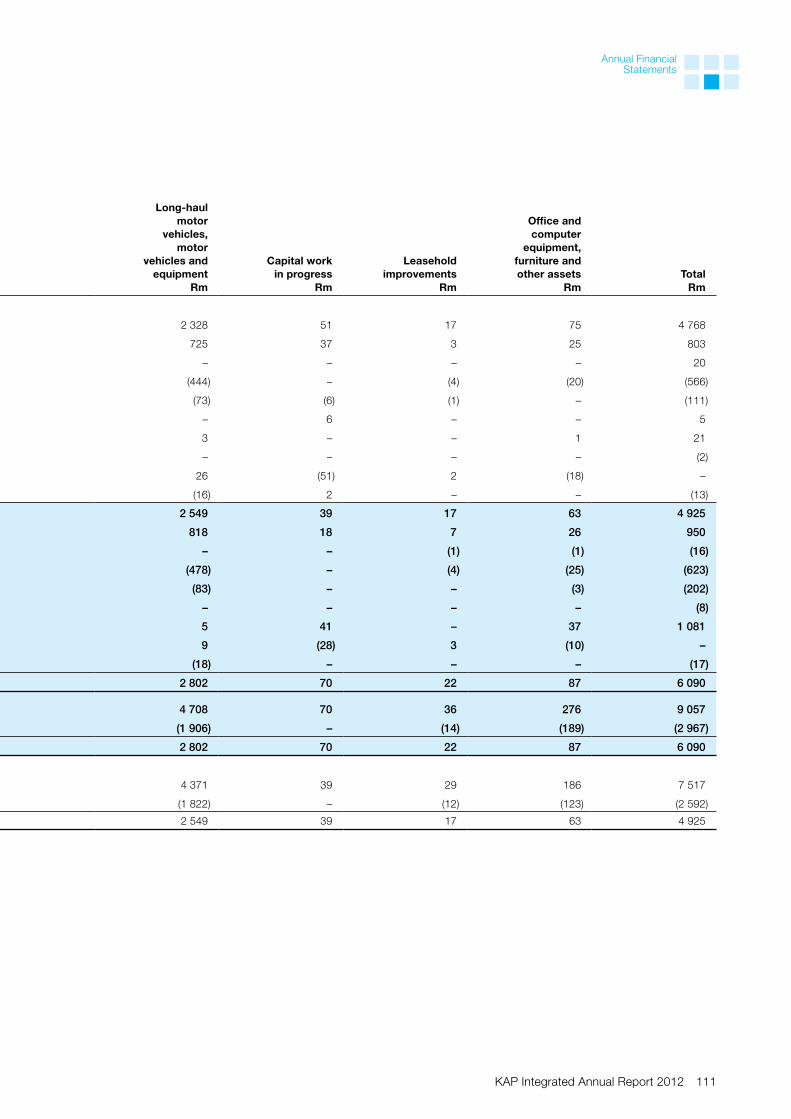
KAP Integrated Annual Report 2012 111
Annual Financial Statements
Land and buildings
Rm
Plant and machinery
Rm
Long-haul motor
vehicles, motor
vehicles and equipment
Rm
Capital workin progress
Rm
Leasehold improvements
Rm
Office and computer
equipment, furniture and other assets
RmTotal
Rm
8. PROPERTY, PLANT AND EQUIPMENT
Balance at 1 July 2010 1 244 1 053 2 328 51 17 75 4 768
Additions 1 12 725 37 3 25 803
Assets held for sale – 20 – – – – 20
Depreciation (17) (81) (444) – (4) (20) (566)
Disposals (9) (22) (73) (6) (1) – (111)
(Impairment)/reversal of impairment – (1) – 6 – – 5
Acquisition of subsidiary companies (note 27) 17 – 3 – – 1 21
Disposal of subsidiary companies (note 28) – (2) – – – – (2)
Reclassification (1) 42 26 (51) 2 (18) –
Exchange differences on consolidation of foreign subsidiaries – 1 (16) 2 – – (13)
Balance at 30 June 2011 1 235 1 022 2 549 39 17 63 4 925
Additions 15 66 818 18 7 26 950
Assets held for sale (2) (12) – – (1) (1) (16)
Depreciation (20) (96) (478) – (4) (25) (623)
Disposals (106) (10) (83) – – (3) (202)
Impairment – (8) – – – – (8)
Acquisition of subsidiary companies (note 27) 413 585 5 41 – 37 1 081
Reclassification 14 12 9 (28) 3 (10) –
Exchange differences on consolidation of foreign subsidiaries – 1 (18) – – – (17)
Balance at 30 June 2012 1 549 1 560 2 802 70 22 87 6 090
Cost 1 649 2 318 4 708 70 36 276 9 057
Accumulated depreciation (100) (758) (1 906) – (14) (189) (2 967)
Net book value at 30 June 2012 1 549 1 560 2 802 70 22 87 6 090
Cost 1 323 1 569 4 371 39 29 186 7 517
Accumulated depreciation (88) (547) (1 822) – (12) (123) (2 592)
Net book value at 30 June 2011 1 235 1 022 2 549 39 17 63 4 925

112 KAP Integrated Annual Report 2012
NOTES TO THEANNUAL FINANCIAL STATEMENTS for the year ended 30 June 2012 (continued)
8. PROPERTY, PLANT AND EQUIPMENT (continued)
Land and buildings
Details of land and buildings are available for inspection by members on request at the various registered offices of the company and its subsidiaries.
Encumbered assets
Assets with a book value of R660 million (2011: R566 million) are encumbered as set out in note 19.
Insurance
Property, plant and equipment, with the exception of motor vehicles, bus fleet, long-haul motor vehicles and land, are insured at approximate cost of replacement. Bus fleet and the majority of motor vehicles are self-insured.
Impairment losses
Refer to “Capital items” (note 1).
Useful lives
The estimated useful lives are reflected under “Judgements and estimates” (note 25).
2012Rm
2011Rm
9. INVESTMENT PROPERTY
Acquired on acquisition of subsidiary 39 –
Balance at the end of the year 39 –
No depreciation was recognised on investment property in the current year as the residual values exceeded the carrying values of all properties classified as investment property.
At 30 June 2012, investment property was valued by management at R39 million.
No restrictions exist on the sale of investment property.
There are no material contractual obligations to purchase, construct or develop investment property. There are, however, service level agreements and building maintenance contracts in place with third party contractors for security, repairs, maintenance and minor enhancements.

KAP Integrated Annual Report 2012 113
Annual Financial Statements
2012Rm
2011Rm
10. CONSUMABLE BIOLOGICAL ASSETS
Timber plantations
Carrying amount at the beginning of the year 1 446 1 321
Acquired on acquisition of subsidiary (note 27) 74 –
Decrease due to harvesting (note 2.8) (177) (146)
Fair value adjustment to plantations (note 2.7) 308 271
Carrying amount at the end of the year 1 651 1 446
Livestock 5 4
1 656 1 450
Expenses incurred in the management and operations of plantations (including harvesting) (note 2.8) 282 231
The group owns and manages timber plantations for use in manufacturing timber products. In terms of IAS 41 Agriculture, the plantations are valued at fair value less estimated costs to sell. The Faustman formula and discounted cash flow models were applied in determining the fair value of the plantations. The principal assumptions used in the Faustman formula include surveying physical hectares planted, age analysis and the industry mean annual incremental growth.
The fair value of mature standing timber, being the age at which it becomes marketable, is based on the market price of the estimated recoverable timber volumes, net of harvesting costs. The fair value of younger standing timber is based on the present value of the net cash flows expected to be generated by the plantation at maturity.
Livestock was introduced to the plantations as part of the fire prevention strategy of the group.
The group is exposed to a number of risks regarding its timber plantations:
• Regulatoryandenvironmentalrisks
The group’s timber plantation operations are subject to laws and regulations. The group has established environmental policies and procedures aimed at compliance with local environmental and other laws. The Thesens and north-eastern Cape forests are Forestry Stewardship Council certified. Management performs regular reviews to identify environmental risks and to ensure that the systems in place are adequate to manage those risks.
• Supplyanddemandrisks
For external sale of timber, the group is exposed to risks arising from the fluctuations of price and sales volumes of timber. Where possible, the group manages these risks by aligning its harvest volume to market supply and demand. Management performs regular industry trend analyses to ensure that the group’s pricing structure is in line with the market and to ensure that projected harvest volumes are consistent with the expected demand.
• Climateandotherrisks
The group’s timber plantations are exposed to the risk of damage from climate changes, disease, forest fires and other natural forces. The group has extensive processes in place aimed at monitoring and mitigating those risks, including regular forest health inspections and industry and pest disease surveys. The group also insures itself, where cost-effective, against natural disasters such as fire.
Encumbered consumable biological assets
None of the group’s consumable biological assets are encumbered.
Commitments
There are no amounts committed for the development and acquisition of consumable biological assets.
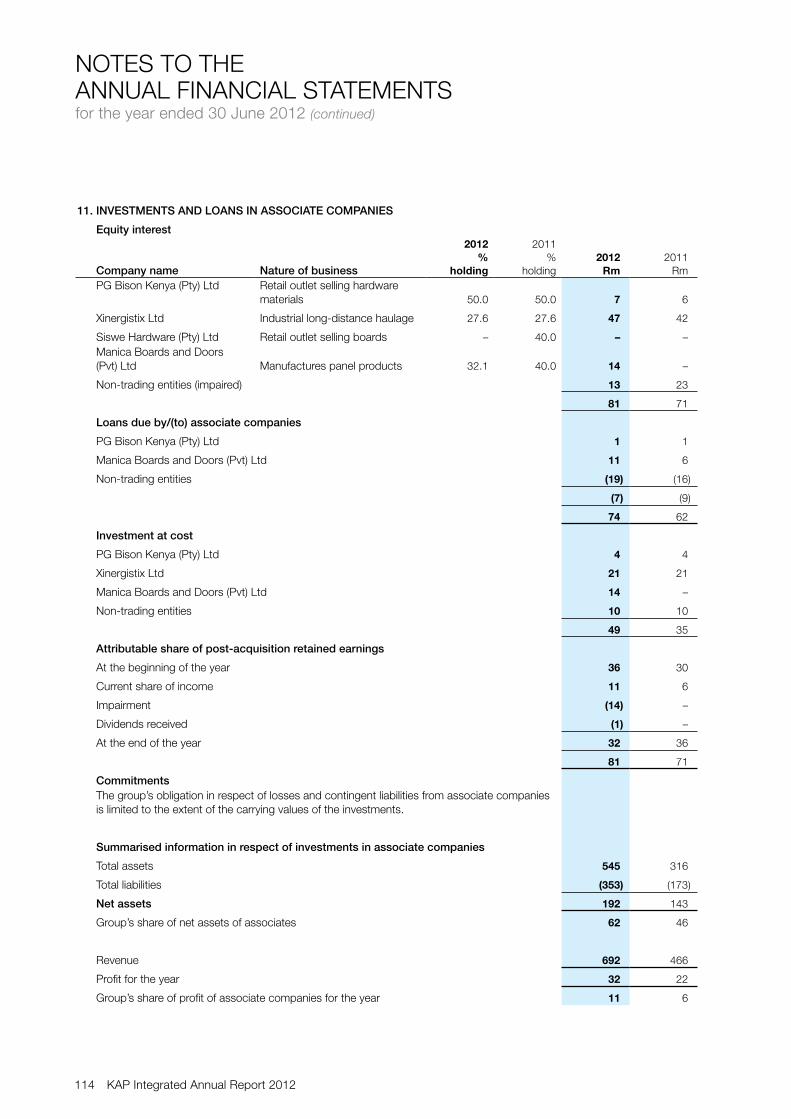
114 KAP Integrated Annual Report 2012
NOTES TO THEANNUAL FINANCIAL STATEMENTS for the year ended 30 June 2012 (continued)
11. INVESTMENTS AND LOANS IN ASSOCIATE COMPANIES
Equity interest
Company name Nature of business
2012%
holding
2011%
holding2012
Rm2011
RmPG Bison Kenya (Pty) Ltd Retail outlet selling hardware
materials 50.0 50.0 7 6
Xinergistix Ltd Industrial long-distance haulage 27.6 27.6 47 42
Siswe Hardware (Pty) Ltd Retail outlet selling boards – 40.0 – – Manica Boards and Doors (Pvt) Ltd Manufactures panel products 32.1 40.0 14 –
Non-trading entities (impaired) 13 23
81 71
Loans due by/(to) associate companies
PG Bison Kenya (Pty) Ltd 1 1
Manica Boards and Doors (Pvt) Ltd 11 6
Non-trading entities (19) (16)
(7) (9)
74 62
Investment at cost
PG Bison Kenya (Pty) Ltd 4 4
Xinergistix Ltd 21 21
Manica Boards and Doors (Pvt) Ltd 14 –
Non-trading entities 10 10
49 35
Attributable share of post-acquisition retained earnings
At the beginning of the year 36 30
Current share of income 11 6
Impairment (14) –
Dividends received (1) –
At the end of the year 32 36
81 71
Commitments The group’s obligation in respect of losses and contingent liabilities from associate companies is limited to the extent of the carrying values of the investments.
Summarised information in respect of investments in associate companies
Total assets 545 316
Total liabilities (353) (173)
Net assets 192 143
Group’s share of net assets of associates 62 46
Revenue 692 466
Profit for the year 32 22
Group’s share of profit of associate companies for the year 11 6
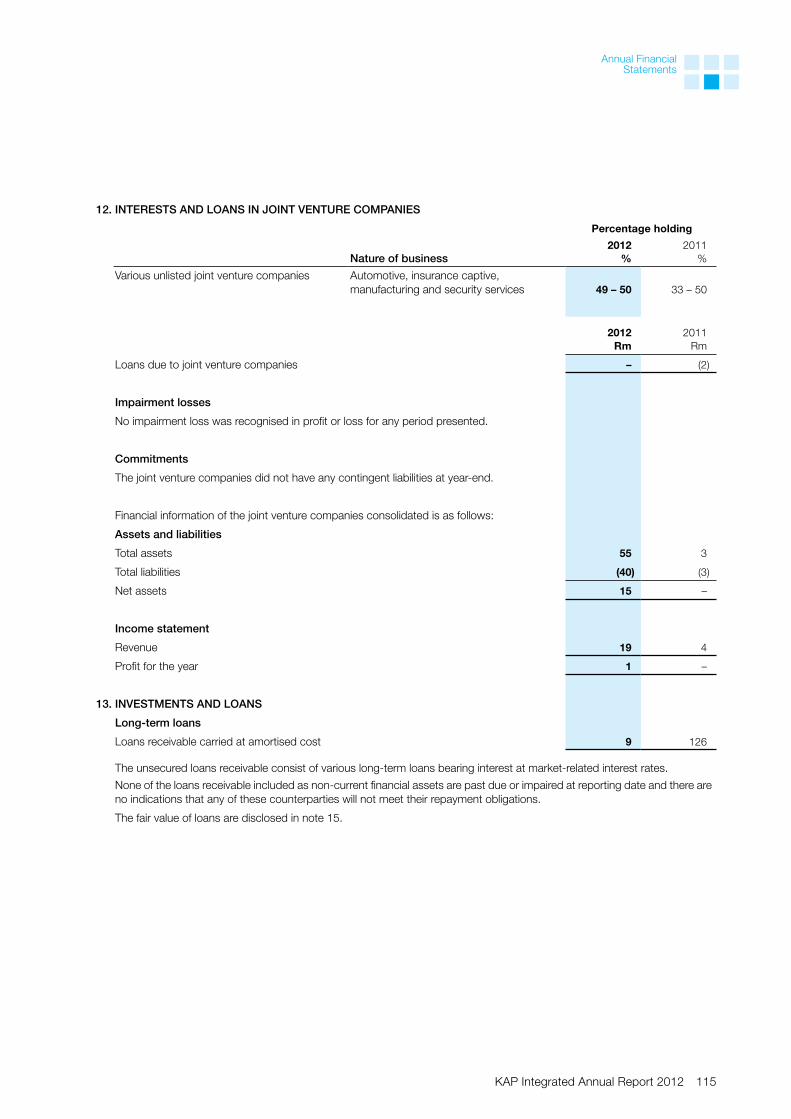
KAP Integrated Annual Report 2012 115
Annual Financial Statements
12. INTERESTS AND LOANS IN JOINT VENTURE COMPANIES
Percentage holding
Nature of business 2012
%2011
%
Various unlisted joint venture companies Automotive, insurance captive, manufacturing and security services 49 – 50 33 – 50
2012Rm
2011Rm
Loans due to joint venture companies – (2)
Impairment losses
No impairment loss was recognised in profit or loss for any period presented.
Commitments
The joint venture companies did not have any contingent liabilities at year-end.
Financial information of the joint venture companies consolidated is as follows:
Assets and liabilities
Total assets 55 3
Total liabilities (40) (3)
Net assets 15 –
Income statement
Revenue 19 4
Profit for the year 1 –
13. INVESTMENTS AND LOANS
Long-term loans
Loans receivable carried at amortised cost 9 126
The unsecured loans receivable consist of various long-term loans bearing interest at market-related interest rates.
None of the loans receivable included as non-current financial assets are past due or impaired at reporting date and there are no indications that any of these counterparties will not meet their repayment obligations.
The fair value of loans are disclosed in note 15.

116 KAP Integrated Annual Report 2012
NOTES TO THEANNUAL FINANCIAL STATEMENTS for the year ended 30 June 2012 (continued)
2012Rm
2011Rm
14. DEFERRED TAXATION ASSETS/(LIABILITIES)
14.1 Deferred taxation movement
(Liabilities)/assets
Balance at the beginning of the year (466) (374)
Deferred taxation of subsidiaries acquired (note 27) (49) 6
Deferred taxation of subsidiaries disposed (note 28) (9) (1)
Amounts charged directly to other comprehensive income and equity
Actuarial reserve (1) (1)
Share-based payments (3) 7
Current year charge (120) (107)
Exchange differences on consolidation of foreign subsidiaries 1 4
Balance at the end of the year (647) (466)
14.2 Deferred taxation balances
Assets
Provision for taxation on temporary differences resulting from South African normal taxation rate (28%), South African capital gains taxation (SA CGT) rate (18,6%) and foreign taxation rates:
Equalisation of operating lease payments 3 3
Prepayments and provisions 36 17
Property, plant and equipment (including consumable biological assets) (538) (459)
Share-based payments 13 11
Other 23 4
(463) (424)
Taxation losses and credits
Taxation losses 539 520
Total deferred taxation assets 76 96
Realisation of the deferred taxation asset is expected out of future taxable income which was assessed and deemed to be reasonable.
Liabilities
Provision for taxation on temporary differences resulting from South African normal taxation rate (28%), SA CGT rate (18,6%) and foreign taxation rates:
Intangible assets (171) (146)
Prepayments and provisions 49 17
Property, plant and equipment (including consumable biological assets) (729) (483)
Share-based payments 15 15
Other (86) (63)
Secondary taxation on companies (10%) – 2
(922) (658)
Taxation losses and credits
Taxation losses 199 96
Total deferred taxation liabilities (723) (562)

KAP Integrated Annual Report 2012 117
Annual Financial Statements
2012Rm
2011Rm
14.3 Unrecognised deferred taxation assets
Deferred taxation assets have not been recognised in respect of the following items:
Taxation losses 110 42
The taxation losses and deductible temporary differences do not expire under current taxation legislation. Deferred taxation assets have not been recognised in respect of these items because it is not yet certain that future taxable profits will be available against which the group can realise the benefits therefrom.
14.4. Taxation losses
Estimated taxation losses available for offset against future taxable income 2 743 2 249

118 KAP Integrated Annual Report 2012
NOTES TO THEANNUAL FINANCIAL STATEMENTS for the year ended 30 June 2012 (continued)
15. FINANCIAL INSTRUMENTS
The executive team is responsible for implementing the risk management strategy to ensure that an appropriate risk management framework is operating effectively across the group, embedding a risk management culture throughout the group. The board and the audit and risk committee are provided with a consolidated view of the risk profile of the group, and any major exposures and relevant mitigating actions are identified.
The system of risk management is designed so that the different business units are able to tailor and adapt their risk management processes to suit their specific circumstances.
Regular management reporting and internal audit reports provide a balanced assessment of key risks and controls. The financial director provides quarterly confirmation to the board that financial and accounting control frameworks have operated satisfactorily and consistently.
The group does not speculate in the trading of derivative or other financial instruments. It is group policy to hedge exposure to cash and future contracted transactions.
15.1 Total financial assets and liabilities
At fair valuethrough
profitor loss1
Rm
Loans and receivables
and other financial
liabilities at amortised
costRm
Total carrying
valuesRm
Loans andreceivables
and other financial
liabilities atfair value
Rm
Total fair values
Rm
2012
Investments and loans – 9 9 9 9
Non-current financial assets – 9 9 9 9
Trade and other receivables (financial assets) 7 2 285 2 292 2 285 2 292
Cash and cash equivalents – 1 346 1 346 1 346 1 346
Current financial assets 7 3 631 3 638 3 631 3 638
Long-term interest-bearing loans and borrowings – (3 800) (3 800) (3 801) (3 801)
Non-current financial liabilities – (3 800) (3 800) (3 801) (3 801)
Short-term interest-bearing loans and borrowings – (343) (343) (343) (343)
Bank overdrafts and short-term facilities – (743) (743) (743) (743)
Trade and other payables (financial liabilities) (1) (2 493) (2 494) (2 493) (2 494)
Current financial liabilities (1) (3 579) (3 580) (3 579) (3 580)
6 (3 739) (3 733) (3 740) (3 734)
Net losses recognised in profit or loss 2 6 8
Net interest expense – 382 382
1 This category includes derivative financial instruments that are not designated as effective hedging instruments.
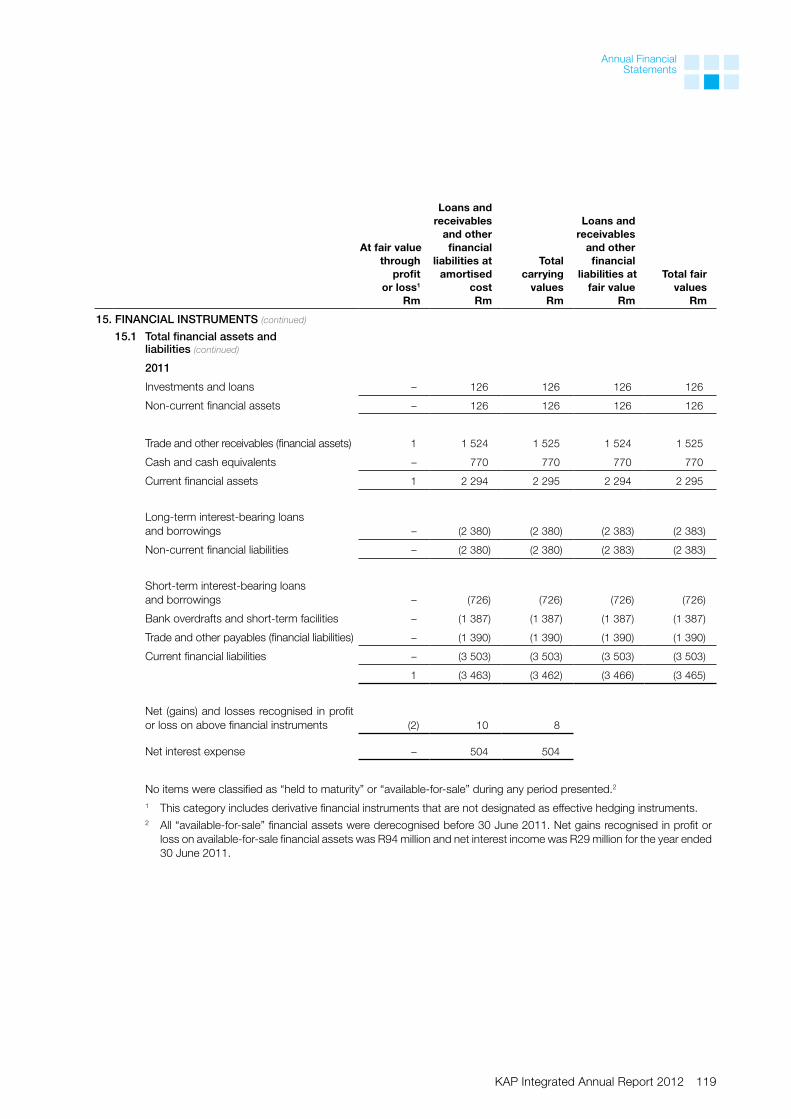
KAP Integrated Annual Report 2012 119
Annual Financial Statements
At fair valuethrough
profitor loss1
Rm
Loans and receivables
and other financial
liabilities at amortised
costRm
Total carrying
valuesRm
Loans andreceivables
and other financial
liabilities atfair value
Rm
Total fair values
Rm
15. FINANCIAL INSTRUMENTS (continued)
15.1 Total financial assets and liabilities (continued)
2011
Investments and loans – 126 126 126 126
Non-current financial assets – 126 126 126 126
Trade and other receivables (financial assets) 1 1 524 1 525 1 524 1 525
Cash and cash equivalents – 770 770 770 770
Current financial assets 1 2 294 2 295 2 294 2 295
Long-term interest-bearing loans and borrowings – (2 380) (2 380) (2 383) (2 383)
Non-current financial liabilities – (2 380) (2 380) (2 383) (2 383)
Short-term interest-bearing loans and borrowings – (726) (726) (726) (726)
Bank overdrafts and short-term facilities – (1 387) (1 387) (1 387) (1 387)
Trade and other payables (financial liabilities) – (1 390) (1 390) (1 390) (1 390)
Current financial liabilities – (3 503) (3 503) (3 503) (3 503)
1 (3 463) (3 462) (3 466) (3 465)
Net (gains) and losses recognised in profit or loss on above financial instruments (2) 10 8
Net interest expense – 504 504
No items were classified as “held to maturity” or “available-for-sale” during any period presented.2
1 This category includes derivative financial instruments that are not designated as effective hedging instruments.
2 All “available-for-sale” financial assets were derecognised before 30 June 2011. Net gains recognised in profit or loss on available-for-sale financial assets was R94 million and net interest income was R29 million for the year ended 30 June 2011.

120 KAP Integrated Annual Report 2012
NOTES TO THEANNUAL FINANCIAL STATEMENTS for the year ended 30 June 2012 (continued)
15. FINANCIAL INSTRUMENTS (continued)
15.2 Fair values
The fair values of financial assets and financial liabilities are determined as follows:
Trade and other receivables and short-term loans receivable
The fair values of trade and other receivables and short-term loans receivable are estimated as the present value of future cash flows, discounted at the market rate of interest at the reporting date.
Derivatives
The fair values of forward exchange contracts are based on their listed market price, if available. If a listed market price is not available, then the fair value is estimated by discounting the difference between the contractual forward price and the current forward price for the residual maturity of the contract using a risk-free interest rate (based on government bonds).
Non-derivative financial liabilities
Fair value, which is determined for disclosure purposes, is calculated based on the present value of future principal and interest cash flows, discounted at the market rate of interest at the reporting date.
The fair values are not necessarily indicative of the amounts the group could realise in the normal course of business.
IFRS 7 Financial Instruments: Disclosure (IFRS 7), has established a three-level hierarchy for making fair value measurements:
• Level1–Unadjustedquotedpricesforfinancialassetsandfinancialliabilitiestradedinanactivemarketforidenticalfinancial assets or financial liabilities.
• Level2–Inputsotherthanquotedpricesincludedinlevel1thatareobservableforthefinancialassetorfinancialliability, either directly (i.e. as prices) or indirectly (i.e. derived from prices).
• Level3–Inputsforthefinancialassetorfinancialliabilitythatarenotbasedonobservablemarketdata.
The fair values of the financial assets and liabilities as determined by the IFRS 7 hierarchy are as follows:
2012Level 2
Rm
2011Level 2
Rm
Derivative financial assets 7 1
Derivative financial liabilities (1) –
6 1
The were no level 1 or level 3 financial assets or financial liabilities as at 30 June 2012 or 30 June 2011.
15.3 Foreign currency risk
The group’s manufacturing operating costs and expenses are principally incurred in South African Rand. Its revenue derived from outside southern Africa, however, is principally in US Dollars.
It is group policy to hedge exposure to cash and future contracted transactions in foreign currencies for a range of forward periods, but not to hedge exposure for the translation of reported profits or reported assets and liabilities.
Exposure to currency risk
Currency risk (or foreign exchange risk) as defined by IFRS 7, arises on financial instruments that are denominated in a foreign currency, i.e. in a currency other than the functional currency in which they are measured. For the purpose of IFRS 7, currency risk does not arise from financial instruments that are non-monetary items or from financial instruments denominated in the functional currency.
Differences resulting from the translation of subsidiary financial statements into the group’s presentation currency are not taken into consideration.

KAP Integrated Annual Report 2012 121
Annual Financial Statements
15. FINANCIAL INSTRUMENTS (continued)
15.3 Foreign currency risk (continued)
The carrying amounts of the group’s material foreign currency denominated monetary assets and liabilities (excluding intragroup loan balances) that will have an impact on profit or loss when exchange rates change, at reporting date are as follows:
Euros US Dollars
2012
Trade and other receivables (financial assets excluding derivatives) 19 20
Cash and cash equivalents 15 24
Trade and other payables (financial liabilities excluding derivatives) (85) (387)
Pre-derivative position (51) (343)
Derivative effect 106 499
Open position 55 156
2011
Trade and other receivables (financial assets excluding derivatives) 1 18
Cash and cash equivalents – 15
Trade and other payables (financial liabilities excluding derivatives) (40) (21)
Pre-derivative position (39) 12
Derivative effect 66 29
Open position 27 41
The following significant exchange rates applied during the year and were used in calculating sensitivities:
Rand
30 June 2013Forecast
rate1
30 June 2012Forecast
rate1
2012Reporting
date spot rate
2011Reporting
date spot rate
Euro 9,8483 9,8400 10,3447 9,8654
US Dollar 8,1050 7,5600 8,1700 6,8555
1 The forecast rates represent a weighting of foreign currency rates as forecasted by the major banks that the group transacts with regularly. These rates are not necessarily management’s expectations of currency movements.

122 KAP Integrated Annual Report 2012
NOTES TO THEANNUAL FINANCIAL STATEMENTS for the year ended 30 June 2012 (continued)
15. FINANCIAL INSTRUMENTS (continued)
15.3 Foreign currency risk (continued)
Sensitivity analysis
The table below indicates the group’s sensitivity at year-end to the movements in the major currencies that the group is exposed to on its financial instruments. The percentages given below represent a weighting of foreign currency rates as forecast by the major banks that the group transacts with regularly. This analysis assumes that all other variables, in particular interest rates, remain constant. The analysis was performed on the same basis for 2011.
The impact on the reported numbers of using the forecast rates as opposed to the reporting date spot rates is set out below.
Through (profit)/loss2012
Rm2011
Rm
Euro weakening by 4,8% (2011: weakening by 0,3%) to the rand (3) –
US Dollar weakening by 0,8% (2011: strengthening by 10,3%) to the rand (1) 4
If the foreign currencies were to weaken/strengthen against the Rand, by the same percentages as set out in the table above, it would have an equal, but opposite effect on profit or loss.
Foreign exchange contracts
The group uses forward exchange contracts to hedge its foreign currency risk against change in foreign denominated assets and liabilities. Most of the forward exchange contracts have maturities of less than one year after reporting date. As a matter of policy, the group does not enter into derivative contracts for speculative purposes. The fair values of such contracts at year-end, by currency, were:
Short-term derivatives
Assets
Fair value of foreign exchange contracts
Euro – 1
US Dollar 7 –
7 1
Liabilities
Fair value of foreign exchange contracts (1) –
Euro (1) –
Net derivative assets 6 1
Currency options are only purchased as a cost-effective alternative to forward currency contracts.
Changes in the fair value of forward exchange contracts of economically hedged monetary assets and liabilities in foreign currencies and for which no hedge accounting is applied, are recognised in profit or loss.

KAP Integrated Annual Report 2012 123
Annual Financial Statements
15. FINANCIAL INSTRUMENTS (continued)
15.4 Interest rate risk
As part of the process of managing the group’s borrowings mix, the interest rate characteristics of new borrowings and the refinancing of existing borrowings are positioned according to expected movements in interest rates. Interest rate exposure is managed within limits agreed by the board.
The interest and related terms of the group’s interest-bearing loans are disclosed in note 19.
At the reporting date the interest rate profile of the group’s financial instruments was: Variable
JIBAR and
SA primeRm
Variable other
Rm
Fixed rateRm
Non-interest-bearing
RmTotal
Rm
2012
Non-current financial assets 9 – – – 9
Current financial assets 943 260 47 2 388 3 638
Non-current financial liabilities (3 710) (20) (1) (69) (3 800)
Current financial liabilities (1 052) (16) (3) (2 509) (3 580)
(3 810) 224 43 (190) (3 733)
2011
Non-current financial assets 126 – – – 126
Current financial assets 515 230 – 1 550 2 295
Non-current financial liabilities (2 332) (30) (17) (1) (2 380)
Current financial liabilities (2 009) (33) (13) (1 448) (3 503)
(3 700) 167 (30) 101 (3 462)
Sensitivity analysis
The group is sensitive to movements in the JIBAR and SA prime rates, which are the primary interest rates to which the group is exposed.
The sensitivities calculated below are based on an increase of 100 basis points for each interest category. These rates are also used when reporting sensitivities internally to key management personnel.
2012Rm
2011Rm
Through (profit)/loss
JIBAR and SA prime – 100 basis point increase 38 37
A 100 basis point decrease in the above rates would have had an equal, but opposite effect on profit or loss.
15.5 Credit risk
Potential concentration of credit risk consists principally of short-term cash and cash equivalent investments, trade and other receivables, and loans receivable. The group deposits short-term cash surpluses with major banks of quality credit standing. Trade receivables comprise a large and widespread customer base and group companies perform ongoing credit evaluations on the financial condition of their customers, and appropriate use is made of credit guarantee insurance. At 30 June 2012, the group did not consider there to be any significant concentration of credit risk which had not been adequately provided for. The amounts presented in the statement of financial position are net of provisions for bad debts, estimated by the group companies’ management based on prior experience and the current economic environment.

124 KAP Integrated Annual Report 2012
NOTES TO THEANNUAL FINANCIAL STATEMENTS for the year ended 30 June 2012 (continued)
15. FINANCIAL INSTRUMENTS (continued)
15.5 Credit risk (continued)
The carrying amounts of financial assets represent the maximum credit exposure.
2012Rm
2011Rm
The maximum exposure to credit risk at the reporting date without taking account of the value of any collateral obtained was:
Non-current financial assets 9 126
Current financial assets 3 638 2 295
3 647 2 421
The maximum exposure to credit risk at the reporting date by segment was (carrying amounts):
Logistics 1 605 1 413
Manufacturing 1 313 433
Timber 729 575
3 647 2 421
The maximum exposure to credit risk at the reporting date by geographical region was (carrying amounts):
Southern Africa 3 629 2 413
Other regions 18 8
3 647 2 421
Ageing of financial assets
Not past due or impaired 3 185 2 023
Past due 1 to 30 days but not impaired 283 261
Past due 31 to 60 days but not impaired 68 70
Past due 61 to 90 days but not impaired 14 27
Past due more than 90 days but not impaired 33 23
Past due but not impaired in full 64 17
Impaired balance 156 68
Impairment provision (92) (51)
3 647 2 421
Movement in provision for bad debts and impairments
Balance at the beginning of the year (51) (61)
Additional provision raised (20) (5)
Amounts unused reversed 16 13
Amounts used during the year 7 2
Acquired on acquisition of subsidiary companies (44) –
Balance at the end of the year (92) (51)
The group has liens over items sold until full payment has been received from customers. The fair value of collateral held against these loans and receivables is linked to the value of the liens. Furthermore the group has credit insurance to cover its exposure to risk on receivables where considered appropriate. On top of the liens over inventories, the group has collateral over other assets of counterparties valued at R277 million (2011: R278 million).
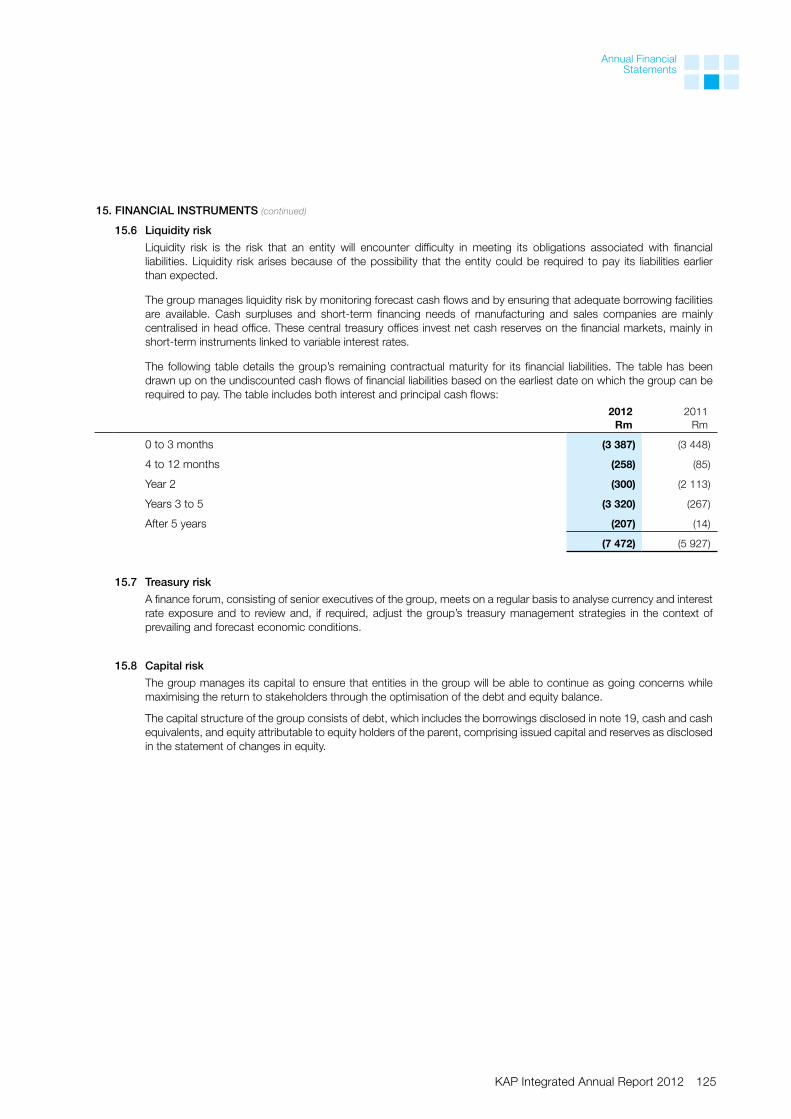
KAP Integrated Annual Report 2012 125
Annual Financial Statements
15. FINANCIAL INSTRUMENTS (continued)
15.6 Liquidity risk
Liquidity risk is the risk that an entity will encounter difficulty in meeting its obligations associated with financial liabilities. Liquidity risk arises because of the possibility that the entity could be required to pay its liabilities earlier than expected.
The group manages liquidity risk by monitoring forecast cash flows and by ensuring that adequate borrowing facilities are available. Cash surpluses and short-term financing needs of manufacturing and sales companies are mainly centralised in head office. These central treasury offices invest net cash reserves on the financial markets, mainly in short-term instruments linked to variable interest rates.
The following table details the group’s remaining contractual maturity for its financial liabilities. The table has been drawn up on the undiscounted cash flows of financial liabilities based on the earliest date on which the group can be required to pay. The table includes both interest and principal cash flows:
2012Rm
2011Rm
0 to 3 months (3 387) (3 448)
4 to 12 months (258) (85)
year 2 (300) (2 113)
years 3 to 5 (3 320) (267)
After 5 years (207) (14)
(7 472) (5 927)
15.7 Treasury risk
A finance forum, consisting of senior executives of the group, meets on a regular basis to analyse currency and interest rate exposure and to review and, if required, adjust the group’s treasury management strategies in the context of prevailing and forecast economic conditions.
15.8 Capital risk
The group manages its capital to ensure that entities in the group will be able to continue as going concerns while maximising the return to stakeholders through the optimisation of the debt and equity balance.
The capital structure of the group consists of debt, which includes the borrowings disclosed in note 19, cash and cash equivalents, and equity attributable to equity holders of the parent, comprising issued capital and reserves as disclosed in the statement of changes in equity.
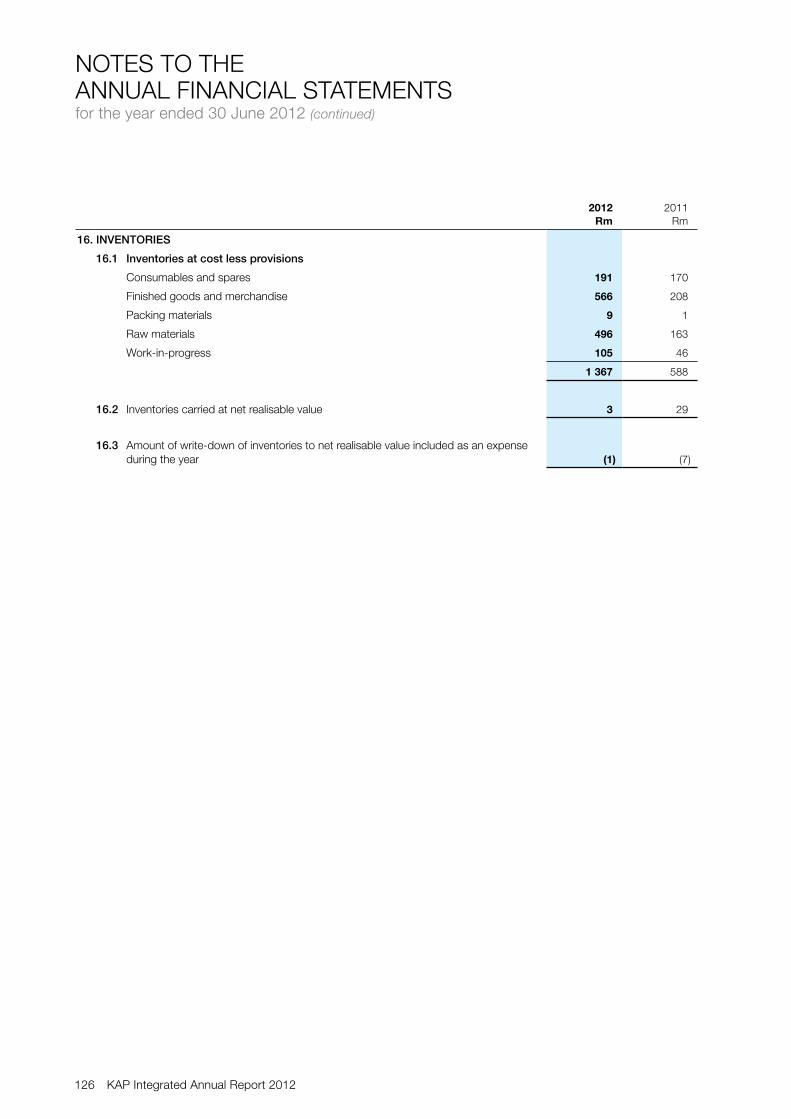
126 KAP Integrated Annual Report 2012
NOTES TO THEANNUAL FINANCIAL STATEMENTS for the year ended 30 June 2012 (continued)
2012Rm
2011Rm
16. INVENTORIES
16.1 Inventories at cost less provisions
Consumables and spares 191 170
Finished goods and merchandise 566 208
Packing materials 9 1
Raw materials 496 163
Work-in-progress 105 46
1 367 588
16.2 Inventories carried at net realisable value 3 29
16.3 Amount of write-down of inventories to net realisable value included as an expense during the year (1) (7)

KAP Integrated Annual Report 2012 127
Annual Financial Statements
2012Rm
2011Rm
17. TRADE AND OTHER RECEIVABLES
Trade receivables 2 054 1 229
Other amounts due 277 171
Less: Provision for bad debts (92) (51)
2 239 1 349
Related party receivables (note 29) 46 175
Derivative financial assets (note 15) 7 1
Trade and other receivables (financial assets) 2 292 1 525
Pension fund surplus 6 –
Prepayments 78 77
Taxation receivable 11 42
Value-added taxation receivable 70 55
2 457 1 699
The credit period on sales of goods is between 30 and 90 days. Where relevant, interest is charged at market-related rates on outstanding balances.
Before accepting any new customers, credit risk management uses various credit bureaux and performs credit assessments to assess the potential customer’s credit potential and credit limit. The credit limits are reviewed on a regular basis as and when increased limits are required. Customers with material balances are subject to additional security requirements or are insured as appropriate.
In determining the recoverability of a customer, the group considers any change in the credit quality of the customer from the date credit was initially granted up to the reporting date.
Given the diverse nature of the group’s operations, it does not have significant concentration of credit risk in respect of trade receivables, with exposure spread over a large number of customers. Accordingly, the directors believe that there is no further credit provision required in excess of the provision for bad debts.
No customer represents more than 5% of the total trade receivables at year-end.
R30 million (2011: R30 million) of the BCM group’s trade receivables, as well as the applicable insurance policies, were ceded in favour of facilities with banks.
The group’s exposure to currency and credit risk related to trade and other receivables is disclosed in note 15.3 and 15.5.

128 KAP Integrated Annual Report 2012
NOTES TO THEANNUAL FINANCIAL STATEMENTS for the year ended 30 June 2012 (continued)
2012Number
of shares
2011Number of
shares
18. ORDINARY STATED SHARE CAPITAL
18.1 Authorised
Ordinary shares of no par value 6 000 000 000 1 200 000 000
18.2 Stated share capital
Shares in issue at the beginning of the year 424 473 657 424 473 657
Shares issued during the year 1 912 781 011 –
Shares in issue at the end of the year 2 337 254 668 424 473 657
Reconciliation of share capital for purposes of accounting for the reverse acquisition in terms of IFRS 3 Business Combinations:
With effect from 2 April 2012, KAP became the legal parent company of the Steinhoff Industrial assets by acquiring all the shares in the Steinhoff Industrial assets from Steinhoff Africa Holdings (Pty) Limited. As this was accounted for as a reverse acquisition under IFRS 3, the equity structure in terms of the number of authorised and issued shares in the consolidated financial statements reflects the equity structure of KAP.
2012Rm
2011Rm
2010Rm
Opening balance (share premium and share capital) 900 930 930
Capital distribution (42) (30) –
Legal entity share capital and premium 858 900 930
Reverse acquisition adjustment 5 253 5 211 5 181 Reinstatement of legal entity’s share capital as part of reverse
acquisition accounting 858 – –
Closing balance 6 969 6 111 6 111
The holders of ordinary shares are entitled to receive dividends as declared from time to time and are entitled to one vote per share at the meetings of the company.
18.3 Share-based payment
KAP performance share plan
The KAP performance share plan, adopted by the shareholders in April 2007 authorises the company to allocate up to 42 447 000 share appreciation rights (SAR’s) to senior employees of the group (to a maximum for one participant of 2,5% of the company’s issued ordinary share capital), in managerial and leadership roles, who are able to influence the performance of the group. The allocation value of SAR’s will be within a range of 10% to 100% of each participant’s total cost to company (excluding annual performance bonuses), which percentage depends on the participant’s position and potential within the company. The cost of the SAR’s is 20 cents per share.
The number of shares corresponding to the SAR’s is determined by dividing the allocation value by the excess of the volume weighted average traded price of KAP shares on the JSE (for thirty days immediately prior to any allocation date) over 20 cents.
Shares are allocated on 1 July of every year.
The following performance criteria must be achieved by KAP in order for the SAR’s to vest and for shares to be allocated:
• Compound growth in headline earnings per share must exceed the growth of the headline earnings of the INDI 25 Index over a three-year period.
• The growth in the company’s volume weighted average share price over the thirty trading days immediately preceding the measurement date must exceed the growth of the INDI 25 Index over a three-year period.
• The participant must meet the criteria for participation in the annual short-term incentive bonus scheme. • Any other additional criteria as determined by the remuneration committee.
The option pricing model used is the Black-Scholes model.

KAP Integrated Annual Report 2012 129
Annual Financial Statements
18. ORDINARY STATED SHARE CAPITAL (continued)
18.3 Share-based payment (continued)
The fair value of services received in return for share options granted is measured by reference to the fair value of the share options granted.
The significant assumptions relating to the scheme per allotment are as follows:
The fair value of services received in return for share options granted is measured by reference to the fair value of the share options granted.
Fair value of share options and assumptions
Grant date 1 July 2011 1 July 2010 1 July 2009
Exercise price R0,20 R0,20 R0,20
Volume weighted average price at grant date R2,47 R2,31 R1,35
Options granted (millions) 8,3 8,7 14,4
Maximum term of option 3 years 3 years 3 years
Volatility 57% 64% 34%
Dividend yield 4% 3% 3%
Risk-free interest rate 6% 9% 9%
Forfeiture rate 1% 1% 1%
Market-related performance expectation 35% 35% 35%
Non-market-related performance expectation 29% 29% 29%
2012Options
2011Options
Reconciliation of options granted under the KAP performance share plan
Balance at the beginning of the year 27 800 000 28 400 000
Options which expired during the year (4 600 000) (9 300 000)
Granted during the year 8 300 000 8 700 000
Balance at the end of the year 31 500 000 27 800 000
2012 Rm
2011Rm
Charged to profit or loss 1 1
Steinhoff Share Rights Scheme
For details on the Steinhoff Share Rights Scheme in which the former Steinhoff Industrial assets’ executives share, refer to note 23.

130 KAP Integrated Annual Report 2012
NOTES TO THEANNUAL FINANCIAL STATEMENTS for the year ended 30 June 2012 (continued)
2012Rm
2011Rm
19. INTEREST-BEARING LOANS AND BORROWINGS
19.1 Analysis of closing balance
Secured financing
Capitalised finance lease and instalment sale agreements 32 7
Term loans 63 63
Phaello senior secured notes 300 –
395 70
Unsecured financing
Steinhoff Africa Holdings (Pty) Limited (note 29) 3 647 –
Steinhoff International Holdings Limited and its subsidiaries (note 29) – 2 984
Unitrans Share Trust (note 29) 24 15
Other loans 72 31
3 743 3 030
Total interest-bearing loans and borrowings 4 138 3 100
Portion payable before 30 June 2013 included in current liabilities (338) (720)
Total non-current interest-bearing loans and borrowings 3 800 2 380
Current interest-bearing loans and borrowings
Portion of non-current interest-bearing loans and borrowings payable before 30 June 2013 338 720
Other current loans payable 5 6
Total current interest-bearing loans and borrowings 343 726
19.2 Analysis of repayment
Repayable within the next year and thereafter
Next year 343 726
Within two to five years 3 557 3 303
Thereafter 216 15
4 116 4 044
All loans and borrowings are carried at amortised cost. The fair values of interest-bearing loans and borrowings are disclosed in note 15.
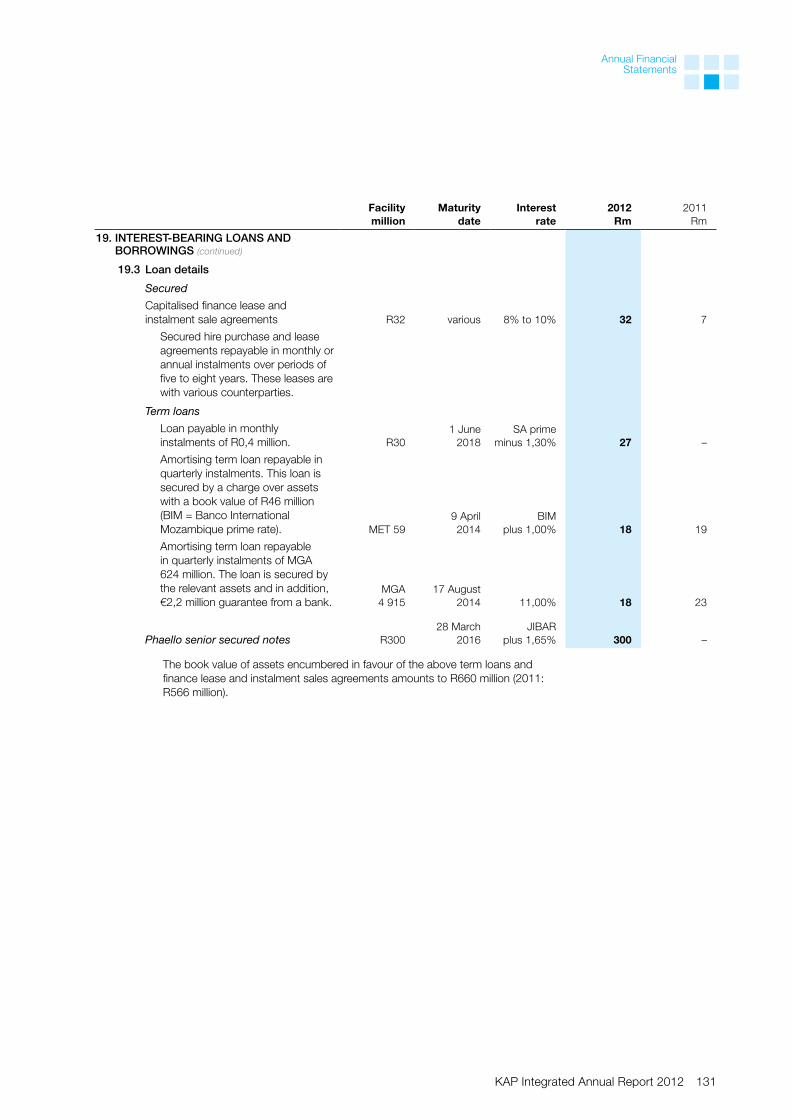
KAP Integrated Annual Report 2012 131
Annual Financial Statements
Facility million
Maturity date
Interest rate
2012Rm
2011Rm
19. INTEREST-BEARING LOANS AND BORROWINGS (continued)
19.3 Loan details
Secured
Capitalised finance lease and instalment sale agreements R32 various 8% to 10% 32 7
Secured hire purchase and lease agreements repayable in monthly or annual instalments over periods of five to eight years. These leases are with various counterparties.
Term loans
Loan payable in monthly instalments of R0,4 million. R30
1 June 2018
SA prime minus 1,30% 27 –
Amortising term loan repayable in quarterly instalments. This loan is secured by a charge over assets with a book value of R46 million (BIM = Banco International Mozambique prime rate). MET 59
9 April 2014
BIM plus 1,00% 18 19
Amortising term loan repayable in quarterly instalments of MGA 624 million. The loan is secured by the relevant assets and in addition, €2,2 million guarantee from a bank.
MGA 4 915
17 August 2014 11,00% 18 23
Phaello senior secured notes R30028 March
2016JIBAR
plus 1,65% 300 –
The book value of assets encumbered in favour of the above term loans and finance lease and instalment sales agreements amounts to R660 million (2011: R566 million).

132 KAP Integrated Annual Report 2012
NOTES TO THEANNUAL FINANCIAL STATEMENTS for the year ended 30 June 2012 (continued)
Facility million
Maturity date
Interest rate
2012Rm
2011Rm
19. INTEREST-BEARING LOANS AND BORROWINGS (continued)
19.3 Loan details (continued)
Unsecured
Amortising term loan 1 250 15 December
2018 JIBAR
plus 3,10% 1 259 –
The loan is repayable in semi-annual instalments, with the final instalment due on 15 December 2018. The loan is repayable in the following instalments: R75 million in December 2012; R100 million in June 2013; R100 million in December 2013; R125 million in June 2014; R125 million in December 2014; R125 million in June 2015; R125 million in December 2015; R100 million in June 2016; R100 million in December 2016; R75 million in June 2017; R75 million in December 2017; R75 million in June 2018; R50 million in December 2018.
Revolving term loan 1 50015 December
2016 JIBAR
plus 2,85% 1 510 –
Any portion of the loan is repayable on one month’s prior notice by KAP on any interest date in multiples of R10 million. The maturity date is 15 December 2016.
Medium-term loan facility 80015 December
2014 JIBAR
plus 2,60% 805 –
Any portion, or the entire loan, is repayable on at least six months prior notice by KAP on any interest date. The maturity date is 15 December 2014.
Overnight or short-term facility 650 On demand 6,33% 73 –
This loan is repayable on demand. The interest rate is reset when JIBAR changes. It will be reviewed on an annual basis from January 2013.
Steinhoff International Holdings Limited and its subsidiaries – – various – 2 984
Unitrans Share Trust – – – 24 15
Other loans – various various 72 31
4 138 3 100
Current interest-bearing loans and borrowings
Other – various various 5 6
5 6

KAP Integrated Annual Report 2012 133
Annual Financial Statements
2012Rm
2011Rm
20. EMPLOYEE BENEFITS
Performance-based bonus accrual 110 83
Christmas bonus accrual 43 37
Leave pay accrual 90 80
Retirement post-retirement medical obligation 10 -
Other 23 91
Total liability 276 291
Transferred to short-term employee benefits (264) (291)
Long-term employee benefits 12 –
20.1 Defined contribution plans
The group has various defined contribution plans which employees contribute to. The assets of these schemes are held in administered trust funds separate from the group’s assets.
20.2 Post-retirement medical benefits
Acquired through business combinations 10 –
Contributions paid (1) –
Interest costs 1 –
Balance at the end of the year 10 –
The principle actuarial assumptions applied in determination of fair value of all the obligations include:
2012 %
2011%
Health-care cost inflation 6,7 –
Discount rate 8,1 –
Percentage married at retirement 90,0 –
Retirement age 63 years –
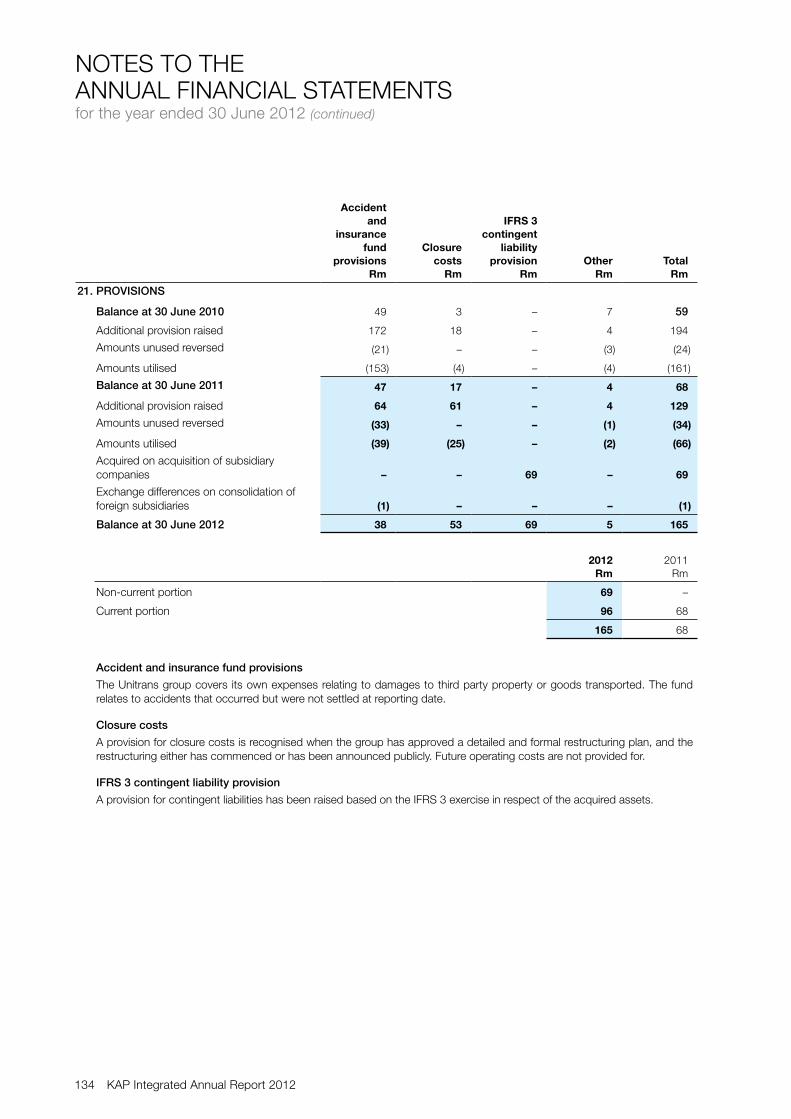
134 KAP Integrated Annual Report 2012
NOTES TO THEANNUAL FINANCIAL STATEMENTS for the year ended 30 June 2012 (continued)
Accident and
insurance fund
provisionsRm
Closure costs
Rm
IFRS 3 contingent
liability provision
Rm Other
Rm Total
Rm
21. PROVISIONS
Balance at 30 June 2010 49 3 – 7 59
Additional provision raised 172 18 – 4 194
Amounts unused reversed (21) – – (3) (24)
Amounts utilised (153) (4) – (4) (161)
Balance at 30 June 2011 47 17 – 4 68
Additional provision raised 64 61 – 4 129
Amounts unused reversed (33) – – (1) (34)
Amounts utilised (39) (25) – (2) (66)
Acquired on acquisition of subsidiary companies – – 69 – 69
Exchange differences on consolidation of foreign subsidiaries (1) – – – (1)
Balance at 30 June 2012 38 53 69 5 165
2012Rm
2011Rm
Non-current portion 69 –
Current portion 96 68
165 68
Accident and insurance fund provisions
The Unitrans group covers its own expenses relating to damages to third party property or goods transported. The fund relates to accidents that occurred but were not settled at reporting date.
Closure costs
A provision for closure costs is recognised when the group has approved a detailed and formal restructuring plan, and the restructuring either has commenced or has been announced publicly. Future operating costs are not provided for.
IFRS 3 contingent liability provision
A provision for contingent liabilities has been raised based on the IFRS 3 exercise in respect of the acquired assets.

KAP Integrated Annual Report 2012 135
Annual Financial Statements
2012Rm
2011Rm
22. TRADE AND OTHER PAYABLES
Trade payables 1 871 912
Accruals 350 256
Derivative financial liabilities (note 15) 1 –
Other payables and amounts due 246 181
Related party payables (note 29) 26 41
Trade and other payables (financial liabilities) 2 494 1 390
Short-term equalisation of operating lease payments 1 –
Taxation payable 24 9
Value-added taxation payable 65 58
2 584 1 457
The fair value of trade and other payables is disclosed in note 15.
23. SHARE SCHEME SETTLEMENT PROVISION
Certain of the Steinhoff Industrial employees were on the Steinhoff share rights scheme and executive share rights scheme prior to the reverse acquisition transaction. These employees will retain their benefits which they had prior to the acquisition under this scheme until the schemes are completed.
23.1 Steinhoff share rights scheme
At the annual general meeting of Steinhoff International Holdings Limited on 1 December 2003, a new share incentive scheme was approved and implemented. Share rights granted annually until December 2009 fell under the rules of this scheme. Scheme rules included measurement of share price growth and headline earnings growth over a three-year period against the companies included in the INDI 25 Index, as well as reaching annual incentive bonus targets and continued service conditions.
Only one share grant remains unvested under this scheme and vesting may occur on 1 December 2012.
Steinhoff Executive Share Right Scheme
At the annual general meeting of Steinhoff International Holdings Limited on 6 December 2010, a new share incentive scheme was approved and implemented. The share rights granted annually since this meeting are subject to the following scheme rules:
(a) Rights are granted to qualifying senior executives on an annual basis.
(b) Vesting of rights occur on the third anniversary of grant date, provided performance criteria as set by Steinhoff’s remuneration committee at or about the time of the grant date have been achieved.
(c) In the event of performance criteria not being satisfied by the third anniversary of the relevant annual grant, all rights attaching to the particular grant will lapse.

136 KAP Integrated Annual Report 2012
NOTES TO THEANNUAL FINANCIAL STATEMENTS for the year ended 30 June 2012 (continued)
23. SHARE SCHEME SETTLEMENT PROVISION (continued)
Reconciliation of rights granted under the Steinhoff share rights schemes2012
Rights2011
Rights
Balance at the beginning of the year 9 763 039 9 055 989
Forfeited during the year (3 337 745) (2 273 358)
Granted during the year 1 814 530 2 374 306
Transferred (out)/in during the year (1 195 702) 606 102
Balance at the end of the year 7 044 122 9 763 039
2012
Rm2011
Rm
Charged to profit or loss 23 17
Assumptions
The fair value of services received in return for share rights granted is measured by reference to the fair value of the share rights granted. The estimated fair value of the services received is measured based on the assumption that all vesting conditions are met and all employees remain in service. The pricing model used was the Black-Scholes model. The volatility was estimated using the Steinhoff daily closing share price over a rolling three-year period.
Fair value of Steinhoff share rights and assumptions 2011grant
2010grant
2009 grants
2008 grant
Fair value at measurement date R21,30 R19,74 R6,98
to R11,07 R2,87
Share price at grant date R23,40 R21,50 R13,96
to R18,84 R9,74
Exercise price R0,005 R0,005 R0,005 R0,005
Expected volatility 28,53% 23,80%40,93%
to 49,80% 64,09%
Dividend yield 3,20% 2,91%4,84%
to 5,86% 3,67%
Risk-free interest rate 6,12% 6,41%7,82%
to 8,29% 8,53%
Option life 3 years 3 years 3 to 3,4
years 3 years
Steinhoff share scheme settlement provision affecting equity
Options granted under the share schemes are subject to a recharge arrangement whereby the company is required to pay Steinhoff the subscription price of shares granted to employees, equivalent to the quoted market price of such shares on the vesting date when the shares are secured by the company for delivery to the employees less the option subscription price payable by the employees.
This recharge arrangement does not impact on profit or loss, as the share scheme settlement provision is raised through equity.

KAP Integrated Annual Report 2012 137
Annual Financial Statements
23. SHARE SCHEME SETTLEMENT PROVISION (continued)
The fair value of the share scheme settlement liability is determined based on the Black-Scholes Model. The fair value of the liability is remeasured at each statement of financial position date and at settlement date. The model inputs at 30 June 2012 were as follows:
2011 grant 2010 grants 2009 grants
2012 2012 2011 2012 2011
Share price R24,65 R24,65 R22,99 R24,65 R22,99
Exercise price R0,005 R0,005 R0,005 R0,005 R0,005
Term 29 months 17 months 29 months 5 months 17 months
Volatility 22,2% 22,2% 24,4% 22,2% 24,4%
Dividend yield 4,4% 4,9% 3,8% 7,6% 4,2%
Risk-free interest rate 5,5% 5,5% 6,7% 5,5% 6,2%
2012Rm
2011Rm
24. COMMITMENTS AND CONTINGENCIES
24.1 Capital expenditure
Contracts for capital expenditure authorised 218 149
Capital expenditure authorised but not contracted for 19 114
24.2 Borrowing facilities
In terms of the Memorandum of Incorporation, the borrowing powers of the company are unlimited.
24.3 Unutilised borrowing facilities at 30 June 1 469 2 032
24.4 Operating leases
Property Rm
Plant, equipment,
vehicles and other
2012Total
Rm
2011Total
Rm
Amounts outstanding under non-cancellable operating lease agreements payable within the next year and thereafter:
Next year 54 60 114 117
Within two to five years 130 118 248 254
Thereafter 55 5 60 44
Balances denominated in currencies other than South African Rands were converted at the closing rates of exchange ruling at 30 June 2012.

138 KAP Integrated Annual Report 2012
NOTES TO THEANNUAL FINANCIAL STATEMENTS for the year ended 30 June 2012 (continued)
24. COMMITMENTS AND CONTINGENCIES
24.5 Capital expenditure
Certain companies in the group are involved in disputes where the outcomes are uncertain. However, the directors are confident that they will be able to defend these actions and that the potential of outflow or settlement is remote and, if not, that the potential impact on the group will not be material.
Certain former effluent dams may require rehabilitation should environmental regulations change. A provision of R5 million has been raised for the potential rehabilitation costs.
There is no other litigation, current or pending, which is considered likely to have a material adverse effect on the group.
The group has a number of guarantees and sureties outstanding at year-end. However, the directors are confident that no material liability will arise as a result of these guarantees and sureties.
The group has issued cross-suretyships to various banks for the banking facilities available to the group.
24.6 Steinhoff Guarantees
Steinhoff Africa Holdings (Pty) Limited (Steinhoff Africa), has with the assistance of its parent group and certain KAP subsidiaries entered into various funding facilities and programmes, which enabled Steinhoff Africa in providing KAP with a shareholders financing facility.
The newly-acquired subsidiaries of KAP International Holdings Limited have provided suretyships, guarantees and indemnities in respect of the liabilities of Steinhoff and Steinhoff Africa Holdings (Pty) Limited in respect of pre-existing funding and other funding.
Steinhoff Africa has advised that the aggregate contingent exposure in terms of the suretyships, guarantees and indemnities provided, does not exceed R5 800 million. Steinhoff Africa has also indemnified the new subsidiaries of KAP and has undertaken to hold them harmless against any claim which may be made against them in terms of such suretyships, guarantees and indemnities provided.
Given that the net asset value (“NAV”) of Steinhoff Africa is significantly higher than the aggregate contingent exposure, that the Steinhoff Group has guaranteed repayment of portions of the pre-existing funding and other funding, the benefits arising from the cost of funding from Steinhoff and the fact that Steinhoff Africa also remains bound as guarantor of some of the existing funding arrangement of the new KAP subsidiaries, KAP has agreed to keep these arrangements in place.
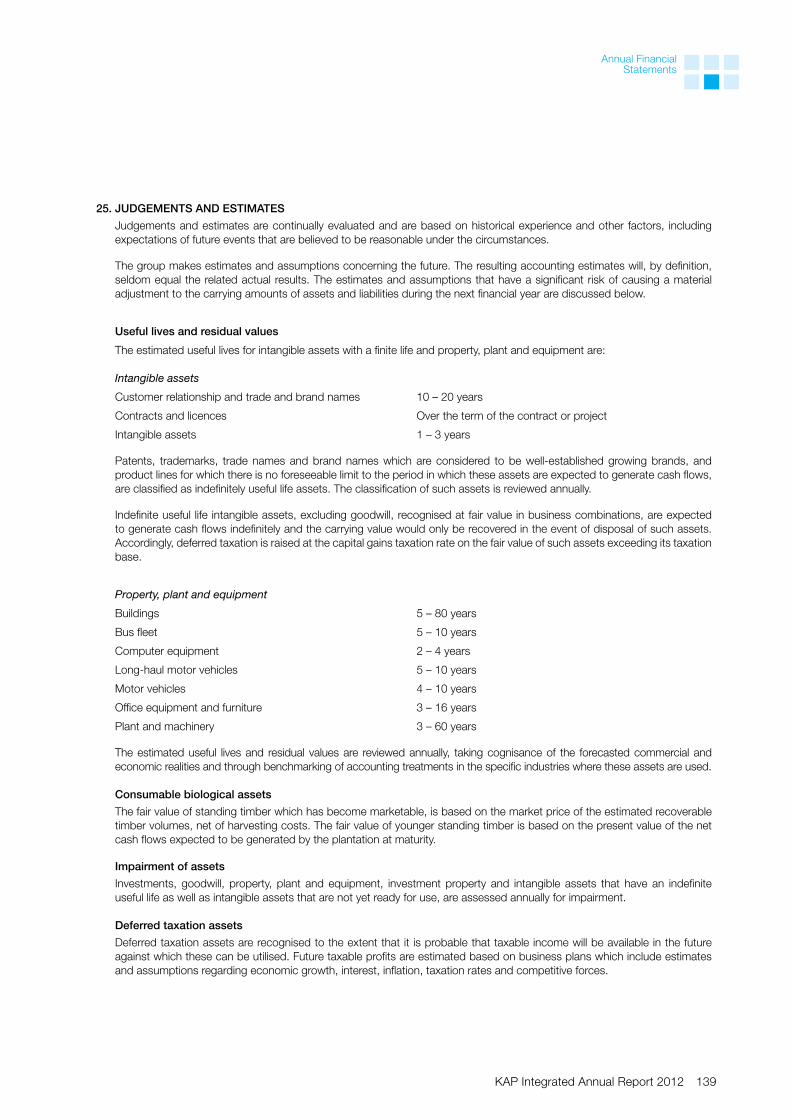
KAP Integrated Annual Report 2012 139
Annual Financial Statements
25. JUDGEMENTS AND ESTIMATES
Judgements and estimates are continually evaluated and are based on historical experience and other factors, including expectations of future events that are believed to be reasonable under the circumstances.
The group makes estimates and assumptions concerning the future. The resulting accounting estimates will, by definition, seldom equal the related actual results. The estimates and assumptions that have a significant risk of causing a material adjustment to the carrying amounts of assets and liabilities during the next financial year are discussed below.
Useful lives and residual values
The estimated useful lives for intangible assets with a finite life and property, plant and equipment are:
Intangible assets
Customer relationship and trade and brand names 10 – 20 years
Contracts and licences Over the term of the contract or project
Intangible assets 1 – 3 years
Patents, trademarks, trade names and brand names which are considered to be well-established growing brands, and product lines for which there is no foreseeable limit to the period in which these assets are expected to generate cash flows, are classified as indefinitely useful life assets. The classification of such assets is reviewed annually.
Indefinite useful life intangible assets, excluding goodwill, recognised at fair value in business combinations, are expected to generate cash flows indefinitely and the carrying value would only be recovered in the event of disposal of such assets. Accordingly, deferred taxation is raised at the capital gains taxation rate on the fair value of such assets exceeding its taxation base.
Property, plant and equipment
Buildings 5 – 80 years
Bus fleet 5 – 10 years
Computer equipment 2 – 4 years
Long-haul motor vehicles 5 – 10 years
Motor vehicles 4 – 10 years
Office equipment and furniture 3 – 16 years
Plant and machinery 3 – 60 years
The estimated useful lives and residual values are reviewed annually, taking cognisance of the forecasted commercial and economic realities and through benchmarking of accounting treatments in the specific industries where these assets are used.
Consumable biological assets
The fair value of standing timber which has become marketable, is based on the market price of the estimated recoverable timber volumes, net of harvesting costs. The fair value of younger standing timber is based on the present value of the net cash flows expected to be generated by the plantation at maturity.
Impairment of assets
Investments, goodwill, property, plant and equipment, investment property and intangible assets that have an indefinite useful life as well as intangible assets that are not yet ready for use, are assessed annually for impairment.
Deferred taxation assets
Deferred taxation assets are recognised to the extent that it is probable that taxable income will be available in the future against which these can be utilised. Future taxable profits are estimated based on business plans which include estimates and assumptions regarding economic growth, interest, inflation, taxation rates and competitive forces.

140 KAP Integrated Annual Report 2012
NOTES TO THEANNUAL FINANCIAL STATEMENTS for the year ended 30 June 2012 (continued)
25. JUDGEMENTS AND ESTIMATES (continued)
Contingent liabilities
Management applies its judgement to the factual patterns and advice it receives from its attorneys, advocates and other advisers in assessing if an obligation is probable, more likely than not, or remote. This judgement application is used to determine if the obligation is recognised as a liability or disclosed as a contingent liability.
Contingent assets
Management applies its judgement to the fact patterns and advice it receives from its attorneys, advocates and other advisers in assessing if a receivable is probable, more likely than not, or remote. This judgement application is used to determine if the receivable is recognised as an asset or disclosed as a contingent asset.
Valuation of equity compensation benefits
Management classifies its share-based payment scheme as an equity-settled scheme based on the assessment of its role and that of the employees in the transaction. In applying its judgement, management consulted with external expert advisers in the accounting and share-based payment advisory industry. The critical assumptions as used in the valuation model are detailed in note 18 and 23.
Post-employment benefit obligations
In applying its judgement to defined benefit plans, management consulted with external expert advisers in the accounting and post-employment benefit obligation industry.
Provision for bad debts
The provision for bad debts was based on a combination of specifically identified doubtful debtors and providing for older debtors.
Fair values in business combinations
Management uses valuation techniques to determine the fair value of assets and liabilities acquired in a business combination. Fair value of property, plant and equipment is determined by using external valuations as well as rental return on property.
Although a comprehensive valuation exercise is performed for each business combination, the group applies initial accounting for its business combinations which will allow the group a period of one year after the acquisition date to adjust the provisional amounts recognised for a business combination.

KAP Integrated Annual Report 2012 141
Annual Financial Statements
2012Rm
2011Rm
26. CASH GENERATED FROM OPERATIONS
Operating profit 1 187 872
Adjusted for:
Depreciation and amortisation 632 575
Net of fair value adjustments of consumable biological assets and decrease due to harvesting (131) (125)
Negative goodwill (93) –
Share-based payment expense 23 17
Other non-cash adjustments 9 150
Cash generated before working capital changes 1 627 1 489
Working capital changes
Increase in inventories (11) (53)
Decrease/(increase) in trade and other receivables 185 (87)
Decrease in assets held for sale – 1
Increase in net derivative financial assets (9) (2)
Increase in non-current and current provisions 28 9
Decrease in non-current and current employee benefits (54) (47)
Decrease in deferred government grants (1) (3)
Increase in trade and other payables 141 153
Net changes in working capital 279 (29)
Cash generated from operations 1 906 1 460

142 KAP Integrated Annual Report 2012
NOTES TO THEANNUAL FINANCIAL STATEMENTS for the year ended 30 June 2012 (continued)
27. NET CASH FLOW ON BUSINESS COMBINATIONS
On 2 April 2012 KAP International Holdings Ltd acquired all equity interests in the Steinhoff Industrial assets from Steinhoff Africa Holdings (Pty) Limited. IFRS 3 defines the acquirer in a business combination as the entity that obtains control. Guidance in IFRS 3 concludes that the transaction qualifies as a reverse acquisition and that the Steinhoff Industrial assets is therefore the accounting acquirer and KAP the accounting acquiree.
Effectively the financial results reflect the Steinhoff Industrial assets acquiring KAP International Holdings Limited and fair valued assets and liabilities as at 2 April 2012.
The fair value of assets and liabilities assumed at date of acquisition was: KAP Rm
OtherRm
2012Rm
2011Rm
Assets
Intangible assets 63 – 63 1
Property, plant and equipment 1 038 43 1 081 21
Investment property 39 – 39 –
Consumable biological assets – 74 74 –
Deferred taxation assets 28 – 28 6
Intergroup loans – 88 88 –
Cash on hand 43 – 43 –
Liabilities
Interest-bearing loans and borrowings (62) – (62) –
Deferred taxation liability (51) (26) (77) –
Bank overdrafts and short-term facilities (297) (3) (300) –
Working capital 695 3 698 (1)
Non-controlling interests (46) – (46) –
Total assets and liabilities acquired 1 450 179 1 629 27
Deemed non-cash consideration in terms of reverse acquisition rules (1 357) – (1 357) –
(Negative goodwill)/goodwill at acquisition (93) 1 (92) 4
Total consideration – 180 180 31
Settled with loan account – (180) (180) –
Cash and cash equivalents on hand at acquisition (43) – (43) –
Net cash (inflow)/outflow on acquisition of subsidiaries (43) – (43) 31

KAP Integrated Annual Report 2012 143
Annual Financial Statements
27. NET CASH FLOW ON BUSINESS COMBINATIONS (continued)
The carrying value of identifiable assets and liabilities immediately prior to the acquisition was: KAP Rm
OtherRm
2012Rm
2011Rm
Assets
Goodwill 67 – 67 –
Intangible assets 1 – 1 1
Property, plant and equipment 890 43 933 21
Investment property 39 – 39 –
Consumable biological assets – 74 74 –
Deferred taxation assets 28 – 28 6
Intergroup loans – 88 88 –
Cash on hand 43 – 43 –
Liabilities
Interest-bearing loans and borrowings (62) – (62) –
Deferred taxation liability (35) (26) (61) –
Bank overdrafts and short-term facilities (297) (3) (300) –
Working capital 788 3 791 (1)
Non-controlling interests (47) – (47) –
Total assets and liabilities acquired 1 415 179 1 594 27
28. NET CASH FLOW ON DISPOSAL OF SUBSIDIARIES AND BUSINESSES
2012Rm
2011Rm
The carrying values of assets and liabilities disposed of at the date of disposal were:
Assets
Intangible assets – 2
Property, plant and equipment – 2
Deferred taxation assets 9 1
Inventories – 14
Trade and other receivables 13 1
Liabilities
Interest-bearing loans and borrowings (22) 4
Trade and other payables, related party payables and provisions – (1)
Carrying value of assets and liabilities disposed – 23
Profit on disposal – 10
Proceeds on disposal – 33
Related party loan accounts – (10)
Net cash inflow on disposal of subsidiaries – 23

144 KAP Integrated Annual Report 2012
NOTES TO THEANNUAL FINANCIAL STATEMENTS for the year ended 30 June 2012 (continued)
29. RELATED PARTY TRANSACTIONS
Related party relationships exist between shareholders, subsidiaries, joint venture companies and associate companies within the group.
These transactions are concluded at arm’s length in the normal course of business. All material intra-group transactions are eliminated on consolidation.
Trading transactions
The following is a summary of material transactions with related parties, associate companies and joint venture companies during the year and receivables and payables balances at year-end:
2012Rm
2011Rm
Related party loans payable:
JD Group Limited and its subsidiaries – 2
Steinhoff International Holdings Limited and its subsidiaries 3 671 2 997
3 671 2 999
Related party payables:
JD Group Limited and its subsidiaries (4) –
Steinhoff International Holdings Limited and its subsidiaries (22) (41)
(26) (41)
Related party receivables:
JD Group Limited and its subsidiaries 38 –
Steinhoff International Holdings Limited and its subsidiaries 8 175
46 175
Dividends paid to:
Steinhoff International Holdings Limited and its subsidiaries* 298 –
Sales to:
JD Group Limited and its subsidiaries (75) (129)
Steinhoff International Holdings Limited and its subsidiaries (2) (3)
(77) (132)
Net operating fees (including administration and management fees) paid to:
Steinhoff International Holdings Limited and its subsidiaries 12 1
Net rent received/(paid):
JD Group Limited and its subsidiaries (1) –
Steinhoff International Holdings Limited and its subsidiaries 2 –
1 –
Net rebates and settlement discounts paid to/(received from):
JD Group Limited and its subsidiaries 4 –
Steinhoff International Holdings Limited and its subsidiaries (97) (89)
(93) (89)
Net finance costs paid to:
JD Group Limited and its subsidiaries 2 –
Steinhoff International Holdings Limited and its subsidiaries 292 239
294 239
* Pre-acquisition date of KAP

KAP Integrated Annual Report 2012 145
Annual Financial Statements
Ownership
2012%
2011%
30. MATERIAL SUBSIDIARIES
Feltex Holdings (Pty) Limited 100 –
Feltex Fehrer (Pty) Limited 74 –
PG Bison Holdings (Pty) Limited 100 100
PG Bison Limited 100 100
Unitrans Holdings (Pty) Limited 100 100
Unitrans Supply Chain Solutions (Pty) Limited 100 100
Unitrans Passenger (Pty) Limited 100 100
31. DIRECTORS’ REMUNERATION
EXECUTIVE DIRECTORS
2012 Name
Basic R
Company contributions
RBonuses
R
Other benefits
RTotal
R
P C T Schouten1&2 1 747 504 426 400 1 624 953 46 729 3 845 586
K J Grové3&4 592 569 96 382 – – 688 951
J P Haveman2 1 404 497 315 013 870 841 58 503 2 648 854
3 744 571 837 795 2 495 794 105 232 7 183 391
1 Resigned on 25 April 20122 Paid by KAP International Holdings (Pty) Limited3 Appointed on 25 April 20124 Paid by Unitrans Holdings (Pty) Limited
2011 Name
Basic R
Company contributions
RBonuses
R
Other benefits
RTotal
R
P C T Schouten 1 995 153 519 574 855 045 – 3 369 772
J P Haveman 1 303 087 322 274 558 507 – 2 183 868
3 298 240 841 848 1 413 552 – 5 553 640

146 KAP Integrated Annual Report 2012
NOTES TO THEANNUAL FINANCIAL STATEMENTS for the year ended 30 June 2012 (continued)
2012 2011
NON-EXECUTIVE DIRECTORS
Service as a director
R
Service on committees
RTotal
R
Total
R
D M van der Merwe1 88 000 22 500 110 500 80 000
K E Schmidt 99 340 128 352 227 692 159 167
U Schäckermann 99 340 40 204 139 544 111 333
C J H van Niekerk 19 233 – 19 233 –
A B la Grange1 19 233 – 19 233 13 500
J de V du Toit 11 181 – 11 181 –
P K Quarmby 660 1 648 2 308 –
S H Müller 660 296 956 –
C E Daun2 189 716 – 189 716 160 000
M J Jooste1 88 000 – 88 000 95 000
J B Magwaza 88 000 127 000 215 000 162 000
S H Nomvete 100 000 40 500 140 500 98 000
F Möller3 87 340 – 87 340 70 000
I N Mkhari 76 000 37 500 113 500 110 000
D Konar4 – – – 41 667
966 703 398 000 1 364 703 1 100 667
1 Paid to Steinhoff International Holdings Limited as management fees.2 Paid to Daun & Cie AG.3 Paid to KAP Textile Holdings Limited.4 Prescribed officer.
All remuneration disclosed above was paid to directors in respect of services rendered as directors/prescribed officers of the company.

KAP Integrated Annual Report 2012 147
Annual Financial Statements
Effective date – annual periods
commencing on or after
32. NEW ACCOUNTING PRONOUNCEMENTS
At the date of authorisation of these annual financial statements, there are standards and interpretations in issue but not yet effective. These include the following standards and interpretations that have not been early adopted and may have an impact on future financial statements:
IFRS 9 Financial Instruments 1 January 2015
IFRS 10 Consolidated Financial Statements 1 January 2013
IFRS 11 Joint Arrangements 1 January 2013
IFRS 12 Disclosure of Interests in Other Entities 1 January 2013
IFRS 13 Fair Value Measurement 1 January 2013
IAS 1 Presentation of Financial Statements: Presentation of items of other comprehensive income 1 July 2012
IAS 19 Employee Benefits 1 January 2013
IAS 27 Separate Financial Statements 1 January 2013
IAS 28 Investments in Associates and Joint Ventures 1 January 2013
IAS 32 Financial Instruments: Presentation: Offsetting financial assets and financial liabilities 1 January 2013
32.1 IFRS 9
In October 2010, the IASB issued an expanded and amended version of IFRS 9 Financial Instruments (IFRS 9). The statement addresses the classification and measurement of financial assets and financial liabilities. The new standard enhances the ability of investors and other users of financial information to understand the accounting of financial assets and financial liabilities and aims to reduce complexity. As the entire statement has not been finalised (e.g. hedge accounting), the group will first assess the standard in its entirety before adopting it.
32.2 IFRS 10, IFRS 11, IFRS 12, IAS 27 and IAS 28
In May 2011, the IASB issued IFRS 10 Consolidated Financial Statements (IFRS 10), IFRS 11 Joint Arrangements (IFRS 11) and IFRS 12 Disclosure of Interest in Other Entities (IFRS 12). These statements supersede IAS 27 Consolidated and Separate Financial Statements (IAS 27), IAS 28 Investments in Associates (IAS 28), IAS 31 Interest in Joint Ventures (IAS 31), SIC 12 Consolidation: Special Purpose Entities and SIC 13 Jointly Controlled Entities: Non-monetary Contributions by Venturers. In June 2012, the IASB published amendments to the transition guidance of IFRS 10, IFRS 11 and IFRS 12. These amendments will be adopted with the relevant IFRS. These IFRS redefine the principles of consolidation and the methods of consolidation. The group is in the process of analysing the impact of the standards and determining when it will adopt the standards.
148 KAP Integrated Annual Report 2012
32. NEW ACCOUNTING PRONOUNCEMENTS (continued)
32.3 IFRS 13
In May 2011, the IASB issued IFRS 13 Fair Value Measurement. This IFRS defines fair value, provides a single framework for measuring fair value and requires disclosures about fair value measurement. The standard applies to other IFRS that require or permit fair value measurements or disclosures about fair value measurements. The group is in the process of analysing the impact of the standard and determining when it will adopt the standard.
32.4 IAS 1 (revised)
In June 2011, the IASB issued IAS 1 Presentation of Financial Statements: Presentation of items of other comprehensive income. The amendment focuses on improving how items of other comprehensive income are presented in order to facilitate the assessment of their impact on the overall performance of an entity. The main change required from the amendment is that entities group items presented in other comprehensive income on the basis of whether they are potentially reclassifiable to profit or loss subsequently. The group is in the process of analysing the impact of the standard and determining when it will adopt the standard.
32.5 IAS 19 (revised)
In June 2011, the IASB revised IAS 19 Employee Benefits. The revision eliminates the corridor method (deferral of gains and losses on measurement of the defined benefit liability) in order to improve comparability and faithfulness of presentation. The revision streamlines the presentation of changes in assets and liabilities arising from defined benefit plans, including requiring the remeasurements to be presented in other comprehensive income thereby separating these changes from those of the entity’s day-to-day operations. The group is in the process of analysing the impact of the standard and determining when it will adopt the standard.
32.6 IAS 32 (revised)
In December 2011, the IASB issued amendments to IAS 32 Financial Instruments: Presentation (IAS 32) and IFRS 7. The amendment requires entities to disclose gross amounts subjetc to rights of set-off, amounts set off in accordance with the accounting standards, and the related net credit exposure. This information will help investors to understand the extent to which an entity has set off in its statement of financial position and the effects of rights of set-off on the entity’s rights and obligations. The group is in the process of analysing the impact of the standard and determining when it will adopt the standard.
NOTES TO THEANNUAL FINANCIAL STATEMENTS for the year ended 30 June 2012 (continued)

KAP Integrated Annual Report 2012 149
Shareholder InformationANNEXURE A
SHAREHOLDERS’ PROFILE as at 30 June 2012
SHAREHOLDERS’ PROFILE as at 30 June
2012 2011
Directors of subsidiaries of the group1 No. of shares % No. of shares %
Litkie G S 2 135 051 0,09 2 135 051 0,5
Balladon M 2 000 000 0,09 2 000 000 0,5
White P 1 004 950 0,04 1 004 950 0,2
Pollock B 150 000 0,01 150 000 0,04
Totals 5 290 001 0,23 5 290 001 1,24
2012
Public/non-public shareholdingNo. of
shareholders %No. of
shares %
Steinhoff International Holdings Limited2 1 0,04 1 445 902 054 61,86
Directors of the company and its subsidiaries 4 0,17 5 290 001 0,23
Non-public shareholders 5 0,21 1 451 192 055 62,09
Public shareholders 2 354 99,79 886 062 613 37,91
Totals 2 359 100,00 2 337 254 668 100,00
2012
Breakdown of beneficial shareholders holding 1% or more No. of shares %
Steinhoff International Holdings Limited2 1 445 902 054 61,86
Daun & Cie AG 175 524 828 7,51
Investec 120 046 847 5,14
Government Employees Pension Fund 90 106 772 3,86
Eskom Pension and Provident Fund 39 461 221 1,69
Metal and Engineering Industries Fund 28 113 462 1,20
Totals 1 899 155 184 81,26
Breakdown of institutional shareholders holding 1% or more
Investec Asset Management 386 234 576 16,53
Brewin Dolphin Securities Limited Global Custody account 175 017 544 7,49
Public Investment Corporation 77 773 920 3,33
Argon Asset Management 27 341 437 1,17
Totals 666 367 477 28,51
1 The issued share capital of the company was increased from 424 473 657 as at 30 June 2011 to 2 337 254 668 as at 30 June 2012.
2 Shares held via Ainsley Holdings (Pty) Ltd, a subsidiary of Steinhoff Africa Holdings (Pty) Ltd.

150 KAP Integrated Annual Report 2012
SPECIAL RESOLUTIONS passed during the year ended 30 June 2012
Authorisation for:1. KAP International Holdings Limited
Registration Number 1978/000181/06
2 December 2011
– The acquisition by the company and any of its subsidiaries of shares issued by it.
– The remuneration of the non-executive directors for the period from 1 July 2011 to the 2012 annual general meeting.
– In terms of section 45(3)(a)(ii) of the Companies Act, the provision by the company of financial assistance to any company or corporation which is related or inter-related to the company, until the 2012 annual general meeting.
18 January 2012
– Conversion of the company’s authorised and issued share capital from ordinary shares of par value into ordinary shares of no par value.
– The increase of the authorised ordinary no par value shares of the company by the creation of a further 4 800 000 000 authorised ordinary no par value shares so as to result in an authorised share capital of 6 000 000 000 ordinary shares of no par value.
– The issue by the company of 1 912 781 011 shares of no par value to Steinhoff Africa Holdings (Pty) Ltd at a subscription price of R2,50 as part settlement of the acquisition consideration for the Steinhoff Industrial assets.
– Approval of financial assistance in terms of section 45 of the Companies Act to subsidiaries, related and inter-related entities.
2. PG Bison Africa (Pty) Ltd
Registration number 1997/008086/07
11 August 2011
– The change of name from Rotique Timbers (Natal) (Pty) Ltd to PG Bison Africa (Pty) Ltd.
3. SHF Raw Materials (Pty) Ltd
Registration number 1988/070308/07
26 August 2011
– The change of name from Gommagomma (Pty) Ltd to SHF Raw Materials (Pty) Ltd.
4. Thesen Timber Marketing (Pty) Ltd
Registration number 1982/005168/07
30 September 2011
– The change of name from House of york (Pty) Ltd to Thesen Timber Marketing (Pty) Ltd.
5. Group subsidiaries: Financial Assistance
During October and November 2011, shareholders of a number of group subsidiaries passed special resolutions in accordance with the provisions of section 45(3) (a) (ii) of the Companies Act and renewed their authorisation of the provision by such subsidiaries of direct or indirect financial assistance to related or inter-related companies for a period of two years.

Annual general meeting Wednesday, 14 November 2012 at 10:00
Record date for name change* Friday, 11 January 2013
Announcement of interim results Tuesday, 19 February 2013
Announcement of annual results and anticipated declaration of dividend/distribution Tuesday, 20 August 2013
Annual general meeting Tuesday, 19 November 2013 at 10:00
* Name change subject to shareholder approval.
SHAREHOLDERS’ DIARy
CORPORATE INFORMATION
KAP International Holdings LimitedBusiness addressBlock D, De WagenwegStellentia RoadStellenbosch7600
Postal addressPO Box 18Stellenbosch7599
Telephone+21 21 808 0900
Facsimile+27 21 808 0901
Websitewww.kap.co.za
Registered address28 Sixth StreetWynberg, Sandton 2090PO Box 1955Bramley2018
Registration number1978/000181/06
Share codeKAP
ISINZAE00059564
Company secretarySteinhoff Africa Secretarial Services(Proprietary) Limited28, Sixth Street, Wynbeg, Sandton 2090PO Box 1955, Bramley 2018
External auditorsDeloitte & Touche
Internal auditorsKPMG
SponsorPSG Capital (Proprietary) LimitedFirst Floor, Ou Kollege35 Church StreetStellenbosch7600
PO Box 7403Stellenbosch7599
Telephone +27 21 227 9602
Facsimile +27 21 887 9624
BankersFirst Rand Bank LimitedNedbank LimitedThe Standard Bank of South AfricaLimitedInvestec Bank Limited
Transfer secretariesComputershare InvestorService (Proprietary) LimitedGround Floor70 Marshall Street Johannesburg2001
PO Box 61051Marshaltown2107
Telephone+21 11 370 5000
Facsimile +27 11 688 7710
www.kap.co.za