annual financial report 2018 - kap...kap ag i annual financial report 2018 2 – – in the meeting...
TRANSCRIPT

ANNUAL FINANCIAL REPORT 2018

KAP AG I ANNUAL FINANCIAL REPORT 2018
1
– –
REPORT OF THE SUPERVISORY BOARD Dear Shareholders,
For our company, the 2018 financial year was a very successful one – both in terms of operations as well as strategy. The growth achieved in revenue and in the core key performance indicator – normalised EBITDA – demonstrates that KAP AG is on the right course. The foundation of this course is the segment strategy which the Management Board consistently implements together with the newly appointed segment managers and which also promises further profitable growth over the coming years.
Collaboration with the Management Board
In the year under review, the Supervisory Board discharged the duties incumbent upon it in accordance with the law, the Articles of Association and the rules of the company with the greatest possible care. We collaborated closely with the Management Board and advised in the strategic development of the company as well as the material individual measures. The collaboration between the Management Board and Supervisory Board was always conducted in a trusting and open atmosphere. This was based on detailed written and oral reports by the Management Board, which were submitted during and outside the meetings of the Supervisory Board. In addition, there was also a regular exchange between the Chairman of the Supervisory Board and the Chairman of the Management Board outside the Supervisory Board meetings. In this way, we were always informed about all relevant economic key figures, the economic development in the markets relevant to the KAP Group and about deviations from short-, medium- and long-term planning. The Supervisory Board was thus always informed about the intended business policy, the profitability of the company, the risk situation including risk management, compliance and corporate planning including financial, investment, sales and personnel planning.
The Supervisory Board was always involved at an early stage in decisions of major importance. To the extent that decisions or measures taken by the Management Board required the approval of the Supervisory Board by law, the Articles of Association or the rules of the company, we examined the proposed resolutions in detail, discussed them in detail and always gave our approval.
Focus of Supervisory Board meetings
The Supervisory Board came together for a total of six meetings throughout the year under review. In these meetings, we dealt with the detailed reports of the Management Board on the course of business, in particular with the current revenue and earnings development, the opportunities and risks of business development, the major planned or ongoing investments and the situation of the company as a whole. All members of the Supervisory Board took part in at least half or more of the meetings in the 2018 financial year. No committees were formed.

KAP AG I ANNUAL FINANCIAL REPORT 2018
2
– –
In the meeting on 9 February 2018, we first intensively dealt with the provisional figures from the 2017 financial year as well as the realised one-time and special effects. Furthermore, our discussions with the Management Board covered investment planning for 2018 and possible optimisation measures within the portfolio. The Supervisory Board also approved the new segment and reporting structure based on five segments and supported the proposal to establish adjusted EBITDA as the central reporting and management indicator in the future.
In the meetings on 25 and 30 April 2018, in the presence of the auditor, we dealt comprehensively with the annual financial statements and the consolidated financial statements for 2017, the management report and the group management report, the corporate social responsibility (CSR) report and the proposal for the appropriation of profits. The auditor explained the audit report including the focal points of the audit. We also concluded the Report of the Supervisory Board. In the meeting on 25 April, the Management Board also reported – based on provisional figures – on the development in the first quarter of 2018 and provided an update on the optimisation measures within the portfolio. Further points on the agenda included acquisition, financial and liquidity planning for the 2018 financial year, as well as the further development of the risk management system and a report on the status quo with regard to compliance. We approved, without reservation, the recommendation to change the name of the company to KAP AG. Finally, we reorganised the delegation of duties within the Management Board.
In the meeting on 16 May 2018, we focused intensively on the takeover of the Heiche Group as well as the possible financing for the transaction and the impact the takeover would have on the liquidity situation of the KAP Group.
In the meeting on 20 July 2018, the focus was on the current development of business in the first half of 2018. An additional focal point of the meeting was the further planning for 2018, including the progress of the optimisation measures under consideration within the portfolio and the acquisition opportunities. We dealt extensively with digitisation and the implementation of Industry 4.0 solutions within the industrial group and with strategic approaches to further expand the innovative strength of the individual segments. We also dealt with the operative implementation of the segment strategy, the further orientation of the company on the capital market and the development of a new equity story.
The report of the Management Board on the development in the first nine months of 2018 was the subject of our discussions in the meeting on 5 December 2018. Furthermore, we discussed with the Management Board the budget plans for the 2019 financial year and the strategic development within the segments and the KAP Group as a whole. Another topic was the development of the liquidity and financing of the company. The Management Board also reported on the current status of the realignment on the capital market and the intensification of investor relations activities.
Corporate governance
The principles of sound corporate governance are given considerable importance at KAP AG and within the Supervisory Board. The further development of corporate governance

KAP AG I ANNUAL FINANCIAL REPORT 2018
3
– –
and compliance with the recommendations of the government commission on the German Corporate Governance Code (DCGK) were a focal point of our audit and advisory activities in the past financial year. At the meeting on 5 December 2018, after extensive discussion with the Management Board, we adopted the updated Compliance Statement in accordance with § 161 of the AktG on the basis of the DCGK as amended on 7 February 2017.
In the year under review, the Supervisory Board was not aware of any conflicts of interest on the part of individual members. None of the members of the Supervisory Board performs any executive or advisory duties for material competitors of the company.
Audit of annual financial statements and consolidated financial statements
BDO AG Wirtschaftsprüfungsgesellschaft, Hamburg, Germany, the auditing firm appointed by this year’s Annual General Meeting, has audited the annual and consolidated financial statements prepared by the Management Board, including the management report and group management report for the 2018 financial year of the group and the individual company together with the accounting department. As a result, it can be stated that the company has complied with the rules of the German Commercial Code (HGB), the German Stock Corporation Act (AktG) and the International Financial Reporting Standards (IFRS) as applicable in the European Union. The auditor did not raise any objections and issued unqualified audit opinions for both financial statements.
The annual and consolidated financial statements, including the management report and group management report, the proposal for the appropriation of profits, the non-financial declaration and the auditor’s reports, were made available to all members of the Supervisory Board in good time and were examined and discussed in detail with the Management Board and the auditor at the meeting on 25 March 2019. The auditor reported on the results of the audit and was available to answer additional questions and provide information. Key audit matters were one of the focal points. Based on the final results of our own examinations, we approved the results of the audit by the auditor and raised no objections.
The Supervisory Board approved the annual financial statements of KAP AG prepared by the Management Board and the consolidated financial statements of the KAP Group at its meeting on 25 March 2019 to approve the balance sheet. The annual financial statements for 2018 of KAP AG have thus been adopted. We approve the Management Board’s proposal for the appropriation of retained earnings, which provides for the distribution of a dividend of €2.00 per share.
At the meeting on 25 March 2019, the two final candidates will personally present themselves to the Supervisory Board. One candidate will then be selected and proposed to the Annual General Meeting for election as the new auditor.
Changes in the Supervisory Board and Management Board
The shareholders of KAP AG appointed Fried Möller to the Supervisory Board at the Annual General Meeting on 20 July 2018. Due to the previous court appointment by the Fulda district court, Mr Möller had been a member of the Supervisory Board since 7

KAP AG I ANNUAL FINANCIAL REPORT 2018
4
– –
December 2017. Mr Pavlin Kumchev (Carlyle) has resigned from his post with effect from 28 February 2019 for reasons of professional change.
With effect from 1 May 2018, we appointed Dr Alexander Riedel to the Management Board. Dr Riedel took over the position of Chief Financial Officer (CFO), which had been vacant since André Wehrhan resigned from the position in December 2017 and which was temporarily taken over by CEO Guido Decker. Dr Riedel’s areas of responsibility include finance, IT, compliance, personnel and property.
Thanks
The Supervisory Board would like to thank the members of the Management Board, the managing directors of our subsidiaries and all employees for their commitment and hard work in the 2018 financial year.
Fulda, 25 March 2019
For the Supervisory Board
Christian Schmitz
Chairman of the Supervisory Board

KAP AG I ANNUAL FINANCIAL REPORT 2018
5
– –
CORPORATE GOVERNANCE The corporate governance report of the KAP Group takes into account the recommendations of the German Corporate Governance Code (DCGK) and is made in connection with the corporate governance statement in accordance with § 289f and § 315d of the German Commercial Code, which is published on the website of the company. In particular, it contains the declaration of compliance in accordance with § 161 of the German Stock Corporation Act (AktG). The declaration on corporate governance also a part of the group management report.
The Management Board and Supervisory Board of KAP AG are committed to responsible and value-oriented corporate governance. Sound corporate governance is the basis for a sustainable increase in the company’s value, and it also plays a role in strengthening the trust placed in us by our customers, business partners, investors and employees. For the implementation of sound corporate governance, the Management Board and Supervisory Board are guided by the recognised standards of the DCGK. In the 2018 financial year, the Management Board and Supervisory Board of KAP AG gave particular attention to the corporate governance of KAP AG and the KAP Group, as well as the content, recommendations and suggestions of the DCGK. There were no changes in this regard compared to the previous year. On 6 December 2018, the Management Board and the Supervisory Board jointly submitted the following declaration of compliance, which is permanently available to the public on the company’s website at www.kap.de/investor-relations/corporate-governance/entsprechenserklaerung.html.
Declaration of compliance of the Management Board and Supervisory Board in accordance with § 161 of the German Stock Corporation Act (AktG)
Declaration by the Management Board and Supervisory Board of KAP AG in accordance with § 161 of the AktG on the recommendations of the government commission on the German Corporate Governance Code (hereafter ‘DCGK’) in its version from 7 February 2017, published in the Federal Gazette (Bundesanzeiger) on 24 April 2017
I. During the period since the submission of the last declaration of compliance in December 2017, KAP AG (formerly KAP Beteiligungs-AG) has been in compliance with the recommendations of the German Corporate Governance Code of the government commission on the German Corporate Governance Code in its version from 7 February 2017, published in the Federal Gazette (Bundesanzeiger) on 24 April 2017, with the following exceptions listed and justified under section II, clauses1 though 9.
II. In the future, KAP AG will comply with all recommendations of the DCGK of the government commission on the German Corporate Governance Code in its version from 7 February 2017, published in the Federal Gazette (Bundesanzeiger) on 24 April 2017, with the following exceptions:
1. Clause 4.2.51, paragraph 2, recommends that the remuneration report also 1 Clauses without citation are those from the Corporate Governance Code in its version from 7 February 2017.

KAP AG I ANNUAL FINANCIAL REPORT 2018
6
– –
contain information as to the nature of the fringe benefits provided by the company.
Because the company does not provide any fringe benefits, no information can be provided in this regard.
2. Clause 4.2.5, paragraphs 3 and 4, recommends which information is to be provided in the remuneration report for each member of the Management Board and the use of model tables in paragraph 4.
We consider the presentation of Management Board remuneration used to date in the group management report to be informationally sufficient.
3. Clause 5.1.2, paragraphs 1 and 2, recommends that the Supervisory Board also keep diversity in mind with regard to the composition of the Management Board. The Supervisory Board determines target values for the proportion of women on the Management Board.
Due to the current size of the Management Board, which consists of two members, filling leadership functions in the company is currently not carried out under consideration of diversity. For the same reason, no target values are determined for the proportion of women on the Management Board.
4. Clause 5.3.1 recommends that the Supervisory Board form expert and qualified committees independent of the specific situation of the company and the number of Supervisory Board members.
The six-person Supervisory Board makes the formation of committees superfluous, as decisions can be made quickly and efficiently. There are therefore no audit committees (clause 5.3.2) and no nomination committees (clause 5.3.3).
5. Clause 5.4.1, paragraph 2, recommends that the Supervisory Board name specific targets for its composition which, in consideration of the company-specific situation, take into account the international activities of the company, potential conflicts of interest the number of independent Supervisory Board members within the meaning of clause 5.4.2, an age limit to be determined for Supervisory Board members and a standard limit to be determined for the length of service on the Supervisory Board, as well as diversity. For exchange-listed companies which are subject to the German co-determination act (Mitbestimmungsgesetz), the co-determination act for the mining, iron and steel industries (Montan-Mitbestimmungsgesetz) or the supplement to the co-determination act (Mitbestimmungsergänzungsgesetz), the Supervisory Board is to be made up of at least 30% women and at least 30% men. For the other companies covered by the German equal opportunity act (Gleichstellungsgesetz), the Supervisory Board determines target values for the proportion of women.
The determination of specific targets for the composition of the Supervisory Board is too strong of a limitation for our company for the search and selection

KAP AG I ANNUAL FINANCIAL REPORT 2018
7
– –
of suitable candidates for the Supervisory Board in consideration of the company-specific situation, and could automatically exclude potentially suitable candidates. When filling positions on the Supervisory Board of KAP AG, it is important for the Supervisory Board – in accordance with the requirements of laws governing stock corporations – that the candidate possess the necessary skills, knowledge and experience for the work of the board. Due to the small number of members of the Supervisory Board, KAP AG is of the opinion that the composition of the Supervisory Board should continue to give decisive consideration to professional suitability regardless of gender. There will therefore be no determination of an absolute number of female Supervisory Board members at KAP AG. Furthermore, we are of the opinion that a standard limit for the length of service on the Supervisory Board does not represent an appropriate criterion for the search or exclusion of members of these boards. Selection criteria are rather – as previously mentioned – the necessary knowledge, skill and professional experience. A determination of an age limit for members of the Supervisory Board has been provided for in the rules of the Supervisory Board and is taken into consideration.
6. Clause 5.4.1, paragraph 3, sentence 2, recommends that the targets of the Supervisory Board (clause 5.4.1, paragraph 2) and the status of the implementation be published in the corporate governance report.
As corresponding targets have not been determined, there is therefore no presentation in a corporate governance report.
7. Clause 5.4.4 recommends that Management Board members not be permitted to become Supervisory Board members within two years from the end of their appointment, unless their selection to the Supervisory Board is based on a nomination of shareholders holding more than 25% of the voting rights in the company.
If a nomination is made by shareholders holding more than 25% of the voting rights in the company, the appointment of a Management Board member to the Supervisory Board of the company will be supported if the Management Board member concerned also otherwise fulfils the professional and personal qualifications.

KAP AG I ANNUAL FINANCIAL REPORT 2018
8
– –
8. Clause 5.4.6, paragraph 3, sentence, 1, recommends that the remuneration of the members of the Supervisory Board be reported individually and broken down by components in the notes or in the management report.
The individual Supervisory Board remuneration can be gathered from the Articles of Association and the information in the group management report.
9. Clause 7.1.2, sentence 3, recommends that the consolidated financial statements be made available to the public within 90 days from the end of the financial year and the interim financial statements within 45 days from the end of the reporting period.
The consolidated financial statements and the interim financial statements are presented within the statutory periods, which we consider to be sufficient.
KAP AG
Fulda, December 2018
Management Board Supervisory Board

KAP AG I ANNUAL FINANCIAL REPORT 2018
9
– –
1. Declaration on corporate governance in accordance with § 289f and § 315d of the German Commercial Code
You can find the declaration on corporate governance in accordance with § 289f and § 315d of the German Commercial Code – which contains comprehensive information on corporate governance, the description of the working methods of the Management Board and Supervisory Board and other information on practised corporate governance at KAP AG and the KAP Group – on our website at www.kap.de/investor-relations/corporate-governance/erklaerung-zur-unternehmensfuehrung.html.
2. Compliance
Compliance refers to compliance with national and international legal requirements as well as internal regulations. We see compliance as a group-wide measure for compliance with law, regulations and internal company guidelines, which is an essential element of corporate governance and corporate culture, and which must be observed in every area of day-to-day actions within the group. We have defined the basis for this in our Code of Conduct, which is available to be viewed on our website at https://www.kap.de/investor-relations/corporate-governance/verhaltenskodex.html. Compliance with these guidelines is a prerequisite for the trust placed by our business partners, shareholders and the public as a whole in the performance, value system and integrity of the KAP Group. The Code of Conduct summarises the most important behavioural principles for all employees, including the Management Board, and establishes minimum standards for respectful collaboration within our company as well as with our business partners.
To further strengthen and expand the compliance system, in addition to the Code of Conduct and the group guideline on gifts and invitations introduced in the previous financial year, we have also introduced further internal guidelines and sets of rules, such as the business partner guideline for the implementation of the anti-corruption guideline and the antitrust guideline as a means of implementing the commercial sanctions guideline. The introduction was accompanied in parallel by the continuation of our training concept to improve transparency and awareness among our employees and to strengthen the compliance culture in the form of e-learning. In the year under review, our executives, including the members of the Management Board, and the compliance officers attended events or took part in web-based training sessions.

KAP AG I ANNUAL FINANCIAL REPORT 2018
10
– –
Moreover, in the 2018 reporting year, we also replaced our telephone-based whistle-blower system, which introduced several years ago, with an online system. In doing so, we also comply with the recommendation included in clause 4.1.3 of the German Corporate Governance Code for the year under review that employees or third parties be given the opportunity to report legal violations within the company anonymously and in a protected and appropriate manner. The whistle-blower system is operated by a German third-party provider in compliance with the highest IT and data protection standards.
In the past financial year, we also devoted more attention to the topics of data protection and IT security. As such, training was offered in the form of web seminars and e-learning. In the coming financial year, we intend to further expand our data protection and IT security concept.

KAP AG I ANNUAL FINANCIAL REPORT 2018
11
– –
GROUP MANAGEMENT REPORT
1. Principles of the group
1.1. Business model of the group
Group structure
We are an exchange-listed industrial group with its headquarters in Fulda, Germany. The group offers the leading platform for creating market leaders amongst Germany’s SMEs. As the parent company, KAP AG assumes superordinate functions such as strategic company development, further development and the creation of our segment strategy based on a sustainable operating buy-and-build approach, as well as central functions in the areas of controlling, corporate governance, investor relations, finances, treasury, legal and administration.
Our business operations are aligned with clearly identified and growing niche markets and are currently made up of the following segments: engineered products, flexible films, it/services, surface technologies and precision components. The division of operating activities into these five segments was established in 2017, with the creation of our segment strategy. Since 1 January 2018, our reporting has been carried out based on the new segment structure, the result being that this report deviates from the presentation in Annual Report 2017. Our segments are managed by segment managers – in place for the first time in the 2018 financial year – who are independently responsible for implementing the segment strategy on the basis of comprehensive individual road maps. The purchase of raw materials and services, production and transport to the customer are carried out decentrally by our operating subsidiaries, which have excellent industry-specific expertise.

KAP AG I ANNUAL FINANCIAL REPORT 2018
12
– –
Structure of the KAP Group in 2018
Management Board
Guido Decker (CEO) Dr Alexander Riedel (CFO)
Responsibilities: Responsibilities:
- Strategy – Finances - Business development – IT - M & A – Compliance - Investor relations – Personnel - Controlling
Segment manager
Alberto Tavares
Segment manager
Frederik Schaefer
Segment manager
Dr Hartmut Sauer
Nicolai Baum
Segment manager
Michael Kienle
Segment manager
Michael Kastrup
engineered products
flexible films surface
technologies it/services
precision components
43.4% revenue share1 22.7% revenue
share1 11.1% revenue share1 4.8% revenue
share1 17.4% revenue share1
1 Share in total revenue in the 2018 financial year
Segments
In the engineered products segment, we develop, produce and sell technical textiles and threads around the world with chemical and physical conditioning that offer characteristic performance for our customers’ products. Our products are used in a wide range of industries. Thanks to their light weight and innovative production processes, the list of applications is constantly growing as an increasing number of traditional materials are replaced. This makes technical textiles a material of the future. They have applications in mobility, energy, construction and medicine, for example.
Our coating technology experts in the flexible films segment develop, produce and sell flexible films for our customers for a wide range of applications. Our product portfolio ranges from flexible packaging materials for the consumer goods industry and products for medical technology and the entertainment sector, to the construction industry and digital imaging.
In our newest surface technologies segment, we develop highly specialised surface solutions for metallic materials for our customers and implement these in highly efficient

KAP AG I ANNUAL FINANCIAL REPORT 2018
13
– –
processes. We serve a wide range of end markets such as the food industry, furniture, machine engineering, electronics and mobility.
By establishing the it/services segment, we combined our software development and machine engineering knowledge into one to create a unique source of expertise for digitisation and Industry 4.0 solutions. In our estimation, no other SME unites these skills under one roof. In addition to traditional open-source software solutions and services for anything involving the use of machines, we want to make our own production facilities fit for the age of digitisation by developing new business models for both ourselves and for SME customers and creating value-adding solutions.
With our precision components segment, we offer highly precise products for use in special electric or electromechanical drives, which are made of plastic or plastic/metal compounds. The portfolio includes highly precise gearwheels and adjoining metal products, which are used in e-bikes, among other things.
Change in the portfolio
When developing our segment strategy, we rely both on internal as well as external growth. At the same time, we optimise our portfolio and – following intensive review – are divesting ourselves of our activities in markets that are no longer within our strategic focus.
In July 2018, we acquired 100% of shares in the Heiche Group, headquartered in Schaigern, Germany. With this transaction to acquire the market leader in technological innovation and the customer-specific development of surface solutions for major customers, we are continuing the expansion of our newest surface technologies segment. In October 2018, we also signed an agreement to increase our existing shareholding in Now Contec GmbH & Co. KG and Convert Vliesveredlung GmbH & Co. KG to 74% each. The transaction, with which we are further strengthening our flexible films segment, was completed with effect from 14 December 2018.
With the sale of Geiger Fertigungstechnologie GmbH in July 2018, we streamlined our portfolio and, as planned, have eliminated the share of sales in our industrial group that depends on the combustion engine. The purchaser of our 100% interest was the Chinese company Zhejiang Tieliu Clutch Co., Ltd., based in Hangzhou, China.
Further information on the consolidated group can be found in the notes under note 2 ‘Consolidated group’ on page 72.
Organisational changes
Since 1 May 2018, Dr Alexander Riedel has held the position of Chief Financial Officer (CFO). He took over the position from André Wehrhahn, who resigned in December.
Locations
The KAP Group and its operating subsidiaries are represented worldwide at a total of 29 locations in 12 countries. The focus of our production activities remains in Germany, but we also have production sites in China, India, Poland, Portugal, Sweden, South Africa,

KAP AG I ANNUAL FINANCIAL REPORT 2018
14
– –
the Czech Republic, Hungary, the United States and Belarus. We also have a subsidiary in Switzerland.
1.2. Goals and strategies
The KAP Group is a specialised industrial group with a strategic focus on selected niche markets in which we develop medium-sized companies into market leaders as part of our segment strategy. In doing so, endogenous and exogenous growth leads to dynamic evolution of the product portfolio and consistent expansion of the market presence.
Our long-term business model is based on the goal of consistently pursuing our profitable growth course and – as far as possible – accelerating it with a sense of proportion. We have defined clear strategic building blocks that we intend to implement over the short to medium term.
Optimisation of operational processes: A key strategic focus is on the more effective networking of our individual subsidiaries within the segments and – in the longer term – on a structured transfer of know-how and expertise between the segments. We will analyse the potential for synergies and realise them on a consistent basis. In particular, we intend to increase productivity by exchanging best-practice approaches, gaining access to international production sites and effectively controlling costs.
Intensification of Research and Development: The strong market position of our segments is based on a technologically innovative product portfolio. We aim to significantly increase efficiency by creating joint Research and Development centres for the segments and pooling existing expertise. With joint investment programmes, we want to minimise wastage, shorten development times and drive products and solutions to market maturity more quickly – and we have a high level of internal competence to do so. Our it/services segment acts as its own think tank and can implement flagship projects relating to Industry 4.0 and big data within the segments and subsequently market them externally.
Expansion of the customer base: We want to continuously expand the range of uses for our products and open up new areas of application. To do so, we intend to focus increasingly on technological partnerships and expand joint product development with our existing and potential customers. The bundling of sales and marketing activities at the segment level also enables us to leverage the potential of existing customer relationships and acquire additional major customers.
Internationalisation: The roots of our business operations are in Germany. In the meantime, however, our operating subsidiaries are increasingly active worldwide. We see additional potential for growth in the continuous expansion both on the production as well as on the sales side.
Optimisation of the portfolio: An integral part of our segment strategy is the acquisition of further companies that either strengthen our existing segments and are active in margin-heavy niche markets or that could lead to the development of another segment in the future. Furthermore, we analyse the development of our existing subsidiaries and

KAP AG I ANNUAL FINANCIAL REPORT 2018
15
– –
divest ourselves of activities that cannot make a contribution to our sustainable growth course due to limited prospects for growth and profitability.
1.3. Control system
The corporate management of the KAP Group is aligned with the long-term corporate strategy and is also geared to the short- to medium-term goals of the group. In this way, we can adequately analyse deviations from the overarching corporate strategy and the growth, profitability and liquidity targets derived from it and counteract them with appropriate measures. The Management Board of KAP AG is responsible for the overall planning and thus for the realisation of the defined goals within the framework of the strategic corporate development on the basis of the defined segment strategy. In addition, we are in constant contact with our segment managers and the managing directors of our subsidiaries to discuss the results achieved as well as future developments.
The segments are controlled using a management reporting system on a monthly basis. In addition to an explanation of the current business situation, this system contains a fixed set of key figures with values from the income statement, the balance sheet, the liquidity forecast and the cash flow statement. We also use a tool created for this process to manage working capital on a monthly basis. The special focus of corporate management is on profitability- and liquidity-oriented key figures, including revenue, EBITDA and investments in property, plant and equipment as the most important control parameters.
1.4. Research and Development
For us as an innovative industrial group, the continuous development of new products and product groups is equally as important as the optimisation of our portfolio of existing products. Innovative products and services are the basis of our strong market position and the attractive profitability of our segments as well as our operating subsidiaries. One of our key strategic goals is therefore to use suitable measures and the launch of an innovation programme planned for 2019 to raise our innovative strength to a new level.
Our Research and Development activities are located directly in our segments or our individual subsidiaries. In this way, we ensure direct proximity to our customers and can thus advance innovative solutions to market maturity early on and together with the customer. The segment managers are responsible for the overall control and coordination of the individual activities; KAP AG itself does not conduct any Research and Development in the narrower sense.
In our engineered products segment, Research and Development activities focused on the megatrend of electromobility. The development of battery-powered electric vehicles and solutions in the field of autonomous driving requires a paradigm shift. In light of this, we participate in research projects such as ThermFire4Woven, which is funded by the European Union. In this project, together with a consortium of partner companies and institutions, we develop lightweight components with outstanding thermal/fire, chemical

KAP AG I ANNUAL FINANCIAL REPORT 2018
16
– –
and mechanical resistance. The focus here is on the development of an alternative for the battery packaging material previously used, mostly aluminium. Together with our development partners, we are focusing on the use of a compound material with an advanced textile fibre structure with better properties at competitive costs and lower weight. Weight savings also play an increasingly important role in selected areas of application in the construction industry, without our customers having to sacrifice technical performance or product service life. Together with companies from the construction sector, we develop lighter refractory and heat-resistant solutions for a wide range of applications.
In addition to specific product developments, we have invested in the optimisation of our process technologies at our site in Portugal. Among other things, we pushed ahead with digitisation and began to establish a fully automated data transfer between production facilities and the enterprise resource planning (ERP) system. This enables us to achieve greater transparency, stability, consistency and reliability in our production processes.
In our flexible films segment, we were able to push ahead with major new developments in the year under review, particularly in the important construction sector. These include innovative sealing membranes for damp rooms and interior applications, with which we can penetrate the accessories market segment. The European approvals are running according to plan and our fully self-adhesive sealing membrane is already very well received among customers. Our new developments in the demanding field of concrete casting foils, which are mainly used in civil engineering, are also nearing market launch. Another focal point was the further development of our roof and facade membranes coated with thermoplastic polyurethane (TPU). Together with major customers, we develop innovative solutions that can withstand extreme heat and high UV exposure without losing their core properties. In the field of tarpaulin materials, we have made further new developments in the area of semi-finished products for insulation laminations as well as in the field of flame-retardant, highly UV-resistant tarpaulin materials for the agricultural sector and the field of PVC-replacement tarpaulin materials for interior applications. In the year under review, we strategically expanded the area of hot-melt adhesive films, which is a completely new sales area for us.
In process optimisation, the first serial extrusion of a polyurethane (PU) on our premium coating lines enabled us to significantly reduce material consumption, realise the cost advantage associated with PU and increase our productivity accordingly.
In our surface technologies segment, we focus on the development of technologically innovative applications for sustainable markets in the fields of electromobility, environmentally friendly technologies and medical care. We further intensified our cooperation with the leading original equipment manufacturers (OEMs) in the year under review. With our first-class expertise in surface analysis, we were able to benefit accordingly from the ongoing shift of OEMs in surface development to system suppliers. In particular, large components for electromobility require a special surface treatment in order to remove oils from the component, which is usually made of aluminium, and to prepare it accordingly for subsequent laser-welding. Another focal point was thermal surface treatment. With laser-, plasma- and flame-spraying processes, we offer a technological approach which, in the preliminary tests, exhibits solid performance in

KAP AG I ANNUAL FINANCIAL REPORT 2018
17
– –
terms of corrosion protection and, above all, adhesion to aluminium (metal/plastic compound).
We have optimised our processes as part of our Research and Development activities as well, having invested in particular in the further automation of our production processes. This includes, among other things, automated individual-piece testing of the produced surfaces and the further automation of electroplating technology in the area of post-dosing and so-called blowdown.
In the year under review, the development activities in our it/services segment concentrated on the topics of big-data analytics, enterprise content management and IT service management, as well as Industry 4.0. We take on the specific requirements of our customers and consistently further develop our software solutions and consulting services. Our SAP/Pentaho connector, the only connector that extracts information from SAP systems and analyses it with data from other systems, has been distributed by Hitachi Vantara since 2018. This year we published three new versions of our monitoring solution openITCOCKPIT. Our version 3.5 includes an intuitive desktop app as well as the integration of Grafana, one of the leading platforms for data analysis and monitoring. We also made major strides in the development of the IT service management (ITSM) analytics solution openLighthouse, which began in spring 2018. In particular, the software enables multiple providers to evaluate data from different ITSM systems.
In our precision components segment, we continued our Research and Development strategy in the 2018 financial year, whereby we rely on both the implementation of our own internal projects as well as close cooperation with leading tier-one customers – whom we support in process and product development – and with universities. One focal point was the optimisation and design of the spindle assembly for one of the leading German car manufacturers. The ‘Spindel-Mutter’ unit with its division of labour is used in power steering systems and enables backlash-free movement in the temperature range from –40°C to +80°C and requires the highest degree of accuracy and durable quality without functional losses.
In total in the 2018 financial year, we invested €0.3 million in the KAP Group (previous year: €0.4 million) in our Research and Development activities.

KAP AG I ANNUAL FINANCIAL REPORT 2018
18
– –
2. ECONOMIC REPORT
2.1. Macroeconomic and industry-specific framework conditions
Economic development
The global economy continued its expansion in 2018. According to the estimates of the International Monetary Fund (IMF) in January 2019, the growth rate of gross domestic product (GDP) around the world was at 3.7%, the same as the previous year. Increasing uncertainties about the continued development of the global economy caused the growth trend to decline noticeably in the second half of the year. The deterioration in trade policy conditions had a correspondingly negative impact in this regard. Trade disputes between the United States and China, which led to protective and retaliatory tariffs, reduced planning security for companies in global trade. At the same time, the number of goods affected by these measures remained rather manageable – at least for the time being. In addition, the financial conditions for the emerging economies deteriorated due to the increasing withdrawal of international investors. Among those countries affected were Turkey and Argentina, where economic development took on almost crisis-like proportions with high inflation and a sharp slump in economic output.
Economic environment
Growth1 in 2018
Growth1 in 2017
World % 3.7 3.7
Eurozone % 1.8 2.4
Germany % 1.5 2.2
United States % 2.9 2.2
Emerging economies % 4.6 4.7
1 Real growth of the gross domestic product (GDP) Sources: International Monetary Fund (IMF): World Economic Outlook Update January 2019; Federal Statistical Office (DESTATIS): German economy grew 1.5% in 2018; Gemeinschaftsdiagnose Herbst 2018: Aufschwung verliert an Fahrt – Weltwirtschaftliches Klima wird rauer
Economic development by region
In the eurozone, GDP growth slowed from 2.4% to 1.8%, with the slowing momentum mainly being due to a weakening of exports. The growing uncertainty about the implementation of Brexit and the resulting consequences for the development of the European economies, as well as the unresolved financial crisis in Italy, led to greater restraint on the part of market participants in the second half of the year. At the beginning of the third quarter of 2018, there were also problems with the transition to the new exhaust gas test standard of the Worldwide harmonised Light vehicles Test Procedure

KAP AG I ANNUAL FINANCIAL REPORT 2018
19
– –
(WLTP) working group of the UN Economic Commission for Europe (UNECE). By contrast, investments and private consumption remained stable well into the second half of the year. The continued expansionary monetary policy of the European Central Bank (ECB) was a key pillar of the economy in 2018. Although the ECB announced that it would reduce the volume of net purchases of securities as part of the existing bond purchase programme, maturing bonds from the portfolio are to be reinvested in full in future. The average unemployment rate fell by almost one percentage point to 8.2% within a year.
The German economy grew in 2018 for the ninth consecutive year. Despite a slowdown in economic development in the course of the year, GDP rose by 1.5%, putting economic growth above the average of 1.2% for the past ten years. Compared with the years 2016 and 2017 in which the growth rate reached a value of 2.2% each, however, the upward trend has slowed significantly. Positive growth momentum came primarily from the domestic market. Private consumer spending rose by 1.0% and government consumer spending by 1.1%, but both remained behind the dynamic development of the previous year. Considerable growth rates were recorded in investments in equipment with an increase of 4.5% and in construction investments with an increase of 3.0%. At the same time, the inventories of the German economy increased. By contrast, net exports slowed German GDP by 0.2% due to a disproportionately high increase in imports (+3.4%) compared with exports (+2.4%). The number of people in employment rose by around 562,000 in 2018 to an annual average of 44.8 million. Accordingly, the unemployment rate fell to 5.2% (previous year: 5.7%).
In the United States, as a result of a tax cut package, GDP grew by 2.9% compared to 2.2% in the previous year to around USD 1.5 trillion. Nevertheless, the US economy also lost momentum in the course of the year, primarily due to the increasing uncertainty caused by the trade dispute with China. Many companies held back on investments and new orders. In contrast, the strong rise in employment remained largely unaffected, which continued until the end of the year and led to an unemployment rate of 3.9% and an increase in disposable income. The rise in the inflation rate during the year to around 3.0% at times prompted the US Federal Reserve to further tighten monetary policy in order to prevent the economy from overheating. Overall, the Fed raised the funds rate in four steps of 0.25% each in 2018. The target corridor was thus 2.25% to 2.50% at the end of the year.
GDP growth in emerging and developing countries slowed slightly compared to the previous year to 4.6%. In 2018, the rise in capital market interest rates in the United States made financial investments in emerging markets less attractive, with the result that net capital inflows there declined – in some cases significantly. This has fundamentally weakened the economic momentum of the emerging economies. In conjunction with country-specific risks, individual economies such as Argentina and Turkey experienced drastic downward trends. The emerging markets in Asia recorded a growth rate of 6.5% (previous year: 6.5%), again showing the highest level of economic momentum. China achieved a GDP increase of 6.6% after 6.9% in the previous year. The main factor behind the slowdown in the Chinese economy, which continues to grow significantly, was a noticeable decline in industrial production, particularly in the fourth quarter of 2018, as a result of weaker export business.

KAP AG I ANNUAL FINANCIAL REPORT 2018
20
– –
Development of important customer industries
Our segments and our segment companies are active in a large number of attractive market niches where they enjoy an excellent market position. Data on current developments in these markets is only available to the public to a limited extent, so that the figures given for market volume and average market development are based on a comprehensive market analysis by a major international consulting firm as well as our own estimates.
Market development of key applications
Key application Market volume 2017
Average market development
2017–2020
engineered products
Power belts, hoses and air springs for the automotive sector
€650–800 million +3–5%
Premium tyres €1,200 million +3–5%
Heavy conveyor belts €70–120 million +5–10%
Industrial adhesives and sealants n/a +3–5%
flexible films
TPU roofing membranes (Germany, Austria and Switzerland/Benelux)
€80–110 million +3–5%
Reinforced PVC pool liners (Europe)
€80–85 million +5–10%
Coated vapour barriers (Germany, Austria and Switzerland/Benelux)
€75 million +0–3%
Membranes for car transport (Europe)
€35 million >+10%
Cinema screens €18–20 million +3–5%

KAP AG I ANNUAL FINANCIAL REPORT 2018
21
– –
surface technologies
Cathodic dip coating (CDC) n/a +0–3%
Passivation n/a +3–5%
Zinc-nickel n/a +3–5%
Copper-nickel-chrome (Chrome III) n/a >+10%
it/services
Enterprise content management n/a +10%
Big-data analytics n/a +10%
precision components
Electric parking brake n/a +3–5%
Wiper system n/a +0–3%
E-bikes n/a >+10%
Electric steering adjustment n/a +3–5%
2.2. Course of business
Overall statement of the Management Board on the course of business and the economic situation1
For the KAP Group, 2018 was another very successful year. We were once again able to achieve or even slightly exceed our most important operating goals this year. Earnings before interest, taxes, depreciation and amortisation adjusted for deconsolidation proceeds (normalised EBITDA) including discontinued operations grew by 6.4% to €44.8 million and thus disproportionately to our revenue including discontinued operations, which rose by 3.6% to €422.3 million. The basis for our more-than-satisfactory development was our segment strategy established in the previous year. As expected, its consistent implementation led to a further improvement of our EBITDA margin by 0.3 percentage points to 10.6%. As a result, our most important performance indicator remained well above our minimum target of 10%. Our investments in property, plant and equipment and the level of depreciation and amortisation almost reached the previous year’s level.
1 In order to ensure comparability with the forecast for the 2018 financial year, the most important key figures are presented below including discontinued operations.
KAP AG I ANNUAL FINANCIAL REPORT 2018
22
– –
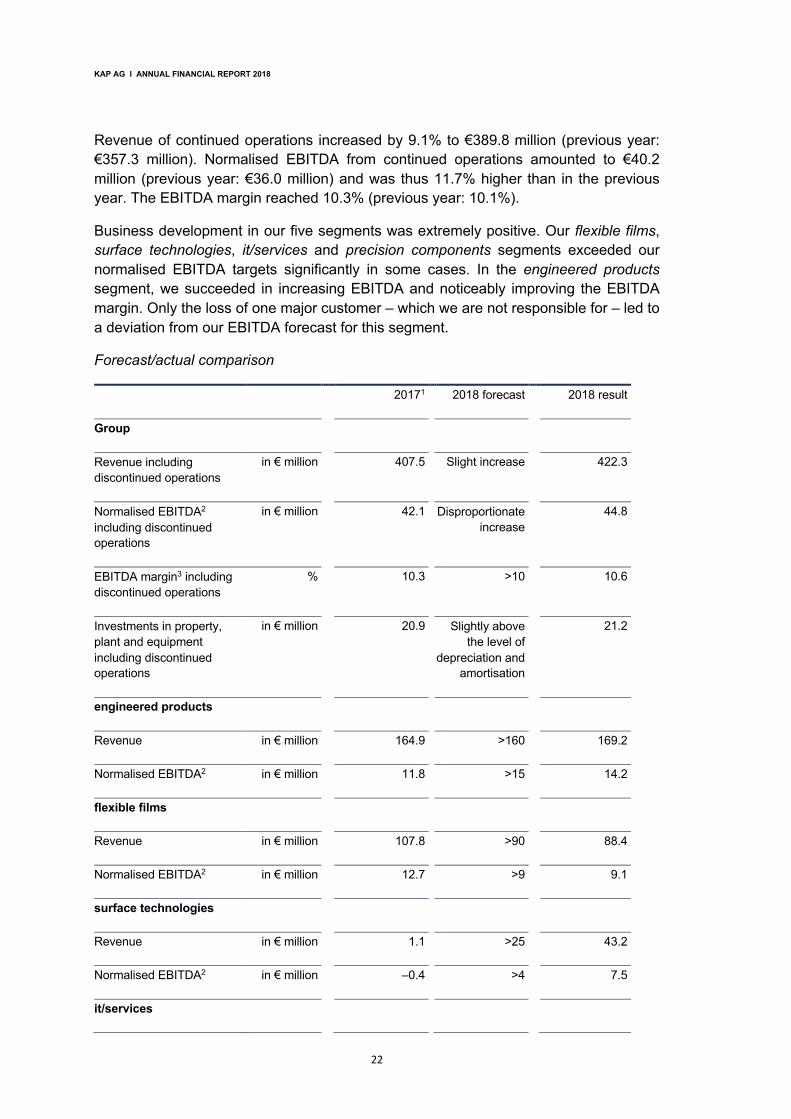
Revenue of continued operations increased by 9.1% to €389.8 million (previous year: €357.3 million). Normalised EBITDA from continued operations amounted to €40.2 million (previous year: €36.0 million) and was thus 11.7% higher than in the previous year. The EBITDA margin reached 10.3% (previous year: 10.1%).
Business development in our five segments was extremely positive. Our flexible films, surface technologies, it/services and precision components segments exceeded our normalised EBITDA targets significantly in some cases. In the engineered products segment, we succeeded in increasing EBITDA and noticeably improving the EBITDA margin. Only the loss of one major customer – which we are not responsible for – led to a deviation from our EBITDA forecast for this segment.
Forecast/actual comparison
20171 2018 forecast 2018 result
Group
Revenue including discontinued operations
in € million 407.5 Slight increase 422.3
Normalised EBITDA2 including discontinued operations
in € million
42.1 Disproportionate increase
44.8
EBITDA margin3 including discontinued operations
% 10.3 >10 10.6
Investments in property, plant and equipment including discontinued operations
in € million 20.9 Slightly above the level of
depreciation and amortisation
21.2
engineered products
Revenue in € million 164.9 >160 169.2
Normalised EBITDA2 in € million 11.8 >15 14.2
flexible films
Revenue in € million 107.8 >90 88.4
Normalised EBITDA2 in € million 12.7 >9 9.1
surface technologies
Revenue in € million 1.1 >25 43.2
Normalised EBITDA2 in € million –0.4 >4 7.5
it/services

KAP AG I ANNUAL FINANCIAL REPORT 2018
23
– –
Revenue in € million 18.5 >20 22.6
Normalised EBITDA2 in € million 1.9 >2.2 2.6
precision components
Revenue including discontinued operations
in € million 121.9 >115 100.1
Normalised EBITDA2 including discontinued operations
in € million 15.8 >13 14.9
1 Segment figures according to the segment classification which was new in 2018; deviations from the segment figures in Annual Report 2017 are possible.
2 EBITDA normalised to include severance payments (previous year also: impairment of Augsburg location, special items from the disposal of assets, unusually high expenses for warranties and restructuring, income from the reversal of provisions as well as legal and consulting costs, in particular M & A activities).
3 Normalised EBITDA/revenue.
Significant events
In line with our segment strategy, we optimised our portfolio as planned in the year under review. With the acquisition of the Heiche Group, a specialist for technologically innovative surface solutions for major customers, we have further strengthened our newest surface technologies segment. In addition, we completed the expansion of our investments in NOW Contec GmbH & Co. KG and Convert Vliesveredlung GmbH & Co. KG, which are subsumed in the flexible films segment. At the same time, the sale of Geiger Fertigungstechnologie GmbH enabled us to discontinue products directly related to the combustion engine.

KAP AG I ANNUAL FINANCIAL REPORT 2018
24
– –
2.3. Performance
2.3.1. Financial performance
Selected key indicators on financial performance
2018 2017 Change
Revenue of continued operations in € million 389.8 357.3 9.1%
Revenue of discontinued operations
in € million 32.5 50.2 –35.3%
Revenue including discontinued operations
in € million 422.3 407.5 3.6%
EBITDA of continued operations in € million 38.8 25.1 54.6%
EBITDA margin of continued operations
% 10.0 7.0 42,9
EBITDA of discontinued operations in € million 4.6 6.2 –25.8%
EBITDA including discontinued operations
in € million 43.4 31.3 38.7%
Normalised EBITDA1 including discontinued operations
in € million 44.8 42.1 6.4%
EBITDA margin2 including discontinued operations
% 10.6 10.3 2.9%
Depreciation and amortisation from continued operations
in € million 25.0 22.8 9.7%
Normalised operating result (EBIT) from continued operations
in € million 15.2 18.4 –17.4%
Operating result (EBIT) from continued operations (adjusted for deconsolidation proceeds)
in € million 13.8 2.3 >100%
Financial result from continued operations
in € million –5.2 4.3 >100%
Gains/losses from continued operations
in € million 3.6 26.7 –86.5%
Gains/losses from discontinued operations
in € million 11.1 4.3 >100%
Consolidated annual result after taxes
in € million 14.8 31.0 –52.3%

KAP AG I ANNUAL FINANCIAL REPORT 2018
25
– –
Earnings per share from continued operations
€ 0.50 4.04 >–100%
Earnings per share from discontinued operations
€ 1.55 0.64 >100%
Earnings per share including discontinued operations
€ 2.05 4.68 –56.2%
Dividend per share € 2.00 2.00 0.0%
Payout ratio (based on earnings per share including discontinued operations)
% 97.6 42.8 >100%
1 EBITDA normalised to include severance payments (previous year also: impairment of Augsburg location, special items from the disposal of assets, unusually high expenses for warranties and restructuring, income from the reversal of provisions as well as legal and consulting costs, in particular M & A activities).
2 Normalised EBITDA/revenue.
Revenue of continued operations increases by 9.1% to € 389.8 million
In the 2018 financial year, revenue of continued operations increased by 9.1% to €389.8 million (previous year: €357.3 million). The acquisition of the Heiche Group and the expansion of the shareholdings in NOW Contec and Convert had a positive effect of €22.7 million on revenue. In the year under review, there were negative (previous year: negative) exchange rate effects with a volume of €3.1 million (previous year: €1.3 million).
In regional terms, growth trends came in particular from the rest of Europe and Germany, but also from the other regions. In Germany – which remains our most important market – revenue rose by 13.1%. Our business operations in the rest of Europe and the other regions developed disproportionately well. The growth rates here were 8.8% and 44.8%, respectively, along with 3.1% in North/South America. By contrast, revenue in Asia fell by 2.8%. Overall, the foreign share of total revenue fell slightly by 1.5 percentage points to 58.5% (previous year: 60.0%).
Changes in inventories of finished goods and work in progress from continued operations increased to €3.6 million as of the balance sheet date (previous year: €1.4 million). Other own workcapitalised from continued operations decreased to €0.9 million (previous year: €3.2 million). The previous year’s figure included, among other things, plant modernisations at our locations in Portugal and the United States, which were not incurred, or were not incurred to the same extent, in the year under review. Overall, total performance rose accordingly by 9.0% to €394.3 million (previous year: €361.8 million).

KAP AG I ANNUAL FINANCIAL REPORT 2018
26
– –
Revenue by region of continued operations
2018 2017 Change
Germany in € million 161.6 142.9 13.1%
Rest of Europe in € million 149.7 137.6 8.8%
North/South America in € million 43.2 41.9 3.1%
Asia in € million 31.1 32.0 –2.8%
Other regions in € million 4.2 2.9 44.8%
Other operating income of continued operations increased by 8.5% to €14.1 million (previous year: €13.0 million). With a volume of €2.4 million (previous year: €1.0 million), income from the reversal of provisions was €1.4 million higher than in the previous year. In addition, other remaining income increased by €0.7 million to €2.5 million (previous year: €1.8 million). This includes income of €0.5 million from the earn-out agreement from the acquisition of Westernacher. Gains from the sale of assets held for sale, on the other hand, decreased by €1.2 million in the year under review (previous year: €1.2 million).
Cost-of-materials ratio of continued operations decreases by 3.1 percentage points
In the 2018 financial year, cost of materials of continued operations increased by 3.3% to €219.4 million (previous year: €212.5 million) but, in relation to the total performance of the continued business operations, the cost-of-materials ratio fell to 55.7% (previous year: 58.8%). This development shows the success of the measures introduced to increase resource efficiency in the production process of our segment companies. Accordingly, it was possible to mitigate the negative effects of higher raw material prices, which were particularly noticeable from the second quarter of 2018 onwards.
Personnel expenses of continued operations increased by 9.9% to €92.6 million (previous year: €84.3 million). This reflects the effect of the further development of the surface technologies segment. Wages and salaries paid increased by 8.4% to €76.8 million (previous year: €70.9 million). Social security contributions and expenses for pensions amounted to €15.8 million in the year under review (previous year: €13.5 million). The ratio of personnel expenses to total performance thus remained virtually unchanged at 23.5% (previous year: 23.3%).
In the year under review, other operating expenses of continued operations increased by 8.9% to €57.5 million (previous year: €52.8 million). This resulted in particular from a 35.1% increase in legal and consulting costs to €10.4 million (previous year: €7.7 million) due to the further development of our portfolio. In particular, the acquisition of the Heiche Group led to an increase in rental and leasing expenses to €2.5 million (previous year: €1.1 million).

KAP AG I ANNUAL FINANCIAL REPORT 2018
27
– –
Normalised EBITDA of continued operations increases by 11.7% to €40.2 million
Normalised EBITDA of continued operations increases by 11.7% to €40.2 million (previous year: €36.0 million) in the year under review. This growth is mainly attributable to the good operating performance of our segments, coupled with a decline in the cost-of-materials ratio and an almost constant personnel-expense ratio. With normalised EBITDA, we eliminate special and non-recurring effects from, among other things, changes in our consolidated group. In this way, we increase the transparency of the group’s operating performance and the comparability of the individual key figures over time.
Overview of special and one-time effects
2018 2017 Change
Normalised EBITDA of continued operations
in € million 40.2 36.0 11.7%
Severance payments in € million 1.4 5.0 –72.0%
Devaluation of Schäfflerbachstraße
in € million 0.0 0.4 –100.0%
Disposal of assets in € million 0.0 –0.9 +100.0%
Warranties and restructuring in € million 0.0 3.6 –100.0%
Reversal of provisions in € million 0.0 –0.8 +100.0%
Legal and consulting fees in € million 0.0 3.6 –100.0%
EBITDA adjusted for deconsolidation proceeds of continued operations
in € million 38.8 25.1 54.6%
In the 2018 financial year, depreciation and amortisation of continued operations increased by 9.7% to €25.0 million (previous year: €22.8 million). This consists of amortisation of intangible assets totalling €3.2 million (previous year: €0.7 million) as well as depreciation of property, plant and equipment in the amount of €21.5 million (previous year: €21.8 million) and investment properties in the amount of €0.3 million (previous year: €0.3 million). This includes unscheduled depreciation in connection with a fire at our location in Hungary in the amount of €0.8 million (previous year: €5.2 million).
Taking into account the deconsolidation proceeds of €23.0 million in the previous year, the operating result of continued operations, defined as earnings before interest and taxes (EBIT), amounted to €13.8 million (previous year: €2.3 million). This represents a significant increase of €11.5 million. The financial result from continued operations of €–5.2 million (previous year: €4.3 million) in the year under review contains, among other things, an interest result of €–4.2 million (previous year: €–3.9 million) as well as exchange losses in the amount of €0.3 million (previous year: €2.6 million). It should be

KAP AG I ANNUAL FINANCIAL REPORT 2018
28
– –
noted here that, in the previous year, revenue of €10.9 million was generated from the sale of securities held as current assets, which did not occur in the year under review. Adjusted for the deconsolidation proceeds in the previous year, earnings before taxes (EBT) from continued operations increased by 28.4% to €8.6 million (previous year: €6.7 million). Income taxes of continued operations increased by €2.0 million to €5.0 million (previous year: €3.0 million). The actual tax expense rose, due to a higher tax burden in Germany, to €6.0 million (previous year: €2.4 million). On the other hand, a change in the item deferred taxes from temporary valuation differences led to a positive effect of €1.1 million (previous year: €–0.7 million).
Continuation of the permanent and earnings-oriented dividend policy
The annual result for the group amounted to €14.8 million (previous year: €31.0 million). Earnings per share including discontinued operations amounted to €2.05 (previous year: €4.68). In light of this, we intend to continue our permanent dividend policy, so the Management Board and Supervisory Board will propose to shareholders at the Annual General Meeting on 3 July 2019 an unchanged dividend of €2.00 per share.
Segment development
engineered products segment
Selected key indicators on development in the engineered products segment
2018 20171 Change
engineered products
Revenue in € million 169.1 164.9 2.5%
EBITDA in € million 13.1 12.4 5.6%
Normalised EBITDA2 in € million 14.2 11.8 20.3%
EBITDA margin3 % 8.4 7.2 16.7%
Investments in € million 4.2 8.5 –50.6%
Employees 1,046 1,059 –1.2%
1 Segment figures according to the segment classification which was new in 2018; deviations from the segment figures in Annual Report 2017 are possible.
2 EBITDA before severance payments (previous year: normalised for income from the reversal of provisions and gains from the disposal of assets).
3 Normalised EBITDA/revenue.
In the 2018 financial year, revenue in the engineered products segment rose by 2.5% to €169.1 million (previous year: €164.9 million), fuelled in particular by developments in Germany, Portugal and the United States. Normalised EBITDA improved disproportionally by 20.3% to €14.2 million (previous year: €11.8 million). The significant measures taken to increase earnings at our segment company MEHLER ENGINEERED PRODUCTS took effect as planned, so that the first successes were already visible in

KAP AG I ANNUAL FINANCIAL REPORT 2018
29
– –
the second half of 2018. Accordingly, the EBITDA margin improved by 1.2 percentage points to 8.4% (previous year: 7.2%).
Investment activities focused on Portugal and China. Overall, the investment volume decreased by 50.6% to €4.2 million (previous year: €8.5 million), As of 31 December 2018, the total number of employees remained virtually unchanged at 1,046 (previous year: 1,059) in the segment.
flexible films segment
Selected key indicators on development in the flexible films segment
2018 20171 Change
flexible films
Revenue in € million 88.4 107.8 –18.0%
EBITDA in € million 9.1 11.3 –19.5%
Normalised EBITDA2 in € million 9.1 12.1 –24.8%
EBITDA margin3 % 10.3 11.2 –8.0%
Investments in € million 2.1 3.2 –34.3%
Employees 326 318 2.5%
1 Segment figures according to the segment classification which was new in 2018; deviations from the segment figures in Annual Report 2017 are possible.
2 EBITDA in the previous year normalised for income from the reversal of provisions, expenses for warranties and restructuring.
3 Normalised EBITDA/revenue.
Revenue in the flexible films segment fell by 18.0% to €88.4 million due to a change in the consolidated group (previous year: €107.8 million). In 2017, we completed the sale of our subsidiary Kirson Industrial Reinforcements GmbH, which contributed €24.4 million to revenue in the previous year. By contrast, we were able to include our two subsidiaries NOW Contec GmbH & Co. KG and Convert Vliesveredlung GmbH & Co. KG in the consolidated financial statements for a full 12 months following the acquisition of a majority interest on 30 December 2017. In the year under review, both companies contributed a total of €4.9 million to segment revenue. Normalised EBITDA decreased by 24.8% to €9.1 million (previous year: €12.1 million).
In the year under review, the segment companies invested a total of €2.1 million (previous year: €3.2 million). The main focus was on our production sites in Sweden and Nordkirchen in particular. The changes in the consolidated group led to a slight increase in the number of employees in the segment, so that as of 31 December 2018 a total of 326 people were employed (previous year: 318) in our segment.

KAP AG I ANNUAL FINANCIAL REPORT 2018
30
– –
surface technologies segment
Selected key indicators on development in the surface technologies segment
2018 20171 Change
surface technologies
Revenue in € million 43.2 1.1 Not measurable
EBITDA in € million 7.5 –0.4 >100%
Normalised EBITDA in € million 7.5 –0.4 >100%
EBITDA margin2 % 17.4 Not measurable Not measurable
Investments in € million 2.7 0.2 Not measurable
Employees 810 302 Not measurable
1 Segment figures according to the segment classification which was new in 2018; deviations from the segment figures in Annual Report 2017 are possible.
2 Normalised EBITDA/revenue.
The surface technologies segment is the newest segment within our industrial group. With the acquisition of Gt Oberflächen GmbH, Oberflächentechnik Döbeln GmbH and Metallveredlung Döbeln GmbH in November and December of last year, we have begun to develop another margin-heavy segment. In the year under review, we were able to further strengthen the segment through the acquisition of the Heiche Group. In this context, a comparison with the previous year’s figures for the segment is of little significance. Segment revenue amounted to €43.2 million in 2018, and normalised EBITDA amounted to €7.5 million. This results in an EBITDA margin of 17.4%, which means that our newly established segment has already made a significant contribution to the group margin in 2018.
The investment volume in the year under review was €2.7 million. The focus of our investing activities was on our locations in Saxony. The segment had 810 employees as of 31 December 2018.

KAP AG I ANNUAL FINANCIAL REPORT 2018
31
– –
it/services segment
Selected key indicators on development in the it/services segment
2018 20171 Change
it/services
Revenue in € million 22.6 18.5 22.2%
EBITDA in € million 2.3 2.0 15.0%
Normalised EBITDA2 in € million 2.6 1.9 36.8%
EBITDA margin3 % 11.5 10.3 11.7%
Investments in € million 0.8 3.9 –79.5%
Employees 124 126 –1.6%
1 Segment figures according to the segment classification which was new in 2018; deviations from the segment figures in Annual Report 2017 are possible.
2 EBITDA before severance payments (previous year: additionally normalised by income from the reversal of provisions and gains from the sale of assets).
3 Normalised EBITDA/revenue.
Revenue in the it/services segment rose dynamically by 22.2% to €22.6 million in the year under review (previous year: €18.5 million). The main growth drivers were projects in the areas of enterprise content management and big-data analytics. The normalised EBITDA improved to €2.6 million (previous year: €1.9 million). Accordingly, the EBITDA margin rose significantly by 1.2 percentage points to 11.5% (previous year: 10.3%).
Investment activities focused on a new software program for customer relationship management that is designed to help increase annual fees. Overall, the investment volume decreased to €0.8 million (previous year: €3.9 million). As of 31 December 2018, the total number of people employed in the segment company was 124 (previous year: 126).

KAP AG I ANNUAL FINANCIAL REPORT 2018
32
– –
precision components segment
Selected key indicators on development in the precision components segment
2018 20171 Change
precision components
Revenue in € million 67.6 71.7 –5.7%
EBITDA in € million 10.8 3.7 >100%
Normalised EBITDA in € million 10.8 3.7 >100%
EBITDA margin2 % 16.0 5.2 >100%
Investments in € million 4.7 5.2 –9.6%
Employees 630 672 –6.3%
1 Segment figures according to the segment classification which was new in 2018; deviations from the segment figures in Annual Report 2017 are possible.
2 Normalised EBITDA/revenue.
In our precision components segment, revenue decreased by 5.7% to €67.6 million in the 2018 financial year (previous year: €71.7 million). It should be noted here that, in 2018, the revenue of our discontinued operation – the divested Geiger Fertigungstechnologie GmbH – of €32.5 million (previous year: €50.2 million) is not included in segment revenue. Normalised EBITDA improved significantly by €7.1 million to €10.8 million (previous year: €3.7 million). Accordingly, the EBITDA margin increased 16.0% (previous year: 5.2%). The measures introduced in 2017 to increase profitability had a significant impact here. The closure of the Haslach site and, as a result, the discontinuation of products with low profitability resulted in a slight reduction in revenue and a significant jump in profitability of 10.8 percentage points above the target return of 10%.
In addition to our site in Pretzfeld, investment activities also focused on Hungary. Overall, the investment volume decreased to €4.7 million (previous year: €5.2 million). As a result of consolidation, the number of employees decreased by 42 to 630 as of 31 December 2018 (previous year: 672).
2.3.2. Financial performance
Principles and goals of financial management
Financial management of the KAP Group includes the procurement of equity and debt capital, liquidity management as well as the management of interest rate and currency risks. The Treasury department of KAP AG assumes the responsibility for financial management for all segments in the group. Liquidity management is primarily carried out via a central cash-pooling system with the overarching goal of ensuring that the group

KAP AG I ANNUAL FINANCIAL REPORT 2018
33
– –
and the segments always have sufficient liquidity at the lowest possible costs. The use of derivative financial instruments was dispensed with, but is reviewed on an ongoing basis. On the other hand, the optimisation of working capital is a further component of our financial management. By means of active management, we hope to make a positive contribution to the creation of additional liquid funds, to the reduction of the debt ratio and to the optimisation of the capital structure.
Off-balance-sheet financing instruments
Other financial obligations amounted to €25.9 million (previous year: €10.4 million), of which €1.5 million (previous year: €7.0 million) is allocated to the purchase commitments for property, plant and equipment and €24.4 million (previous year: €3.4 million) to obligations from rental and lease agreements.
Capital structure and liquidity
Development of net debt
2018 2017 Change
Non-current financial liabilities in € million 59.4 45.7 30.0%
+ Current financial liabilities in € million 28.1 36.9 –23.8%
Financial liabilities in € million 87.5 82.6 5.9%
– Cash and cash equivalents in € million 11.7 10.1 15.8%
Net debt in € million 75.8 72.5 4.6%
Overall, financial liabilities increased by 5.9% to €87.5 million (previous year: €82.6 million). As of 31 December 2018, liabilities to financial institutions totalled €83.1 million (previous year: €78.4 million), of which €59.0 million (previous year: €45.0 million) is allocated to liabilities with a remaining term of more than one year and €24.1 million (previous year: €33.4 million) to liabilities with a remaining term of less than one year. The majority of our liabilities to financial institutions are denominated in euros. A mere €17.5 million (previous year: €17.9 million) have been agreed in a foreign currency in China and India. The proportion of liabilities to financial institutions in the balance sheet total decreased by 0.4 percentage points to 22.1% (previous year: 22.5%). By comparison, the equity ratio was 51.6% (previous year: 44.5%).
The main component of the financing is the syndicated loan agreement concluded in 2017 with a term until 2022 and an original volume of €136.7 million (previous year: €115 million). The interest rate depends on the Euro Interbank Offered Rate (EURIBOR) and the net debt ratio. The minimum interest rate on the syndicated loan is 1.5% and the agreed margins are between 1.5% and 2.7% above EURIBOR. Overall, the interest rates that we had to pay for liabilities to financial institutions in 2018 ranged between 1.25% and 12.45% (previous year: 1.25% and 11.25%).

KAP AG I ANNUAL FINANCIAL REPORT 2018
34
– –
Taking into account cash and cash equivalents, which increased by 15.8% to €11.7 million (previous year: €10.1 million), net debt increased only slightly to €75.8 million as of the end of the 2018 financial year. This makes it clear that the portfolio optimisations and measures to increase profitability were achieved with no impact on financing.
Cash flow and investments
Selected key indicators on financial performance including discontinued operations
2018 2017 Change
Cash flow from operating activities in € million 20.7 25.3 –18.2%
Cash flow from investing activities in € million –2.3 6.4 –100.0%
Cash flow from financing activities in € million –16.6 –25.2 n/a
Net change in cash and cash equivalents in € million 1.7 6.0 –71.7%
Changes in cash and cash equivalents due to exchange rate and consolidated group changes
in € million –0.1 –0.1 0.0%
Cash and cash equivalents at end of period in € million 11.7 10.1 15.8%
Cash flow from operating activities sank by 18.2% to €20.7 million (previous year: €25.3 million). While investments in property, plant and equipment including investment property totalled €21.2 million (previous year: €21.0 million) and were therefore nearly unchanged compared to the previous year, investments in intangible assets decreased to €1.0 million (previous year: €3.6 million). The acquisition of Westernacher in the it/services segment had a corresponding effect here in the previous year. The sale of Geiger Fertigungstechnologie GmbH resulted in cash inflow of €37.3 million from the disposal of consolidated companies, compared with €22.0 million in the previous year. The cash outflow from the acquisition of new subsidiaries amounted to €19.4 million in 2018 and is attributable to the acquisition of the Heiche Group. In the previous year, the cash outflow from the addition of consolidated companies amounted to €11.9 million. In contrast to the previous year, there was no cash inflow from the sale of securities in the year under review (previous year: €18.8 million). The cash flow from investing activities (cash inflow) in the 2018 financial year thus amounted to €–2.3 million (previous year: €6.4 million).
Cash flow from financing activities totalled €–16.6 million in the 2018 financial year, compared with €–25.2 million in the previous year. The cash outflow from changes in financial liabilities amounted to €2.8 million. This was mainly due to the repayment of current liabilities to banks through scheduled repayments and the reduction of current account liabilities. The raising of non-current bank liabilities had a counteracting effect.

KAP AG I ANNUAL FINANCIAL REPORT 2018
35
– –
On 31 December 2018, cash and cash equivalents amounted to €11.7 million (previous year: €10.1 million). The free cash flow – which results from the consideration of proceeds from the disposal of property, plant and equipment and intangible assets and payments for investments in property, plant and equipment and intangible assets – totalled €0.4 million in 2018 (previous year: €2.3 million).
Calculating the free cash flow
2018 2017 Change
Cash flow from operating activities in € million 20.7 25.3 –18.2%
– Payments for investments in intangible assets in € million 1.0 3.6 –72.2%
+ Proceeds from the disposal of property, plant and equipment including investment property
in € million 1.7 1.6 6.2%
– Payments for investments in property, plant and equipment including investment property
in € million 21.2 21.0 1.0%
+ Proceeds from the disposal of financial assets in € million 0.2 0.0 n/a
– Payments for investments in financial assets in € million 0.0 0.0 0.0%
Free cash flow in € million 0.4 2.3 –82.6%
Working capital
As of 31 December 2018, the working capital decreased to €108.7 million (previous year: €110.4 million). In spite of the increase in revenue, inventories and trade receivables decreased due to active working capital management.
Working capital
2018 2017 Change
Inventories in € million 70.1 74.0 –5.3%
+ Trade receivables in € million 62.9 64.3 –2.2%
– Trade payables in € million 24.3 27.9 –12.9%
Total in € million 108.7 110.4 –1.5%

KAP AG I ANNUAL FINANCIAL REPORT 2018
36
– –
2.3.3. Financial position
At €376.0 million as of 31 December 2018, the balance sheet total of the KAP Group was €26.9 million above the figure from 31 December 2017 (€349.1 million).
Balance sheet structure – assets
2018 2017 Change
Non-current assets in € million 222.2 188.0 34.2
Intangible assets in € million 42.3 23.0 19.3
Property, plant and equipment in € million 169.0 152.8 16.2
Investment property in € million 4.7 4.9 –0.2
Other financial assets in € million 1.4 1.3 0.1
Deferred tax assets in € million 4.8 6.1 –1.3
Current assets in € million 153.8 161.0 –7.2
Inventories in € million 70.1 74.0 –3.9
Trade receivables in € million 62.9 64.3 –1.4
Income tax refund claims in € million 2.6 2.3 0.3
Other receivables and assets in € million 6.4 10.2 –3.8
Cash and cash equivalents in € million 11.7 10.1 1.6
On the assets side, non-current assets rose by €34.2 million to €222.2 million (previous year: €188.0 million). Intangible assets increased by €19.3 million to €42.3 million (previous year: €23.0 million). This reflects in particular the increase of €17.6 million in capitalised intangible assets due to customer relationships as a result of the acquisition of the Heiche Group. In light of the changes to the consolidated group, and after deduction of scheduled depreciation, property, plant and equipment increased by a total of €16.2 million to €169.0 million (previous year: €152.8 million).
Current assets decreased by €7.2 million to €153.8 million (previous year: €161.0 million). This development is mainly due to a decrease in inventories by €3.9 million to €70.1 million (previous year: €74.0 million) and a decrease in trade receivables by €1.4 million to €62.9 million (previous year: €64.3 million). Other receivables and assets sank by €3.8 million to €6.4 million (previous year: €10.2 million). In contrast, refund claims for advance income tax payments rose by €0.3 million to €2.6 million (previous year: €2.3 million). At €11.7 million as of 31 December 2018 (previous year: €10.1 million), cash and cash equivalents came in €1.6 million above the previous year’s figure.

KAP AG I ANNUAL FINANCIAL REPORT 2018
37
– –
Balance sheet structure – liabilities
2018 2017 Change
Equity in € million 194.0 155.2 38.8
Subscribed capital in € million 20.2 17.2 3.0
Capital reserve in € million 86.8 48.8 38.0
Reserves in € million –15.4 –15.1 –0.3
Retained earnings in € million 99.9 98.9 1.0
Non-controlling interests in € million 2.4 5.4 –3.0
Non-current liabilities in € million 91.1 70.8 20.3
Provisions for pensions and similar obligations in € million 18.1 18.5 –0.4
Non-current financial liabilities in € million 59.4 45.7 13.7
Deferred tax liabilities in € million 13.3 6.6 6.7
Current liabilities in € million 90.9 123.1 –32.2
Other provisions in € million 25.2 31.2 –6.0
Current financial liabilities in € million 28.1 36.9 –8.8
Trade payables in € million 24.3 27.9 –3.6
Income tax liabilities in € million 4.9 2.0 2.9
Other liabilities in € million 8.4 25.2 –16.8
On the liabilities side, the equity attributable to the shareholders of KAP increased by €41.8 million to €191.6 million (previous year: €149.8 million). The increase is mainly attributable to the capital increases against contributions in kind in connection with the acquisitions carried out, the result of which was that subscribed capital increased by €3.0 million to €20.2 million (previous year: €17.2 million) and the capital reserve increased by €38.0 million to €86.8 million (previous year: €48.8 million). Reserves declined by €0.3 million to €–15.4 million (previous year: €–15.1 million). In retained earnings, an annual result of €14.8 million exceeds the dividend payment of €14.1 million for the 2017 financial year.
Non-current liabilities increased by €20.3 million to €91.1 million (previous year: €70.8 million). Whereas provisions for pensions and similar obligations totalling €18.1 million (previous year: €18.5 million) changed only slightly, non-current financial liabilities increased significantly by €13.7 million to €59.4 million (previous year: €45.7 million).

KAP AG I ANNUAL FINANCIAL REPORT 2018
38
– –
This development reflects in particular the restructuring of the maturities of our liabilities to credit institutions to long-term financing.
By contrast, current liabilities decreased by €32.2 million to €90.9 million (previous year: €123.1 million). The €6.0 million decrease in current provisions to €25.2 million (previous year: €31.1 million) is primarily due to the €2.7 million decrease in provisions for severance payments to €1.5 million (previous year: €4.2 million) and a €1.8 million decrease in provisions for complaints, guarantees and warranties to €13.3 million (previous year: €15.1 million) as well as a €1.2 million decrease in provisions formed for restructuring expenses to €0.4 million (previous year: €1.6 million). Current financial liabilities decreased by €8.8 million to €28.1 million (previous year: €36.9 million). In addition to the €9.3 million decline in current liabilities to financial institutions to €24.1 million (previous year: €33.4 million), financial liabilities to third parties remained unchanged at €3.5 million (previous year: €3.5 million). Actual income taxes increased by €2.9 million to €4.9 million (previous year: €2.0 million) due to the tax liability determined for the financial year. The registration of the capital increases resolved in the previous year but not registered until the 2018 financial year led to a decline in other liabilities, which decreased by €8.4 million to €16.8 million (previous year: €25.2 million).
2.4. Non-financial performance indicators
2.4.1. Employees
As of 31 December 2018, we employed a total of 2,974 people – converted to full-time equivalents – in the group, totalling 117 more than in the previous year. On the one hand, this growth reflects the changes in our industrial group through the acquisition of the Heiche Group and the sale of the Geiger Group and, on the other hand, the targeted operational growth in our segments.
In the engineered products segment, the number of employees remained stable at 1,046 (previous year: 1,059). The changes in the consolidated group of the flexible films segment led to a slight increase in the number of employees in the segment, so that as of 31 December 2018 a total of 326 people were employed (previous year: 318) in this area. Our newest segment, surface technologies, had 810 employees (previous year: 302 employees) due to the dynamic segment structure resulting from the acquisitions made. In the it/services segment, the number of employees remained nearly constant at 124 (previous year: 126). As a result of the sale of Geiger Fertigungstechnologie, the number of employees in the precision components segment fell to 630 (previous year: 672).

KAP AG I ANNUAL FINANCIAL REPORT 2018
39
– –
Selected key indicators regarding employees1
2018 2017 Change
By region
Germany 1,446 1,222 18.4%
Rest of Europe 1,230 1,003 22.7%
North/South America 111 97 14.5%
Asia 148 154 –3.9%
Other regions 1 1 0.0%
Total 2,936 2,477 18.6%
By segment
engineered products 1,046 1,059 –1.2%
flexible films 326 318 2.6%
surface technologies 810 302 >100%
it/services 124 126 –1.5%
precision components 630 672 –6.2%
Total 2,936 2,477 18.6%
1 Converted to full-time equivalents; as of the end of each financial year on 31 December.
The largest increases in the number of employees were recorded in the regions Rest of Europe and North/South America. The majority of our employees continue to be employed in Germany but, as a result of our continued internationalisation, this share fell slightly by 0.1 percentage points to 49.9% (previous year: 50.0%).
Training and continuing education
The aim of our overarching personnel strategy is to position the KAP Group and its individual subsidiaries as attractive employers in an increasingly global competitive environment in order to attract the best specialists and managers. We attach great importance to an innovative corporate culture and a working environment based on transparency, openness and trust. An important benchmark for our attractiveness as an employer is the high loyalty of our employees to our industrial group.
The skills and competencies of our employees are of decisive importance for our sustainable and successful development, which is why we attach great importance to the continuous learning and individual development of our employees. In doing so, we

KAP AG I ANNUAL FINANCIAL REPORT 2018
40
– –
focus on comprehensive continuing education and training programmes and offer our employees internal development opportunities tailored to their abilities and potential.
We rely on a bundle of personnel recruitment measures for the recruitment of motivated and high-performing employees. At our German locations, we offer training in a total of 17 different professions, covering a wide range of commercial, technical and process engineering professions as well as selected IT and electrical sectors. As of 31 December 2018, we employ a total of 58 trainees in the group (previous year: 62). Based on the training programmes of our subsidiaries, we offer personal incentives such as the financing of master craftsman and technician training. Our junior managers are largely recruited from vocational academies and also from universities. In doing so, we rely on our many years of close cooperation with schools, vocational academies and universities. For example, our subsidiaries award study and development projects and support master’s theses in selected subject areas.
Diversity
We promote the diversity of our employee structure. With the combination of people from various cultures and with different abilities, experiences and outlooks, we gain a better understanding of markets and customer groups. This is an important prerequisite for the long-term success of our company. In our industrial group, we attach great importance to a climate in which diversity is practised and respect for the individual is an integral part of our corporate culture. We employ people from the most diverse cultural groups and countries as well as with different religious affiliations. In Germany alone, we employ people from 25 nations.
Even though the proportion of women in the group, especially in our Eastern European locations, is in some cases over 50% of the total workforce, the proportion of women in the technical and scientific positions that are important to us is too low. However, the proportion of female executives is encouraging. In almost all companies and locations worldwide, women are represented at the level below the company management. The main focus was on commercial positions as well as on positions in sales and quality management.
Healthcare and occupational health and safety
We promote the health and safety of our employees by utilising comprehensive health management as well as by complying with the health and safety regulations we have created on the basis of legal provisions and the specific requirements of our individual subsidiaries. Our health management programme is based on targeted analyses of clinical pictures in relation to the requirements of the various areas of activity in our subsidiaries. We carry out these analyses in partnership with occupational health practitioners. Our goal is to reduce the burden on our employees and to reduce the risks that can arise from daily work and the working environment, thereby preventively reducing time missed by our employees. Individual offers in the areas of prevention, therapy and rehabilitation are an integral part of our health management programme. Our subsidiaries are obliged to comply with the established occupational health and safety guidelines at all times and to report occupational accidents immediately. In this way, we ensure that, on the basis of comprehensive analyses of each individual accident,
KAP AG I ANNUAL FINANCIAL REPORT 2018
41
– –
we can take appropriate measures and preventively defuse existing and potential hazardous situations.
2.4.2. Remuneration report
Remuneration of the Management Board
Responsibility The structure and determination of Management Board remuneration is the responsibility of the Supervisory Board.
Goals The remuneration model for the Management Board is intended to be attractive in the competition for highly qualified executives. As an incentive for successful work, the variable portion of the remuneration should be highly dependent on the economic success of the KAP Group. The remuneration structure for the Management Board is in line with the remuneration system for employees and executives.
Remuneration elements Management Board remuneration contains fixed and variable elements as well as long-term incentives. In successful financial year, the factors which make up the variable element of remuneration enable the KAP Group to offer competitive income for the Management Board with a very high profit-sharing component. From 2019, earnings before interest, taxes, depreciation and amortisation (EBITDA) will serve as a benchmark for the variable remuneration component. The bonus is fixed for 2018.
KAP AG has maintained a virtual stock option programme with cash settlement since 2017 in which Mr Decker and Dr Riedel take part. Mr Decker was granted 100,000 virtual stock options, which are vested over a period of four years, on a one-time basis as of 1 August 2017. Upon commencement of his employment on 1 May 2018, Dr Riedel was promised 100,000 virtual stock options as of 1 November 2018 on a one-time basis, which will be earned over a period of four years from the start of service. The programme stipulates that the beneficiary receive a cash settlement from the company upon exercise of the option. The exercise date is 31 July 2021 for Mr Decker and 30 April 2022 for Dr Riedel. The cash settlement entitlement corresponds to the difference between the average share price (XETRA trading, Deutsche Börse AG, Frankfurt am Main) of the last 20 trading days prior to exercising the option and the base value of €30 (Mr Decker) or €33 (Dr Riedel). The entitlement is limited in amount to €40 per option, whereby an adjustment is made for dividend distributions made in the meantime and any dilution effects in the event of capital increases. As capital measures took place between the granting of the virtual stock options and the balance sheet date, the number of virtual stock options increased to 232,262, of which 119,562 are attributable to Mr Decker and 112,700 to Dr Riedel. As of the balance sheet date, the remaining term of the options was 31 months (Mr Decker) and 40 months (Dr Riedel). The remuneration component earned in the financial year from the stock option programme amounts to €367,903, of which €202,185 is attributable to Mr Decker and €165,718 to Dr Riedel.

KAP AG I ANNUAL FINANCIAL REPORT 2018
42
– –
A non-compete agreement is in place for a period of a year. As compensation, the Management Board receives an amount equal to 50% of the last salary and bonus.
With the approval of the Supervisory Board and on the basis of the authorisation resolution of the Annual General Meeting on 7 July 2017, Mr Decker, as the CEO of KAP AG, subscribed to 20,000 shares against cash contributions using part of the authorised capital for 2017. The new shares were issued to Mr Decker. The capital increase serves the purpose of binding the Management Board to the company as approved by the Annual General Meeting. The entry in the commercial register was made on 29 January 2018. The issue price is €33.92 per new share and corresponds to the last official closing price of the company’s shares on 29 November 2017 less a 5% discount.
With the approval of the Supervisory Board and on the basis of the authorisation resolution of the Annual General Meeting on 7 July 2017, Dr Riedel, as the CFO of KAP AG, subscribed to 18,045 shares against cash contributions using part of the authorised capital for 2017. The new shares were issued to Dr Riedel. The capital increase serves the purpose of binding the Management Board to the company as approved by the Annual General Meeting. The entry in the commercial register was made on 27 June 2018. The issue price is €33.25 per new share.

KAP AG I ANNUAL FINANCIAL REPORT 2018
43
– –
* The D & O insurance represents additional fringe benefits granted.
Name Decker, Guido Dr Riedel, Alexander Function CEO CFO Entry 1 August 2017 1 May 2018
Granted contributions
2017 2017 (min.) 2017 (max.) 2018 2018 (min.) 2018 (max.) 2017 2017 (min.) 2017 (max.) 2018 2018 (min.) 2018 (max.)
Fixed remuneration
104 104 104 296 296 296 n/a n/a n/a 208 208 208
Fringe benefits* (company car)
6 6 6 16 16 16 n/a n/a n/a 7 7 7
Total fixed remuneration
110 110 110 312 312 312 n/a n/a n/a 215 215 215
One-year variable remuneration
260 260 260 100 100 100 n/a n/a n/a 67 67 67
Total variable remuneration
260 260 260 100 100 100 n/a n/a n/a 67 67 67
Stock option plan
953 0 4,000 924 0 4,000
Total remuneration
1,323 370 4,370 412 412 412 n/a n/a n/a 1,206 282 4,282
Grants received 2017 2017 (min.) 2017 (max.) 2018 2018 (min.) 2018 (max.) 2017 2017 (min.) 2017 (max.) 2018 2018 (min.) 2018 (max.) Fixed remuneration
104 104 104 296 296 296 n/a n/a n/a 208 208 208
Fringe benefits* (company car)
6 6 6 16 16 16 n/a n/a n/a 7 7 7
Total fixed remuneration
110 110 110 312 312 312 n/a n/a n/a 215 215 215
One-year variable remuneration
160 160 160 100 100 100 n/a n/a n/a – – –
Total variable remuneration
160 160 160 100 100 100 n/a n/a n/a – – –
Stock option plan
– – – – – – n/a n/a n/a – – –
Total remuneration
270 270 270 412 412 412 n/a n/a n/a 215 215 215

KAP AG I ANNUAL FINANCIAL REPORT 2018
44
– –
Remuneration of the Supervisory Board
Remuneration regulation The current remuneration regulation is laid down in Article 13 of the Articles of Association. In addition to the reimbursement of expenses, the Supervisory Board receives a fixed remuneration.
Supervisory Board remuneration in the 2018 financial year The Supervisory Board consists of five (previous year: six) members. Each ordinary member of the Supervisory Board received €5,000 in 2018 (previous year: €5,000) and the chairman received €7,500 (previous year: €7,500). The remuneration was paid pro rata temporis. The members of the Supervisory Board received total remuneration of €28 thousand (previous year: €26 thousand).
2.4.3. Corporate social responsibility
Comprehensive information on our corporate social responsibility and other non-financial performance indicators is contained in our non-financial report pursuant to § 289 b et seq. and § 315 b et seq. of the German Commercial Code. You can find it at www.kap.de/unternehmen/vision-werte/nfe.html.
2.5. Comparability of the sustainable growth of the KAP Group
In order to assess the sustainable earnings and financial strength of the KAP Group, we have decided to determine the sustainable growth of the KAP Group in relation to the current consolidated group for the 2015 to 2018 financial years, and for the segments for the 2017 and 2018 financial years on a one-time basis. This is due in particular to changes in the segments as a result of sales and liquidations in recent years.
This is based on the following key figures: revenue, like-for-like adjusted revenue, EBITDA, like-for-like adjusted EBITDA, capital expenditure (‘capex’; investments) and trade working capital (TWC). In order to demonstrate sustainable growth, the management of the KAP Group has decided to adjust the companies that were sold or liquidated in the 2015 to 2018 financial years from the reported figures for the above-mentioned key figures. Companies that are merged with other companies remaining in the group as part of group-internal restructuring are not adjusted, as the underlying business is continued. The following overview is intended to clarify the approach:
Companies segment 2015 2016 2017 2018
ELBTAL OF AMERICA, INC. flexible films liquidation
Kirson Industrial Reinforcement GmbH flexible films sale
Caplast Türkiye Ltd. Sti. flexible films liquidation
Coatec s.r.o. flexible films liquidation
Geiger Fertigungstechnolgie GmbH1 precision components sale
Ballistic Protective Systems D.O.O. other liquidation
Ströhr & Co. Aktiengesellschaft other liquidation
All other companies continued 1 Geiger Fertigungstechnologie GmbH were adjusted for 2015 and 2016 only. 2017 and 2018 Geiger was included as a discontinued operation in 2017 and 2018.

KAP AG I ANNUAL FINANCIAL REPORT 2018
45
– –
The starting point for the calculation of like-for-like key figures for the KAP Group is the consolidated statement of income for the respective 2015 to 2018 financial years and the segment information for the respective segment in the current structure for the 2017 and 2018 financial years.
For like-for-like presentation at group level, expenses, income, capital expenditure and relevant balance sheet items for the TWC presentation of the respective companies were eliminated in a second step, taking into account relationships with other companies. All transactions between the remaining group companies and the eliminated companies were presented as if they had taken place with third parties.
For like-for-like presentation at segment level, the expenses and income of the respective companies were eliminated in a second step, taking into account relationships with other companies. All transactions between the remaining segment companies, other group companies and the eliminated companies were presented as if they had taken place with third parties.
After these adjustments were made, the adjustments made were also allocated to the individual segments according to the causation principle and adjusted.
It should be noted that, despite normalisations and adjustments, no conclusive comparability is possible, as the acquisitions of the NOW Group as of 31 December 2017 and the Heiche Group as of 1 August 2018 for twelve and five months, respectively, in 2018 have resulted in corresponding contributions from these two groups being included in the consolidated key figures (both like for like and before adjustments).
In the following, revenue is reconciled to like-for-like adjusted revenue:
(1) Mainly includes the adjustments to the sale of Kirson Industrial Reinforcement GmbH (€–27,129 thousand) and Geiger
Fertigungstechnologie GmbH (€–46,093 thousand). (2) Mainly includes the adjustments to the sale of Kirson Industrial Reinforcement GmbH (€–27,048 thousand) and Geiger
Fertigungstechnologie GmbH (€–41,182 thousand) and the liquidation of Caplast Türkiye Ltd. Sti. (€–631 thousand).

KAP AG I ANNUAL FINANCIAL REPORT 2018
46
– –
2017 2018
Segment
Revenue of the
segment Adjustments
to revenue Subtotal Consolidation/ reconciliation
Like-for-like
adjusted revenue
Revenue of the
segment Adjustments
to revenue Subtotal Consolidation/ reconciliation
Like-for-like
adjusted revenue
engineered products 164.916 0 164.916 169.148 0 169.148
flexible films 107.839 -25.088 (3) 82.751 88.447 0 88.447
it/services 18.527 0 18.527 22.578 0 22.578
surface technology 1.140 0 1.140 43.244 0 43.244
precision components 71.704 0 71.704 67.636 0 67.636
Reconciliation (previous year all other)
12 0 12 2.725 0 2.725
Subtotal 364.139 -25.088 339.051 393.778 0 393.778
Group total 364.139 -25.088 339.051 393.778 0 393.778 393.778
339.051 -6.820 332.231 393.778 -3.949 389.829
(3) Mainly includes the adjustments to the sale of Kirson Industrial Reinforcement GmbH (€–24,416 thousand) and the liquidation of
Caplast Türkiye Ltd. Sti. (€–562 thousand).
The following table shows EBITDA reconciled to like-for-like adjusted EBITDA:
(1) Mainly includes the adjustments to the sale of Kirson Industrial Reinforcement GmbH (€–3,987 thousand) and Geiger
Fertigungstechnologie GmbH (€–4,609 thousand) and the liquidation of Caplast Türkiye Ltd. Sti. (€401 thousand). (2) Mainly includes the adjustments to the sale of Kirson Industrial Reinforcement GmbH (€–4,148 thousand) and Geiger
Fertigungstechnologie GmbH (€–4,454 thousand) and the liquidation of Caplast Türkiye Ltd. Sti. (€606 thousand).

KAP AG I ANNUAL FINANCIAL REPORT 2018
47
– –
2017 2018
Segment
EBITDA of the
segment Adjustments
to EBITDA Subtotal Consolidations
Like-for-like
adjusted EBITDA
EBITDA of the
segment Adjustments
to EBITDA Subtotal Consolidations
Like-for-like
adjusted EBITDA
engineered products 12.404 -582 (3) 11.822 13.053 1.147 (8) 14.200
flexible films 11.334 -4.146 (4) 7.188 9.143 118 (9) 9.261
it/services 1.961 -23 (5) 1.938 2.299 285 (10) 2.584
surface technology -406 0 -406 7.495 0 7.495
precision components 3.694 6.704 (6) 10.398 10.826 0 10.826
Reconciliations -6.139 4.053 (7) -2.086 -6.649 5.698 (11) -951
Subtotal 22.847 6.007 28.854 36.166 7.249 43.415
Group total 22.847 6.007 28.854 36.166 7.249 43.415
28.854 2.277 31.131 43.415 2.625 46.040
(3) Mainly includes income from the reversal of provisions (€–519 thousand) and gains from the disposal of assets (€–148 thousand). (4) Includes mainly the adjustments for the liquidation of Elbtal of AMERICA, Inc. (€–137 thousand), the sale of Kirson Industrial
Reinforcement GmbH (€–4,595 thousand), expenses for warranties and restructuring (€645 thousand) and gains from the disposal of assets (€–129 thousand).
(5) Mainly includes other adjustments (€23 thousand). (6) Mainly includes severance payments for staff reductions (€4,093 thousand), gains from the disposal of assets (€–594 thousand),
income from the reversal of provisions (€–165 thousand), expenses for warranties and restructuring (€2,710 thousand) and legal and consulting costs, in particular M & A activities (€628 thousand).
(7) Mainly includes legal and consulting costs, in particular M & A activities (€2,935 thousand), severance payments for former members of the Management Board (€670 thousand) and impairment for our location in Augsburg (€373 thousand).
(8) Mainly includes severance costs (€460 thousand) and restructuring costs (€687 thousand). (9) Mainly includes the settlement of the liquidation of Caplast Türkiye Ltd. Sti. (€111 thousand). (10) Mainly includes severance costs (€285 thousand). (11) Mainly includes legal and consulting costs, in particular M & A activities (€5,698 thousand).
The following table shows TWC reconciled to like-for-like adjusted TWC:

KAP AG I ANNUAL FINANCIAL REPORT 2018
48
– –
The following table shows capex reconciled to like-for-like adjusted capex:

KAP AG I ANNUAL FINANCIAL REPORT 2018
49
– –
3. Events after reporting period
Up to the 11 March, there were no significant events after the balance sheet date (approval for publication by the Management Board).
4. Forecast, opportunity and risk report
4.1. Forecast report
Economic expectations
At 3.5%, the International Monetary Fund’s (IMF) forecast for global economic growth in the current year is slightly below the expected growth rate of the previous year. In the second half of 2018, the dynamic upward trend of previous years had already weakened slightly. The main reasons for this are the trade disputes between the United States and China and the incalculable risks that could arise from a disorderly Brexit process. According to the IMF, these issues will continue to be the predominant factors influencing the further development of the global economy in 2019.
GDP growth in the eurozone is expected to slow from 1.8% to 1.6%, probably due in particular to the lower expectations regarding the development of the three major European economies of Germany, France and Italy. In Germany, GDP is expected to grow by only 1.5% in 2019. Weaker private consumption, subdued foreign demand and weaker industrial production following the introduction of revised emission standards for cars are expected to contribute to this slowdown in growth.
In the United States, growth should fall to 2.5% following the loss of the immense fiscal impetus and the slightly more restrictive monetary policy of the US Federal Reserve. Strong growth is expected to come in particular from domestic demand, which could lead to rising imports and thus to a widening of the US current account deficit.
For the emerging markets, the IMF expects economic growth of 4.5% in 2019, almost at the previous year’s level. The gap in the development of the individual regions and countries is expected to widen further. The emerging and developing countries of Asia are expected to grow by 6.3%. However, the combined impact of the necessary tightening of financial supervision and the ongoing trade conflict with the United States should slow the growth of the Chinese economy. Accordingly, the growth forecast of 6.2% is below the figure achieved in the previous year.
Economic environment
Growth1 in 2018
Growth1 in 2019
World % 3.7 3.5 Eurozone % 1.8 1.6 Germany % 1.5 1.3 United States % 2.9 2.5 Emerging economies % 4.6 4.5
1 Real growth of the gross domestic product (GDP)

KAP AG I ANNUAL FINANCIAL REPORT 2018
50
– –
Sources: International Monetary Fund (IMF): World Economic Outlook Update January 2019; Gemeinschaftsdiagnose Herbst 2018: Aufschwung verliert an Fahrt – Weltwirtschaftliches Klima wird rauer
Our segments are active in a large number of attractive market niches where they enjoy a very good market position. Developments in these market niches are relatively independent of general economic developments. The following information is based on a study by a large international consulting company, which is exclusively available to KAP.
In the engineered products segment, the key growth drivers for the key applications in which our products are used remain intact. The market for power belts, hoses and air springs should benefit above all from strong business in the field of spare parts. Higher investments by mining companies should lead to higher demand for heavy-duty conveyor belts. We also expect the market for premium tyres to continue growing, driven by higher sales figures in the US and Asian automotive markets.
The key applications of our flexible films segment benefit from long-term growth trends. The continuing demand for high-quality and sustainable solutions should lead to further market growth in the field of roof membranes in 2019. At the same time, a high level of pressure to renovate and high level of new construction activity should lead to robust demand for reinforced swimming pool linings and cinema screens. The relatively young market for transport covers for new cars should also develop dynamically in 2019.
The market for surface solutions is characterised in particular by the growing demand of major OEMs for better corrosion protection for their products and the increased use of aluminium in the automotive sector. This should also benefit our key applications in the surface technologiessegment, such as chemical passivation or surface protection in the area of zinc-nickel, Chrome III.
The it/services segment should benefit from the unbroken market trend towards digitisation in 2019. Growth drivers for the special market are, in particular, the digitisation of processes and the structured administration of data records as well as applications around big-data analytics, so that the two areas of enterprise content management and big-data analytics are expected to increase significantly.
The products of our precision components segment are increasingly used in the field of electromobility. Market demand for e-bikes should remain high in 2019. But also electric parking brakes and electric steering adjustment should be increasingly used – both in traditional cars as well as in electrified cars.
For individual developments, we also refer to the table Market development of key applications on page 18 in section 2.1 Macroeconomic and industry-specific framework conditions.
Expected development of the KAP Group
We will consistently implement our segment strategy in 2019. We intend to continue to create value for our shareholders through targeted investments in internal and external growth and to continuously expand the market position of our industrial segments.
The strategic focus here is on increasing profitability by realising synergies and gains in efficiency through a targeted package of measures, which we have individually tailored to the respective requirements of our segments and have already initiated. We carried out the necessary analysis and the derivation of the individual measures required for this last year. In the current year, we are

KAP AG I ANNUAL FINANCIAL REPORT 2018
51
– –
working hard – together with our segment managers and our managing directors at the individual locations – to consistently continue the implementation.
At the same time, we want to generate additional growth through increased investments in product innovations. To this end, we plan to establish research centres and combine the previously decentralised Research and Development activities in the segments. In this way, we want to increase our R & D power, avoid duplicate developments and jointly develop innovative solutions at an early stage. Big data and Industry 4.0 are important future fields for us as a modern industrial group. Our unique combination of IT know-how and engineering expertise provides us with excellent prerequisites in an environment characterised by SMEs. With three flagship projects that we intend to carry out within our group in 2019, we provide our external customers with proof of feasibility in the engineered products, flexible films and surface technologies segments.
Finally, we want to further optimise and expand our industrial group structurally with our buy-and-build approach. However, this does not rule out the sale of activities in markets outside our strategic focus. Together with the free funds available to us, we intend to use the resulting funds for targeted acquisitions.
Expected segment development
In our engineered products segment, we have identified various measures with which we intend to reduce our cost base, in particular by realising synergies. We plan to streamline our product portfolio and systematically divest ourselves of products with unsatisfactory margins. By bundling production capacities, we intend to increase the capacity utilisation of the individual plants. In this context, we are also examining the start of production for third parties in selected areas and regions, for example in Germany. On the purchasing side, we plan to centralise our activities and thereby achieve better conditions with our suppliers due to the increased volume. By bundling our sales activities and introducing a technical sales force, we intend to approach our existing and potential customers even more actively and continue to grow with margin-heavy products. In summary, we expect segment revenues to rise inthe 2019 financial year, with normalised EBITDA rising.
The strategic focus in the development of our flexible films segment is on restructuring sales. Here, we want to leverage synergies by building up a uniform sales team and, at the same time, increase sales by making greater use of agents for all segment products. By entering into technological partnerships with our customers, our intention is to be involved even earlier and more directly in joint development. In this way, we can create or establish additional areas of application with our innovative products. In addition, we are planning to introduce a more transparent financial reporting system at all locations, which should lead to a significantly better product mix. In summary, we expect stable segment sales forthe 2019 financial year, with stable normalised EBITDA and a slight increase in investments in property, plant and equipment.
For our surface technologies segment, we have identified structural and organisational measures in particular that we intend to implement in the 2019 financial year. Together with the newly defined segment management, we want to achieve enhancements in efficiency in this area. The basis for this is the implementation of a uniform ERP system and the application of proven best-practice management solutions. We intend to streamline sales by focusing on key accounts. At the same time, we plan to drive diversification – both in terms of application processes as well as the geographic markets in which we operate. Following a comprehensive analysis, we intend to make

KAP AG I ANNUAL FINANCIAL REPORT 2018
52
– –
our operating activities in the United States more profitable. In summary, we expect a significant increase in segment sales for the 2019 financial year, with a significant increase in normalised EBITDA for the full 12 months – also due to the consolidation of the Heiche Group acquired in 2018.
The focus of the development of our it/services segment is on advancing technological applications related to Industry 4.0. Above all, we see great potential in the conversion and integration of existing machines and production lines. Moreover, the focus is on expanding software solutions and thus increasing royalty fees. We are focusing on bundling existing internal competences, but can also envisage growing in this area through acquisitions. In summary, we expect stable segment sales for the 2019 financial year with stable normalised EBITDA and an unchanged level of investments in Research and Development.
Last year, we succeeded in eliminating the share of sales in our precision components segment that depends on the combustion engine in order to be able to concentrate fully on the development of electric drive systems. We intend to consistently venture along this strategic path and, at the same time, open up other end markets in order to significantly minimise the share of sales we generate in the automotive sector. To achieve this, we are planning to increase development of new products. Our technological products are already being used, for example, in e-bikes and electronic transmissions. We see promising potential in these areas over the medium to long term. In summary, we expect significantly lower segment sales on a normalised basis and a significantly lower normalised EBITDA for the 2019 financial year. Investments in property, plant and equipment will also decrease on a comparable basis.
Overall statement of the Management Board and forecast of financial performance for 2019
With our segment strategy, we continue to see ourselves well equipped for the challenges that lie ahead. Due to the very good market positioning of our segments in attractive niche markets, we expect the slowdown in economic development forecast by the IMF to have a disproportionately low impact on our operating business development. In light of this, we expect the KAP Group to generate revenue of between €400 and €430 million with an expected EBITDA of between €45 and €53 million before potential normalisation effects.
2019 goals1
Group Actual 2018 Forecast 20192
Revenue including discontinued operations
in € million 389.8 Slightly above previous year
Normalised EBITDA3 including discontinued operations
in € million 40.2 Slightly above previous year
Investments4 including discontinued operations
in € million 18.0 Significantly above previous year
engineered products
Revenue in € million 169.1 Slightly above previous year
Normalised EBITDA3 in € million 14.2 Slightly above previous year
Investments in property, plant and equipment
in € million 4.2 Significantly above previous year
flexible films

KAP AG I ANNUAL FINANCIAL REPORT 2018
53
– –
Revenue in € million 88.4 Slightly above previous year
Normalised EBITDA in € million 9.1 Stable compared to previous year
Investments4 in € million 2.1 Significantly above previous year
surface technologies
Revenue in € million 43.2 Significantly above previous year
Normalised EBITDA in € million 7.5 Significantly above previous year
Investments4 in € million 2.7 Significantly above previous year
it/services
Revenue in € million 22.6 Stable compared to previous year
Normalised EBITDA in € million 2.3 Stable compared to previous year
Investments4 in € million 0.8 Significantly above previous year
precision components
Revenue in € million 67.6 Significantly below previous year
Normalised EBITDA in € million 10.8 Significantly below previous year
Investments4 in € million 4.7 Slightly above previous year
1 In the forecast for 2019, ‘slight’ corresponds to a change of between 1% and 10%, ‘significant’ to a change of more than 10% and ‘stable’ to a change of +/– 1%.
2 On a comparable basis. 3 EBITDA before severance payments. 4 Intangible assets and property, plant and equipment.
4.2. Opportunity and risk report
4.2.1. Risk management system
As an internationally active industrial group, the KAP Group is subject to a number of internal and external developments and events. We want to identify the risks arising from our entrepreneurial activities at an early stage and systematically record them, and take the necessary measures in good time in order to sustainably increase the value of the company. We support this overarching goal with our group-wide risk management system, which is a central instrument of our value-oriented corporate management. Risks are defined as events and possible developments within and outside our company that lead to deviations from a previously defined target value and can therefore have a negative impact on the financial performance or reputation of the company.
Our group-wide risk management system covers all strategic, operational and financial risks as well as possible compliance risks. The aim is to use a holistic approach to identify, assess, monitor and adequately manage these risks at an early stage and in full. The basis for this is a group-wide risk management software program, which we continuously develop. Defined risk managers in our group and in our subsidiaries regularly review processes, procedures and developments for existing risks and record these at an early stage and comprehensively on the basis of specified risks. This is broken down into four central risk areas in order to enable efficient risk management. The relevant risks are assessed taking into account the risk potential and the frequency of occurrence.

KAP AG I ANNUAL FINANCIAL REPORT 2018
54
– –
Classification of risks – risk potential
Effect on operating result (EBIT) per financial year
Decrease in cash and cash equivalents
per financial year
Low in € million <0.4 <0.4 Medium in € million 0.4–1.0 0.4–1.0 High in € million >1.0 >1.0
Classification of risks – probability of occurrence
Frequency of occurrence Low Less than once per five years Medium Usually every one to five years High Usually once per year
We always record the so-called gross risks and multiply them by the respective probability of occurrence analysed. From this, we determine the net expected value of the potential risk. The detailed recording of risks ensures a complete overview of all risks that could materially impair the financial position and financial performance. This is done in a central system, from which we can generate in-depth and comprehensive risk reports at any time.
The formal documentation of reporting is carried out by the responsible risk manager of the reporting unit concerned at the end of each year on the basis of uniformly defined standards. The risk managers act largely autonomously for their areas. In addition to risk identification, risk recording and risk reporting, their tasks also include the early initiation and implementation of individual measures aimed at avoiding and/or limiting risks. The information collected is evaluated and the risks classified centrally within the group.
In principle, risk management is the responsibility of the Management Board, which is therefore always informed of the current risk situation. Among other methods, this is done via management reporting, which consists of comprehensive reporting, projections and updated planning, including investment planning. These instruments are supplemented by measures that each corporate group uses individually for its operational management. Risks are therefore assessed and aggregated on two levels. Outside the established reporting routines, an immediate reporting obligation to the Management Board is imposed as soon as a risk manager identifies a risk that could have an impact on the operating result (EBIT) of more than €1.0 million.

KAP AG I ANNUAL FINANCIAL REPORT 2018
55
– –
4.2.2. Internal control system and risk management system relating to the group accounting process (disclosures in accordance with § 315 (4) of the German Commercial Code and explanatory report)
In addition to the risk management system and the compliance system, the internal control system (ICS) and risk management system relating to the group accounting process are an integral part of corporate governance. The aim of the ICS is to implement controls to ensure sufficient security for the internal and external accounting in the KAP Group, which is always in compliance with the rules, and for the valid numerical mapping of business processes.
Our accounting guidelines contain comprehensive organisational measures and clearly defined technical processes that include all group companies. In this way, we ensure that the International Financial Reporting Standards (IFRS) are applied uniformly throughout the group. The central point of contact and thus the consolidated knowledge repository is our Internet-based financial portal, with which we can ensure access at all times to all documents and resources relevant to the accounting process. New developments in international accounting are reviewed centrally by us for their relevance and, if necessary, implemented promptly in our internal accounting guidelines. Accordingly, we constantly monitor the activities of legislators and other organisations with regard to changes in international accounting standards in order to be able to initiate targeted measures for smooth implementation even before the regulations come into force. This includes, among other things, intensive and early training of employees who are responsible for preparing internal and external accounts. These case-by-case training courses supplement our ongoing training offering and the additional individual support provided to our subsidiaries by a professionally qualified contact person at group level.
By using uniform consolidation software throughout the group, we achieve complete and almost simultaneous recording of the financial statements of our subsidiaries. Comprehensive disclosure obligations ensure that the employees entrusted with these tasks record all prescribed information. Intelligent plausibility checks largely rule out inconsistencies in the figures. A comparison between the risk management system and the financial statement reporting data ensures the conformity of the disclosures. Prudent and forward-looking scheduling with regard to reporting and publication obligations, combined with early communication, also contributes to the orderly organisation of the process.
4.2.3. Risk reporting in relation to the use of financial instruments
We actively manage the interest rate risks and currency risks associated with our operating activities. Our goal is to reduce the negative effects of exchange rate fluctuations, especially the US dollar and interest rate levels. We mainly use letters of credit to minimise the risks from planned supply and service transactions.
We use derivatives only to a very limited extent. The same also applies to forward exchange transactions to hedge currency risks. Only in the context of hedging relationships do we use forward exchange contracts to hedge an underlying transaction that has already been recognised (fair value hedge). This involves constant risk control. Counterparties are always domestic and foreign banks with impeccable credit ratings. In this way, we minimise the risk of default due to non-performance of payment obligations.

KAP AG I ANNUAL FINANCIAL REPORT 2018
56
– –
4.2.4. Risks
The following presentation contains all material opportunities and risks which, from today’s perspective, could influence the financial position, financial performance and reputation of the KAP Group. In addition to the opportunities and risks described above, other factors that are not currently known to us or that we do not yet consider to be material may affect our business activities. For better understanding, we have assigned the main risks to four superordinate categories: strategic risks, company-specific risks, financial risks and compliance risks. Unless explicitly stated otherwise, the opportunities and risks presented apply in principle to all business segments.
Overview of significant risk areas
Risk categories Risk potential Probability of occurrence
Change compared to previous
year
Strategic risks
Political, regulatory and legal framework conditions Low Low–medium Þ
Corporate governance Medium Medium Ý
Portfolio risks Low Low–medium ß
Company-specific risks
Sales and marketing Low Low–medium Ý
Materials management High Low–medium ß
Personnel Medium Low–medium Ý
IT/Organisation Low Low–medium Þ
Financial risks
Liquidity risk Medium Low–medium ß
Interest rate risk Low Low Þ
Currency and inflation risk Medium Low–medium Þ
Compliance risks
Legal risks Medium Low–medium ß
Ý Improved Þ Unchanged ß Worse
Strategic risks
Political, regulatory and legal framework conditions As a globally active industrial group, we are exposed to political, regulatory and legal framework conditions in many countries and markets. The operating development of our subsidiaries depends on the development of the overall economic environment. In addition to the economic risks resulting from an unexpected economic downturn, increases in energy and raw-material prices can also represent risks for the development of the individual subsidiaries. With a broad diversification across five different segments, and within the segments across different application areas, we avoid a disproportionate dependence on developments in individual industries. The high degree of specialisation and the associated strong position within attractive market niches reduce the general economic risk for our operating subsidiaries as well as the sector risk, without being able to eliminate it completely.
Corporate governance

KAP AG I ANNUAL FINANCIAL REPORT 2018
57
– –
Risks arising from the management of our group companies stem in particular from our decentralised organisational structure. We demand and promote independent entrepreneurial action. Together with the segment managers, the Management Board periodically agrees the objectives and framework conditions of their actions without specifying detailed implementation. The risk of deviations from plans and undesirable developments in individual segments and subsidiaries is minimised by comprehensive controlling, compliance and risk management systems that are firmly implemented in corporate processes throughout the group. In this way, the managing directors of our subsidiaries, the superordinate segment managers and the Management Board are in a position at all times to identify undesirable developments and, if necessary, to issue warnings or initiate countermeasures at an early stage.
Portfolio risks We focus on the development of our existing segments and subsidiaries. We also focus on the acquisition of medium-sized companies that have a strong position in market and product segments that are attractive to us. When companies are acquired, there is a possibility that hidden risks or misjudgements could impair the economic success of a newly acquired subsidiary. In order to minimise this risk, we conduct an extensive review of the legal and economic circumstances and the market environment of potential takeover candidates. For this task, we have specialists within the group who have extensive expertise in the M & A field. In addition, our contracts include guarantees and indemnities as far as possible when a company is taken over. However, we cannot completely rule out a residual risk.
Portfolio risks can arise in particular from an incorrect assessment of the future market or business development of the individual subsidiaries. We counter these potential risks with comprehensive internal and external market analyses of the respective industry. In addition, there are possible risks from misjudgements in the strategic positioning of our subsidiaries. We reduce this risk through intensive market and competition monitoring and regular strategy discussions with our segment managers and the managing directors of our subsidiaries. In addition, all companies report regularly on their current business performance and their individual risk situation. In principle, we also subject all strategic investments in new product areas to a critical market review with regard to future revenue and earnings potential. The bundling of these measures means that the KAP Group always has a comprehensive overview of the aggregated portfolio risks arising from the risk situation of the individual subsidiaries.
Company-specific risks
Sales and marketing Risks from sales and marketing can arise in particular from dependence on the development of individual regions and individual major customers. With the increasing internationalisation of our operating business, our subsidiaries have succeeded in continuously reducing the sales risk. In the year under review, we generated 58.5% of our total revenue abroad, so that our dependence on the German market has fallen sharply in recent years as a result of the strategic expansion of the international business of our subsidiaries. We minimise our dependence on the development of individual major customers by intensifying our sales and development activities, which enable us to open up new product groups and new fields of application and thus new markets and new customers. As of 31 December 2018, one product or service group or customer accounted for more than 10% of our consolidated revenue.
Materials management

KAP AG I ANNUAL FINANCIAL REPORT 2018
58
– –
Our subsidiaries are predominantly medium-sized production companies. The raw materials and supplies required for production are sourced from various suppliers. This creates dependencies, in particular with regard to the price and quality of the materials supplied.
The purchase prices for raw materials can fluctuate strongly depending on the current economic environment. Depending on the respective market situation, we try to pass on the burdens resulting from higher purchase prices to our customers. In addition, it is our goal to contractually pass on the merchandise management risks to our customers by varying the contract terms and corresponding agreements.
In order to meet the high quality demands of our customers and ourselves, we also require our suppliers to comply with clearly defined quality and manufacturing standards. To this end, our subsidiaries carry out strict quality controls on all incoming raw materials. This enables us to react at any time to violations of our quality and manufacturing standards. In this case, we demand either a rework or can immediately switch to other suppliers in our existing network if defects occur.
Personnel Qualified, motivated and satisfied employees are a decisive prerequisite for our sustained successful company development. Difficulties in recruiting, retaining and developing specialists and managers can have a significant negative impact on our future company development. We are increasingly in competition with other medium-sized and internationally active companies, especially among highly qualified specialists and managers. In addition, demographic change can lead to a reduction in the number of available workers.
We counter this risk with a comprehensive package of measures to motivate, develop and promote our employees in the group and in our subsidiaries. With our strategic personnel planning, we have described and firmly defined the goals and measures for all subsidiaries. Building on this, we offer a wide range of traineeships and university places as part of a dual course of study in order to cover the need for suitable personnel. We maintain close contact with selected universities in order to attract potential junior managers to the KAP Group. We cultivate these relationships intensively and, if required, offer internships and subjects for diploma, bachelor’s and master’s theses. Another important factor in limiting personnel risks is the establishment and development of a lively and positive corporate culture within the group and its individual subsidiaries. All these measures make us an attractive employer to work for.
IT/Organisation The security of our IT systems is particularly important to us. Increasing networking creates opportunities for misuse which can lead to, among other things, a failure of central IT systems, a loss of integrity of confidential data, a manipulation of IT systems or damage caused by virus attacks. We counter this risk with regular investments in our IT systems, a comprehensive use of virus scanners and firewall systems as well as fixed authorisation and access controls. We constantly adapt our central systems to the respective requirements of our organisation. We rely on our own experts for our IT measures, but also call in external experts for specific projects.

KAP AG I ANNUAL FINANCIAL REPORT 2018
59
– –
Financial risks
Risk of default In our operating business and in certain financing activities, we are exposed to the risk that the counterparty will not fulfil its contractual obligations. Significant financial transactions with credit risk are concluded exclusively with banks of good credit standing. In addition, our large group of banks, consisting of five banks (as of 31 December 2018), reduces potential losses in the event of a default. The operational default risk consists in particular in the non-performance of existing trade receivables by customers of our subsidiaries. In order to minimise this risk, we have established strict and effective accounts receivable management at our subsidiaries on a decentralised basis. If necessary, risk-reducing measures, such as taking out credit insurance, are implemented.
Liquidity and credit risk We identify risks from fluctuations in cash flows at an early stage as part of our comprehensive liquidity management. The basis of our liquidity management is a liquidity reserve, which we maintain in the form of bank balances and credit lines. As of 31 December 2018, we had cash and cash equivalents of €11.7 million and credit lines with an aggregate volume of €176.1 million, of which we utilised €83.6 million. With the exception of our locations in China, India, Switzerland and South Africa, our subsidiaries are linked to a cash-pooling system, which ensures an adequate supply of liquidity at all times throughout the group.
KAP AG raises funds centrally on the basis of careful and forward-looking planning of its financial requirements – particularly in the case of major investments. With regard to internal financing sources, the optimisation of working capital through continuous monitoring and active management plays a key role. With regard to external sources of financing, we ensure that our banking partners have first-class credit ratings. To secure business at our locations in China and India, we involve local financial institutions, or subsidiaries or associate companies of financial institutions which we already work together with in Germany. In this way, we increase the flexibility of our financing and reduce ongoing currency risks by taking out loans in local currency. Various covenants have been agreed for some of the existing financial liabilities. Compliance with these covenants is continuously centrally monitored. A possible violation can lead to a termination of the financing on the part of the banks. In 2018, we were in compliance with the covenants at all time.
Interest rate risk Our financing consists of a balanced and targeted mix of short-term and long-term financing instruments. For the long-term financing instruments, we use redemption loans in particular and classic overdraft facilities in the short term, most of which are involved in syndicated financing. The EURIBOR is always used as the basis interest rate, whereby a so-called floor is available with a negative EURIBOR. Accordingly, potential changes in the market interest rate may lead to interest rate risks due to a higher interest rate payable. Interest rate risks are actively managed by the Treasury department. However, hedging through the use of derivative instruments is generally not carried out.

KAP AG I ANNUAL FINANCIAL REPORT 2018
60
– –
Currency and inflation risk Due to the international business activities of our subsidiaries, we are exposed to risks from fluctuations in exchange rates. In the 2018 financial year, we generated a not-inconsiderable portion of our business with customers in the US dollar zone, accounting for 8.1% of group revenue. Accordingly, the assumption of certain currency risks is essential for us. By implementing a cash-pooling system for the US dollar, we mitigate the exchange rate risks of the US dollar to the euro through natural hedging, so that we make the risks calculable. At the same time, we are able to invoice our customers predominantly in euros and thus minimise the corresponding risks arising from the change in the exchange rate between the US dollar and the euro. Control and reduction through derivatives or other currency hedging transactions were therefore only necessary to a very limited extent.
Compliance risks
The compliance management system of the KAP Group focuses in particular on the areas of corruption prevention, antitrust law, sanctions and export control, as well as IT security, data protection and taxes. To ensure compliance with laws and regulations, we have introduced a group-wide compliance system and established a code of conduct for our employees. We continuously check both instruments for efficiency and further develop them for legal or regulatory changes that go beyond this. Through training, we increase awareness for legally compliant behaviour and thus try to avoid the occurrence of possible reputation risks.
Legal risks The KAP Group is generally exposed to a large number of risks arising from legal disputes or legal proceedings. These include in particular risks in the areas of warranty and product liability, competition law, patent law and contract law. These risks can have a negative impact on our operating business and on the reputation of our company, and can result in high costs. With efficient contract and quality management, we reduce the risks arising from warranty and product liability claims. We have formed sufficient provisions for all legal risks on the basis of comprehensive analyses and assessments of the underlying circumstances. As of 31 December 2018, these totalled €13.3 million. There were no ongoing or threatened legal disputes in the KAP Group as of the reporting date that could have a significant impact on the financial position and financial performance.
Trademark protection As an industrial group, the KAP Group is particularly dependent on the protection of intellectual property and thus on investments in new products and processes. We apply for the protection of our products, as far as possible, by utility model or patent application. The need to apply for trademark protection measures is eliminated in the case of joint development of products or applications with our customers, or in our function as a tier-two supplier, which we assume in particular in the precision components segment. We consistently pursue infringements of our utility model or patent applications and always strive for judicial or extrajudicial resolution.

KAP AG I ANNUAL FINANCIAL REPORT 2018
61
– –
4.2.5. Opportunity management
The establishment of our segment strategy in a dynamic market environment offers the KAP Group numerous opportunities in the coming years to successfully develop the company further. Systematic identification and consistent exploitation of opportunities is an important part of our corporate policy. Opportunities are defined as events and possible developments within and outside our company that lead to additional potential and positive deviations from a previously defined target value and can therefore have a positive impact on the financial performance or reputation of the company. In order to identify opportunities at an early stage, we use various instruments for market observation and analysis. These include in particular comprehensive market studies of areas in which we are already active with our subsidiaries, or which could be attractive for us due to the existing competitive structure and growth prospects.
As part of our opportunity management, the Management Board, the segment managers and the individual managing directors of the subsidiaries work closely together. As part of the annual business planning and target agreements, the Management Board specifies the opportunities and coordinates them with the responsible managers. The aim is always to generate added value for our stakeholders on the basis of a balanced relationship between opportunities and risks, based on our business model and our segment strategy. The opportunities arising at the operating level are managed decentrally by the individual segment managers and managing directors of the individual subsidiaries. They have comprehensive knowledge of the respective market and the relevant competitors and can thus identify, evaluate and, if necessary, consistently exploit opportunities at an early stage.
The strategic opportunities for the KAP Group lie in particular in the consistent implementation of the segment strategy and the further goal-oriented expansion of the group through targeted M & A activities. Our good position in the market, our corporate strategy geared towards sustainable growth and our comfortable financing and liquidity situation enable us to operate in the M & A market at any time. In conjunction with our established identification, testing, negotiation and implementation processes, we can thus consistently exploit the opportunities that present themselves to us on the acquisition market.
Our subsidiaries generally benefit from positive economic development in the regional and industry-specific markets in which we are active. In particular, opening up new markets offers new opportunities and immediately increases independence from local developments. The innovative strength and the planned promotion of product developments offers the opportunity to grow in particular in future-oriented fields such as environmental protection and energy efficiency, which are relevant for all industrial sectors. The segment strategy offers the opportunity to realise significant potential with regard to efficiency by optimising capacity utilisation at individual locations, bundling production capacities and intensifying the exchange of knowledge between our individual subsidiaries within a segment. In addition, we intend to drive innovative new products, product groups and processes forward with increased investments in Research and Development, thereby continuously expanding the product portfolio of our segments.

KAP AG I ANNUAL FINANCIAL REPORT 2018
62
– –
4.2.6. Overall statement of the Management Board on the opportunity and risk situation
The assessment of the overall risk situation is the result of a consolidated examination of all material individual risks and superordinate risk categories. From the Management Board’s perspective, at the time of publication of this report, no individual or aggregated risks have been identified that could endanger the continued existence of the KAP Group. There are also no threats in the foreseeable future either. We do not see any significant change in the risk situation compared with the previous year. No new risks have been identified which, according to current estimates, could have a potentially critical impact on the result. We are convinced that we will be able to consistently exploit the opportunities arising from our entrepreneurial activities in the future and continue to successfully master the challenges arising from the risks described above.
5. Other mandatory disclosures
5.1. Declaration on corporate governance in accordance with § 289f and § 315d of the German Commercial Code
The declaration on corporate governance in accordance with § 289f and § 315d of the German Commercial Code can be found on our website at www.kap.de/investor-relations/corporate-governance/erklaerung-zur-unternehmensfuehrung.html.
5.2. Non-financial declaration in accordance with § 289b et seq. and § 315b et seq. of the German Commercial Code
The non-financial declaration in accordance with § 289b et seq. and § 315b et seq. of the German Commercial Code can be found on our website at www.kap.de/unternehmen/vision-werte/nfe.html.
5.3. Takeover-relevant disclosures in accordance with § 289a (1) and § 315a (1) of the German Commercial Code and explanatory report of the Management Board in accordance with § 176 (1), sentence 1, of the German Stock Corporation Act
Composition of subscribed capital As of 31 December 2018, the company’s share capital amounted to €20,176,917.80, divided into 7,760,353 bearer shares with a nominal value of €2.60 per share. Each share grants the same legal rights and one vote at the Annual General Meeting. There are no different classes of shares.
Restrictions relating to voting rights and the transfer of shares The exercise of voting rights and the transfer of shares are governed by statutory provisions. In accordance with § 136 (1) of the German Stock Corporation Act (AktG), these relate primarily to the vote on the annual discharge in respect of shares held directly or indirectly by members of the Management Board or Supervisory Board, as well as the – at least temporary – non-existence of voting rights in the event of violations of the notification obligations pursuant to § 33 (1) or (2), § 38 (1) or § 39 (1) of the German Securities Trading Act (WpHG). The Articles of Association of KAP AG do not provide for any restrictions on voting rights or the transfer of shares. The Management Board is not aware of any special contractual restrictions relating to voting rights or the transfer of shares.
Shareholdings exceeding 10% of the voting rights

KAP AG I ANNUAL FINANCIAL REPORT 2018
63
– –
Project Diamant Bidco AG, Frankfurt am Main, Germany, and FM Verwaltungsgesellschaft mbH, Stadtallendorf, Germany, had shareholdings in KAP AG exceeding 10% of the voting rights as of 31 December 2018. Further information can be found in section 47 of the notes (related party disclosures) on page 119.
Shares with special rights conferring powers of control No shareholder is entitled to special rights that confer powers of control.
Type of control of voting rights in the event that employees have shareholdings and do not exercise their control rights directly Employees exercise their voting rights and the control rights arising from their shareholdings in KAP AG in accordance with the statutory provisions and the Articles of Association.
Appointment and dismissal of members of the Management Board and amendments to the Articles of Association The members of the Management Board of KAP AG are appointed and dismissed exclusively in accordance with the statutory provisions pursuant to § 84 and § 85 of the German Stock Corporation Act (AktG). Pursuant to Article 5 of the Articles of Association, the Management Board of the company consists of two or more members. The number is determined by the Supervisory Board.
Pursuant to Article 119 (1) 5 and Article 179 (1) 1, the Articles of Association may be amended by resolution of the Annual General Meeting. Pursuant to Article 17 of the Articles of Association in conjunction with § 179 (2) and § 133 (1) of the German Stock Corporation Act (AktG), the resolution of the shareholders at the Annual General Meeting on amendments to the Articles of Association is generally passed by a simple majority of the votes cast, unless other mandatory statutory provisions exist. Amendments to the Articles of Association that affect only the wording may be made by the Supervisory Board in accordance with Article 12 of the Articles of Association.
Powers of the Management Board to issue or repurchase own shares Pursuant to Article 4 (4) of the Articles of Association, the Management Board of KAP AG is authorised, with the consent of the Supervisory Board, to increase the company’s share capital until 7 July 2022 by issuing up to 188,982 new no-par-value bearer shares, each with a nominal value of €2.60 of the share capital, against contributions in cash or in kind (authorised capital 2017). In principle, shareholders are to be granted subscription rights. However, with the approval of the Supervisory Board, the Management Board is authorised to exclude this subscription right in certain cases. Further details can be found in Article 4 (4) of the Articles of Association of KAP AG, which can be accessed at any time on the company’s website and in the electronic register of companies.

KAP AG I ANNUAL FINANCIAL REPORT 2018
64
– –
The Annual General Meeting on 7 July 2017 authorised the company to acquire treasury shares – by 7 July 2022 – up to 10% of the share capital existing at the time the resolution was adopted. The details are set out in the authorisation resolution adopted by the Annual General Meeting on 7 July 2017 (agenda item 14). As of 31 December 2018, KAP AG had not made use of the resolution passed.
Material agreements that exist under the condition of a change of control in the event of a takeover bid There are no material agreements of the company that exist under the condition of a change of control in the event of a takeover bid.
Compensation agreements in the event of a takeover bid There are no compensation agreements between the company and the members of the Management Board or individual employees that take effect in the event of a takeover bid.

KAP AG I ANNUAL FINANCIAL REPORT 2018
65
– –
CONSOLIDATED FINANCIAL STATEMENTS
CONSOLIDATED STATEMENT OF INCOME FROM 1 JANUARY TO 31 DECEMBER 2018
in € thousands Notes 2018 2017
Revenue (27) 389,8291 357,295
Change in inventories and other own work capitalised 4,458 4,529
Total performance 394,287 361,824
Other operating income (28) 14,059 12,978
Cost of materials (29) –219,422 –212,515
Personnel expenses (30) –92,649 –84,334
Depreciation and amortisation of intangible assets, property, plant and equipment and investment property (31) –24,974 –22,826
Other operating expenses (32) –57,484 –52,828
Result from the disposal of assets and liabilities (33) 18 23,047
Operating earnings 13,835 25,345
Interest earnings (34) –4,219 –3,851
Other financial earnings (35) –996 8,168
Financial earnings –5,214 4,317
Gains/losses from continued operations before income taxes 8,620 29,662
Income taxes (36) –5,029 –2,952
Gains/losses from continued operations 3,592 26,711
Gains/losses from discontinued operations after taxes (37) 11,154 4,265
Consolidated annual result after taxes 14,746 30,975
Earnings share of non-controlling interests (38) 25 46
Consolidated annual result of KAP AG shareholders 14,771 31,021
Undiluted earnings per share (in EUR) (39)
Gains/losses from continued operations 0.50 4.04
Gains/losses from discontinued operations 1.55 0.64
2.05 4.68

KAP AG I ANNUAL FINANCIAL REPORT 2018
66
– –
in € thousands Notes 2018 2017
Diluted earnings per share (in EUR) (39)
Gains/losses from continued operations 0.50 4.04
Gains/losses from discontinued operations 1.55 0.64
2.05 4.68
1 Revenue including discontinued operations totalled €422,339 thousand (previous year: €407,522 thousand). As the figures are presented in € thousands, the numbers may not add up due to rounding.
CONSOLIDATED STATEMENT OF COMPREHENSIVE INCOME/LOSS AS OF 31 DECEMBER 2018
in € thousands Notes 2018 2017
Consolidated earnings after taxes 14,746 30,975
Unrealised gains from currency translation –13 –390
Unrealised gains from financial assets available for sale (43) – –10,748
Items which may be reclassified in the income statement in the future –13 –11,139
Actuarial gains from defined-benefit plans (20) –356 2,155
Deferred taxes on actuarial gains/losses from defined-benefit plans (38) 107 –646
Items which will not be reclassified in the income statement in the future –249 1,508
Other earnings after taxes –262 –9,631
Thereof earnings after taxes attributable to non-controlling interests 33 297
Thereof earnings after taxes attributable to shareholders of KAP AG –295 –9,928
Total comprehensive income 14,483 21,345
Thereof attributable to non-controlling interests attributable to total comprehensive income 8 252
Thereof attributable to shareholders of KAP AG 14,475 21,093
As the figures are presented in € thousands, the numbers may not add up due to rounding.

KAP AG I ANNUAL FINANCIAL REPORT 2018
67
– –
CONSOLIDATED STATEMENT OF FINANCIAL POSITION AS OF 31 DECEMBER 2018
in € thousands Notes 31.12.2018 31.12.2017
ASSETS
ASSETS
Non-current assets Intangible assets (7) 42,327 23,015
Property, plant and equipment (8) 169,026 152,789
Investment property (9) 4,678 4,881
Financial assets accounted for using the equity method (10) 0 0
Other financial assets (11) 1,374 1,260
Deferred tax assets (12) 4,813 6,097
222,218 188,042
Current assets Inventories (13) 70,062 74,041
Trade receivables (14) 62,935 64,300
Income tax refund claims (15) 2,631 2,329
Other receivables and assets (16) 6,400 10,294
Cash and cash equivalents (17) 11,727 10,079
153,755 161,044
375,973 349,085

KAP AG I ANNUAL FINANCIAL REPORT 2018
68
– –
in € thousands Notes 31.12.2018 31.12.2017
LIABILITIES
EQUITY AND LIABILITIES
Equity and reserves
Subscribed capital 20,177 17,224
Capital reserve 86,840 48,811
Reserves –15,358 –15,088
Retained earnings 99,903 98,874
Equity attributable to shareholders of KAP AG 191,560 149,822
Non-controlling interests 2,400 5,365
(18) 193,960 155,187
Non-current liabilities Provisions for pensions and similar obligations (20) 18,080 18,480
Non-current financial liabilities (21) 59,399 45,733
Deferred tax liabilities (12) 13,309 6,603
Other non-current liabilities (22) 349 –
91,137 70,815
Current liabilities Other provisions (23) 25,154 31,150
Current financial liabilities (21) 28,115 36,939
Trade payables (24) 24,292 27,850
Income tax liabilities (25) 4,895 1,984
Other liabilities (26) 8,419 25,159
90,876 123,083
375,973 349,085
As the figures are presented in € thousands, the numbers may not add up due to rounding.

KAP AG I ANNUAL FINANCIAL REPORT 2018
69
– –
CONSOLIDATED STATEMENT OF CHANGES IN EQUITY AS OF 31 DECEMBER 2018
Revenue reserves
in € thousands Subscribed
capital Capital reserve
Currency differences
Cash flow hedges
Financial assets
available for sale
Actuarial gains/losses Other Total
Consolidated balance
sheet result
Equity of KAP
shareholders
Non-controlling
interests Total equity
01.01.2017 17,224 48,966 –19,903 10,749 –6,436 13,418 –2,174 81,269 145,285 2,008 147,293
Consolidated annual result – – – – – – – – 31,021 31,021 –46 30,975
Other earnings before taxes – – –618 – –10,749 2,054 – –9,313 – –9,313 328 –8,985
Deferred taxes on other comprehensive income – – – – – –616 – –616 – –616 –30 –646
Total result – – –618 – –10,749 1,438 – –9,929 31,021 21,093 252 21,345
Dividends – – – – – – – – –13,249 –13,249 – –13,249
Change in consolidated group – – – – – – –2,986 –2,986 –146 –3,132 3,122 –10
Other changes – –155 – – – – – – –21 –176 –15 –191
31.12.2017 17,224 48,811 –20,521 – 0 –4,998 10,432 –15,086 98,874 149,822 5,366 155,187
Consolidated annual result – – – – – – – – 14,771 14,771 –25 14,746
Other earnings before taxes – – –63 – – –356 – –420 – –420 33 –387
Deferred taxes on other comprehensive income – – – – – 107 – 107 – 107 – 107

KAP AG I ANNUAL FINANCIAL REPORT 2018
70
– –
Revenue reserves
in € thousands Subscribed
capital Capital reserve
Currency differences
Cash flow hedges
Financial assets
available for sale
Actuarial gains/losses Other Total
Consolidated balance
sheet result
Equity of KAP
shareholders
Non-controlling
interests Total equity
Total result – – –63 – – –249 – –313 14,771 14,458 8 14,466
Capital increase 2,953 38,069 – – – – – – – 41,022 – 41,022
Dividends – – – – – – – – –14,056 –14,056 – –14,056
Change in consolidated group – – 18 – – – – 18 – 18 –590 –572
Other changes – –40 – – – – 23 23 314 297 –2,383 –2,086
31.12.2018 20,177 86,840 –20,566 – – –5,247 10,455 –15,358 99,903 191,560 2,400 193,960
As the figures are presented in € thousands, the numbers may not add up due to rounding. See note 18 of the notes to the consolidated financial statements for additional information on equity.

KAP AG I ANNUAL FINANCIAL REPORT 2018
71
– –
CONSOLIDATED STATEMENT OF CASH FLOWS in € thousands 2018 2017
Earnings before interest and income taxes 24,011 37,788
Depreciation and amortisation of non-current assets (offset against write-ups) 26,824 25,955
Change in provisions –8,745 5,780
Other non-cash expenses and income –1,512 –10,556
Gains/losses from the disposal of non-current assets and discontinued operations –8,238 –24,125
Cash flow from operating activities before changes in assets and liabilities 32,341 34,842
Changes in inventories, receivables and other assets not attributable to investing and financing activities 2,184 –11,602
Changes in payables and other liabilities which are not attributable to investing and financing activities –6,432 8,902
Cash flow from operating activities before interest and income taxes 28,094 32,142
Interest paid and received –3,895 –2,984
Income taxes paid and received –3,521 –3,865
Cash flow from operating activities 20,678 25,293
Proceeds from the disposal of property, plant and equipment (including investment property) 1,673 1,567
Investments in property, plant and equipment (including investment property) –21,230 –20,952
Investments in intangible assets –919 –3,592
Proceeds from the disposal of financial assets 205 0
Investments in financial assets – –28
Cash inflow from the disposal of consolidated companies 37,311 21,990
Cash outflow from the addition of consolidated companies –19,360 –11,851
Cash inflow from the sale of securities – 18,810
Cash inflow from repayments of financial receivables 2 474
Disbursements by granting loans –18 –
Cash flow from investing activities –2,336 6,419

KAP AG I ANNUAL FINANCIAL REPORT 2018
72
– –
in € thousands 2018 2017
Proceeds from capital increase 600 678
Dividends paid to shareholders –14,056 –13,249
Acquisition of minority interest –372 –
Cash inflow from borrowing 70,706 55,499
Disbursements for the repayment of financial liabilities –73,510 –68,624
Cash flow from financing activities –16,632 –25,222
Net change in cash and cash equivalents 1,710 6,017
Effect of changes in foreign exchange rates, consolidated group and valuation-related changes in cash and cash equivalents –63 –76
Cash and cash equivalents at beginning of period 10,079 4,138
Cash and cash equivalents at end of period 11,727 10,079
As the figures are presented in € thousands, the numbers may not add up due to rounding. See note 45 of the notes to the consolidated financial statements for information on the consolidated statement of cash flows and note 37 for discontinued operations.

KAP AG I ANNUAL FINANCIAL REPORT 2018
73
– –
NOTES TO THE CONSOLIDATED FINANCIAL STATEMENTS FOR THE 2018 FINANCIAL YEAR
1. GENERAL REMARKS KAP AG or the KAP Group has prepared the consolidated financial statements as of 31 December 2018 in accordance with the International Financial Reporting Standards (IFRS) applicable in the EU member states and the additional requirements of § 315e of the German Commercial Code. The consolidated financial statements of KAP AG take into account and have been prepared in accordance with all regulations of the International Financial Reporting Standards (IFRS) as well as the related interpretations (IFRIC) which are mandatory as of 31 December 2018. The statement of cash flows and the statement of changes in shareholders’ equity are shown in addition to the balance sheet, the income statement and the statement of comprehensive income. The notes also contain segment reporting.
In order to improve the clarity of the presentation, various items of the consolidated statement of financial position and the consolidated income statement are summarised. These items are correspondingly broken down and explained in the notes.
The consolidated statement of income has been prepared using the total cost method.
The reporting currency of the group is the euro. All figures are given in thousands of euros (in € thousands) unless otherwise stated. As the figures are presented in € thousands, the numbers may not add up due to rounding.
Effective upon entry in the commercial register on 8 August 2018, KAP Beteiligungs-AG was renamed to KAP AG. KAP AG is a listed industrial holding company that holds stakes in medium-sized companies. Its registered office is Edelzeller Strasse 44, 36043 Fulda, Germany, and is entered in the commercial register B under HRB 5859.
2. CONSOLIDATED GROUP In addition to KAP AG, the consolidated financial statements include all major domestic and foreign subsidiaries that are under the legal and/or actual control of KAP AG. In addition to the parent company, the consolidated group includes 28 domestic and 15 foreign companies.
Investments in joint ventures and associated companies are accounted for using the equity method.
Interests in subsidiaries and investments in joint ventures and associated companies whose influence on the financial performance and financial position is of minor importance are not included in the consolidated financial statements, but are recognised at amortised cost. Five subsidiaries and one investment were not included. The key figures for the companies not included in the consolidated financial statements are less than 1% each of the consolidated revenue, the consolidated equity and the consolidated balance sheet total.
Overall, the consolidated group changed as follows in the year under review:
31.12.2017 Additions Disposals 31.12.2018
Domestic 29 8 2 35
Foreign 15 6 2 19
Total 44 14 4 54
With effect from 30 November 2018, the shares in NOW Contec GmbH and Convert Vliesveredlung GmbH (both in Detmold, Germany) as well as NOW Contec GmbH & Co. KG and Convert Vliesveredlung GmbH & Co. KG (both in Waldfischbach-Burgalben, Germany) were increased from 51% to 74% each in order to strengthen our activities in the field of flexible films. The

KAP AG I ANNUAL FINANCIAL REPORT 2018
74
– –
fair value of the consideration transferred totals €1,965 thousand, made up of a cash component in the amount of €178 thousand and shares in KAP AG with a value of €1,786 thousand. The number of the 47,917 shares was determined using the simple average of the listed daily closing prices from the five working days preceding the date of the transaction.
With effect from 26 July 2018, as part of the acquisition of the Heiche Group, KAP AG directly acquired 100% of shares in Heiche Oberflächentechnik GmbH and Heiche Logistics GmbH (both in Schwaigern, Germany) and indirectly acquired 100% of the shares in Heiche Polska Sp. z.o.o. (Stanowice, Poland) via Heiche Logistics GmbH. Via KAP Surface Holding GmbH, KAP AG acquired 100% each of the shares in G. und R. Heiche Beteiligungs GmbH and G. und R. Heiche GmbH & Co. KG (both in Schwaigern, Germany), in Heiche Bayern GmbH & Co. KG and Heiche Bayern Verwaltungs GmbH (both in Hunderdorf, Germany), in Heiche Oberflächentechnik Beteiligungs GmbH and Heiche Sachsen GmbH & Co. KG (both in Leisnig, Germany), in Heiche Hungary Real Estate Kft. and Heiche Hungary Surface Technologies Kft. (both in Sátoraljaújhely, Hungary) and in KAP US Surface Inc. (in Atlanta, United States), as well as 99% (KAP AG: 1%) in Heiche US Surface Technology LP (Spartanburg, United States).
The companies of the Heiche Group are specialists in surface coating and refinement whose coated parts meet high demands with regard to protection against corrosion and wear.
As of the acquisition on 26 July 2018, the acquired assets and liabilities of the Heiche Group were as follows:
in € thousands
Carrying amounts before purchase
price allocation Adjustment
Provisional purchase price
allocation
Non-current assets
Intangible assets 1,048 19,730 20,778
Property, plant and equipment 28,037 12,769 40,806
Deferred tax assets 132 – 132
29,217 32,499 61,716
Current assets
Inventories 637 637
Trade receivables 6,336 6,336
Other receivables and assets 2,122 2,122
Cash and cash equivalents 2,703 2,703
11,798 – 11,798
Assets 41,015 32,499 73,514
Non-current liabilities Deferred tax liabilities 401 7,987 8,388
Financial liabilities 500 500
Pension obligations 50 50
951 7,987 8,938
Current liabilities

KAP AG I ANNUAL FINANCIAL REPORT 2018
75
– –
in € thousands
Carrying amounts before purchase
price allocation Adjustment
Provisional purchase price
allocation
Other provisions 3,384 3,384
Current financial liabilities 11,419 11,419
Trade payables 2,520 2,520
Actual income taxes – –
Other liabilities 2,875 2,861
20,198 – 20,198
Liabilities 21,149 7,987 29,136
Net assets 19,866 24,512 44,378
Goodwill 25,198 (24,512) 686
45,064 – 45,064
The provisional purchase price allocation of the assets and liabilities resulted in goodwill in the amount of €672 thousand, which is not tax-deductible and which was allocated to the surface technologies segment. The goodwill represents non-separable values such as the expertise of the employees, positive income expectations for the future and synergies from development, sales and marketing, in particular within the surface technologies segment. The purchase price allocation is provisional in particular due to outstanding matters that resulted from the preparation of the opening balance sheet. This concerns the items other receivables and assets as well as other liabilities.
The fair value of the consideration transferred totals €45,064 thousand, made up of a cash component in the amount of €22,064 thousand and shares in KAP AG with a value of €23,000 thousand. The number of the 614,462 shares was determined using the simple average of the listed daily closing prices from the 30 working days preceding the date of the transaction.
The fair value of the trade receivables amounts to €6,336 thousand. The gross amount of the receivables assumed totals €6,529 thousand. The total contractually agreed amounts are expected to be collectable.
Transaction costs in the amount of €2,292 thousand were recognised as expenses and are shown as other operating expenses.
The deferred tax liabilities are primarily comprised of the effects of the higher tax-related depreciation and amortisation of intangible assets and property, plant and equipment.
In the 2018 financial year, the group made revenue contributions of €17,768 thousand and contributions to earnings before interest and income taxes and depreciation and amortisation of €2,950 thousand.

KAP AG I ANNUAL FINANCIAL REPORT 2018
76
– –
No adjustments were necessary for the assets and liabilities recognised in the course of a provisional purchase price allocation for the business operations acquired from it-novum in the previous year.
in € thousands Provisional purchase
price allocation Adjustment
Final purchase price
allocation
Non-current assets 1,330 – 1,330
of which – Intangible assets 1,326 – 1,326
– Property, plant and equipment 4 – 4
Current assets – – –
Assets 1,330 – 1,330
Non-current liabilities – – –
of which – Deferred taxes – – –
Current liabilities 69 – 69
of which – Other provisions 69 – 69
Liabilities 69 – 69
Net assets 1,261 – 1,261
The final purchase price allocation of the assets and liabilities resulted in goodwill in the amount of €1,976 thousand which, with regard to taxes, will be amortised over a period of 15 years. The goodwill represents non-separable values such as the expertise of the employees as well as positive income expectations for the future and synergies from development, sales and marketing.
In addition to the purchase price of €2,110 thousand, two earn-out clauses were agreed which were added to the acquisition costs with the most probable value of €1,130 thousand and accordingly carried as liabilities. The earn-out agreements relate to the fate of the acquired employees and the existing customer contracts (Earn-Out I) at a certain point in time after the closing date and to the achievement of certain revenue targets in the 2018 financial year (Earn-Out II). The earn-out clauses were recognised at their most probable value in the amount of €1,130 thousand as of the acquisition date. An agreement was reached with the seller in the 2018 financial year regarding a one-time payment in the amount of €660 thousand. The remaining amount of €470 thousand was recognised as income.
The assets and liabilities of Gt Oberflächen GmbH recognised as part of a provisional purchase price allocation in the previous year were adjusted as follows:
in € thousands Provisional purchase
price allocation Adjustment
Final purchase price
allocation
Non-current assets 18,760 1,400 17,360
of which – Intangible assets 5,607 1,400 4,207
– Property, plant and equipment 13,153 – 13,153
Current assets 3,739 – 3,739

KAP AG I ANNUAL FINANCIAL REPORT 2018
77
– –
in € thousands Provisional purchase
price allocation Adjustment
Final purchase price
allocation
of which – Inventories 309 – 309
– Trade receivables 1,728 – 1,728
– Other receivables and assets 329 – 329
– Cash 1,373 – 1,373
Assets 22,499 1,400 21,099
Non-current liabilities 6,383 407 5,976
of which – Non-current financial liabilities 2,661 – 2,661
– Deferred taxes 3,722 407 3,315
Current liabilities 2,151 – 2,151
of which – Other provisions 565 – 565
– Current financial liabilities – – –
– Actual income taxes 41 – 41
– Trade payables 1,220 – 1,220
– Other liabilities 325 – 325
Liabilities 8,534 407 8,127
Net assets 13,965 993 12,972
The final purchase price allocation results in goodwill of €5,128 thousand, which is not tax-deductible and which was allocated to the surface technologies segment. The goodwill represents non-separable values such as the expertise of the employees as well as positive income expectations for the future and synergies from development, production, sales and marketing.
No adjustments were necessary for the assets and liabilities of Oberflächentechnik Döbeln GmbH recognised as part of a provisional purchase price allocation in the previous year.
in € thousands Provisional purchase
price allocation Adjustment
Final purchase price
allocation
Non-current assets 5,429 – 5,429
of which – Intangible assets 1,301 – 1,301
– Property, plant and equipment 3,914 – 3,914
– Deferred tax assets 214 – 214
Current assets 2,992 – 2,992
of which – Inventories 62 – 62
– Trade receivables 548 – 548

KAP AG I ANNUAL FINANCIAL REPORT 2018
78
– –
in € thousands Provisional purchase
price allocation Adjustment
Final purchase price
allocation
– Other receivables and assets 121 – 121
– Cash 2,261 – 2,261
Assets 8,421 – 8,421
Non-current liabilities 1,004 – 1,004
of which – Deferred taxes 1,004 – 1,004
Current liabilities 890 – 890
of which – Other provisions 54 – 54
– Current financial liabilities 416 – 416
– Actual income taxes 15 – 15
– Trade payables 291 – 291
– Other liabilities 114 – 114
Liabilities 1,894 – 1,894
Net assets 6,527 – 6,527
The final purchase price allocation results in goodwill of €1,123 thousand, which is not tax-deductible and which was allocated to the surface technologies segment. The goodwill represents non-separable values such as the expertise of the employees as well as positive income expectations for the future and synergies from development, production, sales and marketing.
No adjustments were necessary for the assets and liabilities of Metallveredlung Döbeln GmbH recognised as part of a provisional purchase price allocation in the previous year.
in € thousands
Provisional purchase price
allocation Adjustment
Final purchase price
allocation
Non-current assets 6,429 – 6,429
of which – Intangible assets 800 – 800
– Property, plant and equipment 5,118 – 5,118
– Deferred tax assets 511 – 511
Current assets 1,689 – 1,689
of which – Inventories 74 – 74
– Trade receivables 746 – 746
– Other receivables and assets 80 – 80
– Cash 789 – 789
Assets 8,118 – 8,118
Non-current liabilities 1,430 – 1,430

KAP AG I ANNUAL FINANCIAL REPORT 2018
79
– –
in € thousands
Provisional purchase price
allocation Adjustment
Final purchase price
allocation
of which – Provisions for pensions 745 – 745
– Other non-current liabilities – – –
– Deferred tax liabilities 685 – 685
Current liabilities 2,364 – 2,364
of which – Other provisions 38 – 38
– Current financial liabilities 1,947 – 1,947
– Actual income taxes – – –
– Trade payables 174 – 174
– Other liabilities 205 – 205
Liabilities 3,794 – 3,794
Net assets 4,324 – 4,324
The final purchase price allocation results in goodwill of €158 thousand, which is not tax-deductible and which was allocated to the surface technologies segment. The goodwill represents non-separable values such as the expertise of the employees as well as positive income expectations for the future and synergies from development, production, sales and marketing.
The assets and liabilities of NOW Contec GmbH & Co. KG and Convert Vliesveredlung GmbH & Co. KG recognised as part of a provisional purchase price allocation in the previous year were adjusted as follows:
in € thousands
Provisional purchase price
allocation Adjustment
Final purchase price
allocation
Non-current assets 5,128 2,657 7,785
of which – Intangible assets 5 2,657 2,662
– Property, plant and equipment 5,123 – 5,123
Current assets 2,635 2,635
of which – Inventories 325 – 325
– Trade receivables 801 – 801
– Other receivables and assets 25 – 25
– Cash 1,483 – 1,483
Assets 7,763 2,657 10,420
Non-current liabilities 925 797 1,722
of which

KAP AG I ANNUAL FINANCIAL REPORT 2018
80
– –
in € thousands
Provisional purchase price
allocation Adjustment
Final purchase price
allocation
– Non-current financial liabilities 150 – 150
– Deferred taxes 775 797 1,572
Current liabilities 4,073 – 4,073
of which – Other provisions 71 – 71
– Current financial liabilities 3,131 – 3,131
– Trade payables 133 – 133
– Other liabilities 738 – 738
Liabilities 4,998 797 5,795
Net assets 2,765 1,860 4,625
Using the full-goodwill method, the final purchase price allocation results in goodwill of €3,479 thousand, which is not tax-deductible and which was allocated to the flexible films segment. The goodwill represents non-separable values such as the expertise of the employees as well as positive income expectations for the future and synergies from development, production, sales and marketing.
With effect from 30 November 2018, the shareholding in the NOW Group was increased by 23% to 74%. The fair value of the consideration transferred totals €4,100 thousand, made up of a cash component in the amount of €372 thousand and shares in KAP AG with a value of €3,728 thousand. The number of the 100,000 shares was determined using the simple average of the listed daily closing prices from the five working days preceding the date of the transaction.
it-novum Schweiz GmbH, Zurich, Switzerland, was founded with effect from 13 February 2018 and KAP US Surface Inc., Atlanta, United States, was founded with effect from 14 May 2018.
The disposals refer to the divestment of shares in Geiger Fertigungstechnologie GmbH, Pretzfeld, Germany, with effect from 31 July 2018, as well as the merger of Oberflächentechnik Döbeln GmbH and Metallveredlung Döbeln GmbH, both in Döbeln, Germany, with effect from 12 June 2018. Caplast Ltd. STI, Ankara, Turkey, was deleted from the commercial register with effect from 15 October 2018. ELBTAL OF AMERICA, INC., Charlotte, United States, was liquidated with effect from 2 November 2018.
The deconsolidation results of subsidiaries are reported under the result from the disposal of assets and liabilities. Discontinued operations are reported separately as the result of discontinued operations. The date of initial consolidation and deconsolidation is generally the transfer of control. The effects of changes in the consolidated group, if material, are explained in the notes under the corresponding items of the consolidated statement of financial position and the consolidated statement of income.

KAP AG I ANNUAL FINANCIAL REPORT 2018
81
– –
The following companies made use of § 264 (3) of the German Commercial Code on the basis of existing profit-and-loss transfer agreements with KAP AG:
Name Registered office
MEHLER Aktiengesellschaft Fulda
GM Tec Industries Holding GmbH Pretzfeld
The other companies which also made use of § 264 (3) as well as § 264b of the German Commercial Code are shown in the list of shareholdings in accordance with § 313 (2) of the German Commercial Code, which is presented in note 49.
The KAP AG documents requiring disclosure are submitted to the Federal Gazette (Bundesanzeiger) and subsequently published.
3. CONSOLIDATION PRINCIPLES The purchase method is applied to all corporate mergers after 1 January 2004. The acquired assets and liabilities of fully consolidated companies are recognised at their fair value. The annual financial statements of the companies included are prepared as of the balance sheet date of KAP AG and are based on uniform accounting and valuation methods.
Any positive difference remaining after the purchase price allocation is recognised as goodwill. All goodwill is regularly subjected to impairment tests after allocation to a cash-generating unit.
Goodwill offset against reserves prior to 1 January 2004 remains offset against reserves. If all or part of the operating unit is sold or the cash-generating unit is impaired, the related goodwill is recognised directly in equity.
Any remaining negative difference is recognised immediately in the income statement. Differences on the liabilities side arising from capital consolidation reported before 1 January 2004 under German commercial law are recognised in reserves in accordance with the provisions of the International Financial Reporting Standards.
Shares in the capital and annual result of fully consolidated subsidiaries to which the parent company is not entitled are reported as non-controlling interests within equity.
Changes in the parent company’s ownership interest in subsidiaries that do not result in the loss or acquisition of control are accounted for as equity transactions.
Investments in joint ventures and associated companies are accounted for using the equity method. Any resulting positive differences are recorded as goodwill in an auxiliary calculation and regularly subjected to impairment testing. Differences on the liabilities side are recognised immediately as income and increase the carrying amount of the investment.
Intra-group revenue, expenses and income as well as receivables, liabilities and provisions between group companies are eliminated, as are results from intra-group transactions, insofar as these are of significance for the financial performance and financial position.
4. CURRENCY TRANSLATION Foreign currency receivables and liabilities reported in the individual financial statements are recognised at the time of addition at their acquisition rate. Exchange rate gains and losses resulting from changes in currency exchange rates arising on the balance sheet date are recorded in the result for the period through profit or loss.
The financial statements of the consolidated companies prepared in foreign currencies are translated using the modified current-rate method based on the concept of the functional currency. As the subsidiaries basically operate independently from a financial, economic and organisational point of view, the functional currency is the national currency of the registered office of the company.
Generally, all assets and liabilities are translated at the average exchange rate on the balance sheet date, and expenses and income at the annual average rate. When applying the accounting rules at times of hyperinflation, the expenses and income are

KAP AG I ANNUAL FINANCIAL REPORT 2018
82
– –
translated at the balance sheet date rate.
Translation differences resulting from varying currency exchange rates in the balance sheet and the income statement are recognised directly in equity.
In the case of consolidated companies of which KAP AG owns less than 100%, the differences resulting from the currency translation, insofar as they are attributable to non-controlling interests, are reported separately under non-controlling interests.
Currency translation differences from the debt consolidation are generally recognised through profit and loss.
The following currency exchange rates were used:
Annual average rate Average rate on balance sheet
date
2018
2017 €1 =
31.12.2018
31.12.2017 €1 =
Belarusian rouble 2.4063 2.1865 2.4806 2.3726
Chinese yuan 7.8045 7.6282 7.8600 7.8327
Indian rupee 80.7158 73.5546 79.9088 76.5603
Polish zloty 4.2616 4.1752 4.2981 4.2571
Swedish krona 10.2572 9.6360 10.2513 9.8300
Swiss franc 1.1550 1.1122 1.1266 1.1693
South African rand 15.6211 15.0588 16.4699 14.7499
Czech koruna 25.6458 26.3171 25.7240 25.5850
Turkish lira 5.7064 4.1225 6.0557 4.5343
Hungarian forint 318.8641 309.1521 321.06 309.9600
US dollar 1.1811 1.1304 1.1453 1.1988
5. ACCOUNTING AND VALUATION PRINCIPLES The financial statements of the companies included in the consolidated financial statements have been prepared in accordance with uniform accounting and valuation principles.
Fair value The fair value measurement as per IFRS 13, including the information required, is largely uniformly regulated in International Financial Reporting Standards. The fair value is the value that would be achieved by the sale of an asset, or the price that would have to be paid to transfer a debt. The three-level fair value hierarchy according to IFRS 13 is applied. Financial assets and liabilities are allocated to hierarchy level 1, provided that an exchange price for assets and liabilities is available on an active market. The allocation to hierarchy level 2 is made if a valuation model is applied or the price is derived from comparable transactions. Financial assets and liabilities are reported in hierarchy level 3 if the fair value is determined using unobservable parameters. The risk of default is also taken into account when valuing assets and liabilities.
Intangible assets Intangible assets are only recognised if it is probable that the expected future economic benefits will be realised and the acquisition or manufacturing costs of the asset can be reliably measured.

KAP AG I ANNUAL FINANCIAL REPORT 2018
83
– –
Acquired intangible assets are recognised at acquisition cost upon their addition. These include, in addition to the purchase price, all directly attributable costs incurred to bring the asset into its operating condition.
Internally created intangible assets are recognised at their manufacturing cost. The manufacturing cost includes all costs directly attributable to the manufacturing process as well as appropriate parts of the manufacturing-related overhead costs.
Costs for Research and Development are generally treated as ongoing expenses. Development costs are capitalised and written off on a straight-line basis when a newly developed product or process can be clearly defined, is technically feasible and either its own use or marketing is envisaged. Furthermore, capitalisation requires that the costs are covered by future cash inflows with sufficient reliability.
After initial recognition at the acquisition of manufacturing cost, intangible assets are carried forward in accordance with the acquisition cost model, taking scheduled depreciation and amortisation and impairment losses into account.
Amortisation takes place on a straight-line basis over a period of three to nine years.
Goodwill Goodwill acquired through a business combination is initially recognised at acquisition cost and, in subsequent periods, measured at acquisition cost less any cumulative impairment losses.
Property, plant and equipment Property, plant and equipment are recognised as an asset at their acquisition or manufacturing cost, if it is probable that there will be a future economic benefit associated with the property, plant and equipment and the cost of acquisition or production can be reliably measured.
The cost of acquisition includes all directly attributable costs incurred to place the asset into the condition for its intended use. In addition to the direct costs, the manufacturing cost also includes appropriate parts of the manufacturing-related overhead costs.
In subsequent periods, property, plant and equipment are recognised at acquisition and manufacturing cost less scheduled depreciation and accumulated impairment losses in accordance with the acquisition cost model. Depreciation takes place on a straight-line basis for assets acquired after 1 January 2004. If a significant portion of the acquisition cost of an asset can be allocated to components, these are depreciated separately. For assets used in multi-shift operations, depreciation increases accordingly.
The assets relating to property, plant and equipment are based on the following useful lives:
Years
Land and buildings 7 to 50
Technical equipment and machinery 4 to 25
Other equipment, factory and office equipment 3 to 15
Depreciation is recognised as long as the residual value of the asset is not higher than its carrying amount.
Borrowing costs Borrowing costs directly attributable to the acquisition, construction or manufacture of a qualifying asset are capitalised as part of the acquisition or manufacturing costs. Qualifying assets are defined as construction projects or other assets which necessarily require at least 12 months to place them into the condition for their intended use or sale.
Leasing Lease agreements in which all the material opportunities and risks are borne by the KAP Group as lessee are classified as finance

KAP AG I ANNUAL FINANCIAL REPORT 2018
84
– –
leases. At the beginning of the lease contract, the leased item is recognised at the fair value or the lower present value of the minimum lease payments. Scheduled depreciation takes place on a straight-line basis over the shorter of the contract term or the useful life. The payment obligations resulting from future lease payments are recognised under financial liabilities.
If the requirements for a finance lease are not met, the lease agreement then becomes an operating lease. Lease payments are recognised immediately as expenses in the income statement of the lessee when they become due.
Government grants Government grants are only recognised if it is sufficiently certain that the applicant company fulfils the conditions and the grants are actually awarded. As a rule, grants are allocated systematically as income over the period in which the corresponding expenses are to be compensated for.
Grants for assets are deducted from the carrying amount of the asset concerned.
Investment property Land and buildings not required for operations are classified as investment property and recognised at their acquisition or manufacturing cost upon addition. Recognition only takes place if it is probable that there will be a future economic benefit associated with the asset and the acquisition or manufacturing costs can be measured reliably.
Investment property is carried forward at the corresponding acquisition cost or manufacturing cost, less scheduled depreciation and amortisation and accumulated impairment losses. Depreciation is recognised on a straight-line basis over a period of seven to 50 years.
Impairment of non-current non-financial assets For intangible assets with a specific useful life, plant, property and equipment, and investment property, an assessment is made as of each balance sheet date as to whether there are any indications that assets could be impaired. If such indications exist, the recoverable amounts of these assets are estimated, unless an asset generates cash inflows that that are not largely independent of other assets or other groups of assets (cash-generating units).
Goodwill acquired through a business combination is allocated to the cash-generating unit that derives benefit from the acquisition. Cash-generating units are defined as the economically independent groups of companies operating independently within the segments. The allocation is made no later than the period following the acquisition date.
For goodwill or intangible assets with indefinite useful lives, the impairment test is carried out annually as of each balance sheet date – and whenever there are indications of an impairment – by comparing the carrying amount with the recoverable amount at the level of the cash-generating unit. If the carrying amount of the unit is higher than its recoverable amount, the impairment loss recorded in the amount of the difference first reduces the carrying amount of the goodwill and then, pro rata, the carrying amount of the other assets. Any impairment loss is recognised immediately in the result for the period. For assets with a certain useful life, the depreciation amounts of future periods are adjusted accordingly. If there is an indication that an impairment loss recognised for an asset other than goodwill may no longer exist or may have decreased, the recoverable amount of the assets is to be re-estimated. The difference resulting from the change of estimation is recognised as a reversal of impairment loss directly in the result for the period. A reversal of an impairment loss of the new recoverable amount to be determined is limited to the carrying amount that would have arisen if the acquisition costs had been carried forward. The depreciation and amortisation amounts of future periods are adjusted accordingly.
An impairment loss for the asset groups is determined based on the value in use. The present value of the future net cash inflows is determined, as an active market cannot be used as a reference. The forecast of net cash inflows is based on a single-value budget plan approved by the management for the KAP Group for the following three years. The planning is based on the general development of the respective markets and the profitability of the business. The value in use is determined using the risk addition method, which takes the expected risk into account by means of an addition to the capitalisation interest rate.
Capital costs are calculated as a weighted average of equity and borrowing costs (weighted average cost of capital – WACC). These are calculated on the basis of the capital asset pricing model (CAPM) on the basis of current market expectations. Specific peer group information for beta factors, capital structure data and borrowing costs is used to determine the risk-adjusted interest

KAP AG I ANNUAL FINANCIAL REPORT 2018
85
– –
rate for the purposes of impairment testing. Periods not included in the planning calculations are represented by the recognition of a terminal value. A sensitivity analysis is carried out with regard to the cost-of-capital rates.
The cost-of-capital rate was 5.51% (previous year: 5.6%) for engineered products, 5.23% (previous year: 5.6%) for flexible films, 6.52% (previous year: 5.6%) for it/services, 5.77% (previous year: 5.6%) for precision components and 7.33% (previous year: 5.6%) for surface technologies. The typical tax rate used was 30%. With a growth rate of 0% (previous year: 0%), this results in a pre-tax interest rate of 7.37% (previous year: 7.5%) for engineered products, 7.00% (previous year: 7.6%) for flexible films, 8.66% for it/services, 7.70% for precision components and 9.70% for surface technologies. An increase in the cost-of-capital rate by 1.0% (previous year: 1.0%) for the respective segment does not result in any unscheduled amortisation of goodwill.
Details of the KAP Group’s impairment methods for financial assets and liabilities to be accounted for in accordance with IFRS 9 and the calculation of valuation allowances are presented in note 43 on credit and default risk.
Financial assets accounted for using the equity method In the case of investments in associated companies and joint ventures accounted for using the equity method, the first-time recognition is made at acquisition cost plus any resulting negative goodwill. In the subsequent periods, the carrying amount of the shares changes by the pro rata result for the period. Dividends received are deducted from the carrying amount. Depreciation is carried out for the lower fair value, if necessary.
Other financial assets Interests in non-consolidated companies, investments not accounted for using the equity method and investment securities are classified as at fair value directly in equity (2017: amortised cost). Changes in fair value are recognised as gains or losses in other comprehensive income.
After initial recognition at acquisition cost, loans are recognised at amortised cost on subsequent balance sheet dates in accordance with their classification as other financial assets measured at amortised cost (2017: loans and receivables). Impairment losses recognised on the balance sheet date are taken into account with appropriate valuation allowances.
Deferred taxes Deferred taxes are recognised for temporary valuation differences. The calculation is based on the concept of the balance-sheet-oriented liability method, which encompasses all accounting differences and valuation differences recognised through profit and loss and directly in equity, insofar as these lead to a tax burden or relief in the future.
Deferred taxes on tax loss carry-forwards are capitalised if it is sufficiently probable that adequate taxable income will be available in future in order to be able to use these loss carry-forwards.
Deferred taxes are calculated based on the tax rates that apply or are expected in the individual countries at the time of realisation. Temporary valuation differences resulting from previous reporting periods are adjusted accordingly in the event of changes in tax rates.
Deferred tax assets and tax liabilities are offset if a legally enforceable right applies to offset actual tax assets against actual tax liabilities and they relate to income taxes levied by the same tax authority for the same tax subject.
Inventories Inventories are measured at the lower value of acquisition or manufacturing costs and net realisable value.
The acquisition cost of raw materials, supplies and merchandise includes all directly attributable costs.
In addition to the direct costs, the manufacturing costs of the unfinished and the finished products are also included in the manufacturing-related overhead costs based on normal capacity utilisation.
Inventory risks with respect to storage time and usability which result in a net realisable value less than the acquisition or manufacturing cost are taken into account with appropriate valuation allowances. If the reasons for an impairment loss that has already occurred in previous periods no longer apply, a reversal of an impairment loss is made up to the adjusted net realisable

KAP AG I ANNUAL FINANCIAL REPORT 2018
86
– –
value.
Other financial receivables and assets Unless they are derivative financial instruments, other financial receivables and assets are classified as financial assets measured at amortised cost (2017: loans and receivables). For the first-time recognition on the settlement date, they are recognised at acquisition cost, taking into account directly attributable transaction costs. On the balance sheet date, the measurement is carried out at amortised cost. Appropriate valuation allowances are made based on the expected credit losses over the term. Uncollectable receivables are recognised as losses on receivables. Non-interest-bearing and low-interest receivables with a maturity of more than one year are recognised at their present value.
If an impairment loss that was recognised in previous reporting periods has decreased in the past financial year due to circumstances that have arisen in the meantime, the original valuation allowance is adjusted through profit and loss, but at most until the carrying amount corresponds to the amortised cost which would have resulted without an impairment.
Income tax assets and income tax liabilities Income tax liabilities for current and earlier periods are recorded as liabilities at the amount still payable. If the advance payments exceed the amount owed, the difference is recognised as income tax assets.
Derivative financial instruments Derivative financial instruments are acquired to hedge currency and interest rate risks arising from the operating business and the associated financing activities, and they are classified as at fair value through profit or loss.
The derivatives are booked for the first time on the settlement date. The fair value is determined as of the balance sheet date. Derivatives with positive fair values are reported under other receivables and assets, and derivatives with negative fair values – depending on their maturity – are reported under other non-current liabilities or other liabilities.
Securities Listed shares are classified as at fair value directly in equity. The valuation is carried out at acquisition cost at the time of acquisition and at the balance sheet date at the current market price (fair value or market value; valuation hierarchy level 1). The fluctuations in value between the cost of acquisition and the market value on the reporting date are recognised directly in equity until the sale of the shares. Upon disposal, the cumulative gains and/or losses are recognised through profit or loss in the income statement. If there are objective indications of a permanent or significant impairment, the cumulative losses in equity are recognised through profit or loss. Due to the liquidity on the stock exchange, the shares are reported under current assets.
Non-current assets held for sale and discontinued operations Non-current assets and/or disposal groups, as well as liabilities associated with non-current assets and disposal groups, are classified as held for sale if the corresponding carrying amounts will be realised principally through a sale transaction rather than through continuing use.
These non-current assets and/or disposal groups are recognised at the lower of their carrying amount and fair value less costs to sell as of the balance sheet date. They are reported separately from other assets in the balance sheet. Liabilities from non-current assets classified as held for sale and disposal groups are reported separately from other liabilities.
Provisions for pensions and similar obligations Provisions for pensions are based on actuarial assessments at the end of each financial year using the 2015 Heubeck mortality tables for the previous year and October 2018. The obligations are calculated using the projected-unit-credit method. In addition to the pension entitlements already earned in previous periods, certain trend assumptions are taken into account in the calculation.
Actuarial gains and losses are always recognised in full as other comprehensive income in equity under reserves. Service costs are recognised in personnel expenses.
Qualifying insurance policies are treated as plan assets and measured at fair value on the balance sheet date. The value of plan assets reduces the present value of the defined-benefit obligations. In the balance sheet, the plan assets are offset by at most the

KAP AG I ANNUAL FINANCIAL REPORT 2018
87
– –
present value of the obligation.
The expenses from the compounding of interest on pension provisions and the income from the plan assets are netted out and recognised in the financial earnings.
Other provisions Other provisions include all present obligations to third parties based on past events which are likely to be claimed and the expected amount of which can be estimated with a sufficient degree of certainty.
They are measured at the settlement amount with the highest probability of occurrence, taking future cost increases into account.
Provisions are only made for restructuring measures if there is a factual obligation to restructure. This requires a formal restructuring plan – including indications of the business area concerned, the most important locations, the number of employees concerned, the costs and the date of implementation – as well as having created a justified expectation among those affected by beginning the implementation or announcing to those concerned that the measure will be implemented.
Share-based remuneration The stock option programme that KAP AG introduced in the 2017 financial year is a virtual stock option programme with cash settlement. Under the programme, a provision proportionate to the level of the fair value of the payment obligation is formed on the respective reference date, with any changes in the fair value recognised through profit and loss.
The fair value of the virtual stock options is determined using the Black-Scholes-Merton model, where the following parameters – each of which was derived on the basis of the remaining term of the virtual stock options – are used in the calculation:
in % 31.12.2018 31.12.2017
Risk-free interest rate –0.61% or –0.53% –0.41%
Expected volatility 27.7% or 28.3% 32.9%
The expected volatility was derived using the historical volatility of KAP AG’s share price.
Financial liabilities Financial liabilities are classified as at amortised cost. Directly attributable transaction costs are recognised immediately as expenses in the result for the period. On the balance sheet date, the measurement is carried out at amortised cost using the effective interest method.
Liabilities from finance leases are recognised at the present value of the minimum lease payments. The resulting financing costs are recognised in financial earnings as interest expenses.
Revenue recognition Revenue is recognised when control over the identifiable goods or services is transferred to the customer, which means that the customer has the ability to determine the use of the transferred goods or services and derives materially all of the remaining benefits from them. Revenue is recognised when there is an enforceable right to receive payment from the customer. Revenue corresponds to the contractually agreed transaction price.
If the agreed transaction price includes variable components, the amount of consideration is determined either by the expected method or by the most probable amount.
The period between the payment by the customer and the transfer of goods or services to the customer is one year or less. For this reason, no financing component is included in the transaction price. If a contract contains several definable benefit obligations, the transaction price is allocated to the individual benefit obligations on the basis of the individual sale prices. As a rule, goods and services are sold at retail prices. Revenue from contracts with customers is recognised on a time and period basis. If the

KAP AG I ANNUAL FINANCIAL REPORT 2018
88
– –
performance condition and the receipt of payment from a customer are to differ in time, contractual assets or liabilities may arise.
The conclusion of a new contract with customers may result in order acquisition costs. Since the term of contracts for which the contract acquisition costs are incurred and the corresponding amortisation period for contract acquisition costs is one year or less, contract acquisition costs are not capitalised but recognised as an expense.
Revenue from the sale of goods: revenue from the sale of goods is recognised at the time of delivery, because control is transferred to the customer at this point in time. The claim for payment exists at the time of delivery.
Bill-and-hold agreements are generally not concluded. If a bill-and-hold agreement is expressly requested by the customer, revenue is recognised at the time of completion, since control is transferred to the customer even without physical delivery of the goods. In the case of a bill-and-hold agreement, the goods will be identified separately as those of the customer and may not be used elsewhere.
In a consignment contract, control of the goods passes to the customer when the goods are removed from the consignment warehouse, since the customer cannot benefit from using the goods before this point in time. Revenue is recognised at this time.
Revenue from the provision of services: revenue from the rendering of services is recognised over the period in which the services are rendered (on a straight-line basis or in accordance with the stage of completion). As a rule, the period of service provision is one week or less. If an invoice is issued, the claim for payment arises after the provision of a service. In the case of long-term orders, invoices are usually issued to the customer on a monthly basis. The company uses output-oriented methods for revenue recognition. In the case of advance payments, contractual liabilities are formed.
Warranties: in connection with the sale of its goods/services, the company is subject only to statutory or customary warranty obligations.
Earnings per share Earnings per share are calculated by dividing the result for the period attributable to the ordinary shareholders of the parent company (KAP AG shareholders’ consolidated annual result) by the average number of ordinary shares outstanding in the reporting period.
Estimates As part of the preparation of the consolidated financial statements, estimates must be made for various items that can affect the recognition and measurement of assets and liabilities, expenses and income as well as contingent liabilities. The actual valuations may deviate from the estimated amounts. Adjustments to the valuations are made in the period in which the original estimate is changed. The resulting expenses and income are recognised through profit and loss in the respective reporting period. Assumptions and estimates must be made and carried out in particular when establishing useful lives for non-current assets, in impairment tests and purchase price allocations, and when making provisions for retirement benefits, taxes and risks from operating business.

KAP AG I ANNUAL FINANCIAL REPORT 2018
89
– –
6. NEW ACCOUNTING STANDARDS a) Standards/interpretations to be used for the first time in the 2018 financial year
Standard/interpretation Mandatory from1 Adopted by the EU Commission2
Foreseeable effects
Amendments to IFRS 2
Amendments to IFRS 2 ‘Share-based Payment’; recognition of vesting conditions in measurement; classification of share-based payment transactions that provide for a net withholding of tax; accounting for a change in conditions
01.01.2018 Yes None
Amendments to IFRS 4
Amendments to IFRS 4 ‘Insurance Contracts’; adjustments due to first-time adoption of IFRS 9 for insurers (deferral of first-time adoption of IFRS 9 or transition)
01.01.2018 Yes No effects
IFRS 9 Financial Instruments: rules for the classification and measurement of financial assets and liabilities and for derecognition of financial assets and liabilities
01.01.2018 Yes See note below
IFRS 15 Revenue from Contracts with Customers 01.01.2018 Yes See note below
Amendments to IFRS 15
‘Revenue from Contracts with Customers’; clarifications to identify the performance obligations under a contract; clarification to estimate whether an entity is principal or agent of a transaction; clarification to estimate whether income from a licence granted is to be recognised on a time-related or period-related basis
01.01.2018 Yes Facilitation to reduce the complexity and cost of switching to
the new standard
Amendments to IAS 40
Amendments to IAS 40 ‘Investment Property’; clarification of the requirements in IAS 40.57 on transfers to or from investment property
01.01.2018 Yes None
IFRIC 22 Foreign Currency Transactions and Advance Consideration
01.01.2018 Yes Conversion of advance payments
made in foreign currency into the
functional currency at the spot rate on the
day of payment
Improvements to IFRS 2014–2016 (Annual Improvements)3
01.01.2018 Yes None
1 For financial years beginning on or after that date. At the time of adoption, reference was made to the date indicated by the European Union. 2 Until 31 December 2018. 3 Amendments to IFRS 1, IFRS 12, IAS 28.
IFRS 9 was applied for the first time as of 1 January 2018. The new regulations on the classification and measurement of financial assets and financial liabilities do not have any material effects. For trade receivables, the KAP Group applies the simplified impairment model of IFRS 9, according to which a provision for losses must be recognised for all instruments in the amount of the expected losses over the remaining term, irrespective of their credit quality. Due to the first-time application, there were no material effects on the financial position and financial performance. IFRS 15 will be applied for the first time as of 1 January 2018. The KAP Group applies the simplified retrospective method. IFRS 15 is only applied to contracts that have not yet been settled at the time of initial application. The application did not result in any significant transition effects, as the previous procedure is already largely in line with the new regulations. However, there are more extensive disclosures in the notes.
b) Standards/interpretations to be used for the first time in future financial years
Standard/interpretation Mandatory from1 Adopted by the EU Commission2
Foreseeable effects
Amendments to IFRS 9
Amendments to IFRS 9 ‘Financial Instruments’; financial assets with a negative prepayment penalty may, under certain circumstances, be carried at
01.01.2019 Yes None

KAP AG I ANNUAL FINANCIAL REPORT 2018
90
– –
Standard/interpretation Mandatory from1 Adopted by the EU Commission2
Foreseeable effects
amortised cost or at fair value directly in equity instead of at fair value through profit or loss
IFRS 16 Leases 01.01.2019 Yes See note below
IFRIC 23 Uncertainty over Income Tax Treatments 01.01.2019 Yes None
1 For financial years beginning on or after that date. At the time of adoption, reference was made to the date indicated by the European Union. 2 Until 31 December 2018.
IFRS 16 will be applied for the first time as of 1 January 2019. The effect of the standard is that almost all leases must be recognised in the balance sheet by the lessee because the distinction between operating and finance leases no longer exists. The standard will primarily affect the accounting treatment of operating leases.
The KAP Group intends to apply the modified retrospective transition method and will not retroactively adjust comparative amounts for the year prior to first-time adoption. The cumulative transition effect at the date of first-time adoption of IFRS 16 will be recognised as a one-time adjustment in the opening balance sheet in revenue reserves.
The KAP Group acts both as a lessee and as a lessor.
Accounting as a lessee For each lease, the KAP Group will generally recognise a right of use and a corresponding lease liability. The KAP Group will make use of the relief to measure the right to use the amount of the lease liability, adjusted for prepaid or deferred rental expenses.
The KAP Group will make use of the exceptions for short-term leases with a term of less than 12 months and leases for low-value assets with a new price of less than €5,000. Expenses for leases of assets with a reinstatement value of less than €5,000 are recognised directly in the income statement, so that neither a right of use nor a lease liability is recognised. The KAP Group will also combine components in the recognition of lease agreements, leases and non-leases.
Rights of use arising from leases are measured at acquisition cost upon initial recognition. The acquisition costs include the following components: the initial value of the lease liability, lease payments made before or at the inception of the lease, less incentives paid to the lessee and any initial direct costs incurred by the lessee.
As the KAP Group has decided to apply the acquisition cost model, the rights of use will in future be recognised at amortised cost less accumulated scheduled depreciation and amortisation and accumulated impairment losses. The lease term is generally used as the basis for determining the amount of depreciation. This does not apply if ownership of the leased asset is transferred to the KAP Group as lessee through the exercise of a purchase option or a contractual agreement. In this case, the useful life of the asset is used to determine depreciation.
The KAP Group will apply IAS 36 to determine whether a right of use is impaired.
The lease liability will be carried forward using the effective interest method. The lease liability is reduced by the repayment portion and the interest portion attributable to the liability is recognised as an expense.
The KAP Group will report its rights of use in the balance sheet items in which the underlying assets would have to be reported if they had been held by the group.
Last year, the KAP Group put together a project team to review all of the group’s leases for compliance with the new accounting standards of IFRS 16.
The KAP Group expects to capitalise a right of use in the range of €19.9 million and €21 million in the balance sheet as of 1 January 2019. It is expected that leasing liabilities of the same amount will have to be carried as liabilities. The KAP Group expects this to result in an increase in EBITDA within a range between €3.3 million and €3.6 million, as the lease payments will in future be reported as interest expenses and repayments in accordance with IFRS 16.

KAP AG I ANNUAL FINANCIAL REPORT 2018
91
– –
The capitalised rights of use are amortised over the term of the contract or the economic useful life. The lease term is generally used as the basis for determining the amount of depreciation. However, if ownership of the leased asset is transferred to the KAP Group as lessee through the exercise of a purchase option or a contractual agreement, the useful life of the asset is used to determine depreciation.
Accounting as a lessor The provisions of the new standard on accounting as the lessor have not changed significantly compared with the previous standard, so that no effects on the financial statements are to be expected with regard to the activity of the KAP Group as lessor. The activities of the KAP Group as a lessor are to be regarded as immaterial overall, so that this does not have a significant impact on the KAP consolidated financial statements. From the 2019 financial year onwards, additional disclosures are required in the notes.
c) Standards/interpretations not yet adopted by the EU Commission
Standard/interpretation Foreseeable effects
Supplements to IFRS 9
‘Financial Instruments’: new rules on hedge accounting in the form of a new general model for hedge accounting
None
IFRS 17 ‘Insurance Contracts’ None
Amendments to IFRS 3
Business combinations; clarifications for the definition and identification of a business operation
None
Amendments to IAS 1 and IAS 8
Amendments to IAS 1 ‘Presentation of Financial Statements’ and IAS 8 ‘Accounting Policies, Changes in Accounting Estimates and Errors’; creation of a uniform definition of materiality of financial information
None
Amendments to IAS 19
Amendments to IAS 19 ‘Employee Benefits’; pension obligations are to be measured on the basis of updated assumptions in the case of plan amendments, curtailments and settlements
None
Amendments to IAS 28 and IFRS 10
Amendments to IAS 28 ‘Investments in Associates and Joint Ventures’ and IFRS 10 ‘Consolidated Financial Statements’; recognition of total gains/losses when assets disposed of/contributed to a business operation within the meaning of IFRS 3
None
Revised framework concept; changes to content and changes/additions to sections None
Improvements to IFRS 2015–2017 (Annual Improvements)1 None
1 Amendments to IFRS 3, IFRS 11, IAS 12, IAS 23.
KAP AG I ANNUAL FINANCIAL REPORT 2018
92
– –
NOTES TO THE CONSOLIDATED FINANCIAL STATEMENTS CONSOLIDATED STATEMENT OF FINANCIAL POSITION
FIXED ASSETS
The list of shareholdings is shown under number 49 of the notes to the consolidated financial statements.
The composition and development of the fixed assets is shown separately in the consolidated statement of changes in fixed assets in note 11.
7. INTANGIBLE ASSETS The carrying amount at the end of the year relates to software and licences, goodwill, advance payments made on intangible assets and the assets for brands, technologies and customer relationships resulting from the purchase price allocations.
Intangible assets with indefinite useful lives are essentially brand names that have been established in the market for many years and whose useful lives are not foreseeable. In the 2018 financial year, the Heiche brand was acquired as part of the acquisition of the Heiche Group.
Of the customer relationships as of 31 December 2018 in the amount of €23,678 thousand (previous year: €8,710 thousand), €2,396 thousand (previous year: €147 thousand) relates to the flexible films segment, €750 thousand (previous year: €950 thousand) to the it/services segment and €20,455 thousand (previous year: €7,613 thousand) to the surface technologies segment. The useful lives are three to nine years (previous year: three to eight years).
Customer relationships amounting to €16,294 thousand were identified and measured as part of the purchase price allocations carried out in the financial year. These are recognised at fair value at the acquisition date and subsequently amortised on a straight-line basis over their estimated useful lives based on the projected cash flows from the contracts. The amortisation periods are between three and nine years.
Of the goodwill of €12,534 thousand (previous year: €12,870 thousand) reported as of 31 December 2018, €3,479 thousand (previous year: €5,339 thousand) is attributable to the cash-generating unit NOW Contec, €1,976 thousand (previous year: €1,976 thousand) to the cash-generating unit it/services, €6,409 thousand (previous year: €5,422 thousand) to the cash-generating unit GtO/MVD and €686 thousand (previous year: €0 thousand) to the cash-generating unit Heiche.
8. PROPERTY, PLANT AND EQUIPMENT Due to the long-term underutilisation of the production facilities at the India location, unscheduled depreciation of €5,200 thousand was set aside on the net realisable value and is recognised under depreciation and amortisation. The impairment is based on the estimate of an independent expert.
Technical equipment and machinery includes assets from finance leases amounting to €138 (previous year: €0 thousand). In the previous year, technical equipment was pledged as collateral for bank loans in the amount of €1,142 thousand.
Future minimum lease payments are as follows:

KAP AG I ANNUAL FINANCIAL REPORT 2018
93
– –
in € thousands 31.12.2018 31.12.2017
Future minimum lease payments Due within one year 499 0
Due between one and five years 15 –
Due after more than five years – –
Total 514 0
Interest portion included Due within one year –33 –
Due between one and five years – –
Due after more than five years – –
Total –33 –
Present value of future minimum lease payments Due within one year 467 0
Due between one and five years 15 –
Due after more than five years – –
Total 481 0
In the 2018 financial year, government grants in the amount of €196 thousand (previous year: €3,975 thousand) were recognised. Government grants were mainly granted for the acquisition of certain buildings and machinery at the Heinsdorfergrund and Döbeln locations. The conditions attached to these grants have been fully met.
9. INVESTMENT PROPERTY This disclosure relates to the commercial premises and buildings of MEHLER Aktiengesellschaft in Fulda, Flieden, and the commercial premises of GbR MEHLER/Daun in Stadtallendorf.
The KAP Group determines the fair value of the investment property held as financial investments using the income value method, taking into account the German regulation for property value determination (ImmoWertV; valuation hierarchy level 2). The expected future income and expenses of a property are discounted as a present value over an average period of ten years on the valuation date. Contractual terms of current rental agreements form the basis of the expected rental income; rent increases were not taken into account. On the cost side, maintenance expenditures, rent loss risks as well as cost increases of 2% per year are estimated, derived from the medium-term expected increase in the consumer price.
The following assumptions were made in order to determine the main valuation parameters such as the standard land value, property interest rate and the remaining useful life: the standard land values determined by appraisal committees were used as the basis. The property interest rate is determined according to the type of property, depending on the location, the type building and the condition of the property, the age, the potential rental growth and the location forecast. For the useful lives, the periods for which the lease has been concluded are taken into account. Third-party experts were not appointed for valuation purposes.
The following overview shows the main assumptions used in determining the fair value of the investment property as part of the valuation using the income value method:

KAP AG I ANNUAL FINANCIAL REPORT 2018
94
– –
2018 2017
Valuation parameters Range for commercial properties Range for commercial properties Residential
property
Market rent (€ per sq. m per year) 18.60 31.88 27.17 31.88 12.09
Property interest rate (%) 6.70 8.00 6.70 8.00 7.00
Remaining useful life (years) 1.00 17.00 7.00 18.00 2.00
Multiplier 0.93 9.97 5.02 10.28 1.81
The property interest rate was identified as the most important value driver of the market. After taking into account a market-based range of 6.50% to 8.50%, the following income values were determined:
2018 Range
2017 Range
6.50% 8.50% 6.50% 8.50%
Income value (in € thousands) 15,654 14,741 17,629 16,453
10. FINANCIAL ASSETS ACCOUNTED FOR USING THE EQUITY METHOD This disclosure relates to Safe-Box Self Storage Mönchengladbach GmbH, Mönchengladbach, Germany. Due to the shareholding of 33.33%, the company was included in the consolidated financial statements at equity.
11. OTHER FINANCIAL ASSETS This item mainly includes loans to participations amounting to €1,084 thousand (previous year: €1,182 thousand). The loans are based on long-term loan agreements.
Details on the development of the fair value of companies in which participations are held are presented in number 43 on financial instruments.

KAP AG I ANNUAL FINANCIAL REPORT 2018
95
– –
DEVELOPMENT OF GROUP FIXED ASSETS FROM 1 JANUARY TO 31 DECEMBER 2018
Acquisition/manufacturing costs Accumulated depreciation Carrying amounts
in € thousands
01.01. 2018
Currency adjustment
Adjustment IAS 29
hyperinflation
Change in
consoli-dated group
Additions Transfers Disposals Re-classifi-cation1
31.12. 2018
01.01. 2018
Currency adjustment
Adjustment IAS 29
hyperinflation
Change in
consoli-dated group
Additions Addi-tions
Trans-fers Disposals Re-classifi-cation1
31.12. 2018
31.12. 2018
01.01. 2018
Intangible assets
Software and licences
10,568 –27 – –3,999 846 45 210 – 7,643 9,220 –20 – –4,125 631 – – 210 – 5,916 1,726 1,348
Development costs
215 –9 – – – – – – 206 215 –9 – – – – – – – 206 – –
Brand and brand name
113 –5 – 3,315 9 – – – 3,433 68 –3 – 0 23 – – – – 89 3,345 45
Technology 28 –1 – 1,027 – – – – 1,054 17 –1 – – 43 – – – – 59 995 11
Customer relationships2
10,325 –15 – 16,294 – – – – 26,604 359 –9 – 52 2,524 – – – – 2,926 23,678 8,710
Other internally generated intangible assets
– – – – 37 – – – 37 – – – – – – – – – – 37 –
Goodwill2 16,509 –156 – 686 – 0 –492 – 16,548 4,506 – – – – – – –492 – 4,014 12,534 12,870
Advance payments made
30 –1 – – 27 –45 – – 12 – – – – – – – – – – 12 30

KAP AG I ANNUAL FINANCIAL REPORT 2018
96
– –
Acquisition/manufacturing costs Accumulated depreciation Carrying amounts
in € thousands
01.01. 2018
Currency adjustment
Adjustment IAS 29
hyperinflation
Change in
consoli-dated group
Additions Transfers Disposals Re-classifi-cation1
31.12. 2018
01.01. 2018
Currency adjustment
Adjustment IAS 29
hyperinflation
Change in
consoli-dated group
Additions Addi-tions
Trans-fers Disposals Re-classifi-cation1
31.12. 2018
31.12. 2018
01.01. 2018
on intangible assets
37,790 –213 – 17,323 919 0 –282 – 55,537 14,385 –42 – –4,072 3,221 – – –282 – 13,210 42,327 23,015
Property, plant and equipment
Land and buildings
120,119 –280 – –11,672
4,028 3,895 –199 – 115,891 61,521 –13 – –8,582 3,140 – – –99 – 55,966 59,925 58,598
Technical equipment and machinery
284,542 –21 – 732 5,120 8,746 –12,101 – 287,019 211,101 338 – –13,730 15,894 – – –12,111 – 201,493 85,526 73,441
Other equipment, plant and office equipment
49,570 –90 – 2,469 3,636 561 –4,449 – 51,696 36,929 –55 – –1,917 4,240 – – –3,849 – 35,348 16,349 12,641
Advance payments and assets under construction
8,109 –30 – 4,030 8,371 –13,236 –2 – 7,243 – –0 – – 17 – – – – 17 7,226 8,109
462,340 –420 – –4,440 21,155 –34 –16,751 – 461,850 309,551 270 – –24,229 23,292 – – –16,059 – 292,824 169,026 152,789
Investment property
19,224 – – – 75 34 – – 19,333 14,343 – – – 312 – – – – 14,655 4,678 4,881
Financial assets
– – – – – – – – – – – – – – – – – – – – 0

KAP AG I ANNUAL FINANCIAL REPORT 2018
97
– –
Acquisition/manufacturing costs Accumulated depreciation Carrying amounts
in € thousands
01.01. 2018
Currency adjustment
Adjustment IAS 29
hyperinflation
Change in
consoli-dated group
Additions Transfers Disposals Re-classifi-cation1
31.12. 2018
01.01. 2018
Currency adjustment
Adjustment IAS 29
hyperinflation
Change in
consoli-dated group
Additions Addi-tions
Trans-fers Disposals Re-classifi-cation1
31.12. 2018
31.12. 2018
01.01. 2018
accounted for using the equity method
Other financial assets
Shares in affiliated companies
99 – – – – – – – 99 72 – – – – – – – – 72 28 28
Investments in companies accounted for at cost
200 – – – – – – – 200 150 – – – – – – – – 150 50 50
Loans to affiliated companies
– – – – – – – – – – – – – – – – – – – – –
Loans to participations
1,402 – – – – – –98 – 1,304 220 – – – – – – – – 220 1,084 1,182
Other loans – –1 – 321 – – –107 – 213 – – – – – – – – – – 213 –
Investment securities
– – – – – – – – – – – – – – – – – – – – –
1,701 –1 – 321 – – –205 – 1,816 442 – – – – – – – – 442 1,374 1,260
521,056 –635 – 13,204 22,150 0 –17,238 538,536 338,721 228 – –28,301 26,824 – – –16,341 – 321,131 217,405 181,945
1 Reclassification to non-current assets held for sale. 2 Adjusted due to final purchase price allocation. As the figures are presented in € thousands, the numbers may not add up due to rounding.

KAP AG I ANNUAL FINANCIAL REPORT 2018
98
– –
DEVELOPMENT OF GROUP FIXED ASSETS FROM 1 JANUARY TO 31 DECEMBER 2017
Acquisition/manufacturing costs Accumulated depreciation Carrying amounts
in € thousands 01.01. 2017
Currency adjust-
ment
Adjust-ment IAS
29 hyperinfla
tion
Change in
consolidated group
Addi-tions
Transfers Dispo-sals
Reclassifi-cation
31.12. 2017
01.01. 2017
Currency adjustment
Adjustment IAS 29 hyper-
inflation
Change in
consoli-dated group
Addi-tions
Addi-tions
Transfers Dispo-sals
Reclassifi-cation
31.12. 2017
31.12. 2017
01.01. 2017
Intangible assets Software and licences
10,357 –10 – –394 6051 47 –37 – 10,568 9,111 6 – –385 525 – – –37 – 9,220 1,348 1,245
Development costs 221 –6 – – – – – – 215 207 –6 – – 14 – – – – 215 – 14
Brand and brand name
116 –3 – – – – – – 113 47 –2 – – 23 – – – – 68 45 70
Technology 29 –1 – – – – – – 28 12 0 – – 6 – – – – 17 11 17
Customer relationships
378 –10 – 7,700 1,0002 – – – 9,068 151 –6 – – 213 – – – – 359 8,710 227
Goodwill 4,823 –177 – 10,754 1,9762 – – – 17,376 4,676 –170 – – – – – – – 4,506 12,870 146
Advance payments made on intangible assets
20 0 – – 11 – – – 30 – – – – – – – – – – 30 20
15,944 –207 – 18,061 3,592 47 –37 – 37,400 14,204 –178 – –385 781 – – –37 – 14,385 23,015 1,741
Property, plant and equipment
Land and buildings 112,374 –435 – 3,207 1,476 3,699 –202 – 120,119 59,185 –102 – –532 2,971 – 163 –164 – 61,521 58,598 53,189
Technical equipment 253,503 –4,496 – 23,311 6,506 8,605 –2,887 – 284,542 191,632 –3,198 – 6,941 18,418 – – –2,692 – 211,101 73,441 61,871

KAP AG I ANNUAL FINANCIAL REPORT 2018
99
– –
Acquisition/manufacturing costs Accumulated depreciation Carrying amounts
in € thousands 01.01. 2017
Currency adjust-
ment
Adjust-ment IAS
29 hyperinfla
tion
Change in
consolidated group
Addi-tions
Transfers Dispo-sals
Reclassifi-cation
31.12. 2017
01.01. 2017
Currency adjustment
Adjustment IAS 29 hyper-
inflation
Change in
consoli-dated group
Addi-tions
Addi-tions
Transfers Dispo-sals
Reclassifi-cation
31.12. 2017
31.12. 2017
01.01. 2017
and machinery
Other equipment, plant and office equipment
45,999 –57 – 1,897 3,2563 115 –1,641 – 49,570 34,256 –33 – 621 3,473 – 4 –1,392 – 36,929 12,641 11,743
Advance payments and assets under construction
10,053 –244 – 344 9,668 –11,705 –7 – 8,109 – – – – – – – – – – 8,109 10,053
421,928 –5,232 – 28,760 20,907 714 –4,737 – 462,340 285,073 –3,333 – 7,030 24,862 – 168 –4,248 – 309,551 152,789 136,856
Investment property 19,940 – – – 45 –761 – – 19,224 14,200 – – – 312 – –168 – – 14,343 4,881 5,741
Financial assets accounted for using the equity method
2,010 – – – – – –2,010 – 0 – – – – – – – – – – 0 2,010
Other financial assets
Shares in affiliated companies
72 – – – 28 – – – 99 72 – – – – – – – – 72 28 –
Investments in companies accounted for at cost
735 – – – – – –535 – 200 685 – – – – – – –535 – 150 50 50
Loans to affiliated companies
– – – – – – – – – – – – – – – – – – – – –
Loans to participations
1,402 – – – – – – – 1,402 220 – – – – – – – – 220 1,182 1,182
Other loans – – – – – – – – – – – – – – – – – – – – –
Investment securities – – – – – – – – – – – – – – – – – – – – –

KAP AG I ANNUAL FINANCIAL REPORT 2018
100
– –
Acquisition/manufacturing costs Accumulated depreciation Carrying amounts
in € thousands 01.01. 2017
Currency adjust-
ment
Adjust-ment IAS
29 hyperinfla
tion
Change in
consolidated group
Addi-tions
Transfers Dispo-sals
Reclassifi-cation
31.12. 2017
01.01. 2017
Currency adjustment
Adjustment IAS 29 hyper-
inflation
Change in
consoli-dated group
Addi-tions
Addi-tions
Transfers Dispo-sals
Reclassifi-cation
31.12. 2017
31.12. 2017
01.01. 2017
2,209 – – – 28 – –535 – 1,701 976 – – – – – – –535 – 442 1,260 1,232
462,032 –5,439 – 46,820 24,571 0 –7,319 – 520,666 314,452 –3,511 – 6,645 25,955 – 0 –4,820 – 338,721 181,945 147,580
1 Of this amount, €326 thousand is attributable to the acquisition of a business operation as part of a business combination. 2 Refers to the acquisition of a business as part of a business combination. 3 Of this amount, €4 thousand is attributable to the acquisition of a business operation as part of a business combination.
As the figures are presented in € thousands, the numbers may not add up due to rounding.

KAP AG I ANNUAL FINANCIAL REPORT 2018
101
– –
12. DEFERRED TAX ASSETS Deferred taxes are to be allocated to the following items:
31.12.2018 31.12.2017
in € thousands
Deferred tax
assets
Deferred tax
liabilities
Deferred tax
assets
Deferred tax
liabilities
Intangible assets 198 6,947 10 2,279
Property, plant and equipment 970 7,371 2,264 4,774
Investment property – – 265 –
Financial assets – 969 – –
Inventories 359 39 405 797
Receivables and assets 2,158 624 863 598
Pension provisions 2,501 – 2,587 –
Other provisions 557 45 626 81
Liabilities 859 1,219 156 258
Other 221 387 0 180
Gross value of deferred taxes on temporary valuation differences 7,823 17,601 7,175 8,967
Value adjustments on temporary valuation differences –99 – –213 –
Tax loss carry-forwards 7,558 – 7,580 –
Value adjustments on tax loss carry-forwards –6,177 – –6,080 –
Offsetting –4,292 –4,292 –2,364 –2,364
4,813 13,309 6,097 6,603
Valuation adjustments on deferred tax assets were carried out if there were uncertainties as to their usability. Positive earnings forecasts for subsequent periods are decisive for the usability of deferred tax assets on temporary valuation differences. For the use of tax loss carry-forwards, the duration of the ability to be carried forward must also be considered.
The balance of unused corporate income tax and comparable foreign loss carry-forwards is as follows:
in € thousands 31.12.2018 31.12.2017
Can be carried forward up to five years 15,706 14,654
Can be carried forward up to ten years 785 4,455
Can be carried forward more than ten years 57 224
Can be carried forward indefinitely 9,028 6,351
25,576 25,684
The balance of €3,345 thousand (previous year: €1,764 thousand) of unused commercial tax loss carry-forwards can be carried forward indefinitely.

KAP AG I ANNUAL FINANCIAL REPORT 2018
102
– –
No deferred tax assets were recognised for active temporary valuation differences in the amount of €5,348 thousand (previous year: €6,107 thousand).
Deferred taxes in the amount of €1,670 thousand (previous year: €2,344 thousand) were capitalised without being offset by positive results from the reversal of deferred tax liabilities. The companies expect positive taxable income in the future following tax losses in the 2018 financial year or in the previous year.
13. INVENTORIES
in € thousands 31.12.2018 31.12.2017
Raw materials and supplies 25,033 27,430
Valuation allowance –1,097 –1,141
Carrying amount 23,936 26,289
Unfinished products, unfinished services 17,671 19,914
Valuation allowance –392 –311
Carrying amount 17,279 19,603
Finished goods 27,114 24,706
Valuation allowance –1,439 –1,416
Carrying amount 25,674 23,291
Merchandise 2,128 5,174
Valuation allowance –153 –1,133
Carrying amount 1,975 4,041
Advance payments made on inventories 1,199 817
70,062 74,041
Of the total amount, inventories were recognised with a carrying amount of €7,485 thousand (previous year: €9,099 thousand) at net realisable value. The impairments on net realisable value recognised in the 2018 financial year amounted to €1,099 thousand (previous year: €1,647 thousand).
14. TRADE RECEIVABLES
in € thousands 31.12.2018 31.12.2017
Trade receivables from
– Third parties 62,831 63,939
– Affiliated companies 104 361
– Investment companies – –
62,935 64,300
Trade receivables are amounts owed by customers for goods sold or services rendered in the ordinary course of business. All trade receivables are due within one year and are therefore classified as current. Trade receivables are initially recognised at the amount of the unconditional consideration. The group holds trade receivables to collect the contractual cash flows and subsequently measures them at amortised cost using the effective interest method.
Valuation allowances of €2,392 thousand (previous year: €2,222 thousand) were recognised on receivables from third parties.

KAP AG I ANNUAL FINANCIAL REPORT 2018
103
– –
Details of the KAP Group’s impairment methods for trade receivables and the calculation of valuation allowances are presented in note 43 on credit and default risk.
15. INCOME TAX REFUND CLAIMS The disclosure as of the balance sheet date relates to refund claims from excess payments made in advance.
16. OTHER RECEIVABLES AND ASSETS The KAP Group classifies its other receivables and assets as financial assets at amortised cost if the financial asset is held in a business model whose objective is to collect contractual cash flows and these cash flows represent only principal repayments and interest payments on the outstanding principal amount.
in € thousands 31.12.2018 31.12.2017
Financial receivables from
– Third parties 18 0
– Affiliated companies 0 0
– Investment companies 61 63
Other assets 6,322 10,231
6,400 10,294
All other financial assets measured at amortised cost are due within one year and are therefore current. Due to the current nature of financial assets measured at amortised cost, their carrying amount corresponds to their fair value.
Valuation allowances amounting to €194 thousand (previous year: €153 thousand) have been made on financial receivables from third parties; €18 thousand had been made on receivables from affiliated companies in the previous year.
Details of the KAP Group’s impairment methods for other financial assets measured at amortised cost and the calculation of valuation allowances are presented in note 43 on credit and default risk.
17. CASH AND CASH EQUIVALENTS Cash and cash equivalents include checks, cash and bank balances in various currencies with a maturity of less than three months.
Cash and cash equivalents of €12 thousand (previous year: €150 thousand) are held by MEHLER ENGINEERED PRODUCTS (Suzhou) Co. Ltd., China, and are subject to the local foreign exchange restrictions. They are therefore not available for all transactions.
18. EQUITY AND RESERVES The changes in equity are shown separately in the consolidated statement of changes in equity.
Subscribed capital
The subscribed capital amounts to €20,176,917.80 (previous year: €17,223,559.60) and is divided into 7,760,353 (previous year: 6,624,446) no-par-value bearer shares which carry the same rights, and specifically the same voting rights. Each share carries one vote at the Annual General Meeting. There are no different classes of shares.
Authorised capital
The Annual General Meeting on 7 July 2017 further authorised the Management Board with the approval of the Supervisory Board to increase the share capital once or several times until 2022 to a limit of €3,444,711.92 by issuing up to 1,324,889 new no-par-value bearer shares with a pro rata share of €2.60 each in the share capital for cash and/or contributions in kind (authorised capital 2017). Even by way of indirect subscription under § 186 (5), sentence 1, of the AktG, shareholders must normally be given a shareholders’ subscription right. The Management Board is authorised to exclude the shareholders’ subscription right with the

KAP AG I ANNUAL FINANCIAL REPORT 2018
104
– –
approval of the Supervisory Board.
In the past 2018 financial year, the Management Board and Supervisory Board resolved to issue new shares totalling of 10.42% (previous year: 6.09%) of the share capital of 714,462 no-par-value shares (previous year: 403,400 no-par-value shares).
Specifically, the 10.17% (previous year: 5.57%) issue of new shares as part of capital increases against contribution in kind was used exclusively for the purpose of acquiring companies, parts of companies or equity interests in Heiche Logistics GmbH, Schwaigern, Germany (270,524 no-par-value shares), Heiche Oberflächentechnik GmbH, Schwaigern, Germany (343,938 no-par-value shares), and the NOW Group (100,000 no-par-value shares). Additionally, 0.30% of the shares (18,045 shares) were issued against cash contributions.
The capital increases resolved in 2017 (403,400 no-par-value shares) were not entered into the commercial register of the company with legal effect until the current 2018 financial year. Of the capital increases resolved in 2018 (732,507 no-par-value shares), all were entered in the commercial register by 31 December 2018.
Capital reserve
The capital reserve includes the premium paid in excess of the nominal amount when the shares were issued.
Reserves
The group’s reserves include differences from the currency translation of foreign financial statements, changes in the fair values of assets measured at fair value with no effect on income and actuarial gains and losses. In addition to the allocation to the reserves of KAP AG, other reserves also include the offsetting of asset-side and liabilities-side differences from the capital consolidation of fully consolidated subsidiaries under German commercial law prior to 1 January 2004 and retained for IFRS accounting purposes, as well as the effects of the measurement of IAS/IFRS applied for the first time and not recognised in income.
Consolidated balance sheet earnings
Consolidated balance sheet earnings include the results of the companies included in the consolidated financial statements achieved in past periods less distributions to the shareholders of KAP AG.
Non-controlling interests
The non-controlling interests comprise the other shareholders’ shares in assets, liabilities and annual results, the pro rata differences arising from currency translation of the annual financial statements of foreign subsidiaries recognised directly in equity, and other items of other comprehensive income recognised under reserves.�
Capital management
Our goal is to secure long-term business continuity and generate appropriate returns for shareholders. This also includes ensuring that sufficient liquidity and access to the capital market are available at all times. The management of the capital structure takes account of the overall economic conditions as well as the risks arising from the underlying assets.
We aim to achieve these goals by optimising the capital structure through equity measures, acquisitions and divestments, restructuring measures and the reduction of financial debt.
Capital management in the strict sense comprises equity and reserves, as well as non-current and current financial liabilities.
19. SHARE-BASED REMUNERATION KAP AG has maintained a virtual stock option programme with cash settlement since 2017. The programme stipulates that the beneficiaries receive a cash settlement from the company upon exercise of the options. The cash settlement entitlement corresponds to the difference between the average share price (XETRA trading, Deutsche Börse AG, Frankfurt am Main) of the last 20 trading days prior to exercising the option and the base value of €30 or €33. The entitlement is limited in amount to €40 per option, whereby an adjustment is made for dividend distributions made in the meantime and any dilution effects in the event of capital increases.

KAP AG I ANNUAL FINANCIAL REPORT 2018
105
– –
On a one-time basis upon their appointment on 1 August 2017, one member of the Management Board was granted 100,000 virtual stock options, which are vested over a period of four years. The exercise date is 31 July 2021. As capital increases took place between the granting of the virtual stock options and the balance sheet date, the number of virtual stock options increased to 119,562 (previous year: 105,871). As of the balance sheet date, the remaining term of the virtual stock options was 31 months until the exercise date. The obligation amounts to €249 thousand (previous year: €99 thousand). Expenses from allocations to provisions amounted to €150 thousand in the financial year (previous year: €99 thousand).
Another Management Board member was also granted 100,000 virtual stock options on a one-time basis as of 1 November 2018, which are vested over a period of four years, with the vesting period commencing on 1 May 2018. The exercise date is 30 April 2022. As capital increases took place between the approval of the virtual stock options and the balance sheet date, the number of virtual stock options increased to 112,700 (previous year: 0). As of the balance sheet date, the remaining term of the virtual stock options was 40 months until the exercise date. The obligation amounts to €99 thousand (previous year: €0). Expenses from allocations to provisions amounted to €99 thousand in the financial year (previous year: €0).
At the beginning of the period, a total of 105,871 virtual stock options were outstanding. In the reporting period, 126,391 further options were granted, which is why 232,262 virtual stock options were outstanding as of the balance sheet date, none of which were exercisable.
20. PROVISIONS FOR PENSIONS AND SIMILAR OBLIGATIONS The balance sheet disclosure is made up as follows:
in € thousands 31.12.2018 31.12.2017 31.12.2016 31.12.2015 31.12.2014
Pension obligations 17,829 18,199 20,667 19,332 20,218
Similar obligations 251 281 292 205 252
18,080 18,480 20,958 19,537 20,470
Pension obligations
The company pension provision consists of defined-contribution and defined-benefit plans. In the case of the defined-benefit pension plans, there is an obligation pay the benefits promised. The actuarial risk and the investment risk remain with the company. Provisions are made for the obligations from entitlements and current benefits to eligible and active as well as former employees and their surviving relatives. The benefits are based on individual commitments, which differ from one country to another and one company to another. As a rule, they are measured according to the length of employment and remuneration of employees.
In the case of the defined-contribution pension plans, there are no further obligations beyond the payment of contributions to external pension providers. The amount of the obligations is calculated using actuarial methods. The current contribution payments are recorded as pension expenses for the respective year.
Material pension obligations from defined-benefit pension commitments exist at Mehler Aktiengesellschaft in the amount of €10,086 thousand (previous year: €10,453 thousand), MEHLER ENGINEERED PRODUCTS GMBH in the amount of €2,200 thousand (previous year: €2,220 thousand) and Gear Motion GmbH in the amount of €4,047 thousand (previous year: €4,030 thousand). The commitments provide for lifelong pension payments depending on length of service and gross basic salary at the start of the benefit event and generally also include benefits in the event of disability and death. The benefit event occurs at the latest at the age of 65. As a rule, a vested entitlement exists if the beneficiary has reached the age of 35 at the time of leaving the company or if uninterrupted employment with the company began at least 12 years ago and the pension commitment has existed for at least three years. All pension schemes are already closed for new employees.
For the KAP Group, risks from pension commitments arise primarily from changes in the actuarial interest rate, the adjustment of current benefits and a longer life expectancy. Apart from the annual allocation to the pension provision, no other measures were taken to meet the existing obligations.

KAP AG I ANNUAL FINANCIAL REPORT 2018
106
– –
Pension commitments granted under deferred-compensation agreements are covered by the conclusion of life insurance policies as plan assets. The fair value of plan assets is significantly influenced by the interest rate environment on the capital markets and the underlying guaranteed interest rate.
Composition of pension obligations
in € thousands 2018 2017 2016 2015 2014
Present value of the unfunded obligations 19,588 19,943 22,375 21,004 21,843
Fair value of the plan assets –1,759 –1,744 –1,708 –1,672 –1,626
Pension obligations as of 31 December 17,829 18,199 20,667 19,332 20,218
Development of the pension provisions
in € thousands 2018 2017 2016 2015 2014
Balance as of 1 January 18,199 20,667 19,332 20,218 18,450
Pensions paid –1,091 –1,078 –1,036 –1,064 –1,056
Allocation 694 –951 2,467 178 3,441
Additions¹ 27 745 – – –
Disposals¹ – –634 –96 – –617
Reversal – –550 – – –
Balance as of 31 December 17,829 18,199 20,667 19,332 20,218
– thereof pension provisions 19,588 19,943 22,375 21,004 21,843
– thereof assets –1,759 –1,744 –1,708 –1,672 –1,626
1 From changes in the consolidated group.
Pension obligations of €1,106 thousand (previous year: €1,017 thousand) are due within one year. In more than one year, but within five years, €4,281 thousand (previous year: €17,182 thousand) fall due. After more than five years, €12,443 thousand (previous year: €705 thousand) fall due.
Pension expenses
in € thousands 2018 2017 2016 2015 2014
Current service cost 24 23 43 48 83
Interest expense 327 251 374 394 562
Deferred compensation – – – – –
Past service cost – – – – 12
Components recognised through profit and loss 350 274 417 442 656
Allocations of actuarial gains (–)/losses (+) recognised directly in equity – from changes in financial – –1,596 2,102 – 2,727

KAP AG I ANNUAL FINANCIAL REPORT 2018
107
– –
in € thousands 2018 2017 2016 2015 2014
assumptions
– from changes in demographic assumptions 254 – – – –
– from adjustments based on experience 115 –151 –26 –230 237
Actuarial gains (–)/losses (+) from plan assets –22 –31 –20 –34 –8
Effect of asset limitation –4 4 –7 1 –172
Components recognised directly in equity 343 –1,775 2,050 –263 2,784
694 –1,501 2,467 178 3,441
– of which allocation 694 –951 2,467 178 3,441
– of which reversal – –550 – – –
Interest expense and income from plan assets are netted and recognised in interest earnings, actuarial gains and losses are recognised in other comprehensive income in equity under reserves and service cost is recognised in personnel expenses.
The actual income from plan assets amounted to €53 thousand in the reporting year (previous year: €52 thousand).
Significant calculation bases and assumptions for valuation:
in € thousands 31.12.2018 31.12.2017 31.12.2016 31.12.2015 31.12.2014
Actuarial interest rate 1.85 1.85 1.25 2.00 2.00
Expected return from plan assets 3.00 3.00 3.00 3.00 3.00
Future salary increases 0.00 0.00 0.00 0.00 0.00
Future pension increases 1.75 1.75 1.75 1.75 1.75
2018 2017
in € thousands
Increase of 0.5 percentage
points
Decrease by 0.5 percentage
points
Increase of 0.5 percentage
points
Decrease by 0.5 percentage
points
Present value of the obligation 17,016 19,307 17,937 20,365
Interest expense 419 274 425 277
Service cost 21 26 18 22
Similar obligations
Similar obligations include the cost of medical care for employees in South Africa after retirement. These obligations were present for KAP Textile Holdings SA Limited on the balance sheet date.
The following assumptions were used for the calculation:

KAP AG I ANNUAL FINANCIAL REPORT 2018
108
– –
in % 31.12.2018 31.12.2017 31.12.2016 31.12.2015 31.12.2014
Actuarial interest rate 9.00 8.76 8.76 7.37 7.37
Increase in healthcare costs 6.73 7.56 7.56 6.18 6.18
21. FINANCIAL LIABILITIES The financial liabilities include all interest-bearing liabilities of the KAP Group broken down by their maturity.
in € thousands 31.12.2018
Of which remaining term
of less than one
year 31.12.2017
Of which
remaining term of
less than one year
Financial institutions 83,118 59,005 78,447 44,998
Finance leases 481 15 0 –
Affiliated companies – – 17 –
Investment companies – – 3 –
Third parties 3,915 379 4,204 735
87,514 59,399 82,672 45,733
The effective interest rates of the liabilities to financial institutions range between 1.25% and 12.45% (previous year: 1.25% and 11.25%).
Of the liabilities to financial institutions, €6,033 thousand were secured by mortgages in the previous year.
The financing by some banks is linked to an equity ratio of 30%. The ratio of net financial debt to EBITDA may not exceed 3.0.
In the case of financial liabilities, the fair values do not differ significantly from the carrying amounts, as the interest payments on these loans either almost correspond to current market interest rates or the loans are short term.
22. OTHER NON-CURRENT LIABILITIES In addition to liabilities with a maturity of more than one year, this item includes obligations which are specific in terms of occurrence and amount but with a maturity of more than 12 months in the future. A discount is applied if the obligations are non-interest-bearing.
23. OTHER PROVISIONS
in € thousands 01.01. 2018 Currency
difference Additions1 Disposals1 Utilisation Allocation Reversal 31.12.2018
Personnel 11,543 –22 643 –1,169 –9,685 7,469 –807 7,973
Complaints and guarantees 15,068 –29 122 –2 –1,600 1,758 –1,989 13,329
Restructuring measures 1,596 – – – –1,155 210 –209 442
Impending losses from pending transactions 1,513 – 127 –212 –574 167 –162 859
Other accruals and provisions 1,430 37 2,230 –5 –1,809 973 –305 2,551

KAP AG I ANNUAL FINANCIAL REPORT 2018
109
– –
in € thousands 01.01. 2018 Currency
difference Additions1 Disposals1 Utilisation Allocation Reversal 31.12.2018
31,150 –14 3,122 –1,388 –14,822 10,577 –3,471 25,154
1 From changes in the consolidated group.
Personnel provisions mainly include bonuses, severance payments, flexitime balances and holiday entitlements. There are uncertainties as to the amount and timing of the outflows. These are expected to result in disbursements within one year.
Provisions for impending losses from pending transactions were made if none of the contracting parties had met their obligations completely. There are uncertainties as to the amount and timing of the outflows. These are expected to result in disbursements within one year.
The provision for restructuring measures was set aside on the basis of the resolution to close the Haslach location of the precision components segment. Implementation was largely completed in the 2018 financial year.
A large number of risks and obligations from operating business are reported under other provisions. There are uncertainties as to the amount and timing of the outflows. It is expected that other provisions of €5,477 thousand (previous year: €6,570 thousand) will have a term of more than one year. Interest expense amounts to €7 thousand (previous year: €13 thousand).
24. TRADE PAYABLES Trade payables comprise outstanding obligations arising from the delivery of goods and services, all of which are due within one year. The carrying amounts of trade payables correspond to their fair values due to their short-term nature.
25. ACTUAL INCOME TAXES This item relates to outstanding payment obligations from current income taxes.
26. OTHER LIABILITIES
in € thousands 31.12.2018 31.12.2017
Contractual liabilities 1,436 1,003
Other liabilities 6,983 24,157
8,419 25,159
Other liabilities have a residual term of up to one year. The disclosure includes liabilities for social security of €798 thousand (previous year: €603 thousand).
Other liabilities of €13,178 thousand in the previous year related to capital increases registered with but not yet recorded in the commercial register. This item also includes the purchase price for a further 25% of the shares in NOW Contec GmbH & Co. KG and Convert GmbH & Co. KG plus their general partner GmbHs.

KAP AG I ANNUAL FINANCIAL REPORT 2018
110
– –
CONSOLIDATED STATEMENT OF INCOME
27. REVENUE FROM CONTRACTS WITH CUSTOMERS The company generates revenue from contracts with customers through the sale of its products and services both on a time and period basis.
in € thousands 2018 2017
Continued operations 389,829 357,295
Discontinued operations 32,510 50,227
422,339 407,522
The breakdown of revenue by product group and geographical area is presented in the segment reporting under note 46.
28. OTHER OPERATING INCOME
in € thousands 2018 2017
Disposal of fixed assets 1,249 2,389
Exchange rate gains 1,673 1,032
Reversal of provisions 2,368 1,011
Reversal of valuation allowances for expected losses 214 307
Rental income from investment property 3,880 3,992
Other income 4,675 4,245
14,059 12,978
Other income mainly consists of rental income of €744 thousand (previous year: €621 thousand), income from the refund of expenses of €396 thousand (previous year: €203 thousand), insurance compensation of €188 thousand (previous year: €531 thousand), income relating to other periods in the amount of €857 thousand (previous year: €256 thousand) and income from distributions of €514 thousand in the previous year.
29. COST OF MATERIALS
in € thousands 2018 2017
Raw materials and supplies 185,539 181,979
Purchased services 33,882 30,536
219,422 212,515

KAP AG I ANNUAL FINANCIAL REPORT 2018
111
– –
30. PERSONNEL EXPENSES
in € thousands 2018 2017
Wages and salaries 76,801 70,873
Social security contributions and expenses for pension schemes 15,848 13,461
92,649 84,334
Social security contributions and expenses for pension schemes include expenses for statutory pension insurance in the amount of €3,532 thousand (previous year: €3,469 thousand) and for defined-contribution plans totalling €461 thousand (previous year: €504 thousand).
On average, the group employed:
2018 2017
Wage earners 1,979 1,596
Salaried employees 813 740
2,792 2,336
Trainees 62 60
2,854 2,396
31. DEPRECIATION AND AMORTISATION
in € thousands 2018 2017
Intangible assets 3,184 718
Property, plant and equipment 21,479 21,796
Investment property 312 312
24,974 22,826
Depreciation and amortisation includes unscheduled depreciation amounting to €805 thousand (previous year: €5,225 thousand).
32. OTHER OPERATING EXPENSES
in € thousands 2018 2017
Maintenance 11,439 11,010
Outgoing freight 7,411 7,432
Additions to valuation allowances for expected losses 381 417

KAP AG I ANNUAL FINANCIAL REPORT 2018
112
– –
in € thousands 2018 2017
Commissions 1,053 1,374
Insurances 1,441 1,326
Losses on receivables 46 35
Legal and consulting fees 10,406 7,728
Packaging materials 3,397 3,522
Rent and leasing 2,479 1,122
Exchange rate losses 1,679 1,658
Allocation to provisions 11 92
Disposal of fixed assets 379 162
Other taxes 954 1,108
Expenses for investment properties 612 923
Complaints and guarantees 1,470 2,295
Other expenses 14,326 12,624
57,484 52,828
Other expenses include a variety of amounts related to operational, administrative and sales activities.
33. RESULT FROM THE DISPOSAL OF FIXED ASSETS AND LIABILITIES
in € thousands 2018 2017
18 23,047
The amount from the previous year relates to €20,906 thousand for the income resulting from the sale of shares in Kirson Industrial Reinforcements GmbH as well as €2,141 thousand for STÖHR & Co. AG i.L.
34. INTEREST RESULT
in € thousands 2018 2017
Interest income
Third parties 91 125
Investments 68 75
Other 17 8
Interest expense Third parties –4,045 –3,731
Affiliated companies – –

KAP AG I ANNUAL FINANCIAL REPORT 2018
113
– –
in € thousands 2018 2017
Investments – –
Compounding of interest on pension obligations –327 –251
Finance leases –16 –7
Other –7 –70
–4,219 –3,851
35. OTHER FINANCIAL EARNINGS
in € thousands 2018 2017
–996 8,168
Other financial earnings include expenses and income from other financial assets and liabilities which do not result from the operating business and do not represent income from investment or the interest result.
In the previous year, income from the disposal of securities was €10,934 thousand. For this purpose, €10,748 thousand from the reserve for financial assets available for sale was reclassified in the consolidated statement of income. In addition, exchange rate losses from financing activities of €297 thousand (previous year: €2,637 thousand) are included.
36. INCOME TAXES
in € thousands 2018 2017
Actual income taxes –6,001 –2,440
Deferred taxes – temporary valuation differences 1,103 –742
Deferred taxes – tax loss carry-forwards –131 230
–5,029 –2,952
Deferred tax assets and liabilities are calculated using a tax rate of 30% for domestic companies. This includes, in addition to corporation tax rate, the solidarity surcharge on corporation tax of 5.5%, as well as the weighted tax rate for commercial income.
The calculation of the actual taxes for the respective financial year was made on the basis of the tax rates applicable for the assessment period.
In the case of foreign subsidiaries, the respective applicable or anticipated income tax rates are used. These are between 9% (previous year: 19%) and 38% (previous year: 38%).
The tax expense for the financial year can be reconciled with consolidated earnings as follows:
in € thousands 2018 2017
Consolidated annual result before income taxes including discontinued operations 19,792 33,937
KAP Group income tax rate 30% 30%
Expected income taxes –5,938 –10,133

KAP AG I ANNUAL FINANCIAL REPORT 2018
114
– –
in € thousands 2018 2017
Variances due to different tax rates 415 –520
Tax reductions (+)/increases (–) due to tax-exempt income/non-tax-deductible expenses –629 7,727
Taxes on previous years 341 –11
Change in valuation allowances on deferred tax assets –356 909
Other effects 1,138 –924
Income tax according to the income statement –5,029 –2,952
Effective tax rate 25% 9%
Due to the actuarial gains and losses being recognised directly in equity, deferred taxes in the amount of €–232 thousand (previous year: €–532 thousand) were also recognised directly in equity under other comprehensive income.
37. GAINS/LOSSES FROM DISCONTINUED OPERATIONS The expenses and income attributable to Geiger Fertigungstechnologie GmbH are as follows:
in € thousands 2018 2017
Revenue 32,510 50,227
Change in inventories and other own work capitalised 1,745 –275
Total performance 34,255 49,952
Other operating income 266 148
Cost of materials –17,081 –26,909
Personnel expenses –9,680 –13,370
Depreciation and amortisation of intangible assets, property, plant and equipment and investment property –1,850 –3,129
Other operating expenses –3,122 –3,700
Result from the disposal of assets and liabilities 7,239 –
Operating earnings 10,028 2,993
Income taxes –18 –10
Earnings after taxes 10,010 2,983
Earnings share of non-controlling interests – –7
Earnings share of KAP AG shareholders 10,010 2,976
The income from the deconsolidation of Geiger Fertigungstechnologie GmbH amounts to €7,239 thousand. In the past, the company was allocated to the precision components segment (previous year: automotive components).
In addition, the result from discontinued operations of €1,079 thousand (previous year: €1,282 thousand) relates to the decline in contingent liabilities. Vis-à-vis the acquirer of the MVS Group, which was sold in the 2014 financial year, we have undertaken to assume responsibility for any risks arising from warranties and price tests for revenue up to the date of the disposal. The amount is attributable to the shareholders of KAP AG.

KAP AG I ANNUAL FINANCIAL REPORT 2018
115
– –
38. RESULT SHARE OF NON-CONTROLLING INTERESTS This item includes shareholders of various subsidiaries in addition to KAP AG. The result share contains the compensation obligation from a profit-and-loss transfer agreement.
39. EARNINGS PER SHARE Earnings per share is calculated as the quotient of the consolidated annual result of KAP AG shareholders and the weighted average number of the shares in circulation during the financial year.
2018 2017
Consolidated annual result of KAP AG shareholders (in € thousands) 14,771 31,021
Weighted average number of shares (in 1,000) 7,195 6,624
Earnings per share (in EUR)
– of which from continued operations 0.50 4.04
– of which from discontinued operations 1.55 0.64
2.05 4.68
There were no effects resulting in the dilution of earnings per share in the reporting year or the previous year.

KAP AG I ANNUAL FINANCIAL REPORT 2018
116
– –
OTHER DISCLOSURES
40. EXPENSES FOR RESEARCH AND DEVELOPMENT
Expenses for Research and Development in the reporting year amounted to €342 thousand (previous year: €438 thousand).
41. CONTINGENT LIABILITIES
The contingent liabilities below could in future result in the outflow of resources with which economic benefits are associated. The valuation is carried out at the nominal value.
in € thousands 2018 2017
Sureties – –
– of which affiliated companies – –
Warranties 99 148
– of which affiliated companies – –
Security – –
– of which affiliated companies – –
Total 99 148
– of which affiliated companies – –
42. OTHER FINANCIAL OBLIGATIONS
in € thousands 2018 2017
Intangible assets – –
– of which affiliated companies – –
Property, plant and equipment 1,474 6,951
– of which affiliated companies – –
Investment property 6 36
– of which affiliated companies – –
Obligations from non-cancellable rental and lease agreements 24,393 3,386
– of which affiliated companies – –
Total 25,873 10,373
– of which affiliated companies – –
The sum of future payments from non-cancellable rental and lease agreements (operating leases) is made up as follows:
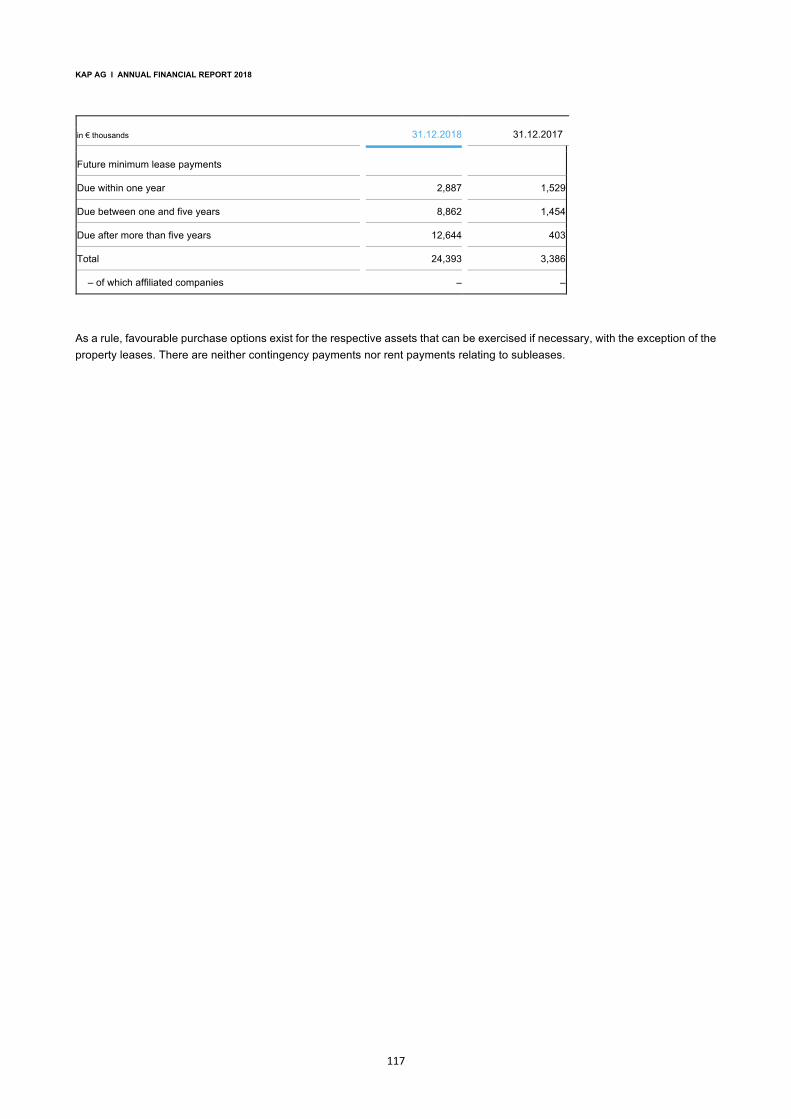
KAP AG I ANNUAL FINANCIAL REPORT 2018
117
– –
in € thousands 31.12.2018 31.12.2017
Future minimum lease payments Due within one year 2,887 1,529
Due between one and five years 8,862 1,454
Due after more than five years 12,644 403
Total 24,393 3,386
– of which affiliated companies – –
As a rule, favourable purchase options exist for the respective assets that can be exercised if necessary, with the exception of the property leases. There are neither contingency payments nor rent payments relating to subleases.

KAP AG I ANNUAL FINANCIAL REPORT 2018
118
– –
43. FINANCIAL INSTRUMENTS
The carrying amounts and fair values of the financial instruments are allocated to the valuation categories as shown below:
Balance sheet item Measurement category under IFRS 9
Measurement category under IAS 39
Carrying amount
Valuation hierarchy Level 1
Valuation hierarchy level 2
Valuation hierarchy level 3
Fair value Carrying amount
Valuation hierarchy level 1
Valuation hierarchy level 2
Valuation hierarchy level 3
Fair value
in € thousands 31.12.2018 31.12.2018 31.12.2017 31.12.2017
ASSETS
Shares in affiliated companies
At fair value through profit or loss
– 28 – – – 28 28 – – – 28
Shares in participations At fair value through profit or loss
– 50 – – – 50 50 – – – 50
Loans to participations Financial assets measured at amortised cost
Loans and receivables 1,084 – – – 1,084 1,182 – – – 1,182
Other loans Financial assets measured at amortised cost
Loans and receivables 213 – – – 213 – – – – –
Trade receivables Financial assets measured at amortised cost
Loans and receivables 62,935 – – – 62,935 64,300 – – – 64,300
Other receivables and assets
Financial assets measured at amortised cost
Loans and receivables 6,400 – – – 6,400 10,294 – – – 10,294
Cash and cash equivalents Loans and receivables 11,727 – – – 11,727 10,079 – – – 10,079
LIABILITIES
Financial liabilities Financial liabilities measured at amortised cost
Financial liabilities 87,514 – – – 87,514 82,672 – – – 82,672
Other non-current liabilities Financial liabilities measured at amortised cost
Financial liabilities 349 – – – 349 – – – – –
Trade payables Financial liabilities measured at amortised
Financial liabilities 24,292 – – – 24,292 27,850 – – – 27,850

KAP AG I ANNUAL FINANCIAL REPORT 2018
119
– –
Balance sheet item Measurement category under IFRS 9
Measurement category under IAS 39
Carrying amount
Valuation hierarchy Level 1
Valuation hierarchy level 2
Valuation hierarchy level 3
Fair value Carrying amount
Valuation hierarchy level 1
Valuation hierarchy level 2
Valuation hierarchy level 3
Fair value
in € thousands 31.12.2018 31.12.2018 31.12.2017 31.12.2017
cost
Other liabilities Financial liabilities measured at amortised cost
Financial liabilities 6,802 – – – 6,802 23,708 – – – 23,708
Valuation hierarchy 1: Market values were determined on the basis of quoted, unadjusted prices on active markets for these or identical assets and liabilities.
Valuation hierarchy 2: The market value was determined on the basis of parameters for which either directly or indirectly derived quoted prices are available on an active market.
Valuation hierarchy 3: The market value was determined on the basis of parameters for which no observable market data are available.
The carrying amounts represent reasonable approximations of the fair values.

KAP AG I ANNUAL FINANCIAL REPORT 2018
120
– –
GAINS AND LOSSES ON FINANCIAL INSTRUMENTS
Net gains or losses as well as total interest income and expenses for financial assets and financial liabilities that are not measured at fair value through profit or loss can be allocated to the various categories of financial instruments as follows:
in € thousands 2018 2017
Financial assets at fair value with no effect on income (previous year: financial assets available for sale) Gains/losses recognised in equity (–) – –
Income from dividends – –
Income from the sale of securities – 10,934
Losses recognised in the income statement (–) – –1
Financial assets measured at amortised cost (previous year: loans and receivables) Interest income 160 200
Impairments (–)/reversals –400 –158
Financial liabilities measured at amortised cost (previous year: financial liabilities) Interest expenses 4,062 3,738
Exchange rate gains and losses (–) from financing activities –297 –2,637
The securities classified as financial assets at fair value with no effect on income (previous year: financial assets available for sale) were measured on the basis of prices quoted on active markets for identical assets.
Interest income from financial assets measured at amortised cost (previous year: loans and receivables) is calculated using the effective interest rate on the gross carrying amount of the financial asset. For assets whose creditworthiness is impaired, the effective interest rate is subsequently applied to the amortised cost of the financial asset (after deducting the valuation allowance).
Credit and default risk The amount of the maximum risk exposure for financial assets on the balance sheet date corresponds to the amounts specified in the balance sheet if the contracting parties cannot meet their payment obligations. Cash and cash equivalents are also subject to the impairment provisions of IFRS 9, but no impairment was identified.
Credit information and references are collected to minimise risk of default. For trade receivables, commercial credit insurance is partially in place. The KAP Group applies the simplified approach under IFRS 9 to measure expected credit losses. Accordingly, the expected credit losses over the term are used for all other financial assets measured at amortised cost.
The expected loss rates on trade receivables are based on the payment profiles of revenue over a period of 36 months prior to 31 December 2018 or 1 January 2018 and the corresponding historical defaults in this period. Historical loss ratios are adjusted to reflect current and forward-looking information on external market parameters, internal factors and specific information affecting customers’ ability to pay receivables.
On this basis, the valuation allowance for trade receivables and contract assets was determined as follows as of 31 December

KAP AG I ANNUAL FINANCIAL REPORT 2018
121
–
–
2018 and 1 January 2018 (upon adoption of IFRS 9):
31.12.2018
in € thousands
Less than three
months Three to six
months Six to nine
months Over nine
months Total
Expected loss rate 0–25% 0–32% 0–50% 0–100% Gross carrying amount of trade receivables 63,291 995 304 633 65,223
Valuation allowances 1,828 60 57 448 2,392
01.01.2018
in € thousands
Less than three
months Three to six
months Six to nine
months Over nine
months Total
Expected loss rate 0–18% 0–18% 0–100% 0–100% Gross carrying amount of trade receivables 65,631 126 120 283 66,160
Valuation allowances 1,937 16 46 223 2,221
According to the previous accounting method (IAS 39), the impairment of trade receivables was determined as follows when doubts arose about the creditworthiness of the customer:
in € thousands 2018 2017
Balance of valuation allowances on 1 January 2,221 2,811
IFRS 9 adjustment 43 –
Allocations 381 417
Utilisation/currency differences –296 –688
Reversals –201 –310
Disposals/change in consolidated group 244 –9
Balance of valuation allowances on 31 December 2,392 2,221
The first-time application of IFRS 9 did not result in any material changes in the calculation of valuation allowances compared with the calculation in accordance with IAS 39.
Liquidity risk
Solvency is ensured at all times through liquidity planning, a cash reserve and confirmed credit lines. The cash-pooling system ensures that the operating units are supplied with sufficient liquidity at all times. The control is managed centrally by KAP AG. Diversification with respect to external equity providers reduces the dependency on individual lenders.
The maturity structure of the contractual, non-discounted and expected cash flows of financial liabilities is as follows:

KAP AG I ANNUAL FINANCIAL REPORT 2018
122
–
–
31.12.2018
in € thousands
Remaining term
up to one year
Remaining term from one
to five years
Remaining term
more than five years Total
Other non-current liabilities – 349 – 349
Financial institutions 24,113 49,005 10,000 83,118
Finance leases 467 15 – 481
Affiliated companies – – – –
Investment companies – – – –
Third parties 3,536 371 8 3,915
Goods and services 24,292 – – 24,292
Other liabilities 6,802 – – 6,802
59,210 49,739 10,008 118,957
31.12.2017
in € thousands
Remaining term
up to one year
Remaining term from one
to five years
Remaining term
more than five years Total
Financial institutions 33,449 34,998 10,000 78,447
Finance leases 0 – – 0
Affiliated companies 17 – – 17
Investment companies 3 – – 3
Third parties 3,469 735 – 4,204
Goods and services 27,850 – – 27,850
Other liabilities 23,708 – – 23,708
88,498 35,733 10,000 134,231
Market risks
The main market risks to which the KAP Group is exposed arise from changes in currency exchange rates, interest rates and prices of raw materials.
Hedging against these risks is generally achieved by means of closed items in which values or cash flows from original financial instruments are offset. To further reduce the risk, forward transactions are concluded in the form of swaps as required.
Currency risk
As a globally operating group, foreign exchange risks arise from various sales and procurement markets from the perspective of the respective national companies of KAP AG. In addition, there are occasionally risks associated with the financing activities of the foreign companies with KAP AG. We consider these risks to be manageable compared to the costs incurred in concluding hedging transactions and therefore largely forgo hedging against exchange rate fluctuations.
Key foreign currency items as of 31 December 2018:

KAP AG I ANNUAL FINANCIAL REPORT 2018
123
–
–
US dollar British pound Russian rouble
in thousands USD EUR GBP EUR RUB EUR
ASSETS Trade receivables 2,557 2,223 324 359 – –
Financial receivables – – – – – –
Other assets 23 20 Cash and cash equivalents 978 863 37 41 – –
Total 3,558 3,106 361 400 – –
LIABILITIES Financial liabilities 233 203 – – – –
Trade payables 855 746 – – – –
Total 1,088 949 – – – –
Revenue 14,060 11,867 2,802 3,163 435 6
Key foreign currency items as of 31 December 2017:
US dollar British pound Russian rouble
in thousands USD EUR GBP EUR RUB EUR
ASSETS Trade receivables 2,782 2,350 365 409 – –
Cash and cash equivalents 821 685 64 72 7,325 106
Total 3,603 3,035 429 481 7,325 106
LIABILITIES – – – – – –
Trade payables 1,617 1,348 – – – –
Other liabilities 4 3 – – – –
Total 1,621 1,351 – – – –
Revenue 10,618 9,431 2,490 2,845 21,062 318
Our foreign subsidiaries also carry out transactions in euros. These may lead to corresponding exchange rate gains or losses in the respective local financial statements.

KAP AG I ANNUAL FINANCIAL REPORT 2018
124
–
–
Risk concentration
The concentration of risks can result from dependence on a few major customers. A concentration of risks results when one customer accounts for 10% of the group’s revenue.
In the 2018 financial year, more than 10% of revenue was attributable to one (previous year: two) customer.
Interest rate risk
Interest rate risks arise when variable-rate loans are taken out. If necessary, we hedge against the risk of rising interest rates through the acquisition of payer swaps.
Financing in Germany is principally carried out via a syndicated loan agreement which has a term of five years. The interest rate depends on the EURIBOR, the net debt ratio and how much of the credit line has been used and the nature of its usage. Variable-interest working capital lines are in place at various foreign locations. The table below shows the amount by which interest expense would increase in the event of an interest rates rise:
2018 2017
in € thousands
Increase of 0.5 percentage
points
Decrease by 1.0 percentage
points
Increase of 0.5 percentage
points
Decrease by 1.0 percentage
points
Interest expense 369 –738 321 –641
44. EVENTS AFTER THE BALANCE SHEET DATE Up to 11 March, there were no significant events after the balance sheet date (approval for publication by the Management Board).
45. CONSOLIDATED STATEMENT OF CASH FLOWS The statement of cash flows separately shows cash flows from operating activities, from investing activities and from financing activities. Changes in the cash and cash equivalents due to exchange rates, the consolidated group and valuations are eliminated and reported separately.
Cash and cash equivalents comprise the liquid assets reported on the balance sheet date. The cash flow from operating activities is determined using the indirect method. The direct method is used for the presentation of cash flows from investing activities and financing activities.
Liquid assets decreased by €62 thousand (previous year: €76 thousand) as a result of exchange rate changes. Cash flow from operating activities includes:
in € thousands 2018 2017
Interest Interest paid (–) –4,106 –3,162
Interest received 211 178
–3,895 –2,984
Income taxes Income taxes paid (–) –4,156 –4,615
Income taxes refunded 635 749
–3,521 –3,865

KAP AG I ANNUAL FINANCIAL REPORT 2018
125
–
–
The change in liabilities from financing activities is as follows:
Net changes in cash
in € thousands 01.01.2018
Net changes
in cash Exchange rate
changes
Changes in consolidated
group Other
changes 31.12.2018
Financial institutions 78,447 13,923 361 –9,613 – 83,118
Finance leases – – – 478 3 481
Affiliated companies 17 –17 – – – –
Investment companies 3 –3 – – – –
Third parties 4,204 –289 – – – 3,915
82,672 13,614 361 –9,135 3 87,514
Net changes in cash
in € thousands 01.01.2017
Net changes
in cash Exchange rate
changes
Changes in consolidated
group Other
changes 31.12.2017
Financial institutions 85,977 –11,774 –745 4,989 – 78,447
Finance leases 545 –545 – – – –
Affiliated companies 17 – 0 – – 17
Investment companies 11 –8 – – – 3
Third parties 1,368 63 – 2,773 – 4,204
87,918 –12,264 –745 7,762 – 82,672
Due to the sale of Geiger Fertigungstechnologie GmbH, cash and cash equivalents in the amount of €397 thousand were transferred in the reporting year. The proceeds from the sale of Geiger Fertigungstechnologie GmbH amounted to €37,708 thousand.
The share of Geiger Fertigungstechnologe GmbH in the cash flow from operating activities amounted to €523 thousand and in the cash flow from investing activities to €–3,171 thousand.
The following assets and liabilities were disposed of:
in € thousands 2018
Non-current assets 21,451
Current assets 16,785
38,236
Non-current liabilities –

KAP AG I ANNUAL FINANCIAL REPORT 2018
126
–
–
in € thousands 2018
Current liabilities 28,680
28,680
The acquisition of the shares in the Heiche Group resulted in a cash outflow of €19,360 thousand. Cash and cash equivalents amounting to €2,703 thousand were acquired.
The following assets and liabilities were acquired:
in € thousands 2018
Non-current assets (including goodwill) 62,388
Current assets 11,798
74,186
Non-current liabilities 8,937
Current liabilities 20,184
29,121
46. SEGMENT REPORTING Due to the established internal financial reporting by the KAP Group, the primary reporting format is broken down by business segment.
Compared to the previous year, the portfolio was divided into the following more detailed segments in the 2018 financial year in order to better define the business activities:
engineered products (previous year: engineered products) flexible films (previous year: engineered products) it/services (previous year: engineered products) precision components (previous year: automotive components) surface technologies engineered products, flexible films, it/services, precision components and surface technologies each represent specific product groups.
The engineered products segment develops, manufactures and markets a wide range of special products made from technical yarns and fabrics which are used, for example, in the automotive industry as reinforcing support for the tyre industry, for roof-sarking membranes or reinforced plaster or in road construction.
The flexible films segment specialises in the coating and packaging of fleece, fabrics, films and paper used as roof-sarking membranes and in agriculture.
The it/services segment develops innovative solutions and provides IT and engineering services.
The precision components segment concentrates on the manufacture of complex metal, milled and plastic parts.
The surface technologies segment specialises in surface coating and finishing.
In addition to KAP AG, the holding companies KAP Textile Holdings SA Limited, MEHLER Aktiengesellschaft, KAP Beteiligungs

KAP AG I ANNUAL FINANCIAL REPORT 2018
127
–
–
Inc., GM Tec Industries Holding GmbH, KAP Surface Holding GmbH, Schäfflerbachstraße Grundbesitz GmbH, Mehler Grundstücksverwaltungs GmbH and GbR MEHLER AG/DAUN & Cie. AG are allocated to the reconciliation column.
The reconciliation of expenses and income to the corresponding group figures are shown in the table containing additional information to segment reporting in the notes to the consolidated financial statements.
The accounting and valuation methods used correspond to those of the consolidated financial statements.
Intra-group revenue is settled at standard market prices and is generally equivalent to prices used in third-party sales (‘at-arm’s-length principle’).
In the engineered products segment, revenue with one customer amounted to €49,595 thousand (previous year: €42,540 thousand).
In the precision components segment, revenue of €12,162 thousand (previous year: €11,393 thousand) was generated with one customer.
The segment result is defined as segment EBITDA (earnings before interest, taxes, depreciation and amortisation and the result of assets and liabilities disposed of). The segment EBITDA corresponds to the EBITDA of the group at group level.
Working capital is defined as inventories plus trade receivables less trade payables.
The reconciliation to EBITDA includes the elimination of inter-company results, receivables and liabilities as well as expenses and income that cannot be allocated to the business segments.
The engineered products segment included unscheduled depreciation of €5,200 thousand in the previous year.
The precision components segment included unscheduled depreciation of €25 thousand in the previous year.
The surface technologies segment includes unscheduled depreciation of €805 thousand (previous year: €0 thousand).
Revenue, non-current assets and investments
Segment revenue with external customers was allocated on the basis of the geographical locations of the customers. The total carrying amount of non-current assets and investments was determined according to the geographical location of the respective unit. Investments include the acquisition cost of intangible assets and property, plant and equipment.

KAP AG I ANNUAL FINANCIAL REPORT 2018
128
– –
SEGMENT REPORTING BY BUSINESS AREA FROM 1 JANUARY TO 31 DECEMBER 2018
engineered products flexible films it/services precision components surface technologies Reconciliation Consolidation Continued operations
in € thousands 2018 2017 2018 2017 2018 2017 2018 2017 2018 2017 2018 2017 2018 2017 2018 2017
Revenue with third parties 169,147 164,900 88,447 107,839 18,668 11,701 67,636 71,704 43,205 1,139 2,725 12 1 0 389,829 357,295
Revenue with other segments 1 16 – – 3,910 6,826 – – 39 1 – – –3,950 –6,843 – –
Revenue 169,148 164,916 88,447 107,839 22,578 18,527 67,636 71,704 43,244 1,140 2,725 12 –3,949 –6,843 389,829 357,295
Segment earnings1 13,053 12,404 9,143 11,334 2,299 1,961 10,826 3,694 7,495 –406 –6,649 –6,139 2,625 2,277 38,791 25,125
Scheduled depreciation and amortisation 7,443 7,535 3,604 3,800 869 578 4,378 4,245 6,549 269 1,145 917 985 5,483 24,169 22,826
Operating earnings2 5,610 –332 5,538 7,535 1,430 1,382 6,447 –551 140 –675 –7,794 –7,055 2,445 1,996 13,817 2,299
Interest income 322 422 80 113 22 52 120 45 45 0 4,915 4,695 –5,342 –5,127 161 200
Interest expenses 3,734 3,587 964 951 69 25 881 1,106 659 28 2,665 2,487 –4,920 –4,396 4,052 3,789
Income taxes 1,262 807 –781 356 152 –15 145 276 400 –167 3,828 1,695 24 0 5,029 2,952
Investments3 4,167 8,502 2,061 3,224 814 3,851 4,713 5,211 2,746 172 6,515 639 –2,112 1,752 18,904 23,351
Working capital 63,100 58,682 22,761 20,129 1,646 1,393 17,510 18,472 5,112 1,217 –1,382 1,345 –42 – 108,705 101,238
Employees as of 31 December 1,046 1,059 326 318 124 126 630 672 810 302 38 34 – – 2,974 2,511
As the figures are presented in € thousands, the numbers may not add up due to rounding.
1 Segment earnings are defined as segment EBITDA (previous year: operating earnings). 2 The operating earnings of the surface technologies segment include unscheduled depreciation of €805 thousand. In the previous year, the engineered products and precision components segments included unscheduled depreciation of €5,200 thousand and €25 thousand. 3 Concerns intangible assets and property, plant and equipment.

129
SEGMENT REPORTING BY GEOGRAPHICAL AREA FROM 1 JANUARY TO 31 DECEMBER 2018
Revenue with third parties1 Segment assets2 Investments3
in € thousands 2018 2017 2018 2017 2018 2017
Germany 161,593 142,909 219,767 197,191 13,465 23,828
Rest of Europe 149,712 137,583 106,681 77,999 8,070 6,456
North/South America 43,170 41,937 23,714 17,930 565 1,741
Asia 31,124 31,951 23,995 25,333 822 975
Other countries 4,225 2,915 249 300 0 0
Consolidation 5 0 –12,009 –15,969 –4,018 –9,649
Continued operations 389,829 357,295 362,398 302,784 18,904 23,351
As the figures are presented in € thousands, the numbers may not add up due to rounding. 1 Segment revenues with external customers by geographical area. 2 Total carrying amount of the production sites. 3 Acquisition/manufacturing costs of the production sites.
ADDITIONAL INFORMATION TO SEGMENT REPORTING in € thousands 2018 2017
Segment earnings 38,791 25,125
Depreciation and amortisation of intangible assets, property, plant and equipment and investment property –24,974 –22,826
Result from the disposal of assets and liabilities 18 23,047
Operating earnings 13,835 25,345
Interest earnings –4,219 –3,851
Other financial earnings –996 8,168
Financial earnings –5,214 4,317
Gains/losses from continued operations before income taxes 8,620 29,662
Income taxes –5,029 –2,952
Gains/losses from continued operations after income taxes 3,592 26,711
Gains/losses from discontinued operations after taxes 11,154 4,265
Consolidated annual result after taxes 14,746 30,975
Earnings share of non-controlling interests 25 46
Consolidated annual result of KAP AG shareholders 14,771 31,021

KAP AG I ANNUAL FINANCIAL REPORT 2018
130
– –
47. RELATED PARTY TRANSACTIONS Companies which directly or indirectly have control over, or are controlled by, KAP AG are regarded as related parties, unless these companies are included in the consolidated financial statements of KAP AG on the balance sheet date.
Further, associated companies and joint ventures are included which can be significantly influenced by the company or which are managed jointly.
The relationships with these companies are shown in the list of shareholdings, which is attached under note 49.
FM-Verwaltungsgesellschaft mbH, Stadtallendorf, Germany, notified us in writing on 1 September 2014 in accordance with § 21 (1) of the German Securities Trading Act (WpHG) that its share of voting rights in our company exceeded the 25% threshold on 1 September 2014 and since that date has accounted for 29.889% (1,980,000 voting rights).
Mr Rüdiger Heiche, Schwaigern, Germany, notified us in writing on 12 September 2018 in accordance with § 33 (1) of the WpHG that his share of voting rights in our company exceeded the threshold of 3% on 10 September 2018 and amounts to 4.01%.
Mr Gunter Heiche, Schwaigern, Germany, notified us in writing on 12 September 2018 in accordance with § 33 (1) of the WpHG that his share of voting rights in our company exceeded the threshold of 3% on 10 September 2018 and amounts to 4.01%.
Mr William Elias Conway, Jr, notified us in writing on 14 September 2018 that his total share of voting rights in our company fell below the threshold of 50% on 10 September 2018 in accordance with § 33 (1) of the WpHG and now amounts to 46.10% of the voting rights and 25.85% of the shares in the instruments in accordance with § 38 (1), No. 2, of the WpHG (pre-emption right in shareholder agreement (subject to condition precedent)). Of the voting rights, 46.10% (3,531,719 voting rights) are attributable to him pursuant to § 33 (1) in connection with § 34 (1), No. 1, of the WpHG via the company Project Diamant Bidco AG, Frankfurt am Main, Germany.
Mr Daniel Anthony D’Aniello notified us in writing on 14 September 2018 that his total share of voting rights in our company fell below the threshold of 50% on 10 September 2018 in accordance with § 33 (1) of the WpHG and now amounts to 46.10% of the voting rights and 25.85% of the shares in the instruments in accordance with § 38 (1), No. 2, of the WpHG (pre-emption right in shareholder agreement (subject to condition precedent)). Of the voting rights, 46.10% (3,531,719 voting rights) are attributable to him pursuant to § 33 (1) in connection with § 34 (1), No. 1, of the WpHG via the company Project Diamant Bidco AG, Frankfurt am Main, Germany.
Mr David Mark Rubenstein notified us in writing on 14 September 2018 that his total share of voting rights in our company fell below the threshold of 50% on 10 September 2018 in accordance with § 33 (1) of the WpHG and now amounts to 46.10% of the voting rights and 25.85% of the shares in the instruments in accordance with § 38 (1), No. 2, of the WpHG (pre-emption right in shareholder agreement (subject to condition precedent)). Of the voting rights, 46.10% (3,531,719 voting rights) are attributable to him pursuant to § 33 (1) in connection with § 34 (1), No. 1, of the WpHG via the company Project Diamant Bidco AG, Frankfurt am Main, Germany.
Project Diamant Bidco AG, based in Frankfurt am Main, Germany, is the parent company of KAP AG.
Project Diamant Bidco AG is included in the consolidated financial statements of CSP Diamant Luxco 1 Sàrl, which is registered in the Luxembourg commercial register under number B 210.172. This represents the largest group of companies. The consolidated financial statements will be published under CSP Diamant Luxco 1 Sàrl, Luxembourg. KAP AG prepares the consolidated financial statements for the smallest group of companies.
The consolidated financial statements of KAP AG are published in the Federal Gazette under number HRB 5859 of the Fulda district court.
Natural persons are considered to be related parties if they belong to the Management Board or the Supervisory Board

KAP AG I ANNUAL FINANCIAL REPORT 2018
131
– –
of KAP AG or are close family members of such persons. This also applies to persons who control, jointly manage or exercise a significant influence over other companies within the KAP Group, or who hold a significant voting interest, directly or indirectly, in such companies. Information on the remuneration of the Management Board and Supervisory Board can be found in note 48 on the Management Board and Supervisory Board.
The mandates of the members of the Management Board and other members of the Supervisory Board of KAP AG are listed under note 48.
The volumes of the transactions carried out during the financial year with related companies and the balances still outstanding on the balance sheet date are broken down as follows:
in € thousands 2018 2017
PARENT COMPANY Goods and services rendered to the parent company Other income 87 303
Receivables from the parent company Goods and services 104 361
AFFILIATED COMPANIES
Receivables from affiliated companies Financial receivables 0 –
Liabilities to affiliated companies Financial liabilities 0 17
INVESTMENT COMPANIES Goods and services rendered to investment companies Interest income from loans granted 68 75
Other income 0 0
Goods and services received from investment companies Sourced raw materials, contract production – 1,376
Other expenses – 2
Receivables from investment companies

KAP AG I ANNUAL FINANCIAL REPORT 2018
132
– –
in € thousands 2018 2017
Loans 1,084 1,182
Financial receivables 61 63
Liabilities to investment companies Financial liabilities 0 3
OTHER RELATED COMPANIES Goods and services rendered to other related companies Sales transactions – –
Other income – –
Goods and services received from other related companies Sourced raw materials, contract production – –
Interest expenses from loans received – –
Other expenses – –
Receivables from other related companies Goods and services – –
Liabilities to other related companies Financial liabilities – –
Goods and services – –
48. MANAGEMENT BOARD AND SUPERVISORY BOARD Appointed members of the Management Board in the reporting period:
Guido Decker, Chief Executive Officer (CEO) Diplom-Kaufmann (certified business administrator), Fulda, Germany
No other mandates
Dr Alexander Riedel, Chief Financial Officer (CFO) (from 1 May 2018) Diplom-Wirtschaftsingenieur (certified industrial engineer), Munich, Germany

KAP AG I ANNUAL FINANCIAL REPORT 2018
133
– –
No other mandates
Appointed members of the Supervisory Board in the reporting period:
Christian Schmitz, Chairman (Chairman from 8 May 2018, member of the Supervisory Board since 17 December 2016) Managing Director of The Carlyle Group, London, United Kingdom
Other mandates: CANAVERAL HOLDCO LIMITED, London, United Kingdom2
Ian Jackson (Chairman until 8 May 2018, member of the Supervisory Board until 5 June 2018) Managing Director of The Carlyle Group, Richmond, United Kingdom
Other mandates: Mehler AG, Fulda, Germany1 Klenk Holz AG, Oberrot, Germany1
Fried Möller, Deputy Chairman Diplom-Kaufmann (certified business administrator), Stadtallendorf, Germany
Other mandates: Mehler AG, Fulda, Germany1 KAP Textile Holdings SA Ltd., Paarl, South Africa2
Pavlin Kumchev Associate Director of The Carlyle Group, London, United Kingdom
Other mandates: Project Light Topco Ltd., London, United Kingdom2
Uwe Stahmer Business administrator, Bad Zwischenahn, Germany Management consultant
No other mandates
Roy Bachmann Consultant, London, United Kingdom
No other mandates
1 Member of domestic supervisory boards required by law. 2 Member of comparable domestic and foreign control bodies.
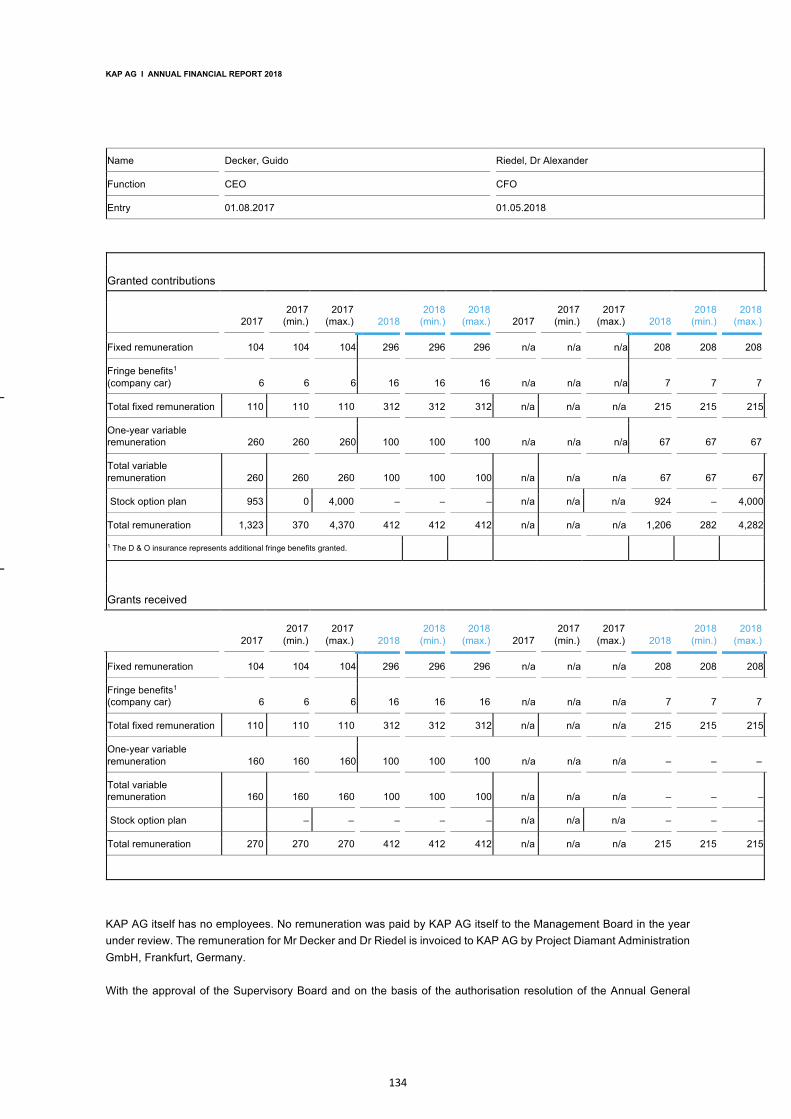
KAP AG I ANNUAL FINANCIAL REPORT 2018
134
– –
Name Decker, Guido Riedel, Dr Alexander
Function CEO CFO
Entry 01.08.2017 01.05.2018
Granted contributions
2017 2017
(min.) 2017
(max.) 2018 2018
(min.) 2018
(max.) 2017 2017
(min.) 2017
(max.) 2018 2018
(min.) 2018
(max.)
Fixed remuneration 104 104 104 296 296 296 n/a n/a n/a 208 208 208
Fringe benefits1 (company car) 6 6 6 16 16 16 n/a n/a n/a 7 7 7
Total fixed remuneration 110 110 110 312 312 312 n/a n/a n/a 215 215 215
One-year variable remuneration 260 260 260 100 100 100 n/a n/a n/a 67 67 67
Total variable remuneration 260 260 260 100 100 100 n/a n/a n/a 67 67 67
Stock option plan 953 0 4,000 – – – n/a n/a n/a 924 – 4,000
Total remuneration 1,323 370 4,370 412 412 412 n/a n/a n/a 1,206 282 4,282
1 The D & O insurance represents additional fringe benefits granted.
Grants received
2017 2017
(min.) 2017
(max.) 2018 2018
(min.) 2018
(max.) 2017 2017
(min.) 2017
(max.) 2018 2018
(min.) 2018
(max.)
Fixed remuneration 104 104 104 296 296 296 n/a n/a n/a 208 208 208
Fringe benefits1 (company car) 6 6 6 16 16 16 n/a n/a n/a 7 7 7
Total fixed remuneration 110 110 110 312 312 312 n/a n/a n/a 215 215 215
One-year variable remuneration 160 160 160 100 100 100 n/a n/a n/a – – –
Total variable remuneration 160 160 160 100 100 100 n/a n/a n/a – – –
Stock option plan – – – – – n/a n/a n/a – – –
Total remuneration 270 270 270 412 412 412 n/a n/a n/a 215 215 215
KAP AG itself has no employees. No remuneration was paid by KAP AG itself to the Management Board in the year under review. The remuneration for Mr Decker and Dr Riedel is invoiced to KAP AG by Project Diamant Administration GmbH, Frankfurt, Germany.
With the approval of the Supervisory Board and on the basis of the authorisation resolution of the Annual General

KAP AG I ANNUAL FINANCIAL REPORT 2018
135
– –
Meeting on 7 July 2017, Mr Decker, as the CEO of KAP AG, subscribed to 20,000 shares against cash contributions using part of the authorised capital for 2017. The new shares were issued to Mr Decker. The capital increase serves the purpose of binding the Management Board to the company as approved by the Annual General Meeting. The entry in the commercial register was made on 29 January 2018. The issue price is €33.92 per new share and corresponds to the last official closing price of the company’s shares on 29 November 2017 less a 5% discount.
With the approval of the Supervisory Board and on the basis of the authorisation resolution of the Annual General Meeting on 16 April 2018, Dr Riedel, as the CFO of KAP AG, subscribed to 18,045 shares against cash contributions using part of the authorised capital for 2017. The new shares were issued to Dr Riedel. The capital increase serves the purpose of binding the Management Board to the company as approved by the Annual General Meeting. The entry in the commercial register was made on 27 June 2018. The issue price is €33.25.
KAP AG has maintained a virtual stock option programme with cash settlement since 2017 in which Mr Decker and Dr Riedel take part. Mr Decker was granted 100,000 virtual stock options, which are vested over a period of four years, on a one-time basis as of 1 August 2017. The fair value of the virtual stock options as of the grant date was €924,331. Upon commencement of his employment on 1 May 2018, Dr Riedel was promised 100,000 virtual stock options as of 1 November 2018 on a one-time basis, which will be earned over a period of four years from the start of service. The fair value of the virtual stock options as of the grant date was €994,306. The programme stipulates that the beneficiary receive a cash settlement from the company upon exercise of the option. The exercise date is 31 July 2021 for Mr Decker and 30 April 2022 for Dr Riedel. The cash settlement entitlement corresponds to the difference between the average share price (XETRA trading, Deutsche Börse AG, Frankfurt am Main) of the last 20 trading days prior to exercising the option and the base value of €30 (Mr Decker) or €33 (Dr Riedel). The entitlement is limited in amount to €40 per option, whereby an adjustment is made for dividend distributions made in the meantime and any dilution effects in the event of capital increases. As capital measures took place between the granting of the virtual stock options and the balance sheet date, the number of virtual stock options increased to 232,262, of which 119,562 are attributable to Mr Decker and 112,700 to Dr Riedel. As of the balance sheet date, the remaining term of the options was 31 months (Mr Decker) and 40 months (Dr Riedel). The remuneration component earned in the financial year from the stock option programme amounts to €367,903, of which €202,185 is attributable to Mr Decker and €165,718 to Dr Riedel.
Pension obligations include pension obligations for former members of the Management Board amounting to €1,336 thousand (previous year: €1,324 thousand).
The members of the Supervisory Board received total remuneration of €28 thousand (previous year: €26 thousand). Each ordinary member of the Supervisory Board received €5,000 in 2018 (previous year: €5,000) and the chairman received €7,500 (previous year: €7,500).
As a member of the Supervisory Board, Mr Bachmann works for RB Capital Ltd, Guernsey. RB Capital Ltd, Guernsey, invoiced a total of €813 thousand (previous year: €552 thousand) for brokerage and consulting services in the 2018 financial year.

KAP AG I ANNUAL FINANCIAL REPORT 2018
136
– –
49. INVESTMENTS OF KAP AG IN ACCORDANCE WITH § 313 (2) OF THE GERMAN COMMERCIAL CODE
Companies included in the consolidated financial statements Registered office
Share in capital
in % GM Tec Industries Holding GmbH Fulda 100.00 ¹
BEBUSCH Hungaria Müanyagfeldolgozó Kft. Oroszlány, Hungary 100.00 Gear Motion GmbH Ehingen, Germany 100.00 ¹
Gear Motion Grundstücksverpachtungs GmbH & Co. KG Ehingen, Germany 100.00 ¹
Gear Motion Grundstücksverwaltungs GmbH Ehingen, Germany 100.00
Minavto OOO Lahoysk, Belarus 100.00 Präzisionsteile Dresden GmbH & Co. KG Dresden, Germany 100.00 ¹
Präzisionsteile Dresden Verwaltungsgesellschaft mbH Dresden, Germany 100.00
Heiche Logistic GmbH Schwaigern, Germany 100.00
Heiche Oberflächentechnik GmbH Schwaigern, Germany 100.00
Heiche Polska sp. z o.o. Stanowice, Poland 100.00
KAP Surface Holding GmbH Fulda 100.00
Gt Oberflächen GmbH Heinsdorfergrund, Germany 100.00
G. und R. Heiche Beteiligungs GmbH Schwaigern, Germany 100.00
G. und R. Heiche GmbH & Co. KG Schwaigern, Germany 100.00
Heiche Bayern GmbH & Co. KG Hunderdorf, Germany 100.00
Heiche Bayern Verwaltungs GmbH Hunderdorf, Germany 100.00
Heiche Hungary Real Estate Kft. Sátoraljaújhely, Hungary 100.00
Heiche Hungary Surface Technologies Kft. Sátoraljaújhely, Hungary 100.00
Heiche Oberflächentechnik Beteilgungs GmbH Leisnig, Germany 100.00
Heiche Sachsen GmbH & Co. KG Leisnig, Germany 100.00
Heiche US Surface Technology, LP Spartanburg, United States 100.00
KAP US Surface Inc. Atlanta, United States 100.00
Metallveredlung Döbeln GmbH Döbeln, Germany 100.00
KAP Textile Holdings SA Limited South Africa 100.00
UKW Properties (Pty.) Ltd. South Africa 100.00 MEHLER Aktiengesellschaft Fulda 100.00 ¹

KAP AG I ANNUAL FINANCIAL REPORT 2018
137
– –
Companies included in the consolidated financial statements Registered office
Share in capital
in % CaPlast Kunststoffverarbeitungs GmbH Nordkirchen (Capelle), Germany 100.00 ¹
Convert Vliesveredlung GmbH Detmold, Germany 74.00
Convert Vliesveredlung GmbH & Co. KG Waldfischbach-Burgalben, Germany 74.00
Elbtal Verwaltungs GmbH Coswig, Germany 100.00 Elbtal Plastics GmbH & Co. KG Coswig, Germany 100.00 ¹
GbR MEHLER AG / DAUN & Cie. AG Stadtallendorf, Germany 94.00 it-novum GmbH Fulda 100.00 ¹
it-novum Schweiz GmbH Zurich, Switzerland 100.00
KAP Beteiligungs Inc. Martinsville, United States 100.00 MEHLER ENGINEERED PRODUCTS GMBH Fulda 100.00 ¹
MEHLER ENGINEERED PRODUCTS INDIA PRIVATE LIMITED Bangalore, India 100.00
MEHLER ENGINEERED PRODUCTS, INC. Martinsville, United States 100.00
MEHLER ENGINEERED PRODUCTS s.r.o. Jilemnice, Czech Republic 100.00
MEHLER ENGINEERED PRODUCTS (Suzhou) Co., Ltd. Suzhou, China 100.00 MEHLER Engineering und Service GmbH Fulda, Germany 100.00 ¹
Mehler Grundstücksverwaltungs GmbH Fulda, Germany 100.00
NOW Contec GmbH Detmold, Germany 74.00
NOW Contec GmbH & Co. KG Waldfischbach-Burgalben, Germany 74.00
OLBO & MEHLER Tex GmbH & Co. KG Fulda, Germany 100.00 ¹
OLBO & MEHLER TEX PORTUGAL LDA. Famalicão, Portugal 100.00
Olbo & Mehler Tex North America, Inc. Charlotte, United States 100.00
OLBO & MEHLER Verwaltungs-GmbH Fulda, Germany 100.00
Riflex Film AB Ronneby, Sweden 100.00 Safe-Box Self Storage Mönchengladbach GmbH Mönchengladbach, Germany 33.33 ²
Steinweg Kunststoffolien GmbH Castrop-Rauxel, Germany 75.00 ¹
Technolen technický textil s.r.o. Hlinsko, Czech Republic 100.00
Schäfflerbachstraße Grundbesitz GmbH Fulda, Germany 93.62 1 Domestic companies that made use of the the provisions of § 264 (3) and § 264b of the German Commercial Code on the exemption from the obligation to disclose the annual financial statements. 2 Inclusion at equity.

KAP AG I ANNUAL FINANCIAL REPORT 2018
138
– –
Companies not included in the consolidated financial statements Registered office
Share in capital
in %
Via KAP Textile Holdings SA Limited South Africa 100.00
Gelvenor Textiles (Pty.) Ltd. South Africa 100.00
KAP International Brands (RSA) (Pty.) Ltd. South Africa 100.00
Rags and Fabrics (Lesotho) (Pty.) Ltd. Lesotho 100.00
Via Mehler Aktiengesellschaft Fulda, Germany 100.00
Kammgarnbüro GmbH Frankfurt, Germany 32.81
Platin 1535. GmbH Frankfurt, Germany 100.00
Ude technical products GmbH (bankrupt) Kalefeld, Germany 100.00

KAP AG I ANNUAL FINANCIAL REPORT 2018
139
– –
50. DECLARATION ON CORPORATE GOVERNANCE The company has issued the declaration on corporate governance and published it on its website at www.kap.de/investor-relations/corporate-governance/erklaerung zur unternehmensfuehrung. This declaration contains the declaration of compliance with the German Corporate Governance Code in accordance with § 161 of the German Stock Corporation Act (AktG).
51. GROUP AUDITOR’S FEES Total group auditor’s fees calculated for the year:
in € thousands 2018 2017
Audit of financial statements 229 76
Other certification services 94 –
Other consulting services 124 47
447 123
The other certification services mainly relate to audit activities relating to interim financial statements. Other services mainly relate to special analyses.
52. RECOMMENDATION FOR THE ADOPTION OF THE ANNUAL FINANCIAL STATEMENTS AND DISTRIBUTIONS OF THE RETAINED EARNINGS The Management Board proposes that the annual financial statements of KAP AG be adopted, in accordance with the provisions of the German Commercial Code, as showing retained earnings of €36,831,775.71.
In addition, the Annual General Meeting on 3 July 2019 is expected to propose the distribution of a dividend from the retained earnings of €15,520,706.00 (previous year: €14,055,692.00) and the remaining retained earnings of €21,311,069.71 to be carried forward to the new account. This equates to a dividend of €2.00 (previous year: €2.00) per share.
On the basis of the resolution of the Annual General Meeting, €14,055,692.00 (previous year: €13,248,892.00) was distributed as a dividend in the 2018 financial year. This equates to a dividend of €2.00 (previous year: €2.00) per share.
53. DECLARATION BY THE MANAGEMENT BOARD The consolidated financial statements and the group management report of KAP AG for the 2018 financial year were approved for publication by resolution of the Management Board on 11 March 2019.
Fulda, 11 March 2019
KAP AG Management Board
Guido Decker Dr Alexander Riedel CEO CFO

KAP AG I ANNUAL FINANCIAL REPORT 2018
140
– –
INDEPENDENT AUDITOR’S REPORT
To KAP AG, Fulda
REPORT ON THE AUDIT OF THE CONSOLIDATED FINANCIAL STATEMENTS AND OF THE GROUP MANAGEMENT REPORT
OPINIONS
We have audited the consolidated financial statements of KAP AG, Fulda and its subsidiaries (the Group), which comprise the consolidated statement of financial position as of December 31, 2018, the consolidated profit and loss statement, the statement of comprehensive income, the consolidated statement of changes in equity and the consolidated statement of cash flows for the financial year from January 1, 2018 to December 31, 2018, and notes to the consolidated financial statements, including a summary of significant accounting policies. In addition, we have audited the group management report of KAP AG for the financial year from January 1, 2018 to December 31, 2018. In accordance with the German legal requirements, we have not audited the content of those parts of the group management report listed in the chapter “other information”.
In our opinion, on the basis of the knowledge obtained in the audit,
• the accompanying consolidated financial statements comply, in all material respects, with the IFRSs as adopted by the EU, and the additional requirements of German commercial law pursuant to Article 315e paragraph 1 HGB [Handelsgesetzbuch: German Commercial Code] and, in compliance with these requirements, give a true and fair view of the assets, liabilities, and financial position of the Group as of December 31,2018, and of its financial performance for the financial year from January 1, 2018 to December 31, 2018, and
• the accompanying group management report as a whole provides an appropriate view of the Group’s position. In all material respects, this group management report is consistent with the consolidated financial statements, complies with German legal requirements and appropriately presents the opportunities and risks of future development. Our opinion on the group management report does not cover the content of those parts of the group
management report listed in the chapter “other information”.
Pursuant to Article 322 paragraph 3 sentence 1 HGB, we declare that our audit has not led to any reservations relating to the legal compliance of the consolidated financial statements and of the group management report.
BASIS FOR THE OPINIONS
We conducted our audit of the consolidated financial statements and of the group management report in accordance with Article 317 HGB and the EU Audit Regulation (No. 537/2014, referred to subsequently as “EU Audit Regulation”) and in compliance with German Generally Accepted Standards for Financial Statement Audits promulgated by the Institut der Wirtschaftsprüfer [Institute of Public Auditors in Germany] (IDW). Our responsibilities under those requirements and principles are further described in the “Auditor’s Responsibilities for the Audit of the Consolidated Financial Statements and of the Group Management Report” section of our auditor’s report. We are independent of the group entities in accordance with the requirements of European law and German commercial and professional law, and we have fulfilled our other German professional responsibilities in accordance with these requirements.
In addition, in accordance with Article 10 (2) point (f) of the EU Audit Regulation, we declare that we have not provided non-audit services prohibited under Article 5 (1) of the EU Audit Regulation. We believe that the audit evidence we have obtained is sufficient and appropriate to provide a basis for our opinions on the consolidated financial statements and on the group management report.
KEY AUDIT MATTERS IN THE AUDIT OF THE CONSOLIDATED FINANCIAL STATEMENTS
Key audit matters are those matters that, in our professional judgment, were of most significance in our audit of the consolidated financial statements for the financial year from January 1, 2018 to December 31, 2018. These matters were addressed

KAP AG I ANNUAL FINANCIAL REPORT 2018
141
– –
in the context of our audit of the consolidated financial statements as a whole, and in forming our opinion thereon, we do not provide a separate opinion on these matters.
We identified the following matters as key audit matters:
- Business combinations - Discontinued operations - Changes in segment reporting
BUSINESS COMBINATIONS Facts and circumstances On July 26, 2018, KAP Group acquired the Heiche Group, a group of domestic and foreign companies, which are active in the wide range of surface coating and finishing. To the details of the Transaction please refer to section "2. consolidation" of the notes to the consolidated financial statements. The accounting of the acquisition in the consolidated financial statements of KAP AG was carried out with the involvement of an expert's preliminary purchase price allocation. Taking into account the acquired net assets of EUR 44.4 mil., determined by KAP AG, the goodwill amounts to EUR 0.7 mil. The complete identification of assets and liabilities to be recognized in the context of the purchase price allocation, is complex and the measurement of the acquired assets and assumed liabilities at fair value is judgmental. Therefore, the purchase accounting with respect of Heiche Group is a key audit matter. The disclosures on the accounting treatment of business combinations are included in sections “2. Consolidated Group" and "45. Consolidated Cash Flow Statement" of the Notes to the Consolidated Financial Statements. Auditor reaction and observations The audit of the accounting treatment of the business combination was carried out with the assistance of our valuation specialists. As part of our audit of the purchase accounting we reviewed the contractual basis of the acquisition of the company and agreed the purchase price with the corresponding documents. In addition, we
examined whether the business combination was correctly and completely reflected in the consolidated financial statements based on information available as of the date of the preparation. We evaluated competence, skills and objectivity of the expert engaged to perform the valuation of assets acquired and liabilities assumed. Furthermore, we assessed the underlying valuation methods whether they are suitable for the respective purpose and are in accordance with generally accepted valuation techniques. We have evaluated the underlying assumptions used for the measurement of the fair values. Furthermore, we checked the arithmetical accuracy of the valuation models. We compared assumptions and parameters underlying the used cost of capital with own assumptions and market data. After all, we checked the completeness of the disclosures to be made in accordance with IFRS 3. Overall, we were able to satisfy ourselves that assumptions made, and valuation parameters used by the legal representatives are comprehensible, and that the business combination has been appropriately reflected based on information available as of the preparation date.
DISCONTINUED OPERATIONS Facts and circumstances With economic effect as of July 31, 2018 KAP AG has sold its shares in the subsidiary Geiger Fertigungstechnologie GmbH in the context of their corporate. The entity was deconsolidated on the same date from the consolidated financial statements. Geiger Fertigungstechnologie GmbH was disclosed as a discontinued operation in the consolidated financial statements as of December 31, 2018, with the effect that expenses, income and cash flows which are attributable to this division were shown separately. As the qualification as discontinued operation is judgmental and the accounting is complex, we considered this a key audit matter. The disclosures on the discontinued operation are shown in section "37. Result from discontinued

KAP AG I ANNUAL FINANCIAL REPORT 2018
142
– –
operations" in the notes to the consolidated financial statements. Auditor reaction and observations We reviewed the legal and contractual basis for the sale of the shares in Geiger Fertigungstechnologie GmbH and evaluated whether Geiger Fertigungstechnologie GmbH qualifies for a discontinued operation in the meaning of IFRS 5. We reviewed management's assessment and evaluated the significance of the operations for the Group. Additionally, we have considered the company’s approach for classifying discontinued operations in the past. We also assessed the presentation of the discontinued operation and the completeness of the disclosures in the consolidated financial statements. Overall, we were able to satisfy ourselves, that the presentation of the Geiger Fertigungstechnologie GmbH as a discontinued operation in the consolidated financial statements of KAP AG is appropriate. CHANGES IN THE SEGMENT REPORTING Facts and circumstances The executive directors of KAP AG made changes to the management control and the management reporting of the group. The main changes relate to the split up of the "engineered products" segment into the segments "engineered products", "flexible films" and "IT/Services" and the introduction of the key performance indicator EBITDA (earnings before interest, taxes, depreciation and amortization) as segment result and as an important financial performance indicator. In addition, the extent of additional key figures and disclosures in the management reporting was reduced. According to IFRS 8 the segment reporting must follow the management reporting; the so-called "management approach" applies. Thus, the executive directors have adjusted the segment reporting in the consolidated financial statements to account for the changed management reporting. For the addressees of a listed company's financial reporting the segment report is an important information. The application of the management
approach is judgmental. Thus, the change in the segment reporting is considered a key audit matter. The segment reporting can be found in section "46 Segment Reporting" of the notes to the consolidated financial statements. Auditor reaction and observations In the context of our assessment of the segment reporting, we discussed with the legal representatives the organization of the group and changes in management. We assessed the structure and content of the changed management reporting, as well as the internal communication in that respect. We reviewed the reporting to the Management Board and satisfied ourselves that the new segments and the changed financial performance indicators are used to manage the company and that the requirements of IFRS 8 Operating Segments have been complied with. We also reviewed the adjustments required for the presentation of the new segments in the reporting systems. Furthermore, we examined whether the segment information in the group management report is based on the same segment definition as in the consolidated financial statements. Overall, we were able to satisfy ourselves, that the changes in management of the group and in the internal reporting is properly reflected in the segment report of KAP AG.
OTHER INFORMATION
The executive directors are responsible for the other information. The other information includes the "Declaration on Corporate Governance pursuant to Sections 289f (4) and 315d HGB" received by us before the date of this audit report as well as the "Non-financial Statement pursuant to Section 289b et seq. HGB and Section 315b et seq. HGB", and the remaining parts of the annual report, except for the audited consolidated financial statements, the group management report and our audit report which are expected to be made available to us after that date.
Our opinions on the consolidated financial statements and on the group management report do not cover the other information, and consequently we do not express an opinion or any other form of assurance conclusion thereon.

KAP AG I ANNUAL FINANCIAL REPORT 2018
143
– –
In connection with our audit, our responsibility is to read the other information and, in so doing, to consider whether the other information
• is materially inconsistent with the consolidated financial statements, with the group management report or our knowledge obtained in the audit, or
• otherwise appears to be materially misstated.
If, based on the work we have performed, we conclude that there is a material misstatement of this other information, we are required to report that fact. We have nothing to report in this regard.
RESPONSIBILITIES OF THE EXECUTIVE DIRECTORS AND THE SUPERVISORY BOARD FOR THE CONSOLIDATED FINANCIAL STATEMENTS AND THE GROUP MANAGEMENT REPORT
The executive directors are responsible for the preparation of the consolidated financial statements that comply, in all material respects, with IFRSs as adopted by the EU and the additional requirements of German commercial law pursuant to § 315e Abs. 1 HGB and that the consolidated financial statements, in compliance with these requirements, give a true and fair view of the assets, liabilities, financial position, and financial performance of the Group. In addition the executive directors are responsible for such internal controls as they have determined necessary to enable the preparation of consolidated financial statements that are free from material misstatement, whether due to fraud or error.
In preparing the consolidated financial statements, the executive directors are responsible for assessing the Group’s ability to continue as a going concern. They also have the responsibility for disclosing, as applicable, matters related to going concern. In addition, they are responsible for financial reporting based on the going concern basis of accounting unless there is an intention to liquidate the Group or to cease operations, or there is no realistic alternative but to do so.
Furthermore, the executive directors are responsible for the preparation of the group management report that, as a whole, provides an appropriate view of the Group’s position and is, in all material respects, consistent with the consolidated financial statements, complies with German legal requirements, and appropriately presents the opportunities and risks of future development. In addition, the executive directors are responsible for such arrangements and
measures (systems) as they have considered necessary to enable the preparation of a group management report that is in accordance with the applicable German legal requirements, and to be able to provide sufficient appropriate evidence for the assertions in the group management report.
The supervisory board is responsible for overseeing the Group’s financial reporting process for the preparation of the consolidated financial statements and of the group management report.
AUDITOR’S RESPONSIBILITIES FOR THE AUDIT OF THE CONSOLIDATED FINANCIAL STATEMENTS AND OF THE GROUP MANAGEMENT REPORT
Our objectives are to obtain reasonable assurance about whether the consolidated financial statements as a whole are free from material misstatement, whether due to fraud or error, and whether the group management report as a whole provides an appropriate view of the Group’s position and, in all material respects, is consistent with the consolidated financial statements and the knowledge obtained in the audit, complies with the German legal requirements and appropriately presents the opportunities and risks of future development, as well as to issue an auditor’s report that includes our opinions on the consolidated financial statements and on the group management report.
Reasonable assurance is a high level of assurance, but is not a guarantee that an audit conducted in accordance with Article 317 HGB and the EU Audit Regulation and in compliance with German Generally Accepted Standards for Financial Statement Audits promulgated by the Institut der Wirtschaftsprüfer (IDW) will always detect a material misstatement. Misstatements can arise from fraud or error and are considered material if, individually or in the aggregate, they could reasonably be expected to influence the economic decisions of users taken on the basis of these consolidated financial statements and this group management report.
We exercise professional judgment and maintain professional skepticism throughout the audit. We also:
• Identify and assess the risks of material misstatement of the consolidated financial statements and of the group management report, whether due to fraud or error, design and perform audit procedures responsive to those risks, and obtain audit evidence that is sufficient and appropriate

KAP AG I ANNUAL FINANCIAL REPORT 2018
144
– –
to provide a basis for our opinions. The risk of not detecting a material misstatement resulting from fraud is higher than for one resulting from error, as fraud may involve collusion, forgery, intentional omissions, misrepresentations, or the override of internal controls.
• Obtain an understanding of internal controls relevant to the audit of the consolidated financial statements and of arrangements and measures (systems) relevant to the audit of the group management report in order to design audit procedures that are appropriate in the circumstances, but not for the purpose of expressing an opinion on the effectiveness of these systems.
• Evaluate the appropriateness of accounting policies used by the executive directors and the reasonableness of estimates made by the executive directors and related disclosures.
• Conclude on the appropriateness of the executive directors’ use of the going concern basis of accounting and, based on the audit evidence obtained, whether a material uncertainty exists related to events or conditions that may cast significant doubt on the Group’s ability to continue as a going concern. If we conclude that a material uncertainty exists, we are required to draw attention in the auditor’s report to the related disclosures in the consolidated financial statements and in the group management report or, if such disclosures are inadequate, to modify our respective opinions. Our conclusions are based on the audit evidence obtained up to the date of our auditor’s report. However, future events or conditions may cause the Group to cease to be able to continue as a going concern.
• Evaluate the overall presentation, structure and content of the consolidated financial statements, including the disclosures, and whether the consolidated financial statements present the underlying transactions and events in a manner that the consolidated financial statements give a true and fair view of the assets, liabilities, financial position and financial performance of the Group in compliance with IFRSs as adopted by the EU and the additional requirements of German commercial law pursuant to Article 315e Abs. 1 HGB.
• Obtain sufficient appropriate audit evidence regarding the financial information of the entities or business activities within the Group to express opinions on the consolidated financial statements and on the group management report. We are responsible for the direction, supervision and performance of the group audit. We remain solely responsible for our opinions.
• Evaluate the consistency of the group management report with the consolidated financial statements, its conformity with [German] law, and the view of the Group’s position it provides.
• Perform audit procedures on the prospective information presented by the executive directors in the group management report. On the basis of sufficient appropriate audit evidence we evaluate, in particular, the significant assumptions used by the executive directors as a basis for the prospective information, and evaluate the proper derivation of the prospective information from these assumptions. We do not express a separate opinion on the prospective information and on the assumptions used as a basis. There is a substantial unavoidable risk that future events will differ materially from the prospective information.
We communicate with those charged with governance regarding, among other matters, the planned scope and timing of the audit and significant audit findings, including any significant deficiencies in internal controls that we identify during our audit.
We also provide those charged with governance with a statement that we have complied with the relevant independence requirements, and communicate with them all relationships and other matters that may reasonably be thought to bear on our independence, and where applicable, the related safeguards.
From the matters communicated with those charged with governance, we determine those matters that were of most significance in the audit of the consolidated financial statements of the current period and are therefore the key audit matters. We describe these matters in our auditor’s report unless law or regulation precludes public disclosure about the matter.

KAP AG I ANNUAL FINANCIAL REPORT 2018
145
– –
OTHER LEGAL AND REGULATORY REQUIREMENTS
FURTHER INFORMATION PURSUANT TO ARTICLE 10 OF THE EU AUDIT REGULATION
We were elected as auditor by the annual general meeting on July 20, 2018. We were engaged by the supervisory board on October 23, 2018.
BDO AG has been the auditor of KAP AG without interruption since the financial year 1989.
We declare that the opinions expressed in this auditor’s report are consistent with the additional report to the audit committee pursuant to Article 11 of the EU Audit Regulation (long-form audit report).
GERMAN PUBLIC AUDITOR RESPONSIBLE FOR THE ENGAGEMENT
The German Public Auditor responsible for the engagement is Silvia Sartori.
Hamburg, March 11, 2019 BDO AG Wirtschaftsprüfungsgesellschaft signed Weichert signed Sartori Wirtschaftsprüfer Wirtschaftsprüferin

KAP AG I ANNUAL FINANCIAL REPORT 2018
146
– –
RESPONSIBILITY STATEMENT “To the best of our knowledge, and in accordance with the applicable accounting standards for Consolidated financial statements, we assure that the consolidated financial statements provide a true and fair view of the assets, financial and earnings position of the Group, and that the Group management report presents the business performance including the operating result and the position of the Group so that a true and fair view is presented, together with a description of the major opportunities and risks associated with the expected development of the Group for the remainder of the financial year.” Fulda, March 11, 2019 KAP AG Management Board
Guido Decker Dr Alexander Riedel CEO CFO

KAP AGEdelzeller Strasse 4436043 FuldaGermany
www.kap.de