indicators for measuring the digital environment of
TRANSCRIPT
Inna S. Lola, Murat Bakeev, Anton Manukov
INDICATORS FOR MEASURING
THE DIGITAL ENVIRONMENT OF
MANUFACTURING ENTERPRISES
IN RUSSIA BASED ON DATA
FROM BUSINESS TENDENCY
SURVEYS
BASIC RESEARCH PROGRAM
WORKING PAPERS
SERIES: SCIENCE, TECHNOLOGY AND INNOVATION
WP BRP 120/STI/2021
This Working Paper is an output of a research project implemented within NRU HSE’s Annual Thematic Plan for
Basic and Applied Research. Any opinions or claims contained in this Working Paper do not necessarily reflect the
views of HSE
2
Inna S. Lola1,1 Murat Bakeev2, Anton Manukov323
4 INDICATORS FOR MEASURING THE DIGITAL
ENVIRONMENT OF MANUFACTURING ENTERPRISES IN
RUSSIA BASED ON DATA FROM BUSINESS TENDENCY
SURVEYS
The paper discusses various aspects of digital environment and activity of enterprises from
the Russian manufacturing sector in 2020 using the evidence from business tendency surveys.
Based on aggregate sectoral and industrial assessments, such as the Digital Climate Index (DCI),
the Digital Intensity Index (DII), the Digital Employment Index (DEI) and the Digital
Vulnerability index (DVI), the dynamics of digital development during the COVID-19 crisis in
2020 is described. In general, according to the results obtained, we can conclude that, despite all
the negative consequences and uncertainty associated, 2020 became a very significant point in
terms of the digital transformation in manufacturing. Manufacturing businesses were both
relatively resilient to the adverse business trends caused by the pandemic and were able to absorb
the positive digital momentum generated by the pandemic.
Keywords: digital technology, COVID-19, business tendency surveys, manufacturing, Russia.
JEL: D22, J21, J24, L21, L60, M12, M15, O14, O33.
1 National Research University Higher School of Economics, Russian Federation. Institute for
Statistical Studies and Economics of Knowledge, Centre for Business Tendency Studies. Deputy
Director.: [email protected] 2 National Research University Higher School of Economics, Russian Federation. Institute for
Statistical Studies and Economics of Knowledge, Centre for Business Tendency Studies. Analyst.:
[email protected] 3 National Research University Higher School of Economics, Russian Federation. Institute for
Statistical Studies and Economics of Knowledge, Centre for Business Tendency Studies.
Leading Analyst.: [email protected] 4 The article was prepared within the framework of the Basic Research Program at the National Research University Higher School
of Economics (HSE).
3
Introduction
The crisis triggered by the worldwide COVID-19 pandemic marked a turning point in
history in terms of its impact on human life, comparable to large-scale economic crises and wars.
Measures taken to combat the pandemic, such as quarantine and physical distancing, have led to
the forced transfer of many forms of human activity and interaction from offline to online
environment, which, as can be assumed, is a potential factor in the rapid development of digital
technologies in sectors of the economy affected by these restrictions.
The most studied aspect of technological transformation in the context of a pandemic in
the literature at the moment is the development of digital technologies used in the medical and
sanitary spheres (Golinelli et al., 2020; Budd et al., 2020), although the study of transformations
in a broader context is also gaining attention (Vargo et al., 2021). Overall, the available evidence
points to a particularly widespread development of computed tomography, video-based
communication platforms and artificial intelligence in healthcare, education, work and everyday
life. In the United States, during the pandemic, the number of patents significantly rose in the field
of video conferencing, telecommuting, and work from home (Bloom et al., 2021).
Nevertheless, our knowledge about the digitalization of the entire economy or its large
segments as a whole is still rather insufficient; fragmentary evidence prevails only from certain
fields of activity. Has the pandemic catalyzed a digital surge across the whole economy or
remained visible only in certain areas? Has it caused the digital divide to deepen? Whereas in
industries such as health care and education, which have become most susceptible to imposed
restrictions, predicting the cumulative effect may be a feasible task, in less obvious cases, such as
manufacturing, it is much more difficult. Certain manufacturing industries, such as
pharmaceuticals, were clearly more affected by the pandemic than others were. Available global
evidence suggests that COVID-19 has dramatically accelerated the digital transformation of the
pharmaceutical industry, with technologies such as cloud computing and cybersecurity helping the
industry move to remote work and conduct decentralized clinical trials (Pharmaceutical
Technology, 2021).
Despite the positive potential of the imposed restrictions in terms of digital development,
the pandemic has proven to be a major negative economic shock. For example, early data from
Russian surveys of business activity in key sectors of the Russian economy conducted by Federal
State Statistics Service (Rosstat) during 2020 showed the most significant contraction for at least
the last ten years of observations. According to OECD (2020), the shock of COVID-19 has
4
negatively impacted venture and seed investment, a key source of funding for innovative start-ups.
However, the negative impact on investment was weaker than during the 2001-02 dot-com crisis
and the global financial crisis of 2008-09 (Gompers et al., 2020). The negative impact on digital
innovation could also be expressed in changing management priorities towards tasks related to
current anti-crisis activities to the detriment of long-term digital initiatives and projects
(McKinsey, 2020; BMWi, 2020).
Thus, the cumulative effect of the pandemic on digital development in the manufacturing
sector is not entirely clear; it is likely that in different industries and in different conditions, it could
vary greatly, depending on whether positive or negative factors were more significant. For
example, this difference is reflected in OECD (2021a) data on a number of selected R&D-intensive
companies, according to which R&D investments in IT and pharmaceuticals increased in 2020
compared to the previous year, while investments in the automotive, aerospace and defense sectors
declined.
In this situation, statistical studies based on large representative data are needed to assess
current digital trends without strong distortions. For instance, OECD (2021b), Eurostat (2021),
United Nations (2021) and others are engaged in such programs. Although they are based
predominantly on quantitative statistics; semantic citation rate meters are also gaining popularity
(see, for example, the “digital pulse” measure). Quantitative indicators are often used as building
blocks for digital development indices, such the International Digital Economy and Society Index
(I-DESI) (European Union, 2021), as the Networked Readiness Index (NRI) (Portulans Institute,
2020), Digital Business Indicators (World Bank, 2019), The IMD World Digital Competitiveness
Ranking (IMD, 2018).
Among the existing meters, two important problems can be distinguished that can become
especially noticeable when trying to study the digital effects of a pandemic. First, the indices used
often focus on universal assessments of the digitalization of economy and society, while
underestimating the role of industry digitalization factors. For a more nuanced assessment, a larger
number of indicators may be required. For example, Tolkachev (2020) proposes the Index of
Digitalization of Manufacturing Enterprises, which consists of two sub-indices - the Cyber-
Physical Systems Development Index and the Business Model Transformation Index, which are
based on OECD data, to assess the state of digital development in the manufacturing industry only.
In addition to the industry aspect, we can highlight various aspects of digital development, which
can also be considered separately for a more detailed understanding of trends (for example,
separation by enterprise size).
5
Secondly, despite the presence of many digital meters and indicators, the difficulty is in
the lack of a common methodological standard, which additionally leads to differences in existing
estimates. Nevertheless, the program for measuring the digital economy developed in the European
Union is a good example of a solid methodological basis, which can serve as a model for the
development and harmonization of existing practices (Eurostat, 2020).
In particular, on the basis of this program, CBTS ISSEK NRU HSE has developed a
methodology for measuring the digital environment in the basic segments of the Russian economy,
such as manufacturing, trade and information technology, since 20185. As part of the launched
annually updated business tendency observations, an analysis of the dynamics of indicators of
digital transformations at enterprises and organizations throughout the country is carried out in this
paper.
The transformations that have taken place have increased the demand for the prompt
identification of new vectors in the evolution of the digital development of the Russian
manufacturing industry. Given the unprecedented challenges of 2020 and still insufficient content
of timely statistical data capable of reflecting the scale of digitalization in an expanded and relevant
form, the results of qualitative business surveys, in addition to quantitative estimates, become an
important complementary source of information, which, among other things, allows drawing
conclusions not only about the actual the reaction of enterprises to the coronavirus dynamics due
to the inclusion of the relevant blocks of questions in the survey instruments, but also to simulate
the post-crisis business and digital environment in the short and medium run on the basis of the
obtained short-term forecast estimates of the phenomena under study.
The aim of this work is to attempt a deep detailed analysis of the key aspects of the
digitalization of the manufacturing industry and its low-, medium and high-tech industries in the
context of severe pandemic-related negative dynamics by means of an expanded system of simple
and composite digital business tendency indicators, harmonized with the methodology for
measuring the digital economy and calculating indices developed by the European Commission.
The analysis of the state of the digital climate was carried out based on an expanded system
of simple and composite indicators, including such new statistical tools as the Digital Intensity
Index (DII), the Digital Climate Index (DCI), Digital Employment Index (DEI) and Digital
Vulnerability Index (DVI). The updated measurement system transmits with its dynamics
aggregate trends of business, digital and investment activity, as well as the demand and intensity
5 https://www.hse.ru/monitoring/buscl
6
of technological transformation, reveals the peculiarities of employment at enterprises, including
in terms of the intensity of attracting specialists with high competencies in the ICT field, and also
allows to obtain unique aggregated assessments of measuring industry vulnerability to the effects
of the coronavirus crisis, to show the degree of readiness of industries for digitalization in the face
of a market shock.
The relevance of this goal seems undeniable, since future digital trends are directly related
to what the transformation will be like now. Our assessments made using the proposed tools will
be the first such results on a national scale. Given the complexity of the nature of digital effects
demonstrated above, we focus on a high level of detail, separately considering different sub-sectors
of the manufacturing industry and various aspects of digital development through assessments of
the indicators involved.
Data and Methodology
The empirical basis for this study was the results of the annual pilot business tendency
surveys program “Digital Activity of Manufacturing Enterprises”, which has been conducted since
2018 at the request of CBTS ISSEK NRU HSE in order to measure the dynamics and analyze
trends of the key components of the digital transformation process. Surveys are carried out within
the framework of a specially developed questionnaire, “Survey of Business Tendencies and Digital
Activity of Manufacturing”, which is subject to regular updating. The questionnaires are filled in
by respondents (directors or managers of organizations) with the necessary level of competence in
relation to the questions asked at the end of the second half of the surveyed period.
The key features of the information obtained in the course of business tendency surveys
include the fact that this information describes the perception of the observed trends and not
changes in objective conditions, as well as the qualitative nature of answers collected and the
relative promptness of obtaining in comparison with quantitative statistics data. In general, the
system of indicators and the structure of the corresponding questions in the survey program is
based on the following standard methodological principles arising from the recommendations of
the Organization for Economic Cooperation and Development and the Statistical Department of
the European Commission (OECD, 2003): questions refer to the characteristics of the activities of
the directly surveyed organization; the questions reflect the dynamics of indicators for the current
year and their change in relation to the previous period; for all issues related to assessments of the
dynamics (trends) of indicators, a three-category grading is used: the number of respondents who
note an increase (improvement) (+), no changes (=), a decline (deterioration) (-), respectively.
7
The developed survey instruments are harmonized with European practice of
measurements of digitalization processes. The key criteria of the survey methodology are the
unification of sectoral survey programs, the homogeneity and significance of target groups of
respondents, the ability to determine homogeneous sample sets and their stratifications according
to established types of activity, unity with well-known international standards and
recommendations, allowing cross-country comparisons.
The questionnaire used in the surveys is adapted to the Russian context of digital
transformation, which causes a number of discrepancies in the questions compared to the European
community's questionnaire on the use of ICT and e-commerce in enterprises, as well as the
presence of additional questions and blocks. At the same time, as mentioned above, our
questionnaire is based on the methodological principles set by European practice, and is generally
consistent with the thematic structure characteristic of the European questionnaire. In particular,
the following correspondence can be established between the thematic blocks of the questionnaire
of the European community on the use of ICT and e-commerce in enterprises and the instruments
of our survey: block A “Access and use of the internet” of the European questionnaire corresponds
to questions 2.4 and 8.7 of our questionnaire; block B “E-commerce” corresponds to question 2.12;
block C “Invoicing” corresponds to question 2.9; Block D “Use of cloud computing services”
corresponds to questions 2.6 and 10.7; Block E “Big data analysis” corresponds to questions 10.1,
10.17 and 10.18; block F “ICT specialists and skills” corresponds to question 2.3, block of
questions 5 and question 8.4; block G “Internet of Things” corresponds to questions 10.5, 10.6,
10.13; block H “Use of 3D printing technologies” corresponds to block of questions 7, questions
10.4 and 10.12; Block I “Use of robotics” corresponds to questions 4.11, 10.2 and 10.3.
In 2020, the third round of the observation was carried out, within which, for the first time
on a national scale, the results of a survey were presented, reflecting detailed assessments of
business leaders regarding the impact of COVID-19 on the dynamics of business, digital,
employment and investment activity. Additional blocks of questions were included in the survey
questionnaire of the 2020 Observation Program, which made it possible to expand the
understanding of the effects of the cumulative shock of the coronavirus crisis on various aspects
of the sectoral activities related to the technological transformation process. In particular, the
survey questionnaire was updated and included special “crisis” questions, which made it possible
to identify direct assessments of the digital effects of the pandemic directly by the respondents
themselves.
8
The total sample consists of 1150 large and medium-sized enterprises registered in Russia,
included in section C of the OKVED-2 classification. The sample is representative for all units of
observation, multidimensional, stratified, and representative for the main economic parameters of
thirty regions of Russia6. Taking into account the likely differentiation in the responses of various
segments of the manufacturing industry to the COVID-19 crisis, we often differentiated between
various types of activities within manufacturing, which is possible due to the possibility of
detailing the results to the second level of OKVED-2 classification. In many cases, these sub-
sectors were united into groups in terms of the level of technological advancement of production.
The distribution of activities into medium- and high-tech, as well as low-tech activities was
carried out in accordance with the recommendations of UNIDO7. It is based on the International
Standard Industrial Classification (ISIC) and the Standard International Trade Classification
(SITC), as well as a version of the OECD classification adapted to the characteristics of the
countries of the post-Soviet region, which links industry spending on research and development
with sizes of value added and production.
The processing of raw materials is made up of activities mainly with a low level of
technology, labor-intensive production processes and low capital intensity. The possible
competitive advantages of such industries are determined mainly by the presence of local natural
resources in the country or by the fact that the skills and technologies used in production can attract
capital and promote new technologies. This group of industries is not considered in our study.
Low-tech industries include industries that have fairly simple requirements for the skills
and qualifications of workers, but are more capital-intensive. In developed countries, the assembly
operations of such industries are often transferred to countries with cheap labor and raw materials,
while complex production and technological functions remain within the country.
Medium-tech and high-tech manufacturing industries for Russia are combined, according
to UNIDO recommendations, into one group, characterized by complex technologies and high
requirements for personnel qualifications. Mid-tech industries combine manufacturing with
moderately high levels of research and development, requiring sophisticated skills and long-term
learning. High-tech industries use advanced technologies that require high investments in research
6 Krasnodarskij kraj, Krasnojarskij kraj, Primorskij kraj, Stavropol'skij kraj, Habarovskij kraj, Arhangel'skaja oblast', Vladimirskaja
oblast', Volgogradskaja oblast', Vologodskaja oblast', Nizhegorodskaja oblast', Irkutskaja oblast', Tverskaja oblast', Kemerovskaja
oblast', Samarskaja oblast', Sankt-Peterburg, Leningradskaja oblast', Moskva, Moskovskaja oblast', Novosibirskaja oblast',
Rostovskaja oblast', Sverdlovskaja oblast', Smolenskaja oblast', Tul'skaja oblast', Tjumenskaja oblast', Cheljabinskaja oblast',
Respublika Bashkortostan, Respublika Dagestan, Respublika Tatarstan, Udmurtskaja Respublika, Respublika Saha. 7 UNIDO. Classification of manufacturing sectors by technological intensity (ISIC Revision 4). URL:
https://stat.unido.org/content/learning-center/classification-of-manufacturing-sectors-by-technological-intensity-%28isic-
revision-4%29;jsessionid=B99E902A3918AB9F3DF9859923DFC4F4
9
and development, advanced technological infrastructure and a high level of specialized technical
skills.
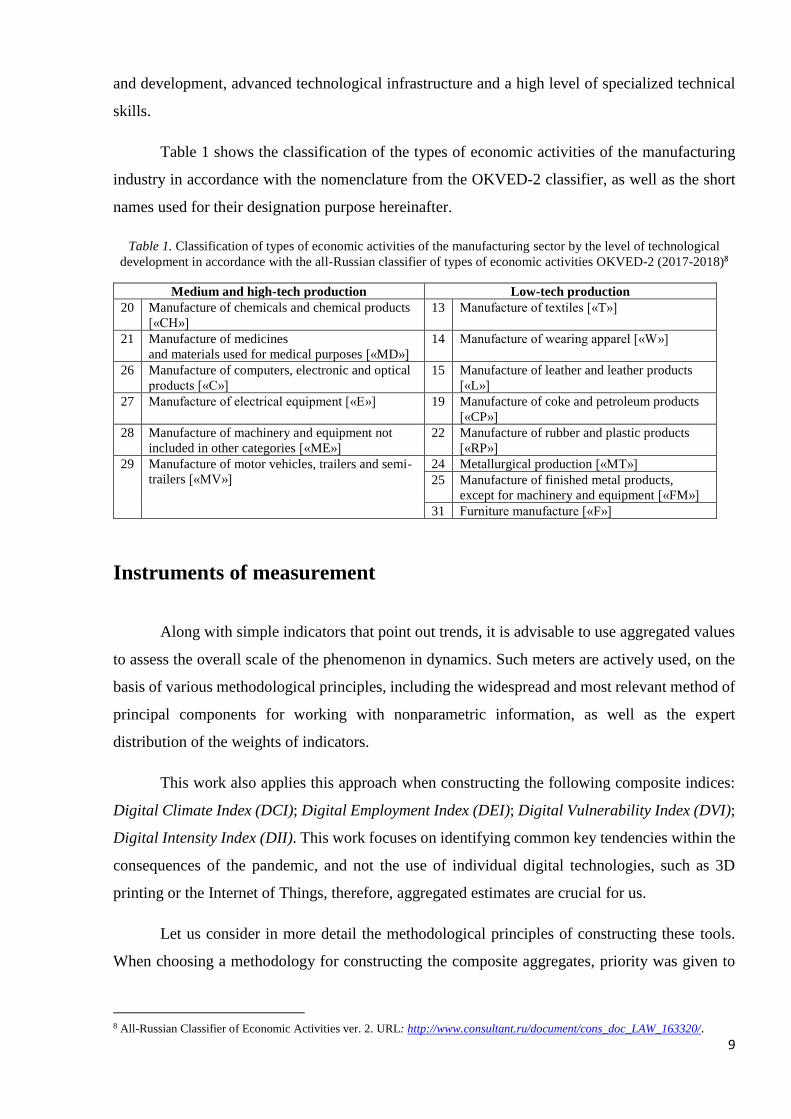
Table 1 shows the classification of the types of economic activities of the manufacturing
industry in accordance with the nomenclature from the OKVED-2 classifier, as well as the short
names used for their designation purpose hereinafter.
Table 1. Classification of types of economic activities of the manufacturing sector by the level of technological
development in accordance with the all-Russian classifier of types of economic activities OKVED-2 (2017-2018)8
Medium and high-tech production Low-tech production
20 Manufacture of chemicals and chemical products
[«CH»]
13 Manufacture of textiles [«T»]
21 Manufacture of medicines
and materials used for medical purposes [«MD»]
14 Manufacture of wearing apparel [«W»]
26 Manufacture of computers, electronic and optical
products [«C»]
15 Manufacture of leather and leather products
[«L»]
27 Manufacture of electrical equipment [«E»] 19 Manufacture of coke and petroleum products
[«CP»]
28 Manufacture of machinery and equipment not
included in other categories [«МE»]
22 Manufacture of rubber and plastic products
[«RP»]
29 Manufacture of motor vehicles, trailers and semi-
trailers [«MV»]
24 Metallurgical production [«МT»]
25 Manufacture of finished metal products,
except for machinery and equipment [«FM»]
31 Furniture manufacture [«F»]
Instruments of measurement
Along with simple indicators that point out trends, it is advisable to use aggregated values
to assess the overall scale of the phenomenon in dynamics. Such meters are actively used, on the
basis of various methodological principles, including the widespread and most relevant method of
principal components for working with nonparametric information, as well as the expert
distribution of the weights of indicators.
This work also applies this approach when constructing the following composite indices:
Digital Climate Index (DCI); Digital Employment Index (DEI); Digital Vulnerability Index (DVI);
Digital Intensity Index (DII). This work focuses on identifying common key tendencies within the
consequences of the pandemic, and not the use of individual digital technologies, such as 3D
printing or the Internet of Things, therefore, aggregated estimates are crucial for us.
Let us consider in more detail the methodological principles of constructing these tools.
When choosing a methodology for constructing the composite aggregates, priority was given to
8 All-Russian Classifier of Economic Activities ver. 2. URL: http://www.consultant.ru/document/cons_doc_LAW_163320/.
10
the methods on which the indices built by the European Commission based in the framework of
monitoring digital transformation, such as the European Digital Intensity Index (DII) and Digital
Technology Integration Index (DTII), due to the possibility of their maximum harmonization with
the European practice of measuring digital activity.
The first three indices are calculated using the principal component analysis, aggregating
the estimates of changes in the relevant parameters of the digital environment similar to the
European Digital Transformation Integration Index (DTII). The DCI measures the aggregate
digital sentiment in the manufacturing industry by aggregating estimates of changes in key
parameters of the digital environment: digital activity, investment in technology, demand for
digital products. DEI measures changes at enterprises in terms of the dynamics of the number of
employment of specialists with ICT competencies. In addition to the DEI, the Total Employment
Index (TEI) is involved in the work, which makes it possible to track the dynamics and trends
regarding all the employees at the enterprise, and not only specialized in the field of ICT. DVI
measures the general level of vulnerability (stress resistance) of enterprises to the typical industrial
limiting barriers for development, as well as to sudden shocks of the business and digital
environment.
The methodology for constructing the ICT is a version of the methodology for calculating
the DII (Digital Intensity Index) developed by Eurostat (2020), adapted for Russia, calculated on
the basis of the results of the annual European survey on the use of ICT and e-commerce in
enterprises. Original DII is a 12-point micro-index that is calculated for each individual enterprise
from the sample population. Each enterprise can score from 0 to 12 points, depending on how
many criteria of digital intensity it satisfies. Enterprises are then divided into four groups of digital
intensity: very low (score 0-3), low (score 4-6), high (score 7-9), very high (score 10-12).
The set of criteria used by Eurostat is revised and adapted every year to better suit the
changing realities and the current stage of digital development, but the general idea remains the
same: the index is intended to reflect the depth of the enterprise's involvement in digital
transformation in terms of its various aspects. Accordingly, the list of criteria has evolved over
time and included, among others, the following: Internet use by the majority of employees; access
to ICT specialists; access to fixed broadband speed higher than 30 Mbps; mobile devices are used
by more than 20% of employees; presence of a company website; presence of a company in social
networks; electronic sales are at least 1% of the total turnover; presence of B2C sales via the
Internet; electronic exchange of information on supply chain management; purchase of services in
the field of cloud computing; sending electronic invoices.
11
In this work, the methodology was adapted in the form of a similar but 9-point micro-index.
Most of our criteria are identical to those used to construct the European counterpart index; some
of the criteria, in which case it was impossible to find complete analogs among the indicators of
the questionnaire, was replaced by other indicators that were close and relevant in meaning. For
some of the criteria, it was not possible to find adequate analogues, which led to a decrease in the
total number of calculated points from 12 to 9. Similarly, enterprises were divided into four groups
of digital intensity level according to a slightly different classification: low (score 0-2), medium
(score 3- 5), above average (score 6-7), high (score 8-9).
A distinctive feature of the Russian index in comparison with the European one is that this
index is tied to entrepreneurial assessments of current tendencies. Compliance with the index
criterion in the case of Russian business tendency survey-based index means that, from the
respondent's point of view, during the year when the survey was carried out, the company
underwent positive changes in the considered parameter of digital intensity. Accordingly, our
index primarily reflects the situation “in almost real mode of time”, i. e., the current dynamics of
industry changes. This point of view is especially convenient for analyzing industry events that
took place in 2020 in connection with the onset of the coronavirus crisis.
Thus, calculated for the 2019 and 2020 survey results, DII was based on the following 9
most relevant criteria (indicators), characterized by a growth trend in the current year compared to
the previous year, which we selected from observations:
1) The use of personal computers, laptop computers, tablets and other portable devices in
the enterprise;
2) The number of employees in the field of digital technologies at the enterprise (ICT
specialists);
3) Internet access and use of the Internet for business purposes;
4) Use of own website;
5) Use of cloud services;
6) Exchange of information in electronic form at the enterprise;
7) Exchange of information in electronic form on supply chain management with other
enterprises, suppliers or consumers;
8) Electronic invoicing;
12
9) The presence of the enterprise in social media.
As the European research practice shows, DII is good at identifying differentiation between
countries and sectors of the economy in terms of digitalization. The European experience shows
that the most digitalized sector is the ICT sector in the broadest sense, as well as a number of
segments of the service sector, including wholesale trade. The manufacturing industry is not a
leader: on average, only about 10-15% of enterprises could be classified as enterprises with high
digital intensity according to the European index.
Results
1. Digital Climate Assessments
The sudden shock caused by COVID-19 did not severely distort the digital climate in the
manufacturing industry but given the unprecedentedness of the calls that have shifted production
to a mode of increased mobilization, the focus on digitalization has decreased in some of them.
The results of the 2020 survey indicate moderately negative consequences of the pandemic for the
manufacturing segment as a whole, but rather asymmetric manifestations of the crisis in sub-
sectors, including those that received a stimulating impetus.
The change in DCI in 2020 compared to 2019 allows us to conclude that the segment as a
whole avoided a sharp break in the dynamics of the digitalization process, demonstrating only a
slight slowdown in the intensity of its individual components: the indicator dropped to 99.6 from
99.8%, having lost only 0.2% (fig. 1).
At the same time, in the sectoral context, one can observe an increased volatility of the DCI
values and, as a result, heterogeneity in the landscape of the digital environment, which indicates
not only the unequal actual impact of the pandemic, but the individual specificity and role of digital
solutions for production as a potential source of business growth, the competitiveness of products,
and finally, as a tool for eliminating the consequences of the coronavirus crisis, which determined
the high uncertainty of subsequent development.
Among medium- and high-tech enterprises, the deterioration of the digital climate was
insignificant and, despite the weakening of positive trends in its estimates, most of them remained
in the favorable range of the index values. In particular, the adjustment, which caused a slowdown
in the growth of DCI, occurred at the chemical industry enterprises (the index decreased by 0.7%
to 100.5%), as well as in the production of motor vehicles (by 0.9%. to 100.5%).
Among the low-tech industries, the most affected were enterprises producing finished
metal products, except for machinery and equipment (a decrease in the DCI by 1.1% to 98.4%)
13
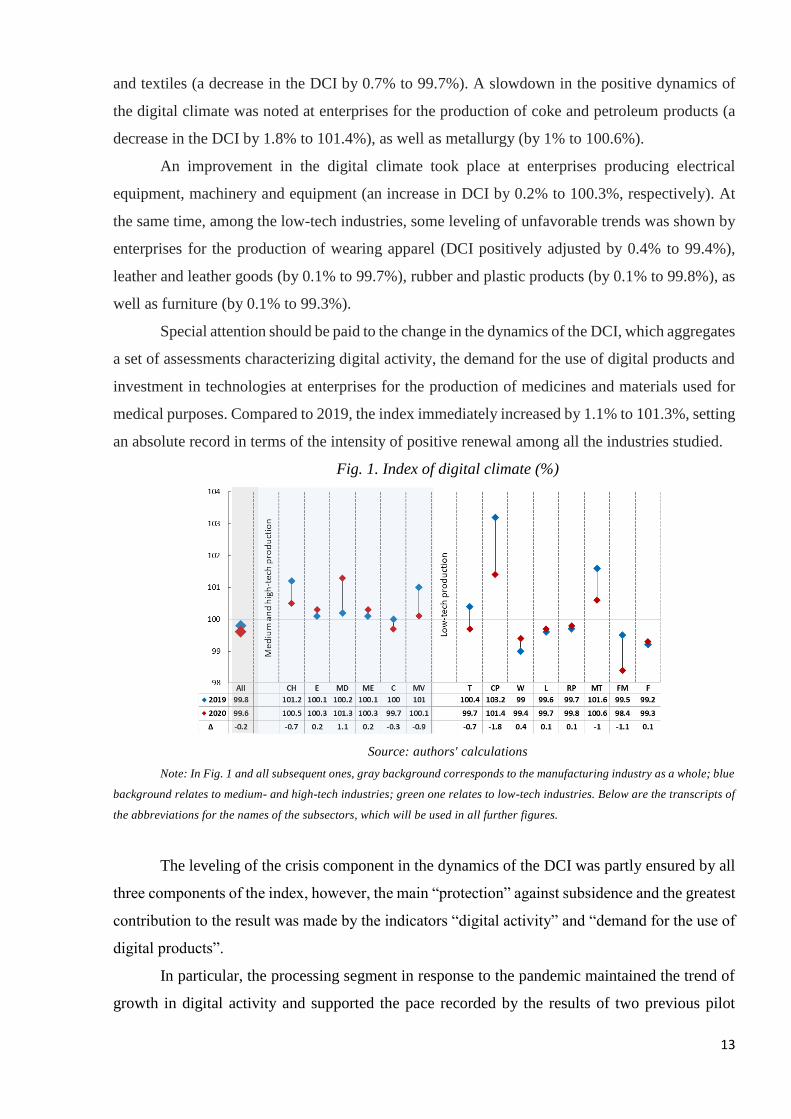
and textiles (a decrease in the DCI by 0.7% to 99.7%). A slowdown in the positive dynamics of
the digital climate was noted at enterprises for the production of coke and petroleum products (a
decrease in the DCI by 1.8% to 101.4%), as well as metallurgy (by 1% to 100.6%).
An improvement in the digital climate took place at enterprises producing electrical
equipment, machinery and equipment (an increase in DCI by 0.2% to 100.3%, respectively). At
the same time, among the low-tech industries, some leveling of unfavorable trends was shown by
enterprises for the production of wearing apparel (DCI positively adjusted by 0.4% to 99.4%),
leather and leather goods (by 0.1% to 99.7%), rubber and plastic products (by 0.1% to 99.8%), as
well as furniture (by 0.1% to 99.3%).
Special attention should be paid to the change in the dynamics of the DCI, which aggregates
a set of assessments characterizing digital activity, the demand for the use of digital products and
investment in technologies at enterprises for the production of medicines and materials used for
medical purposes. Compared to 2019, the index immediately increased by 1.1% to 101.3%, setting
an absolute record in terms of the intensity of positive renewal among all the industries studied.
Fig. 1. Index of digital climate (%)
Source: authors' calculations
Note: In Fig. 1 and all subsequent ones, gray background corresponds to the manufacturing industry as a whole; blue
background relates to medium- and high-tech industries; green one relates to low-tech industries. Below are the transcripts of
the abbreviations for the names of the subsectors, which will be used in all further figures.
The leveling of the crisis component in the dynamics of the DCI was partly ensured by all
three components of the index, however, the main “protection” against subsidence and the greatest
contribution to the result was made by the indicators “digital activity” and “demand for the use of
digital products”.
In particular, the processing segment in response to the pandemic maintained the trend of
growth in digital activity and supported the pace recorded by the results of two previous pilot
14
observations during 2018 and 2019: the balance value of the indicator increased to the mark (+
11%). Thus, according to the survey, 2020 was no exception - the updated result signals the high
importance of digital processes, despite all features of the current moment and future uncertainty
of the COVID-19 crisis.
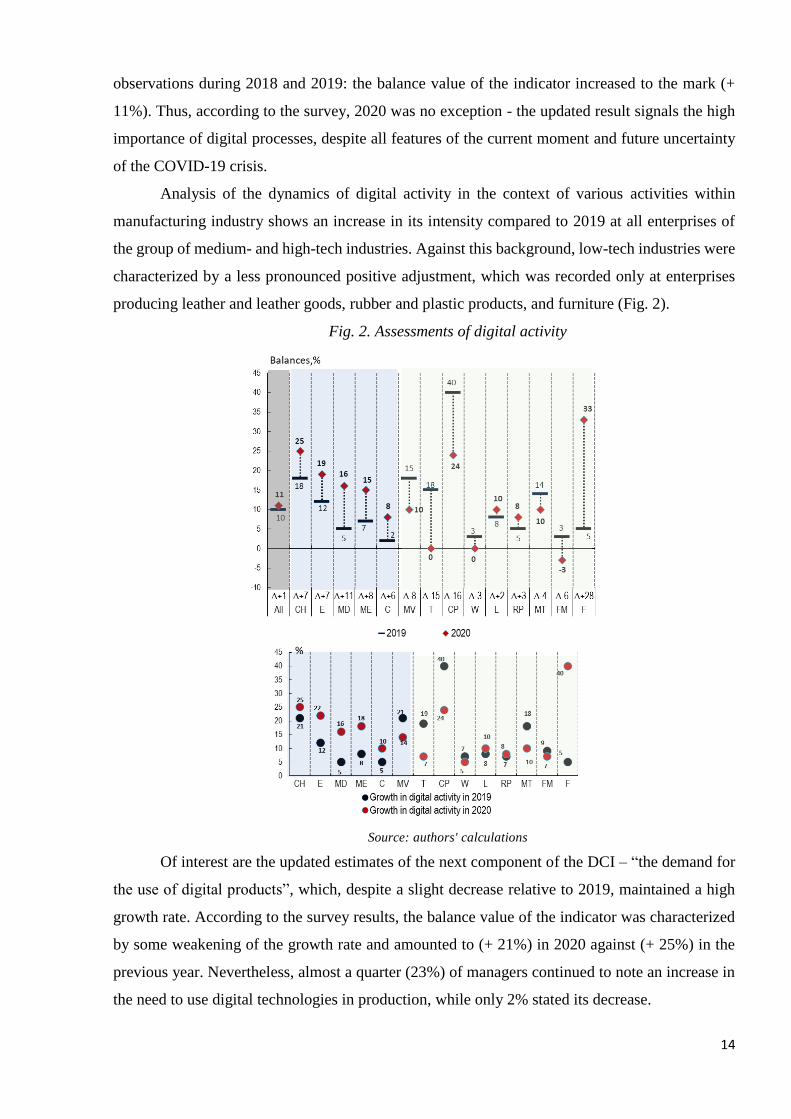
Analysis of the dynamics of digital activity in the context of various activities within
manufacturing industry shows an increase in its intensity compared to 2019 at all enterprises of
the group of medium- and high-tech industries. Against this background, low-tech industries were
characterized by a less pronounced positive adjustment, which was recorded only at enterprises
producing leather and leather goods, rubber and plastic products, and furniture (Fig. 2).
Fig. 2. Assessments of digital activity
Source: authors' calculations
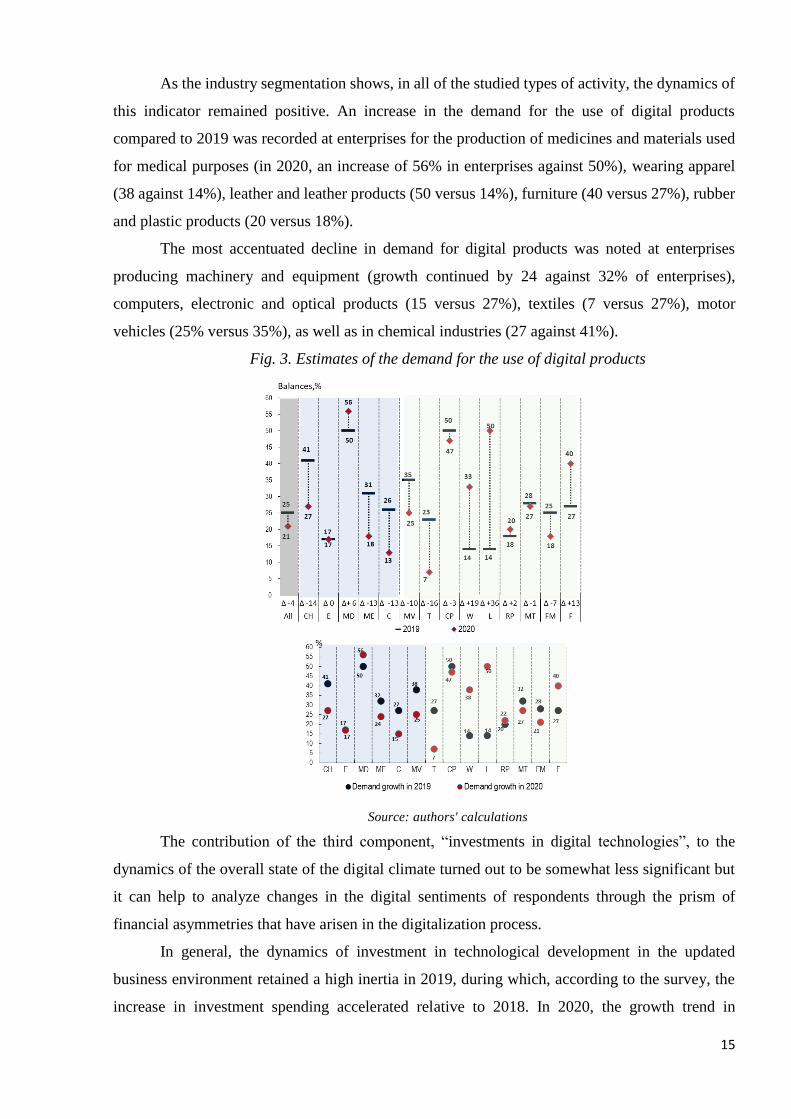
Of interest are the updated estimates of the next component of the DCI – “the demand for
the use of digital products”, which, despite a slight decrease relative to 2019, maintained a high
growth rate. According to the survey results, the balance value of the indicator was characterized
by some weakening of the growth rate and amounted to (+ 21%) in 2020 against (+ 25%) in the
previous year. Nevertheless, almost a quarter (23%) of managers continued to note an increase in
the need to use digital technologies in production, while only 2% stated its decrease.
15
As the industry segmentation shows, in all of the studied types of activity, the dynamics of
this indicator remained positive. An increase in the demand for the use of digital products
compared to 2019 was recorded at enterprises for the production of medicines and materials used
for medical purposes (in 2020, an increase of 56% in enterprises against 50%), wearing apparel
(38 against 14%), leather and leather products (50 versus 14%), furniture (40 versus 27%), rubber
and plastic products (20 versus 18%).
The most accentuated decline in demand for digital products was noted at enterprises
producing machinery and equipment (growth continued by 24 against 32% of enterprises),
computers, electronic and optical products (15 versus 27%), textiles (7 versus 27%), motor
vehicles (25% versus 35%), as well as in chemical industries (27 against 41%).
Fig. 3. Estimates of the demand for the use of digital products
Source: authors' calculations
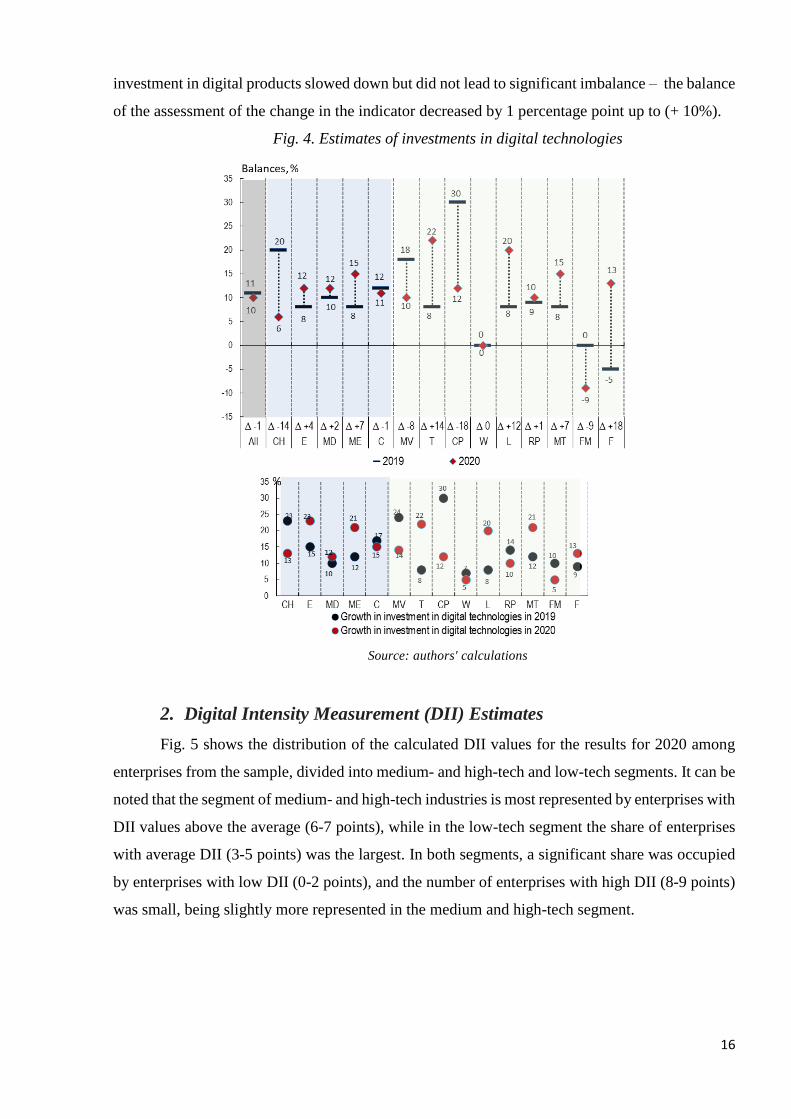
The contribution of the third component, “investments in digital technologies”, to the
dynamics of the overall state of the digital climate turned out to be somewhat less significant but
it can help to analyze changes in the digital sentiments of respondents through the prism of
financial asymmetries that have arisen in the digitalization process.
In general, the dynamics of investment in technological development in the updated
business environment retained a high inertia in 2019, during which, according to the survey, the
increase in investment spending accelerated relative to 2018. In 2020, the growth trend in
16
investment in digital products slowed down but did not lead to significant imbalance – the balance
of the assessment of the change in the indicator decreased by 1 percentage point up to (+ 10%).
Fig. 4. Estimates of investments in digital technologies
Source: authors' calculations
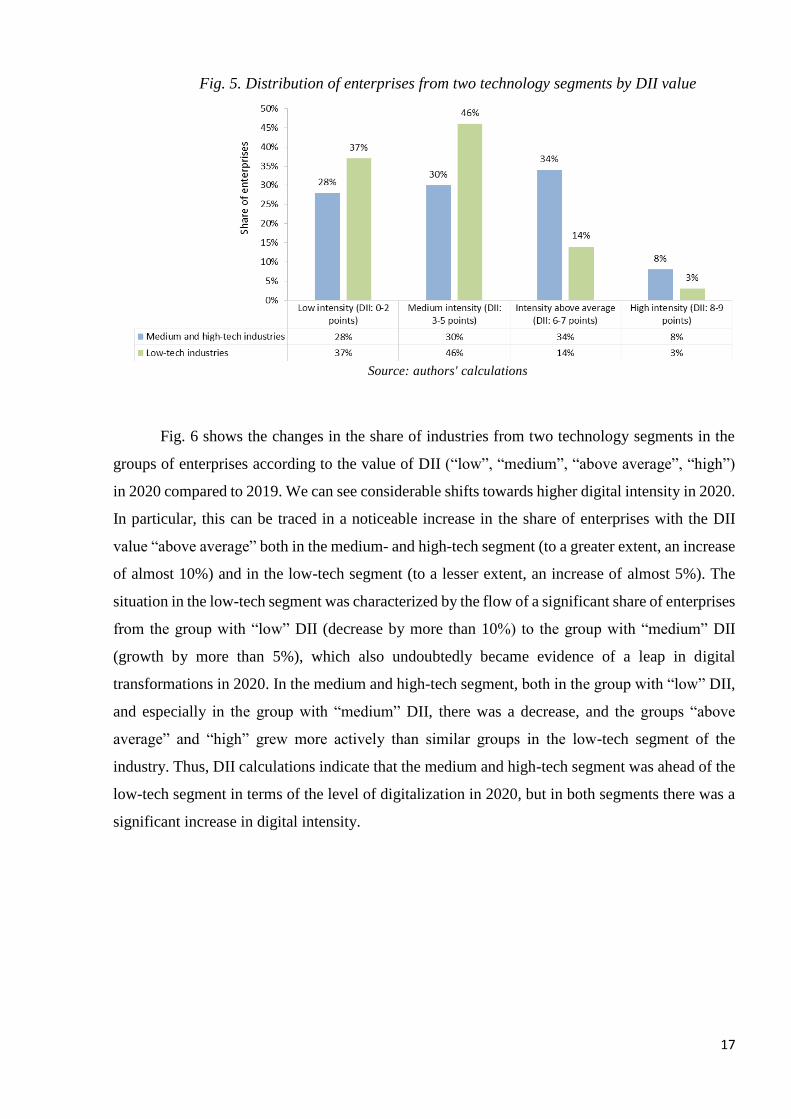
2. Digital Intensity Measurement (DII) Estimates
Fig. 5 shows the distribution of the calculated DII values for the results for 2020 among
enterprises from the sample, divided into medium- and high-tech and low-tech segments. It can be
noted that the segment of medium- and high-tech industries is most represented by enterprises with
DII values above the average (6-7 points), while in the low-tech segment the share of enterprises
with average DII (3-5 points) was the largest. In both segments, a significant share was occupied
by enterprises with low DII (0-2 points), and the number of enterprises with high DII (8-9 points)
was small, being slightly more represented in the medium and high-tech segment.
17
Fig. 5. Distribution of enterprises from two technology segments by DII value
Source: authors' calculations
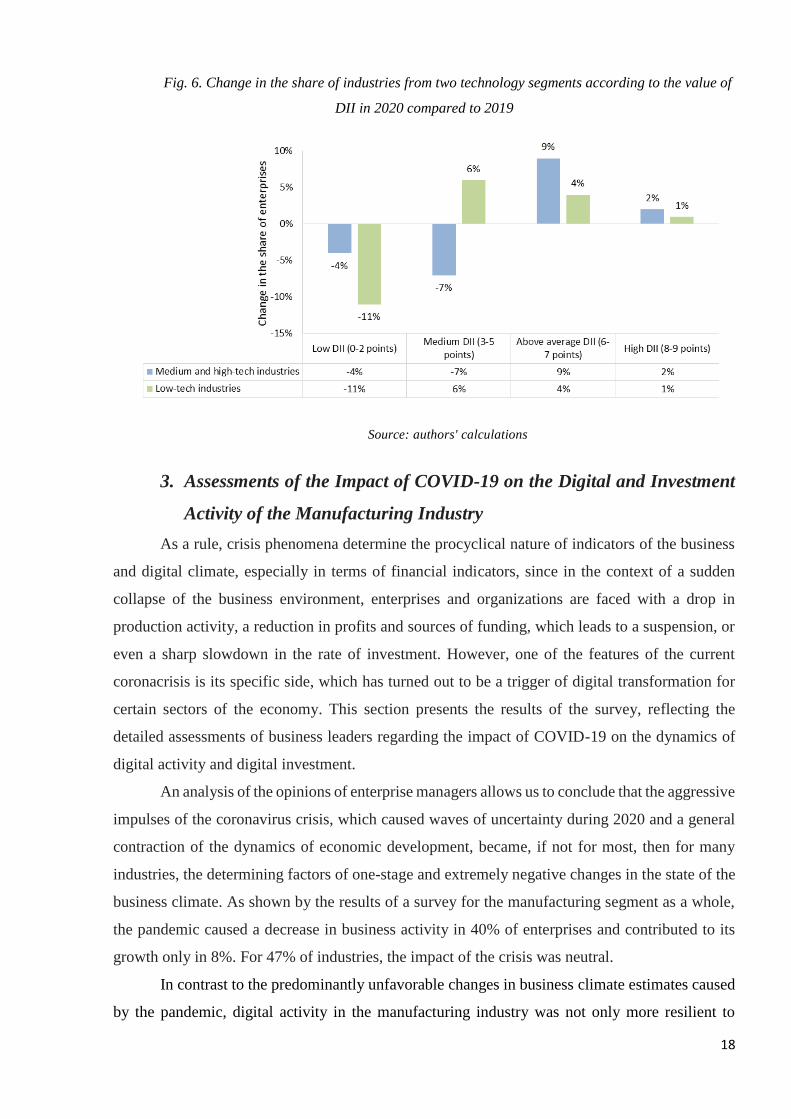
Fig. 6 shows the changes in the share of industries from two technology segments in the
groups of enterprises according to the value of DII (“low”, “medium”, “above average”, “high”)
in 2020 compared to 2019. We can see considerable shifts towards higher digital intensity in 2020.
In particular, this can be traced in a noticeable increase in the share of enterprises with the DII
value “above average” both in the medium- and high-tech segment (to a greater extent, an increase
of almost 10%) and in the low-tech segment (to a lesser extent, an increase of almost 5%). The
situation in the low-tech segment was characterized by the flow of a significant share of enterprises
from the group with “low” DII (decrease by more than 10%) to the group with “medium” DII
(growth by more than 5%), which also undoubtedly became evidence of a leap in digital
transformations in 2020. In the medium and high-tech segment, both in the group with “low” DII,
and especially in the group with “medium” DII, there was a decrease, and the groups “above
average” and “high” grew more actively than similar groups in the low-tech segment of the
industry. Thus, DII calculations indicate that the medium and high-tech segment was ahead of the
low-tech segment in terms of the level of digitalization in 2020, but in both segments there was a
significant increase in digital intensity.
18
Fig. 6. Change in the share of industries from two technology segments according to the value of
DII in 2020 compared to 2019
Source: authors' calculations
3. Assessments of the Impact of COVID-19 on the Digital and Investment
Activity of the Manufacturing Industry
As a rule, crisis phenomena determine the procyclical nature of indicators of the business
and digital climate, especially in terms of financial indicators, since in the context of a sudden
collapse of the business environment, enterprises and organizations are faced with a drop in
production activity, a reduction in profits and sources of funding, which leads to a suspension, or
even a sharp slowdown in the rate of investment. However, one of the features of the current
coronacrisis is its specific side, which has turned out to be a trigger of digital transformation for
certain sectors of the economy. This section presents the results of the survey, reflecting the
detailed assessments of business leaders regarding the impact of COVID-19 on the dynamics of
digital activity and digital investment.
An analysis of the opinions of enterprise managers allows us to conclude that the aggressive
impulses of the coronavirus crisis, which caused waves of uncertainty during 2020 and a general
contraction of the dynamics of economic development, became, if not for most, then for many
industries, the determining factors of one-stage and extremely negative changes in the state of the
business climate. As shown by the results of a survey for the manufacturing segment as a whole,
the pandemic caused a decrease in business activity in 40% of enterprises and contributed to its
growth only in 8%. For 47% of industries, the impact of the crisis was neutral.
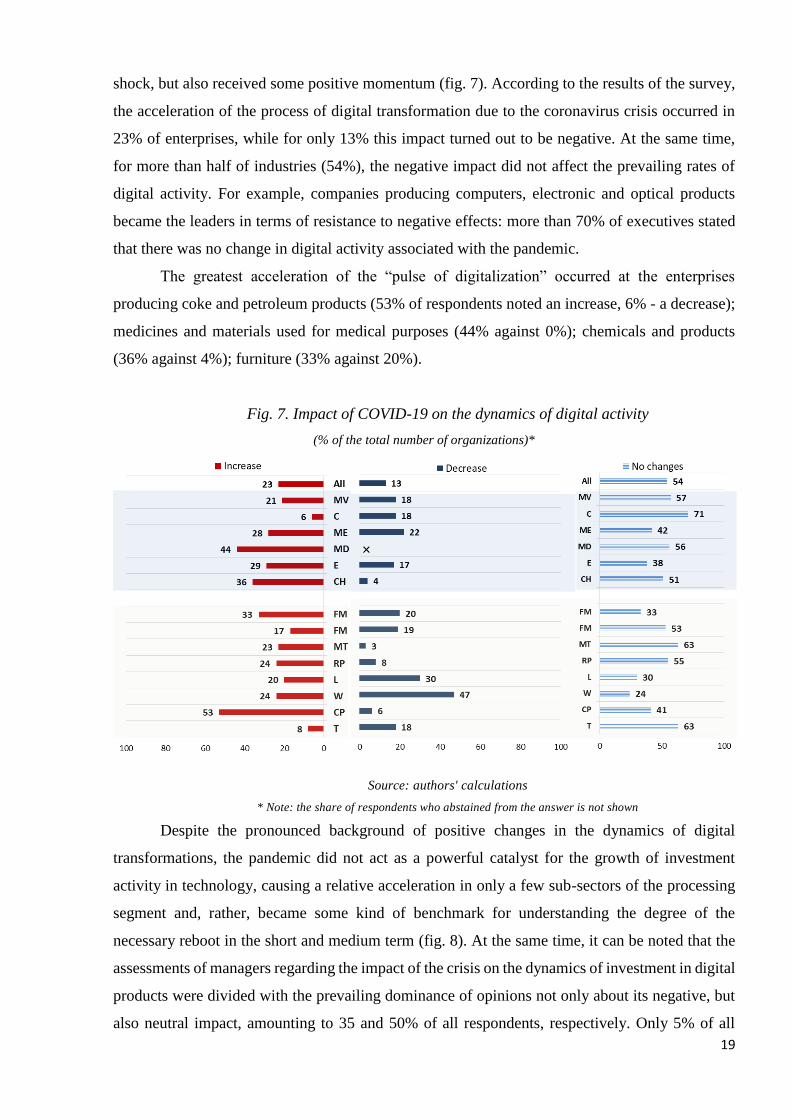
In contrast to the predominantly unfavorable changes in business climate estimates caused
by the pandemic, digital activity in the manufacturing industry was not only more resilient to
19
shock, but also received some positive momentum (fig. 7). According to the results of the survey,
the acceleration of the process of digital transformation due to the coronavirus crisis occurred in
23% of enterprises, while for only 13% this impact turned out to be negative. At the same time,
for more than half of industries (54%), the negative impact did not affect the prevailing rates of
digital activity. For example, companies producing computers, electronic and optical products
became the leaders in terms of resistance to negative effects: more than 70% of executives stated
that there was no change in digital activity associated with the pandemic.
The greatest acceleration of the “pulse of digitalization” occurred at the enterprises
producing coke and petroleum products (53% of respondents noted an increase, 6% - a decrease);
medicines and materials used for medical purposes (44% against 0%); chemicals and products
(36% against 4%); furniture (33% against 20%).
Fig. 7. Impact of COVID-19 on the dynamics of digital activity
(% of the total number of organizations)*
Source: authors' calculations
* Note: the share of respondents who abstained from the answer is not shown
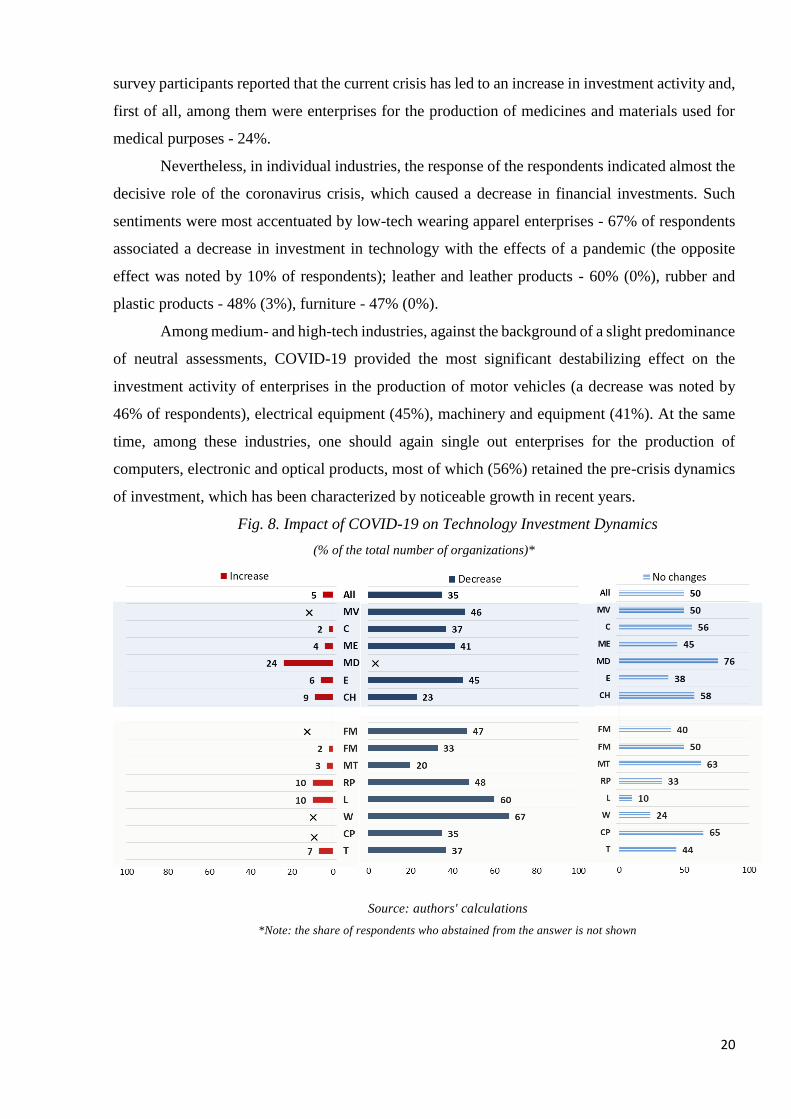
Despite the pronounced background of positive changes in the dynamics of digital
transformations, the pandemic did not act as a powerful catalyst for the growth of investment
activity in technology, causing a relative acceleration in only a few sub-sectors of the processing
segment and, rather, became some kind of benchmark for understanding the degree of the
necessary reboot in the short and medium term (fig. 8). At the same time, it can be noted that the
assessments of managers regarding the impact of the crisis on the dynamics of investment in digital
products were divided with the prevailing dominance of opinions not only about its negative, but
also neutral impact, amounting to 35 and 50% of all respondents, respectively. Only 5% of all
20
survey participants reported that the current crisis has led to an increase in investment activity and,
first of all, among them were enterprises for the production of medicines and materials used for
medical purposes - 24%.
Nevertheless, in individual industries, the response of the respondents indicated almost the
decisive role of the coronavirus crisis, which caused a decrease in financial investments. Such
sentiments were most accentuated by low-tech wearing apparel enterprises - 67% of respondents
associated a decrease in investment in technology with the effects of a pandemic (the opposite
effect was noted by 10% of respondents); leather and leather products - 60% (0%), rubber and
plastic products - 48% (3%), furniture - 47% (0%).
Among medium- and high-tech industries, against the background of a slight predominance
of neutral assessments, COVID-19 provided the most significant destabilizing effect on the
investment activity of enterprises in the production of motor vehicles (a decrease was noted by
46% of respondents), electrical equipment (45%), machinery and equipment (41%). At the same
time, among these industries, one should again single out enterprises for the production of
computers, electronic and optical products, most of which (56%) retained the pre-crisis dynamics
of investment, which has been characterized by noticeable growth in recent years.
Fig. 8. Impact of COVID-19 on Technology Investment Dynamics
(% of the total number of organizations)*
Source: authors' calculations
*Note: the share of respondents who abstained from the answer is not shown
21
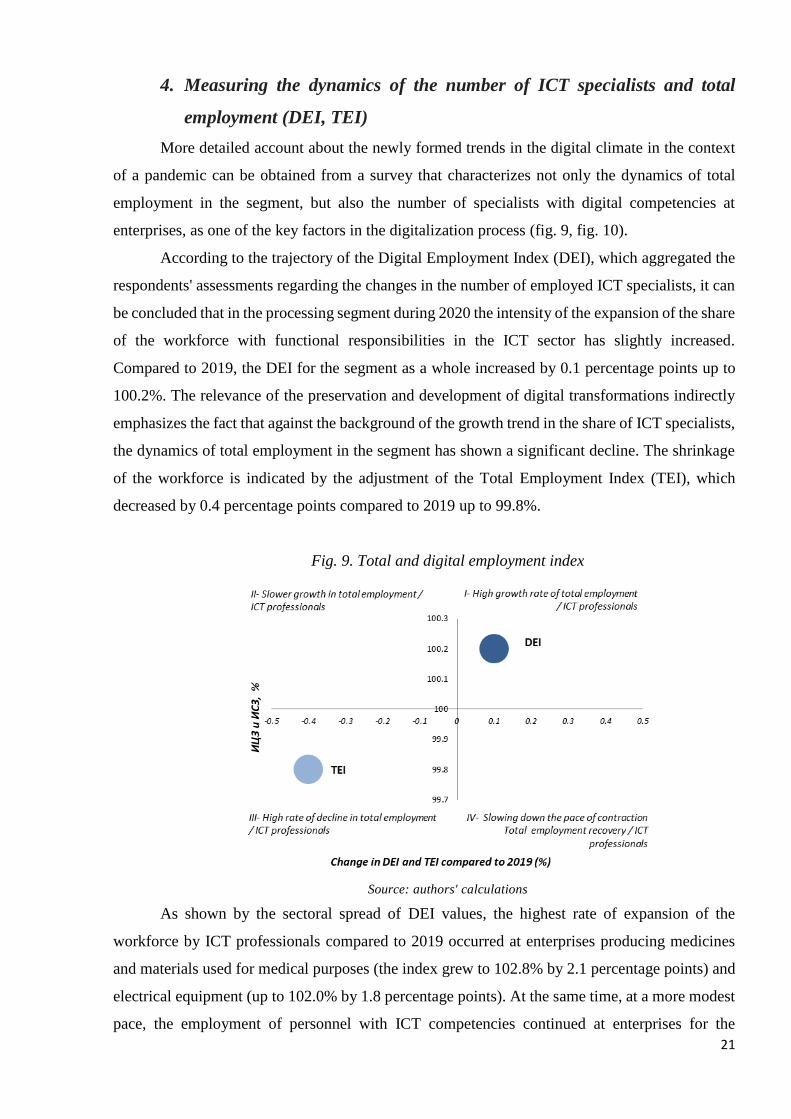
4. Measuring the dynamics of the number of ICT specialists and total
employment (DEI, TEI)
More detailed account about the newly formed trends in the digital climate in the context
of a pandemic can be obtained from a survey that characterizes not only the dynamics of total
employment in the segment, but also the number of specialists with digital competencies at
enterprises, as one of the key factors in the digitalization process (fig. 9, fig. 10).
According to the trajectory of the Digital Employment Index (DEI), which aggregated the
respondents' assessments regarding the changes in the number of employed ICT specialists, it can
be concluded that in the processing segment during 2020 the intensity of the expansion of the share
of the workforce with functional responsibilities in the ICT sector has slightly increased.
Compared to 2019, the DEI for the segment as a whole increased by 0.1 percentage points up to
100.2%. The relevance of the preservation and development of digital transformations indirectly
emphasizes the fact that against the background of the growth trend in the share of ICT specialists,
the dynamics of total employment in the segment has shown a significant decline. The shrinkage
of the workforce is indicated by the adjustment of the Total Employment Index (TEI), which
decreased by 0.4 percentage points compared to 2019 up to 99.8%.
Fig. 9. Total and digital employment index
Source: authors' calculations
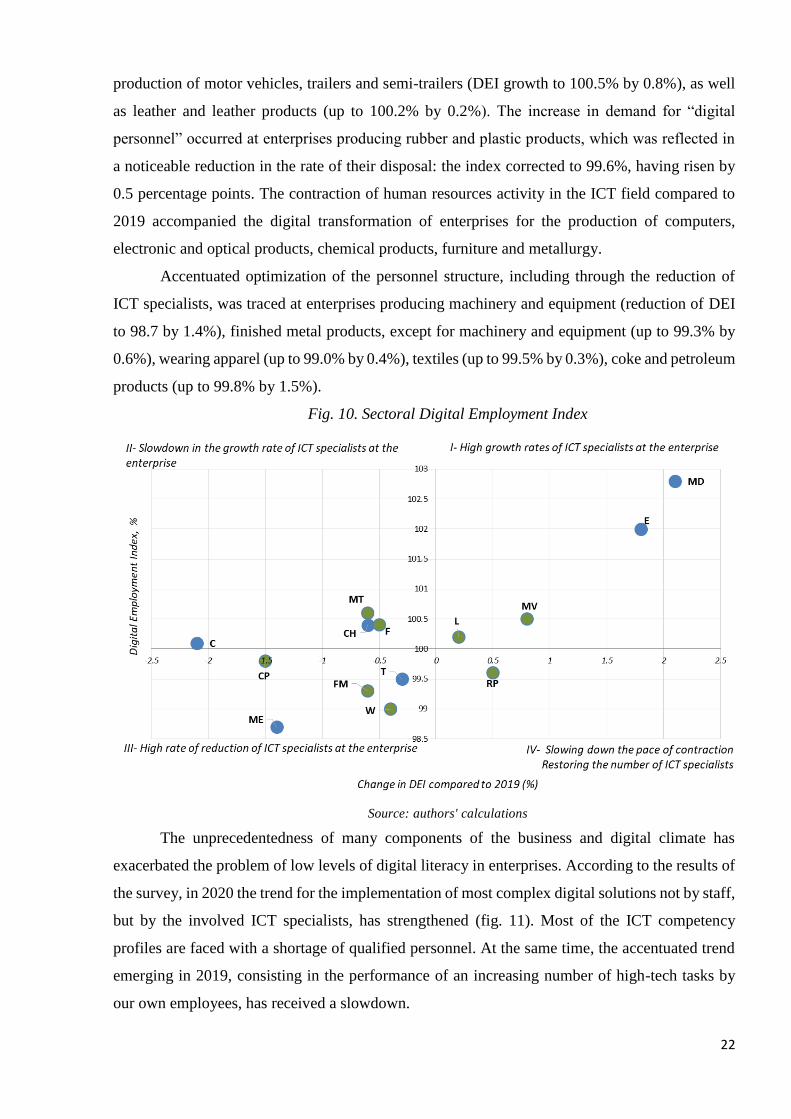
As shown by the sectoral spread of DEI values, the highest rate of expansion of the
workforce by ICT professionals compared to 2019 occurred at enterprises producing medicines
and materials used for medical purposes (the index grew to 102.8% by 2.1 percentage points) and
electrical equipment (up to 102.0% by 1.8 percentage points). At the same time, at a more modest
pace, the employment of personnel with ICT competencies continued at enterprises for the
22
production of motor vehicles, trailers and semi-trailers (DEI growth to 100.5% by 0.8%), as well
as leather and leather products (up to 100.2% by 0.2%). The increase in demand for “digital
personnel” occurred at enterprises producing rubber and plastic products, which was reflected in
a noticeable reduction in the rate of their disposal: the index corrected to 99.6%, having risen by
0.5 percentage points. The contraction of human resources activity in the ICT field compared to
2019 accompanied the digital transformation of enterprises for the production of computers,
electronic and optical products, chemical products, furniture and metallurgy.
Accentuated optimization of the personnel structure, including through the reduction of
ICT specialists, was traced at enterprises producing machinery and equipment (reduction of DEI
to 98.7 by 1.4%), finished metal products, except for machinery and equipment (up to 99.3% by
0.6%), wearing apparel (up to 99.0% by 0.4%), textiles (up to 99.5% by 0.3%), coke and petroleum
products (up to 99.8% by 1.5%).
Fig. 10. Sectoral Digital Employment Index
Source: authors' calculations
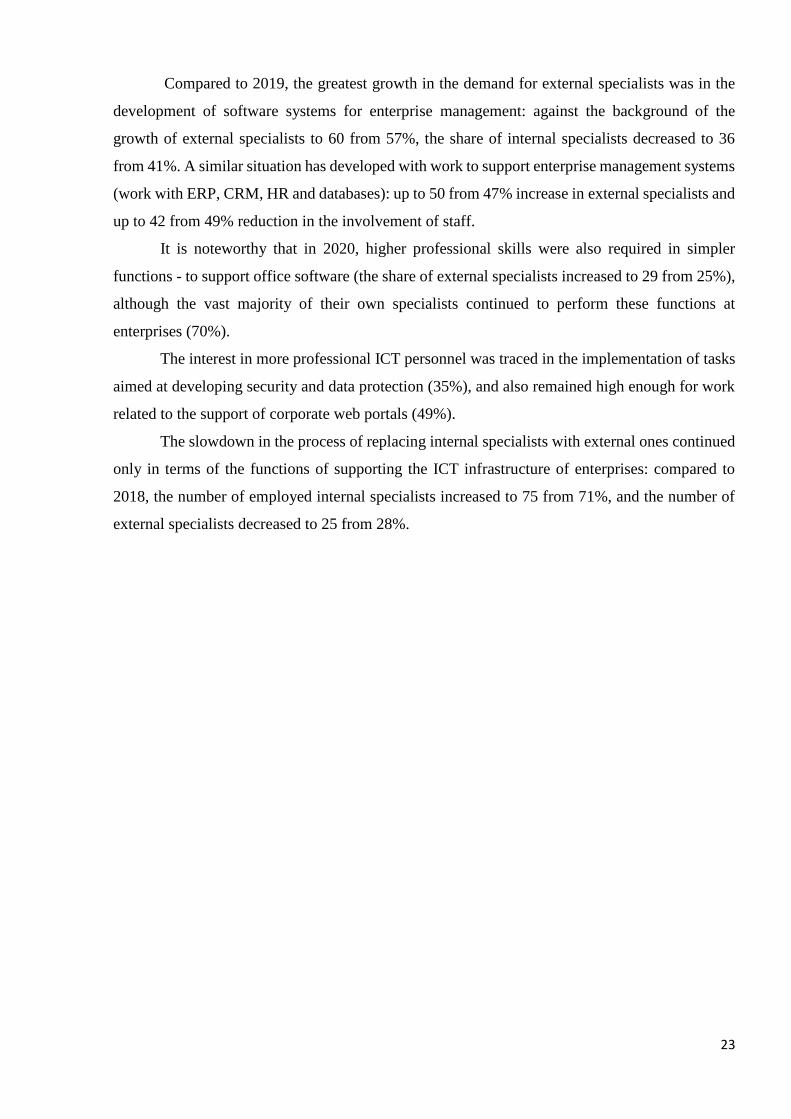
The unprecedentedness of many components of the business and digital climate has
exacerbated the problem of low levels of digital literacy in enterprises. According to the results of
the survey, in 2020 the trend for the implementation of most complex digital solutions not by staff,
but by the involved ICT specialists, has strengthened (fig. 11). Most of the ICT competency
profiles are faced with a shortage of qualified personnel. At the same time, the accentuated trend
emerging in 2019, consisting in the performance of an increasing number of high-tech tasks by
our own employees, has received a slowdown.
23
Compared to 2019, the greatest growth in the demand for external specialists was in the
development of software systems for enterprise management: against the background of the
growth of external specialists to 60 from 57%, the share of internal specialists decreased to 36
from 41%. A similar situation has developed with work to support enterprise management systems
(work with ERP, CRM, HR and databases): up to 50 from 47% increase in external specialists and
up to 42 from 49% reduction in the involvement of staff.
It is noteworthy that in 2020, higher professional skills were also required in simpler
functions - to support office software (the share of external specialists increased to 29 from 25%),
although the vast majority of their own specialists continued to perform these functions at
enterprises (70%).
The interest in more professional ICT personnel was traced in the implementation of tasks
aimed at developing security and data protection (35%), and also remained high enough for work
related to the support of corporate web portals (49%).
The slowdown in the process of replacing internal specialists with external ones continued
only in terms of the functions of supporting the ICT infrastructure of enterprises: compared to
2018, the number of employed internal specialists increased to 75 from 71%, and the number of
external specialists decreased to 25 from 28%.
24
Fig. 11. Distribution of external and internal specialists, performing functions in the field
of ICT at enterprises
(% of the total number of organizations)
Source: authors' calculations
The growing need to attract external ICT specialists with higher professional skills against
the background of a decrease in the involvement of internal staff (fig. 12), is consistent with the
strengthening of negative feedback from respondents from almost all sub-sectors of the
manufacturing industry for the limiting factor - “low level of digital literacy of specialists at the
25
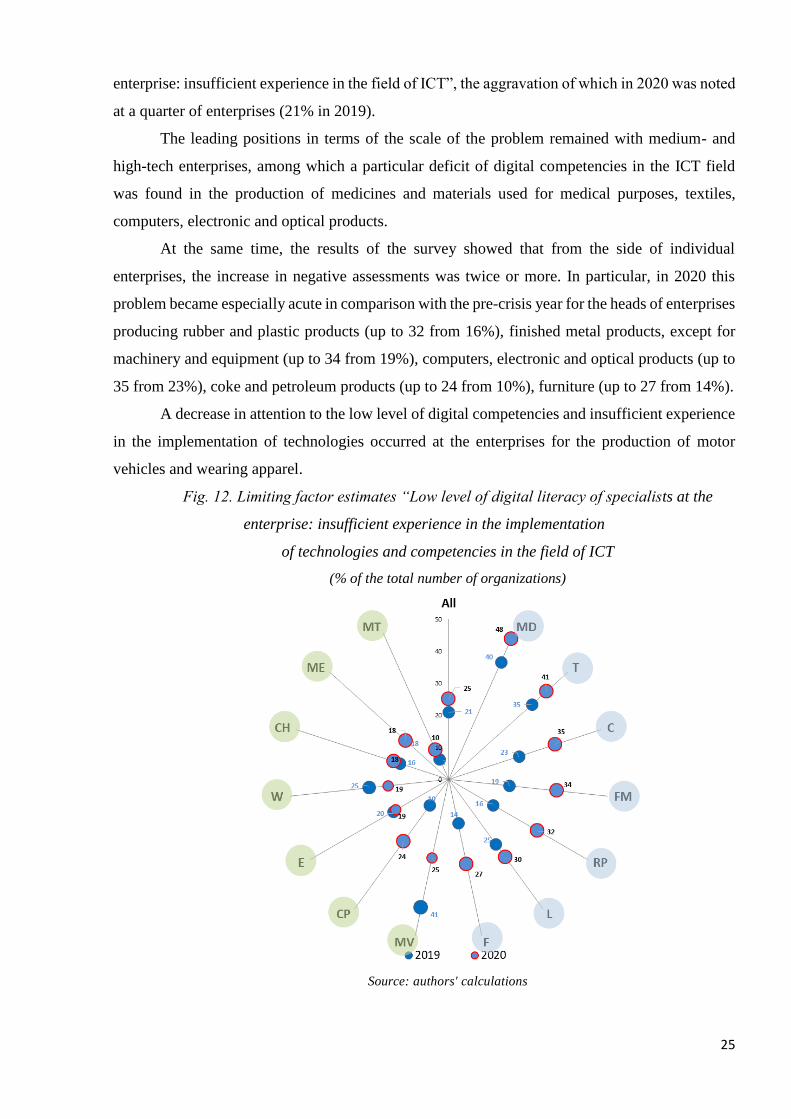
enterprise: insufficient experience in the field of ICT”, the aggravation of which in 2020 was noted
at a quarter of enterprises (21% in 2019).
The leading positions in terms of the scale of the problem remained with medium- and
high-tech enterprises, among which a particular deficit of digital competencies in the ICT field
was found in the production of medicines and materials used for medical purposes, textiles,
computers, electronic and optical products.
At the same time, the results of the survey showed that from the side of individual
enterprises, the increase in negative assessments was twice or more. In particular, in 2020 this
problem became especially acute in comparison with the pre-crisis year for the heads of enterprises
producing rubber and plastic products (up to 32 from 16%), finished metal products, except for
machinery and equipment (up to 34 from 19%), computers, electronic and optical products (up to
35 from 23%), coke and petroleum products (up to 24 from 10%), furniture (up to 27 from 14%).
A decrease in attention to the low level of digital competencies and insufficient experience
in the implementation of technologies occurred at the enterprises for the production of motor
vehicles and wearing apparel.
Fig. 12. Limiting factor estimates “Low level of digital literacy of specialists at the
enterprise: insufficient experience in the implementation
of technologies and competencies in the field of ICT
(% of the total number of organizations)
Source: authors' calculations
26
5. Measuring the vulnerability and adaptability of industries to digital
transformation in a pandemic
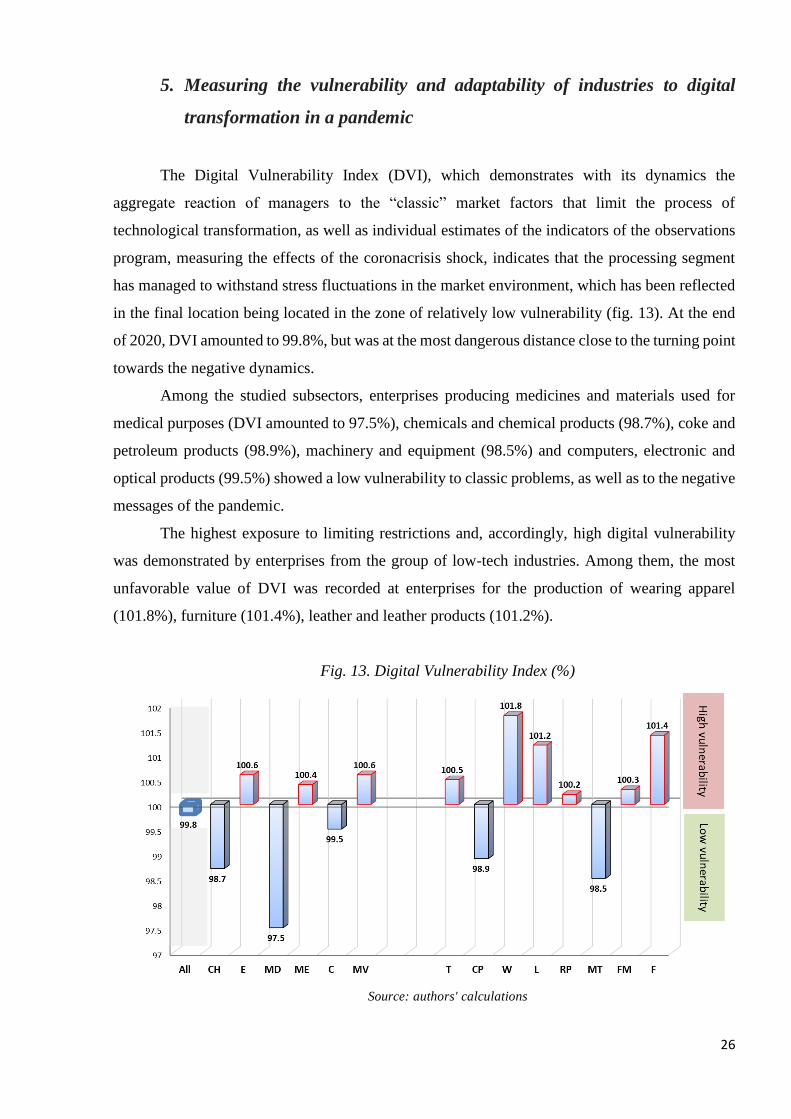
The Digital Vulnerability Index (DVI), which demonstrates with its dynamics the
aggregate reaction of managers to the “classic” market factors that limit the process of
technological transformation, as well as individual estimates of the indicators of the observations
program, measuring the effects of the coronacrisis shock, indicates that the processing segment
has managed to withstand stress fluctuations in the market environment, which has been reflected
in the final location being located in the zone of relatively low vulnerability (fig. 13). At the end
of 2020, DVI amounted to 99.8%, but was at the most dangerous distance close to the turning point
towards the negative dynamics.
Among the studied subsectors, enterprises producing medicines and materials used for
medical purposes (DVI amounted to 97.5%), chemicals and chemical products (98.7%), coke and
petroleum products (98.9%), machinery and equipment (98.5%) and computers, electronic and
optical products (99.5%) showed a low vulnerability to classic problems, as well as to the negative
messages of the pandemic.
The highest exposure to limiting restrictions and, accordingly, high digital vulnerability
was demonstrated by enterprises from the group of low-tech industries. Among them, the most
unfavorable value of DVI was recorded at enterprises for the production of wearing apparel
(101.8%), furniture (101.4%), leather and leather products (101.2%).
Fig. 13. Digital Vulnerability Index (%)
Source: authors' calculations
27
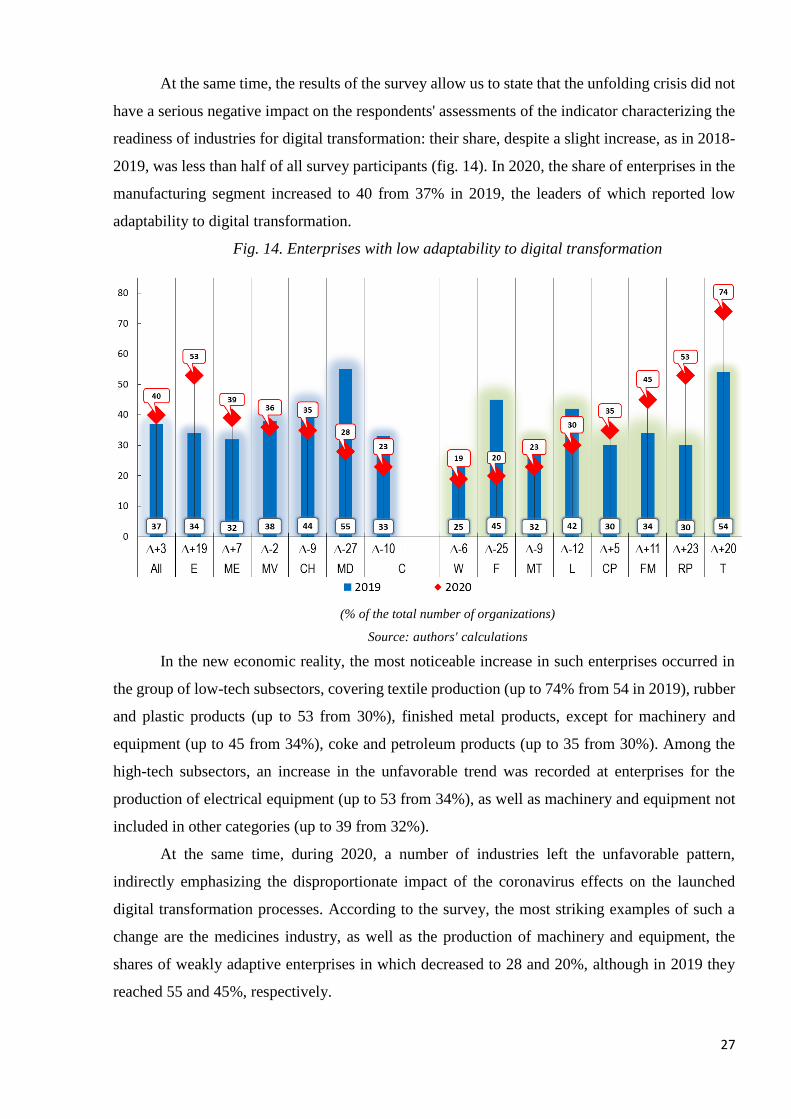
At the same time, the results of the survey allow us to state that the unfolding crisis did not
have a serious negative impact on the respondents' assessments of the indicator characterizing the
readiness of industries for digital transformation: their share, despite a slight increase, as in 2018-
2019, was less than half of all survey participants (fig. 14). In 2020, the share of enterprises in the
manufacturing segment increased to 40 from 37% in 2019, the leaders of which reported low
adaptability to digital transformation.
Fig. 14. Enterprises with low adaptability to digital transformation
(% of the total number of organizations)
Source: authors' calculations
In the new economic reality, the most noticeable increase in such enterprises occurred in
the group of low-tech subsectors, covering textile production (up to 74% from 54 in 2019), rubber
and plastic products (up to 53 from 30%), finished metal products, except for machinery and
equipment (up to 45 from 34%), coke and petroleum products (up to 35 from 30%). Among the
high-tech subsectors, an increase in the unfavorable trend was recorded at enterprises for the
production of electrical equipment (up to 53 from 34%), as well as machinery and equipment not
included in other categories (up to 39 from 32%).
At the same time, during 2020, a number of industries left the unfavorable pattern,
indirectly emphasizing the disproportionate impact of the coronavirus effects on the launched
digital transformation processes. According to the survey, the most striking examples of such a
change are the medicines industry, as well as the production of machinery and equipment, the
shares of weakly adaptive enterprises in which decreased to 28 and 20%, although in 2019 they
reached 55 and 45%, respectively.
28
A similar, but less pronounced background of changes was recorded for enterprises
producing chemicals (down to 35 from 44%), computers, electronic and optical products (up to 23
from 33%), motor vehicles, trailers and semi-trailers (up to 36 from 38%). The low-tech segment
also draws attention, the most noticeable increase in digital mobilization in which was noted at
enterprises for the production of leather and leather products (the share decreased to 30 from 42%),
furniture (down to 23 from 32%) and wearing apparel (down to 19 from 25%).
Conclusions
In general, according to the results obtained, we can conclude that, despite all the negative
consequences and uncertainty associated with the COVID-19 crisis, 2020 became, if not a turning
point in terms of accelerating digital processes, but definitely a very significant point.
Manufacturing businesses were both relatively resilient to the adverse business trends caused by
the pandemic and were able to absorb the positive digital momentum generated by the pandemic.
From the point of view of the dynamics of the digital climate, the segment demonstrated
more moderate changes, while the estimates of digital intensity indicate more active shifts in the
intensification and spread of digital processes in 2020. The segment of medium- and high-tech
industries turned out to have deeper digitalization than in the low-tech segment. However, when
it comes to digital investment, the pandemic has proven to be a rather weak catalyst, playing an
important role in only a few sub-sectors, such as pharmaceuticals, which overall experienced the
most powerful digital boom in 2020, standing out from the rest of industrial activities.
Also, the COVID-19 crisis highlighted the problem of a low level of digital literacy in
enterprises, which, in the face of a sharp increase in the need for digital solutions, broke the
previously established trend of increasing the proportion of full-time employees performing ICT
tasks. Now companies had to actively seek out external ICT specialists.
Further directions for the development of research problems posed in this work may consist
in measuring digital sentiment and progress in the new post-pandemic reality of other sectors of
the economy, as well as purely technological transformations through point and aggregated
instruments and meters. For example, trade organizations, the financial sector, enterprises for the
production of computers, electronic and optical products, and the pharmaceutical segment from
the manufacturing sector are of great interest for future research. At the same time, it is advisable
to focus on certain advanced technologies, say, “green” technologies or Industry 4.0 technologies,
which imply the study of digitalization through an alternative prism, which allows for a more
29
detailed analysis that is closer to the features of industrial production than a standardized
measurement of the level of digital intensity of enterprises or the state of the digital climate.
References
Bloom, N., Davis, S. J., Zhestkova, Y. (2021). COVID-19 Shifted Patent Applications Toward
Technologies that Support Working from Home. University of Chicago, Becker Friedman
Institute for Economics Working Paper No. 2020-133. URL: https://ssrn.com/abstract=3695191
or http://dx.doi.org/10.2139/ssrn.3695191
BMWi. (2020). Companies adjusting their R&D work during the crisis. URL:
https://www.bmwi.de/Redaktion/EN/Pressemitteilungen/2020/20200526-companies-adjusting-
their-rd-work-during-the-crisis.html
Budd, J., Miller, B. S., Manning, E. M., Lampos, V., Zhuang, M., Edelstein, M., Short, M.
J. (2020). Digital technologies in the public‐health response to COVID‐19. Nature
Medicine, 26, 1– 10.
European Union (2021). Digital Economy and Society Index (DESI) 2020. URL: https://digital-
strategy.ec.europa.eu/en/library/digital-economy-and-society-index-desi-2020
Eurostat (2020). Community Survey on ICT Usage and E-Commerce in Enterprises. URL:
https://circabc.europa.eu/sd/a/47b2dcfa-2eb9-4cc4-9e98-
b93a85406d67/MQ_2020_ICT_ENT.pdf
Eurostat (2021). Digital Economy and Society: Database. URL:
https://ec.europa.eu/eurostat/web/digital-economy-and-society/data/database
Golinelli, D., Boetto, E., Carullo, G., Landini, M. P., Fantini, M. P. (2020). How the COVID‐19
pandemic is favoring the adoption of digital technologies in healthcare: A rapid literature
review. medRxiv preprint. URL: https://doi.org/10.1101/2020.04.26.20080341
Gompers, P., Gornall, W., Kaplan, S. N., Strebulaev, I. A. (2020). Venture Capitalists and
COVID-19. National Bureau of Economic Research Working Paper Series, No. w27824. URL:
https://www.nber.org/system/files/working_papers/w27824/w27824.pdf
IMD (2018). IMD World Digital Competitiveness Ranking. URL:
https://www.imd.org/globalassets/wcc/docs/imd_world_digital_competitiveness_ranking_2018.p
df
McKinsey (2020). Innovation in a crisis: Why it is more critical than ever. URL:
https://www.mckinsey.com/business-functions/strategy-and-corporate-finance/our-
insights/innovation-in-a-crisis-why-it-is-more-critical-than-ever
OECD (2003). Business Tendency Surveys: A Handbook. OECD Publishing, Paris. URL:
https://doi.org/10.1787/9789264177444-en
OECD (2020). Start-ups in the Time of COVID-19: Facing the Challenges, Seizing the
Opportunities, OECD Tackling Coronavirus (Covid-19): Contributing to a global effort. URL:
http://www.oecd.org/coronavirus/policy-responses/start-ups-in-the-time-of-covid-19-facing-the-
challenges-seizing-the-opportunities-87219267/
30
OECD (2021a). OECD Science, Technology and Innovation Outlook 2021: Times of Crisis and
Opportunity. OECD Publishing, Paris. URL: https://doi.org/10.1787/75f79015-en.
OECD (2021b). Key STI statistics, databases and publications. URL:
https://www.oecd.org/sti/stistatistics.htm
Pharmaceutical Technology (2021). COVID-19 accelerated digital transformation of the
pharma industry by five years: Poll. URL: https://www.pharmaceutical-
technology.com/news/covid-19-accelerated-digital-transformation-of-the-pharma-industry-by-
five-years-poll/
Portulans Institute (2020). The Network Readiness Index 2020. URL:
https://networkreadinessindex.org/wp-content/uploads/2020/11/NRI-2020-V8_28-11-2020.pdf
Tolkachev, S. (2020). Cyber-physical digitalization of the manufacturing industry in the era of
new industrialization. In Digital Economy and Networks. URL:
http://www.econorus.org/pdf/Volume20_REC-2020.PDF#page=76
United Nations (2021). Measuring e-commerce and the digital economy. URL:
https://unctad.org/topic/ecommerce-and-digital-economy/measuring-ecommerce-digital-
economy
Vargo, D., Zhu, L., Benwell, B., Yan, Z. (2021). Digital technology use during COVID‐19
pandemic: A rapid review. Human Behavior and Emerging Technologies, 3(1), 13-24.
World Bank (2019). Digital Business Indicators. URL:
https://www.worldbank.org/en/research/brief/digital-business-indicators
Digital Business Indicators (World Bank, 2019), The IMD World Digital Competitiveness
Ranking (IMD, 2018).
Inna S. Lola
National Research University Higher School of Economics, Russian Federation. Institute for
Statistical Studies and Economics of Knowledge, Centre for Business Tendency Studies. Deputy
Director.: [email protected]
Any opinions or claims contained in this Working Paper do not necessarily reflect the
views of HSE.
© Lola, Bakeev, Manukov 2021