measuring enforcement. indicators at eu level
TRANSCRIPT
Measuring Enforcement. Indicators at EU level
(ENFIND)
Forum 22 – AP 17
Helsinki, 5 November 2015
Miquel A. Aguado-Monsonet
REACH Unit within DG GROW
European Commission
Overview of the presentation
1. Introduction
2. How to measure enforcement?
3. Enforcement Indicators (ENFIND) at 3 levels
4. Some preliminary results
5. Conclusions
2
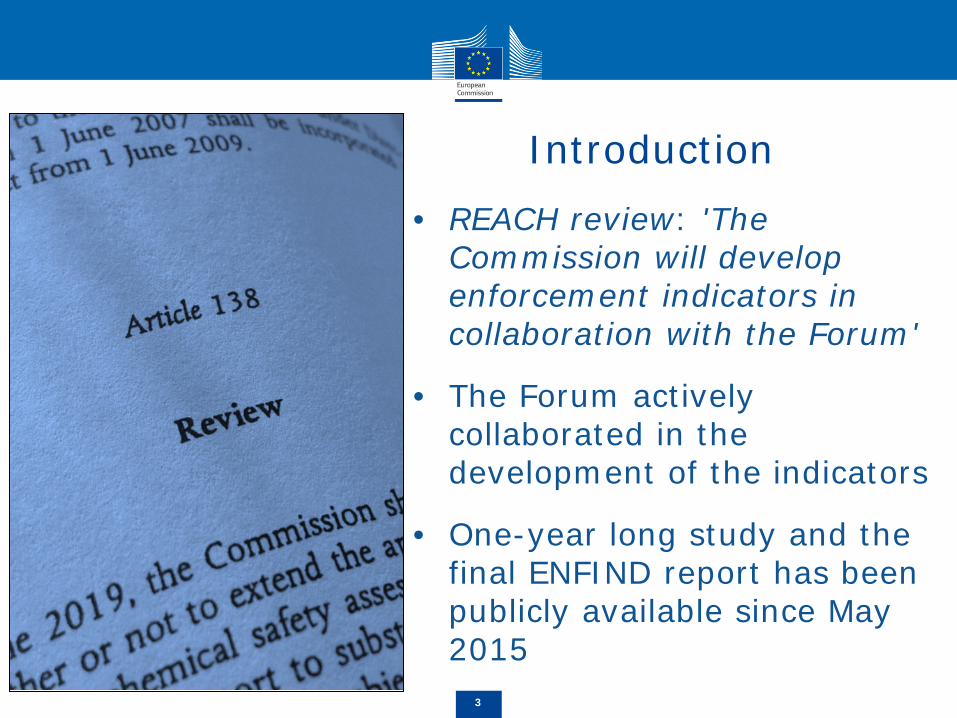
Introduction • REACH review: 'The
Commission will develop enforcement indicators in collaboration with the Forum'
• The Forum actively collaborated in the development of the indicators
• One-year long study and the final ENFIND report has been publicly available since May 2015
3
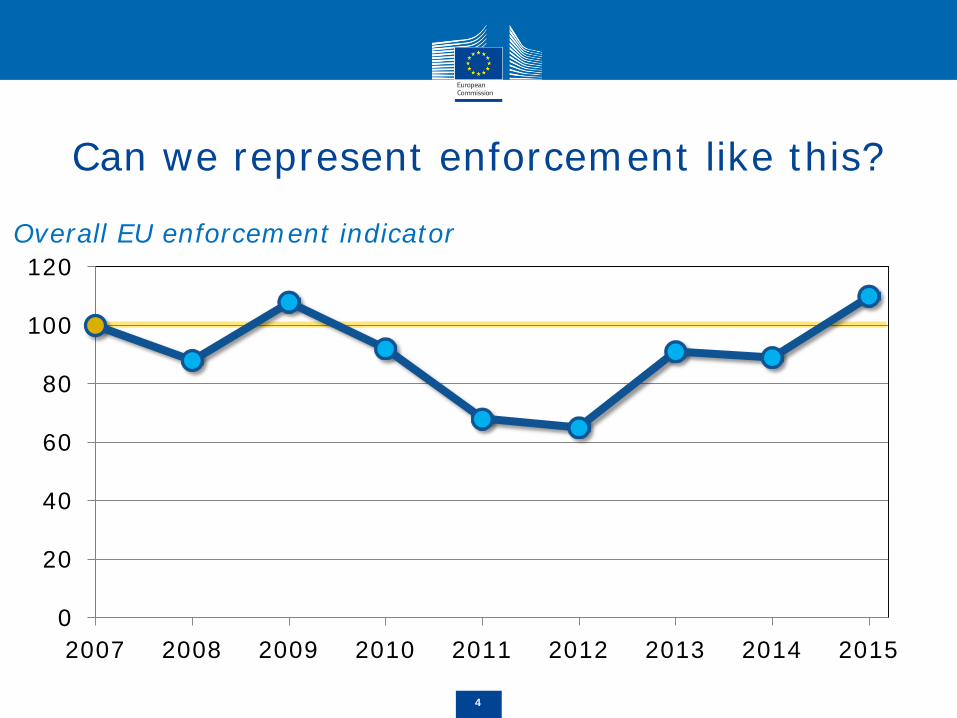
Can we represent enforcement like this?
4
Overall EU enforcement indicator
0
20
40
60
80
100
120
2007 2008 2009 2010 2011 2012 2013 2014 2015
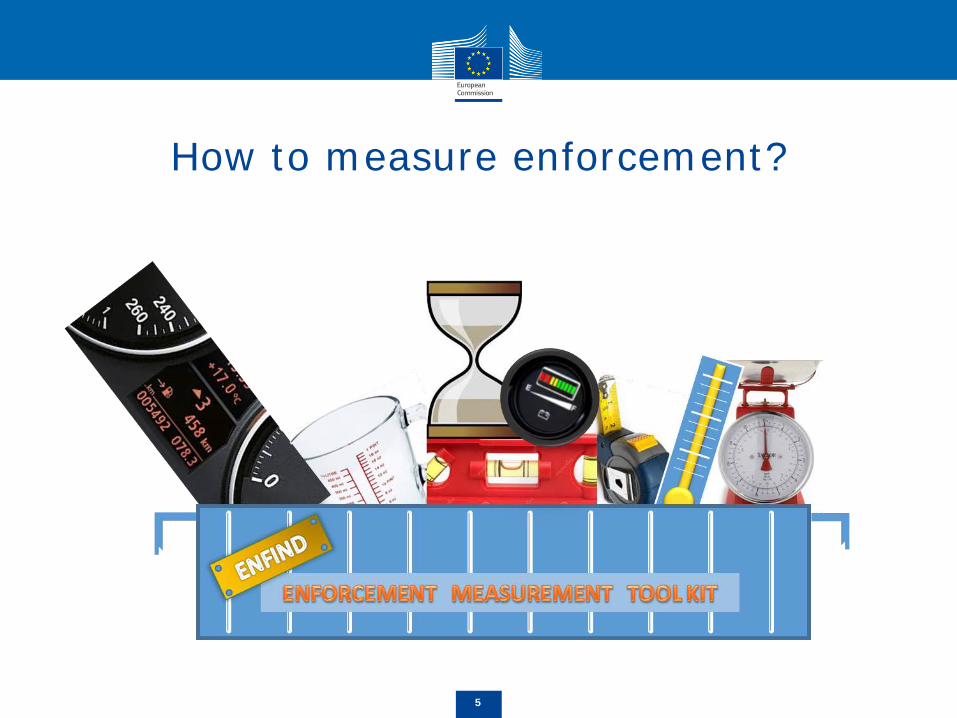
How to measure enforcement?
5
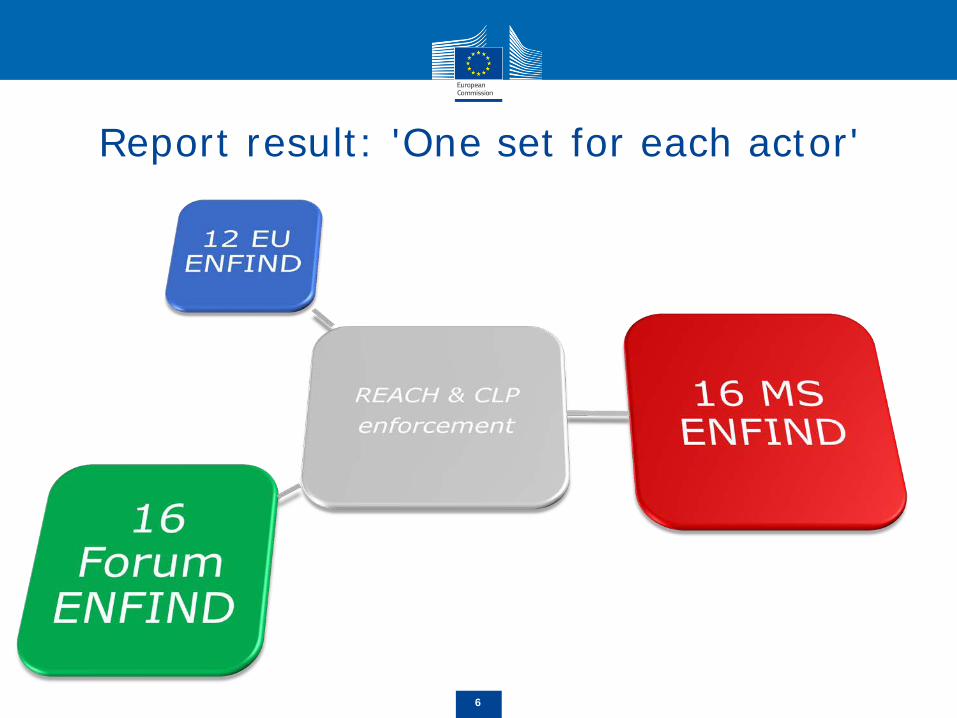
Report result: 'One set for each actor'
6
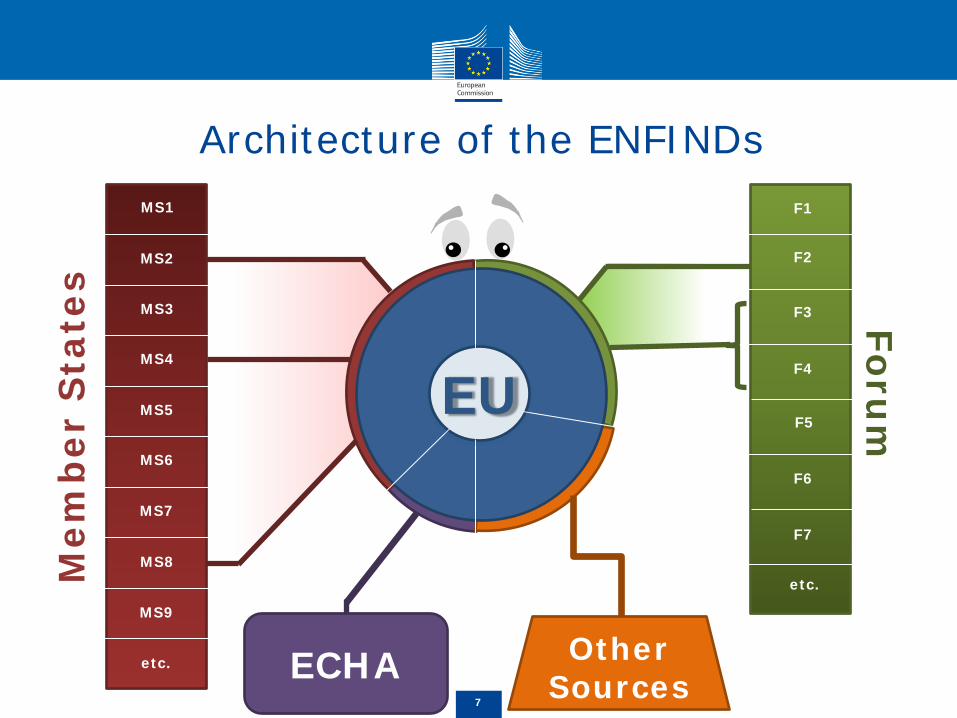
Architecture of the ENFINDs Foru
m
EU
ECHA Other Sources
MS1
MS2
MS3
MS4
MS5
MS6
MS7
MS8
MS9
etc.
F1
F2
F3
F4
F5
F6
F7
etc. Mem
ber
Sta
tes
7
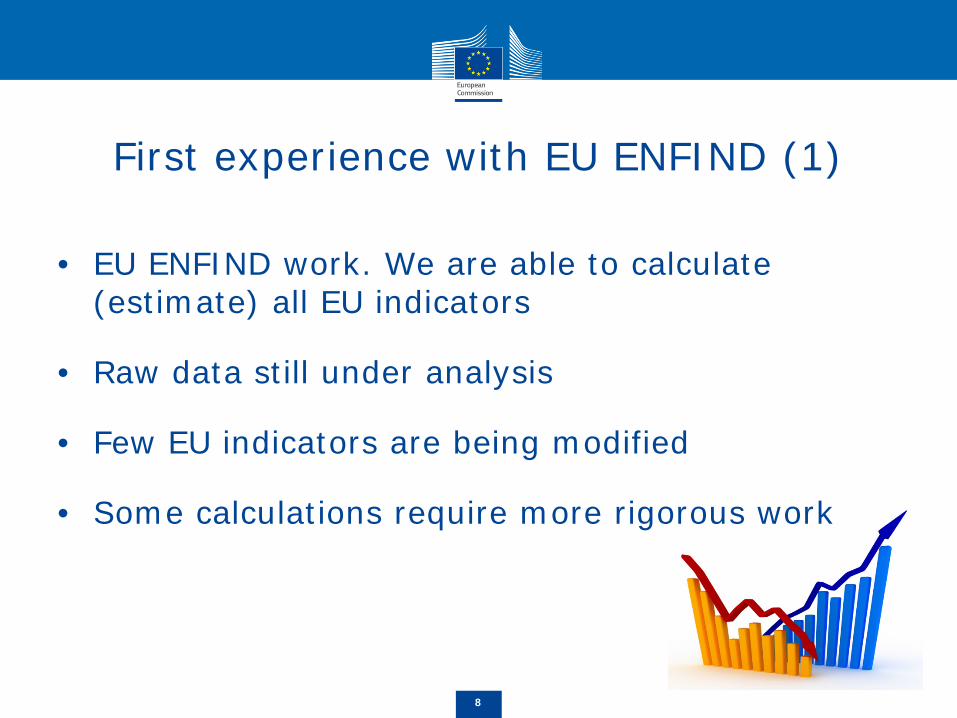
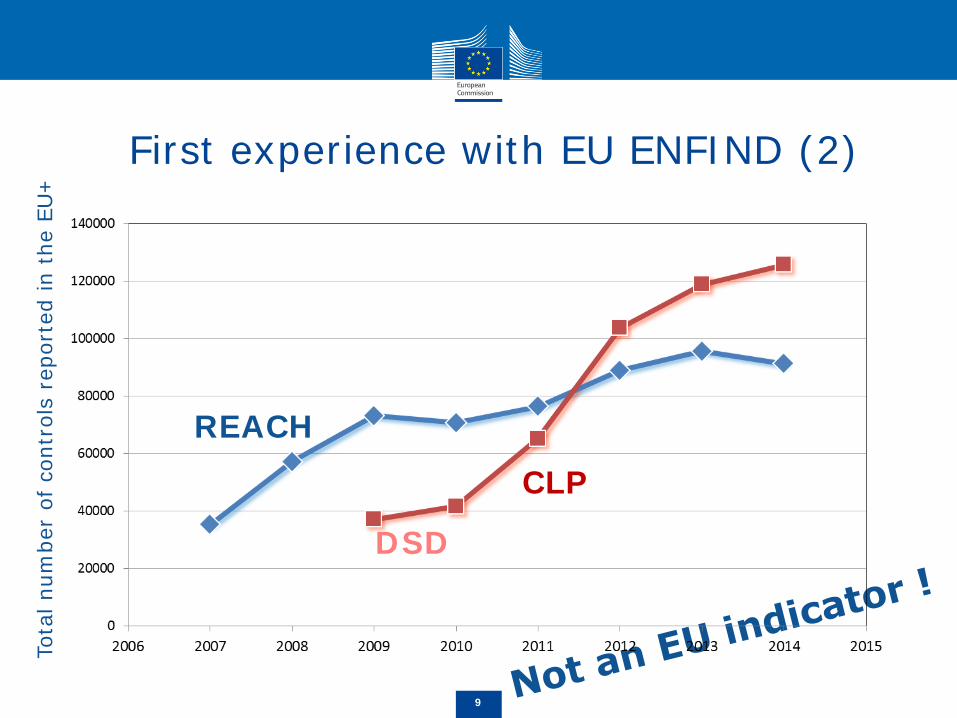
First experience with EU ENFIND (1)
• EU ENFIND work. We are able to calculate (estimate) all EU indicators
• Raw data still under analysis
• Few EU indicators are being modified
• Some calculations require more rigorous work
8
9
Tot
al n
umbe
r of
con
trol
s re
port
ed in
the
EU
+
REACH
CLP
DSD
First experience with EU ENFIND (2)
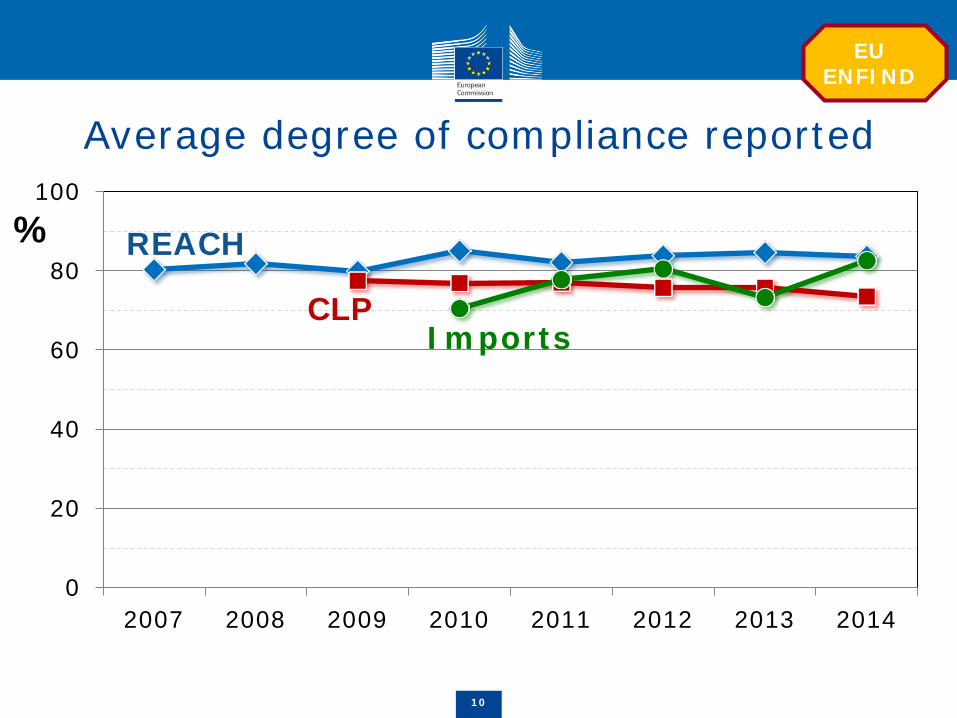
Average degree of compliance reported
10
%
0
20
40
60
80
100
2007 2008 2009 2010 2011 2012 2013 2014
Imports CLP
REACH
EU ENFIND
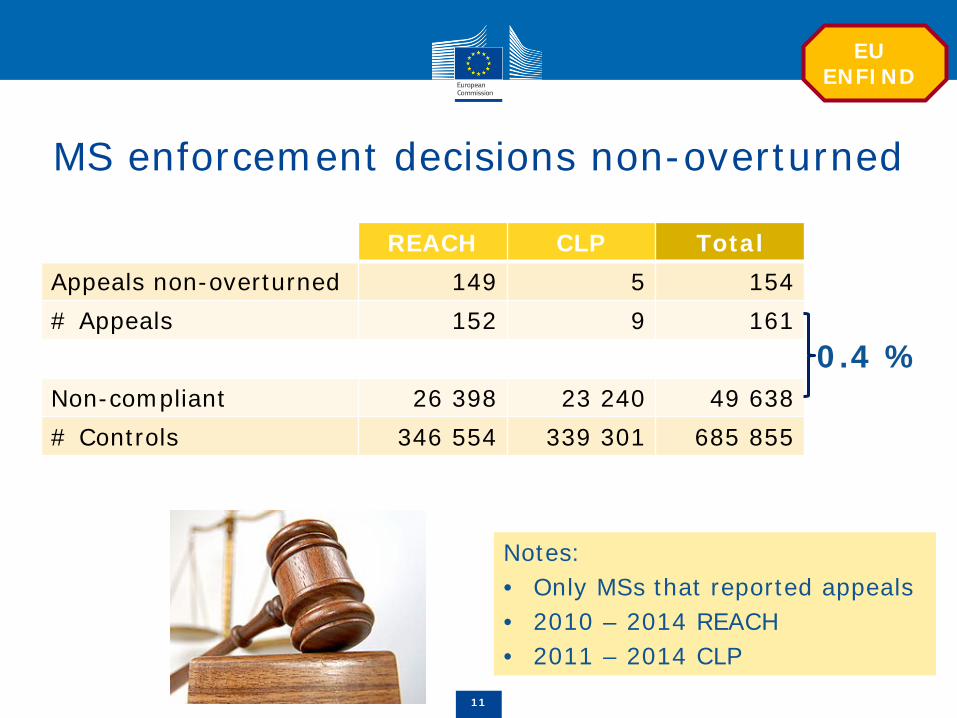
MS enforcement decisions non-overturned
11
Notes: • Only MSs that reported appeals • 2010 – 2014 REACH • 2011 – 2014 CLP
REACH CLP Total Appeals non-overturned 149 5 154 # Appeals 152 9 161
Non-compliant 26 398 23 240 49 638 # Controls 346 554 339 301 685 855
0.4 %
EU ENFIND
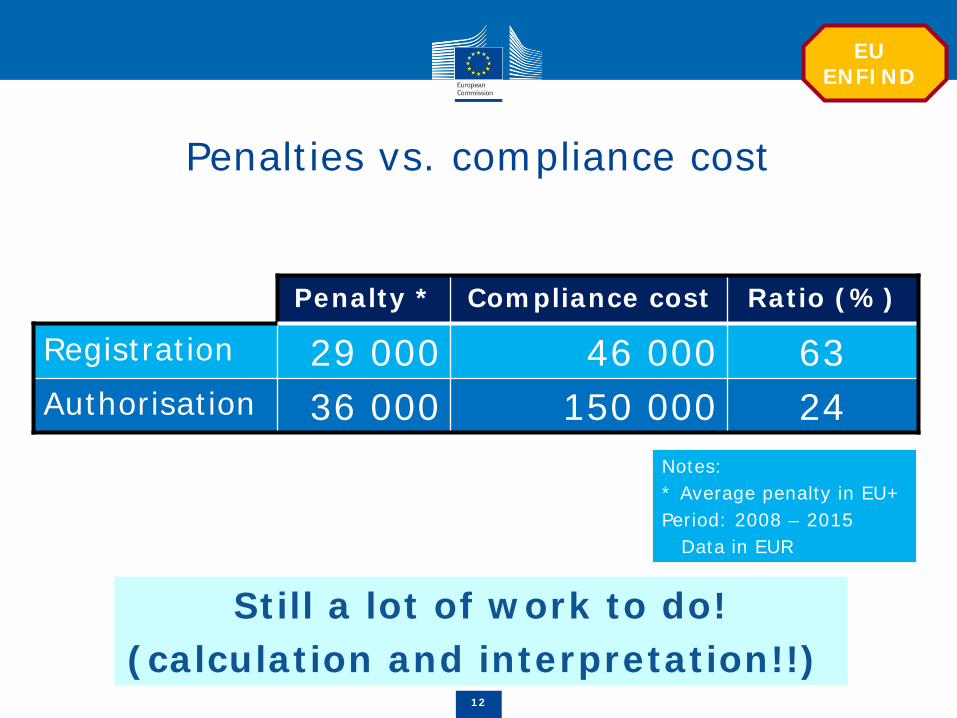
Penalties vs. compliance cost
Penalty * Compliance cost Ratio (%)
Registration 29 000 46 000 63 Authorisation 36 000 150 000 24
12
Notes: * Average penalty in EU+ Period: 2008 – 2015 Data in EUR
Still a lot of work to do! (calculation and interpretation!!)
EU ENFIND
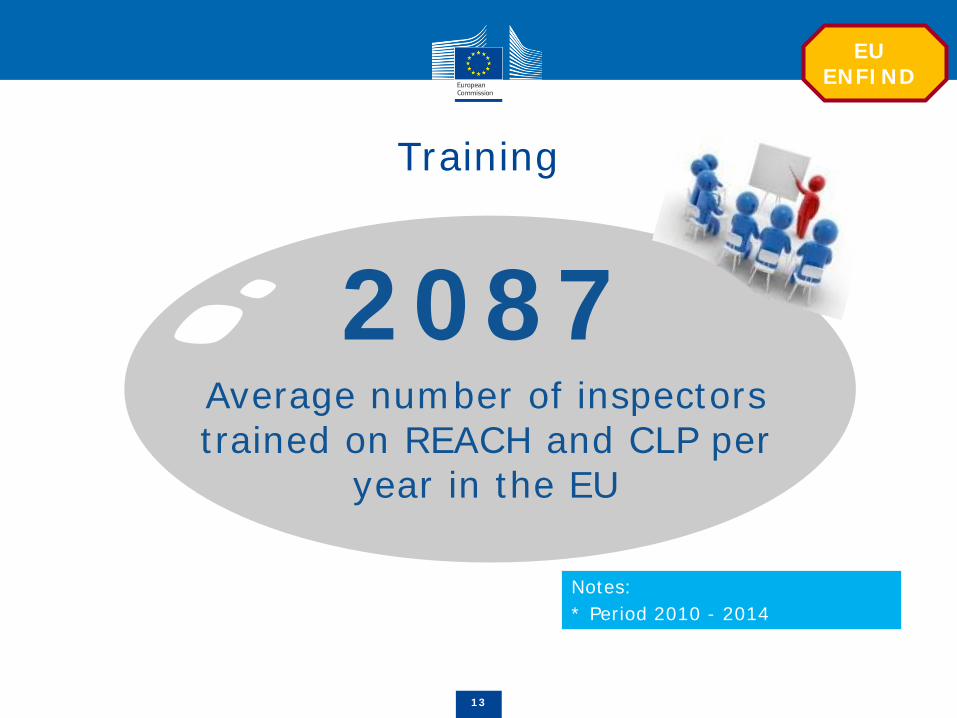
Training
13
Notes: * Period 2010 - 2014
Average number of inspectors trained on REACH and CLP per
year in the EU
2087
EU ENFIND
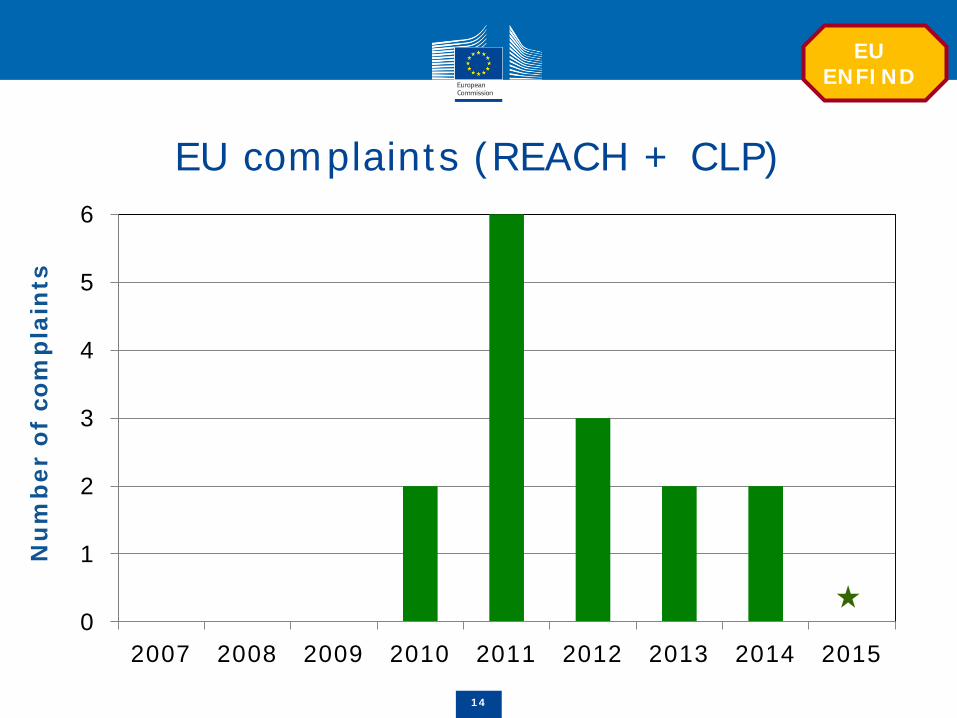
EU complaints (REACH + CLP)
14
Nu
mb
er o
f co
mp
lain
ts
0
1
2
3
4
5
6
2007 2008 2009 2010 2011 2012 2013 2014 2015
EU ENFIND
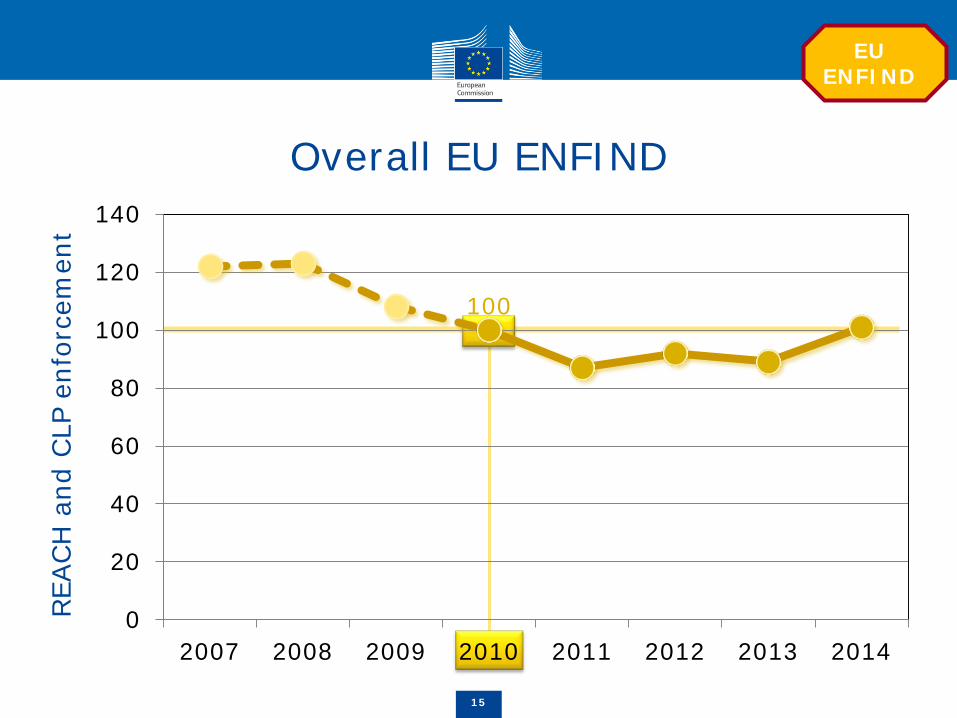
Overall EU ENFIND
15
REA
CH
and
CLP
enf
orce
men
t
100
0
20
40
60
80
100
120
140
2007 2008 2009 2010 2011 2012 2013 2014
EU ENFIND
Conclusions (1)
• By measuring enforcement, ENFINDs will help:
– to have better knowledge of REACH and CLP enforcement
– to achieve a more harmonised and systematic approach concerning collection of information at EU and national level
– to use similar data to evaluate enforcement
– to create intelligence that might be used in decision making processes
16
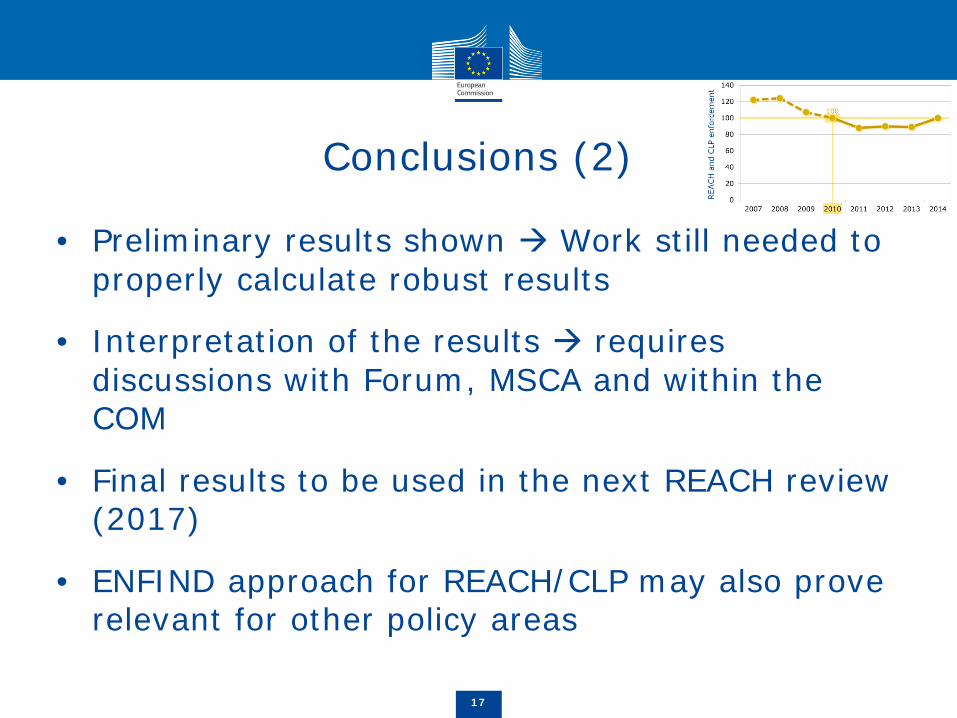
Conclusions (2)
• Preliminary results shown Work still needed to properly calculate robust results
• Interpretation of the results requires discussions with Forum, MSCA and within the COM
• Final results to be used in the next REACH review (2017)
• ENFIND approach for REACH/CLP may also prove relevant for other policy areas
17