applicable indicators for measuring the liquidity of
TRANSCRIPT
IZVESTIA – Journal of University of Economics – Varna80
Econ Lit – G100
APPLICABLE INDICATORS FOR MEASURINGTHE LIQUIDITY OF BULGARIAN STOCK MARKET
Doctoral student Krasimira Naidenova
Introduction
Market liquidity is defined as the possibility of converting an asset into cash andvice versa (marketability) without significant price changes and a resulting loss of value.Market liquidity is an essential characteristic of a national stock market and defines it ina qualitative manner by representing the economic potential for attracting foreign long-term equity. Bulgarian stock market is an emerging one and therefore accounts for alower degree of transparency and protection of investors, with the correspondingproblematic attractiveness of investments, low rates of market evaluation of assets andnumber of traded securities, low market liquidity and high required rate of return.
The problem of liquidity of Bulgarian stock market is a current issue in view ofthe need for the national economy to develop at a faster rate. Growth of productivityand GDP require funding for long-term high-risk projects with a potential for highreturn rate. The availability of liquid secondary market is a factor for growth ofinvestment, as shareholders are able to get their money and capital gain back at anytime. Secondary markets have to ensure liquidity and mobility for investors and arelikely to facilitate raising new investment, provided they reduce price volatility and areeffective in an operational, distributive and informational level (Yordanov, 2009). Primarymarket is also of utmost importance, as it takes on newly issued securities and undercircumstances of low investment interest company projects will not be financed. Theconcept of market mobilized capital is of vital importance for the growth rate (Azfarand Matheson, 2003). This capital represents investment in equity and debt, mobilizedby the country’s equity market as a share of GDP. These investments are functions ofnational savings but access to foreign capital by means of integration and internationalrisk sharing practically renders the size of this capital unlimited. It is only the localmarket liquidity that sets limits to market-mobilized capital, as both national andinternational investors require the option of being able to sell their securities at a fairprice and at any time.
The object of the present survey is stock market liquidity in Bulgaria. Its subjectis a specific aspect of market liquidity, and in particular, the ability to measure thisliquidity under conditions of undeveloped stock market. Conventional indicators do notcover the peculiarities of emerging markets concerning quality of information abouttransactions. Very often data that hypotheses are tested on, do not meet developedmarkets standards and consequently, the results do not show objective values.
In view of the above mentioned considerations, we shall examine the followingHypothesis:
81Articles
Bulgarian stock market liquidity that is measured by means of conventionalindicators does not always give an objective evaluation. Stock market in Bulgariais an emerging one and, consequently, its liquidity will be more accuratelyrepresented by an alternative indicator that accounts for specific peculiarities.
The aim of the present study is to highlight the problems related to measuringliquidity and to come up with specific, more adequate indicators which should overcomedata inconsistency and irrelevance and allow for an objective analysis of the liquidityof Bulgarian stock market.
1. Conventional indicators for market liquidity
1.1. Aggregate absolute indicators
Stock market liquidity is difficult to measure - it cannot be observed directly andcannot be represented by means of a single indicator (Amihud, 2002), therefore variousindicators are used for different aspects of liquidity. One of the most widely used ismarket capitalization. It represents the sum total of the market evaluations of listedcompanies and is an absolute indicator for the potential size of the market. It is calculatedaccording to the following formula1:
(1)
where MC is the capitalization of the stock market, Pi is the price of the publiccompany i shares, Ni is the number of the listed shares of the public company i. Theindicator does not represent the liquidity of assets at a micro level, but does provideinformation on the overall state of the market through the number of listed securitiesand their price.
The volume of trade (V), represented as the number of traded securities is alsoa frequently used indicator for liquidity and one that gives essential information aboutinvestors’ interest (Amihud, 2002). The second variable based on trade turnover istrade volume as a sum total (TVT), equal to the multiplication of the number of tradedsecurities times the price of transactions. High volume signifies high investment interestpresented both by the number of securities as objects of trade and the high evaluationof assets (TVT) (Fernandez-Amador, Gachter, Larch, Peter, 2011).
The indicators for volume and capitalization can be used as aggregate ones(with reference to the overall market) and as micro measurements (referring toparticular companies). They are also important components of aggregate relativemeasurements.
1.2. Aggregate relative indicators
The absolute measurements presented above do not give an idea of the stockmarket’s “weight” in the economy in general and cannot serve as instruments ofcomparison between different countries. For this purpose it is necessary to use indicators
MC = Σ Pi * Ni,
1 Another variant for representing the market capitalization formula is MC = Σ MCi, where MC is thestock market capitalization, MCi is the market capitalization of i company.
IZVESTIA – Journal of University of Economics – Varna82
of a relative character. A basic indicator of the kind is the stock market size comparedto the size of the national economy. This indicator provides information about thevaluation of that particular part of national economy which has access to stock market(Beck, Demirguc-Kunt, Levine, 2009):
(2)
where Rmc is the rate of market capitalization compared to GDP with MCstanding for market capitalization. The values of the indicator reflect both the evaluationof public companies and the extent to which business is interested in attracting foreignequity. An economy with a large number of high-value listed companies suggests highlevels of trust and transparency, as well as access to considerable foreign capital,including international capital.
Market liquidity is also represented through the notion of market activity, whichis measured by the total value traded (TVT) as a share of GDP representing the sizeof the economy (Beck, Demirguc-Kunt, Levine, 2009). This indicator can also bereferred to as “value traded ratio”:
(3)
where MA stands for market activity, VTR stands for the value traded ratio,TVT is the total value traded on the stock exchange and GDP is the gross domesticproduct. By means of this indicator the stock exchange turnover is juxtaposed againsteconomic activity (Demirguc-Kunt, Levine, 1999). The indicator measures the organizedtrade of company equity as a proportion of GDP and positively influences liquidity ona wide economic base. The indicator provides generalized information but neverthelesscontains a sufficient number of qualities that are prerequisite for a market liquidityanalysis – high turnover compared to GDP means a high degree of investment interestin public companies and considerable listed capital, which is itself a forecast for highinvesting activity and high interest on the part of issuers of securities in the future.
The next widely used measurement of market liquidity is the relation betweenthe overall traded value at the stock exchange and market capitalization, which isoften referred to as turnover ratio (Beck, Demirguc-Kunt, Levine, 2009):
(4)
where TR stands for turnover ratio, TVT stands for the total traded value, andMC stands for market capitalization. This indicator measures traded stock value againstthe stock market size and complements the market size indicator, also known as marketactivity. Both indicators distinguish between the important characteristics of stockmarkets, such as size, activity and liquidity. Market activity shows the share of stockmarket, its relative size against national economy while turnover ratio illustrates activityand liquidity as listed securities trade potential. These indicators do not directly measurethe ease with which investors sell or buy (the liquidity of particular assets), but onlytrade in securities as compared to the size of economy (Levine, Zervos, 1996) and thesize of the market (aspects of market liquidity).
Rmc = MC/GDP,
MA = VTR = TVT/ GDP,
TR = TVT/ MC,

83Articles
2. Relevance of indicators to Bulgarian stock market
The study of Bulgarian stock market liquidity calls for not only calculation andcomparison of indicators values against those of other markets, but also for anassessment of their relevance and adequacy. In the process of analysis one has toestablish how objective an indicator is, based on the quality of input data.
Aggregate relative indicators measure liquidity on a macroeconomic scale - thedegree to which agents can cheaply, quickly and safely trade the rights over theirequity (Levine, 1996) and enable comparison between the conditions for investment indifferent countries, while at the same time overcoming the differences in these countries’size of economies and markets. Juxtaposition is important, as it shows the attraction ofthe national market and the extent to which it will draw investors, based on the indicatorsof competitive markets. The following tables examine the values of basic aggregaterelative indicators for market liquidity for a period of 5 years, with selected countriesincluding the developed financial market of the US, the new market economies ofsimilar economic background such as Bulgaria, the Czech Republic, Slovakia, Romaniaand Croatia and, in view of a better comparison, data are included on the highly-developed, though predominantly bank- based financial system of Germany.
Table 1
Rate of market capitalization compared to GDP
Source: Author’s own calculations based on data from World Bank Global FinancialDevelopment Database, www.worldbank.org
Table 1 presents data on the rate of market capitalization against GDP (Rmc=MC/GDP), showing public companies evaluation compared to the size of the nationaleconomy. High values of the indicator characterize markets with high levels of trustand transparency, and consequently high investment interest. Values show Bulgaria’sexceptionally poor performance, though comparable to that of the majority of neweconomies.
Year
Country 2008 2009 2010 2011 2012Bulgaria 0,171 0,146 0,152 0,154 0,130
Czech Republic 0,217 0,267 0,217 0,178 0,189
Germany 0,306 0,393 0,433 0,326 0,434
Croatia 0,385 0,412 0,423 0,354 0,384
Romania 0,097 0,185 0,197 0,116 0,094
Slovakia 0,052 0,054 0,048 0,049 0,050
USA 0,797 1,046 1,146 1,007 1,149
IZVESTIA – Journal of University of Economics – Varna84
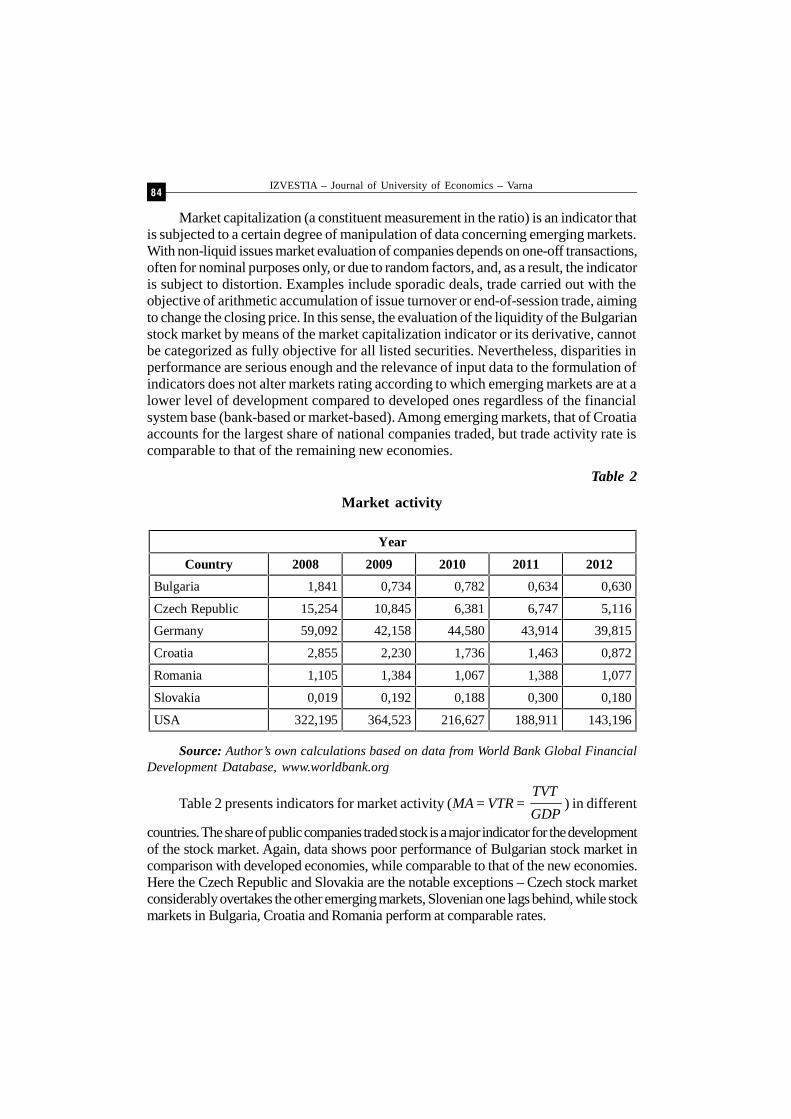
Market capitalization (a constituent measurement in the ratio) is an indicator thatis subjected to a certain degree of manipulation of data concerning emerging markets.With non-liquid issues market evaluation of companies depends on one-off transactions,often for nominal purposes only, or due to random factors, and, as a result, the indicatoris subject to distortion. Examples include sporadic deals, trade carried out with theobjective of arithmetic accumulation of issue turnover or end-of-session trade, aimingto change the closing price. In this sense, the evaluation of the liquidity of the Bulgarianstock market by means of the market capitalization indicator or its derivative, cannotbe categorized as fully objective for all listed securities. Nevertheless, disparities inperformance are serious enough and the relevance of input data to the formulation ofindicators does not alter markets rating according to which emerging markets are at alower level of development compared to developed ones regardless of the financialsystem base (bank-based or market-based). Among emerging markets, that of Croatiaaccounts for the largest share of national companies traded, but trade activity rate iscomparable to that of the remaining new economies.
Table 2
Market activity
Source: Author’s own calculations based on data from World Bank Global FinancialDevelopment Database, www.worldbank.org
Table 2 presents indicators for market activity (MA = VTR =TVT
GDP) in different
countries. The share of public companies traded stock is a major indicator for the developmentof the stock market. Again, data shows poor performance of Bulgarian stock market incomparison with developed economies, while comparable to that of the new economies.Here the Czech Republic and Slovakia are the notable exceptions – Czech stock marketconsiderably overtakes the other emerging markets, Slovenian one lags behind, while stockmarkets in Bulgaria, Croatia and Romania perform at comparable rates.
Year
Country 2008 2009 2010 2011 2012Bulgaria 1,841 0,734 0,782 0,634 0,630
Czech Republic 15,254 10,845 6,381 6,747 5,116
Germany 59,092 42,158 44,580 43,914 39,815
Croatia 2,855 2,230 1,736 1,463 0,872
Romania 1,105 1,384 1,067 1,388 1,077
Slovakia 0,019 0,192 0,188 0,300 0,180
USA 322,195 364,523 216,627 188,911 143,196
85Articles
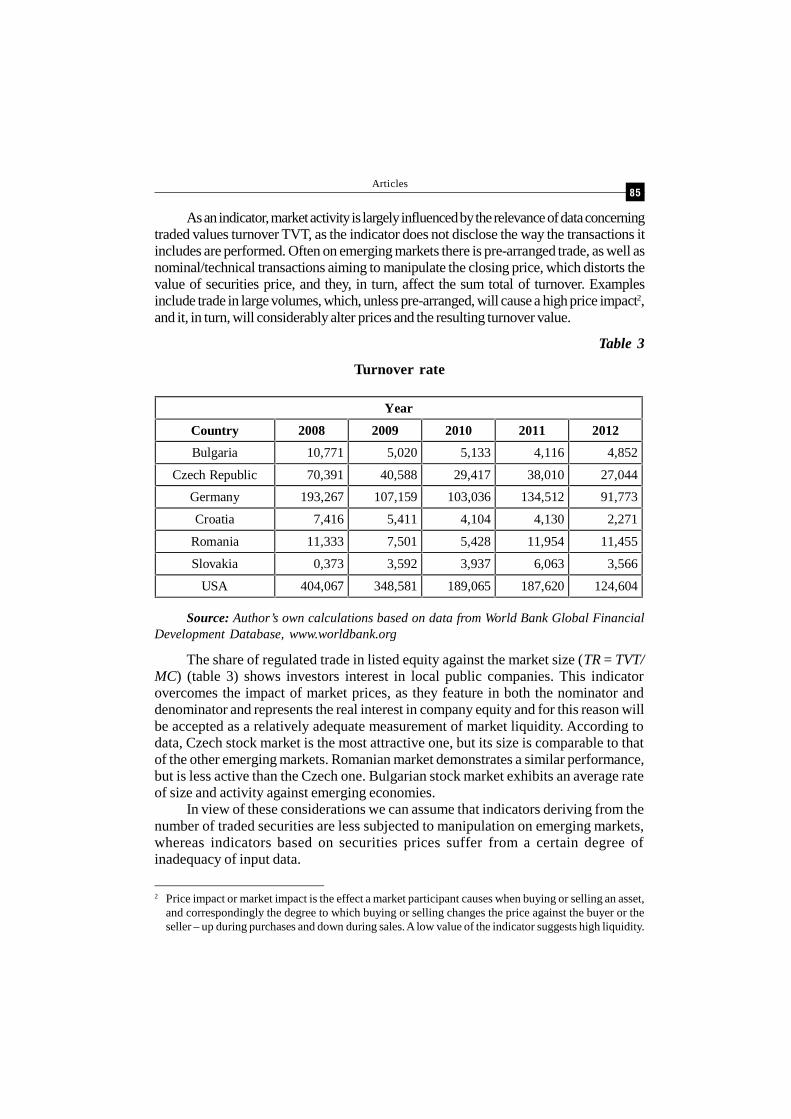
As an indicator, market activity is largely influenced by the relevance of data concerningtraded values turnover TVT, as the indicator does not disclose the way the transactions itincludes are performed. Often on emerging markets there is pre-arranged trade, as well asnominal/technical transactions aiming to manipulate the closing price, which distorts thevalue of securities price, and they, in turn, affect the sum total of turnover. Examplesinclude trade in large volumes, which, unless pre-arranged, will cause a high price impact2,and it, in turn, will considerably alter prices and the resulting turnover value.
Table 3
Turnover rate
Source: Author’s own calculations based on data from World Bank Global FinancialDevelopment Database, www.worldbank.org
The share of regulated trade in listed equity against the market size (TR = TVT/MC) (table 3) shows investors interest in local public companies. This indicatorovercomes the impact of market prices, as they feature in both the nominator anddenominator and represents the real interest in company equity and for this reason willbe accepted as a relatively adequate measurement of market liquidity. According todata, Czech stock market is the most attractive one, but its size is comparable to thatof the other emerging markets. Romanian market demonstrates a similar performance,but is less active than the Czech one. Bulgarian stock market exhibits an average rateof size and activity against emerging economies.
In view of these considerations we can assume that indicators deriving from thenumber of traded securities are less subjected to manipulation on emerging markets,whereas indicators based on securities prices suffer from a certain degree ofinadequacy of input data.
Year
Country 2008 2009 2010 2011 2012Bulgaria 10,771 5,020 5,133 4,116 4,852
Czech Republic 70,391 40,588 29,417 38,010 27,044
Germany 193,267 107,159 103,036 134,512 91,773
Croatia 7,416 5,411 4,104 4,130 2,271
Romania 11,333 7,501 5,428 11,954 11,455
Slovakia 0,373 3,592 3,937 6,063 3,566
USA 404,067 348,581 189,065 187,620 124,604
2 Price impact or market impact is the effect a market participant causes when buying or selling an asset,and correspondingly the degree to which buying or selling changes the price against the buyer or theseller – up during purchases and down during sales. A low value of the indicator suggests high liquidity.
IZVESTIA – Journal of University of Economics – Varna86
3. An alternative indicator for measuring the liquidityof Bulgarian stock market
Regarding the indicators examined above, it has been assumed that the price ofdeals made under conditions of low market liquidity and undeveloped market is subjectto manipulation and, consequently, distorts the values of trade turnover and marketcapitalization (which are themselves constituents of essential aggregate relativemeasurements of market liquidity). Bulgarian market is an emerging one and thereforeexhibits some deviations from developed markets. One of the most substantial distortionsof information is a result of contractually arranged trade. They are the reason whyprice impact values will not represent the real opportunity for instant trade andtransactional costs offered by the market.
Contractual trade is a practice on illiquid markets. Contractually arranged dealsare a registration of an agreement between contractors that has been reached inadvance, regarding an issue, a number and a price of securities, by means ofsimultaneously entering “buy” or “sell” orders of equal parameters into the trade systemand their automatic matching. In this type of trade transactional costs for seeking acontractor are high, because the market does not provide enough width and depth forthe volumes quoted but deals remain hidden for the public as a measurement of liquidity.Without a preliminary arrangement, a market order for a large number of shareswould lead to a high price impact and would later result in a freeze of trade in aparticular issue. Establishing the contracted character of a deal requires access to thelist of orders and deals and, respectively, detecting the time for entering and matching.With such deals failure to consider the preliminary contractual arrangement distortsinformation regarding market liquidity and individual liquidity.
All that has been said above suggests the formulation of an indicator to measurethe share of contracted number of securities in the total numbers traded, for a particularcompany or the market in general, over a certain period. The indicator represents theshare/proportion of the traded volume that has been an object of contract/arrangement:
(5)
where RCT – ratio of contractual trade, CV – contractual volume for the period– number of securities or value of trade of a particular issue, V – total traded volumefor the period in number of securities or value for a particular issue. High values willsignify high preliminary contracted volume, and, respectively, high estimatedtransactional costs involved in seeking a contractor and will be an indication for lowliquidity of the asset. The indictor presents another important aspect of liquidity –immediacy, by showing what amount of stock can be traded without preliminarynegotiations and looking for a contractor. The indicator is suitable for use in relation toemerging markets and provides additional information other than depth and width ofpositions. The difference stems from the fact that amounts that are subject to contractualarrangements do not feature in the list of unexecuted orders and are not visible, i.e. donot form market demand and supply and are not accessible to investors.
CV
RCTV
87Articles
The indicator can also be used as an aggregate one, for the whole market, and inthis case the number of securities must be weighed for every company, as differentcompanies have different registered capital. In this case a more objective representationcan be achieved by using the total value of all preliminary contracted deals as a share/proportion of total trade on the market.
(6)
where RCTа – aggregate ratio of contractual trade, TVTc – total value of contractualtrade for the period (contractual value traded), TVT – total value of trade for the period.
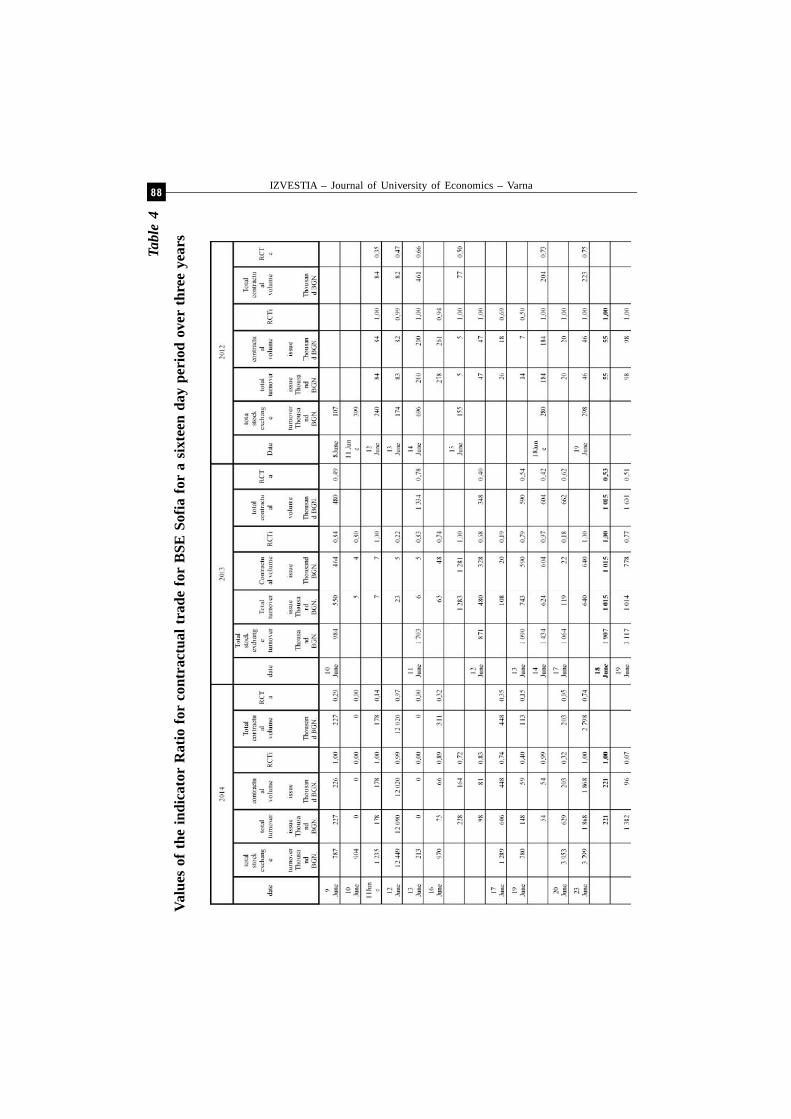
Table 4 presents data pertaining to a 16-day period within a three - year timeframe.Data includes total stock exchange turnover, volume of trade in issues where contractualarrangements have been identified, and the volume of contractual trade in these issues.The ratio for contractual trade is calculated for individual assets and for the market asan aggregate/ total. RCTi (ratio of contractual trade for individual assets) values arecalculated when the contractual volume for a particular asset is divided by the totalturnover for the particular issue, while values for RCTa (ratio for contractual trade forthe aggregate/total market) are calculated when the total contractual volume for theday is divided by the total turnover of the stock exchange.
Data shows high rates of preliminary contracted trade. For some issues theindicator’s values are close to one, which means that traded volume of that issue isproblematic without the additional transactional costs of seeking a contractor. Theaverage market indicator shows that approximately one third of all traded volumesrequire preliminary contractual arrangements.
On the basis of calculated measurements RCTi with a value of approximately 70%and RCTa about 30%, it is proved that the market liquidity of Bulgarian stock marketmeasured by conventional indicators does not objectively represent the rate of liquidity.
Bulgarian stock market is an emerging one and that is why its liquidity will bemore accurately represented by an alternative indicator, accounting for itscharacteristics, and namely the indicators for the ratio of contractual trade. Accordingto the presented data, the rate of contractual trade is calculated at about 30% for theperiod quoted; in other words, the rate of distortion of results for standard indicatorswill refer to approximately 30% of the deals on the stock market.
Failure to take into consideration the pre-arranged deals will lead to inaccurateresults, as without the element of preliminary contractual arrangement, price impactwill be higher. With a high price impact, deals prices are subject to serious changeagainst the agent who places an order, whereby the agent sustains considerable lossesand causes an additional market imbalance3. As a result, deals prices will differ andthat will result in changed values of the indicators for turnover and market capitalizationwhich are basic input data in the aggregate indicators for liquidity.
ca
TVTRCT
TVT
3 Market imbalance is a deviation in the price and quantities (demanded, supplied and volumes oftransactions) from estimated values. Market imbalance arises because of information asymmetry orhigh price impact.
IZVESTIA – Journal of University of Economics – Varna88
Tabl
e 4
Valu
es o
f the
indi
cato
r R
atio
for
cont
ract
ual t
rade
for
BSE
Sof
ia fo
r a
sixt
een
day
peri
od o
ver
thre
e ye
ars

89Articles
Sour
ce:A
utho
r’s o
wn c
alcu
latio
ns b
ased
on
BSE
- Sof
ia d
atab
ase.

IZVESTIA – Journal of University of Economics – Varna90
Conclusion
Market liquidity is a multi-aspect notion, therefore its measurement requires theapplication of a number of indicators, including individual ones that account for thepeculiarities of the national stock market. Most conventional indicators are based ondata about deals prices, which suggests a certain inaccuracy of values because of thespecifics of input data characteristic of emerging markets.
Regarding Bulgarian stock market, calculations of the ratio of contractual tradefor particular issues and for the market as an aggregate total, prove a certain inadequacyof input data referring to deals prices. The number of traded securities is a relativelycredible indicator, as it represents the performed transactions (absolute interest inassets) and contractually arranged volumes do not substantially distort this number.Turnover ratio represents the proportion of contractually traded securities against thetotal number of registered stock and can also be considered adequate enough. Aggregateratio of contractual trade represents that section of trade which requires additionaltransactional costs and can be used as a correction value for the conventional indicatorsfor market liquidity. Because of the above mentioned considerations, the most suitablemeasurements of Bulgarian stock market liquidity appear to be the volume of tradedsecurities, corrected or not against the contractually arranged volumes, turnover ratio(TR) and aggregate ratio of contractual trade (RCTа).
Reference
1. Yordanov, Y., (2009), “Financial investments”, Publishing House “Lotus 23” p. 13.2. Amihud, Y., (2002), “Illiquidity and stock returns: Cross-section and time series
effects”, Journal of Financial Markets, 5 pp.31–56.3. Azfar, O., T. Matheson, (2003), „Market-Mobilized Capital”, Public Choice, 117,
pp. 357-372.4. Beck, T. and A. Demirguc-Kunt, R. Levine, (2009), “Financial Institutions and
Markets across Countries and over Time”, Policy Research Working Paper 4943,The World Bank.
5. Chordia, T. and A. Subrahmanyam, V. R. Anshuman, (2001), “Trading activity andexpected stock returns”, Journal of Financial Economics 59 (No. 1, January), pp.3-32.
6. Demirguc-Kunt, A. and R. Levine, (1999), “Bank-Based and Market-BasedFinancial Systems: Cross-Country Comparisons”, The World Bank, http://elibrary.worldbank .org/doi/pdf/10.1596/ 1813-9450-2143.
7. Fernandez-Amador O. and M. GЁachter, M. Larch, G. Peter, (2011), “Monetarypolicy and its impact on stock market liquidity: Evidence from the euro zone”,Working Papers in Economics and Statistics 2011-06.
8. Kang, W. and H.Zhang, (2010), “Measuring Liquidity in Emerging Markets”, SocialScience Research Network, http://papers .ssrn.com/sol3/papers.cfm?abstract_id=2326380, December.
9. Kyle, A. S, (1985), “Continuous Auctions and Insider Trading”, Econometrica, Vol.53, No. 6, pp. 1315-1336
91Articles
10. Levine, R. and S. Zervos, (1996), “Stock Market Development and Long-RunGrowth”, The World Bank Policy Research Department. Finance and PrivateSector Development Division.
11. Levine, R., (1996), “Financial Development and Economic Growth. Views andAgenda”, The World Bank Policy Research Department. Finance and PrivateSector Development Division.
12. Levine, R., (1991), „Stock Markets, Growth, and Tax Policy”, Journal of Finance,46(4), pp. 1445-65.
APPLICABLE INDICATORS FOR MEASURING LIQUIDITYON THE BULGARIAN STOCK MARKET
PhD student Krasimira Naydenova
Abstract
The liquidity of the stock market is a multifaceted and abstract concept, which is why itis difficult to measure. Emerging stock markets differ from the developed ones due to the lowerliquidity, the level of protection of investors, the investment interest, the attractiveness of theinvestments, the application of the regulations. The measurement of their market liquidityrequires a revision of the standard indicators and the composition of alternative ones, suitablefor more precise estimation. Such an adequate indicator can be the aggregated level of agreementof trade.
Keywords: stock market, market liquidity, measurement indicators, emerging markets.