indian coking coal requirement sourcing options coking coal requirement... · mozambique...
TRANSCRIPT

Indian Coking Coal Requirement &
Sourcing Options
Arun Kumar Jagatramka Chairman & Managing Director
Gujarat NRE Coke Limited
India Unbound
Recently growth has slowed, but...
Growth story is far from being over….
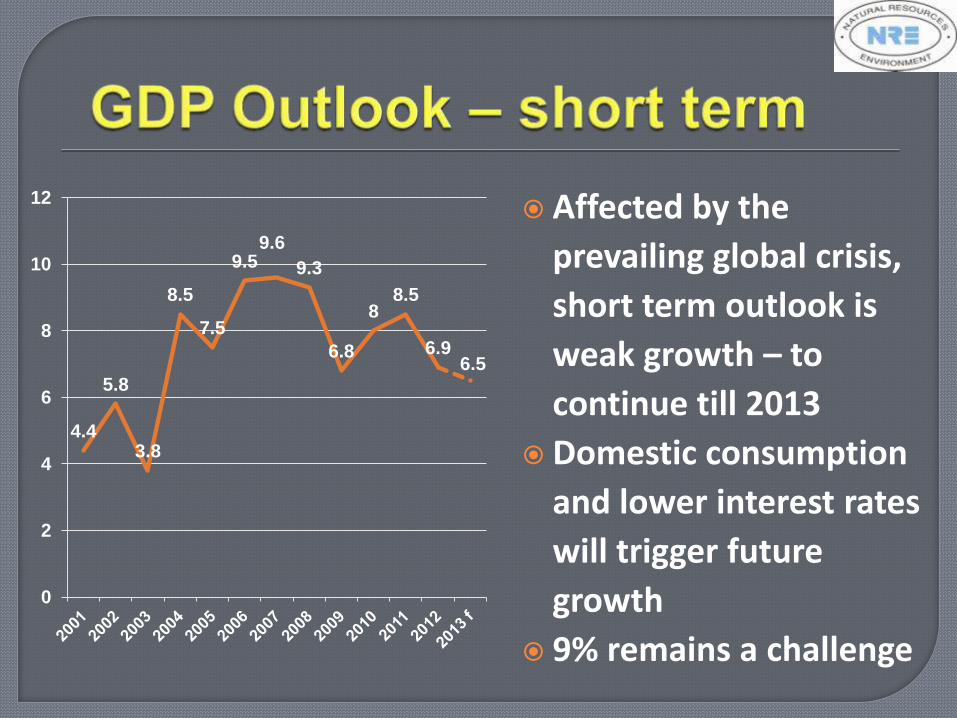
Affected by the
prevailing global crisis,
short term outlook is
weak growth – to
continue till 2013
Domestic consumption
and lower interest rates
will trigger future
growth
9% remains a challenge
4.4
5.8
3.8
8.5
7.5
9.5 9.6
9.3
6.8
8 8.5
6.9 6.5
0
2
4
6
8
10
12
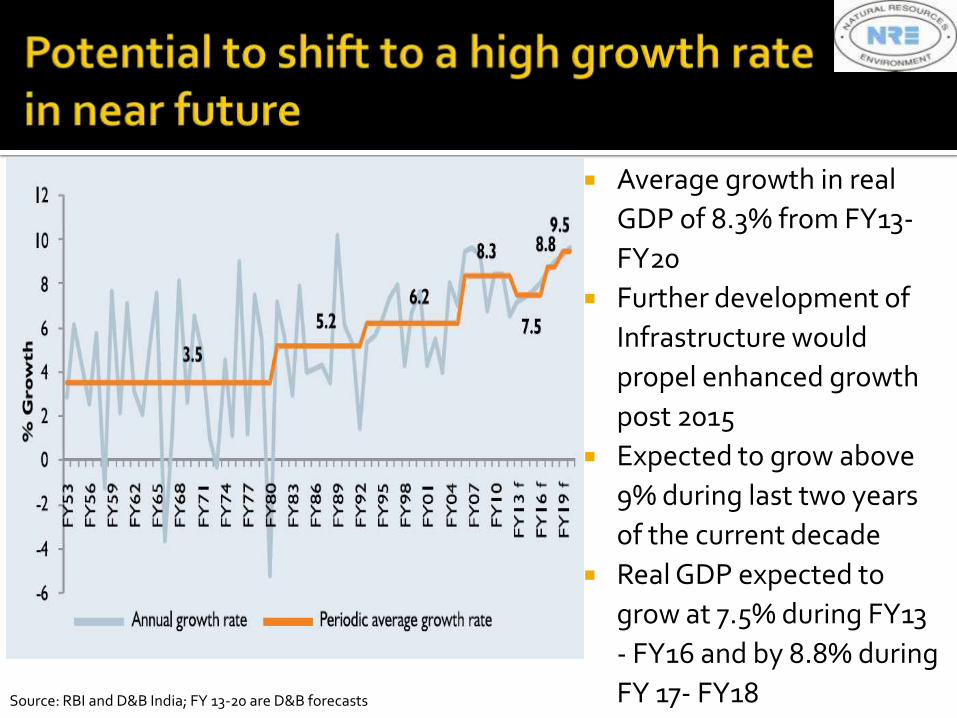
Average growth in real
GDP of 8.3% from FY13-
FY20
Further development of
Infrastructure would
propel enhanced growth
post 2015
Expected to grow above
9% during last two years
of the current decade
Real GDP expected to
grow at 7.5% during FY13
- FY16 and by 8.8% during
FY 17- FY18 Source: RBI and D&B India; FY 13-20 are D&B forecasts

• High savings rates
• Availability of low cost, skilled and semi skilled labour & good knowledge of English
• Growing affluent Middle Class
• Technology – supporting the Service sector
• Favourable demographics
• Benefits from future infrastructure development
• Trade opening and Free markets – opportunities from increased FDI in future
• Manufacturing • Growth in parts manufacturing
• Emerging centre for small car development and manufacturing
• Plans for intelligent engineering products
• Potential for “smart” light engineering
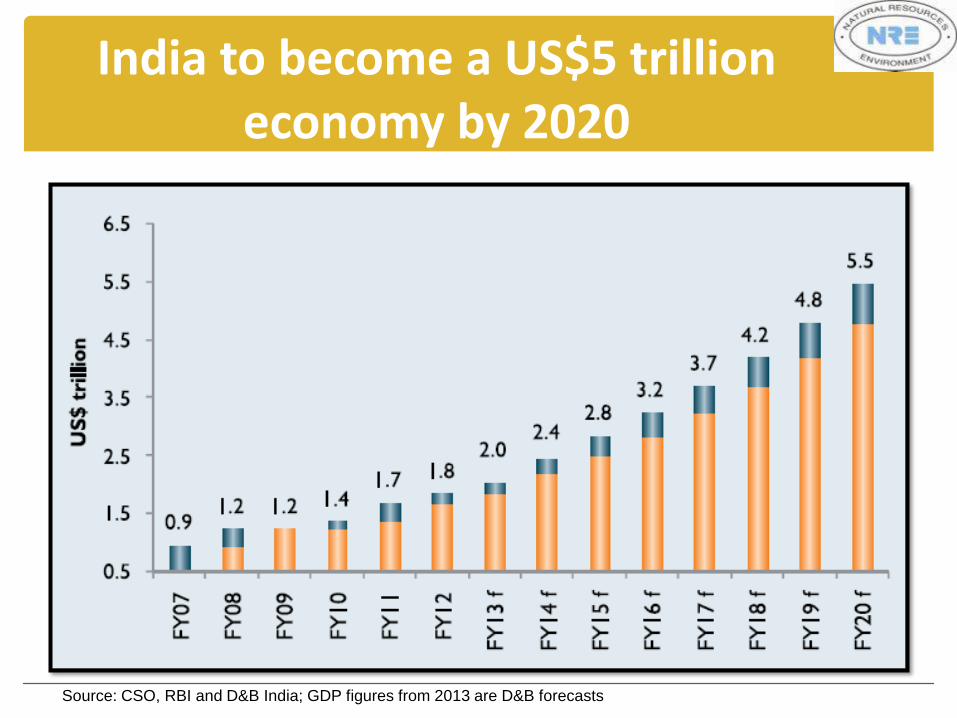
India to become a US$5 trillion economy by 2020
Source: CSO, RBI and D&B India; GDP figures from 2013 are D&B forecasts
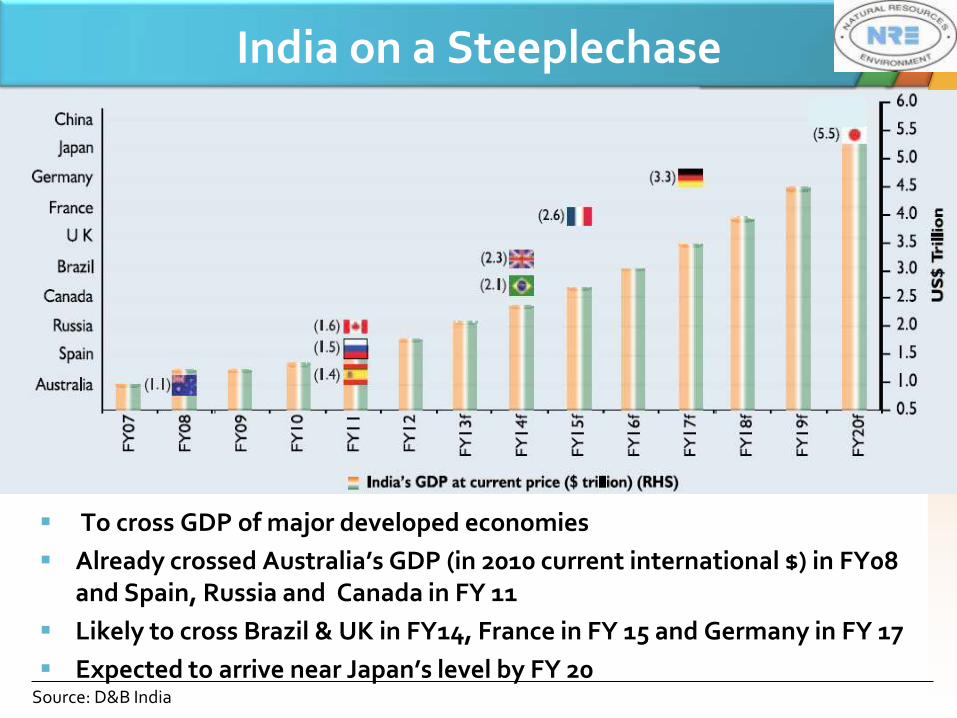
India on a Steeplechase
To cross GDP of major developed economies
Already crossed Australia’s GDP (in 2010 current international $) in FY08 and Spain, Russia and Canada in FY 11
Likely to cross Brazil & UK in FY14, France in FY 15 and Germany in FY 17
Expected to arrive near Japan’s level by FY 20 Source: D&B India
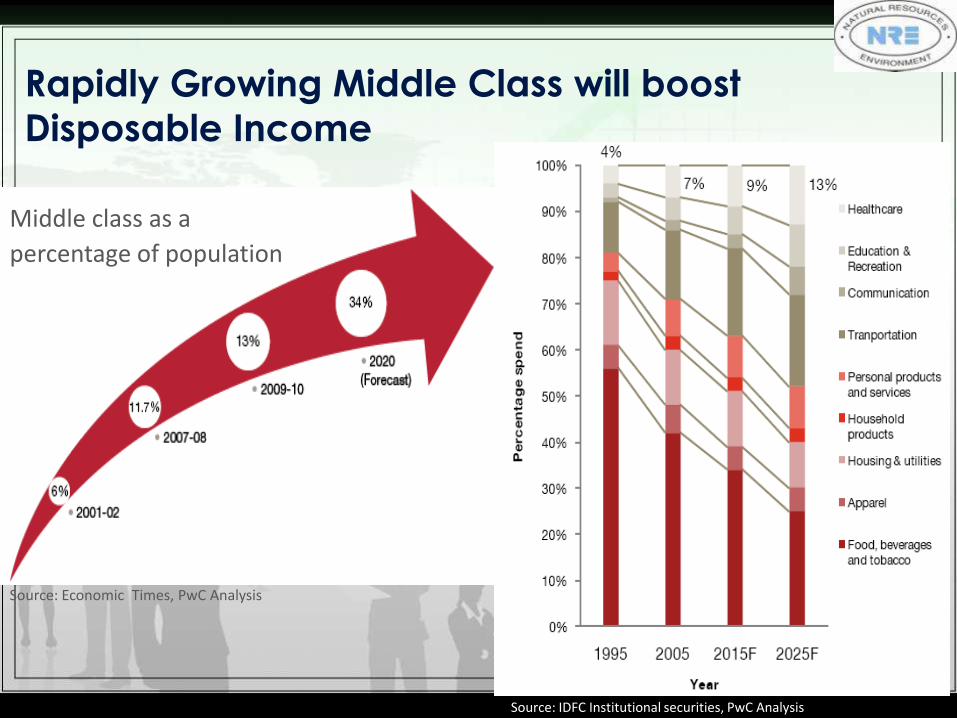
Rapidly Growing Middle Class will boost
Disposable Income
Ascent of Indian Middle
Class – Percentage of
population
Middle class as a
percentage of population
Source: Economic Times, PwC Analysis
Source: IDFC Institutional securities, PwC Analysis
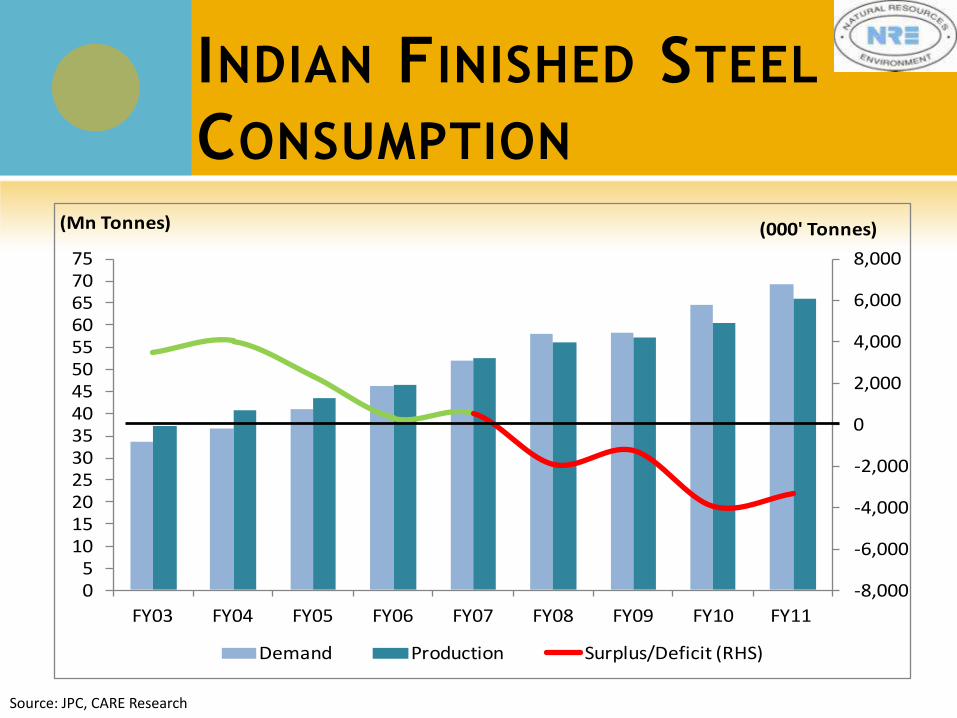
INDIAN FINISHED STEEL
CONSUMPTION
-8,000
-6,000
-4,000
-2,000
0
2,000
4,000
6,000
8,000
05
1015202530354045505560657075
FY03 FY04 FY05 FY06 FY07 FY08 FY09 FY10 FY11
(000' Tonnes)(Mn Tonnes)
Demand Production Surplus/Deficit (RHS)
Source: JPC, CARE Research
IMMENSE GROWTH POTENTIAL IN
INDIAN STEEL SECTOR Domestic crude steel production grew at a
compound annual growth rate of 8.4% in the last few years and is projected to be around 110 million tonne by 2012-13.
222 MoUs signed for planned capacity of around 276 MT by 2020 (challenge remains of how many translates into actual commissioning).
Investments at stake are to the tune of $187 billion
Increase in the demand of steel in India is expected to be 14% against the global average of 5-6%
THE STEEL GROWTH DRIVERS
Target for $ 1 trillion of investments in infrastructure during the 12th Five Year Plan (2012-17).
Infrastructure projects (like Golden Quadrilateral and Dedicated Freight Corridor) will give boost to the demand in the steel sector in near future.
Projected New Greenfield & up-grading of existing Airports will keep the momentum up.
Government has identified ports, airports, railways, power, coal and road sectors for special monitoring of investment totalling around USD 40 billion in 2012-13.
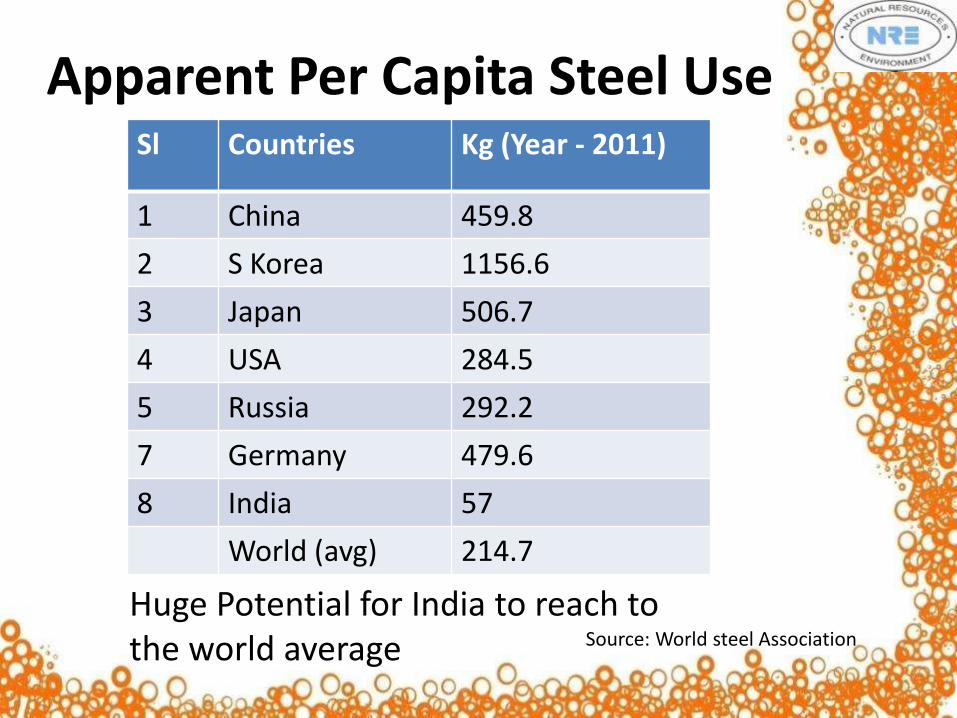
Apparent Per Capita Steel Use Sl Countries Kg (Year - 2011)
1 China 459.8
2 S Korea 1156.6
3 Japan 506.7
4 USA 284.5
5 Russia 292.2
7 Germany 479.6
8 India 57
World (avg) 214.7
Huge Potential for India to reach to the world average Source: World steel Association
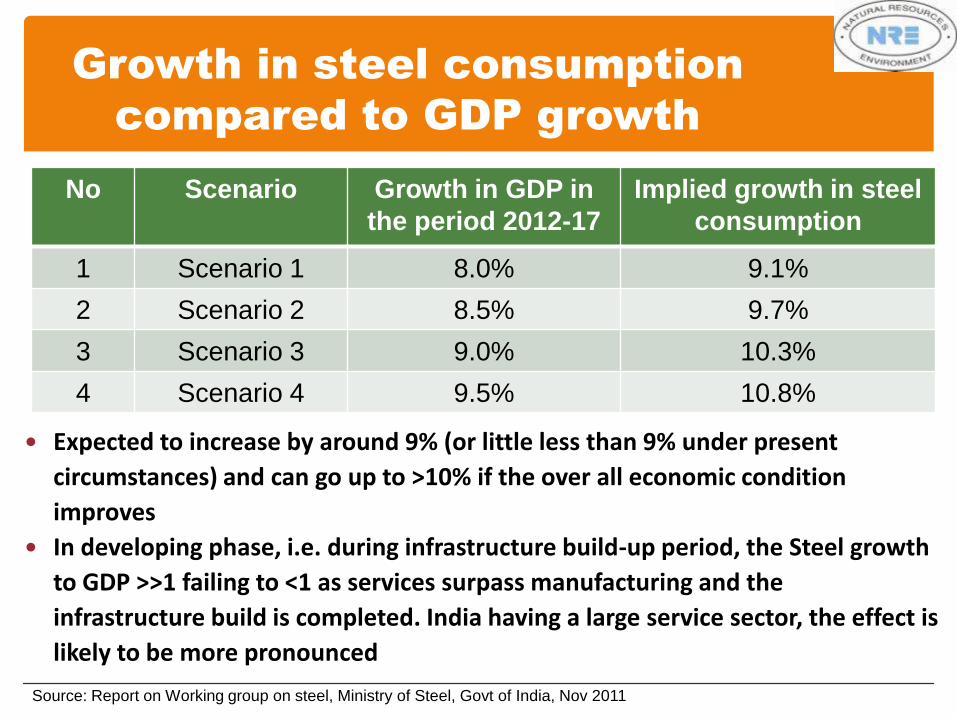
Growth in steel consumption
compared to GDP growth
No Scenario Growth in GDP in
the period 2012-17
Implied growth in steel
consumption
1 Scenario 1 8.0% 9.1%
2 Scenario 2 8.5% 9.7%
3 Scenario 3 9.0% 10.3%
4 Scenario 4 9.5% 10.8%
Expected to increase by around 9% (or little less than 9% under present
circumstances) and can go up to >10% if the over all economic condition
improves
In developing phase, i.e. during infrastructure build-up period, the Steel growth
to GDP >>1 failing to <1 as services surpass manufacturing and the
infrastructure build is completed. India having a large service sector, the effect is
likely to be more pronounced
Source: Report on Working group on steel, Ministry of Steel, Govt of India, Nov 2011
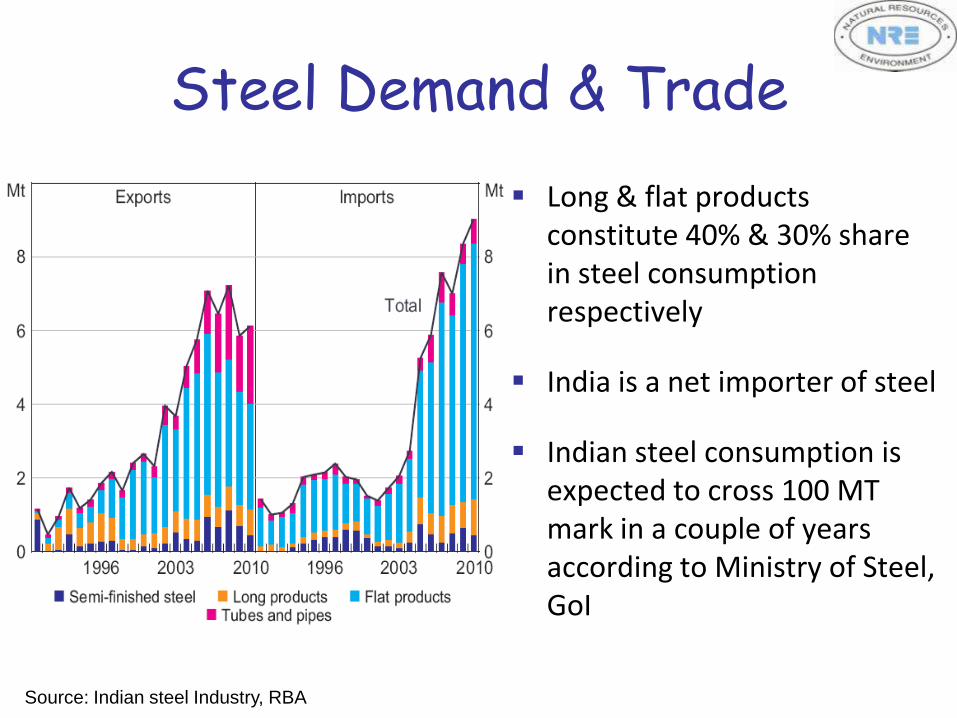
Steel Demand & Trade
Long & flat products constitute 40% & 30% share in steel consumption respectively
India is a net importer of steel
Indian steel consumption is expected to cross 100 MT mark in a couple of years according to Ministry of Steel, GoI
Source: Indian steel Industry, RBA
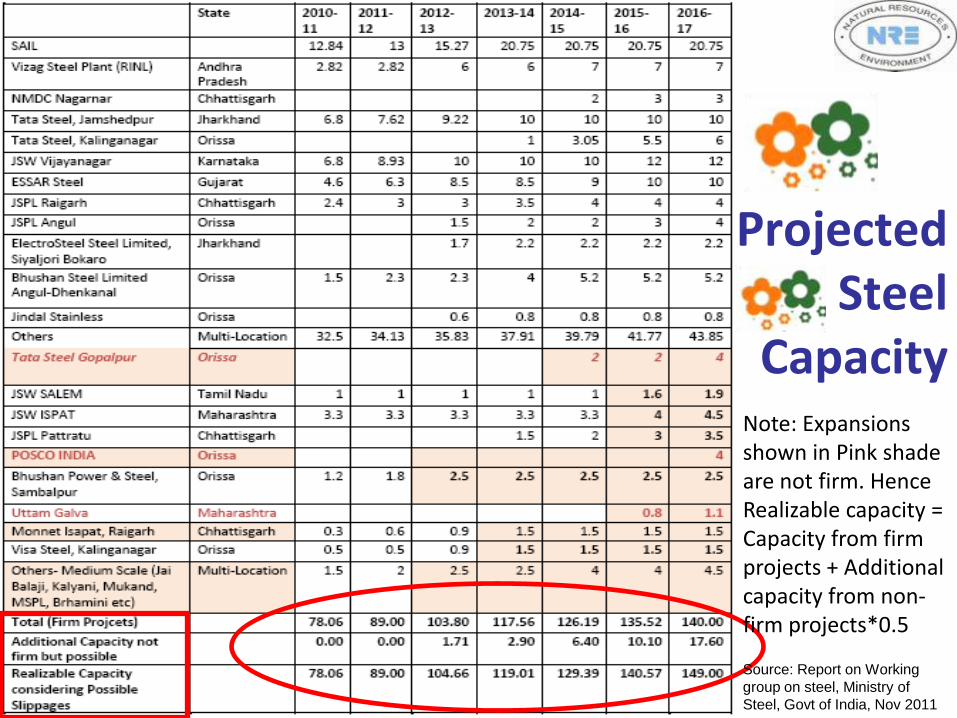
Projected Steel
Capacity
Source: Report on Working
group on steel, Ministry of
Steel, Govt of India, Nov 2011
Note: Expansions shown in Pink shade are not firm. Hence Realizable capacity = Capacity from firm projects + Additional capacity from non-firm projects*0.5
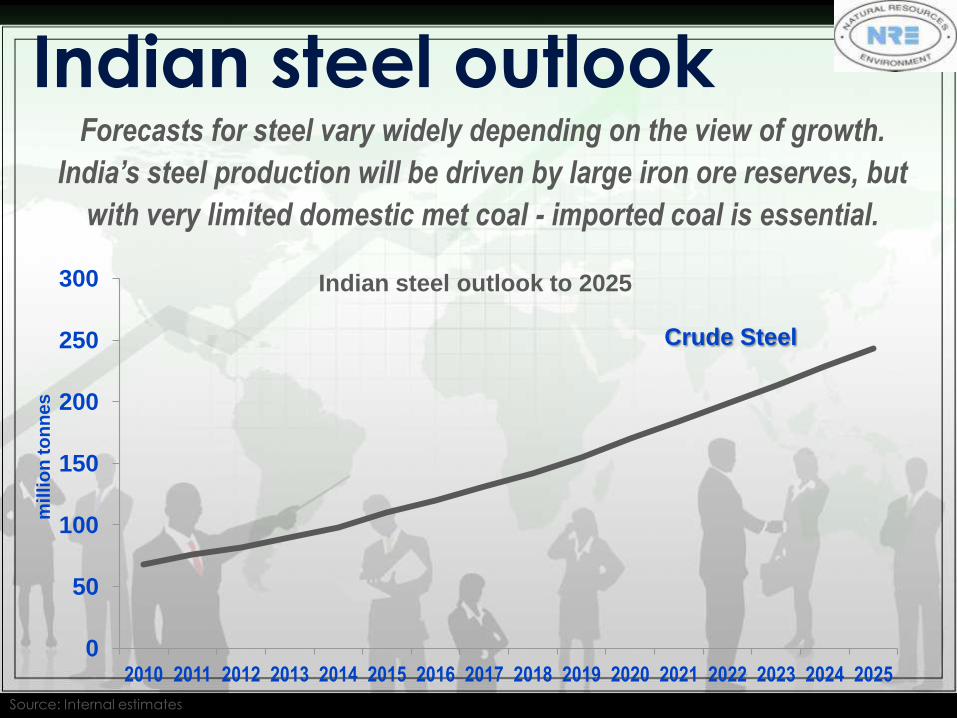
Indian steel outlook Forecasts for steel vary widely depending on the view of growth.
India’s steel production will be driven by large iron ore reserves, but
with very limited domestic met coal - imported coal is essential.
0
50
100
150
200
250
300
2010 2011 2012 2013 2014 2015 2016 2017 2018 2019 2020 2021 2022 2023 2024 2025
mil
lio
n t
on
ne
s
Indian steel outlook to 2025
Crude Steel
Source: Internal estimates
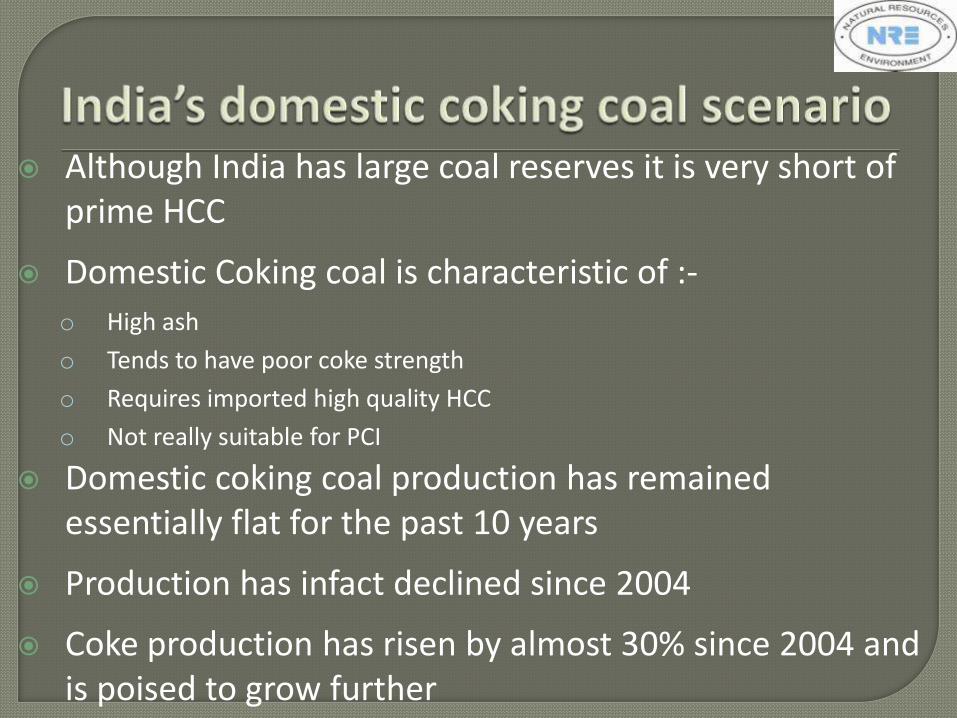
Although India has large coal reserves it is very short of prime HCC
Domestic Coking coal is characteristic of :-
o High ash
o Tends to have poor coke strength
o Requires imported high quality HCC
o Not really suitable for PCI
Domestic coking coal production has remained essentially flat for the past 10 years
Production has infact declined since 2004
Coke production has risen by almost 30% since 2004 and is poised to grow further
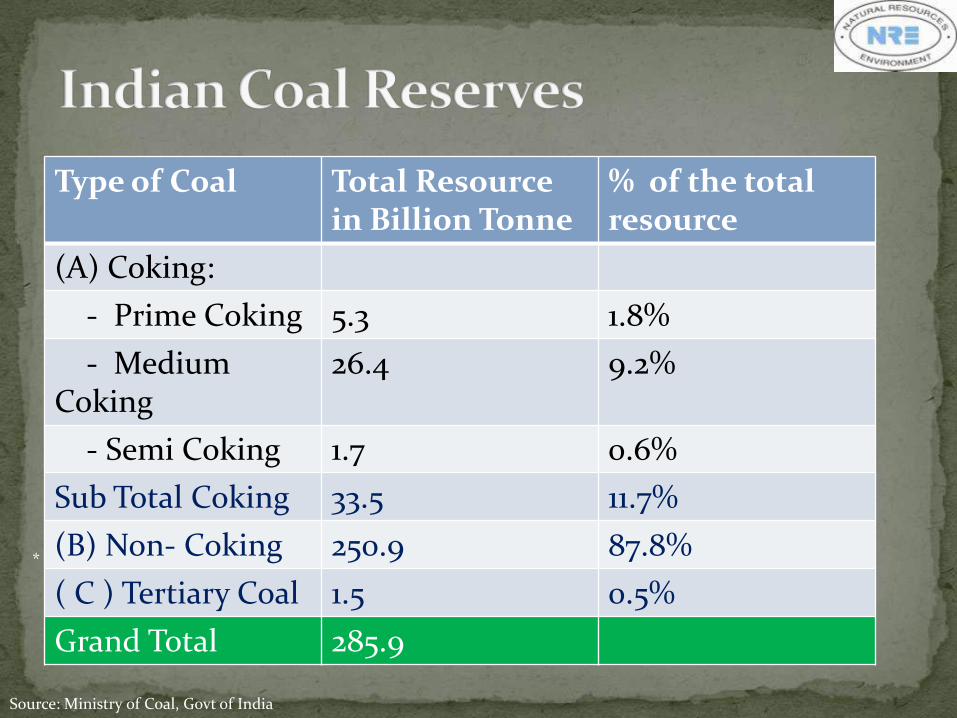
* Includes 749.92 M.T. of Inferred resources established through mapping in North-Eastern region.
Source: Ministry of Coal, Govt of India
Type of Coal Total Resource in Billion Tonne
% of the total resource
(A) Coking:
- Prime Coking 5.3 1.8%
- Medium Coking
26.4 9.2%
- Semi Coking 1.7 0.6%
Sub Total Coking 33.5 11.7%
(B) Non- Coking 250.9 87.8%
( C ) Tertiary Coal 1.5 0.5%
Grand Total 285.9
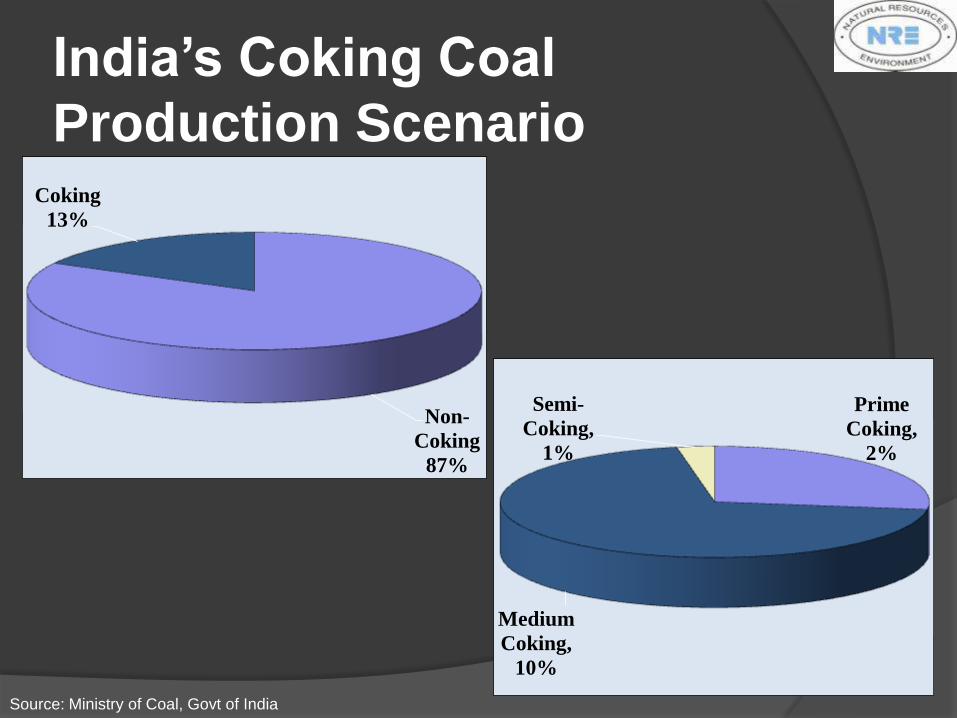
India’s Coking Coal
Production Scenario
Non-
Coking
87%
Coking
13%
Prime
Coking,
2%
Medium
Coking,
10%
Semi-
Coking,
1%
Source: Ministry of Coal, Govt of India

Increasing Coking Coal Demand in Line with Crude Steel Production
125.9
90.2
4.5
0
1
2
3
4
5
0
40
80
120
160
2011-12 2012-13 2013-14 2014-15 2015-16 2016-17
Mil
lio
n T
on
nes
Steel Production
Coking Coal Demand
PCI
Source: Report on Working group on steel, Ministry of Steel, Govt of India, Nov 2011
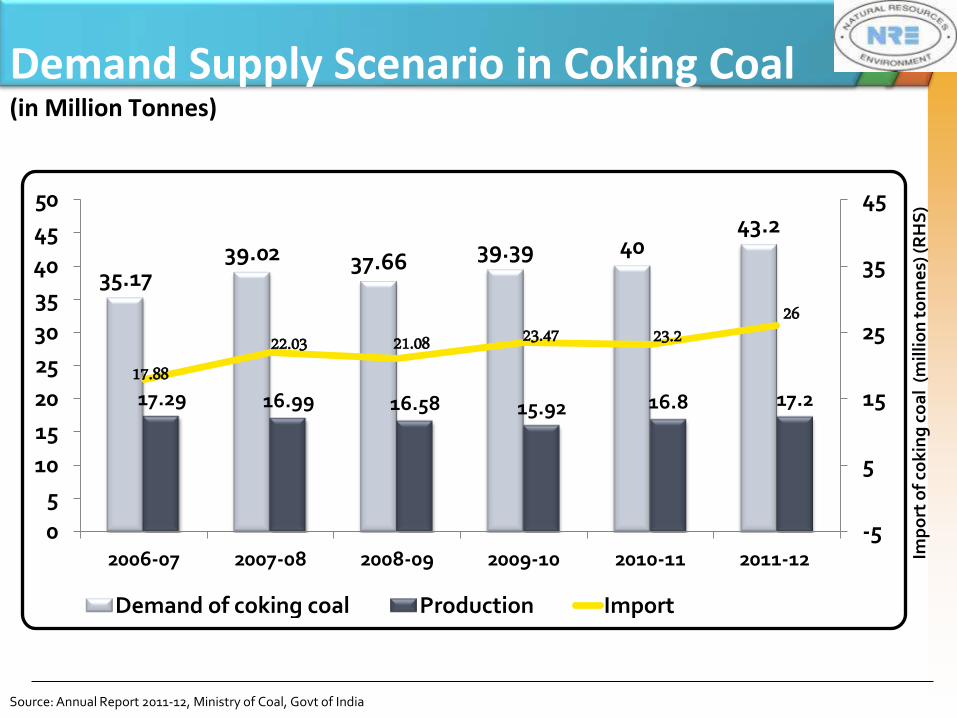
Demand Supply Scenario in Coking Coal (in Million Tonnes)
Imp
ort
of
cok
ing
co
al
(mil
lio
n t
on
ne
s) (R
HS
)
Source: Annual Report 2011-12, Ministry of Coal, Govt of India
35.17 39.02 37.66 39.39 40
43.2
17.29 16.99 16.58 15.92 16.8 17.2
17.88 22.03 21.08 23.47 23.2
26
-5
5
15
25
35
45
0
5
10
15
20
25
30
35
40
45
50
2006-07 2007-08 2008-09 2009-10 2010-11 2011-12
Demand of coking coal Production Import
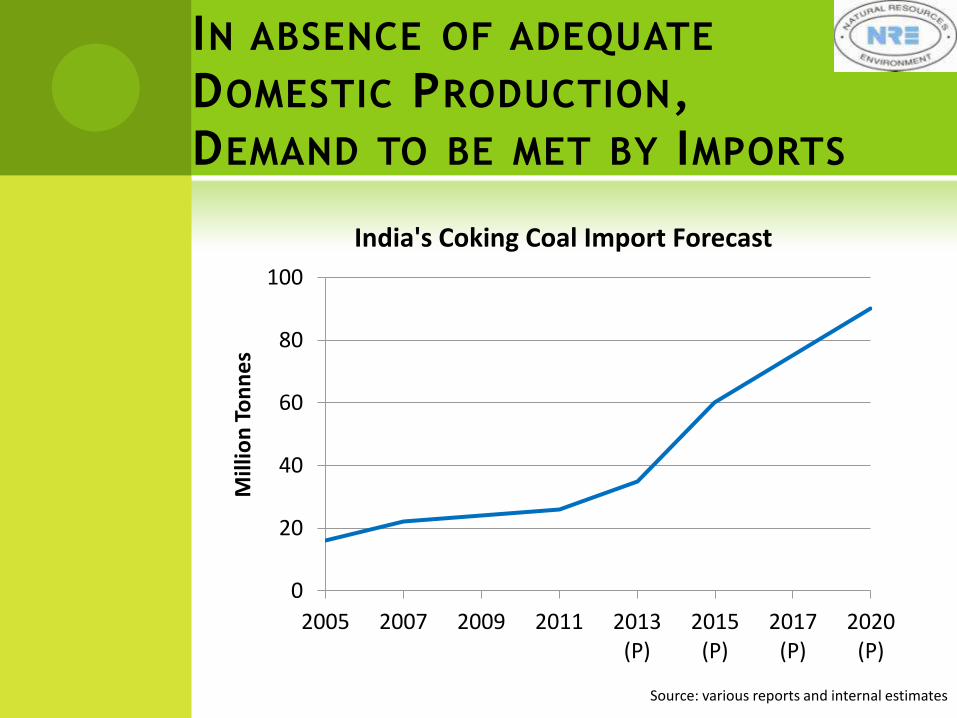
IN ABSENCE OF ADEQUATE
DOMESTIC PRODUCTION,
DEMAND TO BE MET BY IMPORTS
0
20
40
60
80
100
2005 2007 2009 2011 2013 (P)
2015 (P)
2017 (P)
2020 (P)
Mill
ion
To
nn
es India's Coking Coal Import Forecast
Source: various reports and internal estimates
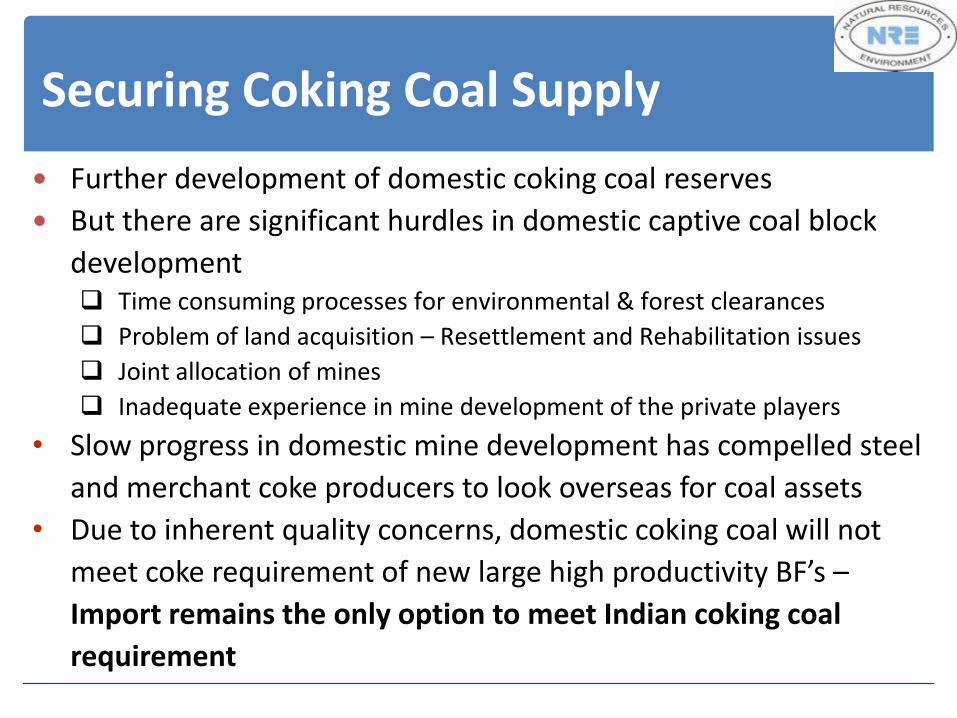
Securing Coking Coal Supply
Further development of domestic coking coal reserves
But there are significant hurdles in domestic captive coal block
development Time consuming processes for environmental & forest clearances
Problem of land acquisition – Resettlement and Rehabilitation issues
Joint allocation of mines
Inadequate experience in mine development of the private players
• Slow progress in domestic mine development has compelled steel
and merchant coke producers to look overseas for coal assets
• Due to inherent quality concerns, domestic coking coal will not
meet coke requirement of new large high productivity BF’s –
Import remains the only option to meet Indian coking coal
requirement
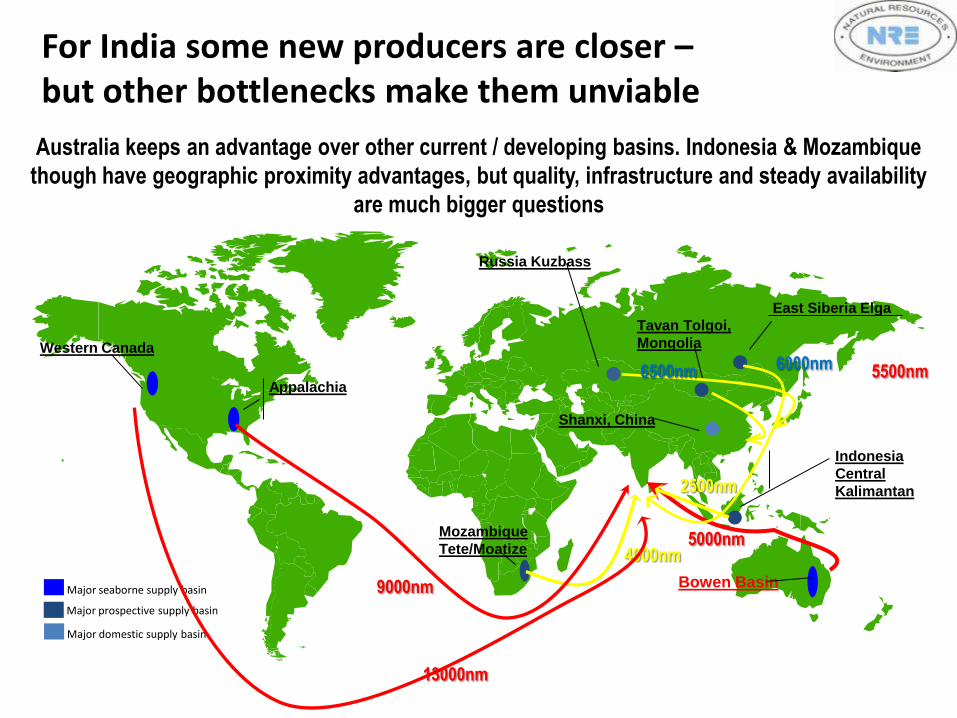
For India some new producers are closer – but other bottlenecks make them unviable
Major seaborne supply basin
Major prospective supply basin
Major domestic supply basin
Tavan Tolgoi,
Mongolia
Shanxi, China
Indonesia
Central
Kalimantan
Bowen Basin
Mozambique
Tete/Moatize
Appalachia
Western Canada
East Siberia Elga
Russia Kuzbass
Australia keeps an advantage over other current / developing basins. Indonesia & Mozambique
though have geographic proximity advantages, but quality, infrastructure and steady availability
are much bigger questions
9000nm
5500nm
5000nm 4000nm
6500nm 6000nm
2500nm
13000nm
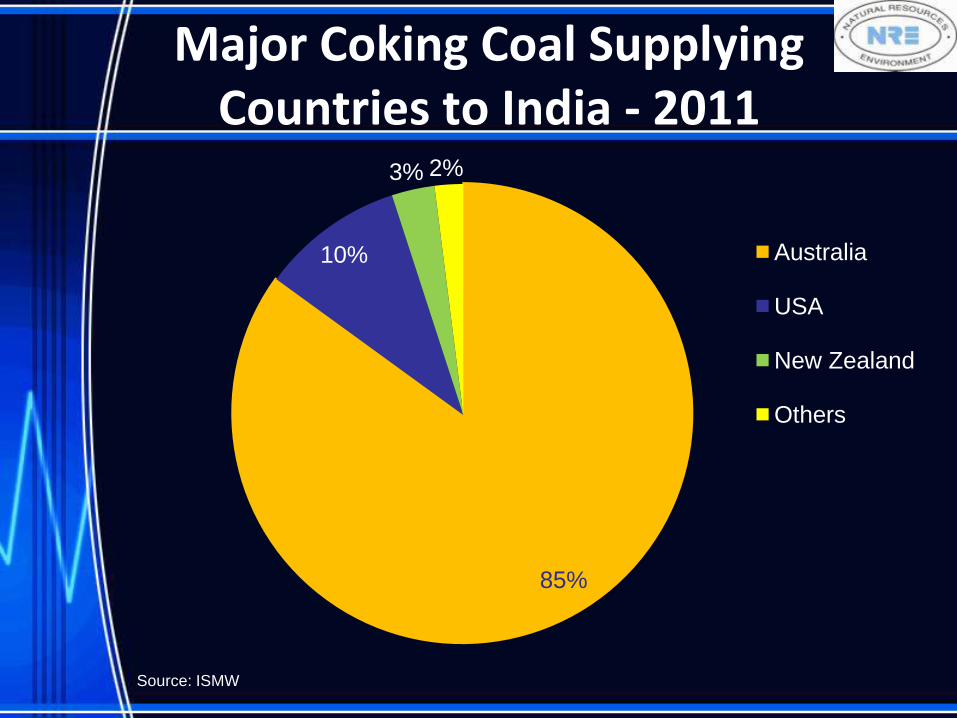
Major Coking Coal Supplying Countries to India - 2011
85%
10%
3% 2%
Australia
USA
New Zealand
Others
Source: ISMW
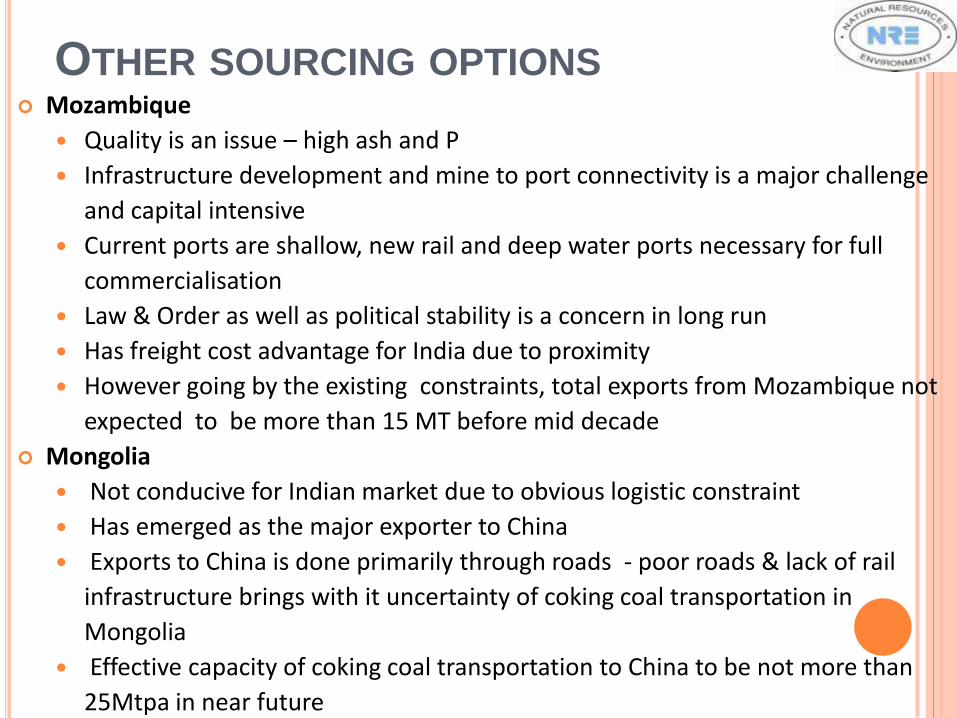
OTHER SOURCING OPTIONS Mozambique
Quality is an issue – high ash and P
Infrastructure development and mine to port connectivity is a major challenge
and capital intensive
Current ports are shallow, new rail and deep water ports necessary for full
commercialisation
Law & Order as well as political stability is a concern in long run
Has freight cost advantage for India due to proximity
However going by the existing constraints, total exports from Mozambique not
expected to be more than 15 MT before mid decade
Mongolia
Not conducive for Indian market due to obvious logistic constraint
Has emerged as the major exporter to China
Exports to China is done primarily through roads - poor roads & lack of rail
infrastructure brings with it uncertainty of coking coal transportation in
Mongolia
Effective capacity of coking coal transportation to China to be not more than
25Mtpa in near future
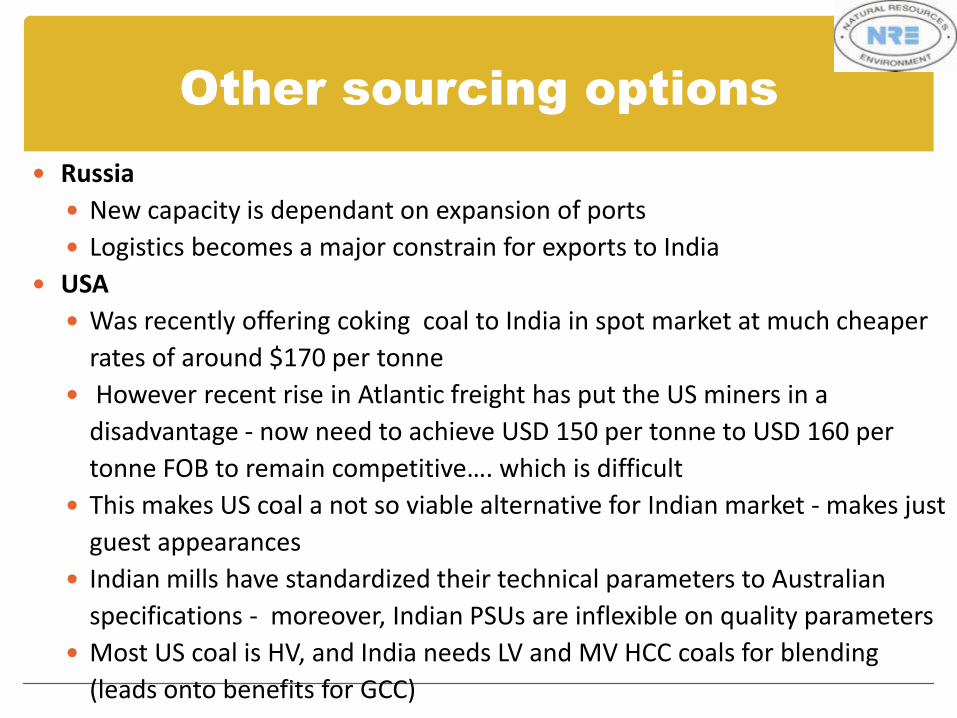
Other sourcing options
Russia
New capacity is dependant on expansion of ports
Logistics becomes a major constrain for exports to India
USA
Was recently offering coking coal to India in spot market at much cheaper
rates of around $170 per tonne
However recent rise in Atlantic freight has put the US miners in a
disadvantage - now need to achieve USD 150 per tonne to USD 160 per
tonne FOB to remain competitive…. which is difficult
This makes US coal a not so viable alternative for Indian market - makes just
guest appearances
Indian mills have standardized their technical parameters to Australian
specifications - moreover, Indian PSUs are inflexible on quality parameters
Most US coal is HV, and India needs LV and MV HCC coals for blending
(leads onto benefits for GCC)

Advantage Australia
Democratic traditions
Shared commonwealth traditions
English speaking population
Strong, stable Government where Rule of Law
prevails
Industry friendly, proactive bureaucracy
India has Law
China has Order
While
Australia has both Law & Order
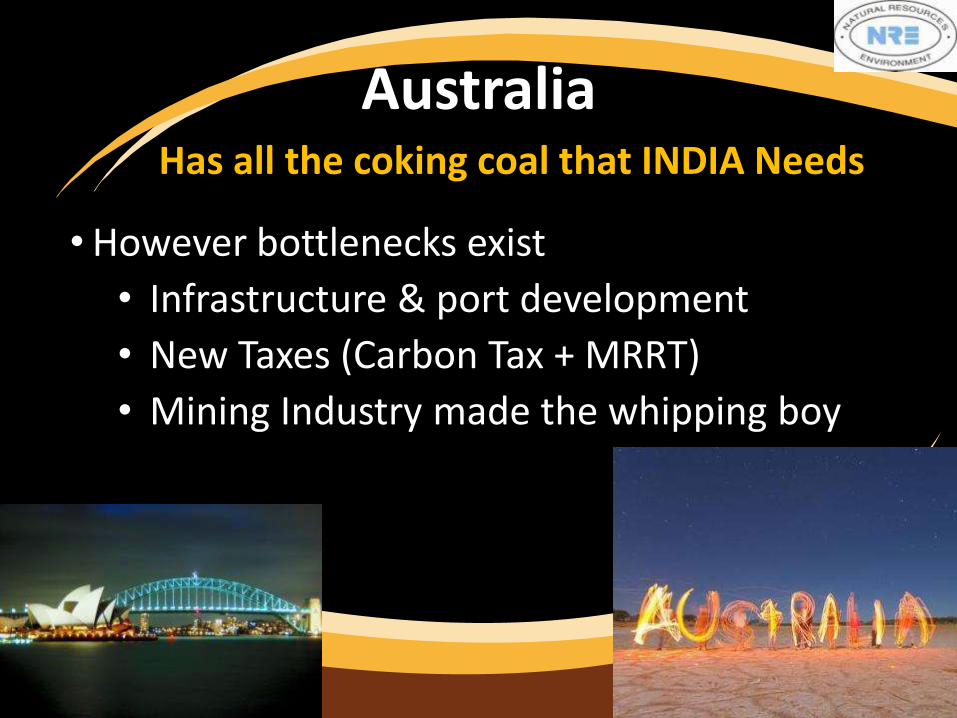
Australia Has all the coking coal that INDIA Needs
• However bottlenecks exist
• Infrastructure & port development
• New Taxes (Carbon Tax + MRRT)
• Mining Industry made the whipping boy
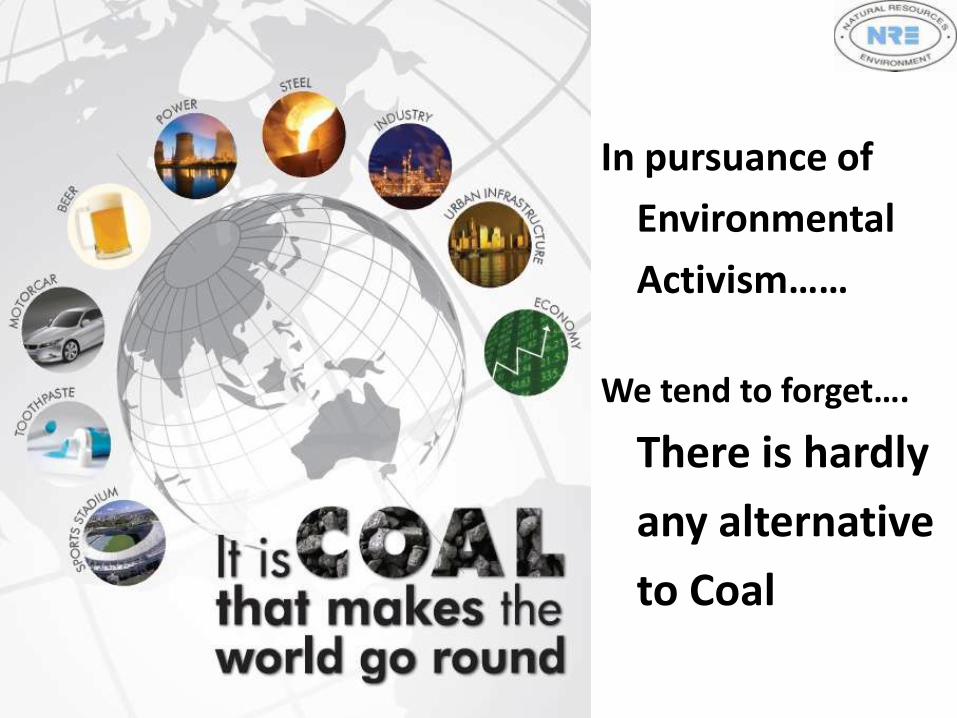
In pursuance of
Environmental
Activism……
We tend to forget….
There is hardly
any alternative
to Coal
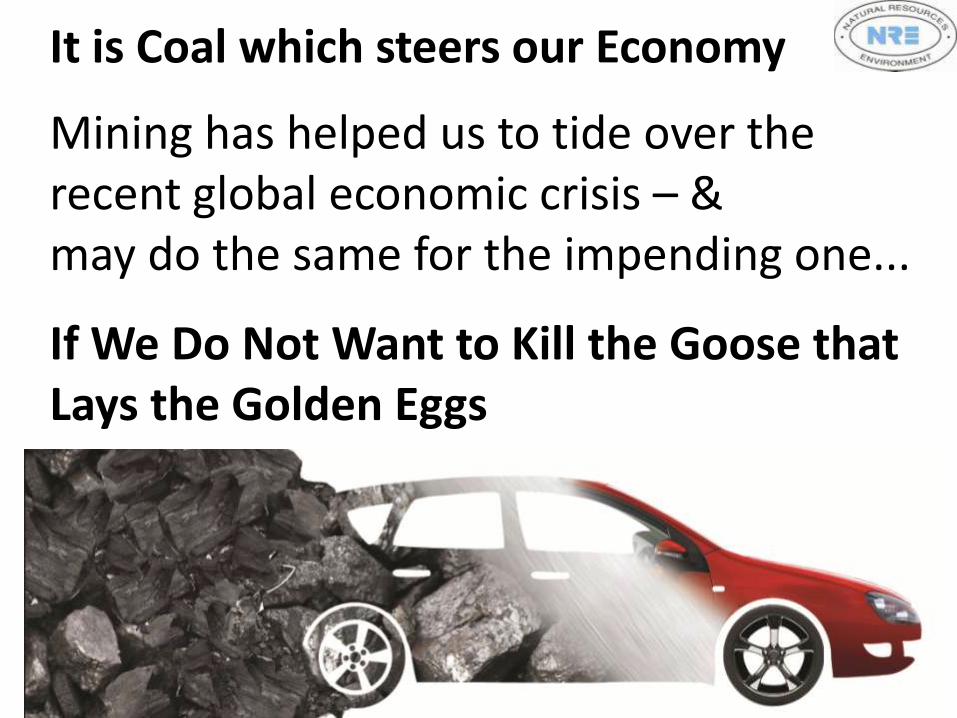
It is Coal which steers our Economy
Mining has helped us to tide over the recent global economic crisis – & may do the same for the impending one...
If We Do Not Want to Kill the Goose that Lays the Golden Eggs

• Development must continue while we meet the challenges of
climate change
• Global Climate Change is a truth but we need to ensure that
facts & figures are not used to forcefully slaughter the human
civilization that we have built over ages
A Sustainable and qualified response to Global Climate
Change is required without stopping development
The Coal industry is sensitive to the carbon emissions and
is taking all the right steps
A matured workable strategy needs to be designed so
that we do not jeopardize development and at the
same time address the challenge of climate change
AT GUJARAT NRE
We Produce Premium Hard Coking Coal
Which is considered the Greenest variety of coal
Coking Coal….Its Different • Coking coal has special coking properties……Is used
primarily in steel production - - coking coal is converted to
met coke, which is then used in blast furnaces as a
reducing agent to make steel
• Every tonne of steel around us contains 1 ton of coking
coal and is the basic building block of society
• Coking Coal needs to be treated differently & coking coal
producers seek preferential treatment and not bundled in
a single category of coal – based on the value and severe
scarcity of the commodity mined
At Gujarat NRE we mine this essential & valuable commodity
Prime Hard Coking Coal
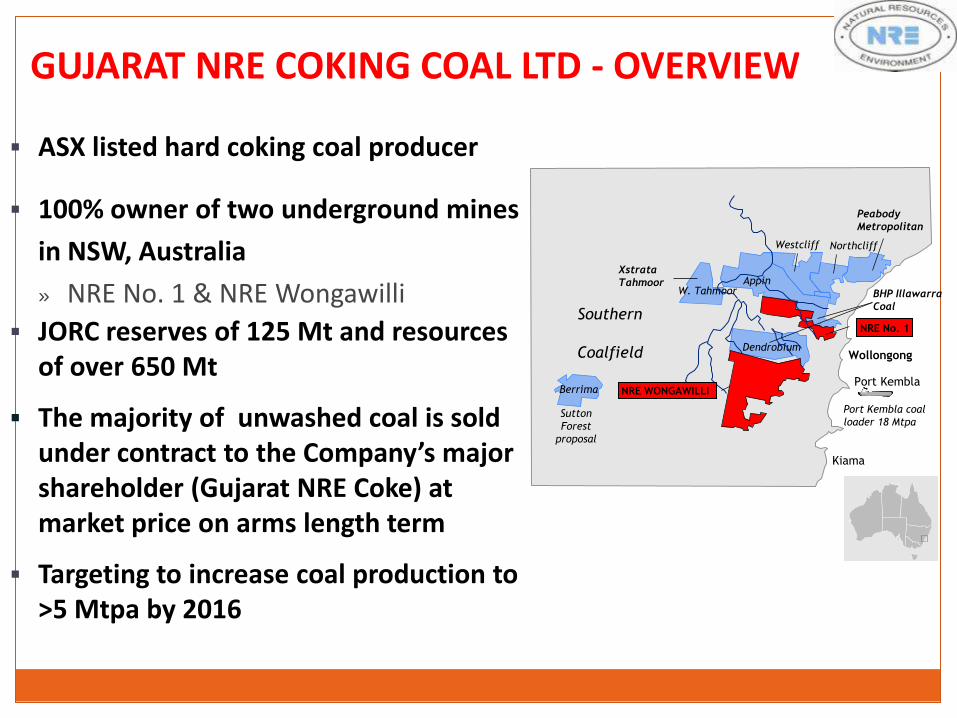
GUJARAT NRE COKING COAL LTD - OVERVIEW
ASX listed hard coking coal producer
100% owner of two underground mines
in NSW, Australia
» NRE No. 1 & NRE Wongawilli
JORC reserves of 125 Mt and resources of over 650 Mt
The majority of unwashed coal is sold under contract to the Company’s major shareholder (Gujarat NRE Coke) at market price on arms length term
Targeting to increase coal production to >5 Mtpa by 2016
Wollongong
Kiama
Port Kembla
Port Kembla coal
loader 18 Mtpa Sutton
Forest
proposal
Berrima
Dendrobium
W. Tahmoor Appin
Westcliff Northcliff
Southern
Coalfield
NRE No. 1
NRE WONGAWILLI
BHP Illawarra
Coal
Peabody
Metropolitan
Xstrata
Tahmoor
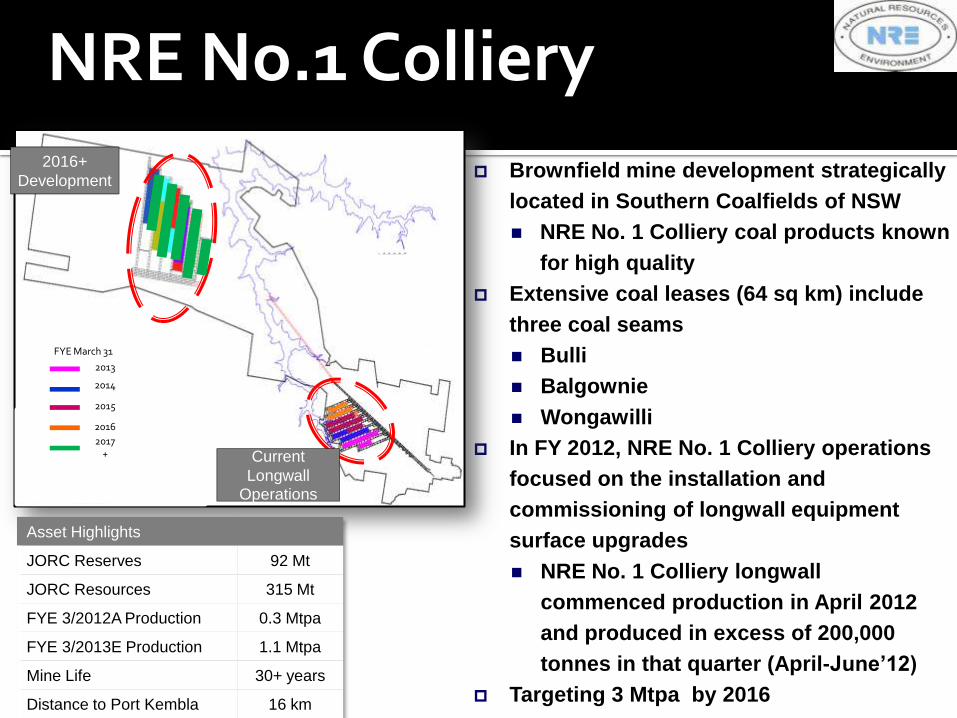
NRE No.1 Colliery
Brownfield mine development strategically
located in Southern Coalfields of NSW
NRE No. 1 Colliery coal products known
for high quality
Extensive coal leases (64 sq km) include
three coal seams
Bulli
Balgownie
Wongawilli
In FY 2012, NRE No. 1 Colliery operations
focused on the installation and
commissioning of longwall equipment
surface upgrades
NRE No. 1 Colliery longwall
commenced production in April 2012
and produced in excess of 200,000
tonnes in that quarter (April-June’12)
Targeting 3 Mtpa by 2016
2016+
Development
Current
Longwall Operations
2013
2014
2015
2016
2017+
FYE March 31
Asset Highlights
JORC Reserves 92 Mt
JORC Resources 315 Mt
FYE 3/2012A Production 0.3 Mtpa
FYE 3/2013E Production 1.1 Mtpa
Mine Life 30+ years
Distance to Port Kembla 16 km
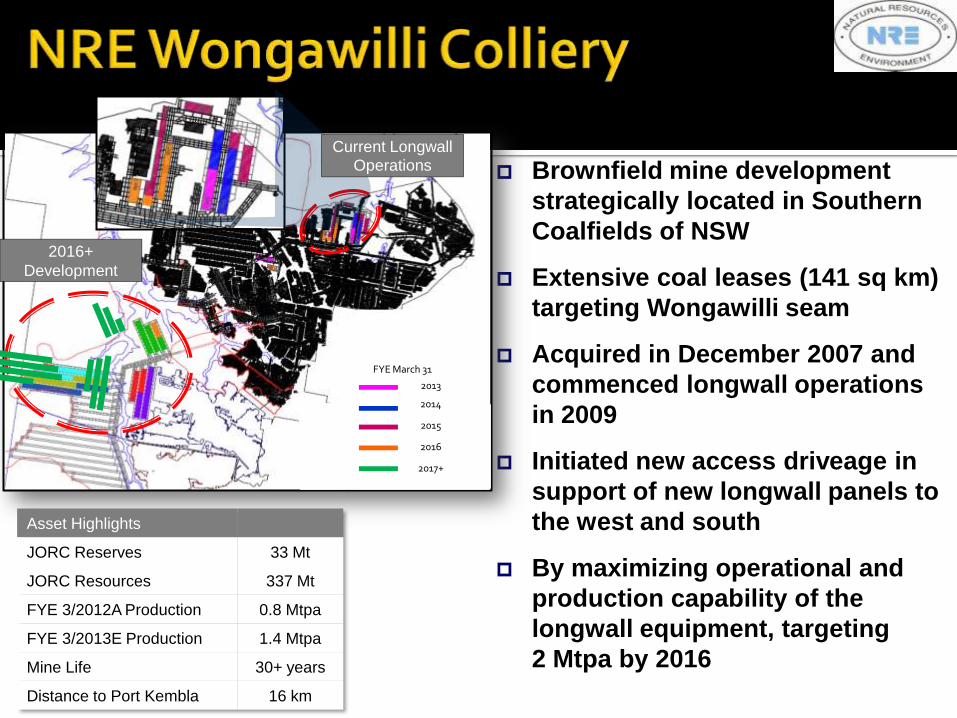
Brownfield mine development
strategically located in Southern
Coalfields of NSW
Extensive coal leases (141 sq km)
targeting Wongawilli seam
Acquired in December 2007 and
commenced longwall operations
in 2009
Initiated new access driveage in
support of new longwall panels to
the west and south
By maximizing operational and
production capability of the
longwall equipment, targeting
2 Mtpa by 2016
2013
2014
2015
2016
2017+
FYE March 31
Current Longwall Operations
2016+
Development
Asset Highlights
JORC Reserves 33 Mt
JORC Resources 337 Mt
FYE 3/2012A Production 0.8 Mtpa
FYE 3/2013E Production 1.4 Mtpa
Mine Life 30+ years
Distance to Port Kembla 16 km
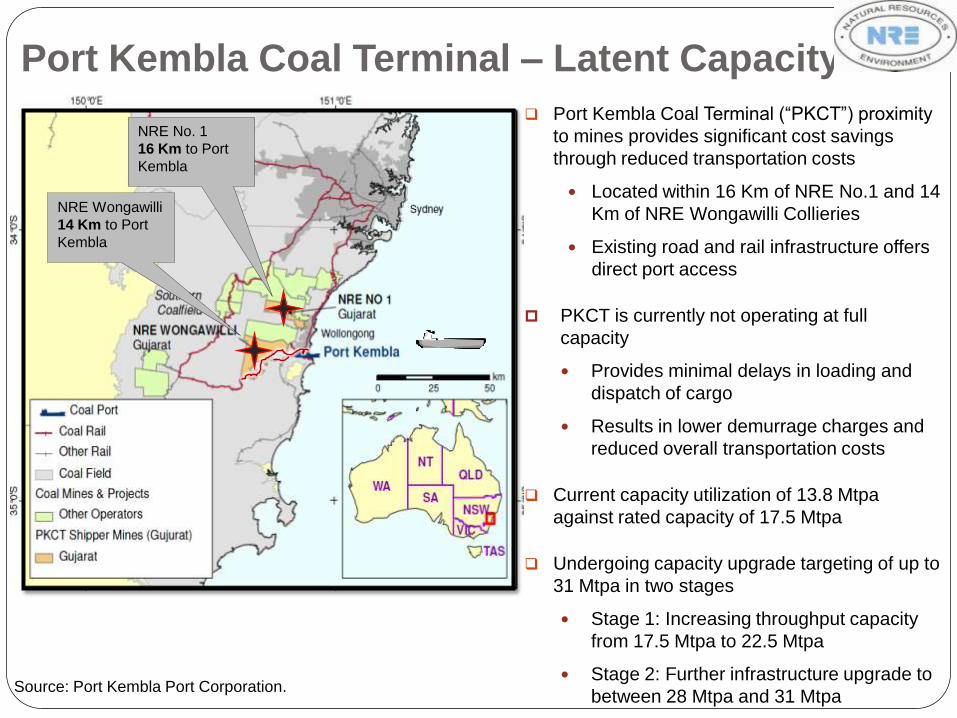
NRE Wongawilli
14 Km to Port
Kembla
NRE No. 1
16 Km to Port
Kembla
Source: Port Kembla Port Corporation.
Port Kembla Coal Terminal (“PKCT”) proximity
to mines provides significant cost savings
through reduced transportation costs
Located within 16 Km of NRE No.1 and 14
Km of NRE Wongawilli Collieries
Existing road and rail infrastructure offers
direct port access
PKCT is currently not operating at full
capacity
Provides minimal delays in loading and
dispatch of cargo
Results in lower demurrage charges and
reduced overall transportation costs
Current capacity utilization of 13.8 Mtpa
against rated capacity of 17.5 Mtpa
Undergoing capacity upgrade targeting of up to
31 Mtpa in two stages
Stage 1: Increasing throughput capacity
from 17.5 Mtpa to 22.5 Mtpa
Stage 2: Further infrastructure upgrade to
between 28 Mtpa and 31 Mtpa
Port Kembla Coal Terminal – Latent Capacity
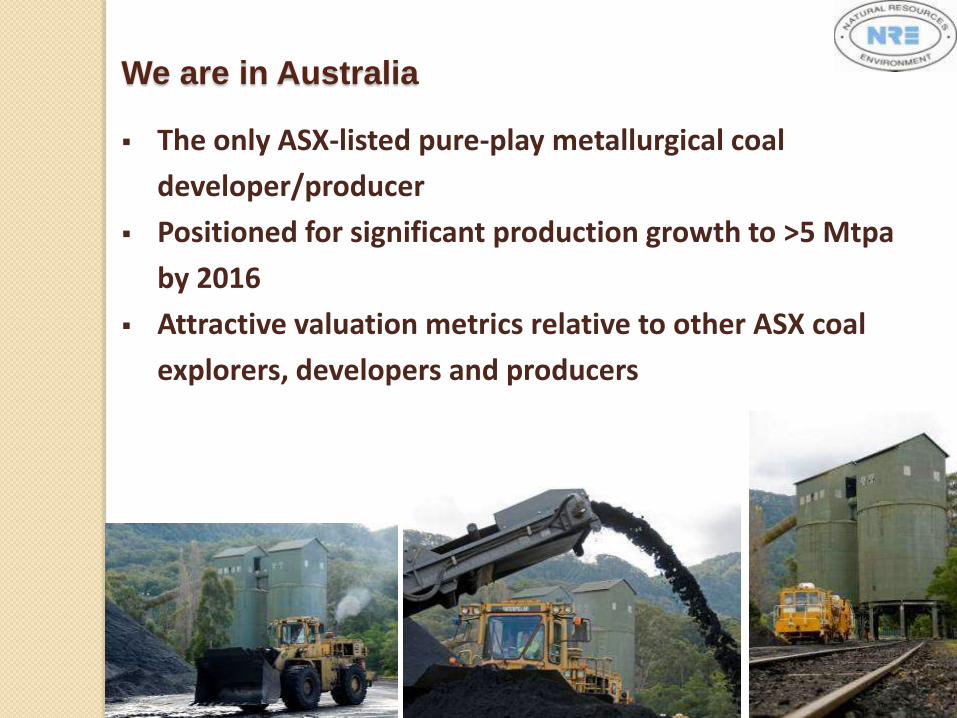
We are in Australia
The only ASX-listed pure-play metallurgical coal
developer/producer
Positioned for significant production growth to >5 Mtpa
by 2016
Attractive valuation metrics relative to other ASX coal
explorers, developers and producers
GUJARAT NRE COKE LIMITED (GNCL)
GNCL - A SNAPSHOT Largest independent producer of Metallurgical Coke in India
Profit earning and dividend paying with strong financials and
credit rating
Present Met Coke capacity of over 1.43 MT, being increased to
4 MT by 2015
Strong focus on the Environment with ISO 14001:2004 & OHSAS
18001:1999 certification
Rated one of the top 10 company by 10-years profit
performance issued by Business Today on India’s Most Valuable
Companies (Nov 2009 edition)
43
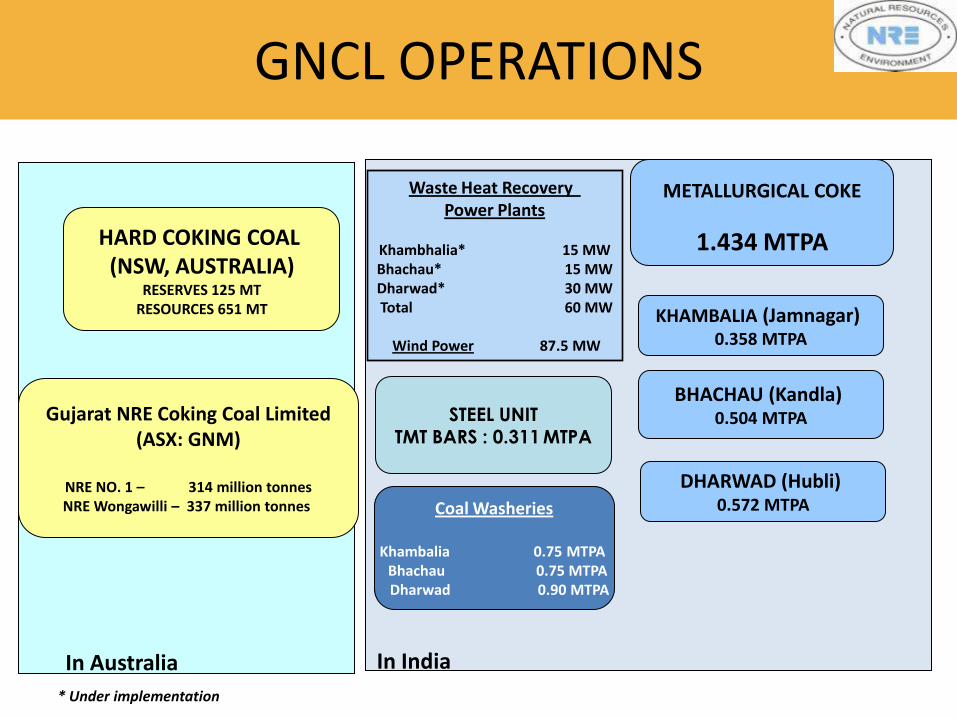
GNCL OPERATIONS
HARD COKING COAL
(NSW, AUSTRALIA) RESERVES 125 MT
RESOURCES 651 MT
METALLURGICAL COKE
1.434 MTPA
Gujarat NRE Coking Coal Limited (ASX: GNM)
NRE NO. 1 – 314 million tonnes NRE Wongawilli – 337 million tonnes
STEEL UNIT TMT BARS : 0.311 MTPA
BHACHAU (Kandla) 0.504 MTPA
KHAMBALIA (Jamnagar) 0.358 MTPA
Waste Heat Recovery Power Plants
Khambhalia* 15 MW Bhachau* 15 MW Dharwad* 30 MW Total 60 MW
Wind Power 87.5 MW
In Australia In India
Coal Washeries
Khambalia 0.75 MTPA Bhachau 0.75 MTPA Dharwad 0.90 MTPA
* Under implementation
DHARWAD (Hubli) 0.572 MTPA
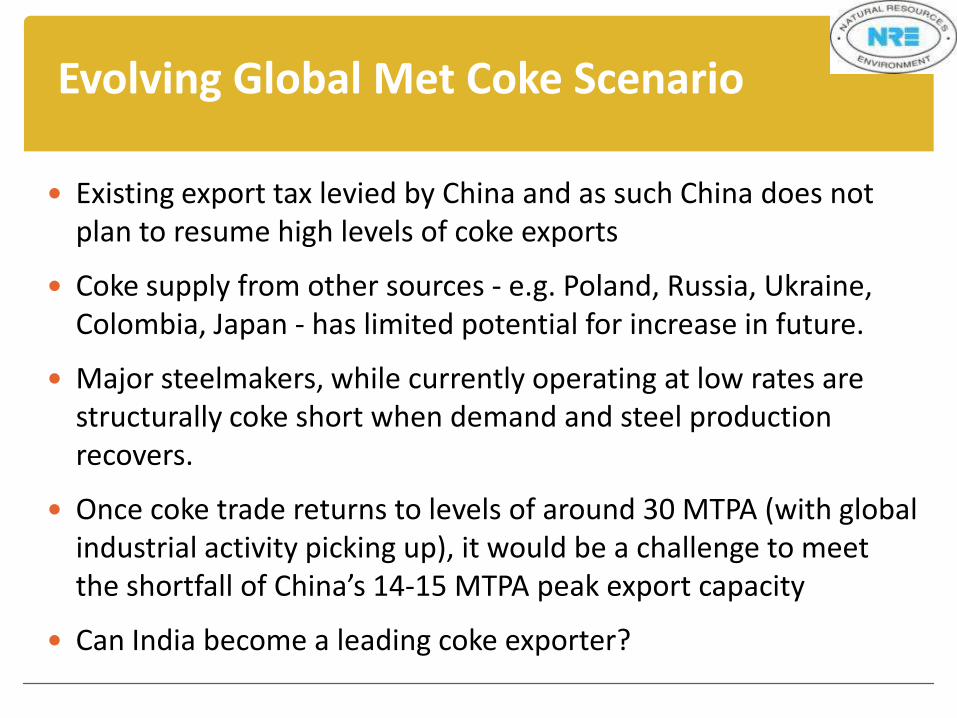
Evolving Global Met Coke Scenario
Existing export tax levied by China and as such China does not plan to resume high levels of coke exports
Coke supply from other sources - e.g. Poland, Russia, Ukraine, Colombia, Japan - has limited potential for increase in future.
Major steelmakers, while currently operating at low rates are structurally coke short when demand and steel production recovers.
Once coke trade returns to levels of around 30 MTPA (with global industrial activity picking up), it would be a challenge to meet the shortfall of China’s 14-15 MTPA peak export capacity
Can India become a leading coke exporter?
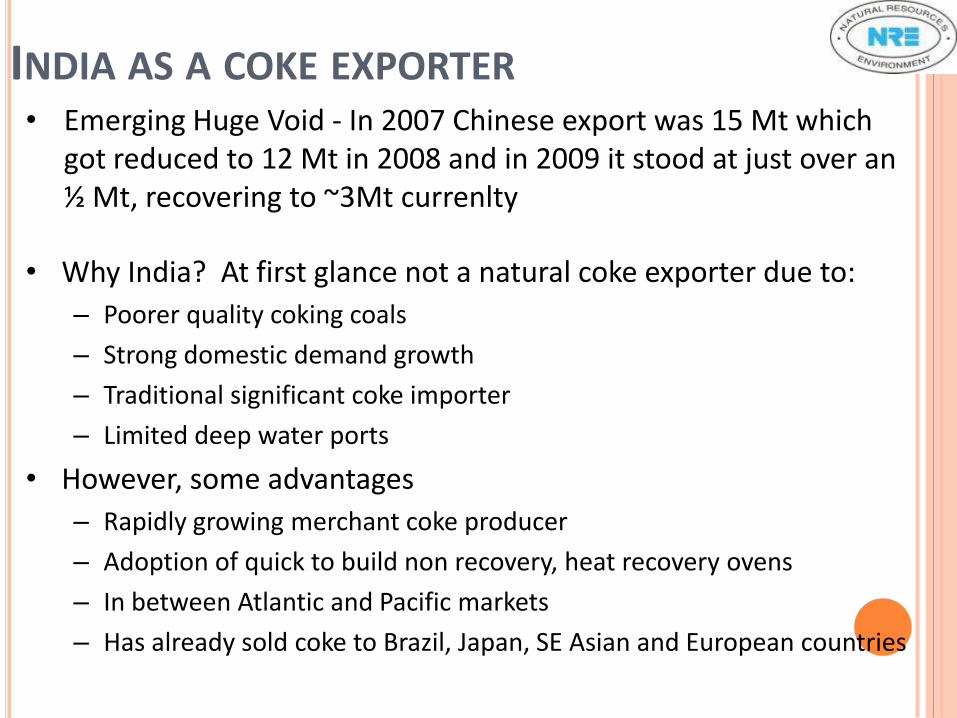
INDIA AS A COKE EXPORTER
• Why India? At first glance not a natural coke exporter due to:
– Poorer quality coking coals
– Strong domestic demand growth
– Traditional significant coke importer
– Limited deep water ports
• However, some advantages
– Rapidly growing merchant coke producer
– Adoption of quick to build non recovery, heat recovery ovens
– In between Atlantic and Pacific markets
– Has already sold coke to Brazil, Japan, SE Asian and European countries
• Emerging Huge Void - In 2007 Chinese export was 15 Mt which got reduced to 12 Mt in 2008 and in 2009 it stood at just over an ½ Mt, recovering to ~3Mt currenlty
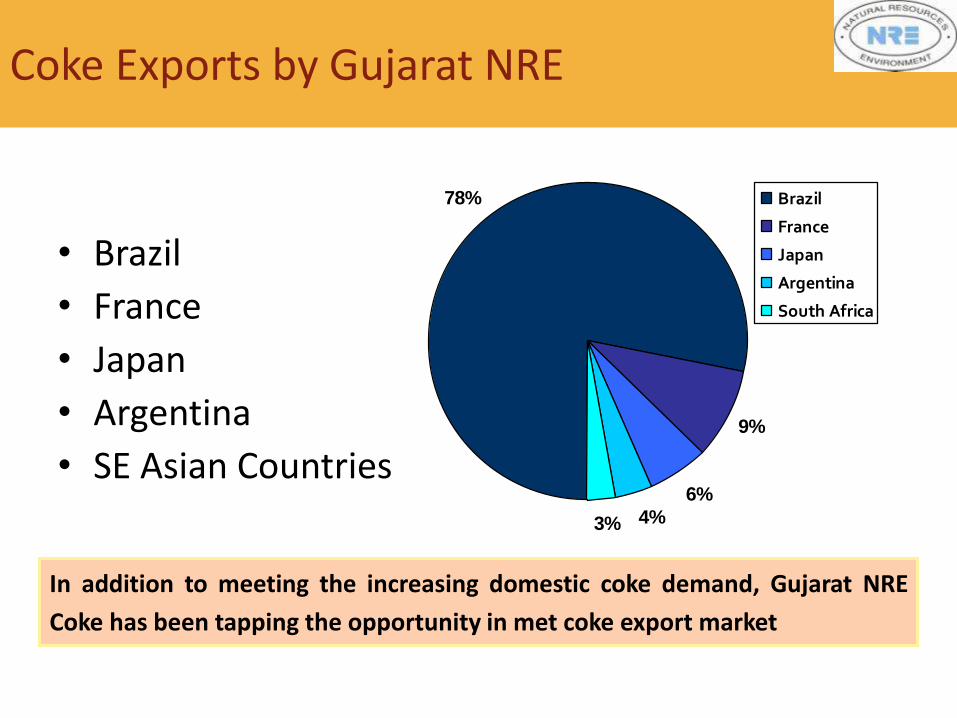
Coke Exports by Gujarat NRE
• Brazil
• France
• Japan
• Argentina
• SE Asian Countries
In addition to meeting the increasing domestic coke demand, Gujarat NRE
Coke has been tapping the opportunity in met coke export market
78%
9%
6%
4%3%
Brazil
France
Japan
Argentina
South Africa

DISCLAIMER & IMPORTANT NOTICE
FORWARD LOOKING STATEMENTS AND OTHER MATTERS
UNLESS OTHERWISE NOTED, THE FORECASTED INDUSTRY AND MARKET DATA CONTAINED IN THE ASSUMPTIONS FOR THE PROJECTIONS ARE BASED UPON
MANAGEMENT ESTIMATES AND INDUSTRY AND MARKET PUBLICATIONS AND SURVEYS. THE INFORMATION FROM INDUSTRY AND MARKET PUBLICATIONS HAS BEEN
OBTAINED FROM SOURCES BELIEVED TO BE RELIABLE, BUT THERE CAN BE NO ASSURANCE AS TO THE ACCURACY OR COMPLETENESS OF THE INCLUDED
INFORMATION. GUJARAT NRE COKING COAL LTD (“GNM”) HAS NOT INDEPENDENTLY VERIFIED ANY OF THE DATA FROM THIRD-PARTY SOURCES, NOR HAS GNM
ASCERTAINED THE UNDERLYING ECONOMIC ASSUMPTIONS RELIED UPON THEREIN.
THE INFORMATION AND OPINIONS SUPPLIED BY WOOD MACKENZIE (AUSTRALIA) PTY LIMITED, DOES NOT INCLUDE, NOR SHALL BE CONSTRUED AS INCLUDING,
ADVICE, GUIDANCE OR RECOMMENDATIONS FROM WOOD MACKENZIE TO TAKE, OR NOT TO TAKE, ANY ACTIONS OR DECISIONS IN RELATION TO ANY MATTER,
INCLUDING WITHOUT LIMITATION RELATING TO INVESTMENTS OR THE PURCHASE OR SALE OF ANY SECURITIES, SHARES OR OTHER ASSETS OF ANY KIND. SHOULD
YOU TAKE SUCH ACTION OR DECISION BASED ON SUCH INFORMATION OR OPINION, YOU DO SO ENTIRELY AT YOUR OWN RISK AND WOOD MACKENZIE SHALL HAVE
NO LIABILITY WHATSOEVER FOR ANY LOSS, DAMAGE, COSTS OR EXPENSES INCURRED OR SUFFERED BY YOU AS A RESULT. FURTHER, WOOD MACKENZIE
REPRESENTS THAT ALTHOUGH IT HAS USED REASONABLE ENDEAVOURS TO OBTAIN RELEVANT FACTUAL INFORMATION WHOLLY FROM PUBLIC SOURCES DEEMED
BY IT, IN ITS DISCRETION, TO BE RELIABLE AT THE TIME THE INFORMATION WAS OBTAINED, IT MAKES NO WARRANTIES OR REPRESENTATIONS ABOUT THE
ACCURACY OR COMPLETENESS OF SUCH INFORMATION. ALSO, ALTHOUGH WOOD MACKENZIE REPRESENTS THAT IT HAS USED REASONABLE SKILL AND CARE IN
INTERPRETING SUCH FACTUAL INFORMATION, IT MAKES NO WARRANTIES OR REPRESENTATIONS ABOUT THE ACCURACY OR COMPLETENESS OF SUCH
INTERPRETATION.
THESE MATERIALS ARE BEING SUPPLIED TO YOU SOLELY FOR YOUR INFORMATION AND FOR USE AT THE PRESENTATION. THIS PRESENTATION AND THESE
MATERIALS MAY NOT BE REPRODUCED, REDISTRIBUTED OR PASSED ON, DIRECTLY OR INDIRECTLY, TO ANY OTHER PERSON OR PUBLISHED, IN WHOLE OR IN PART,
BY ANY MEDIUM OR FOR ANY PURPOSE.
THIS PRESENTATION IS NOT INTENDED TO CONSTITUTE AN OFFER TO SELL OR THE SOLICITATION OF AN OFFER TO BUY ANY SECURITIES IN ANY JURISDICTION. NO
REPRESENTATION, WARRANTY OR UNDERTAKING (EXPRESSED OR IMPLIED) IS MADE IN RELATION TO THIS PRESENTATION. THE PRESENTATION CONTAINS
FORWARD LOOKING STATEMENTS WHICH INVOLVE RISKS AND UNCERTAINTIES AND ACTUAL RESULTS AND DEVELOPMENTS MAY DIFFER MATERIALLY FROM THOSE
EXPRESSED OR IMPLIED HEREIN DEPENDING ON A VARIETY OF FACTORS. NO RESPONSIBILITY IS TAKEN OR ACCEPTED BY GNM AND/OR ANY OF ITS PARENTS,
SUBSIDIARIES, AFFILIATES AND THEIR RESPECTIVE OFFICERS, DIRECTORS, EMPLOYEES, AGENTS AND ASSIGNS FOR THE ADEQUACY, COMPLETENESS OR
ACCURACY OF THE PRESENTATION OR THE ASSUMPTIONS ON WHICH IT IS BASED AND ALL LIABILITY IS HEREBY EXPRESSLY EXCLUDED AND DENIED. ANYONE
USING THE PRESENTATION DOES SO AT THEIR OWN RISK AND NO RESPONSIBILITY IS ACCEPTED FOR ANY LOSSES WHICH MAY RESULT FROM SUCH USE DIRECTLY
OR INDIRECTLY. RECIPIENTS SHOULD CARRY OUT THEIR OWN DUE DILIGENCE IN CONNECTION WITH THE ASSUMPTIONS CONTAINED HEREIN.
WE HAVE MADE CERTAIN ASSUMPTIONS WITH RESPECT TO ECONOMIC CONDITIONS, THE LEVEL OF MARKET DEMAND FOR OUR PRODUCT AND SEVERAL OTHER
MATERIAL CONTINGENCIES AND MATTERS WHICH ARE NOT WITHIN OUR CONTROL AND THE OUTCOME OF WHICH CANNOT BE PREDICTED BY US WITH ANY
EXPECTATION OF ACCURACY. OUR ASSUMPTIONS ARE INHERENTLY IMPRECISE, SPECULATIVE , IN SOME CASES, AND SUBJECT TO UNCERTAINITIES AND ACTUAL
RESULTS WILL DEFER, PERHAPS MATERIALLY,FROM THOSE PROJECTED. THE FORGOING PROJECTIONS ARE BASED IN LARGE PARTS UPON US RECEIVING AND
MAINTAINING A CERTAIN LEVEL OF COAL PURCHASE FROM OUR PARENT-GUJARAT NRE COKE LIMITED. THERE CAN BE NO ASSURANCES THAT OUR PARENT WILL
PURCHASE COAL FROM US AT PROJECTED VOLUMES THROUGH FISCAL YEARS 2013 & 2014. THE FORGOING PROJECTIONS ARE BASED UPON OUR ABILITY TO
MAINTAIN CONSISTENT MINING OPERATIONS AT BOTH OF OUR MINES THROUGHOUT FISCAL YEARS 2013 & 2014. THERE CAN BE NO ASSURANCE THAT WE WILL NOT
ENCOUNTER ADVERSE GEOLOGICAL CONDITIONS OR OTHER OPERATING CONDITIONS WHICH IMPAIR OUR ABILITY TO OBTAIN THE PROJECTED PRODUCTION
LEVELS.
IT IS POSSIBLE THAT ASSUMED EVENTS, PERFORMANCE OR CIRCUMSATNCES WILL NOT MATERIALIZE, THAT ANTICIPATED EVENTS MAY NOT OCCUR OR MAY HAVE
DIFFERENT RESULTS THAN PROJECTED OR THAT AN ANTICIPATED EVENTS MAY OCCUR TO CAUSE FUTURE REVENUE, OPERATING EXPENSES AND NET CASH FLOW
TO VARY MATERIALLY FROM THE PROJECTIONS.
COMPETENT PERSON STATEMENT
The information in this Presentation that relates to Exploration Results, Mineral Resources or
Ore Reserves is based on information compiled by, in relation to the Coal Resources for both
NRE Wongawilli Colliery and NRE No.1 Mine, by Mr. Barry Clark an employee of Gujarat NRE
Coking Coal Ltd, and in relation to the Coal Reserves for both NRE Wongawilli Colliery and NRE
No.1 Mine, by Mr. Kris Markowski, also an employee of Gujarat NRE Coking Coal Ltd.
Mr. Clark is a Member of The Australasian Institute of Mining and Metallurgy or the Australian
Institute of Geoscientists. Mr. Clark has sufficient experience which is relevant to the style of
mineralization and type of deposit under consideration and to the activity which he is undertaking
to qualify as a Competent Person as defined in the 2004 Edition of the ‘Australasian Code for
Reporting of Exploration Results, Mineral Resources and Ore Reserves’. Mr. Clark consents to
the inclusion in the Presentation of the matters based on his information in the form and context
in which it appears.
Mr. Markowski is a Member of The Australasian Institute of Mining and Metallurgy or the
Australian Institute of Geoscientists. Mr. Markowski has sufficient experience which is relevant to
the style of mineralization and type of deposit under consideration and to the activity which he is
undertaking to qualify as a Competent Person as defined in the 2004 Edition of the ‘Australasian
Code for Reporting of Exploration Results, Mineral Resources and Ore Reserves’. Mr.
Markowski consents to the inclusion in the Presentation of the matters based on his information
in the form and context in which it appears.
THANK YOU 50