6.coal mining &...
TRANSCRIPT

203
6.Coal Mining & Quarrying
Coalmine at Panaji

204
6.Coal Mining & Quarrying

205
6.Coal Mining & Quarrying
6. COAL
Concepts and Definitions
Coking Coal - Coking coals are those varieties of coal which on heating in the absence of air (process known as Carbonisation) undergo transformation into plastic state, swell and then re-solidify to give a Cake. On quenching the cake results in a strong and porous mass called coke.
Primary/Medium/Semi/Week Coking Coal: Coking coal is divided into 3 sub-categories namely, Primary Coking Coal (Low ash , low Volatile, High Coking property) Medium Coking Coal (low ash, medium volatile, low caking index) and Blendable/ Semi/Weak Coking Coal (low ash, high volatile, very low caking index). Non Coking Coal These are coals with relatively lower ash and higher fixed carbon and of poor coking properties i.e. does not soften and form cake like coking coal during carbonization in the coke oven.
Coal Grades (from website of M/o Coal) The gradation of non-coking coal is based on Useful Heat Value (UHV), the gradation of
coking coal is based on ash content and for semi coking / weakly coking coal it is based on
ash plus moisture content , as in vogue as per notification.
Grades of Coking Coal
Grade Ash Content
Steel Grade –I Not exceeding 15%

206
6.Coal Mining & Quarrying
Steel Grade -II Exceeding 15% but not exceeding 18%
Washery Grade -I Exceeding 18% but not exceeding 21%
Washery Grade -II Exceeding 21% but not exceeding 24%
Washery Grade -III Exceeding 24% but not exceeding 28%
Washery Grade -IV Exceeding 28% but not exceeding 35%
Grades of Non-coking Coal
Grade Useful Heat Value (UHV)
(Kcal/Kg)
UHV= 8900-138(A+M)
Corresponding
Ash% + Moisture %
at (60% RH & 40O C)
Gross Calorific Value GCV
(Kcal/ Kg)
(at 5% moisture level)
A Exceeding 6200 Not exceeding 19.5 Exceeding 6454
B Exceeding 5600 but not
exceeding 6200
19.6 to 23.8 Exceeding 6049 but not
exceeding 6454
C Exceeding 4940 but not
exceeding 5600
23.9 to 28.6 Exceeding 5597 but not
exceeding. 6049
D Exceeding 4200 but not
exceeding 4940
28.7 to 34.0 Exceeding 5089 but not
Exceeding 5597
E Exceeding 3360 but not
exceeding 4200
34.1 to 40.0 Exceeding 4324 but not
exceeding 5089
F Exceeding 2400 but not 40.1 to 47.0 Exceeding 3865 but not

207
6.Coal Mining & Quarrying
exceeding 3360 exceeding. 4324
G Exceeding 1300 but not
exceeding 2400
47.1 to 55.0 Exceeding 3113 but not
exceeding 3865
Grades of Semi-coking and Weakly Coking Coal
Grade Ash + Moisture Content
Semi coking grade –I Not exceeding 19%
Semi coking grade –II Exceeding 19% but not exceeding 24%
Lignite – Often referred to as Brown coal is a soft brown coal with a low degree of coalification (process of formation of coal from vegetal matter). It’s gross calorific value is 5,700 Kilo calorie/kilogram or less on an ash-free but moist basis.
Coke- The solid product obtained from carbonization of coal or lignite at high temperature.
Proved Reserves A ‘Proven Mineral Reserve’ is the economically mineable part of a Measured Mineral Resource demonstrated by at least a Preliminary Feasibility Study. This Study must include adequate information on mining, processing, metallurgical, economic, and other relevant factors that demonstrate, at the time of reporting, that economic extraction is justified. Indicated Reserves An ‘Indicated Mineral Resource’ is that part of a Mineral Resource for which quantity, grade or quality, densities, shape and physical characteristics, can be estimated with a level of confidence sufficient to allow the appropriate application of technical and economic parameters, to support mine planning and evaluation of the economic viability of the deposit. The estimate is based on detailed and reliable exploration and testing information gathered through appropriate techniques from locations such as outcrops, trenches, pits, workings and drill holes that are spaced closely enough for geological and grade continuity to be reasonably assumed. Inferred Reserves An ‘Inferred Mineral Resource’ is that part of a Mineral Resource for which quantity and grade or quality can be estimated on the basis of geological evidence and limited sampling and reasonably assumed, but not verified, geological and grade continuity. The estimate is based on limited information and sampling gathered through appropriate techniques from locations such as outcrops, trenches, pits, workings and drill

208
6.Coal Mining & Quarrying
holes. Due to the uncertainty that may be attached to Inferred Mineral Resources, it cannot be assumed that all or any part of an Inferred Mineral Resource will be upgraded to an Indicated or Measured Mineral Resource as a result of continued exploration. Confidence in the estimate is insufficient to allow the meaningful application of technical and economic parameters or to enable an evaluation of economic viability worthy of public disclosure. Inferred Mineral Resources must be excluded from estimates forming the basis of feasibility or other economic studies.
Output per man-shift (OMS):- It is an indicator of labour productivity. It is defined as the average output per employee engaged for a normal work-shift. It is computed as the total output divided by total number of shifts worked by all the employees.

209
6.Coal Mining & Quarrying
6. COAL MINING AND QUARRYING
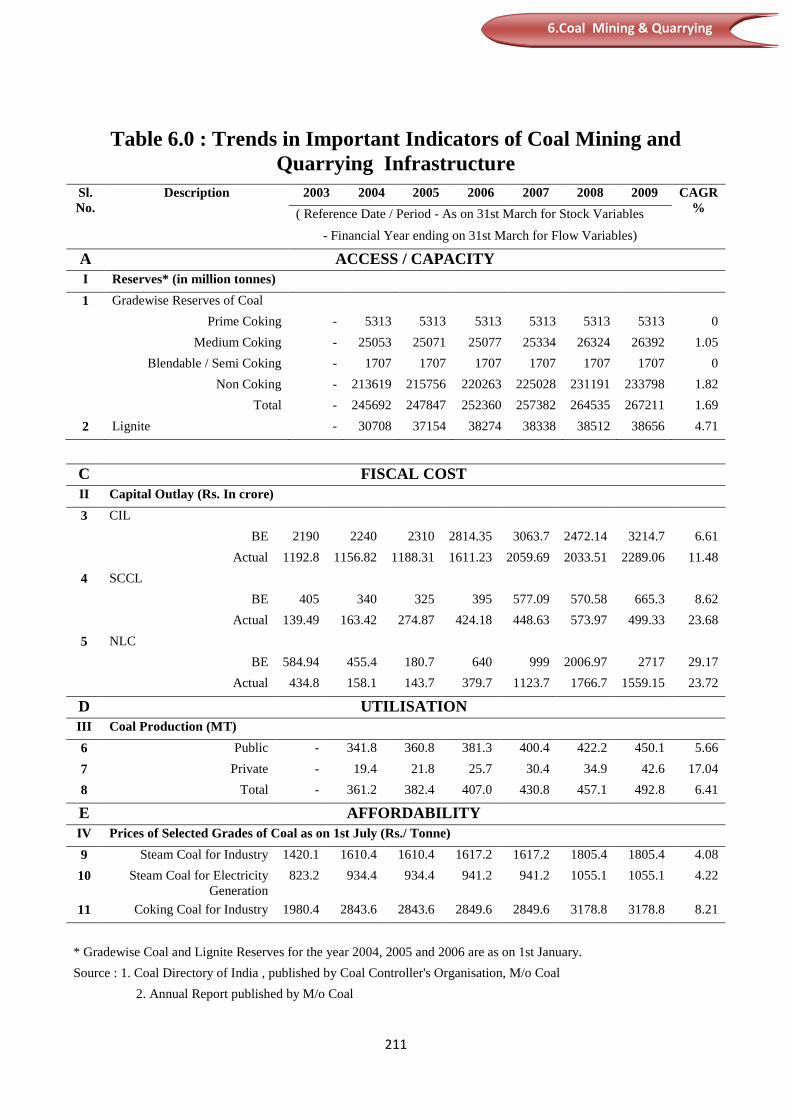
6.1 The chief data source for this sector is Coal Controller’s Organisation, in the M/o Coal. Unless otherwise stated analytical highlights given below are based on Table No. 6.0 on Trends in Important Indicators of Coal Mining and Quarrying Infrastructure.
Capacity
Reserve Capacity
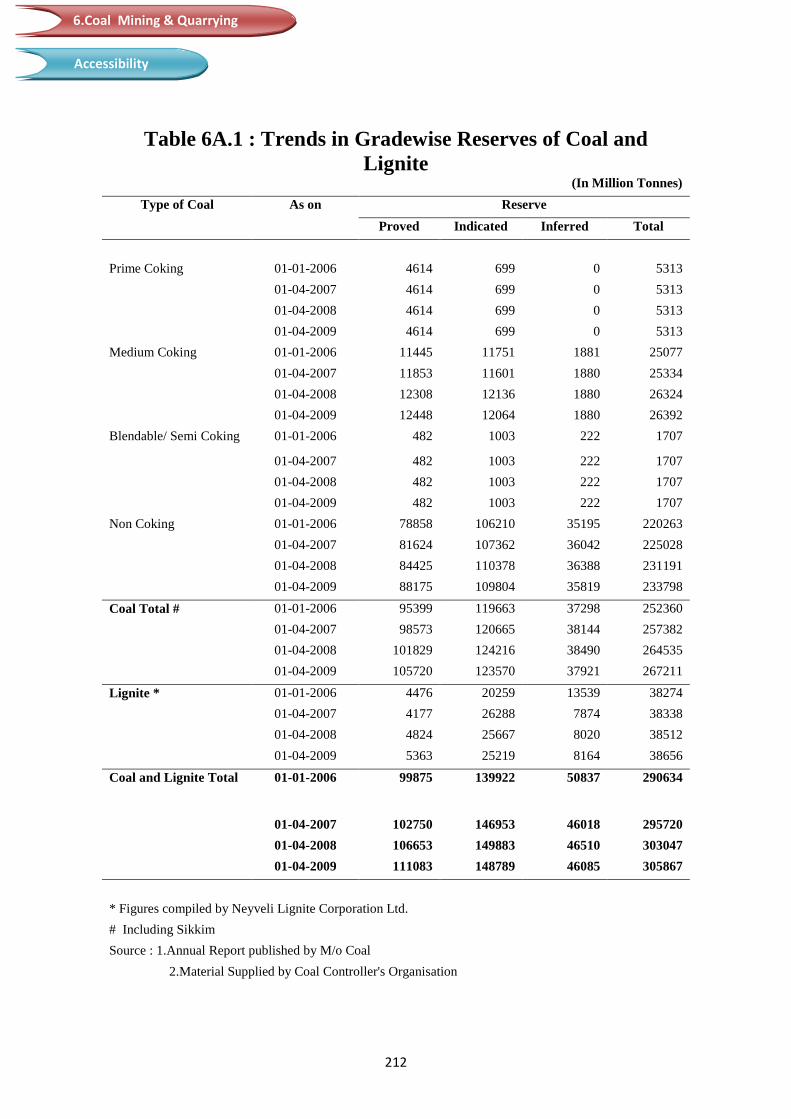
6.2 The reserve capacity for coal production increased from 246 billion tones in 2004 to 267 billion tones in 2009 showing a CAGR of 1.69% per annum. The reserve capacity for lignite production increased from 31 billion tones in 2004 to 39 billion tones in 2009 showing a CAGR of 4.71% per annum.
Developed coal mines
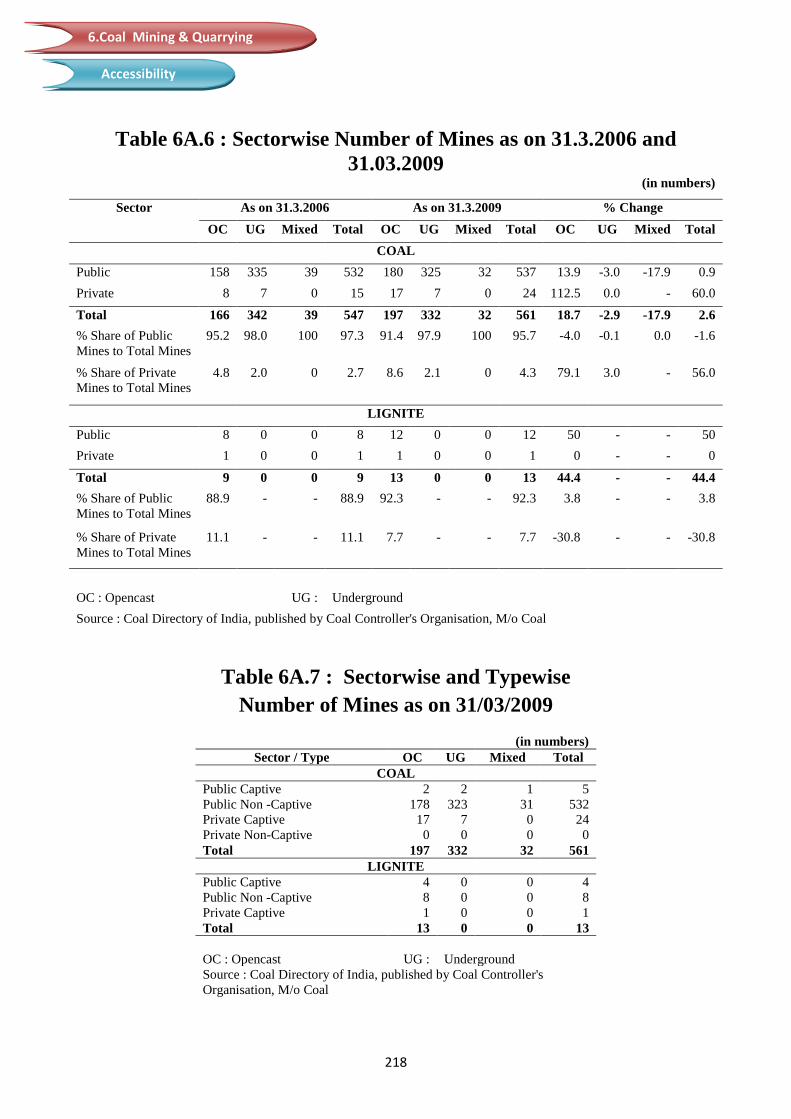
6.3 Total number of coal mines increased from 547 in 2006 to 561 in 2009. Total number of lignite mines increased from 9 in 2006 to 13 in 2009 (Table 6A.4). Share of public sector mines decreased from 97.3% in 2006 to 95.7% in 2009 for coal. But for lignite a reverse trend is seen. Share of public sector mines for lignite increased from 88.9% in 2006 to 92.3% in 2009 (Table 6A.6).
Washery Capacity
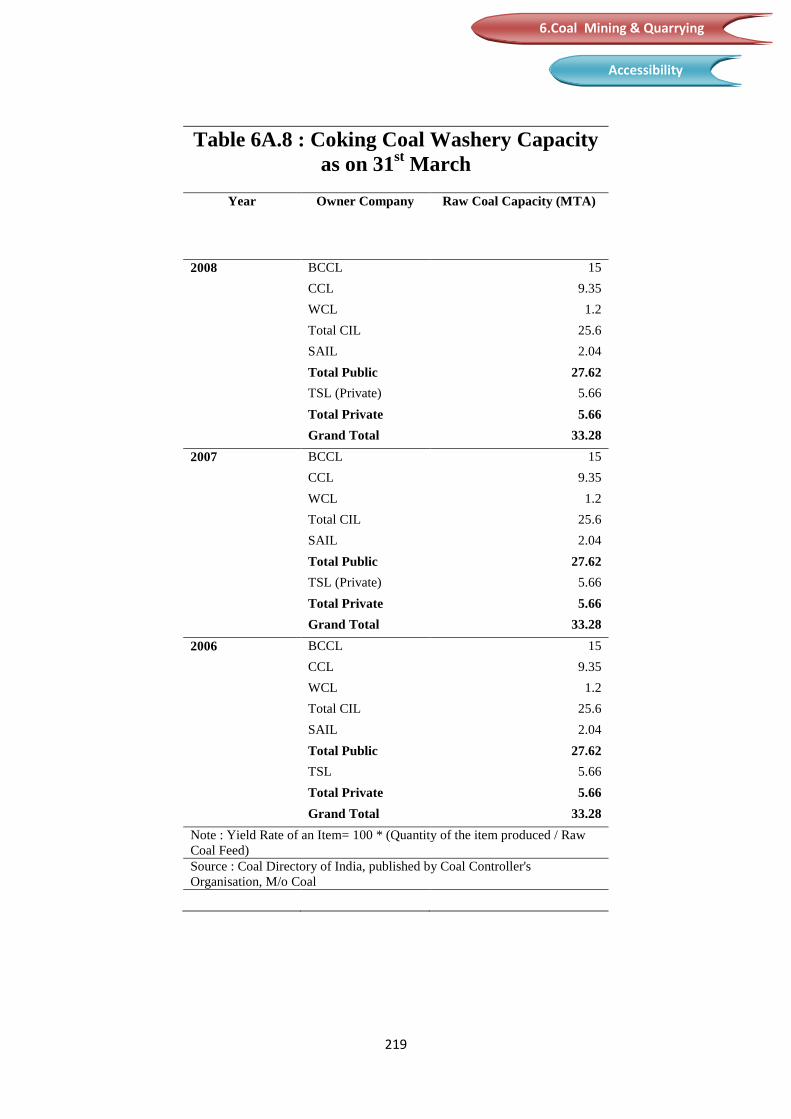
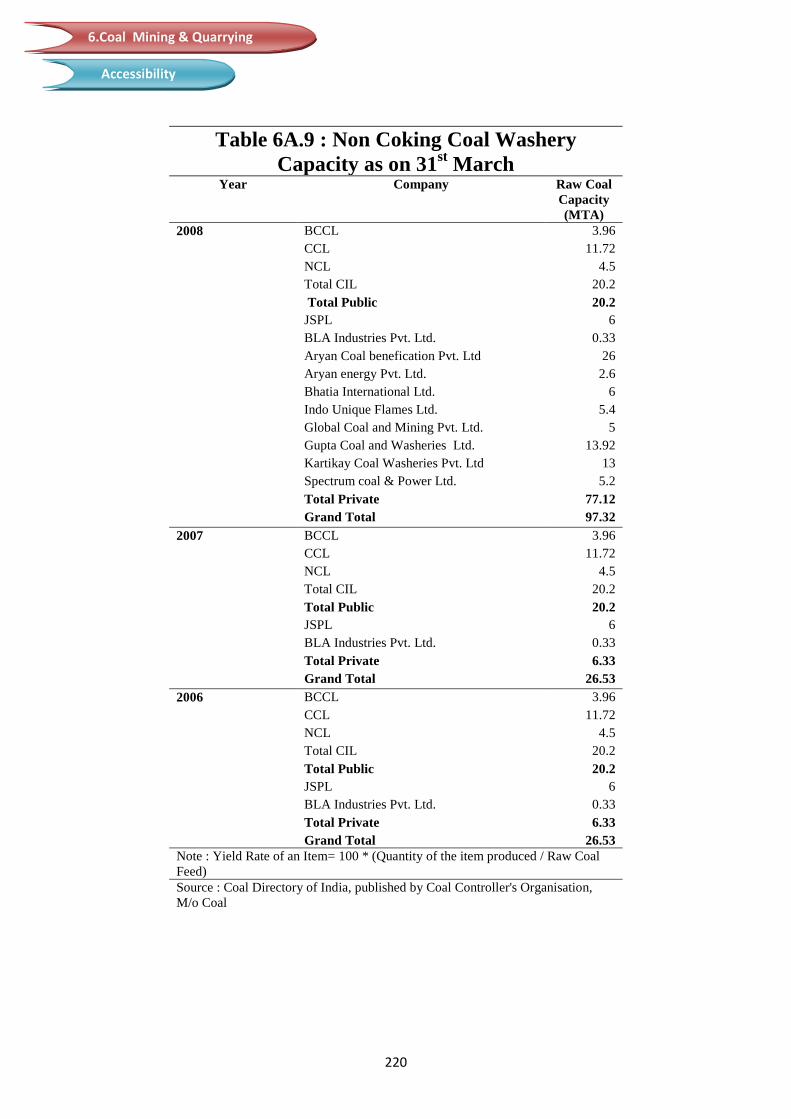
6.4 As on 31st March 2009, there is total washery capacity of 33.28 Million tones per annum(MTA) for coking coal and 97.32 MTA for non coking coal. While public sector companies have a major share(83%) in washery capacity for coking coal, private sector companies have a major share(79%) in washery capacity for non-coking coal (Table 6B.3 and 6B.4).

210
6.Coal Mining & Quarrying
Quality
6.5 Number of opencast mines is on the increase, while number of underground mines is decreasing. Number of opencast mines increased from 166 in 2006 to 197 in 2009, but number of underground mines decreased from 342 in 2006 to 332 in 2009 for coal(Table 6A.4).
Fiscal Cost
6.6 Capital outlay for CIL and SCCL shows negligible growth during 2003 to 2009. Only for NLC it shows a CAGR of 29% during the same period.
Capacity Utilisation
6.7 Total coal production is showing a CAGR of 6.41% during 2004 to 2009, while reserve capacity shows a much lower CAGR of 1.69%; indicating that after some time there may be depletion in reserve capacity. Presently production rate is 0.2% of the reserve capacity. It implies that at the present growth rates of production (extraction) and reserve capacity present reserves should last for less than 500 years.
Affordability
6.8 Price of steam coal for electricity generation increased from `823 per tonne in 2003 to `1055 per tonne in 2009 showing a CAGR of 4.22%.
211
6.Coal Mining & Quarrying
Table 6.0 : Trends in Important Indicators of Coal Mining and Quarrying Infrastructure
Sl. No.
Description 2003 2004 2005 2006 2007 2008 2009 CAGR % ( Reference Date / Period - As on 31st March for Stock Variables
- Financial Year ending on 31st March for Flow Variables)
A ACCESS / CAPACITY I Reserves* (in million tonnes) 1 Gradewise Reserves of Coal Prime Coking - 5313 5313 5313 5313 5313 5313 0 Medium Coking - 25053 25071 25077 25334 26324 26392 1.05 Blendable / Semi Coking - 1707 1707 1707 1707 1707 1707 0 Non Coking - 213619 215756 220263 225028 231191 233798 1.82 Total - 245692 247847 252360 257382 264535 267211 1.69
2 Lignite - 30708 37154 38274 38338 38512 38656 4.71
C FISCAL COST II Capital Outlay (Rs. In crore) 3 CIL BE 2190 2240 2310 2814.35 3063.7 2472.14 3214.7 6.61 Actual 1192.8 1156.82 1188.31 1611.23 2059.69 2033.51 2289.06 11.48
4 SCCL BE 405 340 325 395 577.09 570.58 665.3 8.62 Actual 139.49 163.42 274.87 424.18 448.63 573.97 499.33 23.68
5 NLC BE 584.94 455.4 180.7 640 999 2006.97 2717 29.17 Actual 434.8 158.1 143.7 379.7 1123.7 1766.7 1559.15 23.72
D UTILISATION III Coal Production (MT) 6 Public - 341.8 360.8 381.3 400.4 422.2 450.1 5.66 7 Private - 19.4 21.8 25.7 30.4 34.9 42.6 17.04 8 Total - 361.2 382.4 407.0 430.8 457.1 492.8 6.41
E AFFORDABILITY IV Prices of Selected Grades of Coal as on 1st July (Rs./ Tonne) 9 Steam Coal for Industry 1420.1 1610.4 1610.4 1617.2 1617.2 1805.4 1805.4 4.08 10 Steam Coal for Electricity
Generation 823.2 934.4 934.4 941.2 941.2 1055.1 1055.1 4.22
11 Coking Coal for Industry 1980.4 2843.6 2843.6 2849.6 2849.6 3178.8 3178.8 8.21
* Gradewise Coal and Lignite Reserves for the year 2004, 2005 and 2006 are as on 1st January. Source : 1. Coal Directory of India , published by Coal Controller's Organisation, M/o Coal 2. Annual Report published by M/o Coal
212
6.Coal Mining & Quarrying
Accessibility
Table 6A.1 : Trends in Gradewise Reserves of Coal and Lignite
(In Million Tonnes) Type of Coal As on Reserve
Proved Indicated Inferred Total Prime Coking 01-01-2006 4614 699 0 5313 01-04-2007 4614 699 0 5313 01-04-2008 4614 699 0 5313 01-04-2009 4614 699 0 5313 Medium Coking 01-01-2006 11445 11751 1881 25077 01-04-2007 11853 11601 1880 25334 01-04-2008 12308 12136 1880 26324 01-04-2009 12448 12064 1880 26392 Blendable/ Semi Coking 01-01-2006 482 1003 222 1707
01-04-2007 482 1003 222 1707 01-04-2008 482 1003 222 1707 01-04-2009 482 1003 222 1707 Non Coking 01-01-2006 78858 106210 35195 220263 01-04-2007 81624 107362 36042 225028 01-04-2008 84425 110378 36388 231191 01-04-2009 88175 109804 35819 233798
Coal Total # 01-01-2006 95399 119663 37298 252360 01-04-2007 98573 120665 38144 257382 01-04-2008 101829 124216 38490 264535 01-04-2009 105720 123570 37921 267211
Lignite * 01-01-2006 4476 20259 13539 38274 01-04-2007 4177 26288 7874 38338 01-04-2008 4824 25667 8020 38512 01-04-2009 5363 25219 8164 38656
Coal and Lignite Total 01-01-2006 99875 139922 50837 290634
01-04-2007 102750 146953 46018 295720 01-04-2008 106653 149883 46510 303047 01-04-2009 111083 148789 46085 305867 * Figures compiled by Neyveli Lignite Corporation Ltd. # Including Sikkim Source : 1.Annual Report published by M/o Coal 2.Material Supplied by Coal Controller's Organisation

213
6.Coal Mining & Quarrying
Accessibility
Table 6A.2 : Trends in Statewise Reserves of Coal (In Million Tonnes)
State As on Coal Reserves Proved Indicated Inferred Total
Andhra Pradesh 01-01-2006 8403 6158 2585 17146 01-04-2007 8791 6266 2658 17715 01-04-2008 9007 6711 2979 18697 01-04-2009 9194 6748 2985 18927 Arunachal Pradesh 01-01-2006 31 40 19 90 01-04-2007 31 40 19 90 01-04-2008 31 40 19 90 01-04-2009 31 40 19 90 Assam 01-01-2006 0 3 0 3 01-04-2007 0 3 0 3 01-04-2008 0 3 0 3 01-04-2009 0 3 0 3 Jharkhand 01-01-2006 36148 31411 6338 73897 01-04-2007 36960 31094 6338 74392 01-04-2008 37493 31629 6338 75460 01-04-2009 39479 30894 6338 76711 Bihar 01-01-2006 0 0 160 160 01-04-2007 0 0 160 160 01-04-2008 0 0 160 160 01-04-2009 0 0 160 160 Madhya Pradesh 01-01-2006 7566 9258 2934 19758 01-04-2007 7842 9723 2782 20347 01-04-2008 7896 9882 2782 20560 01-04-2009 8041 10295 2645 20981 Chhattisgarh 01-01-2006 9570 27433 4439 41442 01-04-2007 9973 27035 4443 41451 01-04-2008 10419 29272 4443 44134 01-04-2009 10911 29192 4381 44483 Maharashtra 01-01-2006 4652 2432 1992 9076 01-04-2007 4856 2822 1992 9670 01-04-2008 5004 2822 1992 9818 01-04-2009 5255 2907 1992 10155 Meghalaya 01-01-2006 118 41 301 460 01-04-2007 118 41 301 460 01-04-2008 89 70 301 460 01-04-2009 89 17 471 577 Nagaland 01-01-2006 4 1 15 20 01-04-2007 3 1 15 19 01-04-2008 3 1 15 19 01-04-2009 9 0 13 22

214
6.Coal Mining & Quarrying
Accessibility
Table 6A.2 (contd.) : Trends in Statewise Reserves of Coal (In Million Tonnes)
State As on Coal Reserves Proved Indicated Inferred Total
Orissa 01-01-2006 16911 30793 14297 62001 01-04-2007 17465 31455 14314 63234 01-04-2008 19222 31728 14314 65264 01-04-2009 19944 31484 13799 65227 Sikkim 01-01-2006 - - - - 01-04-2007 - - - -
01-04-2008 0 58 43 101
01-04-2009 0 58 43 101 Uttar Pradesh 01-01-2006 766 296 0 1062 01-04-2007 766 296 0 1062 01-04-2008 766 296 0 1062 01-04-2009 766 296 0 1062 West Bengal 01-01-2006 11383 11879 4553 27815 01-04-2007 11454 11810 5071 28335 01-04-2008 11584 11680 5071 28335 01-04-2009 11653 11603 5071 28327
India 01-01-2006 95867 119769 37667 253303 01-04-2007 98573 120665 38144 257382 01-04-2008 101829 124216 38490 264535 01-04-2009 105720 123570 37921 267211 Note : Data may not add up to respective total due to rounding off. Source : Material supplied by Coal Controller's Organisation

215
6.Coal Mining & Quarrying
Accessibility
Table 6A.3 : Trends in Statewise Reserves of Lignite (In Million Tonnes)
State As on Lignite Reserves Proved Indicated Inferred Total
Gujarat 01-01-2006 1084.44 259.40 1318.91 2662.75 01-04-2007 785.27 259.40 1618.08 2662.75 01-04-2008 785.27 259.40 1618.08 2662.75 01-04-2009 785.27 259.40 1618.08 2662.75 Jammu & Kashmir 01-01-2006 0 20.25 7.30 27.55 01-04-2007 0 20.25 7.30 27.55 01-04-2008 0 20.25 7.30 27.55 01-04-2009 0 20.25 7.30 27 Kerala 01-01-2006 0 0 9.65 9.65 01-04-2007 0 0 9.65 9.65 01-04-2008 0 0 9.65 9.65 01-04-2009 0 0 9.65 9.65 Puducherry 01-01-2006 - - - - 01-04-2007 0 405.61 11 416.61 01-04-2008 0 405.61 11 416.61 01-04-2009 0 405.61 11 416.61 Rajasthan 01-01-2006 560.91 2620.60 1053.84 4235.35 01-04-2007 560.91 2620.60 1129.92 4311.43 01-04-2008 639.69 2568.30 1276.84 4484.83 01-04-2009 842.13 2327.78 1384.14 4554.05 Tamil Nadu 01-01-2006 2831 17359.15 11148.98 31339.13 01-04-2007 2831 23387.42 5108 31327.02 01-04-2008 3399.39 22819.03 5108.60 31327.02 01-04-2009 3735.23 22521.93 5144.65 31401.81 West Bengal 01-01-2006 - - - - 01-04-2007 0 0.29 0.86 1.15 01-04-2008 0 0.29 0.86 1.15 01-04-2009 0 0.29 0.86 1.15 India 01-01-2006 4476.35 20259.4 13538.68 38274.43 01-04-2007 4177.18 26287.67 7873.55 38338.4 01-04-2008 4824.35 25666.98 8020.47 38511.8 01-04-2009 5362.63 25129.36 8163.82 38655.81 Source : Material supplied by Coal Controller's Organisation

216
6.Coal Mining & Quarrying
Accessibility
Table 6A.4 : Companywise Number of Opencast and Underground Mines as on 31.3.2006 and 31.3.2009
(in number) Sl. No. Company As on 31.3.2006 As on 31.3.2009 % Change
OC UG Mixed Total OC UG Mixed Total OC UG Mixed Total COAL
1 ECL 20 88 5 113 21 82 7 110 5 -6.8 40.0 -2.7 2 BCCL 14 50 21 85 18 47 17 82 28.6 -6.0 -19.0 -3.5 3 CCL 33 22 4 59 36 24 2 62 9.1 9.1 -50.0 5.1 4 NCL 8 0 0 8 10 0 0 10 25.0 - - 25.0 5 WCL 35 42 6 83 39 43 4 86 11.4 2.4 -33.3 3.6 6 SECL 19 70 1 90 21 69 1 91 10.5 -1.4 0 1.1 7 MCL 13 9 0 22 15 9 0 24 15.4 0 - 9.1 8 NEC 2 3 0 5 3 5 0 8 50 66.7 - 60.0 9 CIL 144 284 37 465 163 279 31 473 13.2 -1.8 -16.2 1.7 10 SCCL 11 46 0 57 13 37 0 50 18.2 -
19.6 -12.3
11 JSMDCL 1 0 0 1 1 0 0 1 0 - - 0 12 DVC 1 0 0 1 1 0 0 1 0 - - 0 13 IISCO 0 1 2 3 1 2 1 4 - 100 -50.0 33.3 14 JKML 0 4 0 4 0 7 0 7 - 75.0 75.0 15 BECML 1 0 0 1 1 0 0 1 0 - - 0 16 ICML 1 0 0 1 1 0 0 1 0 - - 0 17 JSPL 1 0 0 1 1 0 0 1 0 - - 0 18 HIL 1 0 0 1 1 0 0 1 0 - - 0 19 TSL - - - - 3 5 0 8 - - - - 20 MIL 0 1 0 1 0 1 0 1 - 0 - 0 21 BLA 0 1 0 1 1 0 0 1 - -
100 - 0
22 CML 1 0 0 1 1 0 0 1 0 - - 0 23 PANEM 1 0 0 1 1 0 0 1 0 - - 0 24 PIL - - - - 1 0 0 1 - - - - 25 JNL - - - - 1 0 0 1 - - - - 26 JPL - - - - 1 0 0 1 - - - - 27 SIL - - - - 0 1 0 1 - - - - 28 APMDTCL - - - - 1 0 0 1 - - - - 29 UML - - - - 1 0 0 1 - - - - 30 KEMTA - - - - 1 0 0 1 - - - - 31 ESCL - - - - 1 0 0 1 - - - - 32 SEML - - - - 1 0 0 1 - - - - 33 TISCO 3 5 0 8 -100 -
100 - -100
Total 166 342 39 547 197 332 32 561 18.7 -2.9 -17.9 2.6 LIGNITE
1 NLC 3 0 0 3 3 0 0 3 0 - - 0 2 GMDCL 3 0 0 3 5 0 0 5 66.7 - - 66.7 3 GIPCL 1 0 0 1 1 0 0 1 0 - - 0 4 GHCL 0 0 1 0 0 1 - - - 5 RSMML 2 0 0 2 3 0 0 3 50 - - 50
Total 9 0 0 9 13 0 0 13 44.4 - - 44.4 OC : Opencast UG : Underground Source : Coal Directory of India, published by Coal Controller's Organisation, M/o Coal

217
6.Coal Mining & Quarrying
Accessibility
Table 6A.5 : Statewise Number of Opencast and Underground Mines as on 31.3.2006 and 31.3.2009
(in number) Sl. No.
State As on 31.3.2006 As on 31.3.2009 % Change OC UG Mixed Total OC UG Mixed Total OC UG Mixed Total
COAL 1 Andhra Pradesh 11 46 0 57 13 37 0 50 18.2 -19.6 - -12.3 2 Arunachal
Pradesh 2 3 0 5 1 0 0 1 -50.0 -
100.0 - -80.0
3 Assam 12 42 1 55 3 5 0 8 -75.0 -88.1 -100.0 -85.5 4 Chhattisgarh 0 4 0 4 18 42 1 61 - 950.0 - 1425.0 5 Jammu &
Kashmir 60 86 27 173 0 7 0 7 -
100.0 -91.9 -100.0 -96.0
6 Jharkhand 18 51 5 74 68 84 21 173 277.8 64.7 320.0 133.8 7 Madhya Pradesh 29 21 1 51 21 50 4 75 -27.6 138.1 300.0 47.1 8 Maharashtra 0 0 0 0 33 22 0 55 - - - 9 Orissa 14 9 0 23 16 9 0 25 14.3 0.0 - 8.7 10 Uttar Pradesh 4 0 0 4 5 0 0 5 25.0 - - 25.0 11 West Bengal 16 80 5 101 19 76 6 101 18.8 -5.0 20.0 0.0 Total 166 342 39 547 197 332 32 561 18.7 -2.9 -17.9 2.6
LIGNITE 1 Gujarat 4 0 0 4 7 0 0 7 75 - - 75 2 Rajasthan 2 0 0 2 3 0 0 3 50 - - 50 3 Tamil Nadu 3 0 0 3 3 0 0 3 0 - - 0 Total 9 0 0 9 13 0 0 13 44.4 - - 44.4 OC : Opencast UG
: Underground
Source : Coal Directory of India, published by Coal Controller's Organisation, M/o Coal
218
6.Coal Mining & Quarrying
Accessibility
Table 6A.6 : Sectorwise Number of Mines as on 31.3.2006 and 31.03.2009
(in numbers)
Sector As on 31.3.2006 As on 31.3.2009 % Change OC UG Mixed Total OC UG Mixed Total OC UG Mixed Total
COAL Public 158 335 39 532 180 325 32 537 13.9 -3.0 -17.9 0.9 Private 8 7 0 15 17 7 0 24 112.5 0.0 - 60.0
Total 166 342 39 547 197 332 32 561 18.7 -2.9 -17.9 2.6 % Share of Public Mines to Total Mines
95.2 98.0 100 97.3 91.4 97.9 100 95.7 -4.0 -0.1 0.0 -1.6
% Share of Private Mines to Total Mines
4.8 2.0 0 2.7 8.6 2.1 0 4.3 79.1 3.0 - 56.0
LIGNITE Public 8 0 0 8 12 0 0 12 50 - - 50 Private 1 0 0 1 1 0 0 1 0 - - 0
Total 9 0 0 9 13 0 0 13 44.4 - - 44.4 % Share of Public Mines to Total Mines
88.9 - - 88.9 92.3 - - 92.3 3.8 - - 3.8
% Share of Private Mines to Total Mines
11.1 - - 11.1 7.7 - - 7.7 -30.8 - - -30.8
OC : Opencast UG : Underground Source : Coal Directory of India, published by Coal Controller's Organisation, M/o Coal
Table 6A.7 : Sectorwise and Typewise Number of Mines as on 31/03/2009
(in numbers) Sector / Type OC UG Mixed Total
COAL Public Captive 2 2 1 5 Public Non -Captive 178 323 31 532 Private Captive 17 7 0 24 Private Non-Captive 0 0 0 0 Total 197 332 32 561
LIGNITE Public Captive 4 0 0 4 Public Non -Captive 8 0 0 8 Private Captive 1 0 0 1 Total 13 0 0 13 OC : Opencast UG : Underground Source : Coal Directory of India, published by Coal Controller's Organisation, M/o Coal
219
6.Coal Mining & Quarrying
Accessibility
Table 6A.8 : Coking Coal Washery Capacity as on 31st March
Year Owner Company Raw Coal Capacity (MTA)
2008 BCCL 15 CCL 9.35 WCL 1.2 Total CIL 25.6 SAIL 2.04 Total Public 27.62 TSL (Private) 5.66 Total Private 5.66 Grand Total 33.28 2007 BCCL 15 CCL 9.35 WCL 1.2 Total CIL 25.6 SAIL 2.04 Total Public 27.62 TSL (Private) 5.66 Total Private 5.66 Grand Total 33.28 2006 BCCL 15 CCL 9.35 WCL 1.2 Total CIL 25.6 SAIL 2.04 Total Public 27.62 TSL 5.66 Total Private 5.66 Grand Total 33.28 Note : Yield Rate of an Item= 100 * (Quantity of the item produced / Raw Coal Feed) Source : Coal Directory of India, published by Coal Controller's Organisation, M/o Coal
220
6.Coal Mining & Quarrying
Accessibility
Table 6A.9 : Non Coking Coal Washery Capacity as on 31st March
Year Company Raw Coal Capacity (MTA)
2008 BCCL 3.96 CCL 11.72 NCL 4.5 Total CIL 20.2 Total Public 20.2 JSPL 6 BLA Industries Pvt. Ltd. 0.33 Aryan Coal benefication Pvt. Ltd 26 Aryan energy Pvt. Ltd. 2.6 Bhatia International Ltd. 6 Indo Unique Flames Ltd. 5.4 Global Coal and Mining Pvt. Ltd. 5 Gupta Coal and Washeries Ltd. 13.92 Kartikay Coal Washeries Pvt. Ltd 13 Spectrum coal & Power Ltd. 5.2 Total Private 77.12 Grand Total 97.32 2007 BCCL 3.96 CCL 11.72 NCL 4.5 Total CIL 20.2 Total Public 20.2 JSPL 6 BLA Industries Pvt. Ltd. 0.33 Total Private 6.33 Grand Total 26.53 2006 BCCL 3.96 CCL 11.72 NCL 4.5 Total CIL 20.2 Total Public 20.2 JSPL 6 BLA Industries Pvt. Ltd. 0.33 Total Private 6.33 Grand Total 26.53 Note : Yield Rate of an Item= 100 * (Quantity of the item produced / Raw Coal Feed) Source : Coal Directory of India, published by Coal Controller's Organisation, M/o Coal

221
6.Coal Mining & Quarrying
Fiscal Cost
Table 6C.1 : Capital Outlay for the XI Plan Period and for 2007-08 to 2009-10
(Rs.in crore) Company XI Plan
proposed by M/o Coal
2007-08 (BE)
2007-08 (Actual)
2008-09 (BE)
2008-09 (Actual)
2009-10 (BE)
CIL 17390.07 2472.14 2033.51 3214.70 2289.06 2900.00 SCCL 3340.30 570.58 573.97 665.30 499.33 580.57 NLC 15044.00 2006.97 1766.71 2717.00 1559.15 1893.84 Sub-Total (Coal PSUs) 35774.37 5049.69 4374.19 6597.00 4347.54 5374.41 Departmental Schemes Science & Technology 100.00 22.54 12.86 10.00 10.00 20.00 Regional Exploration 383.50 63.59 34.99 30.00 30.00 30.39 Detailed Drilling 893.89 104.50 40.00 60.00 15.00 60.00 Env. Mgmt & Subsidence Ctrl. 4642.88 31.12 17.99 10.00 9.90 15.00 Conservation & Safety in Coal Mines
692.95 0.01 150.38 135.00 132.00 135.00
Development of Transport Infrastructure in coal field areas
972.65 0.01 23.58 21.80 0 22.00
Coal Controller's Office 1.13 0.23 0.19 0.20 0.21 0.31 IT 15.00 3.00 0.03 3.00 0 3.00 North-Eastern Region 0 25 0 30.00 0 14.30 Sub-Total Departmental Schemes
7702.00 250.00 280.02 300.00 197.11 300.00
Grand Total (MoC) 43476.37 5299.69 4654.21 6897.00 4544.65 5674.41 Source : Annual Report, published by M/o Coal

222
6.Coal Mining & Quarrying
Utilisation
Table 6D.1 : Coking Coal Washery Performance (2006-07 to 2008-09)
(in thousand tonnes) Year Owner Company Raw Coal
Feed Washed
Coal Production
Capacity Utilization
(%)
Yield (%) Washed
Coal
2008-09 BCCL 3314 1605 22.09 48.4 CCL 3512 1709 37.56 48.7 WCL 698 366 58.17 52.4 Total CIL 7524 3680 29.39 48.9 SAIL 748 577 36.67 77.1 Total Public 8272 4257 29.95 51.5 TSL (Private) 6983 2925 123.37 41.9 Total Private 6983 2925 123.37 41.9 Grand Total 15255 7182 45.84 47.1 2007-08 BCCL 3177.2 1662 21.18 52.3 CCL 4138 1838 44.26 44.4 WCL 690 331 57.50 48 Total CIL 8005.2 3831 31.27 47.9 SAIL 844.4 514.2 41.39 60.9 Total Public 8849.6 4345.2 32.04 49.1 TSL (Private) 7195.3 2825.7 127.13 39.3 Total Private 7195.3 2825.7 127.13 39.3 Grand Total 16044.9 7170.9 48.21 44.7 2006-07 BCCL 3129.1 1660.4 20.86 53.1 CCL 4200 1825 44.92 43.5 WCL 673 327 56.08 48.6 Total CIL 8002.1 3812.4 31.26 47.6 SAIL 383.1 22.1 18.78 59 Total Public 8385.2 4038.5 30.36 48.2 TSL 7062.5 2986.6 124.78 42.3 Total Private 7062.5 2986.6 124.78 42.3 Grand Total 15447.7 7025.1 46.42 45.5 Note : Yield Rate of an Item = 100 * (Quantity of the item produced / Raw Coal
F d) Capacity Utilization = (Raw Coal feed/Washery Capacity)*100 Source : Coal Directory of India, published by Coal Controller's Organisation, M/o
C l

223
6.Coal Mining & Quarrying
Fiscal Cost
Table 6D.2: Performance of Non Coking Coal Washery Owned by Collieries (2006-07 to 2008-09)
(in thousand tonnes) Year Company Raw Coal
Feed Production Capacity
Utilization (%)
Yield (%)
2008-09 BCCL 1143 987 28.86 86.4 CCL 8108 6558 69.18 80.9 NCL 3465 2961 77.00 85.5 Total CIL 12716 10506 62.95 82.6 Total Public 12716 10506 62.95 82.6 JSPL 4914 1606 81.90 32.7 BLA Industries Pvt. Ltd. 235 230 71.21 97.9 Aryan Coal benefication Pvt. Ltd 20280.7 15112.7 78.00 74.5 Aryan energy Pvt. Ltd. 932.6 723.8 35.87 77.6 Bhatia International Ltd. 1414.9 1162.8 23.58 82.2 Indo Unique Flames Ltd. 443.7 365.9 8.22 82.5 Global Coal and Mining Pvt. Ltd. 1746.2 1315 34.92 75.3 Gupta Coal and Washeries Ltd. 5662 4594.7 40.68 81.1 Kartikay Coal Washeries Pvt. Ltd 302 257 2.32 85.1 Spectrum coal & Power Ltd. 5767 5078 110.90 88.1 Total Private 41698.1 30445.9 54.07 73 Grand Total 54414.1 40951.9 55.91 75.3 2007-08 BCCL 891 788 22.50 88.4 CCL 8000 6595 68.26 82.4 NCL 3252 3071 72.27 94.4 Total CIL 12143 10454 60.11 86.1 Total Public 12143 10454 60.11 86.1 JSPL 5909 1916 98.48 32.4 BLA Industries Pvt. Ltd. 325 316 98.48 97.2 Total Private 6234 2232 98.48 35.8 Grand Total 18377 12686 69.27 69 2006-07 BCCL 1220 1056.9 30.81 86.6 CCL 8213 6676 70.08 81.3 NCL 2940 2581 65.33 87.8 Total CIL 12373 10313.9 61.25 83.4 Total Public 12373 10313.9 61.25 83.4 JSPL 5904 2163 98.40 36.6 BLA Industries Pvt. Ltd. 219 211.4 66.36 96.1 Total Private 6123.8 2374.4 96.74 38.8 Grand Total 18496.8 12688.3 69.72 68.6 Note : Yield Rate of an Item = 100 * (Quantity of the item produced / Raw Coal Feed) Capacity utilisation = (raw Coal feed/Washery Capacity ) *100 Source : Coal Directory of India, published by Coal Controller's Organisation, M/o
Coal

224