impacts of urban development and climate change in...
TRANSCRIPT

General rights Copyright and moral rights for the publications made accessible in the public portal are retained by the authors and/or other copyright owners and it is a condition of accessing publications that users recognise and abide by the legal requirements associated with these rights.
• Users may download and print one copy of any publication from the public portal for the purpose of private study or research. • You may not further distribute the material or use it for any profit-making activity or commercial gain • You may freely distribute the URL identifying the publication in the public portal
If you believe that this document breaches copyright please contact us providing details, and we will remove access to the work immediately and investigate your claim.
Downloaded from orbit.dtu.dk on: Jun 13, 2018
Impacts of urban development and climate change in exposing cities to pluvialflooding
Kaspersen, Per Skougaard; Drews, Martin; Arnbjerg-Nielsen, Karsten; Madsen, Henrik
Publication date:2016
Document VersionPublisher's PDF, also known as Version of record
Link back to DTU Orbit
Citation (APA):Kaspersen, P. S., Drews, M., Arnbjerg-Nielsen, K., & Madsen, H. (2016). Impacts of urban development andclimate change in exposing cities to pluvial flooding. Technical University of Denmark (DTU).

Impacts of urban development and climate change in exposing cities to pluvial flooding
Per Skougaard Kaspersen
PhD Thesis April 2016
DTU Management Department of Management Engineering
Systems Analysis Division Technical University of Denmark

i
Preface The research presented in this PhD thesis was carried out at the Department of Management
Engineering at the Technical university of Denmark (DTU) and was supervised by Senior Researcher
Martin Drews (DTU Management), Professor Karsten Arnbjerg-Nielsen (DTU Environment) and
Professor Henrik Madsen (DHI). The PhD project was funded by the Department of Management
Engineering and completed in the period December 2012 to April 2016.
The PhD project takes the form of a paper-based thesis produced in accordance with the guidelines of
the Technical University of Denmark. It consists of an extended summary followed by six scientific
publications (see below). The summary introduces the research area and highlights and discusses the
main findings of the scientific publications.
I. Kaspersen, P., Fensholt, R., Drews, M. 2015. Using Landsat Vegetation Indices to Estimate
Impervious Surface Fractions for European Cities. Remote Sensing 7, 8224–8249.
doi:10.3390/rs70608224
II. Skougaard Kaspersen, P., Høegh Ravn, N., Arnbjerg-Nielsen, K., Madsen, H., Drews, M. 2015.
Influence of urban land cover changes and climate change for the exposure of European cities to
flooding during high-intensity precipitation. Proceedings of the International Association of
Hydrological Sciences (PIAHS), Volume 370, 21–27. doi:10.5194/piahs-370-21-2015
III. Skougaard Kaspersen, P., Høegh Ravn, N., Arnbjerg-Nielsen, K., Madsen, H., Drews, M.
Comparison of the impacts of urban development and climate change for the exposure of
European cities to pluvial flooding, Manuscript in preparation for Hydrology and Earth System
Sciences (HESS). (To be submitted May 2016).
IV. Halsnæs, K., Kaspersen, P., Drews, M. 2015. Key drivers and economic consequences of high‑end
climate scenarios: uncertainties and risks. Climate Research. 64, 85–98. doi:10.3354/cr01308
V. Skougaard Kaspersen, P., Halsnæs, K. Integrated climate change risk assessment for localized
extreme precipitation, Environmental Management, Springer, in review.
VI. Halsnæs, K., Kaspersen, P.S., Trærup, S. 2016. Climate Change Risks – Methodological Framework
and Case Study of Damages from Extreme Events in Cambodia, in: Uitto, J.I., Shaw, R. (Eds.),
Sustainable Development and Disaster Risk Reduction. Springer Japan, Tokyo, pp. 71–85.

ii
Acknowledgements First and foremost I would like to thank my supervisors, Martin Drews, Karsten Arnbjerg-Nielsen and
Henrik Madsen, for supporting me and guiding me in the right direction with regard to the scientific
content of my publications. Special thanks also go to Nanna Høegh-Ravn (LNH Water) and Rasmus
Fensholt (University of Copenhagen) for assisting me in improving my understanding of the technical
and theoretical concepts of urban flood modelling and remote-sensing techniques.
Professor Kirsten Halsnæs (DTU Management) has provided endless moral support, convincing me
that I was on the right track throughout my more than three years of PhD studies.
Nina Donna Sto. Domingo and Jakob Luchner from DHI likewise deserve my appreciation for always
taking the time to answer my more or less qualified questions concerning the MIKE 21 overland flow
model and extreme value analysis.
Finally the biggest gratitude goes to Julie and Magne for clearing my head by keeping me occupied
elsewhere during the hours where I was not working on my PhD, and for allowing me to work extra
during the weekends and evenings when it was needed.

iii
Summary Urban areas are characterized by very high concentrations of people and economic activities and are
thus particularly vulnerable to flooding during extreme precipitation. Urban development and climate
change are among the key drivers of changes in the exposure of cities to the occurrence and impacts
of pluvial flooding. Cities are often dominated by large areas of impervious surfaces, that is, man-made
sealed surfaces which water cannot penetrate, and increases in these – for example, as a consequence
of urban development – can cause elevated run-off volumes and flood levels during precipitation.
Climate change is expected to affect the intensity and frequency of extreme precipitation, with
increases projected for many regions, including most parts of Europe.
The main objective of this thesis is to improve our understanding of the dual importance of urban
development and climate change in exposing cities to pluvial flooding. Increased knowledge of these
phenomena will enable local and national decision-makers to prioritize efficiently between different
adaptation measures and mitigation strategies when planning the climate-proofing of cities in the
future.
The high complexity of urban environments, where many different land use and cover types are
present within short distances, poses a challenge for mapping at finer scales. For many applications,
satellite-based remote-sensing techniques provide superior coverage of urban areas and facilitate the
systematic, accurate and resource-efficient mapping of urban land cover and changes to it over time.
Since many European cities are almost exclusively characterized by a combination of impervious
surfaces and green vegetation, information on vegetation cover from remote sensors can be utilized to
provide estimates of the quantity and spatial distribution of impervious surfaces. In this work for
example vegetation cover, as measured using Landsat satellite imagery, is found to provide accurate
estimates of subpixel imperviousness for eight European cities. Furthermore, as only minor variations
in the accuracies are observed for the examined cities, this suggests that the method can be applied
with similar accuracies for urban areas in other geographical locations, both within and outside of
Europe. The Soil Adjusted Vegetation Index (SAVI) is identified as a superior index for mapping
multiple cities within a larger geographical area using regional regression models, and in most cases
we find that the quantification models based on Landsat imagery are readily transferable in space, with
only a limited loss of precision.
The impacts of recent historical urban development and anticipated future climate change on
exposure to pluvial flooding are investigated for four European cities – Nice, Strasbourg, Vienna and
Odense – to represent the diversity of flood regimes, urban morphologies, urban development
patterns and hydrological responses that exists across the European continent. The analyses of
changes to the urban land cover show that the four cities all experienced increased levels of
imperviousness between 1984 and 2015, with absolute changes ranging from 7% to 12%. We find that
this increase is driven primarily by cities expanding into former non-urban areas and only marginally
due to intensifications of existing urban land cover. The influence of urban development on flood
exposure shows a clear trend towards the greater impact of soil sealing for the least severe
precipitation events, while only marginally affecting flooding during more extreme precipitation.
Changes to urban land cover are found to have a particular influence on flood exposure in urban areas
characterized by coarser soil textures and limited elevation differences, as soil infiltration rates are
excessive in these cases, increasing the impacts of soil sealing. Urban development in 1984-2015
caused flooding to increase by 0-5% every time overall imperviousness increased by 1%, while
affecting flooding with higher water levels the most. Climate change impacts on precipitation extremes
are projected for RCP (Representative Concentration Pathway) 4.5 and RCP 8.5 based on extreme value
analysis using a change factor (CF) methodology. The estimated changes in the intensity and
frequency of extreme precipitation are identified as highly uncertain, but with average CFs projecting
an increase in precipitation intensities and flooding extents for all four cities. The projected trends in
extremes show a positive correlation with increasing return periods and increasing concentrations of
atmospheric greenhouse gasses. Hence the largest increases are projected for the most extreme

iv
events under high-end climate scenarios, such as RCP 8.5. For Odense and Vienna, the impacts of
climate change on flood exposure under the RCP 4.5 scenario is in the same order of magnitude as
that caused by urban development, while in all cases we find the expected changes in precipitation
intensities under the RCP 8.5 scenario to affect flooding the most. In the context of climate adaptation,
the findings suggest that the efficiency of "green" adaptation measures, that is, where natural
infiltration and the storage of surface water are used as a measure to reduce exposure to flooding –
differs substantially between locations, being an efficient strategy against pluvial flooding for some
cities, while being only marginally effective for others.
Analyses of the consequences of high-end climate scenarios and the risks of extreme precipitation
involve a number of critical assumptions and methodological challenges related to key uncertainties in
climate scenarios and modelling, impact analysis, and economics. A methodological framework for the
integrated risk assessment of climate change impacts has been developed and applied to a case study
of pluvial flooding in the city of Odense, Denmark. It addresses the complex linkages between the
different kinds of data required in a climate adaptation context, emphasizing that the availability of
spatially explicit data reduces the overall uncertainty of the risk assessment and can assist in
highlighting key vulnerable assets in a decision-making context. Also, using an integrated framework
enables the identification of the relative importance of the different factors (i.e. degree of climate
change, assets value, discount rate etc.) that influence the overall output of the assessment. A
sensitivity analysis examines 32 combinations of climate scenarios, damage cost methods and
economic variables, demonstrating that alternative assumptions result in risk estimates with a very
large variation. We find that a major source of uncertainty relates to the climate scenario of choice, in
particular the probability of extreme events and the economic assumptions made, including choices of
risk aversion factor and discount rate. Moving from our current climate to higher atmospheric
greenhouse gas (GHG) concentrations implies that the frequency of extreme events increases. In
combination with various economic assumptions, we find that the annualized damage costs for the
lowest and highest estimates vary from about 85 million EUR yr−1 down to less than 1 million EUR
yr−1. In terms of decision-making, however, it is important to note that most of the combinations
assess the risk to be between 7 and 30 million EUR yr−1, while only 4 out of the 32 combinations really
stand out and go far beyond a 30 million EUR yr−1 risk level. The level of risk is found to vary in nearly
equal parts based on climate scenario assumptions, damage cost approach and cost assumptions, and
we observe that the set of climate scenarios and economic assumptions influences the risk estimates in
a very similar way. Consequently, this study demonstrates that, in terms of decision-making, the actual
expectations concerning future climate scenarios and the economic assumptions applied are very
important in determining the risks of extreme climate events and, accordingly, the level of cost-
effective adaptation seen from the society’s point of view.
Least developed countries (LDCs) are particularly vulnerable to climate change due to their low
incomes, weak infrastructure and limited institutional capacity for coping with climate change. Extreme
events occurring in recent decades point to the threat of increasing frequencies and damages in the
future. Despite uncertainties about whether such events should be attributed to climate change, it is
important to strengthen data and methodological frameworks further in order to assess the risks in
highly vulnerable low income countries. We suggest applying specific assumptions to willingness to
pay (WTP) estimates for avoided damage to LDCs reflecting risk aversion and equity concerns using an
inequality aversion factor, which gives relatively high weight to damage and therefore the income
losses of poor households. It is demonstrated that the application of an inequality factor strongly
influences WTP estimates for avoided damages and we find a factor of ten between the highest and
lowest estimates. This suggests that including such assumptions are very important, seen in the
context of economic arguments for investing in adaptation in LDC's.

v
Dansk sammenfatning Byer er kendetegnet ved meget høje koncentrationer af mennesker og økonomiske aktiviteter, hvilket
gør dem særligt sårbare overfor oversvømmelser i forbindelse med ekstrem nedbør. Byudvikling og
klimaforandringer er blandt de vigtigste drivkræfter for ændringer i byers sårbarhed overfor
forekomsten og konsekvenserne af oversvømmelser i forbindelse med skybrud. Bymiljøer er ofte
domineret af store områder med befæstede overflader, dvs. menneskeskabte forseglede overflader,
som vand ikke kan trænge igennem, og stigninger i disse - for eksempel som følge af byudvikling -
kan medføre forhøjet overfladeafstrømning og øget risiko for oversvømmelser. Fremtidige
klimaændringer forventes at påvirke intensiteten og hyppigheden af ekstrem nedbør, med
projekterede stigninger for mange regioner, herunder for store dele af Europa.
Hovedformålet med denne afhandling er at øge vores viden om betydningen af byudvikling og
klimaændringer for oversvømmelser i byer i forbindelse med skybrud. Øget viden om disse
sammenhænge bidrager med information som er nødvendig for lokale og nationale beslutningstagere
for at prioritere effektivt mellem forskellige klimatilpasningstiltag og afbødningsstrategier når
fremtidens byer skal klimasikres.
Byer er generelt karakteriseret ved stor heterogenitet, da mange forskellige overflade-typer og areal-
anvendelser typisk forekommer indenfor korte afstande. Dette udgør en stor udfordring for
kortlægningen af bymiljøer i tilstrækkelig høj opløsning. Satellitbaserede metoder kan imidlertid med
fordel anvendes i mange henseender, da disse ofte bidrager med en komplet rumlig og tidslig
dækning om byområder, hvilket muliggør systematisk, præcis og ressourceeffektiv kortlægning af
urban overflader og ændringer heri over tid. Satellit-baseret data om vegetationsdække kan anvendes
til at kvantificere mængden og udbredelsen af befæstede arealer, eftersom de fleste større byer i
Europa næsten udelukkende er kendetegnet ved en kombination af befæstede og grønne arealer.
Resultatet af vores analyser for otte europæiske byer bekræfter dette og illustrerer at vegetations-data,
som er målt ved analyse af Landsat satellitbilleder, kan anvendes til at estimere subpixel
befæstelsesgrader med relativ stor nøjagtighed. Eftersom at vi kun observerer lav variabilitet i
præcisionen imellem de forskellige byer, tyder det endvidere på, at metoden kan anvendes med
tilsvarende nøjagtighed for byområder i andre regioner, både i og udenfor Europa. Vores resultater
viser, at Soil Adjusted Vegetation Index (SAVI) er et overlegen indeks i forbindelse med udarbejdelsen
af regionale regressionsmodeller til kortlægning for flere byer inden for et større geografisk område,
og i de fleste tilfælde finder vi, at de lokale Landsat-baseret modeller let kan anvendes for byer i andre
områder med kun et begrænset tab af præcision.
Vi har undersøgt konsekvenserne af nyere tids byudvikling og forventede fremtidige klimaændringer
for oversvømmelser i forbindelse med skybrud for fire europæiske byer - Nice, Strasbourg, Wien og
Odense. Byerne er udvalgt med udgangspunkt i at skulle repræsentere en væsentlig andel af
mangfoldigheden af oversvømmelsesregimer, urbane morfologier, byudviklingsmønstre og
hydrologiske respons, som findes på det Europæiske kontinent. Byudviklingsanalyserne viser, at de fire
byer alle har oplevet en stigning i befæstelsesgraden i perioden 1984-2015, med absolutte stigninger
fra 7-12 %. Samtidig finder vi at denne stigning primært skyldes, at byerne er vokset i omfang og i
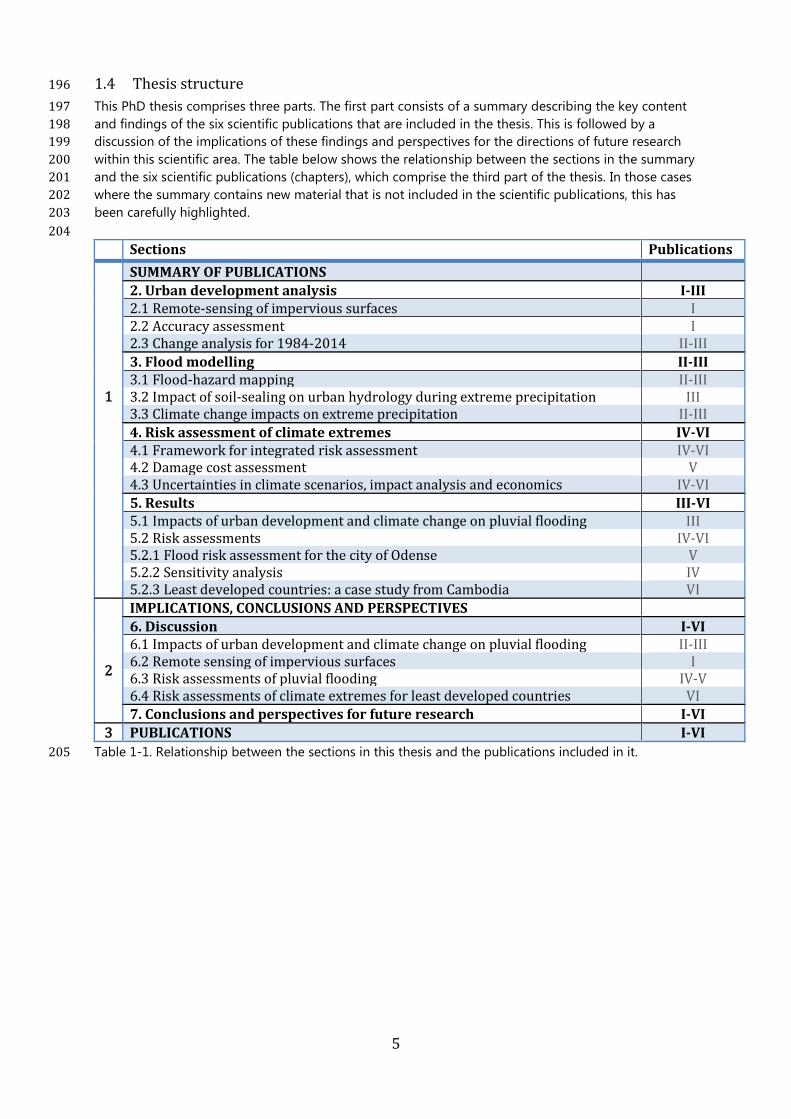
mindre grad på grund af en fortætning af det eksisterende bymiljø. Betydningen af byudvikling for
urbane oversvømmelser viser en klar tendens i retning af en større effekt af ændringer i befæstede
arealer for de mindst intense nedbørshændelser, og kun en marginal påvirkning af oversvømmelser fra
skybrud med lange returperioder (de kraftigste hændelser). Herudover ses det, at ændringer i det
urbane arealdække har stor betydning for udsatheden overfor oversvømmelser for byer, som er
karakteriseret ved grove jordteksturer og begrænsede forskelle i terræn, eftersom at infiltrationen, og
samtidig effekten af at introducere befæstede arealer, her er høj. Byudvikling i perioden 1984-2015
forøgede det oversvømmede areal med 0-5 % hver gang befæstelsesgraden steg med 1 %, og
påvirkede områder med de største vanddybder mest. Klimaændringernes indflydelse på fremtidige
nedbørsintensiteter er analyseret for to klimascenarier, RCP (Representative Concentration Pathway)
4.5 og RCP 8.5, ved brug af ekstremværdi analyse og en "change-factor" metode. Der er stor

vi
usikkerhed forbundet med de estimerede ændringer i nedbørsintensitet og hyppighed, men de
gennemsnitlige klimafaktorer viser generelt en forøgelse i nedbørsintensiteten og sårbarheden overfor
oversvømmelser i alle fire byer. Vores resultater viser en positiv sammenhæng mellem stigende
returperioder og stigende koncentrationer af atmosfæriske drivhusgasser, og viser at de største
ændringer kan forventes under de højeste klimascenarier, som f.eks. RCP 8.5. I Wien og Odense er
konsekvenserne af byudvikling med henblik på byens sårbarhed overfor oversvømmelser
sammenlignelige med hvad man kan forvente under RCP 4.5 scenariet, mens konsekvenserne i alle
tilfælde er størst under RCP 8.5. I en klimatilpasningskontekst indikerer disse resultater en stor
geografisk variation i effektiviteten af "grønne" klimatilpasningsløsninger, hvor naturlig infiltration og
opbevaring af nedbør anvendes til at reducere oversvømmelser. Mens sådanne løsninger i nogle byer
således vil være en effektiv strategi mod skybrudsrelaterede oversvømmelser, vil de kun være
marginalt effektive i andre.
Konsekvensanalyser af klimascenarier og risiko-analyser for skybrud involverer en lang række kritiske
antagelser og metodiske udfordringer som er relateret til usikkerheder i klimascenarier og modeller,
konsekvensanalyser og økonomi. En metodisk ramme til integreret risikovurdering af klimaændringer
er udviklet og anvendt på et casestudie af skybruds-relaterede oversvømmelser i Odense, Danmark.
Metoden adresserer de komplekse sammenhænge mellem de forskellige typer af data, der er
nødvendige i en klimatilpasnings kontekst, og understreger at tilgængeligheden af rumligt eksplicit
data kan medvirke til at reducere den samlede usikkerhed og hjælpe med at identificere vigtige
sårbare aktiver i forbindelse med beslutningstagning om klimatilpasning. Ved anvendelse af et
integreret værktøj muliggøres kvantificeringen af den relative betydning af forskellige faktorer (valg af
klimascenarie, værdisætning, diskonteringsfaktor m.m.), som påvirker det samlede resultat af
risikovurderingen. En følsomhedsanalyse som undersøger 32 kombinationer af klimascenarier,
skadeomkostningsmetoder og økonomiske variable, viser at alternative forudsætninger resulterer i
risikoestimater med meget stor variation. En væsentlig kilde til usikkerhed kan relateres til
klimafremskrivningerne og i særdeleshed til estimater af sandsynligheden for fremtidige ekstreme
nedbørshændelser samt til de økonomiske forudsætninger, herunder risiko-aversion og
diskonteringsfaktor. Når vi bevæger os fra vores nuværende klima til større atmosfæriske
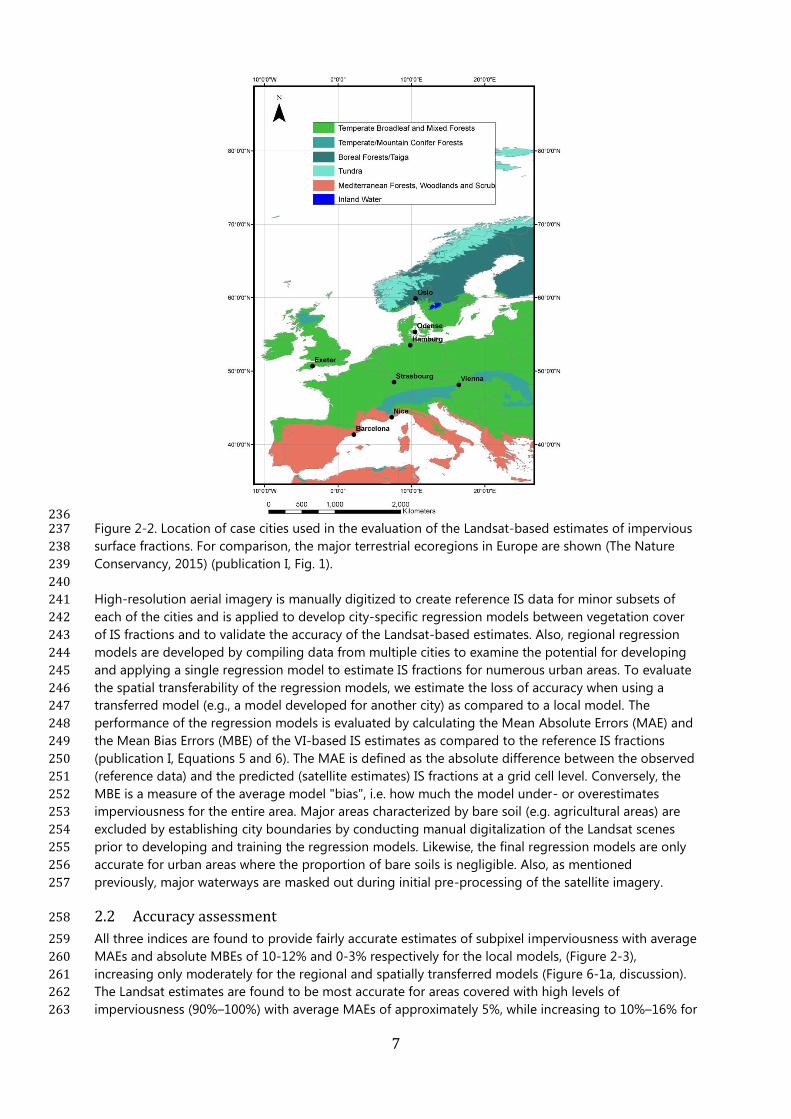
koncentrationer af drivhusgasser (GHG) indebærer det, at frekvensen af ekstreme hændelser stiger. I
kombination med forskellige økonomiske antagelser finder vi, at de årlige skadesomkostninger for de
højeste og laveste estimater varierer fra omkring 85 mio. EUR år-1 ned til mindre end 1 mio. EUR år-1. I
en klimatilpasningskontekst er det dog vigtigt her at bemærke, at de fleste af kombinationerne
vurderer risikoen til at være mellem 7 og 30 mio. EUR år-1, mens kun 4 ud af de 32 kombinationer
skiller sig ud og går langt ud over et risikoniveau på 30 mio. EUR yr-1. Andelen af variationen i
risikoestimaterne, som kan tilskrives forudsætninger i klimafremskrivningerne er sammenlignelige med
variationen, som skyldes forskellige antagelser omkring værdisætning og økonomi, og det kan derfor
konkluderes at de økonomiske forudsætninger og klimascenarierne påvirker risikovurderingen på
samme måde. Denne analyse viser at de faktiske forventninger til fremtidige klimascenarier og de
økonomiske forudsætninger er meget vigtige i fastlæggelsen af risikoen fra ekstreme
nedbørshændelser og dermed for niveauet for omkostningseffektiv klimatilpasning set fra et
samfundsmæssigt perspektiv.
Udviklingslande er særligt sårbare over for klimaændringer på grund af lave indkomster, en svag
infrastruktur og begrænset institutionel kapacitet. Ekstreme begivenheder gennem de seneste årtier
indikerer en stigende hyppighed af hændelser og skader. Trods usikkerhed om, hvorvidt sådanne
begivenheder bør tilskrives klimaforandringerne, er det vigtigt at styrke datatilgængelighed og
metodeudvikling i forbindelse med at vurdere risici i sårbare udviklingslande. Vi foreslår at anvende
specifikke forudsætninger til estimering af "willingness to pay" (WTP) for at undgå skader i de mindst
udviklede lande, der afspejler risikoaversion og ulighed, ved at inkluderer en ulighedsfaktor, som
tilskriver relativ høj værdi for skader på fattige husholdninger. Resultaterne af vores analyser viser
desangående, at anvendelsen af en ulighedsfaktor har stor indflydelse på WTP estimater for undgåede
skader, og vi finder en faktor ti til forskel mellem de højeste og laveste årlige skadesomkostninger.

vii
Dette tyder på, at sådanne forudsætninger er meget vigtige i relation til økonomiske argumenter for at
investere i klimatilpasning i udviklingslande.

viii
Table of Contents
Preface .................................................................................................................................................................. i
Acknowledgements ......................................................................................................................................... ii
Summary ........................................................................................................................................................... iii
Dansk sammenfatning ................................................................................................................................... v
Abbreviations ................................................................................................................................................... ix
Introduction ............................................................................................................................................. 1 1
1.1 Background ....................................................................................................................................................... 1
1.2 Research objectives ....................................................................................................................................... 3
1.3 Methodological framework ........................................................................................................................ 3
1.4 Thesis structure............................................................................................................................................... 5
Urban development analysis .............................................................................................................. 6 2
2.1 Remote sensing of impervious surfaces ................................................................................................ 6
2.2 Accuracy assessment..................................................................................................................................... 7
2.3 Change analysis for 1984-2014 ................................................................................................................ 8
Flood modelling ................................................................................................................................... 10 3
3.1 Flood hazard mapping ............................................................................................................................... 10
3.2 Impact of soil-sealing on urban hydrology during extreme precipitation ........................... 11
3.3 Climate change impacts on extreme precipitation ........................................................................ 13
Risk assessment of climate extremes........................................................................................... 14 4
4.1 Framework for integrated risk assessment ...................................................................................... 14
4.2 Damage cost assessment .......................................................................................................................... 15
4.3 Uncertainties in climate scenarios, impact analysis and economics ...................................... 16
Results ..................................................................................................................................................... 17 5
5.1 Impacts of urban development and climate change on pluvial flooding .............................. 17
5.2 Risk assessments ......................................................................................................................................... 19
5.2.1 Flood risk assessment for the city of Odense ............................................................................................ 19
5.2.2 Sensitivity analysis ............................................................................................................................................... 22
5.2.3 A least developed country perspective: a case study from Cambodia ........................................... 23
Discussion .............................................................................................................................................. 26 6
6.1 Impacts of urban development and climate change on pluvial flooding .............................. 26
6.2 Remote sensing of impervious surfaces ............................................................................................. 28
6.3 Risk assessment of pluvial flooding ..................................................................................................... 29
6.4 Risk assessments of climate extremes for least developed countries ................................... 31
Conclusions and perspectives for future research .................................................................. 33 7
References .............................................................................................................................................. 35 8
Publications ........................................................................................................................................... 38 9

ix
Abbreviations
CF Change Factor
FR Fractional Vegetation Cover
GCM General Circulation Model/Global Climate Model
IS Impervious Surface(s)
LDC Least Developed Country
MAE Mean Absolute Error
MBE Mean Bias Error
NDVI Normalized Difference Vegetation Index
NPV Net Present Value
OLI Operational Land Imager (Landsat Satellite sensor)
RCM Regional Climate Model
RCP Representative Concentration Pathway
RP Return Period
SAVI Soil Adjusted Vegetation Index
TM Thematic Mapper (Landsat Satellite sensor)
VI Vegetation Index
WTP Willingness to Pay

1
Introduction 11
1.1 Background 2
The economic and human consequences of extreme precipitation and related surface flooding in 3
urban areas have been increasing rapidly in recent decades due to changes in a number of key factors 4
affecting the overall exposure and vulnerability of the built environment. Globally, the total number of 5
damaging hydro-meteorological events increased from ≈ 100/year in the 1980s to 300/year in the 6
early 21st century, causing overall losses to follow a similar trend (Munich RE, 2015). For Europe a 7
comparable development, with increasing flood frequencies and economic losses, has been observed 8
in the past thirty to forty years (Golnaraghi et al., 2014). Important drivers of these trends include 9
climate change, expanding urban areas, general population growth and the accumulation of assets 10
and people within cities. Continued urbanization and intensification (increased soil-sealing) of urban 11
environments are projected for all regions (Angel et al., 2011; United Nations et al., 2014), which can be 12
expected to make urban areas even more susceptible to flooding in the future. Recent forecasts of 13
urban land cover for Europe project an average increase of 75% towards 2040, with values ranging 14
from 6-289% (Angel et al., 2011). At the same time, urban populations in Europe are anticipated to rise 15
by approximately 10%. For comparison in the least developed countries (LDCs), urban populations and 16
urban land cover are both projected to more than double over the next thirty years, affecting 17
vulnerability, risk and exposure to an even greater extent. 18
19
To address the challenge of increased susceptibility to urban flooding, all EU member states are 20
required to conduct flood risk assessments during the period of 2007-2021, including the production 21
of flood hazard and risk maps and the development of flood risk management plans, with a 22
particularly focus on the impacts of climate change (European Commission, 2007). The directive 23
applies to all kinds of floods (flash floods, urban floods, coastal floods, river flooding etc.) and aims to 24
reduce the risk of adverse impacts to human health, economic activities, cultural and historical heritage 25
and the environment. Cities are key players in the global and regional implementation of adaptation 26
measures to climate extremes, as this is where the majority of people and economic activities are 27
located, though there are large diversities in the ambition and preparedness of urban areas regarding 28
the projected impacts of climate change. Adaptive capacity and GDP per capita are major drivers 29
influencing the response to the challenges imposed to urban areas by climate change, and large cities 30
in wealthier regions are often more involved in climate planning. In contrast, populations residing in 31
cities in LDCs are often highly vulnerable and at greater risk of the impacts of present-day and future 32
climate extremes. Increased knowledge of the main drivers of exposure to urban flooding regionally 33
and locally is needed to support local and national authorities in reducing susceptibility towards pluvial 34
flooding. Also, research and methodological development in a context of urban flood risk assessment 35
and climate adaptation is necessary to provide decision-makers with the appropriate knowledge and 36
tools to respond properly to the challenges posed by future climate change. 37
38
A key feature of cities is a high degree of imperviousness, as roads, buildings, parking lots and other 39
paved areas occupy a main share of urban land areas. As a result, changes to impervious surfaces (IS) 40
are often used as an indicator of urbanisation and urban development. The abundance and location of 41
sealed surfaces is a key determinant of environmental quality, as it has important implications for 42
many bio-physical processes, both regionally and locally (Arnold and Gibbons, 1996; Weng, 2012). For 43
major urban areas, these processes are primarily linked to the hydrological cycle and the surface 44
energy budget (e.g. Urban Heat Islands). Thus changes in the quantity and location of IS alter an area’s 45
hydrological response, since replacing natural land cover with artificial sealed surfaces reduces 46
infiltration capacity, surface storage capacity and evapotranspiration (Parkinson and Mark, 2005; Butler, 47
2011; Hall et al., 2014). Moreover, it leads to increased run-off volumes, discharge rates, flood peaks 48
and flood frequencies (Butler, 2004). For this reason, past and present city development patterns may 49
prove to have (and will continue to have) important implications for the exposure of urban systems to 50
pluvial flooding. 51

2
The detailed compositions of urban environments – as urban land-use is typically characterized by 52
pronounced spatial and temporal dynamics – is a challenge in terms of mapping urban structure and 53
development at the scale required for many applications, such as flood modelling, urban planning and 54
risk assessments. Conversely, satellite imagery and remote-sensing techniques may provide complete 55
temporal and spatial coverage of cities globally from the 1970s onwards, thus facilitating accurate, 56
systematic and resource-efficient approaches for the mapping of urban landscapes at various scales. 57
As urban development is observed at annual or even decadal timescales (urban development rates 58
differ considerably between regions), temporal coverage is of great importance when selecting data 59
for change analyses: while high-resolution satellite imagery only dates back to the late 1990s, medium-60
resolution data, including Landsat imagery, is available for the past thirty to forty years, allowing for 61
extended time series of urban land cover. That said, most current satellite-based remote-sensing 62
techniques for urban mapping are generally considered to be highly complex and resource-intensive 63
(economic, data and software requirements are high), and are thus not yet readily available for many 64
potential users, especially outside of the scientific community. In practice, this often restricts the use of 65
such methods for a wide variety of applications, including urban flood modelling and analyses of the 66
importance of urban development and structure in the contexts of climate change and extreme events. 67
68
Climate change is often described as a long-term phenomenon characterized by changes in global 69
mean parameters such as temperature or precipitation, one which plays an important role in 70
developing climate policies and long-term mitigation and adaption strategies. When it comes to risk 71
assessments, on the other hand, information relating to the tails of the probability distributions (i.e. 72
extreme events with low probabilities) is typically of much greater interest, as many adverse effects of 73
climate change are propagated through changes in the intensity and frequency of climate extremes. 74
Future climate change is expected to increase the intensity and frequency of precipitation extremes in 75
both the short and long terms for most regions, including Europe, and the projected changes often 76
show a positive correlation with increasing concentrations of atmospheric greenhouse gasses (Fowler 77
and Hennessy, 1995; Larsen et al., 2009). As a result, the most severe changes are projected under 78
high-end scenarios like the Representative Concentration Pathway (RCP) 8.5 (Meinshausen et al., 2011; 79
Field et al., 2012). This can lead to further increases in the exposure of urban areas to flooding unless 80
suitable adaptation measures are implemented. Projections of high-intensity precipitation both locally 81
and regionally are associated with large uncertainties due to different sources of error, including an 82
incomplete understanding of precipitation processes in climate models. Hence ensemble approaches, 83
where precipitation changes are analysed for a large number of climate models and scenarios, are 84
often preferred in order to improve quantifying the influence of uncertainties on projections of future 85
climate extremes. Using information from combinations of General Circulation Models (GCMs) and 86
Regional Climate Models (RCMs) enables the investigation of variations in precipitation projections for 87
flood risk assessments and facilitates robust adaptation decision-making. 88
89
Risk assessments of urban flooding require an integrated approach in which detailed information on 90
extreme precipitation characteristics (e.g. from extreme value analysis of climate model projections), 91
land cover, land use, human behaviour and economics are combined to provide decision-makers and 92
other stakeholders with specific knowledge of the risks of the diverse array of assets that exist within 93
urban environments. Integrated risk assessments are surrounded by large uncertainties originating 94
from the different types of analysis involved and the complex linkages of different analytical tools, 95
including climate models, physical impact models (e.g. flood models) and socioeconomic damage 96
assessments. Altogether this plethora of uncertainties provides the basis for a wide range of climate 97
change risk estimates. Assuming that the level of risk defines the upper boundary of what society 98
should be willing to spend on adaptation measures, this likewise implies a wide range of appropriate 99
responses to climate change. Least developed countries (LDCs) are particularly vulnerable to climate 100
change and to the adverse impacts of extremes due to their low incomes, weak infrastructure and 101
limited institutional capacity for coping with climate change. Also limited data availability often hinders 102
the application of detailed geographical information to climate projections, land cover and 103
socioeconomics, including accurate damage costs. Extreme events which have occurred in recent 104
decades point to the threat of an increasing frequency of incidents and damage. Despite uncertainties 105

3
over attributing these events to climate change, it is important to strengthen the data and 106
methodological frameworks used for assessing risks in LDCs further. 107
1.2 Research objectives 108
This thesis (1) aims to improve our current understanding of the importance of urban development 109
and climate change for the exposure of urban areas to pluvial flooding. Systematically quantifying the 110
importance of changes to urban land cover and climate change in relation to flooding events will assist 111
local and national decision-makers to prioritize effectively between different adaptation measures - 112
and in some cases also mitigation strategies - when planning the climate-proofing of cities in the 113
future. As a precondition for addressing this objective, a satellite-based remote-sensing methodology 114
for quantifying historical urban development, which is particularly useful in an urban flood modelling 115
context, will be developed and tested, i.e. to enable a resource-efficient mapping of temporal and 116
spatial changes in impervious surfaces, which may be useful also for a wide array of other applications 117
for cities globally. Secondly, through the development and application of an integrated risk-118
assessment framework, this thesis (2) aims to advance the current knowledge of the importance of key 119
uncertainties and assumptions in climate projections, impact analysis and economic valuation in risk 120
assessments of climate extremes in the context of climate change adaptation. Assuming that the 121
estimated level of risk also determines the level of appropriate adaptation, a disaggregated approach, 122
in which the importance of individual assumptions is highlighted, facilitates knowledge for robust 123
decision-making when adapting to climate change. 124
125
Publication I investigates the accuracy of using vegetation indices to estimate impervious surface 126
fractions for European cities at a resolution that is suitable for urban development analysis and large-127
scale urban flood modelling. Publication II uses the findings of publication I to examine the potential 128
for developing a combined remote-sensing and flood-modelling approach to quantify the impacts of 129
recent urban development and expected future climate change on pluvial flood exposure. The 130
developed method is evaluated through a case study of the city of Odense, Denmark. Publication III 131
refines the method developed in publication II i.e. by improving the applied flood model and the 132
urban development analysis, as well as through the introduction of uncertainty estimates for the 133
impacts of urban development and climate change on pluvial flooding. It also aims at improving 134
current understanding of the relative impacts of soil-sealing and climate change on exposure to 135
flooding by adding three additional case studies of cities, which are largely representative for 136
European cities. Publication IV addresses the importance of uncertainty in climate projections, impact 137
assessments and economic valuation for risk assessments in a climate adaptation context through a 138
case study of urban flooding; the case study is carried out in Odense, and this thematically links to 139
publication II. Publication V considers an integrated risk assessment framework for addressing the 140
complex linkages between the different kinds of data and analytical tools generally required to carry 141
out risk assessments supporting climate adaptation decision-making in urban areas. Finally, 142
Publication VI presents and applies an adjusted risk-assessment framework suitable for adaptation 143
analyses in least developed countries that are particularly vulnerable to the impacts of climate 144
extremes, that is, due to their low incomes, weak infrastructure and public institutions and thus a low 145
capacity for coping with the adverse impacts of climate change. 146
147
Research objective (1) is addressed in publications I, II and III. 148
Research objective (2) is addressed in publications IV, V and VI. 149
150
1.3 Methodological framework 151
Urban development and climate change are both expected to affect the exposure of urban areas to 152
pluvial flooding. Increased soil-sealing as a result of urban development influences the hydrological 153
response, causing elevated run-off volumes, while climate change is projected to increase the intensity 154
and frequency of climate extremes. 155
156

4
A combined flood-modelling and remote-sensing approach has been developed to simulate the 157
occurrence of (and related flooding during) a range of design extreme precipitation events for four 158
cities (Nice, Strasbourg, Vienna and Odense) in Europe under current and expected future climatic 159
conditions. To include the influence of temporal variations in urban land cover (changes in 160
imperviousness), the simulations are performed for different levels of urbanisation, which corresponds 161
to the historical (1984) and current (2013-2015) conditions of these cities. Nice, Strasbourg, Vienna and 162
Odense are selected for analysis to represent different climatic conditions, (expected) dissimilar 163
historical urbanisation trends, and varying soil characteristics and topographies (flat vs hilly), which are 164
important for infiltration processes during extreme precipitation. The impacts of future climate change 165
for exposure to urban flooding are examined for two different climate scenarios, i.e. RCP 4.5 and RCP 166
8.5 (van der Linden and Mitchell, 2009). The RCP 4.5 scenario describes a future with increases in the 167
near-surface air temperature towards 2100 of 1.8°C (1.1-2.6°C), while the RCP 8.5 scenario represents a 168
world where the increased radiative forcing corresponds to an increase of 3.7°C (2.6-4.8°C) in 2100 169
(Intergovernmental Panel on Climate Change, 2014). 170
171
Data-processing and analytical procedures are divided into three separate types of analysis: (a) urban 172
development analysis; (b) flood modelling; and (c) quantification of the influence of urban 173
development and climate change on exposure to flooding (Figure 1-1). Initially, Landsat TM (1984) and 174
Landsat OLI (2013-2015) satellite imagery is analysed to quantify IS fractions at a pixel level for 175
historical and current urban land cover conditions. The outputs of the remote-sensing analyses are 176
combined with soil infiltration data and regionally downscaled estimates of current and expected 177
future precipitation extremes to enable 2D overland flow simulations and flood hazard assessments 178
within a flood modelling framework. Flood hazard maps, indicating the extent and depth of flooding, 179
are calculated for various combinations of urban land cover, extreme precipitation severity (return 180
period) and climate scenario (an example of a flood hazard map is shown in Figure 3-1). A cross-181
comparison of multiple flood-hazard maps allows for quantification of the relative importance of 182
changes to urban land cover as compared to climate change for overall exposure to pluvial flooding. 183
The impact of recent urban development is isolated by simulating the occurrence of identical design 184
precipitation events for both historical and current levels of urban IS fractions. Conversely, design 185
precipitation intensities are varied, and imperviousness kept constant, when evaluating the expected 186
impacts of climate change. A total of 48 combinations of input variables with regard to degree of 187
imperviousness, climate scenario, climate factors, return period and soil water infiltration are simulated 188
for each city (Figure 3-2). The impacts of future urban development are not included directly in this 189
study, as such projections are surrounded by substantial uncertainties and are not considered by the 190
authors to contribute additional clarification of the role of urban development for temporal variations 191
in exposure to flooding. 192
193
Figure 1-1. Methodological framework for quantifying the impacts of changes to urban land cover and 194
climate change for the exposure of cities to pluvial flooding (Paper III, Fig.1). 195
5
1.4 Thesis structure 196
This PhD thesis comprises three parts. The first part consists of a summary describing the key content 197
and findings of the six scientific publications that are included in the thesis. This is followed by a 198
discussion of the implications of these findings and perspectives for the directions of future research 199
within this scientific area. The table below shows the relationship between the sections in the summary 200
and the six scientific publications (chapters), which comprise the third part of the thesis. In those cases 201
where the summary contains new material that is not included in the scientific publications, this has 202
been carefully highlighted. 203
204
Sections Publications
1
SUMMARY OF PUBLICATIONS
2. Urban development analysis I-III 2.1 Remote-sensing of impervious surfaces I 2.2 Accuracy assessment I 2.3 Change analysis for 1984-2014 II-III
3. Flood modelling II-III 3.1 Flood-hazard mapping II-III 3.2 Impact of soil-sealing on urban hydrology during extreme precipitation III 3.3 Climate change impacts on extreme precipitation II-III
4. Risk assessment of climate extremes IV-VI 4.1 Framework for integrated risk assessment IV-VI 4.2 Damage cost assessment V 4.3 Uncertainties in climate scenarios, impact analysis and economics IV-VI
5. Results III-VI 5.1 Impacts of urban development and climate change on pluvial flooding III
5.2 Risk assessments IV-VI 5.2.1 Flood risk assessment for the city of Odense V 5.2.2 Sensitivity analysis IV 5.2.3 Least developed countries: a case study from Cambodia VI
IMPLICATIONS, CONCLUSIONS AND PERSPECTIVES
2
6. Discussion I-VI 6.1 Impacts of urban development and climate change on pluvial flooding II-III 6.2 Remote sensing of impervious surfaces I 6.3 Risk assessments of pluvial flooding IV-V 6.4 Risk assessments of climate extremes for least developed countries VI
7. Conclusions and perspectives for future research I-VI
3 PUBLICATIONS I-VI
Table 1-1. Relationship between the sections in this thesis and the publications included in it. 205

6
Urban development analysis 2206
2.1 Remote sensing of impervious surfaces 207
Vegetation indices (VIs), like the Normalized Difference Vegetation Index (NDVI) (Rouse et al., 1974; 208
Tucker, 1979) and the Soil Adjusted Vegetation Index (SAVI) (Huete, 1988), have a long record of 209
success within the remote-sensing community, and several authors have shown them to provide 210
relatively accurate estimates of the quantity and distribution of IS and urban land cover (Carlson and 211
Traci Arthur, 2000; Bauer et al., 2002; Bauer et al., 2008; Yuan et al., 2008). The use of VIs as a method 212
to estimate urban IS fractions is based on the assumption of a strong inverse relationship between 213
vegetation cover and IS within cities (Figure 2-1)– that is, it is implicitly assumed that non-IS within 214
urban areas are covered with green vegetation. Lakes, rivers and other major waterways are common 215
in many urban areas, but these are easily identified and masked out due to the spectral signature of 216
water, which is highly distinguishable from other urban surfaces. Limitations in using VIs for IS 217
mapping include the influence of bare soils, shadow effects from buildings and tree crowns covering IS 218
(Bauer et al., 2008). Arguably, bare soil, the most critical of the three, has similar spectral characteristics 219
to urban fabrics and hence is often confused with IS (Lu and Weng, 2006; Weng, 2012). In a flood 220
modelling context, the confusion of bare soils with IS is particularly important, as the hydrological 221
response during extreme precipitation differs considerably between the two surface types. 222
223
224 Figure 2-1. (A) Conceptual relationship between impervious surface fractions and vegetation 225
cover/vegetation indices in urban environments (adapted from Bauer et al., 2008). (B) Example of a 226
high-resolution image used to measure reference impervious surface fractions and a Soil Adjusted 227
Vegetation Index (SAVI) calculated from Landsat OLI for a central part of Vienna (publication III, Fig. 2). 228
229
To test the accuracy of applying estimates of vegetation cover to mapping IS and temporal changes in 230
it for different geographical settings, medium resolution (30m) Landsat 8 satellite imagery is used to 231
calculate three different vegetation indices (Normalized Difference Vegetation Index or NDVI, Soil 232
Adjusted Vegetation Index or SAVI, and fractional vegetation cover or FR) for eight cities in Europe, 233
representing different vegetative and climatic conditions (Figure 2-2). Detailed information on the 234
three indices can be found in publication I, section 2.2. 235
A B
7
236 Figure 2-2. Location of case cities used in the evaluation of the Landsat-based estimates of impervious 237
surface fractions. For comparison, the major terrestrial ecoregions in Europe are shown (The Nature 238
Conservancy, 2015) (publication I, Fig. 1). 239
240
High-resolution aerial imagery is manually digitized to create reference IS data for minor subsets of 241
each of the cities and is applied to develop city-specific regression models between vegetation cover 242
of IS fractions and to validate the accuracy of the Landsat-based estimates. Also, regional regression 243
models are developed by compiling data from multiple cities to examine the potential for developing 244
and applying a single regression model to estimate IS fractions for numerous urban areas. To evaluate 245
the spatial transferability of the regression models, we estimate the loss of accuracy when using a 246
transferred model (e.g., a model developed for another city) as compared to a local model. The 247
performance of the regression models is evaluated by calculating the Mean Absolute Errors (MAE) and 248
the Mean Bias Errors (MBE) of the VI-based IS estimates as compared to the reference IS fractions 249
(publication I, Equations 5 and 6). The MAE is defined as the absolute difference between the observed 250
(reference data) and the predicted (satellite estimates) IS fractions at a grid cell level. Conversely, the 251
MBE is a measure of the average model "bias", i.e. how much the model under- or overestimates 252
imperviousness for the entire area. Major areas characterized by bare soil (e.g. agricultural areas) are 253
excluded by establishing city boundaries by conducting manual digitalization of the Landsat scenes 254
prior to developing and training the regression models. Likewise, the final regression models are only 255
accurate for urban areas where the proportion of bare soils is negligible. Also, as mentioned 256
previously, major waterways are masked out during initial pre-processing of the satellite imagery. 257
2.2 Accuracy assessment 258
All three indices are found to provide fairly accurate estimates of subpixel imperviousness with average 259
MAEs and absolute MBEs of 10-12% and 0-3% respectively for the local models, (Figure 2-3), 260
increasing only moderately for the regional and spatially transferred models (Figure 6-1a, discussion). 261
The Landsat estimates are found to be most accurate for areas covered with high levels of 262
imperviousness (90%–100%) with average MAEs of approximately 5%, while increasing to 10%–16% for 263

8
lower levels of imperviousness (Figure 2-3a). The better performance for areas with very high IS 264
fractions is partly a consequence of the location and characteristics of the urban sub-areas (from which 265
the regression models were developed), which are located within the central parts of the cities and are 266
therefore characterized by a high degree of imperviousness. A bias towards an overestimation of low 267
values and an underestimation of high values is observed for all the cities and indices (Figure 2-3b). 268
This pattern is most likely caused by the inability of the models to adequately describe the non-linear 269
relationship between NDVI/SAVI and IS fractions. The VI/IS relationship is found to be similar for cities 270
that are characterized by comparative vegetative and climatic conditions, and cross-validation of the 271
developed models shows equivalent results, with relatively low MAEs and MBEs for a number of 272
different combinations of city-specific models and urban sub-areas. A low variability in accuracies 273
between the different cities indicates that information on vegetation cover from Landsat may be 274
equally accurate in estimating urban land cover for many other urban areas globally (Figure 6-1b, 275
discussion). Also, our findings suggest that the regional models can be applied more broadly to 276
multiple urban areas and that accuracy is reduced only marginally by applying the regional models 277
Figure 6-1a, discussion). SAVI is identified as a superior index for the development of regional 278
quantification models and in a spatial transferability context (Figure 6-1a, discussion). As compared to 279
NDVI, SAVI reduces the influence of variations in soil background colour and building materials and 280
consequently improves the inter-city comparability of the regression models, which arguably could be 281
the reason for the better performance of the models based on SAVI. 282
283
284 Figure 2-3. (A) Average MAEs and (B) MBEs for different levels of imperviousness for all the urban sub-285
areas for the local linear regression models of NDVI/SAVI and for FR (publication I, Fig. 7, adjusted 286
versions). 287
2.3 Change analysis for 1984-2014 288
Urban areas are commonly dominated by man-made IS, changes in which are often used as an 289
indicator of urban development (Weng, 2012). As major European urban areas are almost exclusively 290
characterized by a combination of IS and green vegetation (and in some cases water, which is easily 291
distinguishable and masked out), information on vegetation cover from remote sensors can be utilized 292
to provide accurate and cost-efficient estimates of the quantity and spatial distribution of IS and 293
changes to it. 294
295
As already noted, the urban development analysis focuses on four cities (Nice, Strasbourg, Vienna and 296
Odense) representing different climatic conditions, varying soil infiltration properties and an (expected) 297
range of urban development trends. Linear regression models developed by Kaspersen et al., 2015 298
(publication I) relating SAVI and imperviousness are applied to estimate IS fractions for the historical 299
0
5
10
15
20
0-30 30-60 60-90 90-100 Mean
MA
E (
%)
IS fractions (%)
-10
-5
0
5
10
15
0-30 30-60 60-90 90-100 Mean
MB
E (
%)
IS fractions (%)
NDVI
SAVI
FR
A B

9
and present-day versions of the four cities. Impervious surface fractions for individual grid cells are 300
calculated using equation 1. 301
302
𝐼𝑚𝑝𝑒𝑟𝑣𝑖𝑜𝑢𝑠 𝑠𝑢𝑟𝑓𝑎𝑐𝑒 𝑓𝑟𝑎𝑐𝑡𝑖𝑜𝑛 = 𝑎 ∗ 𝑆𝐴𝑉𝐼 + 𝑏 (1) 303
304
Multiple Landsat images are compiled into Maximum Value Composites (MVCs) of SAVI to reduce the 305
influence of inter-annual and intra-annual variations in the timing of maximum vegetation cover. Initial 306
IS fractions are subsequently corrected for pixel values <0% and >100%, as linear regression models 307
do not constrain the data within the range that is physically possible (0-100%). Impervious surface 308
fractions are estimated at a spatial resolution of 30 m, which is the original resolution of the short 309
wave (visual and near-infrared) bands in the Landsat TM and OLI sensors. The spatial resolution is later 310
resampled to 25 m to match the resolution of the Digital Elevation Model (DEM), which is used for 311
overland flow calculations in the flood model. In order for the reflectance data, and therefore the SAVI 312
images and IS fractions, to be comparable between the Landsat TM (historical images) and OLI sensor, 313
the difference in the spectral response function between the two sensors is corrected for by applying 314
conversion factors to the surface reflection in individual bands (Flood, 2014). Detailed information on 315
the pre-processing of the Landsat data is found in publication I, section 2.5. 316
317
The results of the urban development analyses show that the four cities have all been experiencing 318
increased levels of imperviousness during the past thirty years, with absolute changes ranging from 319
6.6% in Nice to 11.6% in Strasbourg (Figure 2-4). From visual inspection, we find that the increase in 320
sealed surfaces is driven primarily by cities expanding into former non-urban areas. However, there is 321
also a tendency for existing urban land cover to intensify in all four cities. Detailed quantitative 322
analyses of the location of change are highly relevant for other applications, including in risk 323
assessments, but this is outside the scope of the paper, as we are here only examining the influence of 324
the key drivers of changes to urban flood exposure in cities. 325
326 327
France Austria Denmark France
Strasbourg Vienna Odense Nice
1984 41.4% 42.2% 29.1% 38.1%
2014 53.0% 53.5% 36.6% 44.7%
Change 11.6% 11.3% 7.5% 6.6%
328
Figure 2-4. Urban development analysis for Vienna during 1984-2014 and impervious surface fractions 329
and changes to them for Strasbourg, Vienna, Odense and Nice during 1984-2014 (2013-2015) 330
(publication III, Table 2; images from Vienna are not included in any of the publications). 331
1984 2014 Change

10
Flood modelling 3332
3.1 Flood-hazard mapping 333
Overland flooding can occur during extreme precipitation when the sewer system is surcharged or 334
when soil infiltration and storage capacities are exceeded, and excess surface water can pond on the 335
surface or flow in preferential flow paths along streets or between buildings, depending on the local 336
topography. When simulating overland flooding several modelling concepts are available, including 1D 337
simulations using information on local depressions or simple hydrodynamic drainage system models 338
and more advanced 2D and 1D/2D representations of surface and subsurface flows during 339
precipitation. The pros and cons of these methods have been widely discussed, and the choice of 340
method is highly dependent on the aim of the study: for example, 1D solutions are fast but offer a 341
poor approximation of complex (non-unidirectional) flows (Mark et al., 2004; Leandro et al., 2009; 342
Obermayer et al., 2010). The current study uses the 2D overland flow model in MIKE 21 (MIKE by DHI, 343
2014) to compute water-level variations, surface flows and maximum flood depths in response to the 344
occurrence of a variety of precipitation extremes. 345
346
Reported Intensity – Duration – Frequency (IDF) curves, which are derived based on historical 347
precipitation measurements from weather stations located in (or in the surrounding area of) each of 348
the four cities, are applied to construct time series of design precipitation events for 5, 10, 20, 50 and 349
100-year return periods (Coste and Loudet, 1987; Gregersen et al., 2014; BMLFUW, 2016). These time 350
series are considered representative of precipitation characteristics in both 1984 and 2014. Climate 351
change factors are quantified from climate model simulations and applied to the present-day IDF 352
curves to provide information on future precipitation extremes under the RCP 4.5 and RCP 8.5 climate 353
scenarios (see section 3.3 and publication III for details on extreme value analysis). The EU DEM, which 354
offers elevation estimates over the European continent at a 25m spatial resolution, is used as the basis 355
for calculating surface water flows after onset of precipitation (EEA, 2016). Soil-water infiltration rates 356
are calculated for each grid cell by combining IS fractions with information on soil textures and 357
average slope at the city level (see section 3.2 for details). As the flood modelling approach used here 358
(MIKE 21) does not include a representation of the urban drainage system, the drainage capacity of the 359
pipes is modelled by modifying the precipitation input, for example, by assuming a general maximum 360
pipe capacity based on precipitation intensities. In the current analyses, maximum drainage capacities 361
are assumed to correspond to precipitation with a return period of five years under present-day 362
climatic conditions, and the intensity of all other precipitation events is reduced to reflect this 363
assumption (Chow et al., 1988). This implies that surface flooding does not occur in any of the cities for 364
precipitation with return periods of five years or less. The primary outputs of the flood modelling are 365
flood hazard maps showing the maximum flood depth and extent for each individual simulation 366
(Figure 3-1). 367
368
369 Figure 3-1. Flood hazard maps for Nice showing the maximum water depth and extent during extreme 370
precipitation with a return period of 10-100 years for current urban land cover, present-day climate 371
and average soil infiltration. # = simulation number in Figure 3-2 (publication III, Fig. 3). 372
373
#14 #17 #20 #23
RP10 RP100 RP50 RP20

11
For each of the four cities, a total of 48 flood-model simulations are conducted to represent variability 374
in urban land cover, climate scenario, precipitation return period, climate factors and soil-water 375
infiltration (Figure 3-2). Twelve of these are performed for historical levels of imperviousness, while an 376
additional 36 are conducted for current (2014) versions of the cities (RCP 4.5 and RCP 8.5 are run with 377
urban land cover as in 2014). High and low climate change factors and soil infiltration rates are 378
included to examine the importance of uncertainties in influencing the calculated impacts of urban 379
development and climate change for overall flood exposure and changes to it. 380
381
382 Figure 3-2. Overview of flood model simulations performed for each city. RP = return period, RCP = 383
Representative Concentration Pathway (this figure is not included in any of the publications). 384
3.2 Impact of soil-sealing on urban hydrology during extreme precipitation 385
Converting pervious surfaces to impervious surfaces, or soil-sealing, is one of the most pronounced 386
consequences of recent urban development and is an important determinant of the hydrological 387
response of cities during extreme precipitation. As run-off is the proportion of precipitation which 388
does not infiltrate, soil-infiltration properties, which are primarily controlled by soil texture, topography 389
(slope) and soil structure (granular vs compact soils), are important (together with degree of soil-390
sealing) in determining run-off volumes. We hypothesize that the impact of urban development is 391
most pronounced for cities characterized by coarse soil textures and limited topography, as soil-392
infiltration rates are excessive here, and because soil-sealing has a greater impact on the urban 393
hydrological response during extreme precipitation in such areas. Similarly, the influence of changes to 394
urban land cover is expected to be more prominent for the most frequent precipitation events (i.e. 395
RP10), while only affecting the hydrological response for the most extreme events (i.e. RP100) to a 396
lesser degree. The background to this is an inverse relationship between the soil saturation time and 397
the intensity of precipitation, causing run-off from pervious surfaces to increase with the intensity of 398
Urban Land cover Climate scenario Precipitation event Climate factor Soil infiltration #
1984
Present day
RP10
No change factor
Low 1 Average 2
High 3
RP20
Low 4 Average 5
High 6
RP50
Low 7 Average 8
High 9
RP100
Low 10 Average 11
High 12
2014
RP10
Low 13 Average 14
High 15
RP20
Low 16 Average 17
High 18
RP50
Low 19 Average 20
High 21
RP100
Low 22 Average 23
High 24
RCP 4.5
RP10
10th percentile
Average
25 Average 26
90th percentile 27
RP20
10th percentile 28 Average 29
90th percentile 30
RP50
10th percentile 31
Average 32 90th percentile 33
RP100
10th percentile 34 Average 35
90th percentile 36
RCP 8.5
RP10
10th percentile 37 Average 38
90th percentile 39
RP20
10th percentile 40 Average 41
90th percentile 42
RP50
10th percentile 43 Average 44
90th percentile 45
RP100
10th percentile 46 Average 47
90th percentile 48

12
the events. For purposes of the current research run-off, is calculated at a grid-cell level for each time-399
step in the precipitation time-series using the following equation (2): 400
run-off = precipitation rate – (infiltration rate for pervious surfaces * (1- imperviousness)) (2) 401
402
Soil-infiltration rates are estimated for each city using information on the dominant soil texture and 403
average slope over the entire urban area (see publication III, section 2.4 for details). A constant 404
infiltration rate is applied during the entire time of precipitation for all design events, and an initial loss 405
(causing a decreasing infiltration rate with time) is not included, as its importance has been found to 406
be negligible for total infiltration/run-off during extreme precipitation (J. J. Stone et al., 2008). Also, as 407
a consequence of the large degree of uncertainty in local infiltration rates, which would only be 408
increased further by including a more complex description of the infiltration rate over time, a constant 409
rate was preferred in the current study. Despite the fact that soil texture and structure vary 410
considerably over short distances, a single infiltration value was applied for all grid cells within the 411
individual cities. This simplification is required to enable the application of the same soil texture data 412
across the different cities. High and low values of potential infiltration are included to examine the 413
sensitivity of the results of the analysis to variations in this parameter and to provide a quantitative 414
measure of uncertainty in analyses of the impacts of urban development (i.e. soil-sealing) on pluvial 415
flood exposure. On the basis of the variations in the estimated soil-infiltration rates, the effect of 416
changes in IS (i.e. urban development) on exposure to flooding is expected to be greatest for Odense 417
and smallest for Nice, as the impact of soil-sealing affects run-off volumes more for areas 418
characterized by high infiltration rates (Table 3-1). 419
420
(mm/hr) France Austria Denmark France
Strasbourg Vienna Odense Nice
High 30.6 46.2 58.6 20
Average 15.3 23.1 29.3 10
Low 7.65 11.55 14.65 5
Table 3-1. Potential soil infiltration rates (mm/hr) for pervious areas in the four cities, calculated based 421
on primary soil texture and average slope within the cities. Low = 0.5 * average, high = 2 * average, 422
adapted from USDA, 2016 (publication III, Fig. 4). 423
424
The relationship between precipitation rate, potential infiltration rate and run-off is exemplified using 425
information from Vienna (Figure 3-3a). Here is it seen that run-off from pervious surfaces does not 426
start until midway through the precipitation event, and only continues for 20-25 minutes before the 427
precipitation rate again drops below what can be infiltrated into the soils. However, as most of the 428
precipitation falls within this short period of time, total run-off approximates to 30%. Run-off from 429
pervious surfaces is naturally higher for the most extreme events and decreases for precipitation with 430
shorter return periods (Figure 3-3b). As a consequence of geographical differences in precipitation 431
characteristics, degree of imperviousness and soil-infiltration properties, run-off from pervious surfaces 432
varies significantly between the different cities, ranging between 22-34% for Odense, while increasing 433
to 72-88% for Nice. A similar trend is present when examining the actual run-off from the different 434
urban areas (Figure 3-3c), although values are elevated here as a result of the inclusion of the 435
estimated urban IS fractions for 1984 and 2014. A minor increase in run-off during 1984-2014 can be 436
identified for all the cities, as average imperviousness is also found to increase during this period 437
(Figure 2-4). 438
439
The large variation in run-off between the examined cities indicates that the effectiveness of simply 440
reducing overall imperviousness at the city level as a measure to protect urban environments from 441
pluvial flooding is highly dependent upon the relationship between local infiltration rates and the 442
intensity of extreme precipitation. Also, local infiltration capacities are found to reduce flood levels the 443
least for the most extreme events (e.g. RP100), suggesting that alternative adaptation measures should 444
be preferred when protecting against flooding during very extreme precipitation. This implies a diverse 445

13
array of solutions when planning for pluvial flood-proof cities at different geographical locations and 446
when adapting to the impacts of precipitation with alternative return periods. 447
448
449
450 Figure 3-3. (A) Precipitation rate (RP10), potential infiltration rate (average) and cumulated run-off 451
(RP10) from pervious surfaces for Vienna. (B) Run-off from pervious surfaces during extreme 452
precipitation with different return periods (RP10–RP100) under present-day climatic conditions. (C) 453
Runoff from urban areas during extreme precipitation with different return periods (RP10-RP100). Error 454
bars represent low/high infiltration rates; 1984 = imperviousness in 1984; 2014 = imperviousness in 455
2014 (publication III, Fig. 5). 456
3.3 Climate change impacts on extreme precipitation 457
High-resolution (i.e. at a city-level) climate projections for precipitation extremes can be estimated 458
from global coupled atmosphere-ocean circulation models (GCMs) and downscaled using regional 459
climate models (RCMs) and/or empirical-statistical approaches (Willems, 2012). To address the 460
considerable uncertainties associated with analyses of the frequency and intensity of future extreme 461
precipitation, such projections are generally based on multi-model ensembles, rather than single-462
0%
5%
10%
15%
20%
25%
30%
35%
0
50
100
150
200
250
0 30 60 90 120 150 180 210 240
Ru
no
ff
mm
/h
min
Infiltration
Precipitation
Runoff
0%
25%
50%
75%
100%
RP10 RP20 RP50 RP100
Nice Strasbourg Vienna Odense
0%
25%
50%
75%
100%
RP10 RP20 RP50 RP100
Nice 1984 Nice 2014
Strasbourg 1984 Strasbourg 2014
Vienna 1984 Vienna 2014
Odense 1984 Odense 2014
Runoff starts Runoff ends
A
B C

14
model projections (van der Linden and Mitchell, 2009; Gregersen et al., 2013; Sunyer et al., 2014; 463
Sunyer et al., 2015). 464
465
The impact of climate change on extreme precipitation is estimated using a change factor (CF) 466
methodology, that is, by comparing the relative change between climate model outputs for present-467
day and future precipitation (Willems, 2012; Sunyer et al., 2014). Extreme value analysis is conducted 468
for present-day (1986-2005) and future (2081-2100) time slices for maximum hourly precipitation 469
(within one day) to calculate intensities for 5, 10, 20, 50 and 100-year return periods (RPs). Change 470
factors, representing the percentage difference between present-day and future precipitation 471
intensities, are estimated under the RCP 4.5 and RCP 8.5 climate scenarios for the ten Cordex 472
simulations of SMHI, which use the RCA4 RCM and different GCMs to highlight variability in model 473
responses to future changes in radiative forcing (Giorgi et al., 2009). Three different change factors are 474
estimated for each city for each climate scenario (RCP 4.5 and RCP 8.5), representing the 10th
and 90th
475
percentiles and averages for the ten model combinations (change factors can be found in publication 476
III, table 2). Multiple change factors are selected to represent (some of) the uncertainty (80% of the 477
models are within the 10th
and 90th
percentiles) in climate model projections of future extreme 478
precipitation. The results of the extreme value analysis show a general increase in extreme 479
precipitation intensity for all locations and return periods and for both RCP 4.5 and RCP 8.5. Also, 480
average change factors are found to increase more for the most extreme events (highest change 481
factors for RP100) and in most cases follow that of global climate change (higher factors for RCP 8.5 as 482
compared to RCP 4.5). We observe a large variation in CFs between the GCMs, as the 90th
and 10th
483
percentile values differ considerably from the average factors. Also, it should be noted here that for 484
some areas a decrease in the intensity of extreme precipitation (CF < 1) is projected by a few models. 485
Risk assessment of climate extremes 4486
4.1 Framework for integrated risk assessment 487
The economic and human consequences of pluvial flooding in urban areas are often large and diverse, 488
as their occurrences are not easily predictable in due time, and because comprehensive statistics on 489
their impacts are not readily available due to the inherently low frequencies of such events. Also, the 490
large degree of heterogeneity within cities means that a variety of assets are exposed to flooding. 491
Integrated assessment frameworks assist in providing directions for how information about the climate 492
system can be linked to physical impacts and related costs to support decision-makers in planning for 493
and adapting to current and future climatic conditions. Climate model projections, downscaling 494
methods, physical impact models, damage measures and economic valuation are central elements in 495
adapting a holistic approach to address the complexity of integrated risk assessments of pluvial 496
flooding (Figure 4-1). 497
498
499 Figure 4-1. Generic structure for climate change risk assessment (publication IV, Fig. 1, and publication 500
V, Fig. 1). 501
502
Frameworks for localized risk assessments are often structured based on the main modelling tools, 503
data and assumptions, which are useful in the context of decision-making for climate adaptation in an 504

15
urban setting. As climate change occurs over long periods of time, it should facilitate long-term 505
climate change risk analysis covering a ten to fifty year time frame and beyond, with the aim of 506
supporting decision-making on local climate change adaptation, for example, for urban areas. Risk 507
assessments require an integrated approach where various sector-specific in-depth models, such as 508
climate models, hydrological models, agricultural models and different cost and social impact 509
assessment tools, are combined with geographical information on land-use and behaviour to identify 510
vulnerable and risk-prone assets. On this basis, an integrated framework and tool (Danish Integrated 511
Assessment System – DIAS, publication V, Fig. 2) is developed to highlight key uncertainties and to 512
address the complex linkages between the different kinds of data required in a climate adaptation 513
context. DIAS aims at facilitating modelling groups and experts in sharing outputs and data, given the 514
understanding that the multidisciplinary character of risk and adaptation studies demands such a 515
structured approach to collaboration. It is emphasized that using highly detailed geographical data 516
enables the risk assessment to focus on localized impacts for specific assets rather than on aggregated 517
impacts, where uncertainties related to the different modelling components are concealed. See section 518
2.2 in publication V for detailed information on the DIAS. 519
4.2 Damage cost assessment 520
Damage costs can be estimated using a bottom-up approach, where cost parameters are assigned to 521
different assets that are expected to be at risk from pluvial flooding. The assets examined in an urban 522
setting include buildings, historical/cultural values, health, transport infrastructure and bodies of water. 523
The costs associated with damage to these assets can subsequently be transformed into a measure of 524
‘willingness-to-pay’ (WTP) reflecting welfare loss, where risk aversion, equity concerns (given by 525
alternative discount rates) and inequality (primarily for LDCs) are taken into consideration. 526
527
In the current study (results presented in sections 5.2.1 and 5.2.2), total and annualized damage costs 528
are estimated by combining flood-hazard maps with information on the geographical location of 529
vulnerable assets and individual unit costs for each asset. The damage cost assessment is based on two 530
alternative damage functions that describe the relationship between damage costs for individual 531
assets, surface water depth and precipitation intensity (Figure 4-2). In a traditional “damage curve” 532
(DC) approach, the modelled maximum flood depth during precipitation is used directly as a measure 533
of severity. Using this method, asset damage costs increase linearly with surface water depth until it 534
reaches a predefined level where it is assumed that the maximum possible damage occurs. The water 535
level for maximum damage varies between different assets as a consequence of differences in 536
vulnerability to the impacts of flooding (publication IV, table A1) (Davis and Skaggs, 1992; Jongman et 537
al., 2012). In the ‘event-driven’ (ED) approach, unit damage costs are kept constant for all water levels 538
exceeding a certain water depth threshold. As assets have different susceptibilities to the water level 539
required to cause damage, a water depth threshold is defined for each asset type that remains 540
constant for all precipitation events. Instead damage unit costs follow the intensity and total amount 541
of precipitation (red ED line and red x-axis in Figure 4-2) (publication IV, table A2). The logic behind 542
this approach is that the likelihood of assets being flooded with water levels above the defined 543
threshold increases with the intensity of precipitation, causing a higher damage cost per flooded asset. 544
This relationship (ED) has been confirmed by the available data for insurance claims from flooding 545
during extreme precipitation in Denmark from 2006 to 2013, where average insurance claims are 546
observed to be three to ten times higher for damage from very extreme precipitation as compared to 547
more frequent (less intense) events (Danish Insurance Association (DIA), 2015). A variety of alternative 548
and more detailed damage functions can also be applied to describe the relationship between damage 549
unit costs and flood severity, including non-linear functions (concave/convex) and threshold (TH)-550
based methods (Figure 4-2). 551
552

16
553 554
Figure 4-2. Different conceptual damage functions based on flood depth and precipitation intensity. 555
ED = event driven (top x-axis), DC = damage curve (low x-axis), TH = threshold (low x-axis) (figure not 556
included in any of the publications). 557
4.3 Uncertainties in climate scenarios, impact analysis and economics 558
Combing projections of climate extremes with analytical tools such as flood models and cost-benefit 559
analysis in a climate adaptation decision-making context introduces high levels of uncertainty. This 560
uncertainty is caused primarily by the inability to accurately project future extreme precipitation and 561
related flood levels, as well as to the methodological shortcomings involved in assessing damage costs 562
for cities over long periods of time. Also, no single recommendation on the use of discount rate, risk 563
aversion factor and inequality factor exists for risk estimates in a climate change context, which 564
provides the basis for great variation in risk estimates, and thus a large degree of uncertainty in the 565
appropriate response (level of optimal adaptation) to future climate change. 566
567
The uncertainties related to the different steps of an integrated risk assessment have different 568
characteristics depending on their origin. Structural uncertainties reflect incomplete understanding of 569
the processes and components of the earth system as represented in climate and impact models 570
(Mastrandrea et al., 2010), while other uncertainties are related to economic models in which valuation 571
issues, risk attitudes and discounting approaches can play a major role (publication IV). Precipitation 572
projections are in general very uncertain and predominantly in the short-term model variation, and 573
"noise" from natural variability is a key driver of uncertainty, while the influence of climate scenario 574
becomes increasingly important in the long-term perspective (Hawkins and Sutton, 2011). The 575
downscaling of the frequencies and intensities of extreme precipitation to relevant geographical scales 576
– that is, for specific urban areas – adds yet another large element of uncertainty. Against this 577
background, it can be said that risk assessments of pluvial flooding in cities face large uncertainties 578
simply because it is very difficult to estimate the probability of current and (especially) future events 579
for specific locations. The probability of extreme precipitation may be expressed in the form of a 580
probability density function (pdf), which provides a comprehensive description of precipitation 581
characteristics with respect to both frequency and intensity. In practice, however, it is far from trivial to 582
construct such a pdf, and in some cases more stylized shapes of pdfs are therefore used to explore the 583

17
tails of the distribution given certain assumptions about uncertainties (Figure 4-3). In this idealized 584
example, both distributions depict a nearly identical central value of an increase in, for example, daily 585
mean precipitation, which could be interpreted as the mean (median) of the different climate model 586
projections, whereas the tails of the pdfs express (extreme) values further and further away from the 587
mean. The tails of the two pdfs differ significantly in their ‘fatness’, and while the ‘thin-tailed’ pdf is 588
heavily centred and symmetric around the mean, the red ‘fat-tailed’ pdf is somewhat skewed and lends 589
higher probability to extremes. This implies that the tails corresponding to high-end climate scenarios 590
are similarly likely to be relatively ‘fat’. 591
592
593 Figure 4-3. Stylized representation of two alternative climate variable distributions (publication IV, Fig. 594
2). 595
596
When assessing the risks of extreme events it is important to recognize that the willingness to pay 597
(WTP) for avoiding the impacts is very dependent on the general risk aversion of decision-makers and 598
society as a whole. One way to include the uncertainty in economic valuation is to apply a risk aversion 599
factor. Risk aversion, by definition, is the reluctance of a person to accept a bargain with an uncertain 600
payoff rather than a bargain with a certain payoff. As already pointed out, extreme consequences of, 601
for example, high-end climate scenarios are by their very nature uncertain. Adding a risk aversion 602
factor to reflect people’s attitudes towards risk will increase the estimated damage costs. To exemplify 603
how climate change uncertainties and economic assumptions influence risk levels, we apply the 604
methodological framework to assess flood damage and risks due to extreme precipitation in the city of 605
Odense (sections 5.2.1 and 5.2.2) and through a case study of extreme storms in Cambodia (section 606
5.2.3). A detailed description of the case study for Odense is found in publications IV (sensitivity 607
analysis) and V (flood risk assessment), while the example from Cambodia is presented in publication 608
VI. 609
Results 5610
5.1 Impacts of urban development and climate change on pluvial flooding 611
The findings of the combined remote-sensing and flood-model analyses show a clear pattern of 612
increased flooding for precipitation with longer return periods and for events simulated with elevated 613
levels of imperviousness, which is caused by urban development during 1984-2014 (Figure 5-1). Also, 614
climate change is found to dramatically exaggerate flooding for all return periods under both the RCP 615
4.5 and RCP 8.5 scenario, with the latter having a greater impact in general. The uncertainties related 616
to the projection of future precipitation intensities are found to be large compared to that of urban 617
development, and in all cases we observe that the uncertainty increases with the intensity of 618
precipitation (wider errors bars for RCP 4.5 and RCP 8.5 and when moving towards the most extreme 619
events) (Figure 5-1). There is some difference in how severely the cities are impacted by flooding 620
depending on their geographical location, climatic conditions, soil properties and topographies. For 621

18
Odense the share of total area experiencing flooding approximates to 5% for the most severe events 622
while approaching 10% for Vienna and Strasbourg and 20% for Nice. 623
624
625
626 Figure 5-1. Total area flooded by more than 10 cm of surface water during extreme precipitation with 627
different return periods (RP10-RP100). 1984 = imperviousness in 1984, 2014 = imperviousness in 2014. 628
Error bars represent low/high infiltration rates and low/high climate factors (CFs) respectively (low CF = 629
10th percentile, high CF = 90th percentile). The horizontal %-lines highlight the share of the total 630
urban area for each city (publication III, Fig. 6). 631
632
The relative change in flooding as a consequence of urban development is consistent with the 633
conceptual relationship (see section 3.2 and publication III) between changes in imperviousness and 634
overall exposure to flooding, and the impacts of increasing IS fractions are thus found to be inversely 635
related to the intensity of the precipitation (Figure 5-2). This implies that soil-sealing is a key driver of 636
exposure to flooding for the least extreme events (<RP10-RP20), while only marginally affecting 637
flooding during precipitation with longer return periods. Also, we find that the influence of urban 638
development is highly dependent upon the local soil-infiltration properties and that the impact of soil-639
sealing in this respect follows the soil-infiltration rate. As a consequence, urban development is a main 640
driver of changes to exposure to flooding for Odense and Vienna but only marginally important for 641
Strasbourg and Nice (Figure 5-2). This is in accordance with what was expected from the variations in 642
soil-infiltration properties between the cities, assuming equal historical urban development patterns 643
during 1984-2014 (Table 3-1). For Odense and Vienna the influence of recent urbanisation is 644
comparable with that of the RCP 4.5 scenario, while climate change is the dominant driver of changes 645
for both Strasbourg and Nice. Since we did not observe a high level of variability in the estimated 646
changes in IS fractions during 1984-2014 for the four cities (absolute change of 6%-12%), the 647
importance of this for our results is limited compared to the influence of variations in soil-infiltration 648
rates. A large degree of uncertainty in the impact of climate change is identified, especially for the 649
most extreme events, with a few models projecting a decrease in precipitation intensities and general 650
exposure to flooding for Vienna and Odense (error bars below 0 for RP20-RP100 under RCP 4.5). 651
0
2
4
6
8
10
RP10 RP20 RP50 RP100
km
2
Odense
1984
2014
RCP45
RCP85
0
10
20
30
40
50
60
RP10 RP20 RP50 RP100
km
2
Vienna
1984
2014
RCP45
RCP85
0
5
10
15
20
25
RP10 RP20 RP50 RP100
km
2
Strasbourg
1984
2014
RCP45
RCP85
0
5
10
15
20
RP10 RP20 RP50 RP100
km
2
Nice
1984
2014
RCP45
RCP85
5%
5%
10%
5%
10%
5%
10%
20%

19
652
653
654 Figure 5-2. Relative annual change in flooded area (>10 cm water depth) due to urban development 655
(UD) and climate change (RCP 4.5 and RCP 8.5) during extreme precipitation with different return 656
periods (RP10-RP100). Error bars represent low/high infiltration rates and low/high climate factors 657
(CFs) respectively (low CF = 10th percentile, high CF = 90th percentile) (publication III, Fig. 8). 658
659
The observed impacts of urban development in exposing cities to pluvial flooding are highly sensitive 660
towards the choice of case cities, the historical period selected for analysis of IS changes and the 661
selected flood threshold (flooding is defined as areas with > 10 cm of surface water during 662
precipitation). To overcome the issue that the results are primarily descriptive for the selected cities 663
under the predefined conditions (1984-2014), and to test the sensitivity of the selected flood threshold 664
(which is often defined as the surface water depth where damage begins to occur), the influence of 665
urban development on flood exposure is calculated as an increase in flooding per IS change and 666
investigated for four different flood depth thresholds (representing when an area is considered 667
flooded), ranging from 1-20cm (publication III, Fig. 9). The results of the sensitivity analysis can be 668
merged into the following important findings. Firstly we find that the effect of urban development 669
causes flooding to increase by 0-5% every time average imperviousness increases by 1%, and that 670
flooding is affected more for higher thresholds (20 cm) than for low flood depths. Secondly, we 671
observe that the influence decreases rapidly for all flood thresholds as we move towards the most 672
extreme precipitation events, and that the relative importance of urban development and climate 673
change respectively is unaffected by variations in flood thresholds. 674
5.2 Risk assessments 675
5.2.1 Flood risk assessment for the city of Odense 676
A case study of pluvial flooding in the city of Odense is conducted, following the generic structure for 677
climate change risk assessments (Figure 4-1) and the analytical flow in the DIAS (publication V). The 678
aim of this example is to highlight how detailed spatial analysis can assist in identifying and reducing 679
-1%
0%
1%
2%
3%
4%
RP10 RP20 RP50 RP100
%/y
ear
Odense
UD
RCP45
RCP85
-1%
0%
1%
2%
3%
4%
RP10 RP20 RP50 RP100
%/y
ear
Vienna
UD
RCP45
RCP85
-1%
0%
1%
2%
3%
4%
RP10 RP20 RP50 RP100
%/y
ear
Strasbourg
UD
RCP45
RCP85
-1%
0%
1%
2%
3%
4%
RP10 RP20 RP50 RP100
%/y
ear
Nice
UD
RCP45
RCP85

20
key uncertainties in order to provide optimal decision-making support for climate adaptation and in 680
planning the climate-proofing of cities in the future. 681
682
Odense is the third largest city in Denmark and has a population of around 170,000 people. Previous 683
flooding events in Odense in the period 2006-2012 have shown that a wide diversity of assets are at 684
risk during extreme precipitation, including transport infrastructure, buildings, human health, aquatic 685
environments, recreational areas and historical and cultural sites. The flood risk assessment is 686
conducted by linking information on the geographical location and properties of relevant assets with 687
flood-hazard maps for extreme precipitation with different return periods. Flood-hazard mapping is 688
done using a combined drainage system and overland flow model (1D/2D model), which calculates 689
surface and sub-surface flows during extreme precipitation. Within this modelling framework, the 690
occurrences of five different design precipitation events, corresponding to return periods of 5, 10, 20, 691
50 and 100 years under current and future climatic conditions, are simulated for the city of Odense 692
(Municipality of Odense, 2014). The impacts of climate change are investigated for three different 693
climate scenarios, i.e. RCP 4.5, RCP 8.5 and a +6 °C scenario (van der Linden and Mitchell, 2009; 694
Arnbjerg-Nielsen et al., 2015; Christensen et al., 2015). 695
696
Surface flooding occurs during all of the examined events, and the total quantity of assets affected by 697
flooding is found to increase with the intensity of precipitation (publication V, Table 2). As an example, 698
the total number of houses affected by flooding ranges from 87 to 576 for the least and most severe 699
events respectively, and similar trends are observed for other building types and for transport 700
infrastructure. In the case of health impacts and irreplaceable assets such as historical buildings, a 701
particularly high number of incidents is seen to appear for precipitation exceeding a threshold of 30 702
mm h−1 (RP20 – present-day climate). The damage costs caused by pluvial flooding are found to 703
increase with the intensity of precipitation and the extent of flooding, varying from ≈17M€ for the 704
smallest event to ≈320M€ for the event with the highest maximum intensity (Figure 5-3a). The 705
development of total damage costs when one moves from low to high intensity events is not linearly 706
related to the maximum intensity of the individual events: large increases in damage costs are 707
observed when moving from precipitation events of 25mm/hr (RP10 – present-day) to 30mm/hr (RP20 708
– present-day) and beyond. In a climate adaptation context it is therefore especially important to 709
consider whether the probabilities of these events are expected to increase dramatically in future 710
climate scenarios. The damage to service and industry, houses, multi-storey residential buildings and 711
roads is responsible for a greater share of the total damage costs for all precipitation events (Figure 712
5-3b). Conversely, damage to bodies of water, leisure facilities, railways and health costs are only 713
marginally present in the cost summary. The absolute damage costs are considered conservative, as 714
some indirect and intangible losses, including disruption to economic activities, traffic delays and 715
impacts on urban ecosystems, are not covered in the assessment. 716
717

21
718 Figure 5-3. Damage cost summary: (a) total costs and (b) share of total cost of flooding in the 719
Municipality of Odense during extreme precipitation with different intensities (costs are measured as 720
the total loss of an event) (publication V, Fig. 8). 721
722
The risks of pluvial flooding can be calculated as the expected annual damage cost during a 723
predefined time period by combining climate projections and economic assumptions such as discount 724
rates and risk-aversion factors. From a decision-maker’s point of view, this implies that the expected 725
annual risks provide the upper boundary for what society should be willing to pay to protect itself 726
against the impacts of a given extreme event. The level of expected risks, and thus the resources 727
considered appropriate for climate adaptation, depends considerably on expectations of future 728
precipitation extremes. The probability of extreme precipitation is found to increase for scenarios 729
associated with higher changes in global mean temperature (Figure 5-4a). This implies that, if we 730
consider the frequency of specific events, then the distributions derived from the higher-end scenarios 731
are effectively “fat-tailed” as compared to the “thin-tailed” distributions derived from lower scenarios 732
or present-day conditions. As the annual probability of extreme precipitation varies dramatically 733
between the different climate scenarios, the "choice" of climatic future has important implications for 734
the outcome of the risk assessment, and thus for the appropriate response (the optimal level of 735
adaptation) to climate change in this respect. The risks, measured as the probability of precipitation 736
events multiplied by the damage costs, are shown for the alternative climate scenarios, and the costs 737
are calculated as the total costs of an event transformed into to Net Present Values (NPV) over a 738
hundred-year period using a 3% discount rate (Figure 5-4b). 739
740
For all climate scenarios, the risks of flooding from extreme precipitation are maximised at 741
precipitation intensities of 30mm/hr (RP20), and we observe annual damage costs ranging from 2-10 742
M € for the different climate scenarios (Figure 5-4b). For the high-end scenarios (RCP 8.5 and +6°C), 743
risks almost remain constant when moving towards the most extreme events, while decreasing 744
considerably for present-day climate and RCP 4.5. This could suggest that if high-end climate scenarios 745
are expected, climate change adaptation should aim, from an economic point of view, at a high level of 746
protection (40mm/hr), while a more modest level of adaptation may be optimal under present-day 747
climatic conditions and for lower climate scenarios. Also, the large difference in risks between the 748
different scenarios (a factor of 5, 2-10 M €) should be noted, as it highlights a large variation in how 749
much society should be willing to spend on adaptation measures depending on which climate scenario 750
is realised. 751
752
0 €
50 €
100 €
150 €
200 €
250 €
300 €
350 €
20 25 30 35 40
Precipitation events (mm/hr )
Mil
lio
ns
Historical and cultural assets Waterbodies
Health Railways
Roads Basements
Leisure house Houses
Multistorage residential Service and industry
0%
20%
40%
60%
80%
100%
20 25 30 35 40
Precipitation events (mm/hr )
Historical and cultural assets Waterbodies
Health Railways
Roads Basements
Leisure house Houses
Multistorage residential Service and industry
A B

22
753 Figure 5-4. (A) Annual probability of extreme precipitation events. 25mm/hr corresponds to a 10-year 754
return period under present-day conditions (10%/year) etc. (B) Risks of flood damage over a 100-year 755
period for different climate change scenarios based on the ED approach, using a 3% discount rate and 756
a low risk-aversion factor of 1, RCP 8.5+ = RCP 8.5 where the value of historical/cultural assets is 757
multiplied by three (publication V, Fig. 7, Fig. 10). 758
759
5.2.2 Sensitivity analysis 760
The assessment of risk from high-end climate scenarios and the impacts of pluvial flooding depend on 761
a number of critical assumptions and methodological challenges related to key uncertainties in climate 762
scenarios and modelling, impact analysis and economics (Halsnæs et al., 2015 - publication IV). 763
Applying alternative economic assumptions to the damage cost assessment expands the range of risk 764
estimates for the different climate scenarios. A sensitivity analysis addresses 32 combinations of 765
climate scenarios, damage cost-curve approaches and economic assumptions, including risk aversion 766
and equity considerations represented by discount rates, to illustrate the role of uncertainties and the 767
importance of key drivers in determining the risk from pluvial flooding. Four different climate scenarios 768
are considered: a reference case reflecting present-day climatic conditions, a 2°C and a 4°C scenario 769
corresponding to the RCP 4.5 and RCP 8.5 scenarios respectively (IPCC 2013), and finally a special + 770
6°C climate scenario provided by the Danish Meteorological Institute (Christensen et al., 2015). The 771
climate scenarios are combined with two different damage assessment approaches (Damage Curve or 772
DC and Event Driven or ED). We then apply risk-aversion factors of 3 and 1 respectively, where a factor 773
of 1 implies risk neutrality that is, cost estimates are not adjusted by the risk perception. The factor of 3 774
represents a “middle-of-the-road” perspective often favoured by real-life decision-makers, effectively 775
“averaging” risks across a range of different assets, replaceable as well as irreplaceable. Finally, the 776
alternatives are translated into annualized costs using a (moderate) 3% or a (low) 1% discount rate for 777
a total of 32 combinations (publication IV, Fig. 3). 778
779
The annualized damage costs for the lowest and the highest risk estimates vary from about 85 million 780
EUR down to less than 1 million EUR (Figure 5-5a). The wide range of risk estimates is a result of 781
different combinations of climate scenarios and economic assumptions, and here it is clear that going 782
beyond a 2°C climate scenario has great implications for the risk estimates. In terms of decision-783
making, however, it is important to note that most of the combinations of economic assumptions and 784
climate scenarios assess the risk to be between 7 and 30 million EUR yr−1, while only 4 out of the 32 785
combinations really stand out and go far beyond a 30 million EUR yr−1 risk level. The high-risk cases 786
correspond exclusively to the RCP 8.5 and +6°C climate scenarios, a risk-aversion factor of 3 and a low 787
discount rate of 1%. In conclusion, it can be said that the alternative climate scenarios included in 788
1%
10%
100%
1000%
20 25 30 35 40
Precipitation events (mm/hr)
0 €
1 €
10 €
20 25 30 35 40
Precipitation events (mm/hr)
Co
sts
(x1
06
EU
R y
r-1
)
+6°C
RCP 8.5 +
RCP 8.5
RCP 4.5
Present day
1 year
10 year
100 year
Ret
urn
per
iod
(R
P)
A B
Fat tail

23
Figure 5-5a show variation in the risk estimates from ~25 million EUR yr−1 as the highest estimate for 789
the 2°C scenario to about 80 million EUR yr−1 for the 6°C scenario. Keeping the 6°C scenario constant 790
and then alternatively varying the economic assumptions on risk aversion and discount rate provides 791
an almost similar range of risk estimates (Figure 5-5b). Thus, given our assumptions, we can conclude 792
that the climate scenarios and economic assumptions influence the risk estimates in very similar ways. 793
794
795 Figure 5-5. (A) Risks represented by levelized costs over a hundred-year period calculated for all 32 796
scenario combinations. (B) Range of levelized costs for different climate scenarios and precipitation 797
intensities. Red: +6°, blue: +4°, purple: +2°C climate scenario combinations; green = present-day 798
(publication IV, Figs. 9 and 10). 799
800
5.2.3 A least developed country perspective: a case study from Cambodia 801
Least developed countries (LDCs) are particularly vulnerable to the impacts of climate extremes due to 802
their low incomes, weak infrastructure and public institutions, and thus a low capacity for coping with 803
the adverse impacts of climate change. Risk assessments for LDCs are often characterized by even 804
greater uncertainties due to data limitations and because research efforts on future climate extremes 805
and related impacts are not as readily available when compared to highly developed regions. However, 806
despite these uncertainties and limitations, it is extremely relevant to study the consequences of 807
climate change and extreme events for LDCs, as their impacts are expected to be most pronounced 808
here (Field et al., 2012). A methodological framework for estimating damage costs and risks is 809
described and applied to a case study of risks from storms in Cambodia with the aim of highlighting 810
the importance of key uncertainties and specific vulnerabilities when conducting risk assessments for a 811
developing country. A sensitivity analysis is presented in which a few general assumptions concerning 812
trends in climate extremes (climate scenarios) and associated damage illustrates how climate 813
projections, inequality concerns (impacts on low-income household), risk aversion and discount rates 814
influence damage costs and risk estimates considerably. Damage from climate extremes in LDC will in 815
many cases particularly harm people with low incomes. We therefore suggest applying an income 816
inequality factor to the damage estimates to reflect the fact that damage to low-income households 817
should have a high priority. 818
819
Two alternative climate scenarios are used to project damage from storms and cyclones in Cambodia 820
during 2015-2030 (Figure 5-6). Climate Scenario 1 represents a continuation of present-day climate 821
and assumes constant frequency of the severe storms corresponding to the mean value of the events 822
for the period 1996–2014. Climate Scenario 2 projects an increased frequency corresponding to a 823
linear extension of the trends observed in the period 1996–2014. The importance of risk aversion is 824
examined by applying a risk-aversion factor of 3 and an alternative factor of 1, which represents risk 825
neutrality. Inequality concerns are included using two different inequality factors (low and high) to 826
represent damage affecting low-income groups. Likewise, two different discount rates (5% and 7%) are 827
included to investigate the effect of alternative equity assumptions. 828
829
A B

24
830 Figure 5-6. Number of damaged houses, victims and observed storms in Cambodia in the period 831
1996–2014, and projected number of storms in climate scenarios 1 and 2 for the period 2015–2030 832
(publication VI, Figs. 5.3, 5.4). 833
834
A sensitivity analysis combines the climate scenarios, risk-aversion factors and inequality aversion 835
factors to illustrate how risk estimates are influenced by priorities to avoid damage affecting low-836
income groups in developing countries. The estimates of WTP are calculated for a sixteen-year time 837
frame, which means that we are calculating a proxy value of damage based on climate scenario 838
assumptions for the period 2015–2030 (Figure 5-7). The damage proxy for severe storms increases 839
considerably with the application of income inequality factors. This is the case for both factors, and it 840
can be observed that adding a dimension in which the vulnerabilities of low-income groups are valued 841
as a particularly high welfare loss can make a big difference to economic estimates of what society 842
should be willing to pay to avoid extreme climate events. Adding a risk-aversion factor of three also 843
increases the damage proxies considerably. Finally, in all cases we find a dramatic increase in damage 844
with climate scenario 2 as compared to climate scenario 1, as the number of storms increases here due 845
to climate change. The importance of the choice of discount rate in the NPV calculations is illustrated 846
in Figure 5-7, where combinations of the climate scenarios and the WTP assumptions are calculated as 847
annual NPVs using two different discount rates (5% and 7%). Here it can be seen that the application 848
of high factors of income inequality and risk aversion make a much greater difference to the damage 849
cost proxies as compared to using alternative discount rates. In conclusion, it can be said that the 850
sensitivity cases demonstrate that assessments of welfare implications of extreme events strongly 851
depend on how particularly vulnerable people (e.g. low-income households) are addressed in the risk 852
assessment. It must be remembered that low-income households most often live in houses which are 853
poorly protected against storms, and possibly in geographical areas that are especially exposed to the 854
occurrence of and impacts of extremes. Following these arguments, applying an evaluation framework 855
for assessing the WTP for avoiding damage as suggested in this chapter suggests that, seen from a 856
welfare economic point of view, society should give a high priority to adaptation investments in 857
vulnerable LDCs with a high density of low-income households. 858
859
860
861
862
863
864
865
866
867
76
366
0
100
200
300
400
0
10000
20000
30000
19
96
19
98
20
00
20
02
20
04
20
06
20
08
20
10
20
12
20
14
20
16
20
18
20
20
20
22
20
24
20
26
20
28
20
30
Nu
mb
er o
f st
orm
s
Ho
use
s d
amag
ed a
nd
vic
tim
s HousesVictimsObserved stormsClimate scenario 1Climate scenario 2

25
868 Figure 5-7. Index of the annual NPVs of damage cost proxies for different combinations of 869
assumptions with regards to climate scenario, discount rate, inequality factor and risk aversion 870
(publication VI, Fig. 5-6). 871
0
5
10
15
20
20
15
20
16
20
17
20
18
20
19
20
20
20
21
20
22
20
23
20
24
20
25
20
26
20
27
20
28
20
29
20
30
1
2
3
4
Combinations 1 2 3 4
Climate scenario damage proxy
2.48 2.48 1 1
Discount rate 5% 7% 5% 7%
Risk aversion factor
3 3 1 1
Inequality factor 3.98 3.98 1.83 1.83
Combinations

26
Discussion 6872
This section presents and discusses the implications of the main findings of this thesis and focuses on 873
highlighting the perspectives for applying and evaluating the developed methodologies and the 874
results in a broader context. The discussion is divided into two parts, corresponding to the main 875
research objectives as listed in the introduction (section 1.2). 876
877
Research objective 1 878
6.1 Impacts of urban development and climate change on pluvial flooding 879
Most major cities in Europe and globally are characterized by high IS fractions. If present trends 880
towards increased soil-sealing continue, this is expected to aggravate the risk of pluvial flooding 881
further (EU and EEA, 2012). On the other hand, the introduction of more pervious surfaces could count 882
as an adaptation to climate change. Increased knowledge of the importance of both changes to urban 883
land cover and climate change for the exposure of urban areas to flooding will provide substantial 884
insights for planning the climate-proofing of cities in the future, as well as for predicting future 885
changes in flood regimes (Hall et al., 2014). Also, detailed geographical information on the relative 886
importance of urban development and climate change will assist decision-makers and city planners in 887
prioritize resources efficiently between different adaptation measures and mitigation efforts. 888
In this research, we demonstrate the applicability of a combined remote-sensing and flood-model 889
methodology for investigating spatial and temporal variations in the exposure of cities to pluvial 890
flooding due to changes in urban land cover (imperviousness) and climate change. Whereas similar 891
modelling work is carried out for most European cities, often using flood models of much higher 892
complexity for the purposes of, for example, urban drainage design and cloudburst management, the 893
analytical framework presented here is particularly suited for large-scale mapping (i.e. at the city level). 894
The combination of remote-sensing estimates with an easily customizable flood-modelling approach 895
principally allows for analyses that take into account past and present-day urban development (and 896
potentially projected future changes) as well as climate change in a consistent manner that is readily 897
applicable to the majority of cities in Europe and for a predominant proportion of urban areas globally. 898
Arguably, this may prove an important tool for policy-makers in facilitating urban adaptation to 899
climate change at the European level, and is in line with the main outcome of the Paris Agreement 900
(COP21), which places adaptation, resilience and response to the impacts of climate extremes at the 901
core of the continued work of the international community in climate change research and decision-902
making (EU and EEA, 2012). 903
904
The impacts of urban development on exposure to flooding are found to vary considerably between 905
geographical locations and for extreme precipitation with different return periods. Soil texture 906
characteristics and urban topographies are the primary factors determining soil-infiltration rates, and 907
consequently the impact of soil-sealing on run-off volumes and exposure to flooding. Changing levels 908
of imperviousness play a major role in determining the extent and depth of flooding for areas 909
characterized by relatively high infiltration rates, while to a lesser degree affecting urban hydrology for 910
cities with finer soil textures or major differences in elevation. As an example, we find that urban 911
development in Odense and Vienna influenced the extent of flooding considerably, while only 912
marginally affecting it for Strasbourg and Nice. This indicates that green adaptation measures are only 913
an efficient adaptation strategy preventing pluvial flooding for some locations. We observe a declining 914
impact of soil-sealing with increasing precipitation intensities (greater impacts for shorter return 915
periods), leading to the obvious conclusion that using pervious surfaces as adaptation measures are 916
most efficient for the least severe events, while not providing any noticeable protection against 917
flooding during very extreme precipitation. The four selected cities represent a wide range of soil-918
infiltration rates, and the reported impacts of urban development on flood severity could be expected 919
to be representative for many other cities, particularly in Europe. We have found that an increase in 920
overall imperviousness of 1% causes the area affected by flooding to increase by up to 5% for the 921
shortest return periods, while only slightly affecting flood exposure during very extreme precipitation. 922
From the perspective of climate change adaptation, this clearly demonstrates quantitatively the 923

27
effectiveness of pervious surfaces as measures for reducing exposure to flooding. Conceptually, if 924
measures were implemented reducing overall imperviousness by 1%, exposure to flooding would 925
decrease by up to 5% for some locations and only marginally affect flood levels for other locations. 926
Results suggests that the past thirty years of urban development alone has increased exposure to 927
pluvial flooding by 0.5-1.2%/year for RP10, decreasing to 0-0.4%/year for hundred-year events. 928
Corresponding estimates for RCP 4.5 and RCP 8.5 (climate scenarios) are in the order of 1-2%/year 929
(RP10) and 0.2-1%/year (RP100), indicating that the impacts of changes to urban land cover and 930
climate change are comparable and that both adaptation and mitigation efforts are central in reducing 931
the exposure of urban areas to pluvial flooding. 932
933
The findings of this study can be used in combination with projections of urban land cover to provide 934
estimates of expected changes in flooding regimes due to future urban development. Assuming that 935
urban development trends continue at their current rates over the next hundred years for Nice, 936
Strasbourg, Vienna and Odense, this implies that the additional share of the total urban land cover 937
which can be expected to experience flooding during extreme precipitation approximates to 0.2–1.1% 938
(the share of urban land cover experiencing flooding at present-day levels of imperviousness ranges 939
between 0.5-15%, but is in most cases below 5-10%; see Figure 5-1). For comparison, climate change is 940
found to cause surface flooding to an additional 0.3–5% of urban land cover and can be expected to 941
be the major driver of changes to pluvial flood regimes for some locations, including cities that have 942
similar characteristics (soil textures, urban development, topography, climate projections) like 943
Strasbourg and Nice. The relative importance of past and future urban development and climate 944
change for overall exposure to flooding will differ according to the city and region-specific urban 945
development patterns. The results presented here are thus not considered valid for regions that are 946
characterized by rapid urbanisation, including some Asian and African megacities. For such regions, 947
urban development will most likely be the primary driver of changes to exposure to pluvial flooding. 948
949
The analyses of the impacts of climate change on extreme precipitation suggest that the degree of 950
change is following that of general climate change: that is, as global warming increases, so does the 951
intensity and frequency of extreme precipitation. The uncertainty associated with climate change 952
projections and with different methods of downscaling is well documented, and our results confirm 953
that projections of extreme precipitation differ considerably between different combinations of GCMs 954
and RCMs, and even with some disagreement over the direction of change (i.e. whether events are 955
becoming more or less intense and frequent) (Frei et al., 2006; IPCC, 2014; Sunyer et al., 2014). As a 956
result, the derived climate factors exhibit large variations within the individual climate scenarios. Also, 957
some uncertainty remains in the projected level of change as the estimated change factors are derived 958
using combinations of multiple GCMs with only one RCM. Including a larger number of RCMs would 959
potentially change both the average factors and the calculated percentiles. Adopting a conservative 960
approach, where multiple model runs are used to calculate average change factors, which represents a 961
“middle of the road estimate”, is commonplace. However, if used for adaptation planning, one could 962
instead argue for focusing on the tails of the distributions (best-case and/or worst-case scenarios) to 963
ensure robustness in decision-making. 964
965
A few challenges related to the methodology presented here need to be considered when interpreting 966
the findings of the analyses. The flood model used in this study does not include a module for spatial 967
representation of the drainage system. The geographical location of surface flooding may therefore be 968
inaccurate for some locations due to inconsistent dimensioning, since in practice the actual drainage 969
system is not likely to be perfectly dimensioned according to a five-year rainfall event for all locations 970
(the full load of the drainage system is assumed to correspond to a five-year event for all cities). 971
Neglecting the sewage system, errors are also introduced into the extents and locations of flooding, 972
but these effects are assumed to be localized, and their importance decreasing for more extreme 973
precipitation (Paludan et al., 2011). Using a more advanced hydrological model (e.g. 1D/2D models 974
including a drainage system component) reduces the transferability of the overall method to other 975
locations where such data are not readily available. Evidently, the choice of flood model (MIKE 21 976
overland flow model) makes it easily transferable to other cities at the cost of some precision. Detailed 977

28
information on location-specific soil-infiltration rates during extreme precipitation, which is the 978
primary parameter determining the impact of urban development, is often not available, and the 979
uncertainty surrounding the selected values is considered to be very large. To represent some of this 980
uncertainty, we included low/high values, and we expect the actual impacts of soil-sealing to fall within 981
the estimated range of flood responses as calculated here. However, the results should still be 982
interpreted with some caution. Also, the soil water/moisture content at the onset of precipitation can 983
influence the amount of run-off substantially. In the current study, soils are kept dry at the beginning 984
of all simulations to ensure that the results are comparable between the different precipitation events 985
and different geographical locations. 986
987
The outputs of the urban development analyses, where an increase in overall IS fractions of 7-12% 988
during 1984-2014 is observed, are considered fairly robust, as the method being applied is well-989
established and documented, though a few aspects deserve additional attention. Using information on 990
vegetation cover to estimate impervious surfaces is highly sensitive to the presence of bare soil and 991
should be used with caution outside urban areas, as the accuracy decreases considerably for other 992
types of land cover (e.g. agricultural areas, forest etc.). Also, some uncertainty remains due to 993
differences in the spectral response function between the Landsat TM and Landsat OLI sensors, as 994
official conversion factors are not yet available for all locations and environments. 995
6.2 Remote sensing of impervious surfaces 996
Satellite imagery and remote-sensing techniques provide almost complete coverage of the past forty 997
years of changes to land cover and land use globally, including in urban areas. However, many of the 998
existing methods based on remote-sensing techniques are often considered highly complex and 999
inaccessible by potential users, in particular outside the scientific community. A simple method for 1000
estimating the quantity and location of IS, which is based on the freely available Landsat archive, 1001
covering the past thirty to forty years of global urban development, is developed to facilitate the 1002
mapping of urban land cover and temporal changes in it for a wide range of people and applications, 1003
including flood-modelling. In the current study we develop and apply a method for the spatiotemporal 1004
mapping of IS as a proxy for urban land cover by use of simple linear regression models based on 1005
vegetation indices from remote sensors. We observe a relatively low variability in accuracies across 1006
geographical locations, as well as for urban areas characterized by diverse vegetative and climatic 1007
conditions, suggesting that vegetation cover, as measured from Landsat 8 imagery, can be used to 1008
provide estimates of IS fractions for a major proportion of urban areas in Europe today, which is 1009
sufficiently accurate for a multitude of applications (Figure 6-1b). In combining the findings of this 1010
study with the results of previous research efforts conducted on data from earlier Landsat missions 1011
(especially Landsat 5 and 7), it is evident that IS can be mapped solely from Landsat imagery at the 1012
same level of accuracy for the past thirty to forty years. Consequently, this enables simple and 1013
systematic analyses of historical changes in small-scale imperviousness for many cities globally. 1014
1015
The results of the accuracy assessment clearly indicate that potentially local regression models can be 1016
“spatially transferred” to quantify IS fractions for other urban areas without losing high levels of 1017
accuracy (Figure 6-1a). The VI/IS relationship is found to be similar for cities characterized by 1018
comparative vegetative and climatic conditions, and cross-validations of the developed models show 1019
equivalent results with relatively low errors for a number of different combinations of city-specific 1020
models and urban sub-areas. For this purpose, the Soil Adjusted Vegetation Index (SAVI) is found to 1021
perform the best. Compared to other vegetation indices, SAVI reduces the influence of variations in 1022
soil background colour/building materials, which arguably could be the cause for the better 1023
performance of the models based on SAVI. The results of the analyses for the regional regression 1024
models are promising in relation to developing models, which can be applied to multiple cities over a 1025
larger geographical area. This also demonstrates that VIs, and especially SAVI, show similar 1026
characteristics for cities located in areas with similar vegetative and climatic conditions, and that single 1027
regression models based on Landsat VIs (SAVI in particular) can be applied uniformly for multiple 1028
urban areas with adequate precision. However, if regional regression models are to be developed and 1029
applied consistently, they should be based on a somewhat larger sample as compared to what has 1030

29
been included in the current study (samples from eight cities are included in this study). The 1031
development of such regional models would enable the simple and resource-efficient quantification of 1032
small-scale IS fractions accessible to a much wider audience compared to what is currently the case. 1033
1034
1035 Figure 6-1. (A) Average MAEs and average absolute MBEs for local, regional (European model – 1036
SAVI/NDVI data compiled from the sub-areas of all eight cities) and spatially transferred linear 1037
regression models. (B) MEAs and absolute MBEs for local linear regression models based on SAVI 1038
(figure not included in any of the publications). 1039
1040
There is some evidence of a lower dynamic range in SAVI (and NDVI) for natural vegetation in 1041
southern Europe, which may affect accuracies for Nice and Barcelona, indicating that the use of VIs for 1042
IS mapping is sensitive to the amount of vegetation and may not be applicable for urban areas located 1043
in regions characterized by sparse vegetation cover and larger areas of bare soils. This implies that 1044
using information on vegetation cover to monitor urban land may not be appropriate for semi-1045
arid/arid regions (sparse vegetation cover) and for some cities in LDCs, including in Africa and Latin 1046
America, where larger proportions of road infrastructure consist of bare soil. Also, shadows from tall 1047
buildings and trees covering pervious surfaces reduce the signal as measured by the sensor, 1048
consequently reducing the overall accuracy of the models. Visual inspection of the high-resolution 1049
images suggests that shadows are not a major feature for most of the urban areas covered in the 1050
study, though this may be a major constraint for the application in some mega cities, where high-rise 1051
buildings are commonplace. 1052
1053
Research objective 2 1054
6.3 Risk assessment of pluvial flooding 1055
In the present study, we frame the climate change risk assessment in terms of how much society 1056
should be willing to invest in adaptation measures based on willingness-to-pay estimates. Seen from 1057
the perspective of a climate change adaptation decision-maker, society should be willing to pay 1058
adaptation costs that are at least equal to the avoided costs of climate change impacts. It is therefore 1059
relevant to compare the costs of adaptation with the risk reductions achieved by different measures, 1060
assuming that a given climate scenario is emerging. 1061
1062
An integrated framework for assessing the impacts and risks of climate extremes, focusing 1063
predominantly on pluvial flooding, is described to highlight key uncertainties in climate change 1064
adaptation decision-making. A sensitivity analysis examines the importance of key variables and 1065
methodological challenges related to the main uncertainties in climate change projections, impact 1066
assessments and economic assumptions. The assumptions made in any of the analytical steps will 1067
0
2
4
6
8
10
8 10 12 14
Ab
solu
te M
BE
(%
)
MAE (%)
Oslo Hamburg
Strasbourg
Vienna
Exeter Odense
Nice
Barcelona
Avrg.
0
2
4
6
8
10
8 10 12 14A
bso
lute
MB
E (
%)
MAE (%)
Local
Regional
Transferred
A B NDVI SAVI FR

30
influence the overall results of the risk assessment to a greater or lesser extent, which may have 1068
important implications for the responses of decision-makers to climate change. A wide range of risk 1069
estimates, resulting from several combinations of climate scenarios and economic assumptions, show 1070
that climate change uncertainties and variations in economic assumptions can influence the risk 1071
estimates in very similar ways. Using a disaggregated approach can provide decision-makers with 1072
knowledge of the importance of different expectations and assumptions concerning climate change 1073
and economic valuation for the level of cost-effective adaptation required. In adequately eliciting these 1074
uncertainties in an integrated framework, an ensemble of comprehensive model experiments is 1075
required that is specifically designed to decompose the variation and to take into account key factors 1076
such as the scenario and model uncertainty. This study demonstrates that, when it comes to decision-1077
making, the actual expectations concerning future climate scenarios and the economic assumptions 1078
made are very important in determining the risks of extreme climate events, and therefore the level of 1079
cost-effective adaptation seen from the society’s point of view. This is in opposition to the existence of 1080
a single optimal level of adaptation, and it is argued that the estimated risks will always vary according 1081
to the priorities of decision-makers, stakeholders and preferably society as a whole. 1082
1083
One way to address the high levels of uncertainty surrounding risk assessments for urban 1084
environments is to use a very detailed context-specific data and modelling approach, such as the DIAS 1085
(publication V, Fig. 2), which can help to identify particularly vulnerable and valuable assets that it is 1086
important to protect through the implementation of climate change adaptation measures. Also, the 1087
findings highlight that very rare and historical/cultural values may need special attention in this 1088
context in order to influence the overall outcome of a standardized risk assessment. In this way, a 1089
precautionary approach in relation to specific assets can be important to consider in relation to 1090
adaptation decision-making. 1091
1092
Illustrating the risks of different climate change scenarios, the decision-making issue could be 1093
presented using adaptation cost curves for risk reduction (Figure 6-2a). When adaptation costs (black 1094
line) are above the risk curve, the benefit of implementing adaptation to protect against a specific 1095
event is less than the adaptation costs. The straight line represents a fictive example of an adaptation 1096
cost curve and is merely inserted for illustrative purposes. Using this example, society should aim for 1097
protecting against flooding during precipitation intensities of 30mm/hr if a +4°C scenario is expected 1098
to realize over the next 100 years. In the case of a lower increase in global mean temperature society 1099
should instead, from an economic point of view, aim for a lower level of protection. The optimal level 1100
of protection under the different scenarios is highlighted in Figure 6-2. The recommended risk 1101
management level will of course depend on the exact shape of the adaptation cost curve and the 1102
expectations concerning future climate change (society should be willing to invest more on adaptation 1103
assuming high-end scenarios are realized), which can be very diverse for different geographical 1104
locations. To put the decision-making perspective into a larger context – that is, in terms of climate 1105
change mitigation perspectives – the reduction of the risk of urban flooding can also be seen as a 1106
measure of the benefits of avoiding the consequences of alternative climate change scenarios. For 1107
illustrative purposes, Figure 6-2b shows risk estimates when moving from present-day climate to +2°, 1108
+4° and +6°C climate change scenarios. We assume here that the risk-aversion factor applied to the 1109
willingness-to-pay estimates increases linearly from 1 to 2 when we are on a trajectory to a 6°C climate 1110
scenario. However, one might also argue that the risk-aversion factor will increase with global mean 1111
temperature change due to ambiguity in relation to future uncertain high-consequence events 1112
(Weitzmann 2011). Confronting the climate change risk estimates with mitigation issues indicates that, 1113
by considering different levels of temperature change, the risk function will be convex in shape (solid 1114
line), while adding a risk-aversion factor that increases with temperature clearly results in a much faster 1115
increase in the risk curve (dashed line). Applying similar assumptions in a global decision-making 1116
context thus points to the conclusion that a more ambitious level of climate change mitigation should 1117
be implemented. 1118
1119

31
1120 Figure 6-2. (A) Levelized risks for the different climate scenarios and a stylized adaptation cost curve 1121
(solid straight line) for risk reduction; numbers in brackets are from the 32 combinations in publication 1122
IV, Fig. 3. The optimal levels of adaptation under the different climate scenarios are shown. (B) 1123
Levelized costs for different climate scenarios using the event-driven (ED) damage assessment method 1124
and a 3% discount rate. The risk aversion factor increases from 1 to 2 as climate change increases in 1125
the willingness-to-pay (WTP) measure. NPV: net present values (publication IV, Figs. 12 and 13, 1126
adjusted versions). 1127
1128
Another important point to consider in the perspective of decision-making on climate change 1129
adaptation is the issue of time and learning: for example, what happens when the focus moves from 1130
low-end climate scenarios with possible moderate impacts to higher-end scenarios with more severe 1131
impacts. Since decisions about adaptation measures typically have a much shorter time perspective 1132
than developments in the climate system, it is important to consider the timing of when risks 1133
associated with different climate scenarios may actually materialise and when a given adaptation 1134
becomes necessary. One way to incorporate the time perspective is to compare the time frame 1135
determined by different climate models of when alternative global mean temperature changes will 1136
emerge. Comparing the global annual mean temperature projections for the RCP 8.5 scenario of 38 1137
CMIP5 (Taylor et al. 2012) members compared to the pre-industrial 1881−1910 period, Christensen et 1138
al. (2015), for example, showed that around 2100 is the “earliest” time a 6°C global mean temperature 1139
change could be achieved. It is important from a decision-making point of view to consider the 1140
magnitude and uncertainties of damage estimates when we move from, for example, a 2°C to higher-1141
end scenarios, and timing is important here when it comes to planning adaptation. Recent climate 1142
simulations suggest that a 4°C increase could already be achieved around 2050 if current high GHG 1143
emission rates continue. Hence, depending on the time frame of the actual adaptation considered, it 1144
may be highly relevant, within a time frame of up to 2100, to assess options in the context of risks 1145
when moving from a 4°C scenario to a 6°C scenario. 1146
6.4 Risk assessments of climate extremes for least developed countries 1147
Damage from climate extremes in LDCs will in many cases particularly harm people with low incomes. 1148
We therefore suggest applying specific assumptions to WTP estimates for avoided damage for LDCs 1149
that reflect risk aversion and inequality, giving relatively high weight to damage and thus income 1150
losses to poor households (Markandya 1998). A methodological framework, adjusted to overcome the 1151
issues of data availability and equity concerns, has been applied to a case study of damage from 1152
severe storms in Cambodia to illustrate how assumptions about trends in climate extremes and 1153
impacts on low-income groups can be addressed for risk assessment purposes, and how uncertainties 1154
in these parameters influence the outcomes of such analyses. A sensitivity analysis in which a few 1155
general assumptions about trends in severe storms and inequality, in terms of impacts on low-income 1156
households, demonstrates that the application of these specific factors for LDCs strongly influence 1157
WTP estimates for avoided damage. Also, we observe that the application of high factors of income 1158
inequality and risk aversion make a much greater difference to the damage cost proxies than the use 1159
of alternative discount rates of 7% versus 5% (Figure 5-7). In conclusion, it can be said that the results 1160
of the sensitivity analysis demonstrate that assessments of the welfare implications of extreme events 1161
0 €
25 €
50 €
20 25 30 35 40
Event intensity (mm/hr)
Co
st (
M E
UR
yr
)
+ 6 C (32)
+ 4 C (24)
+ 2 C (16)
Present day (8)
0 €
25 €
50 €
75 €
100 €
Presentday
+2C +4C +6C
Co
st (
M E
UR
yr
)
Climate scenario
ED- WTP
ED- NPVA B
Adaptation cost curve
X – Optimal level of protection
X
X
X X

32
in LDCs like Cambodia strongly depend on how vulnerable people and low-income households in 1162
particular are treated in the assessments. It must be remembered that low-income households most 1163
often live in houses which are poorly protected against storms and that low institutional capacities 1164
impeding access to financial aid often hinders the rebuilding of damaged assets in such societies. 1165
Applying an evaluation framework to assess the WTP for avoiding damages, as suggested here, implies 1166
that, seen from an economic welfare point of view, society should give a high priority to adaptation 1167
investments in vulnerable areas with a high density of low-income households. 1168
1169
The relatively simplistic climate scenario assumptions do not provide an optimal representation of 1170
future climate change and related events in Cambodia, but due to limited data availability, the 1171
alternative scenarios are used to illustrate the implications of future increases in the frequency of 1172
extreme events for purposes of risk assessment. Damage cost reports for storms and cyclones are not 1173
available for Cambodia, and we are therefore using historical trends in the number of damaged houses 1174
and victims during severe storms as proxy values for damage costs. Using such proxies rather than 1175
actual damage cost data implicitly assumes that the number of incidents represents damage and that 1176
the magnitude of damage for individual houses and people is constant over time. Also, it implies that 1177
the damage associated with each severe storm is similar for both climate scenarios, and that only the 1178
number of houses and victims affected differs between the two projections. 1179

33
Conclusions and perspectives for future research 71180
It is virtually beyond doubt that urban areas will become increasingly exposed to the occurrence and 1181
impacts of pluvial flooding due to the joint effects of continued urban development, e.g. causing 1182
increased levels of soil-sealing, and climate change, which will further increase the intensity and 1183
frequency of extreme precipitation. 1184
1185
The results from the four cities analysed here show that changes to land cover within cities can play a 1186
central role in their exposure to flooding and conversely to their ability to adapt to a changed climate. 1187
We have identified a clear trend towards a greater impact of soil-sealing for the least severe 1188
precipitation events, while only marginally affecting flooding during precipitation with longer return 1189
periods. Urban development is found to have a large influence on the exposure to flooding for urban 1190
areas characterized by coarse soil textures and limited topography, as soil-infiltration is excessive in 1191
these cases, increasing the influence of soil-sealing. Climate change impacts on precipitation extremes 1192
are highly uncertain, but with average change factors projecting a significant increase in precipitation 1193
intensities for all the cities. The results from our case studies indicate that the influence of urban 1194
development in exposing cities to flooding is comparable to what can be expected in the end of this 1195
century under the RCP 4.5 scenario, and that the relative importance varies considerably between 1196
locations as a consequence of differences in soil infiltration properties and local climate change 1197
factors. In all cases we find the expected changes in precipitation intensities under the RCP 8.5 scenario 1198
to affect flooding the most. Soil-water infiltration rates during extreme precipitation vary considerably 1199
over small distances. However, current knowledge of the factors determining instantaneous local soil 1200
infiltration rates is limited, causing higher uncertainties for such estimates. Increased research efforts 1201
within this area, including extensive fieldwork, is needed for better understanding the changes in the 1202
hydrological responses in urban areas due to increased soil-sealing. Another obvious research 1203
continuation that might build on the investigations conducted for this thesis is to analyse the 1204
importance of urban development in increasing the risks of pluvial flooding as opposed to examining 1205
the exposure as has been done here. The outcome of such analyses would serve to refine our findings 1206
directly in a decision-making context i.e. by including comprehensively the economic dimension, which 1207
would be particularly useful for decision-makers at all institutional levels. Also, including dynamic 1208
projections of urban development and urban land cover in the analyses could contribute considerably 1209
to increasing our knowledge on how the susceptibility of cities can be expected to change in terms of 1210
both the short- and long-term perspectives. 1211
1212
Our study clearly demonstrates that the remote-sensing and flood-modelling approach used here can 1213
be used – and is easily transferable - in terms of quantifying and mapping the dual importance of 1214
urban development and climate change for changes in urban flood exposure to other geographical 1215
locations both regionally and globally. Continued research into the main drivers affecting overall 1216
exposure, vulnerability and risk for cities is required to provide European (and global) decision-makers 1217
with adequate knowledge of how to plan pluvial flood-proofing for cities in the future. For many 1218
applications, satellite imagery provides superior coverage of urban land cover. The findings of this 1219
study show that IS fractions (as a proxy for urban land cover), and spatiotemporal changes to them can 1220
be mapped with reasonable accuracy from the 1980s onwards by use of simple linear regression 1221
models based on vegetation indices calculated from Landsat medium-resolution imagery. If regional 1222
regression models for use in multiple cities over larger geographical areas are to be developed and 1223
applied consistently, they must be created from large samples of urban areas covering a considerable 1224
share of vegetative and climatic conditions locally, regionally and globally. Future research directions 1225
within this area in a context of flood modelling should focus on the exploration of high-resolution 1226
imagery for IS mapping as extended time-series become available at lower economic and 1227
computational costs in the near future. In this context it could be worthwhile to investigate not only 1228
the expected value added by employing such extended high-resolution time series, but also to 1229
innovate new methods to allow for an optimal integration of remotely sensed imagery of different 1230
resolutions. 1231
1232

34
Risk assessments for flooding in local areas are very uncertain, particularly in relation to the 1233
downscaled precipitation data, which are commonly the backbone of most studies of urban pluvial 1234
flooding. Large uncertainties are inherently related to the projections of extreme precipitation and to 1235
risk estimates, including damage cost estimates, discounting and risk aversion. The latter are key issues 1236
for real-life decision-makers, that is, how much society should be willing to pay for climate change 1237
adaptation, which are often overlooked or drastically simplified in many real-life climate change impact 1238
assessments. In this study we address the propagation of uncertainties and test critical assumptions in 1239
relation to a particular case study of urban flooding. We demonstrate that, in terms of decision-1240
making, actual expectations concerning future climate scenarios and the economic assumptions 1241
adopted are very important in determining the risks of extreme climate events and thus the level of 1242
cost-effective adaptation seen from the society’s point of view. The actual level of risk associated with 1243
flooding from extreme precipitation in Odense is found to vary in near equal parts due to uncertainties 1244
in climate projections and economic assumptions. We therefore conclude that climate scenarios and 1245
economic assumptions influence risk estimates in very similar ways. Using a risk assessment framework 1246
as presented here implies that risk estimates should be considered conservative, as many intangible 1247
costs including mental health impacts and biodiversity concerns are not addressed due to limitations 1248
in the current methodologies for estimating and quantifying damage to such assets. Further 1249
methodological development within this area is sorely needed and will improve risk assessment and 1250
contribute with additional knowledge for decision-makers planning for climate adaptation. For 1251
example, damage caused by extremes should not be considered constant over time and will most 1252
likely decrease with the occurrence of events due to the inherent learning of individuals and society as 1253
a whole. Consequently, research with a distinct focus on quantifying the effects of learning could 1254
increase the accuracy of risk assessments and provide decision-makers with an improved knowledge 1255
base when adapting to climate change. 1256
1257
Least developed countries (LDCs) are particularly vulnerable to the impact of climate change and 1258
extreme events due to their low incomes, weak infrastructures and institutions, and low capacity for 1259
coping with climate change (IPCC 2014). This implies that damage associated with extreme events is 1260
often very serious. To address this issue, we propose the inclusion of an inequality factor, which gives 1261
relatively high weight to damage and thus the income losses of poor households. The conclusion is 1262
that, if vulnerabilities and inequality concerns are taken into account in adaptation planning for regions 1263
with a large share of low-income groups, a strong case is made for allocating economic resources to 1264
the protection of least developed countries. 1265

35
References 81266
Angel, S., Parent, J., Civco, D.L., Blei, A., Potere, D., 2011. The dimensions of global urban expansion: 1267
Estimates and projections for all countries, 2000–2050. Prog. Plan. 75, 53–107. 1268
doi:10.1016/j.progress.2011.04.001 1269
Arnbjerg-Nielsen, K., Leonardsen, L., Madsen, H., 2015. Evaluating adaptation options for urban 1270
flooding based on new high-end emission scenario regional climate model simulations. 1271
Clim. Res. 64, 73–84. doi:10.3354/cr01299 1272
Arnold, C.L., Gibbons, C.J., 1996. Impervious Surface Coverage: The Emergence of a Key Environmental 1273
Indicator. J. Am. Plann. Assoc. 62, 243–258. doi:10.1080/01944369608975688 1274
Bauer, M.E., Doyle, J.K., Heinert, N.J., 2002. Impervious surface mapping using satellite remote sensing. 1275
IEEE, pp. 2334–2336. doi:10.1109/IGARSS.2002.1026536 1276
Bauer, M.E., Loffelholz, B.C., Wilson, B., 2008. Estimating and mapping impervious surface area by 1277
regression analysis of Landsat imagery, in: Remote Sensing of Impervious Surfaces. CRC 1278
Press, Boca Raton, p. 454. 1279
Bundesministerium für Land- und Forstwirtschaft, Umwelt und Wasserwithtschaft - BMLFUW, (2016). 1280
http://ehyd.gv.at/ (Assessed Jan 15th 2016) 1281
Butler, D., 2011. Urban drainage, 3rd ed. ed. Spon Press, London ; New York. 1282
Butler, D., 2004. Urban drainage, 2nd ed. ed. Spon Press, London ; New York. 1283
Carlson, T.N., Traci Arthur, S., 2000. The impact of land use — land cover changes due to urbanization 1284
on surface microclimate and hydrology: a satellite perspective. Glob. Planet. Change 25, 1285
49–65. doi:10.1016/S0921-8181(00)00021-7 1286
Chow, V.T., Maidment, D.R., Mays, L.W., 1988. Applied hydrology, McGraw-Hill series in water resources 1287
and environmental engineering. McGraw-Hill, New York. 1288
Christensen, O., Yang, S., Boberg, F., Fox Maule, C., Thejll, P., Olesen, M., Drews, M., Sørup, H., 1289
Christensen, J., 2015. Scalability of regional climate change in Europe for high-end 1290
scenarios. Clim. Res. 64, 25–38. doi:10.3354/cr01286 1291
Coste, C. & Loudet, M.1987 L’assainissement en milieu urbain ou rural – Tome 1: Les réseaux et les 1292
ouvrages de retenue, Editions du Moniteur. Paris, France. 1293
Danish Insurance Association (DIA), 2015. 1294
http://www.forsikringogpension.dk/presse/Statistik_og_Analyse/statistik/forsikring/ersta1295
tninger/Sider/Erstatninger_for_vandskader.aspx (accessed 20/01-2015). 1296
Davis, S.A., Skaggs, L.L., 1992. Catalog of residential depth-damage functions - used by the army corps 1297
of enginners in flood damage estimation. IWR Report 92-R-3. USACE - Water ressource 1298
support center, institute for water resources, 7701 Telegraph rd casey building, Ft. 1299
Belvoir, VA 22060-5586. 1300
European Commission, 2007. Directive 2007/60/EC of the European Parliament and the Council of 23 1301
October 2007 on the assessment and management of flood risks (text with EEA 1302
relevance). European Commission. 1303
Field, C.B., Barros, V., Stocker, T.F., Qin, D., Dokken, D.J., Ebi, K.L., Mastrandrea, M.D., Mach, K.J., Plattner, 1304
G.-K., Allen, S.K., Tignor, M., Midgley, P.M., 2012. Managing the Risks of Extreme Events 1305
and Disasters to Advance Climate Change Adaption. A Special Report of Working 1306
Groups I and II of the Intergovernmental Panel on Climate Change. Cambridge 1307
University Press, New York. 1308
Flood, N., 2014. Continuity of Reflectance Data between Landsat-7 ETM+ and Landsat-8 OLI, for Both 1309
Top-of-Atmosphere and Surface Reflectance: A Study in the Australian Landscape. 1310
Remote Sens. 6, 7952–7970. doi:10.3390/rs6097952 1311
Fowler, A.M., Hennessy, K.J., 1995. Potential impacts of global warming on the frequency and 1312
magnitude of heavy precipitation. Nat. Hazards 11, 283–303. doi:10.1007/BF00613411 1313
Giorgi, F., Jones, C., Asrar, G., 2009. Addressing climate information needs at the regional level: The 1314
CORDEX framework. WMO Bull. 58:3. 1315
Golnaraghi, M., Etienne, C., Guha-Sapir, D., Below, R., World Meteorological Organization, Centre for 1316
Research on the Epidemiology of Disasters, 2014. Atlas of mortality and economic 1317
losses from weather, climate, and water extremes (1970-2012). 1318

36
Gregersen, I.B., Madsen, H., Linde, J.J. et al, Arnbjerg-Nielsen, K., 2014. Updated climate factors and rain 1319
intensities for dimensioning (Skrift nr. 30) (Opdaterede klimafaktorer og 1320
dimensionsgivende regnintensiteter (Skrift nr. 30)),. Spildevandskommiteen. 1321
Gregersen, I.B., Sørup, H.J.D., Madsen, H., Rosbjerg, D., Mikkelsen, P.S., Arnbjerg-Nielsen, K., 2013. 1322
Assessing future climatic changes of rainfall extremes at small spatio-temporal scales. 1323
Clim. Change 118, 783–797. doi:10.1007/s10584-012-0669-0 1324
Hall, J., Arheimer, B., Borga, M., Brázdil, R., Claps, P., Kiss, A., Kjeldsen, T.R., Kriaučiūnienė, J., Kundzewicz, 1325
Z.W., Lang, M., Llasat, M.C., Macdonald, N., McIntyre, N., Mediero, L., Merz, B., Merz, R., 1326
Molnar, P., Montanari, A., Neuhold, C., Parajka, J., Perdigão, R.A.P., Plavcová, L., Rogger, 1327
M., Salinas, J.L., Sauquet, E., Schär, C., Szolgay, J., Viglione, A., Blöschl, G., 2014. 1328
Understanding flood regime changes in Europe: a state-of-the-art assessment. Hydrol. 1329
Earth Syst. Sci. 18, 2735–2772. doi:10.5194/hess-18-2735-2014 1330
Halsnæs, K., Kaspersen, P., Drews, M., 2015. Key drivers and economic consequences of high end 1331
climate scenarios: uncertainties and risks. Clim. Res. doi:10.3354/cr01308 1332
Hawkins, E., Sutton, R., 2011. The potential to narrow uncertainty in projections of regional 1333
precipitation change. Clim. Dyn. 37, 407–418. doi:10.1007/s00382-010-0810-6 1334
Huete, A.., 1988. A soil-adjusted vegetation index (SAVI). Remote Sens. Environ. 25, 295–309. 1335
doi:10.1016/0034-4257(88)90106-X 1336
Intergovernmental Panel on Climate Change (Ed.), 2014. Climate Change 2013 - The Physical Science 1337
Basis: Working Group I Contribution to the Fifth Assessment Report of the 1338
Intergovernmental Panel on Climate Change. Cambridge University Press, Cambridge. 1339
J. J. Stone, G. B. Paige, R. H. Hawkins, 2008. Rainfall Intensity-Dependent Infiltration Rates on 1340
Rangeland Rainfall Simulator Plots. Trans. ASABE 51, 45–53. doi:10.13031/2013.24226 1341
Jongman, B., Kreibich, H., Apel, H., Barredo, J.I., Bates, P.D., Feyen, L., Gericke, A., Neal, J., Aerts, J.C.J.H., 1342
Ward, P.J., 2012. Comparative flood damage model assessment: towards a European 1343
approach. Nat. Hazards Earth Syst. Sci. 12, 3733–3752. doi:10.5194/nhess-12-3733-2012 1344
JRC, 2016. Dominant Soil Texture, Text-SRF-DOM raster data, http://eusoils.jrc.ec.europa.eu/library 1345
/esdac/index.html, (Assessed Jan 15th 2016). 1346
Kaspersen, P., Fensholt, R., Drews, M., 2015. Using Landsat Vegetation Indices to Estimate Impervious 1347
Surface Fractions for European Cities. Remote Sens. 7, 8224–8249. 1348
doi:10.3390/rs70608224 1349
Leandro, J., Chen, A.S., Djordjević, S., Savić, D.A., 2009. Comparison of 1D/1D and 1D/2D Coupled 1350
(Sewer/Surface) Hydraulic Models for Urban Flood Simulation. J. Hydraul. Eng. 135, 495–1351
504. doi:10.1061/(ASCE)HY.1943-7900.0000037 1352
Lu, D., Weng, Q., 2006. Use of impervious surface in urban land-use classification. Remote Sens. 1353
Environ. 102, 146–160. doi:10.1016/j.rse.2006.02.010 1354
Mark, O., Weesakul, S., Apirumanekul, C., Aroonnet, S.B., Djordjević, S., 2004. Potential and limitations 1355
of 1D modelling of urban flooding. J. Hydrol. 299, 284–299. doi:10.1016/j.jhydrol.2004.0 1356
8.014 1357
Mastrandrea, M.D., Field, C.B., Stocker, T.F., Edenhofer, O., Ebi, K.L., Frame, D.J., Held, H., Kriegler, E., 1358
Mach, K.J., Matschoss, P.R., Plattner, G.-K., Yohe, G.W., Zwiers, F.W., 2010. Guidance note 1359
for lead authors of the IPCC Fifth Assessment Report (AR5) on consistent treatment of 1360
uncertainties. IPCC. 1361
Meinshausen, M., Smith, S.J., Calvin, K., Daniel, J.S., Kainuma, M.L.T., Lamarque, J.-F., Matsumoto, K., 1362
Montzka, S.A., Raper, S.C.B., Riahi, K., Thomson, A., Velders, G.J.M., van Vuuren, D.P.P., 2011. The RCP 1363
greenhouse gas concentrations and their extensions from 1765 to 2300. Clim. Change 1364
109, 213–241. doi:10.1007/s10584-011-0156-z 1365
MIKE by DHI, 2014. http://mikebydhi.com. Accessed on 18 January, 2014. 1366
Munich RE, 2015. Natural catastrophes 2014 Analyses, assessments, positions 2015 issue, Topics - Geo. 1367
Munich RE, München Germany. 1368
Municipality of Odense, 2014. Climate adaptation plan 2014 - Background report for municipality plan 1369
appendix # 1. 1370

37
Obermayer, A., Guenthert, F.W., Angermair, G., Tandler, R., Braunschmidt, S., Milojevic, N., 2010. 1371
Different approaches for modelling of sewer caused urban flooding. Water Sci. Technol. 1372
62, 2175. doi:10.2166/wst.2010.439 1373
Paludan, B., Nielsen, N.H., Brink-Kjær, A., Jense, L.N., Linde, J.J., Mark, O., 2011. The Climate Cookbook - 1374
2nd edition, Forsknings- og udredningsprojekt nr. 19 Danva ISBN 978-87-92651-04-4. 1375
Parkinson, J., Mark, O., 2005. Urban stormwater management in developing countries. IWA Pub., 1376
London. 1377
Rouse, J.W., Haas, R.H., Schell, J.R., Deering, D.W., 1974. Monitoring vegetation systems in the Great 1378
Plains with ETRS. Proc. Third Earth Resour. Technol. Satell.-1 Symp. Greenbelt NASA 1379
3010–3017. 1380
Skjoldborg Hansen, A., 2015. Klimatilpasning - hvorfor og hvordan? Aarhus Universitetsforlag. 1381
Sunyer, M.A., Gregersen, I.B., Rosbjerg, D., Madsen, H., Luchner, J., Arnbjerg-Nielsen, K., 2014. 1382
Comparison of different statistical downscaling methods to estimate changes in hourly 1383
extreme precipitation using RCM projections from ENSEMBLES: STATISTICAL 1384
DOWNSCALING METHODS FOR EXTREME PRECIPITATION. Int. J. Climatol. n/a–n/a. 1385
doi:10.1002/joc.4138 1386
Sunyer, M.A., Hundecha, Y., Lawrence, D., Madsen, H., Willems, P., Martinkova, M., Vormoor, K., Bürger, 1387
G., Hanel, M., Kriaučiūnienė, J., Loukas, A., Osuch, M., Yücel, I., 2015. Inter-comparison of 1388
statistical downscaling methods for projection of extreme precipitation in Europe. 1389
Hydrol. Earth Syst. Sci. 19, 1827–1847. doi:10.5194/hess-19-1827-2015. 1390
The Nature Conservancy, 2015. Available online: http://maps.tnc.org/gis_data.html (accessed on 23 1391
March 2015). 1392
Tucker, C.J., 1979. Red and photographic infrared linear combinations for monitoring vegetation. 1393
Remote Sens. Environ. 8, 127–150. doi:10.1016/0034-4257(79)90013-0 1394
United Nations, Department of Economic and Social Affairs, Population Division, 2014. World 1395
urbanization prospects: the 2014 revision : highlights. 1396
USDA, 2016. http://qcode.us/codes/sacramentocounty/view.php?topic=14-14_10-14_10_110, 1397
(Assessed Jan 15th 2016). 1398
van der Linden, P., Mitchell, J., 2009. ENSEMBLES: Climate Change and its Impacts: Summary of 1399
research and results from the ENSEMBLES project. Met Office Hadley Centre, FitzRoy 1400
Road, Exeter EX1 3PB, United Kingdom. 1401
Weng, Q., 2012. Remote sensing of impervious surfaces in the urban areas: Requirements, methods, 1402
and trends. Remote Sens. Environ. 117, 34–49. doi:10.1016/j.rse.2011.02.030 1403
Willems, P., 2012. Impacts of climate change on rainfall extremes and urban drainage systems. IWA, 1404
London. 1405
Yuan, F., Wu, C., Bauer, M.E., 2008. Comparison of Spectral Analysis Techniques for Impervious Surface 1406
Estimation Using Landsat Imagery. Photogramm. Eng. Remote Sens. 74, 1045–1055. 1407
doi:10.14358/PERS.74.8.1045 1408
1409
1410

38
Publications 91411
I. Kaspersen, P., Fensholt, R., Drews, M. 2015. Using Landsat Vegetation Indices to Estimate 1412
Impervious Surface Fractions for European Cities. Remote Sensing 7, 8224–8249. 1413
doi:10.3390/rs70608224. 1414
1415
II. Skougaard Kaspersen, P., Høegh Ravn, N., Arnbjerg-Nielsen, K., Madsen, H., Drews, M. 2015. 1416
Influence of urban land cover changes and climate change for the exposure of European cities to 1417
flooding during high-intensity precipitation. Proceedings of the International Association of 1418
Hydrological Sciences (PIAHS), Volume 370, 21–27. doi:10.5194/piahs-370-21-2015. 1419
1420
III. Skougaard Kaspersen, P., Høegh Ravn, N., Arnbjerg-Nielsen, K., Madsen, H., Drews, M. 1421
Comparison of the impacts of urban development and climate change for the exposure of 1422
European cities to pluvial flooding, Manuscript in preparation for Hydrology and Earth System 1423
Sciences (HESS). (To be submitted May 2016). 1424
1425
IV. Halsnæs, K., Kaspersen, P., Drews, M. 2015. Key drivers and economic consequences of high‑end 1426
climate scenarios: uncertainties and risks. Climate Research. 64, 85–98. doi:10.3354/cr01308 1427
1428
V. Skougaard Kaspersen, P., Halsnæs, K. Integrated climate change risk assessment for localized 1429
extreme precipitation, Environmental Management, Springer, in review. 1430
1431
VI. Halsnæs, K., Kaspersen, P.S., Trærup, S. 2016. Climate Change Risks – Methodological Framework 1432
and Case Study of Damages from Extreme Events in Cambodia, in: Uitto, J.I., Shaw, R. (Eds.), 1433
Sustainable Development and Disaster Risk Reduction. Springer Japan, Tokyo, pp. 71–85. 1434