climate scenarios
TRANSCRIPT

Climate scenarios
KvR 038/11
Remote Influences on European Climate
Henk van den BrinkFrank Selten

1
Remote Influences on European Climate
Authors
Henk van den BrinkFrank Selten
KvR report number KvR 038/11ISBN ISBN/EAN 978-94-9007-049-6
This project (CS5; Remote Influences on European Climate) was carried out in the framework of the Dutch National Research Programme Climate changes Spatial Planning. This research programme is co-financed by the Ministry of Infrastructure and the Environment.

2
kvr 038/11 | remote inf luences on european climate
Copyright © 2011National Research Programme Climate changes Spatial Planning / Nationaal Onderzoekprogramma Klimaat voor Ruimte (KvR) All rights reserved. Nothing in this publication may be copied, stored in automated databases or published without prior written consent of the National Research Programme Climate changes Spatial Planning / Nationaal Onderzoekprogramma Klimaat voor Ruimte. In agreement with Article 15a of the Dutch Law on authorship is allowed to quote sections of this publication using a clear reference to this publication.
LiabilityThe National Research Programme Climate changes Spatial Planning and the authors of this publication have exercised due caution in preparing this publication. However, it can not be expelled that this publication includes mistakes or is incomplete. Any use of the content of this publication is for the own responsibility of the user. The Foundation Climate changes Spatial Planning (Stichting Klimaat voor Ruimte), its organisation members, the authors of this publication and their organisations can not be held liable for any damages resulting from the use of this publication.

2 3
kvr 038/11 | remote inf luences on european climate
ContentsAbstract 5
Introduction 5
Research topics of CS5 7
Models and data used 8 Topic 1: The development of a methodology to estimate return times of meteorological outliers and its application to extreme winds 9 Topic 2: A study of extreme North Sea storm surges in a changing climate 14 Topic 3: The influence of drying Mediterranean soils on the atmospheric circulation over the Netherlands 17 Topic 4: The impact of warmer North Sea temperatures on rainfall over the Netherlands 21 Topic 5: The effect of a change in the deep convection parameterization in the EC-Earth climate model on tropical rainfall and extra-tropical circulation 25
Synthesis 28
Scientific output 29
References 30

4
kvr 038/11 | remote inf luences on european climate
Abstract
4 5
kvr 038/11 | remote inf luences on european climate
Abstract
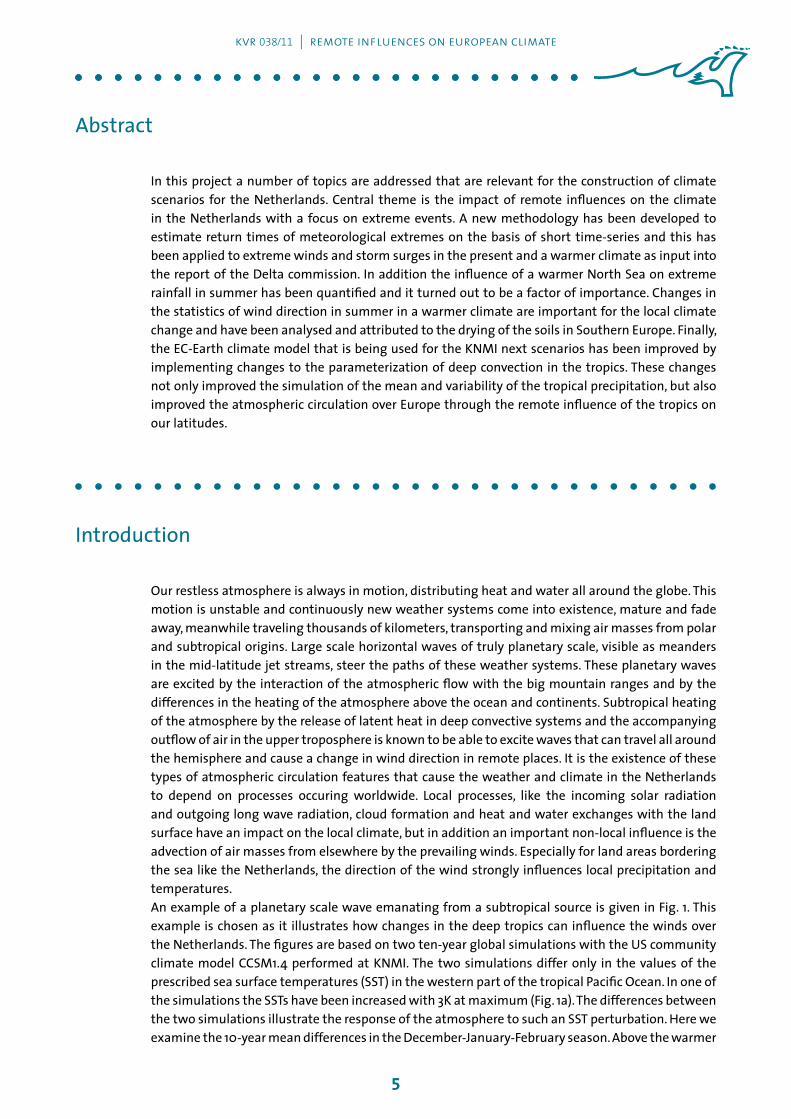
In this project a number of topics are addressed that are relevant for the construction of climate scenarios for the Netherlands. Central theme is the impact of remote influences on the climate in the Netherlands with a focus on extreme events. A new methodology has been developed to estimate return times of meteorological extremes on the basis of short time-series and this has been applied to extreme winds and storm surges in the present and a warmer climate as input into the report of the Delta commission. In addition the influence of a warmer North Sea on extreme rainfall in summer has been quantified and it turned out to be a factor of importance. Changes in the statistics of wind direction in summer in a warmer climate are important for the local climate change and have been analysed and attributed to the drying of the soils in Southern Europe. Finally, the EC-Earth climate model that is being used for the KNMI next scenarios has been improved by implementing changes to the parameterization of deep convection in the tropics. These changes not only improved the simulation of the mean and variability of the tropical precipitation, but also improved the atmospheric circulation over Europe through the remote influence of the tropics on our latitudes.
Introduction
Our restless atmosphere is always in motion, distributing heat and water all around the globe. This motion is unstable and continuously new weather systems come into existence, mature and fade away, meanwhile traveling thousands of kilometers, transporting and mixing air masses from polar and subtropical origins. Large scale horizontal waves of truly planetary scale, visible as meanders in the mid-latitude jet streams, steer the paths of these weather systems. These planetary waves are excited by the interaction of the atmospheric flow with the big mountain ranges and by the differences in the heating of the atmosphere above the ocean and continents. Subtropical heating of the atmosphere by the release of latent heat in deep convective systems and the accompanying outflow of air in the upper troposphere is known to be able to excite waves that can travel all around the hemisphere and cause a change in wind direction in remote places. It is the existence of these types of atmospheric circulation features that cause the weather and climate in the Netherlands to depend on processes occuring worldwide. Local processes, like the incoming solar radiation and outgoing long wave radiation, cloud formation and heat and water exchanges with the land surface have an impact on the local climate, but in addition an important non-local influence is the advection of air masses from elsewhere by the prevailing winds. Especially for land areas bordering the sea like the Netherlands, the direction of the wind strongly influences local precipitation and temperatures. An example of a planetary scale wave emanating from a subtropical source is given in Fig. 1. This example is chosen as it illustrates how changes in the deep tropics can influence the winds over the Netherlands. The figures are based on two ten-year global simulations with the US community climate model CCSM1.4 performed at KNMI. The two simulations differ only in the values of the prescribed sea surface temperatures (SST) in the western part of the tropical Pacific Ocean. In one of the simulations the SSTs have been increased with 3K at maximum (Fig. 1a). The differences between the two simulations illustrate the response of the atmosphere to such an SST perturbation. Here we examine the 10-year mean differences in the December-January-February season. Above the warmer

6
kvr 038/11 | remote inf luences on european climate
SST’s, upward motion occurs with increased precipitation and reduced precipitation to the east and west (Fig. 1b). The upward motion leads to an horizontal outflow of air in the upper troposphere and the subsequent horizontal propagation of so-called Rossby waves along the jet streams. This is illustrated in Fig. 1c with the mean zonal wind at 300 hPa of the unperturbed simulation plotted in grey and the response of the meridional component of the wind in colors. The response at this level is characterised by a stationary wavenumber 5 pattern following the mean position of the jets, giving rise to a northward flow over our region. The surface expression of the response in our region is characterised by lower pressures (Fig. 1d).
a b c
d e f
Figure 1 The atmospheric response in the winter season to the idealised SST perturbation in (a) as simulated by a 10 year simulation with the climate model CCSM1.4 for precipitation in (b), the meridional wind at 300 hPa in (c) and sea level pressure in (d). A climate change simulation of the same model coupled to an ocean model shows a similar response to increasing levels of CO2 for the meridional wind at 300 hPa in (e) and precipitation in (f). The present day climatology for the zonal wind at 300 hPa is plotted in grey in (c) and (e) with contour levels at 20, 30, 40, 50 and 60 m/s.

6 7
kvr 038/11 | remote inf luences on european climate
With rising levels of CO2 the global climate warms and in addition to this warming, global climate models simulate changes in the sea surface temperature distribution and tropical precipitation patterns. As illustrated above, this might lead to changes in the circulation over Europe. When the same model CCSM1.4 coupled to an ocean model is used to simulate the response to rising levels of CO2 according to a business-as-usual scenario, it simulates an increase of tropical precipitation over the western part of the tropical pacific and a change in the extra tropical circulation that bears many similarities to the response of the idealised experiment above (compare Fig. 1e-f with 1c-b). Note that the zonal wind climatology in the coupled model (Fig 1e) is slightly different from that of the model forced by prescribed SST’s (Fig 1c) due to the differences in the SST’s. This experiment leads us to the conclusion that the warming in the tropical oceans and associated changes in the tropical convection impact the wind changes over Europe. An inspection of the climate change as simulated by the ensemble of climate models that formed the basis of the fourth assessment report of the Intergovernmental Panel on Climate Change (IPCC, 2007) learns that a simular response is found in several other models and is not particular to CCSM1.4 (Brandefelt and Körnich, 2008).This introductory example nicely illustrates the necessity to take into account processes worldwide when making scenarios for future climate changes for the Netherlands. In addition to the study of extreme events, this is the main theme of CS5.
Research topics of CS5
The KNMI 2006 scenario’s provided scenario’s for a climate change with and without a change in the circulation over Europe, since the different climate models do not agree on the response of the circulation. An improved understanding of the simulated changes in the circulation is required in order to be able to make an expert judgement on the likelihood of these circulation changes. Many aspects of the climate system change in concert while the climate warms and interactions take place over large distances and across different time-scales. Moreover, the climate change signal is easily masked by naturally occuring climate variations. This explains why limited progress has been made in the understanding of circulation changes in response to the warming. The primary goal of this project was to provide information on the influence of the large-scale circulation on the climate in the Netherlands in the context of climate change and the occurrence of extreme weather events in preparation for the next KNMI scenarios. During the proposal phase of the project the focus was placed on the uncertainty in the circulation response due to the uncertainty in the simulated response in the tropical precipitation. However, during discussion with partners in the other CS projects, especially CS6 and CS7, a number of topics were raised and studied that were more directly relevant for the construction of climate scenarios for the Netherlands. One example is the study of extreme storm surges that was motivated by the need to provide relevant input for the “Commissie Veerman” report. Another example is the work to improve the climate model EC-Earth developed among others by KNMI that will produce climate scenario simulations as input for the next IPCC assessment. Finally 5 research topics were addressed in CS5 with the common theme that they concern remote influences on the climate in the Netherlands and/or concern extreme weather events. These 5 topics are:
1. A new methodology to estimate return times of meteorological outliers was developed and applied to extreme wind occurrences, motivated by the need to assess the one in ten thousand year event on the basis of short time-series.

8
kvr 038/11 | remote inf luences on european climate
2. Statistics of extreme storm surges in response to wind extremes were studied to provide input for the “Commissie Veerman” report on future changes in storm surges. Storm surges were simulated with the water level model WAQUA driven by winds from a global climate model for the simulated present and future climate.
3. August 2006 in the Netherlands turned out to be the wettest month of August in 100 year with 184 mm of precipitation where 62 mm is measured in a normal year. The record rainfall was caused by a combination of persistent northwesterly winds and a warm preceding month of July that had led to very warm North Sea temperatures. A combined study with project CS6 assessed the influence of a warm North Sea on rainfall in the Netherlands and evaluated the performance of the regional climate model RACMO in this respect. The study learns that a detailed simulation of North Sea warming is required for an accurate assessment of the change in precipitation extremes especially for the coastal regions in a warming climate.
4. A number of climate models simulate increased easterly winds in summertime Europe in a warming climate that lead to an enhanced warming and drying in the Netherlands. Why the easterly winds increase in these simulations was not known but the KNMI 2006 scenarios do take this possible change into account in the plus scenarios. A study into the origin of this change led to the conclusion that drying Mediterranean soils are partly responsible for this atmospheric circulation change.
5. The first version of the climate model EC-Earth simulated too strong westerlies in wintertime Europe. A change in the deep convection parameterization was implemented that improved the tropical rainfall distribution and as a result of that also the winter circulation over Europe. As EC-Earth will contribute climate scenario simulations in preparation for the next climate assessment by the IPCC, an accurate simulation of the present-day climate over Europe is a prerequisite.
Results from these studies were communicated through contributions to the “Commissie Veerman” report on storm surges and 7 peer-reviewed papers. A brief description of the CS5 research on these 5 topics is presented, followed by a synthesis of the results. For more detailed descriptions we refer to the papers listed at the end of this report and referenced under each topic.
Models and data used
Several datasets and climate models have been used in this project. This section provides a short overview with references.
ERA40 datasetThe ERA40 dataset is a global dataset spanning the years 1958-2002. It was produced by the European Center for Medium Range Weather Forecasts (ECMWF). Global observations made routinely for the purpose of weather forecasting are combined with a numerical weather prediction model to provide estimates of the three-dimensional atmospheric state at 6 hourly intervals on a global grid of about 1.125x1.125 degree horizontal resolution and 60 levels in the vertical. More details are found on the ECMWF website (http://ecmwf.int).

8 9
kvr 038/11 | remote inf luences on european climate
ESSENCE datasetIn the ESSENCE project conducted by KNMI [Sterl et al., 2008] seventeen coupled model integrations between 1950 and 2100 were carried out with the German climate model ECHAM5/OMI at a horizontal grid resolution of approximately 1.9 x1.9 degree and 31 levels in the vertical using slightly perturbed initial atmospheric conditions for each simulation. For 1950–2000 the concentrations of greenhouse gases (GHG) and tropospheric sulfate aerosols are specified from observations, while for 2001–2100 they follow the SRES A1b scenario. Stratospheric aerosols from volcanic eruptions are not taken into account and the solar constant is fixed. The runs are initialized from a long run in which historical GHG concentrations have been used until 1950 [Sterl et al., 2008]. The large ensemble of ESSENCE ensures statistical robustness which is very relevant for the study of extreme events.
EC-Earth modelThe EC-EARTH.model builds on the Integrated Forecasting System (IFS), cycle 31r1, originally developed at the European Centre for Medium-Range Weather Forecasts (ECMWF) for seasonal forecast purposes. The atmospheric component has the same horizontal resolution as the model used for the ERA40 dataset and has 62 levels in the vertical. The ocean is modeled by the Nucleus for European Modelling of the Ocean (NEMO) V2 model (Madec 2008) in its tripolar ORCA1 configuration, with a horizontal resolution of nominally 1 degree and equatorial refinement to 0.3 degree. The vertical is divided into 42 levels. Sea ice is included through the two-level dynamic-thermodynamic Louvain-la-Neuve sea ice model (LIM2) (Bouillon et al 2009). For an elaborate discussionof the model and its performance, we refer to Hazeleger et al (2011).
RACMO modelThe KNMI regional atmospheric climate model RACMO2 is a high resolution Regional Climate Model that is based on the dynamical core of the regional climate model HIRLAM and the physical parameterizations of ECMWF (Lenderink et al. 2003). In this project a domain is chosen of approximately 1,000 x 1,000 km2 and a horizontal resolution of 6 x 6 km2. The model uses 40 vertical levels. Lateral boundaries are given by the operational ECMWF analyses, updated each 6-h and using linear interpolation in time.
Topic 1: The development of a methodology to estimate return times of meteorological outliers and its application to extreme winds
IntroductionProbabilities of rare extremes, like 1 in 10000 years extreme high water levels needed for the design of our coastal defence systems, are estimated by extrapolation of less rare extremes in the observational records. However, climate model simulations have indicated the possibility that the more extreme events might occur more often as expected on the basis of extrapolation from the less extreme events (Van den Brink et al, 2004). The reason is that other physical mechanisms play a role in the formation of these more extreme events, leading to a mixed population of extremes, each with its own probability distribution. An illustrative example is an observational record of water levels from a coastal station. Extreme water levels arise due to storms and a clear relationship is found between the water level extremes and the return times of these extremes. This relationship allows for an estimate of return times of yet unobserved stronger extremes by extrapolation. However, when a tsunami hits this coastal station, an extreme water level is observed that does not obey this relationship since it is caused by an entirely different physical mechanism. The water level extremes contain two populations, one caused by extreme storms and one caused by tsunamis. For a proper extrapolation, these two populations need to be taken into account.In addition, an extrapolation to return times beyond the length of the observational record is sensitive

10
kvr 038/11 | remote inf luences on european climate
to the assumptions that are made about the statistical distribution underlying the extremes. In this study, a robust statistical tool was developed that enables one to verify whether the most extreme events of multiple records are well described by the fitted distributions or not. The only requirement for this approach to work is that enough records are available and that the most extreme events in these records are distinct. The advantage of this method is that it allows a verification of the assumptions about the underlying distribution so that a faithfull extrapolation can be made and a possible double population can be detected. The method and its applications have been described in Van den Brink and Können (2008, 2009) and Van den Brink and Selten (2010). Here we will briefly describe the method and a few results from these papers.
New statistical methodFrom a timeseries of daily observations of a particular variable y, the most extreme value in each year is plotted on a so-called Gumbel plot (Fig. 2). It illustrates the relation between the value of the extreme and its probability of occurrence as expressed by its return period. If the extremes follow a Gumbel distribution, then they line up on a straight line. The most extreme value of y deviates from the straight line by a distance ΔXn which is the difference between the estimated return time on the basis of the time series and the extrapolated value on the basis of the fit. It can be shown that ΔXn itself is Gumbel distributed if the extremes of y are well described by a Gumbel distribution, indicated by the g(x) function in Fig. 2. This result is more general and does not only hold for extremes that are Gumbel distributed, but it is valid for any distribution from which the extremes are drawn: the outliers are Gumbel distributed.This result enables one to verify whether the assumption about an underlying distribution of observed, meteorological time-series is valid. The only provision is that enough records are available in order to assess whether the outliers from each record indeed follow a Gumbel distribution.
Figure 2 Example of a Gumbel plot of observed annual extremes of a daily timeseries of observable y. If y is Gumbel distributed, the values appear on a straight line. The distance ΔXn indicates the difference in the return period of the most extreme value estimated from the timeseries and its true return period according to its distribution. ΔXn itself follows a Gumbel distribution g(x).

10 11
kvr 038/11 | remote inf luences on european climate
ResultsThe method has been applied to extreme winds, extreme daily and seasonal precipitation, extreme wave heights and extreme sea levels at the Dutch coast. Figure 3 illustrates the application of the method to annual extremes of 6 hourly wind speeds over the entire Northern Hemisphere on a 1 degree grid over the period 1958-2001 from the ERA40 reanalysis dataset. The assumption is tested that the annual extreme wind speed u is Gumbel distributed if uk is fitted instead of u, with k the locally determined Weibull shape parameter – a hypothesis originally put forward by Cook (1982). The NH was subdivided into 24 boxes, each of size 20 degree in latitude and 60 degree in longitude. With requiring a minimum interval of 3 days between the 1200 outliers ΔXn in each box, 11 up to 256 independent values of ΔXn were available for testing whether these were Gumbel distributed. Figure 3 contains the Gumbel plots for every box, together with the positions of the largest outliers. The size of the circles corresponds to the value of ΔXn. The figure shows that outside the tropics (latitude > 30 degrees) the assumption that the extremes of uk can be described by a Gumbel distribution is confirmed, but that in the tropics the assumption fails due to the occurrence of tropical cyclones, which generate a second population in the distribution of extreme winds (Van den Brink et al, 2004).
Previous analyses of model simulations (Van den Brink et al, 2004) have suggested the existence of extreme storms with return times much shorter than expected on the basis of extrapolation from less extreme events (so-called superstorms); or, put differently, the existence of a mixed population in the subtropical region of the North Atlantic basin. We revisited this question on the existence of superstorms using the more realistic model simulations of ESSENCE (higher resolution, more realistic descriptions of physical processes, closer to observed climate) and the new statistical approach as outlined above. Outside the tropics, no indications for a second population of extreme winds are found. This contradicts the findings of Van den Brink et al, 2004. However, both the more realistic model simulations of ESSENCE as well as the more robust statistical approach lead us to conclude that there are no indications for superstorms in the subtropical North Atlantic basin.

12
kvr 038/11 | remote inf luences on european climate
Figure 3 Extreme annual wind speeds according to the 1958-2001 ERA40 data. The NH is divided into 24 boxes. The circles give the grid points where the biggest outliers in wind speed took place with the size of the circle indicating the value of ΔXn. The Gumbel plot in each box shows the distribution of ΔXn of the independent outliers in that box.
However, the most extreme storms in the subtropical part of the North Atlantic basin do differ from normal storms. Figure 4 displays the Gumbel plot of the annual maximum wind speed in this area. The return time of the largest extreme is estimated to be around 106 years on the basis of a Generalized Extreme Value (GEV) distribution fit (see Brink and Können (2008) for details). A composite of the wind speed at 300 hPa and the pressure at sea level of 100 arbitrary extremes and the 10 most extreme storms are plotted in Figure 5. The composite of the 10 most extreme cases
180˚
240˚
300˚
0˚60˚
120˚
180˚
10˚
30˚
50˚
70˚
90˚
−2−1 0 1 2 3 4 5 6 −2−1
0 1
2 3
4 5
6
100
105
2
−2 0 2 4 6 8 −2 0
2 4
6 8
103
100
105
2
−2−1 0 1 2 3 4 5 6 7 −2−1
0 1
2 3
4 5
6 710
310
010
52
−2 0 2 4 6 8 10 −2 0
2 4
6 8
10
104
103
100
105
2
−2−1 0 1 2 3 4 5 −2−1
0 1
2 3
4 5
100
105
2
−2−1 0 1 2 3 4 5 6 −2−1
0 1
2 3
4 5
6
100
105
2
−2−1 0 1 2 3 4 5 6 −2−1
0 1
2 3
4 5
6
100
105
2
−2 0 2 4 6 8 10 12 14 −2 0
2 4
6 8
10
12
14
106
105
104
103
100
1052
−2−1 0 1 2 3 4 5 −2−1
0 1
2 3
4 5
100
105
2
−2−1 0 1 2 3 4 5 6 −2−1
0 1
2 3
4 5
6
100
105
2
−2−1 0 1 2 3 4 5 6 −2−1
0 1
2 3
4 5
6
100
105
2
−2 0 2 4 6 8 10 12 14 −2 0
2 4
6 8
10
12
14
106
105
104
103
100
1052
−2−1 0 1 2 3 4 5 6 7 −2−1
0 1
2 3
4 5
6 710
310
010
52
−2−1 0 1 2 3 4 5 6 −2−1
0 1
2 3
4 5
6
100
105
2
−2−1 0 1 2 3 4 5 6 −2−1
0 1
2 3
4 5
6
100
105
2
−2 0 2 4 6 8 −2 0
2 4
6 8
103
100
105
2
−1 0 1 2 3 4 5 6 7 −1 0
1 2
3 4
5 6
7103
100
105
2
−2−1 0 1 2 3 4 5 6 7 −2−1
0 1
2 3
4 5
6 710
310
010
52
−2 0 2 4 6 8 −2 0
2 4
6 8
103
100
105
2
−2 0 2 4 6 8 −2 0
2 4
6 8
103
100
105
2
−2−1 0 1 2 3 4 5 6 7 −2−1
0 1
2 3
4 5
6 710
310
010
52
−2 0 2 4 6 8 10 −2 0
2 4
6 8
10
104
103
100
105
2
−2−1 0 1 2 3 4 5 6 −2−1
0 1
2 3
4 5
6
100
105
2
−2 0 2 4 6 8 −2 0
2 4
6 8
103
100
105
2

12 13
kvr 038/11 | remote inf luences on european climate
shows a jet stream that is 10 m/s stronger and shifted southwards with respect to the composite of 100 normal storms. Additionally it shows a minimum in pressure at the left exit of the jet. The cyclogenetic character of the left exit of the jet is well-known (Sinclair and Michael, 2000); the interaction of the low level cyclone with the left exit of the upper level jet leads to exceptionally strong winds and happens frequently at higher latitudes but is seldom at these lower latitudes. However, this interaction does not lead to extreme winds that are so much stronger than extreme winds produced by ‘normal’ storms in which this interaction does not occur. that a mixed population can be detected in the extreme winds.
Figure 4 Gumbel plot of the annual extreme surface wind speed for the grid point (30N, 30W) from 1887 years of simulated model data of ESSENCE. The 10 highest events (blue) deviate from the fitted GEV distribution (black line). Those 10 events are compared with 100 arbitrary annual maxima (red). ΔXn is indicated by the green arrow. The vertical axis is linear in u1.8.
30
25
20
15
-2 -1 0 1 2 3 4 5 6 7 8 9 10 11 12 13 14
12
11
10
9
8
7
10610510410310050251052
win
d sp
eed
(m/s
)
Beau
fort
scal
eGumbel scale
return period [years]
GEV-fit to 1887 annual extremes1887 annual 10m-wind extremes10 highest events100 normal storms

14
kvr 038/11 | remote inf luences on european climate
Figure 5 Composite of the wind speed at 300 hPa (colors) and the pressure at mean sea level (contours) for the 100 arbitrary annual extremes of Fig. 4 (left) and the 10 highest events at the black dot (30N, 30W) (right).
ConclusionsIn this study, a robust statistical tool was developed that enables one to verify whether the most extreme events of multiple records are well described by the fitted distributions or not. On the basis of this verification one can safely use the fitted distribution to extrapolate to hitherto unobserved extremes. Using this method it was verified that annual wind extremes in the extra tropics are well described by a Gumbel distribution if uk is fitted instead of u, with k the locally determined Weibull shape parameter. No indications for a double population of the wind extremes are found in the extra tropics.
Topic 2: A study of extreme North Sea storm surges in a changing climate
IntroductionThe height of storm surges is extremely important for a low-lying country like The Netherlands. By law, part of the coastal defense system has to withstand a waterlevel that on average occurs only once every 10 000 years. The question then arises whether and how climate change affects the heights of extreme storm surges. Published research points to only small changes. However, due to the limited amount of data available results are usually limited to relatively frequent extremes like the annual 99th percentile. In this study we use the meteorological fields of the 17 member ESSENCE ensemble to drive a surge model of the North Sea (WAQUA, Gerritsen et al., 1995) and analyse the extreme water levels in this ensemble. This large number of realizations allows us to investigate the rarer extremes. Results from this study can be found in Sterl et al (2009) and Katsman et al (2011).
ResultsFigure 6 shows the Gumbel plot of annual minimum pressures observed at Nordby and simulated by ESSENCE. Nordby is selected because storm systems centered in this area have the greatest impact on the surge levels at the Dutch coast. A small constant offset is visible, but ESSENCE simulates the same dependence of the extremes on return time as observed. The meteorological situation that caused the highest surge at Hoek van Holland, when the ESSENCE winds are used to force the surge model WAQUA, is depicted in Fig. 6b. It corresponds to a storm with strong northwesterly winds, exactly the kind of storm that one would expect to have a big impact on the surge due to the long fetch over open ocean and the geometry of the North Sea.

14 15
kvr 038/11 | remote inf luences on european climate
Figure 6 (a) Gumbel plot of observed annual-minimum sea level pressure in Nordby, Denmark (8.2E, 55.3N) (red) and as simulated at the nearest ESSENCE grid point (blue), and (b) wind and pressure fields for the situation leading to the highest surge in Hoek van Holland that occurred in the ESSENCE-WAQUA/DCSM98 ensemble.
The large ensemble size enables us to calculate 10 000 year return water levels with a low statistical uncertainty, 4.4 ± 0.4 m at Hoek van Holland. In the one model used in this study, we find no statistically significant change in the 10 000 year return values of surge heights along the Dutch coast during the 21st century (Figure 7).
Figure 7 Gumbel plot for water levels at Hoek van Holland from the ESSENCE-WAQUA/DCSM98 ensemble. Black: observations, blue: present-day climate (1950–2000), red: future climate (2050–2100). The thin lines are the fits to a GEV, and the bars in the right margin indicate the 95% confidence interval of the 10 000-year return value.
We tested the assumption whether the water levels are adequately described by a Gumbel distribution. Figure 8 shows the results for a selection of 19 stations using the extreme surge levels from then ESSENCE-WAQUA ensemble. The ΔXn values (see topic 1 for details) of the 204 independent extremes that were found in the simulated records for these 19 stations are indeed Gumbel distributed, verifying that fitting a Gumbel distribution results in unbiased estimates up to return periods of 104 years.
a)
1.5
2
2.5
3
3.5
4
4.5
5
-2 0 2 4 6 8
2 5 10 25 50 100 103 104
wat
er le
vel [
m]
Gumbel variate
Hoek van Holland
return period6.7
ESSENCE 1950-2000ESSENCE 2050-2100
observations 1887-2004
b)
2 2.5
3 3.5
4 4.5
5 5.5
6 6.5
7
-2 0 2 4 6 8
2 5 10 25 50 100 103 104
wat
er le
vel [
m]
Gumbel variate
li in en and Cu aven
return period [ ear ]
li in en
Cu aven1950-20002050-2100
a)
955
960
965
970
975
980
985
990
995
-2 -1 0 1 2 3 4 5 6 7
2 5 10 25 50 100 103
pres
ssur
e at
sea
leve
l [hP
a]
Gumbel variate
Nordby (Denmark) at (55:27N,8:24E)
return period [years]
observations Nordby (1874-1986)ESSENCE
b)
a)
955
960
965
970
975
980
985
990
995
-2 -1 0 1 2 3 4 5 6 7
2 5 10 25 50 100 103
pres
ssur
e at
sea
leve
l [hP
a]
Gumbel variate
Nordby (Denmark) at (55:27N,8:24E)
return period [years]
observations Nordby (1874-1986)ESSENCE
b)

16
kvr 038/11 | remote inf luences on european climate
The Gumbel plot of the 1896-2005 record of observed water levels at Scheveningen is shown in Figure 9. Although the GEV and Gumbel fits are almost similar, the application of the Gumbel distribution results in a considerable reduction of the uncertainty for high return periods. With the new approach we are confident that the Gumbel fit adequately describes the water level extremes and that we can trust the extrapolation with the smaller error bars. The estimated return period of the 1953-disaster (the highest observation in the record) is 455 years according to the Gumbel fit, and 602 years according to the GEV fit.
ConclusionsExtreme water levels along the Dutch coast are adequately described by a Gumbel distribution up to return periods of 104 years. The best estimate at Scheveningen for such an extreme is 4.8 ± 0.4 m. The simulated change in extreme storm surges under the SRES A1b scenario for 2050-2100 is small and falls within the present-day uncertainty.
Figure 8 Gumbel plot of the statistical distribution of ΔXn and the spatial distribution of extreme sea levels in the southern North Sea, generated by the WAQUA surge model coupled to the ESSENCE simulated wind data. The colour coding in plot and map indicate the magnitude of ΔXn, and relate the points on the graph to their positions on the map. The total number of stations is 969; only the 204 independent values of ΔXn are shown. The size of the circles corresponds to the number of extremes observed at that position.
10000-YEAR RETURN VALUES FROM SHORT TIME SERIES
1° 2° 3° 4° 5° 6° 7° 8° 9°
51°
52°
53°
54°–2.0 –1.5 –1.0 –0.5 0.0 0.5 1.0 1.5 2.0 2.5 3.0 3.5 4.0 4.5 5.0 5.5
–2–1
012345
∆X
–2 –1 0 1 2 3 4 5Gumbel variate

16 17
kvr 038/11 | remote inf luences on european climate
Figure 9 Gumbel plot of the annual maxima of the sea level at Scheveningen (1896-2005), the Netherlands. Shown are the fits according to a Gumbel (red) and a GEV distribution (blue). The vertical bars indicate the 95% confidence intervals.
Topic 3: The influence of drying Mediterranean soils on the atmospheric circulation over the Netherlands
IntroductionMany studies on the impact of greenhouse warming on European summer conditions have focused on the heat budget and the hydrological cycle. Most of these [e.g. Sterl et al. 2008, Stott et al. 2004, Schär et al. 2004, Fischer et al. 2007] point towards a hotter and more arid climate with a larger number of long lasting heat waves due to a positive feedback between drier soils and surface air temperatures (SAT). Changes in atmospheric circulation have received less attention. The multi-model response of the climate models that participated in the third Coupled Modeling Intercomparison Project [CMIP3, Meehl et al, 2007] as discussed in the Fourth Assessment Report (AR4) of the IPCC (2007) and shown in Fig. 10.9 therein, however, displays a significant decrease of mean sea level pressure (MSLP) over North Africa and the Mediterranean area. Consistent with this an increase of easterly winds over Central Europe is found in most of the CMIP3 simulations [Van Ulden and Oldenborgh, 2006]. These easterly winds enhance the warming and drying over Central Europe. Using statistical analyses and additional climate model simulations we demonstrate that the decrease of MSLP can be understood as a large-scale heat low response to the drying and enhanced warming of that area. For the complete study, see Haarsma et al. (2009).
ModelsFor the analysis of the change in the summer circulation over Europe we have used the output of two climate models: the ECHAM5/OMI model used in the ensemble experiment ESSENCE and the integrated forecasting system (IFS) atmosphere model of the European Centre of Medium Range Weather Forecast (ECMWF) cycle 31R1. The ECMWF model is the atmospheric component of the
1
2
3
4
5
6
7
−2 0 2 4 6 8
2 5 10 25 50 100 103 104se
a le
vel a
t Sch
even
inge
n [m
]
Gumbel variate
return period [years]
observations 1896-2005Gumbel to observations
GEV to observations

18
kvr 038/11 | remote inf luences on european climate
earth system model EC-Earth. Both ESSENCE as well as ECMWF simulate rather well the climate over Europe. The large ensemble of ESSENCE ensures statistical robustness whereas the flexibility of the ECMWF model allows sensitivity experiments.
The ESSENCE data was analyzed for 1971–2000 and 2071– 2100 which will be denoted henceforth as present and future.
The ECMWF model was run at a horizontal resolution of about 1.875x1.875 degree with 40 levels in the vertical. Time slice experiments were made for the present (1971– 2000) and future (2071–2100) climate. These experiments consisted of ensembles of 5 runs of 10 year duration starting from different atmospheric initial conditions. In the analysis the first year was neglected, resulting in 45 years of data for each period. For the present climate observed climatological sea surface temperatures (SST), sea-ice, tropospheric sulfate aerosols and GHG concentrations were prescribed. Future aerosols and GHG’s were derived from the SRES A1b scenario. Future SST and sea-ice coverage corresponded to the multi-model ensemble mean seasonal cycle of 2071– 2100 of selected CMIP3 SRES A1b climate scenario simulations.
ResultsBoth the ESSENCE and the ECMWF model simulate a similar increase of easterly winds over summertime Europe in response to the enhanced greenhouse warming (see figure 10). Enhanced surface warming is simulated over Southern Europe with reduced overlying air pressure extending to 800 hPa height. The positive MSLP anomaly over the British Isles extends into the whole troposphere and is most likely due to a change in the planetary wave structure forced from remote regions. In this study we focus on the origin of the low pressure response. We hypothesize that it is a heat low response to the enhanced surface warming due to the summertime depletion of moisture in the South European soils in the warmer climate. First we test this hypothesis by a statistical analysis of the effect of soil moisture variations on surface air temperature and MSLP on intra-annual timescales using the ESSENCE dataset. Next we conduct sensitivity experiments with the ECMWF model designed to simulate the response of the circulation to enhanced Southern European surface warming.
Analysis of the effect of soil moisture variations in June on MSLP A singular value decomposition (SVD) analysis of the lagged covariance matrix between monthly mean soil moisture in June and MSLP in July-August determines a spatial pattern of soil moisture variations in June that co varies maximally with a particular spatial pattern of MSLP in July-August (see figure 11). This statistical relationship suggests that dry soils in Southern Europe tend to lead to low MSLP in the following months. The connection is weak, but detectable: the temporal correlation between the amplitude time series of the both patterns is 0.4. A linear regression of the amplitude time series of the soil moisture pattern in June with other fields reveals that dry soils in June tend to coincide with dry soils in July-August, reduced evaporation, reduced rainfall and higher temperatures. Reduced precipitation in Jan-May tends to precede the dry soils in June.
Sensitivity experiment with enhanced Southern Europe heatingTo confirm that an enhanced Southern Europe heating indeed causes a low MSLP response as suggested by the climate change outcomes and the statistical analysis of intra-annual variability, we introduced an additional artificial surface heat flux of 35 W/m2 over Southern Europe in a simulation with the ECMWF model (MEDFLUX experiment). The model response is indeed characterized by a large-scale surface heat low that causes more frequent easterly winds over central Europe (see figure 12). It explains about half of the circulation response in the climate change simulations (see figure 10): the high over the British Isles is absent in this experiment.

18 19
kvr 038/11 | remote inf luences on european climate
Figure 10 Difference between 2071–2100 and 1971–2000 during JJA for (left) ECMWF and (right) ESSENCE of (a) and (b) MSLP (hPa), (c) and (d) SAT (o Celsius), (e) and (f) geopotential height (m) zonally averaged over 0o E - 30o
E, and (g) and (h) PDF of daily mean zonal wind (m/s) averaged over 0o E–20o E, 40o N–50o N (blue: 1971–2000, red: 2071–2100). For SAT the global mean change has been subtracted.

20
kvr 038/11 | remote inf luences on european climate
Figure 11 Pattern of (a) soil wetness variations in June that has a maximum covariance with the pattern of (b) MSLP (hPa) in July–August as calculated from a Singular Value Decomposition (SVD) of the covariance matrix using all 17 ensemble members of ESSENCE for 1951–2000. The amplitude of the soil wetness pattern corresponds to one standard deviation of its amplitude time series; the amplitude of the MSLP pattern and other fields corresponds to the response to a one standard deviation change in the soil wetness pattern. Regressions between the amplitude time series of the soil wetness SVD pattern of Figure 11a in June and (c) evaporation (mm/day), (d) SAT (o C), (e) precipitation (mm/day) in July– August and (f) precipitation in January–May (mm/day).
a b
c d
e f

20 21
kvr 038/11 | remote inf luences on european climate
Figure 12 As figure 10a,10c, 10e and 10g, but for the MEDFLUX experiment (see text).
ConclusionsIn summary, we found that a robust heat low response to enhanced warming of Southern Europe is simulated by two different climate models. The enhanced warming is due to drying soils due to enhanced summer evaporation and reduced late winter precipitation. The heat low response causes an increase in easterly winds over central Europe, further enhancing the warming and drying signal over summertime central Europe in climate scenario simulations with enhanced concentrations of greenhouse gases. Climate projections for the Netherlands need to take the uncertainty involved in the projected circulation changes into account.
Topic 4: The impact of warmer North Sea temperatures on rainfall over the Netherlands
IntroductionThe impact of coastal SSTs of the North Sea on summertime precipitation in The Netherlands is analyzed with Regional Climate Model (RCM) integrations for August 2006 and with observations from the period 1958–2006 in a collaborative effort between the CS5 and CS6 project. August 2006 provided an excellent test case to evaluate RACMO, check whether it is capable of reproducing the precipitation extremes and quantify the effect of warm SST’s on precipitation extremes over land. This is relevant for the construction of scenarios for changes in such extremes in a warmer climate.
August 2006 was characterized by a cold and wet Northwesterly circulation, which – in combination with high SSTs inherited from a very warm July – brought excessive precipitation amounts in the Netherlands, in particular in areas close to the sea (Figure 13). Simulations with the KNMI regional atmospheric climate model RACMO2 are performed to assess the influence of SST in the North Sea on precipitation in the Netherlands.

22
kvr 038/11 | remote inf luences on european climate
ResultsFor the complete results, see Lenderink et al (2009). Here a brief overview is presented.
The regional model reproduces the overall rainfall structure with the highest amounts close to the sea when using the observed SSTs. When using climatological SSTs, the simulated rainfall over The Netherlands is dramatically reduced, showing the strong impact of the warm SSTs (Figure 13).
On a more detailed level the model fails to reproduce the exact spatial distribution (too much rain too close to the coast) and tends to underestimate the strongest daily events (not shown). In a set of sensitivity experiments the dependency of precipitation on the SST is investigated. In experiments with a 2 oC lower SST compared to the reference, coastal rainfall amounts are approximately 30% lower (not shown), yielding a temperature dependency close to two times the Clausius-Clapeyron (CC) relation.
The relation between SST, atmospheric circulation, and precipitation is further analyzed statistically on the basis of daily observations in the period 1958–2006. Under favorable circulation conditions – mostly cyclonic westerly flows – dependencies of coastal precipitation on the SST again amount to approximately two times the CC relation. These relations are consistent with the observed precipitation amounts during August 2006.
The trend in mean precipitation (1951–2006) in summer shows that the coastal zone is progressively getting wetter compared to the inland zone (see Figure 14b). At the same time, it is found that the summer SSTs have risen approximately two times faster than the global mean temperature (see Figure 14a). The positive trend in the difference between coastal and inland precipitation seems to be a robust finding as it is quite insensitive to the precise choice of the period of analysis. In contrast, the trend in precipitation itself is highly dependent on the analyzed period for both regions.

22 23
kvr 038/11 | remote inf luences on european climate
Figure 13 Sea surface temperatures (SSTs) derived from NOAA for August 2006 (a) and the 1981-1990 August climatological SSTs from ERA40 (b). Anomalous SSTs for August 2006 (c) and August 1st 2006 only (d). Monthly mean 500 hPa geopotential height for July 2006 (e) and August 2006 (f). Observed (g) and simulated rainfall with RACMO2 for August 2006 SSTs derived from NOAA (h) and climatological SSTs (i).
40°N
50°N
60°N
70°N
60°W
60°W
50°W
50°W
40°W
40°W
30°W
30°W
20°W
20°W
10°W
10°W
0°
0°
10°E
10°E
20°E
20°E 30°E
30°E
40°E
40°E
50°E
50°E
60°E
60°E552556
556
560
560
564
564
568
568 572
572 576
576
580580
580
584
584
588
500 hPa geopotential height July 2006
40°N
50°N
60°N
70°N
60°W
60°W
50°W
50°W
40°W
40°W
30°W
30°W
20°W
20°W
10°W
10°W
0°
0°
10°E
10°E
20°E
20°E 30°E
30°E
40°E
40°E
50°E
50°E
60°E
60°E556
556
560
560
564
564
564 568
568
568
572
572
572
576576580580584584
588588
500 hPa geopotential height August 2006

24
kvr 038/11 | remote inf luences on european climate
Figure 14(a) Temperature trends in the period 1951–2006. Shown is the trend in global mean near surface temperature, the temperature at De Bilt, the sea surface temperature (SST) in the North Sea derived from ERA40 (only 1958–2006 period) and derived from HadSST. (b) Time series of the 20-year moving average (smoothed with a 1-2-1 filter to remove high frequency noise) of mean, coastal and inland precipitation for late summer (July, August, September) in the Netherlands.
Can we expect more events like August 2006 in the future climate? Of course, the answer strongly depends on the atmospheric circulation. In particular, it depends on how often a similar sequence of a very warm circulation followed by a rapid transition to a cold anti-cyclonic circulation will occur in the future climate. At the moment, this is difficult to assess from global climate models. Preferably ensembles of global climate model integrations are needed to separate the natural variability from the climate change signal. In addition, global climate models should be better evaluated, and improved, with respect to their ability to simulate transitions between the atmospheric circulation regimes. However, given that the frequency of these events does not change, it is likely that the rise in SSTs will cause an increase in coastal rainfall, as supported by the trends in precipitation over the last 55 years. Since the North Sea is shallow it is also likely that it will more closely follow the larger temperature rise above the continent compared to the (Atlantic) ocean. Thus, the local temperature rise in the North Sea may be considerably larger than the temperature rise in the Atlantic Ocean, giving rise to stronger coastal changes in precipitation.
Conclusions In summary, the results show a strong influence of near-coastal SSTs on precipitation in the coastal areas of the Netherlands on all timescales—dependencies that may significantly exceed the CC relation. Although the situation may be rather specific for the Netherlands, we are convinced that the results have a wider implication and that high resolution modeling, including realistic representations of coastal seas, is needed to provide climate change scenarios for coastal areas.
24 25
kvr 038/11 | remote inf luences on european climate
Topic 5: The effect of a change in the deep convection parameterization in the EC-Earth climate model on tropical rainfall and extra-tropical circulation
IntroductionThe Numerical Weather Prediction system of the European Centre for Medium-Range Weather Forecasts (ECWMF) forms the basis of the ECEarth Earth system model (hence the name ECEarth). NWP models are designed to capture short-term atmospheric fluctuations accurately. They are used for forecasts at daily to seasonal time scales and include data assimilation capabilities. Climate models are designed to represent the global coupled ocean-atmosphere system. They are used for different purposes and time scales than NWP models, but could benefit from several best practices from the NWP community. A credible climate model should also be able to produce good weather forecasts.In this part of CS5 we attempted to alleviate a bias in the simulation of the winter time flow over Europe without sacrificing the short term prediction skill of EC-Earth.
Model The atmospheric model of ECEarth version 2, which is the current reference version, is based on ECMWF’s Integrated Forecasting System (IFS), cycle 31R1, corresponding to the current seasonal forecast system of ECMWF. The standard configuration runs at T159 horizontal spectral resolution with 62 vertical levels. In fact some aspects of a newer IFS cycle have been implemented additionally, including a new convection scheme as part of the work in CS5 and the new land surface scheme H-TESSEL (Balsamo et al 2009). The ocean component is based on version 2 of the NEMO model (Madec 2008) with a horizontal resolution of nominally 1 degree and 42 vertical levels. The sea ice model is the LIM2 model. The ocean/ice model is coupled to the atmosphere/land model through the OASIS 3 coupler (Valcke 2006).
The first evaluations of ECEarth version1 based on cycle 31R1 of IFS, showed large biases in tropical rainfall and the extra-tropical winter circulation over Europe with a too deep Icelandic low, leading to too strong westerlies over Europe. Since ECEarth was planned to be used to produce climate scenario’s for Europe, it seemed imperative that the model should be improved in this respect.
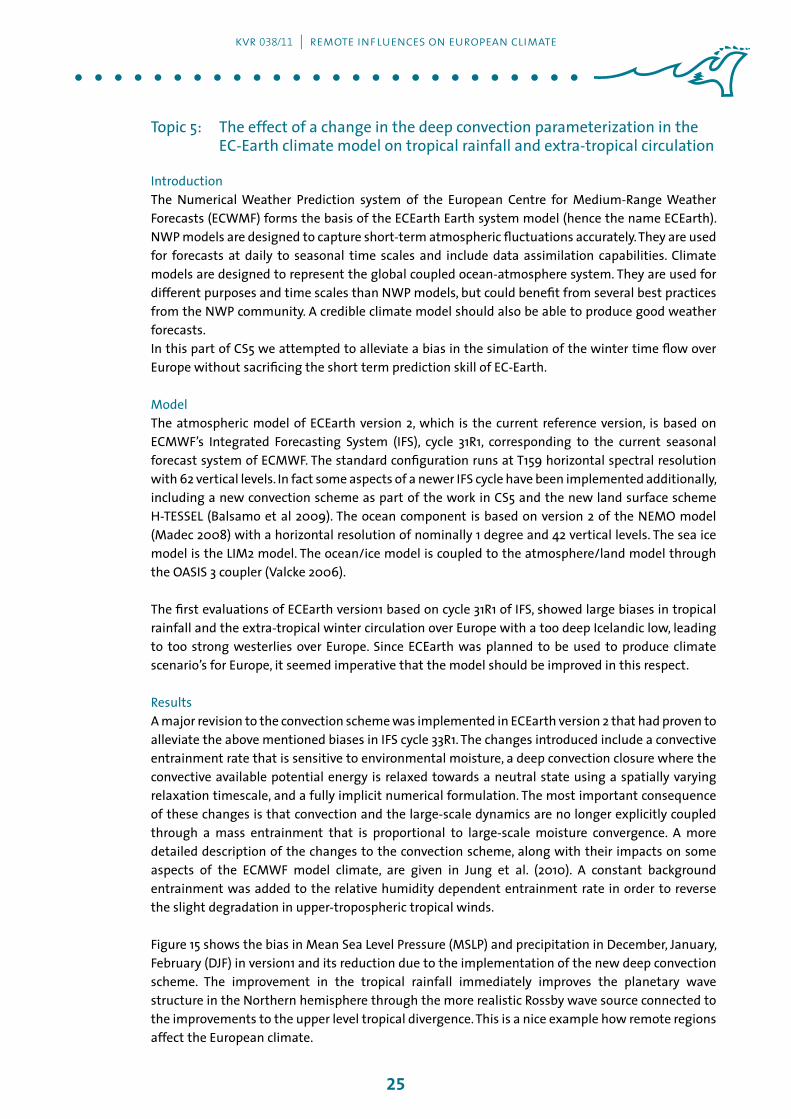
ResultsA major revision to the convection scheme was implemented in ECEarth version 2 that had proven to alleviate the above mentioned biases in IFS cycle 33R1. The changes introduced include a convective entrainment rate that is sensitive to environmental moisture, a deep convection closure where the convective available potential energy is relaxed towards a neutral state using a spatially varying relaxation timescale, and a fully implicit numerical formulation. The most important consequence of these changes is that convection and the large-scale dynamics are no longer explicitly coupled through a mass entrainment that is proportional to large-scale moisture convergence. A more detailed description of the changes to the convection scheme, along with their impacts on some aspects of the ECMWF model climate, are given in Jung et al. (2010). A constant background entrainment was added to the relative humidity dependent entrainment rate in order to reverse the slight degradation in upper-tropospheric tropical winds.
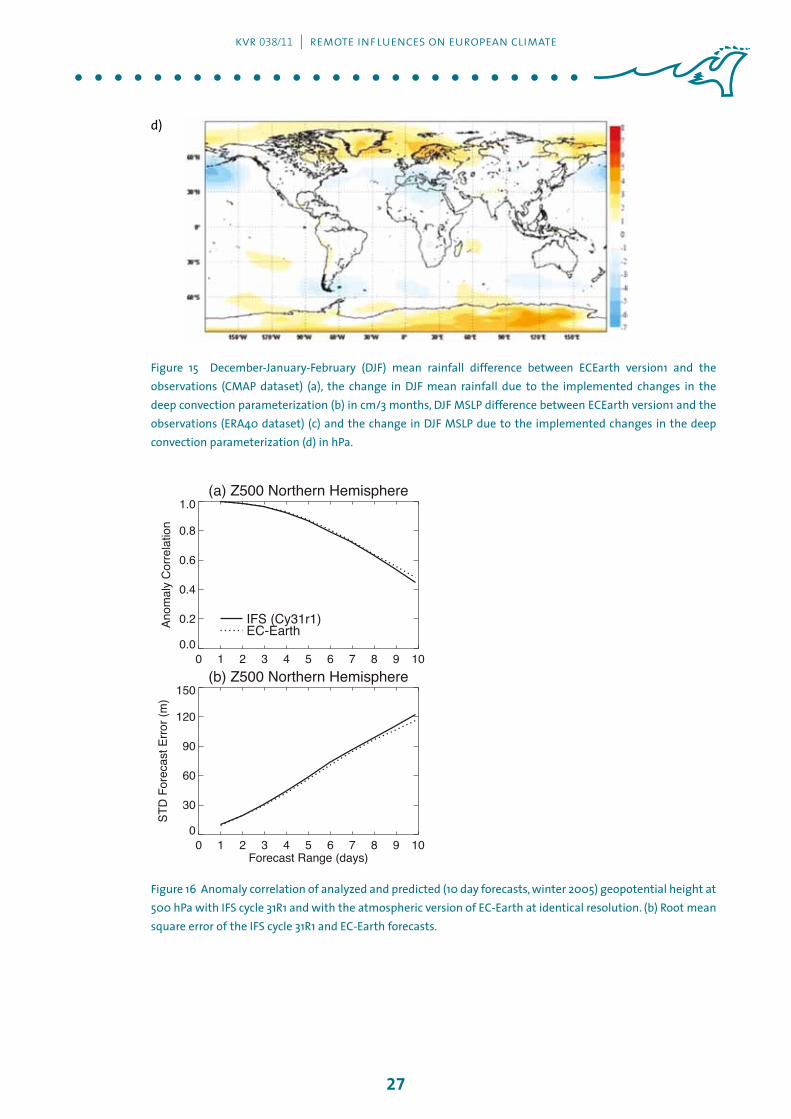
Figure 15 shows the bias in Mean Sea Level Pressure (MSLP) and precipitation in December, January, February (DJF) in version1 and its reduction due to the implementation of the new deep convection scheme. The improvement in the tropical rainfall immediately improves the planetary wave structure in the Northern hemisphere through the more realistic Rossby wave source connected to the improvements to the upper level tropical divergence. This is a nice example how remote regions affect the European climate.

26
kvr 038/11 | remote inf luences on european climate
In addition to these and some other additional changes to the atmosphere, ocean and sea-ice parameters were adjusted to improve the climate of the fully coupled ECEarth model.
The concept of seamless prediction fails if the additional tuning required to simulate a good mean climate and its variability degrades the prediction skill on short time scales. Since primarily slow processes were affected when optimizing the fully coupled system, this is not expected. Indeed, weather re-forecasts with the current atmospheric component of ECEarth show that the model has good forecast skill. As an illustration we present the anomaly correlation and the standard error of geopotential height at 500hPa (Figure 16). Forecasts made by the consortium with the ECMWF model (IFS cycle 31R1) and the EC-Earth model (at the same horizontal and vertical resolution) show comparable levels of skill.
a)
b)
c)
26 27
kvr 038/11 | remote inf luences on european climate
d)
Figure 15 December-January-February (DJF) mean rainfall difference between ECEarth version1 and the observations (CMAP dataset) (a), the change in DJF mean rainfall due to the implemented changes in the deep convection parameterization (b) in cm/3 months, DJF MSLP difference between ECEarth version1 and the observations (ERA40 dataset) (c) and the change in DJF MSLP due to the implemented changes in the deep convection parameterization (d) in hPa.
Figure 16 Anomaly correlation of analyzed and predicted (10 day forecasts, winter 2005) geopotential height at 500 hPa with IFS cycle 31R1 and with the atmospheric version of EC-Earth at identical resolution. (b) Root mean square error of the IFS cycle 31R1 and EC-Earth forecasts.
(a) Z500 Northern Hemisphere
0 1 2 3 4 5 6 7 8 9 100.0
0.2
0.4
0.6
0.8
1.0
Anom
aly
Cor
rela
tion
IFS (Cy31r1)EC-Earth
(b) Z500 Northern Hemisphere
0 1 2 3 4 5 6 7 8 9 10Forecast Range (days)
0
30
60
90
120
150
STD
For
ecas
t Erro
r (m
)

28
kvr 038/11 | remote inf luences on european climate
ConclusionsIn summary, the implemented changes in the parameterization of deep convection in ECEarth version 2 improved not only the tropical precipitation pattern and its variability, but alleviated a serious bias in the simulation of the mean winter circulation in Europe. This change did not degrade the short term forecasts. The improvement in the simulation of the circulation over Europe is witness to the fact that remote atmospheric processes can have a profound impact on local climates in Europe through the propagation of large-scale Rossby waves, emanating from tropical sources.
Synthesis
A major achievement of CS5 is the development of a robust statistical approach to find the appropriate extreme value distribution of meteorological parameters and to provide return values for large return periods from short records. This approach was among others applied to obtain unbiased estimates of the 1 in 10000 year extreme sea level event along the Dutch coast.
Extensive use has been made of the ESSENCE ensemble of climate scenario simulations to assess the climate change signal with a high degree of statistical significance. The availability of a large ensemble turned out to be crucial to evaluate the effect of climate change on the extreme surge levels along the Dutch coast and to detect the influence of summertime soil moisture depletion in southern Europe on the atmospheric circulation.
Numerical experimentation with the climate model EC-Earth has provided insights into the origin of climate biases and circulation changes over Europe. It is an excellent tool to assess uncertainties in climate projections and improve our understanding of how the climate system works. We achieved an improvement in the climate simulation over Europe without sacrificing the ability to make good weather forecasts over Europe which gives confidence that the implemented changes make the model more realistic.
The concrete contributions of CS5 to the development of the next KNMI climate scenarios are the following: • More accurate estimates of extreme storm surges have been obtained through the development
and application of a new statistical approach.• No substantial changes in the storm surge contribution to extreme sea levels are foreseen in a
warming climate.• No evidence is found for the existence of so-called superstorms at our latitudes. We therefore
can trust the extrapolation to more extreme storms on the basis of the hitherto observed extremes.
• Special attention should be paid to the warming of the North-Sea and its effect on the precipitation extremes, especially along the coastal regions. This requires the ability of the climate model to resolve the sharp gradients in SST along the coasts. Not resolving these gradients accurately leads to an under prediction of extreme rainfall.
• Simulated circulation changes in summer are related to drying of the soils in southern Europe and thus on the precipitation changes in late winter/early spring. The climate models to be analysed for the KNMI next scenarios should be evaluated in this aspect.

28 29
kvr 038/11 | remote inf luences on european climate
• EC-Earth will produce a more realistic circulation over wintertime Europe in the climate scenario simulations that will be produced for the next IPCC assessment report due to the improved tropical rainfall distribution resulting from the implemented change in the deep convection parameterization.
As stated and illustrated in the introduction, our local climate depends on processes taking place in locations as remote as the deep tropics in the Western Pacific ocean. These influences are communicated through changes in the large scale circulation. We know that current climate models have considerable errors in the simulation of the present day tropical circulation and thus also in the simulated change in response to rising GHGs (Haarsma and Selten, 2011). The uncertainty involved in these changes should be properly taken into account in the construction of climate scenarios for the Netherlands. Models should be improved in this respect. This requires focused research into the origins of these errors.
Scientific output
Results from these studies were communicated through contributions to the “Commissie Veerman” report on storm surges and to 7 peer-reviewed papers:
Sterl, A., H. van den Brink, H. de Vries, R. Haarsma and E. van Meijgaard, An ensemble study of extreme North Sea storm surges in a changing climateOcean Science, 2009, 5, 369-378.``
Katsman, C.A., A. Sterl, J.J. Beersma, H.W. van den Brink, W. Hazeleger en and 15 co-authors, Exploring high-end scenarios for local sea level rise to develop flood protection strategies for a low-lying delta, Climatic Change, 2011, published online: dor:10.1007/s10584-011-0037-5.
Brink, H.W. van den and F.M. Selten, Extrapolation from wind extremes: pitfalls and surprises. submitted, Atm. Chem. Phys., 2010.
Brink, H.W. van den and G.P. Konnen, Estimating 10000-year return values from short time series Int. J. Climatology, 2009, doi:10.1002/joc.2047.
Brink, H.W. van den and G.P. Konnen, The statistical distribution of meteorological outliersGeophys. Res. Lett., L2370, 2008, 35, 1-5, doi:10.1029/2008GL035967.
Haarsma, R.J., F.M. Selten, B.J.J.M. van den Hurk, W. Hazeleger, X. Wang, Drier Mediterranean Soils due to Greenhouse Warming bring easterly Winds over Summertime Central EuropeGeophys. Res. Lett., 2009, 36, L04705, doi:10.1029/2008GL036617.
Haarsma, R.J., F.M. Selten, Anthropogenic changes in the Walker Circulation and their impact on the extra-tropical planetary wave structure, submitted to Clim.Dyn.. 2011.

30
kvr 038/11 | remote inf luences on european climate
Lenderink, G., E. van Meijgaard and F. Selten, Intense coastal rainfall in the Netherlands in response to high sea surface temperatures: analysis of the event of August 2006 from the perspective of a changing climate. Clim. Dyn., 2009, 32, 19-33, doi:10.1007/s00382-008-0366-x.
In addition to these papers, the results of CS5 have been communicated through a number of oral and poster presentations at scientific meetings.
References
Balsamo, G., P. Viterbo, A. Beljaars, B.J.J.M. van den Hurk, A. Betts and K. Scipal, 2009: A revised hydrology for the ECMWF model: Verification from field site to terrestrial water storage and impact in the Integrated Forecast System. J. Hydrometeorology, 10, 623-643.
Bouillon S, Angel Morales Maqueda M, Legat V, Fichefet T (2009) An elastic-viscous-plasticsea ice model formulated on Arakawa B and C grids. Ocean Modelling 27:174–184, doi:10.1016/j.ocemod.2009.01.004.
Brandefelt, Jenny, Heiner Körnich, 2008: Northern Hemisphere Stationary Waves in Future Climate Projections. J. Climate, 21, 6341–6353. doi: 10.1175/2008JCLI2373.1.
Brink, HW van den, GP Können and JD Opsteegh, 2004: Statistics of extreme synoptic-scale wind speeds in ensemble simulations of current and future climate. J. Clim, 17: 4564-4574.
Cook, NJ, 1982: Towards better estimation of extreme winds. Journal of Wind Engineering and Industrial Aerodynamics, 9: 295-323.
Gerritsen, H., de Vries, H. and Philippart, M.: The Dutch Continental Shelf Model, in: Quantitative Skill Assessment for Coastal Ocean Models, edited by: Lynch, D. and Davies, A., Coastal and Estuarine Studies, 47, AGU, 1995.
Hazeleger W, Severijns C, Semmler T et al, (2010) EC-Earth: A Seamless Earth-System Prediction Approach in Action. Bulletin of the American Meteorological Society 91(10):1357–1363.
Jung, T., Balsamo, G., Bechtold, P., Beljaars, A. C. M., Köhler, M., Miller, M. J., Morcrette, J.-J., Orr, A., Rodwell, M. J. and Tompkins, A. M. (2010), The ECMWF model climate: recent progress through improved physical parametrizations. Quarterly Journal of the Royal Meteorological Society, 136: 1145–1160. doi: 10.1002/qj.634.
Lenderink G, Van den Hurk B, Van Meijgaard E, Van Ulden A, Cuijpers H (2003) Simulation of present-day climate in RACMO2: first results and model developments. KNMI technical report, TR-252.
Madec G., 2008: NEMO ocean engine. Note du Pole de modélisation, Institut Pierre-Simon Laplace (IPSL), France, No 27 ISSN No 1288-1619.

30 31
kvr 038/11 | remote inf luences on european climate
Meehl, G. A., C. Covey, T. Delworth, M. Latif, B. McAvaney, J. F. B. Mitchell, R. J. Stouffer, and K. E. Taylor (2007), The WCRP CMIP3 multi-model dataset, Bull. Am. Meteorol. Soc., 88, 1383-1394, doi:10.1175/BAMS-88-9-1383.
Schär, C., P. L. Vidale, D. Lüthi, C. Frei, C. Häberli, M. A. Liniger, and C. Appenzeller (2004), The role of increasing temperature variability in European summer heat waves, Nature, 427, 332– 336.
Sinclair, MR and JR Michael, 2000: Classification and composite diagnosis of extratropical cyclogenesis events in the southwest pacific. Month. Weath. Rev., 128.
Sterl,A., C. Severijns,H. Dijkstra,W.Hazeleger, G. J. vanOldenborgh, M. van den Broeke, G. Burgers, B. van den Hurk, P. J. van Leeuwen, and P. van Velthoven (2008), When can we expect extremely high surface temperatures?,Geophys. Res. Lett., 35, L14703, doi:10.1029/2008GL034071.
Stott, P. A., D. A. Stone, and M. R. Allen (2004), Human contribution to the European heat wave of 2003, Nature, 432, 610– 614.
van Ulden, A. P., and G. J. van Oldenborgh (2006), Large-scale atmospheric circulation biases and changes in global climate model simulations and their importance for climate change in central Europe, Atmos. Chem. Phys., 6, 863–881.
Valcke S., 2006: OASIS3 User Guide (prism_2-5). PRISM Report Series, No 2, 6th Ed.[http://www.prism.enes.org/Publications/Reports/all_editions/index.php#report02.

32
kvr 038/11 | remote inf luences on european climate

Climate scenarios
www.climatechangesspatialplanning.nl
Climate changes Spatial PlanningClimate change is one of the major environmental issues of this century. The Netherlands are expected to face climate change impacts on all land- and water related sectors. Therefore water management and spatial planning have to take climate change into account. The research programme ‘Climate changes Spatial Planning’, that ran from 2004 to 2011, aimed to create applied knowledge to support society to take the right decisions and measures to reduce the adverse impacts of climate change. It focused on enhancing joint learning between scientists and practitioners in the fields of spatial planning, nature, agriculture, and water- and flood risk management. Under the programme five themes were developed: climate scenarios; mitigation; adaptation; integration and communication. Of all scientific research projects synthesis reports were produced. This report is part of the Climate scenarios series.
Climate scenariosThe projects in this field are designed to obtain high quality climate information and scenarios relevant for the Netherlands. The projects both focus on an improved monitoring and modelling of regional climate variability, and at the construction of tailored climate change scenarios suitable for exploring spatial adaptation options, such as flood retention areas or coastal defense. In all fields special attention is devoted to extreme climate conditions. The climate scenarios are designed and developed jointly with a number of key stakeholders.
c/o Alterra, Wageningen URP.O. Box 476700 AA WageningenThe NetherlandsT +31 317 48 [email protected]
Programme Office Climate changes Spatial Planningc/o VU University Amsterdam, FALWDe Boelelaan 10851081 HV AmsterdamThe NetherlandsT +31 20 598 [email protected]