impact of climate change on malaysiaensearch.org/wp-content/uploads/2013/10/paper-1... · impact of...
TRANSCRIPT

Impact of Climate Change
on M alaysia
Ir. Hj. Ahmad Jamalluddin b. Shaaban Director General
National Hydraulic Research Institute of Malaysia Ministry of Natural Resources & Environment
22 OCT 2013

Outline
•Climate Change in Malaysia
•Impacts • Water Quantity and Quality
• Sea Level Rise
•Adaptation
•Way Forward

Climate Change in Malaysia
4
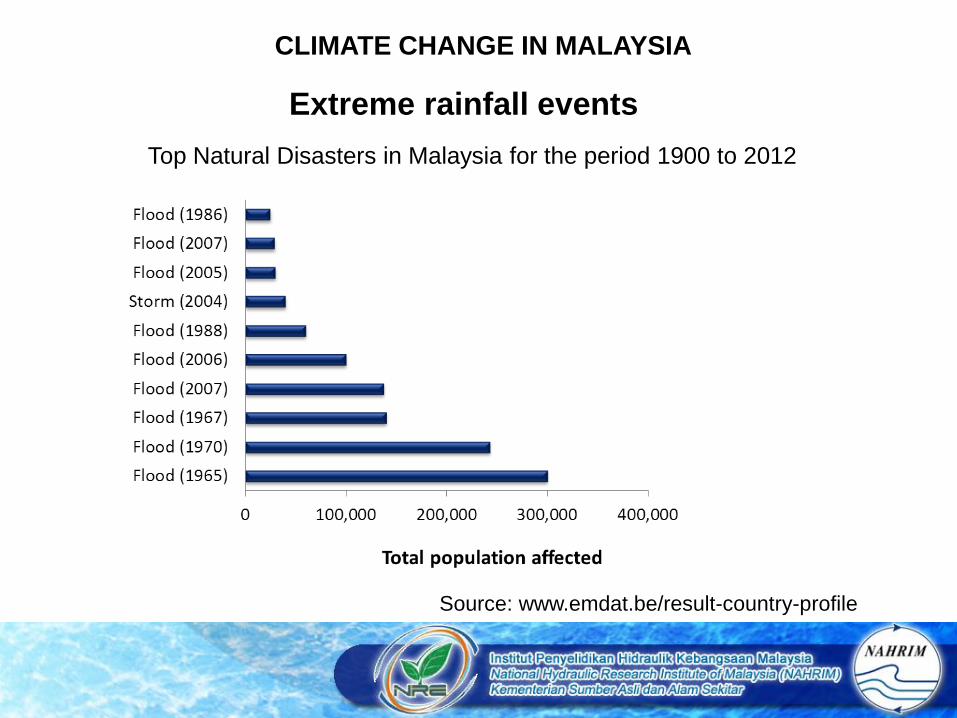
Source: www.emdat.be/result-country-profile
Extreme rainfall events
CLIMATE CHANGE IN MALAYSIA
Top Natural Disasters in Malaysia for the period 1900 to 2012

5
Temperature: Increase in mean surface temperature: 0.6°C to 1.2°C , 1969-
2009 (MMD)
Rainfall Increased rainfall intensity -> 1-hour rainfall intensity (2000-
2007) increase by 17% compared to 1970s values (NAHRIM)
“Above average” rainfall In 2007: Massive floods in Batu Pahat, Johor Baru, Kluang,
Kota Tinggi, Mersing, Muar, and Segamat ->Typhoon Utor Flood losses ~ RM 1.5 billion
Sea Level Rise 4.6 cm to 11.9 cm, satellite altimetry data (1993-2010)
Observed Climatic Change

6
Study of the Impact of Climate Change on the Hydrologic Regime and Water Resources of Peninsular Malaysia (2006)
Study of the Impact of Climate Change on the Hydrologic Regime and Water Resources of Sabah and Sarawak (2010)
The Study of The Impact Of Climate Change on Sea Level Rise in Malaysia (2010)
Climate Change related Research
in Malaysia

7
2006: A regional hydrologic-
atmospheric model of Peninsular Malaysia called as ‘Regional Hydro-climate Model of Peninsular Malaysia (RegHCM-PM) was developed
Downscaling global climate change simulation data (Canadian GCM1 current and future climate data) that are at very coarse resolution (~ 410km), to Peninsular Malaysia (West Malaysia) at fine spatial resolution (~9km) – for future period of 2025 to 2050 (2025-2034 & 2041-2050)
The grid layout for the outer domain (1st Domain, 26x28 grids, 81 km
resolution) of the RegHCM-PM
27km x 27km 9km x 9km
Research on the Impacts of Climate Change on Hydrologic Regime & Water Resources of Peninsular Malaysia

8
NAHRIM Regional Scale Model Configuration
Global Scale
Atmospheric
&
Ocean
Data CGCM, NCEP
Topography
&
Landcover
(USGS) Soil (FAO)
Boundary
Conditions
Initial
Fields
MM5
Model
Outer Domain
Boundary
Conditions
Initial
Fields
MM5
Model
2nd
Domain
Boundary
Conditions
Initial
Fields
MM5
Model
Inner
Domain
Watershed Scale
Hydro-climate
Output
IRSHAM
Model
Domain
Topography,
Landcover
&
Soil
(NAHRIM)
Model
Nesting
CGCM1 MESOSCALE MODEL (MM5)
Regional HCM-PM/SS

9
Average Annual TEMP
Max: +1.4oC KLANG (5.3%)
Min: +1.21oC N/EAST COAST (4.6%)
NAHRIM’s RegHCM-PM Simulated Future Temperature

10
Average Annual RAIN
Max: +264mm N/EAST COAST
(8.5%)
Min: -110mm SELANGOR (-4.9%)
NAHRIM’s RegHCM-PM Simulated Future Annual Rainfall
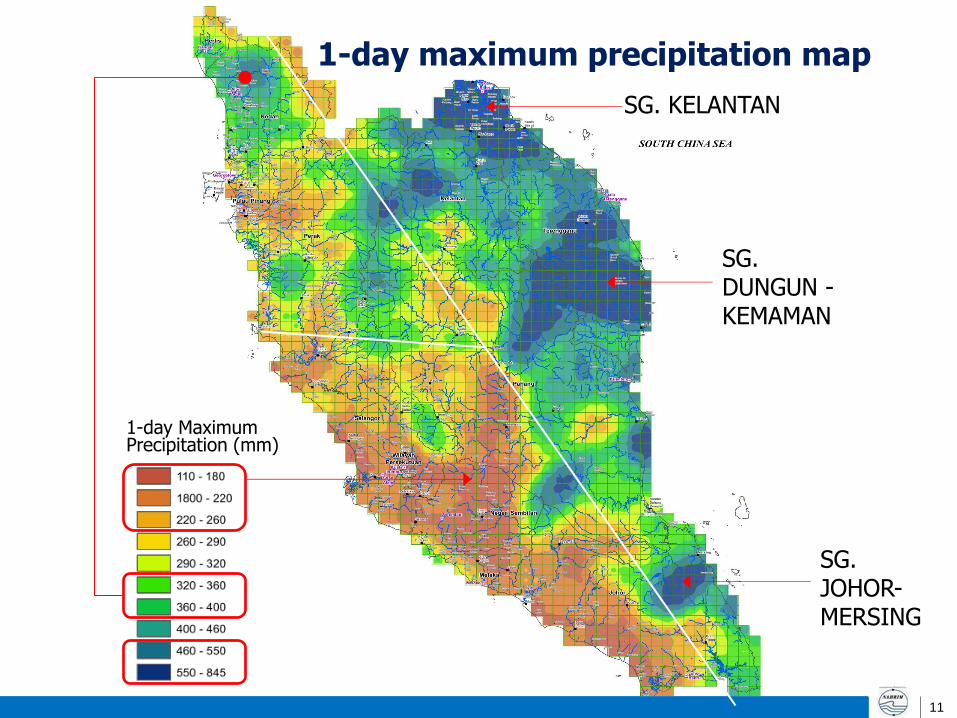
11
SG. KELANTAN
SG. DUNGUN -KEMAMAN
SG. JOHOR-MERSING
1-day Maximum Precipitation (mm)
1-day maximum precipitation map

12
Mean Monthly Flow
Max: +12% [KEL]
Min: - 8% KLANG
NAHRIM’s RegHCM-PM Simulated Future River Flow

13
2010: A regional hydrologic-atmospheric model of east Malaysia called as ‘Regional Hydro-climate Model of Sabah and Sarawak (RegHCM-SS) was developed
Downscaling global climate change simulation data (ECHAM5 GCM and MRI GCM2.3.2 at control run simulation and future climate simulation data) that are at very coarse resolution (~ 208/310km), to Sabah & Sarawak (East Malaysia) at fine spatial resolution (~9km) – for future period of 2010 to 2100
The grid layout for the outer domain (1st Domain, 26x28
grids, 81 km resolution) of the RegHCM-SS
27km x 27km 9km x 9km
Research on the Impacts of Climate Change on Hydrologic Regime & Water Resources of Sabah and Sarawak

14
NAHRIM’s RegHCM-SS Projected Temperature
SABAH 2040 - 2050 2090 - 2100
Min . 1 . 36 o C 2 . 31 o C Mean 1 . 51 o C 3 . 27 o C Max . 2 . 22 o C 4 . 01 o C
SARAWAK 2040 - 2050 2090 - 2100
c 2 . 03 o C C 3 . 10 o C
Min . 1 . 08 o
Mean 1 . 23 o
Max . 1 . 61 o C 3 . 24 o C

15
Tuaran: Substantial
increase of monthly Min.
& Mean Rainfall in
2090-2100 (19.7%)
SCS Coast: Highest projected
monthly Max. rainfall
increases of 46.4% (2040-
2050) to 58.1% (2090-2100)
Limbang: Highest
projected Monthly Max.
rainfall increases of
51.77% (2040-2050) to
99% (2090-2100)
NAHRIM’s RegHCM-SS Projected Rainfall

16
1-day maximum precipitation map
SCS COAST
TUARAN
SOUTHERN SARAWAK

17
SARAWAK R . ( FLOODS ) 2040 - 2050 2090 - 2100
Low Flow ( m 3
/ s ) 2 . 91 /( 4 . 05 ) 6 . 16 /( 4 . 05 ) High Flow ( m
3 / s ) 89 . 42 /( 98 . 42 ) 133 . 91 /( 98 . 42 )
NAHRIM’s RegHCM-SS Projected Flow
KEDAMAIAN ( WATER SUPPLY & FLOODS ) 2040 - 2050 2090 - 2100
Low Flow ( m 3
/ s ) 1 . 75 /( 3 . 40 ) 3 . 18 /( 3 . 40 ) High Flow ( m
3 / s ) 218 . 9 /( 100 . 8 ) 148 . 4 /( 100 . 80 )
FLOODS
WATER SUPPLY PROBLEM

18
PROJECTED CLIMATE CHANGE IN MALAYSIA
Climate Parameter
Peninsular Malaysia [RegHCM-PM]
Sabah [RegHCM-SS]
Sarawak [RegHCM-SS]
Annual mean surface temp.
1.0-1.5oC [2050]
[2050] 1.3-1.7oC [2100]
2.9–3.5oC
[2050] 1.0-1.5oC [2100]
3.0-3.3oC
Max. Monthly Rainfall
[2050] +113mm(12%)
[2050] +59mm (5.1%)
[2100] +111mm (9%)
[2050] +150mm (8%)
[2100] +282mm (32% )

19
NAHRIM’s study (2010) : “The Study of the Impact of Climate Change on Sea Level Rise on Malaysia Coastlines” Projections of SLR for 21st century (2010 to 2100) Data: tide gauge data (25 years); satellite altimetry data (17
years); and GCM Projections.
Linear Trend Analysis.
Assimilation of mean projection of SLR with: 49 simulations of 7 AOGCM models
at satellite altimetry locations along Malaysian coastlines
SEA LEVEL RISE (SLR) STUDY FOR MALAYSIA

SLR Projection for 2100
National Hydraulics Research Institute Of Malaysia (NAHRIM)
0.373 – Projections of SLR at 2100 (in meter)
Satellite altimetry locations
NAHRIM SLR Study (2010)

National Hydraulics Research Institute Of Malaysia (NAHRIM)
Malaysia Global
Tide gauge 0.2 – 4.4 (1984-2010) 1.2 – 2.2 *
Satellite Altimetry 2.73 – 7.0 (1993-2010) 3.2**
Sea Level Rise
Note
Projection 2100 (Peninsular Malaysia)
0.25m – 0.52m (2.5– 5.2 mm/yr)
Maximum SLR – Northeast and West coast of Peninsular Malaysia (Kelantan & Kedah)
Projection 2100 (Sabah & Sarawak)
0.43m – 1.06m (4.3 – 10.6 mm/yr)
1. Maximum SLR– North & East coast of Sabah.
2. Inundation at low lying area and rivermouth/estuaries in Southwest coast of Sarawak (Meradong, located between Batang Igan & Batang Rajang).
3. Inundation at low lying area and rivermouth/estuaries in East coast of Sabah (Tawau, Semporna, Lahad Datu, Sandakan & Kudat).
Projection on Sea Level Rise at 2100 for Malaysia
Observed SLR Rates (mm/year)
•IPCC (AR4, 2007) **IPCC (AR5, 2013)
NAHRIM SLR Study (2010)

22
Climate Change Impacts on
• Water Quantity
• Water Quality

23
Water excess (extreme rainfall, flows) • Increase in severity of floods • Increase in soil erosion -> scouring of drainage
structures and sedimentation in rivers Water shortage (drought) • Reduced inflows to reservoirs • Reduced stream-flows -> affect raw water
abstraction • Reduced recharge of groundwater
A. Change in Water Quantity/Discharge

24
Flooding condition in Johor River during January 2007
Condition before and after floods on Kota Tinggi Bridge in January 2007
Water excesses
Source: San, LY 2011
Flooding in Kajang (2 Dec 2011)

25
17 Oct 2012
Water shortages
8 Oct 2012
Selangor Times 12 Oct 2012
Photo: SAMB

26
12 Oct 2012
12 Oct 2012
B. Change in Water Quality
Water excess (extreme rainfall, flows) • Increase in pollution:
litters, nutrients and sediments
Water shortage (drought) • Concentrated pollutant
level in streams

river flow and groundwater recharge will decrease,
water quality decrease due to less dilution of
pollutants,
Higher concentration of pollutants in the water bodies
Impacts of Water Shortage on Water Quality

1. Increased water colour due to increased input of humic substances as
dissolved organic carbon (DOC) from the catchment.
2. Increased nutrients. Increased mineralisation and releases of nitrogen,
phosphorus and carbon from soil organic matter and increased run-off
and erosion will result in increased nutrient loads.
3. Reduced oxygen content. Increased biological respiration rates result
in lower dissolved oxygen concentrations, particularly during low-flow
periods and in the bottom layers of lakes. Higher temperature and
lower oxygen concentrations will cause stress and may reduce the
habitats in the lakes and rivers.
Impacts of Excessive Flowing Water on
Water Quality

29
macrophyte bloom algal bloom
Nutrient Concentration and Pollutant Loading
High temperature, Intense rainfall
Increase surface and sediment runoff
Tasik Metropolitan 2012 Tasik Chini 2012
Impact on Water Quality

30
• Desk-study in 2005, more than 60% of 90 lakes are experiencing eutrophication i.e. Sembrong Reservoir, Aman Lake, Chini Lake etc
National study on lake eutrophication
Sembrong reservoir, 2012 Chini Lake, 2005
Kenyir Lake, 2012

31
Impact on Coastal Resources
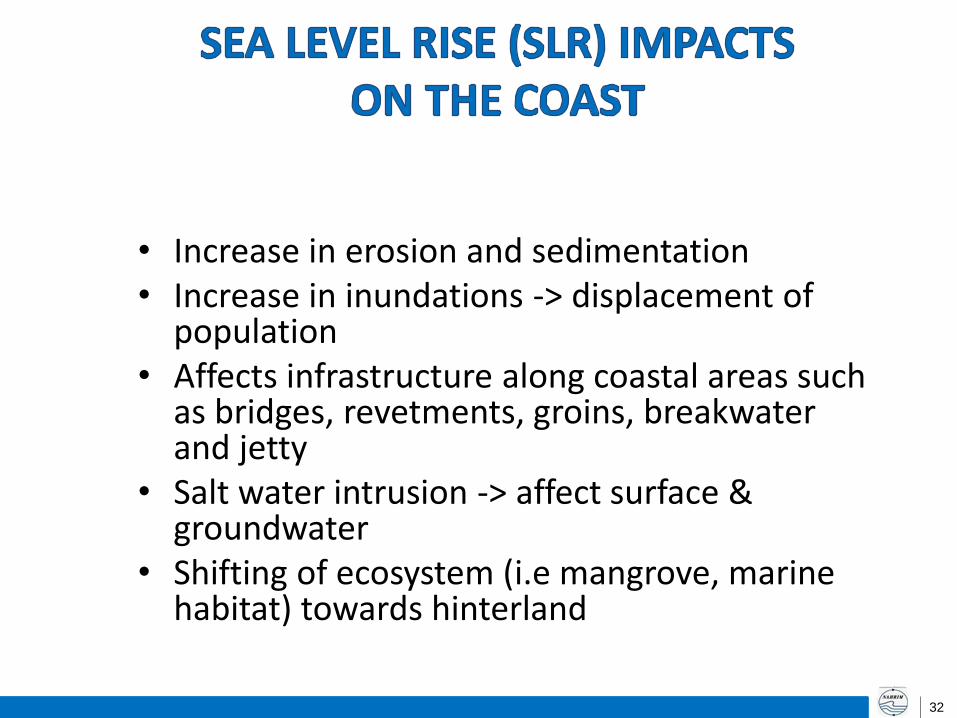
32
• Increase in erosion and sedimentation • Increase in inundations -> displacement of
population • Affects infrastructure along coastal areas such
as bridges, revetments, groins, breakwater and jetty
• Salt water intrusion -> affect surface & groundwater
• Shifting of ecosystem (i.e mangrove, marine habitat) towards hinterland

Case Study
Sandakan Town
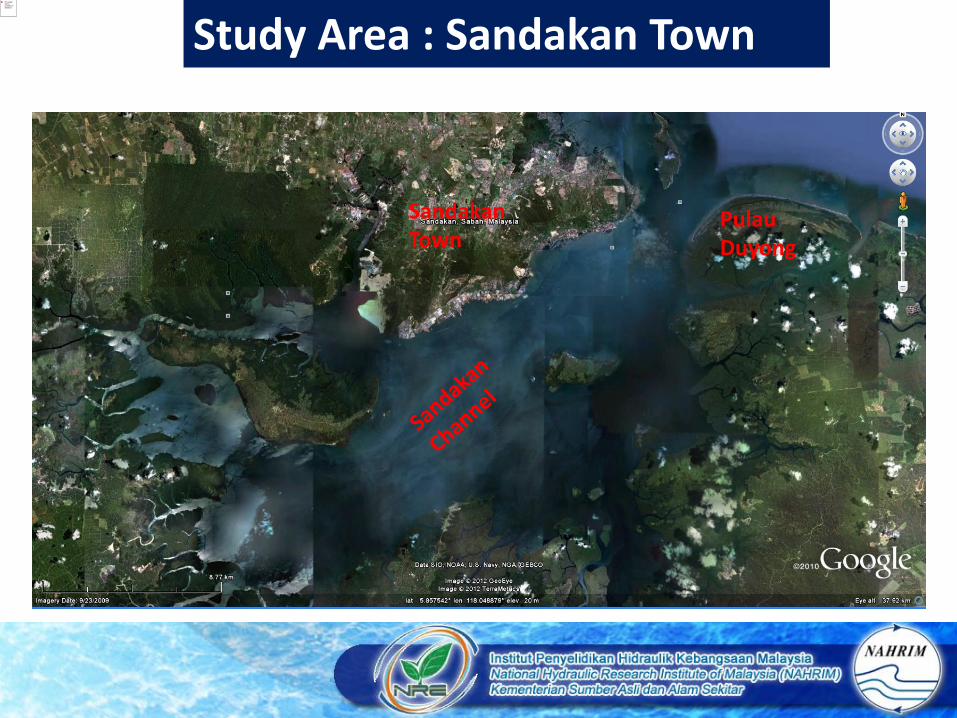
34
Study Area : Sandakan Town
Pulau Duyong
Sandakan Town

35
Findings on Hydraulic Analysis
• Increases in sea surface elevations along the waterfront;
• These will also increase the wave heights and current speeds along the shoreline;
• Pulau Duyong might experience a significant impact

36
Residual Projected Wave Height: Risk Maps
Residual 2020 Residual 2040
Residual 2060
• Exposed northern part of Pulau Duyong will have higher wave height, while southern sheltered part of Pulau Duyong will experience lesser wave height

37
Projected Current Speed : Risk Maps
• Changes of maximum current speed caused by tidal fluctuations in year 2020, 2040 and 2060
Baseline Projected 2020
Projected 2040
Projected 2060

38
Loading Jetty
Platform Elevation

39
Land Losses In Vegetation Areas

The Way Forward
• Continued R&D on hydroclimate projection, vulnerability assessment and innovative adaptation measures
• Mainstreaming climate change adaptation options into planning and development
• Public awareness on climate change impacts
40

41
Thank You for
Your Attention