image-based flight data acquisition
TRANSCRIPT

Mississippi State University Mississippi State University
Scholars Junction Scholars Junction
Theses and Dissertations Theses and Dissertations
5-4-2018
Image-based Flight Data Acquisition Image-based Flight Data Acquisition
Abby L. Bassie
Follow this and additional works at: https://scholarsjunction.msstate.edu/td
Recommended Citation Recommended Citation Bassie, Abby L., "Image-based Flight Data Acquisition" (2018). Theses and Dissertations. 2576. https://scholarsjunction.msstate.edu/td/2576
This Graduate Thesis - Open Access is brought to you for free and open access by the Theses and Dissertations at Scholars Junction. It has been accepted for inclusion in Theses and Dissertations by an authorized administrator of Scholars Junction. For more information, please contact [email protected].

Template C v3.0 (beta): Created by J. Nail 06/2015
TITLE PAGE
Image-based flight data acquisition
By
Abby L. Bassie
A Thesis
Submitted to the Faculty of
Mississippi State University
in Partial Fulfillment of the Requirements
for the Degree of Master of Science
in Electrical and Computer Engineering
in the Department of Electrical and Computer Engineering
Mississippi State, Mississippi
May 2018

COPYRIGHT PAGE
Copyright by
Abby L. Bassie
2018

APPROVAL PAGE
____________________________________
____________________________________
____________________________________
____________________________________
Image-based flight data acquisition
By
Abby L. Bassie
Approved:
Robert J. Moorhead
(Major Professor)
Filip Suminto D. To
(Committee Member)
James E. Fowler
(Graduate Coordinator / Committee Member)
Jason M. Keith
Dean
Bagley College of Engineering
ABSTRACT
Name: Abby L. Bassie
Date of Degree: May 4, 2018
Institution: Mississippi State University
Major Field: Electrical and Computer Engineering
Major Professor: Dr. Robert J. Moorhead
Title of Study: Image-based flight data acquisition
Pages in Study: 41
Candidate for Degree of Master of Science
Flight data recorders (FDRs) play a critical role in determining root causes of
aviation mishaps. Some aircraft record limited amounts of information during flight (e.g.
T-1A Jayhawk), while others have no FDR on board (B-52 Stratofortress). This study
explores the use of image-based flight data acquisition to overcome a lack of available
digitally-recorded FDR data. In this work, images of cockpit gauges were unwrapped
vertically, and 2-D cross-correlation was performed on each image of the unwrapped
gauge versus a template of the unwrapped gauge needle. Points of high correlation
between the unwrapped gauge and needle template were used to locate the gauge needle,
and interpolation and extrapolation were performed (based on locations of gauge tick
marks) to quantify the value to which the gauge needle pointed. Results suggest that
image-based flight data acquisition could provide key support to mishap investigations
when aircraft lack sufficient FDR data.
Key words: flight data recording, flight data acquisition, image processing,
2-D cross-correlation, normalized cross-correlation

DEDICATION
To my mom, Laura.
ii

ACKNOWLEDGEMENTS
I thank Mr. Dale Carter for lending his expertise, guidance, and support to this
project. I thank Mr. Jeff Barnette for all his work in acquiring resources needed to carry
out this research. I thank the United States Air Force (USAF) Safety Center for
providing funding for equipment used in this project. I thank Dr. Robert Moorhead for
advising me in matters big and small over the past two years.
My education was funded by the Science, Mathematics, and Research for
Transformation (SMART) program funded by the Department of Defense. The findings
and opinions in this thesis belong solely to the author, and are not necessarily those of the
sponsor. Permission to reproduce the MSU logo was given by Mississippi State
University.
I thank my committee for their comments on this thesis, and I thank Dr. Robert J.
Moorhead for directing this research.
iii
TABLE OF CONTENTS
DEDICATION.................................................................................................................... ii
ACKNOWLEDGEMENTS............................................................................................... iii
LIST OF TABLES............................................................................................................. vi
LIST OF FIGURES ............................................................................................................ 7
LIST OF SYMBOLS, ABBREVIATIONS, AND NOMENCLATURE .......................... ix
CHAPTER
I. INTRODUCTION.................................................................................................1
1.1 The Flight Data Recorder ..........................................................................1
1.2 Motivation for Research ............................................................................1
1.3 Selected Camera (SONY DSC-QX10)......................................................3
1.4 Image Processing Platform (MATLAB) ...................................................3
1.5 Camera Calibration....................................................................................3
1.5.1 Distortion Parameters ..........................................................................4
1.5.2 Intrinsic Parameters .............................................................................5
1.5.3 Extrinsic Parameters ............................................................................5
1.6 Cross-correlation .......................................................................................6
1.7 Normalized Cross-correlation ...................................................................7
1.8 Thesis Outline............................................................................................7
II. RELATED WORKS .............................................................................................8
2.1 Feature Tracking Approaches....................................................................8
2.1.1 Sequential Similarity Detection Algorithm .........................................8
2.1.2 Active Contour Models .......................................................................8
2.1.3 Convolutional Neural Networks..........................................................9
2.1.4 Normalized Cross-correlation ...........................................................10
2.2 Applications of Cross-correlation and NCC............................................10
2.3 Projects on Gauge Needle Detection .......................................................11
III. IMAGE-BASED FLIGHT DATA ACQUISITION METHODOLOGY ...........12
3.1 Camera Calibration..................................................................................12
iv
3.1.1 Distortion Parameters ........................................................................12
3.1.2 Intrinsic and Extrinsic parameters .....................................................14
3.2 Proof of Concept: Gauge Needle Identification .....................................17
3.2.1 Image Segmentation for Animation Gauges .....................................18
3.2.2 Discussion of Algorithm....................................................................20
3.2.3 Results ...............................................................................................21
3.3 Proof of Concept: Needle Identification with Reflection
Interference..............................................................................................26
3.3.1 Results ...............................................................................................27
3.4 Needle Identification Testing: T-1A Cockpit Imagery ..........................28
3.4.1 Image Segmentation for T-1A Cockpit .............................................28
3.4.2 Results ...............................................................................................30
IV. CONCLUSIONS AND FUTURE RESEARCH .................................................35
REFERENCES ................................................................................................................. 37
APPENDIX
A. INSTANTANEOUS GAUGE NEEDLE VALUES OBTAINED WITH
IMAGE-BASED FLIGHT DATA ACQUISITION AND
CORRESPONDING TRUTH DATA ............................................39
v
LIST OF TABLES
3.1 Average Percent Accuracy of Estimated Instantaneous Gauge Needle
Values over 400 Animation Frames ...............................................................22
3.2 Object Detection When Target Is Partially Occluded (normxcorr
Algorithm) ......................................................................................................24
3.3 Average Percent Accuracy of Estimated Instantaneous Gauge Needle
Values over 400 Animation Frames with Reflections Present .......................28
A.1 Experimental Instantaneous Gauge Needle Values (Xcorr Algorithm)
and Corresponding Truth Data for Animation Frames 1-20 (No
Reflections Simulated on Cockpit Gauges)....................................................40
A.2 Experimental Instantaneous Gauge Needle Values (Normxcorr
Algorithm) and Corresponding Truth Data for Animation Frames
265-285 (With Reflections Simulated on Cockpit Gauges) ...........................41
vi
LIST OF FIGURES
1.1 Image of a flight data recorder (FDR) [1] ........................................................1
1.2 a) Barrel distortion and b) pincushion distortion with distortion of
planar points shown as dotted lines [6] ............................................................5
3.1 Image of measurement device passing through center of image; note
that the cm baseline of the ruler passes through the top right and
bottom left edges of the field of view.............................................................13
3.2 Uniform width blocks marched across image of ruler; note that center
tick marks of each block are all in approximately the same lateral
position (minimal distortion)..........................................................................14
3.3 Focal length vs. pixels per radian and quadratic fit for SONY QX10 ...........15
3.4 Image of mock gauge with perspective distortion highlighted by
relationship between a) 9 and 27 ticks (red) and b) 0 and 18 ticks
(blue)...............................................................................................................16
3.5 Orthogonalized image of mock gauge............................................................17
3.6 Animation frame used in proof of concept for the viability of image-
based flight data acquisition ...........................................................................18
3.7 Template (knob with arrow surrounded by blue box) identified using
NCC................................................................................................................19
3.8 Segmented animation gauges .........................................................................19
3.9 Fuel flow gauge (left) and cropped portion of needle (right); point on
gauge of highest correlation to template shown with red crosshairs..............21
3.10 Animation frames 266-269 with partial occlusion of the AL needle of
the FUEL gauge that caused non-normalized cross-correlation
algorithm (xcorr) to fail ..................................................................................23
7
3.11 xcorr algorithm (left) fails to distinguish between AL and FR needles
within the unwrapped FUEL gauge for frame 267 (signified by two
regions of peak correlation scores corresponding to pixels on the FR
needle), while normxcorr algorithm (right) has one high correlation
response corresponding to the top of the AL needle. .....................................25
3.12 T-1A cockpit gauge with reflective noise ......................................................26
3.13 Animation frame from dataset with simulated reflective noise added ...........27
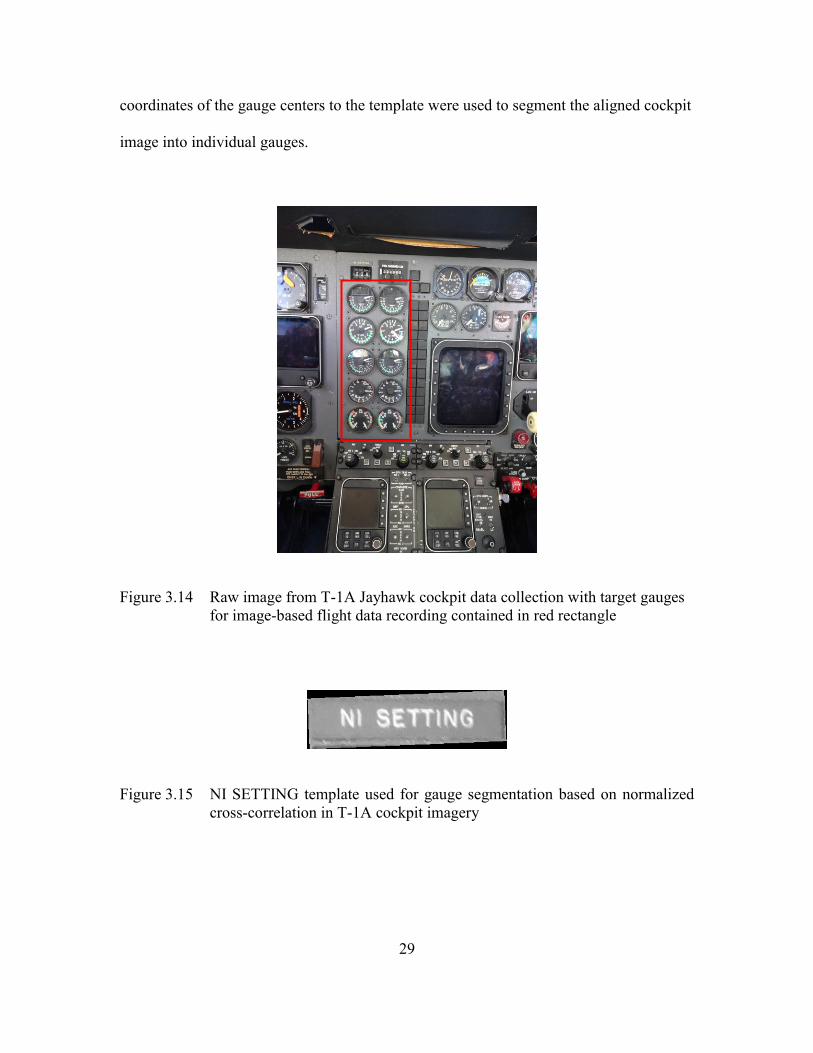
3.14 Raw image from T-1A Jayhawk cockpit data collection with target
gauges for image-based flight data recording contained in red
rectangle .........................................................................................................29
3.15 NI SETTING template used for gauge segmentation based on
normalized cross-correlation in T-1A cockpit imagery..................................29
3.16 Cockpit images were aligned so that the vertical bank of black buttons
shown in the blue rectangle were perfectly vertical on the left side.
Once alignment of cockpit imagery was complete, images were
searched for the template in Figure 3.15 ........................................................30
3.17 Identification of fan speed and ITT gauge needles for engines 1 and 2
of the T-1A Jayhawk with normxcorr algorithm............................................31
3.18 Identification of turbine speed and oil temperature gauge needles for
engines 1 and 2 of the T-1A Jayhawk with normxcorr algorithm..................32
3.19 Identification of fuel flow and oil pressure gauge needles for engines
1 and 2 of the T-1A Jayhawk with normxcorr algorithm...............................33
3.20 Successful identification of needle template in the presence of
reflective noise on the glass surface of the gauge using normxcorr
algorithm.........................................................................................................34
8
LIST OF SYMBOLS, ABBREVIATIONS, AND NOMENCLATURE
FDR flight data recorder
MAAF Mishap Analysis & Animation Facility
USAF United States Air Force
SIB Safety Investigation Board
QX10 abbreviation for SONY DSC-QX10
mm millimeters
EXIF Exchangeable Image File Format
NCC normalized cross-correlation
GDS gradient descent search
SSDA sequential similarity detection algorithm
ACM active contour model
CNN convolutional neural network
GPU graphics processing unit
RPM rotations (or revolutions) per minute
N1 low pressure rotor speed
N2 high pressure rotor speed
FTIT fan turbine inlet temperature
NOZ POS exhaust nozzle position
AL aft/left fuel quantity
FR forward/right fuel quantity
ix

XCORR non-normalized cross-correlation
NORMXCORR normalized cross-correlation
x
CHAPTER I
INTRODUCTION
1.1 The Flight Data Recorder
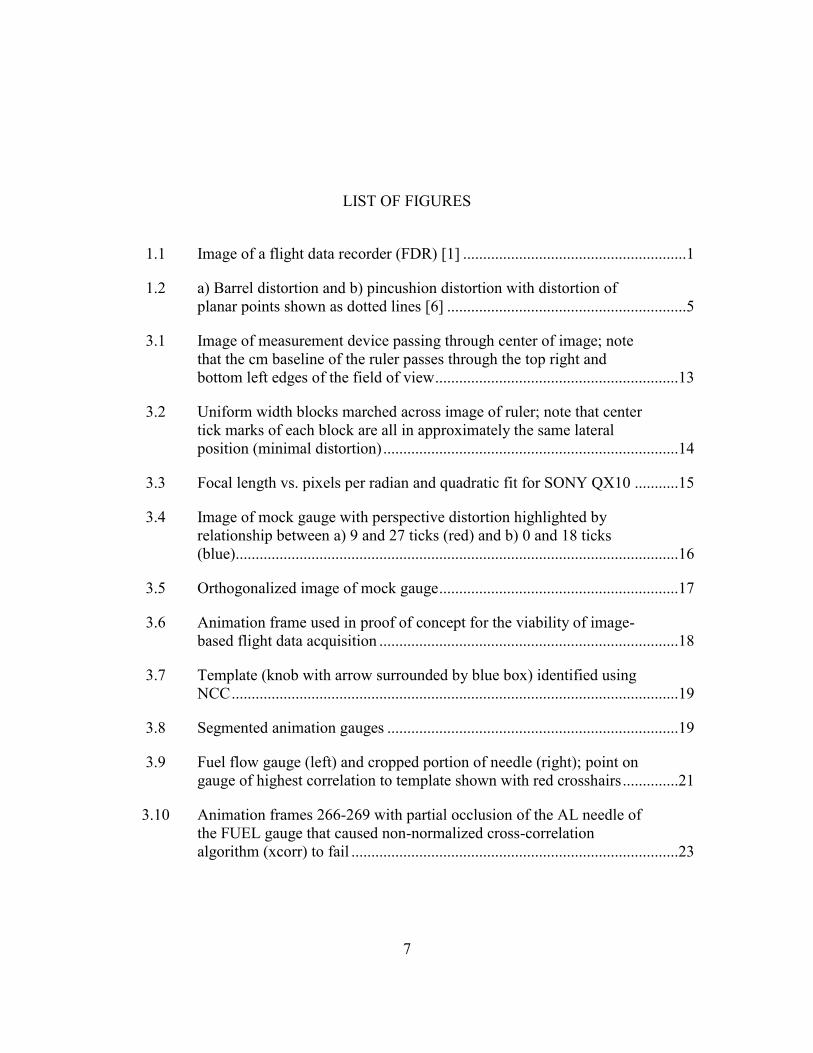
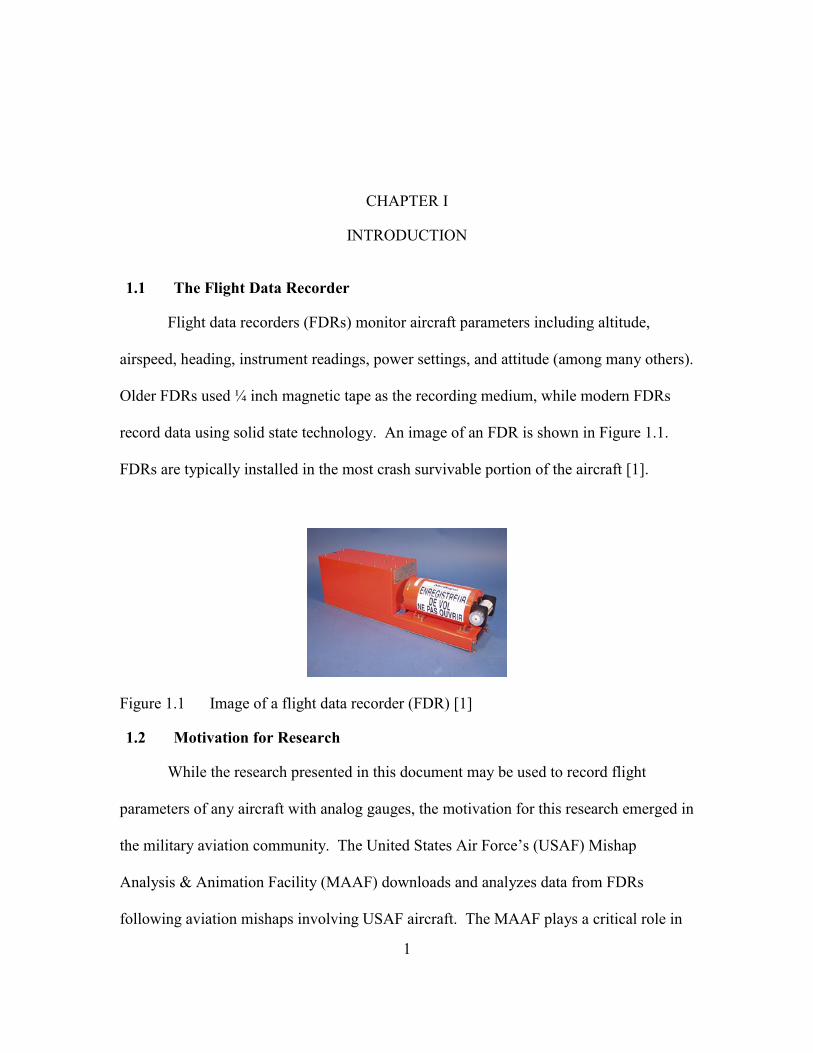
Flight data recorders (FDRs) monitor aircraft parameters including altitude,
airspeed, heading, instrument readings, power settings, and attitude (among many others).
Older FDRs used ¼ inch magnetic tape as the recording medium, while modern FDRs
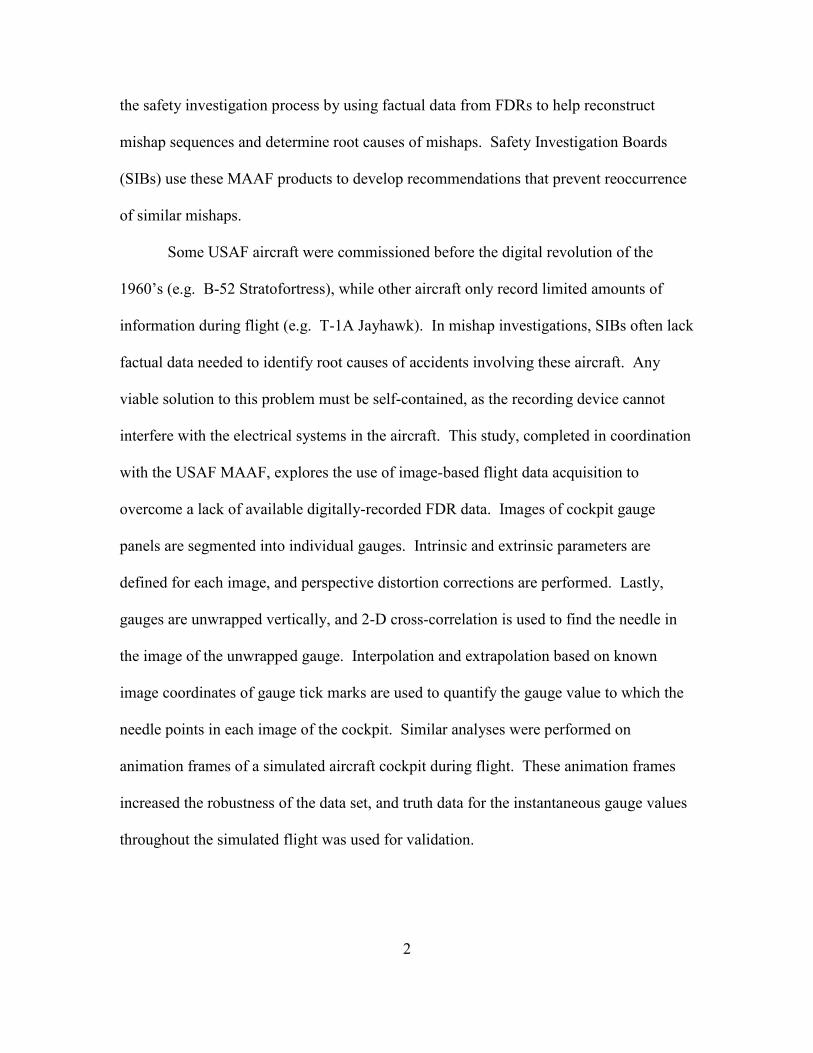
record data using solid state technology. An image of an FDR is shown in Figure 1.1.
FDRs are typically installed in the most crash survivable portion of the aircraft [1].
Figure 1.1 Image of a flight data recorder (FDR) [1]
1.2 Motivation for Research
While the research presented in this document may be used to record flight
parameters of any aircraft with analog gauges, the motivation for this research emerged in
the military aviation community. The United States Air Force’s (USAF) Mishap
Analysis & Animation Facility (MAAF) downloads and analyzes data from FDRs
following aviation mishaps involving USAF aircraft. The MAAF plays a critical role in
1
the safety investigation process by using factual data from FDRs to help reconstruct
mishap sequences and determine root causes of mishaps. Safety Investigation Boards
(SIBs) use these MAAF products to develop recommendations that prevent reoccurrence
of similar mishaps.
Some USAF aircraft were commissioned before the digital revolution of the
1960’s (e.g. B-52 Stratofortress), while other aircraft only record limited amounts of
information during flight (e.g. T-1A Jayhawk). In mishap investigations, SIBs often lack
factual data needed to identify root causes of accidents involving these aircraft. Any
viable solution to this problem must be self-contained, as the recording device cannot
interfere with the electrical systems in the aircraft. This study, completed in coordination
with the USAF MAAF, explores the use of image-based flight data acquisition to
overcome a lack of available digitally-recorded FDR data. Images of cockpit gauge
panels are segmented into individual gauges. Intrinsic and extrinsic parameters are
defined for each image, and perspective distortion corrections are performed. Lastly,
gauges are unwrapped vertically, and 2-D cross-correlation is used to find the needle in
the image of the unwrapped gauge. Interpolation and extrapolation based on known
image coordinates of gauge tick marks are used to quantify the gauge value to which the
needle points in each image of the cockpit. Similar analyses were performed on
animation frames of a simulated aircraft cockpit during flight. These animation frames
increased the robustness of the data set, and truth data for the instantaneous gauge values
throughout the simulated flight was used for validation.
2
1.3 Selected Camera (SONY DSC-QX10)
The SONY DSC-QX10 (QX10) is a lens-style camera that boasts light weight
(3.7 oz.), small size (2.46 x 2.19 x 2.46 in.), and a high-quality CMOS imaging sensor.
The QX10 can be operated directly using buttons on the camera, or the camera’s aperture,
exposure, zoom, and focus can be controlled remotely via Wi-Fi. The camera has a built-
in Whitworth 1/4”-20 thread and can be attached to a wide variety of mounting devices.
These attributes make the QX10 an ideal imaging platform for this application, as the
chosen camera should be small and lightweight, and it should not interfere in any way
with operator performance in the aircraft [2].
1.4 Image Processing Platform (MATLAB)
MATLAB (MATrix LABoratory) is a high-performance matrix-based
computation environment. MATLAB is often used in university settings as a standard
instructional tool for courses in mathematics, engineering, and science. In industry,
MATLAB is used for high-productivity research, development, and analysis.
MATLAB’s high-level commands for 2-D data visualization, interactive graphics
interfaces, and robust image processing toolbox make it an excellent platform for image
processing applications [3].
1.5 Camera Calibration
Camera calibration is critical to any imaging task that aims to extract geometric
information from a scene. The overall goal of camera calibration is to define a
relationship between true points and observed image points. This process involves
defining distortion parameters (pincushion, barrel distortion), intrinsic parameters (focal
3
length, location of image center), and extrinsic parameters (camera position and
orientation) [4].
1.5.1 Distortion Parameters
According to [5], the perspective projection of a straight line in a 3-D scene is a
straight line in the 2-D image domain. Therefore, for a given line that is straight in the 3-
D scene, any curvature of that line present in the image is due to lens distortion [4]. In a
distortion-free camera model, image plane coordinates of points can be defined based on
the camera orientation and position and the principal point of the image plane
(intersection of the optical axis and the image plane). If distortion is present due to
imperfections or intentional alterations in design or the assembly of lenses in the camera
optical system, then the image plane coordinates defined for a distortion-free camera
model do not hold true, and positional error must be accounted for [6]. For this reason, it
is important to study camera optics and to characterize image distortion introduced by the
camera.
Because this research aims to analyze planar objects in an image, lines in 3-D
space must be maintained as straight lines in the 2-D image space. Radial distortion
causes an inward or outward displacement of planar image points from their ideal
locations. This distortion is typically caused by radial curvature of lens elements.
Negative radial displacement of planar image points is known as barrel distortion. In this
type of distortion, planar points near the edge of the field of view become crowded.
Positive radial distortion, on the other hand, is known as pincushion distortion. This type
of distortion causes planar points at the edges of the field of view to spread apart. Both
barrel distortion and pincushion distortion are radially symmetric about the optical axis
4
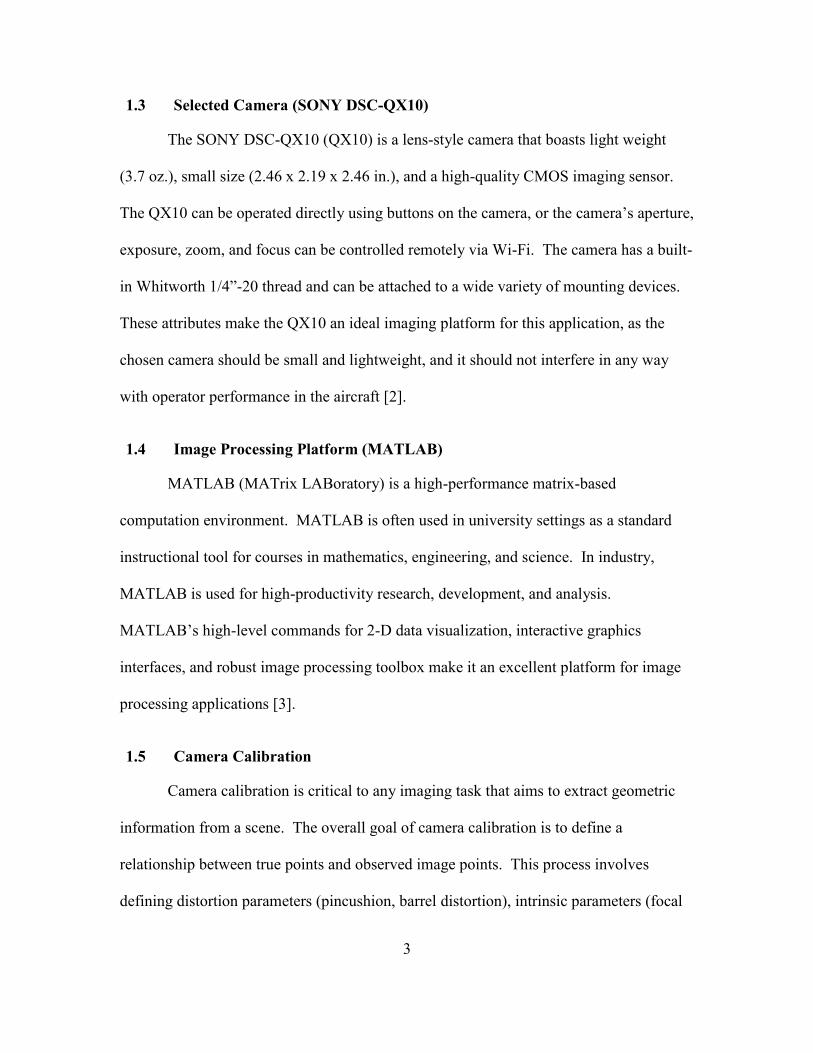
and cause degradation of the linear relationship between planar points in an image [6].
Barrel and pincushion distortion are shown in Figure 1.2.
Figure 1.2 a) Barrel distortion and b) pincushion distortion with distortion of planar
points shown as dotted lines [6]
1.5.2 Intrinsic Parameters
In the simplest case, focal length is defined as the distance light travels between
the camera lens and the image sensor when the subject is in focus. As focal length
decreases, the angle of view increases, and a greater area is captured in the image [7].
Focal length is typically specified in terms of mm. Many intrinsic parameters of .jpg and
.tif images can be obtained by viewing image EXIF data. Image centers can also easily
be located with the aid of software.
1.5.3 Extrinsic Parameters
In this project, images of cockpit gauges will almost always be shot from a
position in which the gauges are not orthogonally presented to the camera. Defining
extrinsic parameters (camera position and orientation) is a critical step in removing
perspective distortion so that cockpit gauges appear as though they were orthogonal to
the camera lens at the time the photo of the gauges was taken.
5
1.6 Cross-correlation
Cross-correlation is a well-known technique for detecting and tracking features in
imagery. According to the reference paper for the MATLAB cross-correlation algorithm
[8], cross-correlation for template matching is derived by squared Euclidian distance
measurement:
2𝑑2
𝑓,𝑡 (𝑢, 𝑣) = ∑𝑥,𝑦[𝑓(𝑥, 𝑦) − 𝑡(𝑥 − 𝑢, 𝑦 − 𝑣)] (1.1)
Equation 1.1 can be expanded to the form given in Equation 1.2 [8].
𝑑2𝑓,𝑡 (𝑢, 𝑣) = ∑ [𝑓2(𝑥, 𝑦) − 2𝑓(𝑥, 𝑦)𝑡(𝑥 − 𝑢, 𝑦 − 𝑣) + 𝑡2(𝑥 − 𝑢, 𝑦 − 𝑣)] (1.2)𝑥,𝑦
The terms ∑ 𝑡2(𝑥 − 𝑢, 𝑦 − 𝑣) and ∑ 𝑓2(𝑥, 𝑦) are constants for a given (𝑢, 𝑣), so the
remaining cross-correlation term is [8]:
𝑐(𝑢, 𝑣) = ∑𝑥,𝑦 𝑓(𝑥, 𝑦)𝑡(𝑥 − 𝑢, 𝑦 − 𝑣) (1.3)
Equation 1.3 provides a measure of similarity between the image f and the feature t
positioned at (𝑢, 𝑣). When searching grayscale images for bright templates against a dark
background, using the cross-correlation function in Equation 1.3 for template matching
has several disadvantages [8]:
• If image energy ∑ 𝑓2(𝑥, 𝑦) varies with position, cross-correlation can fail
to identify the template. This can be noted in images with bright spots. In
these images, the bright spot could have a higher correlation score than the
region in the image in which an exact template match occurred.
• The range of correlation scores c(u,v) is dependent on the size of the
template.
• The 2-D cross-correlation function is sensitive to changes in lighting
conditions in imagery.
To overcome these disadvantages, normalized cross-correlation can be implemented.
6
1.7 Normalized Cross-correlation
Normalized cross-correlation (NCC) overcomes the disadvantages of using cross-
correlation for template matching mentioned in section 1.7 by normalizing the image and
the feature vectors to unit length. Equation 1.4 shows the mathematical description of
NCC [8]:
∑𝑥,𝑦[𝑓(𝑥,𝑦)−𝑓�̅� ,𝑣][𝑡(𝑥−𝑢,𝑦−𝑣)−�̅�]𝑛𝑜𝑟𝑚_𝑐(𝑢, 𝑣) = 0.5 (1.4)
{∑𝑥,𝑦[𝑓(𝑥,𝑦)−𝑓�̅� ,𝑣]2 ∑𝑥,𝑦[𝑡(𝑥−𝑢,𝑦−𝑣)−�̅�]2}
where 𝑡̅ is the mean of the template, and 𝑓�̅� ,𝑣 is the mean of image f(x,y) in the region
under the template. In NCC, transform coefficients are normalized to unit magnitude
prior to correlation computation in the frequency domain. This renders NCC invariant to
changes in image intensity. It should be noted that both cross-correlation and NCC are
sensitive to changes in imaging scale, rotation, and perspective distortion [8].
1.8 Thesis Outline
In this chapter of the thesis, all necessary background information needed to
understand the research reported in this thesis document is discussed. In the second
chapter, feature tracking approaches and their drawbacks and advantages are discussed.
Other works implementing cross-correlation and normalized cross-correlation are
discussed. Lastly, other projects aiming to locate needles in circular gauges are surveyed.
In chapter 3, research on the viability of image-based flight data acquisition for USAF
aircraft is presented. Chapter four summarizes significant findings from the research and
discusses areas where future research in image-based flight data acquisition may be
conducted.
7
CHAPTER II
RELATED WORKS
2.1 Feature Tracking Approaches
2.1.1 Sequential Similarity Detection Algorithm
The sequential similarity detection algorithm (SSDA) uses full precision only
when the cross-correlation function is near its maximum. Otherwise, SSDA saves
correlation scores at reduced precision. While this algorithm provides significant
speedup compared to spatial domain cross-correlation, this algorithm is not guaranteed to
identify the max of the correlation surface. This algorithm performs well in situations
where the correlation has broad maxima and small slopes. These conditions are typically
not satisfied in images containing a variety of objects, as multiple textures can create
multiple narrow extrema in the correlation surface and cause the SSDA algorithm to fail.
This algorithm also has parameters that need to be pre-determined by the user, while
cross-correlation does not require input parameters [8].
2.1.2 Active Contour Models
Active contour models (ACMs) are used to track objects that deform over time by
providing a representation of the deformed object’s contour over time. While ACMs can
be used to track targets with clearly-defined boundaries, this technique cannot track
objects that do not have a well-defined contour. In imagery, objects that do not have
clearly-defined boundaries due to image blur or poor lighting conditions are not trackable
8

via ACMs; however, if the objects have characteristic color patterns, the objects will be
trackable via cross-correlation. Cross-correlation, like ACMs, can be used to track a
feature that moves a significant portion of its size across image frames, but high amounts
of translation can cause ACMs to fail [8].
2.1.3 Convolutional Neural Networks
Convolutional neural networks (CNNs) are quickly becoming one of the most
widely used technologies for object detection in imagery. Because CNNs can share
weights all over the input layer, these architectures are efficient and powerful for object
detection in large data sets. In many applications, researchers implement a CNN for
object detection and use a softmax layer with full connections to all activation units in the
previous layer for object classification [9]. Still, CNNs require many training parameters
and need a large, robust data set for training, and there is no guarantee that the global
minimum error solution will be obtained with a neural network [10]. The gradient
descent search method of learning used by CNNs works well for detection of feature
translation between adjacent image frames if the translation of the feature is assumed
smaller than the radius of the basin surrounding the minimum of the matching error
surface; however, if any unintentional roll of the camera occurs, the translation of the
feature can become large, rendering this method invalid [8]. Furthermore, small features
(like a gauge needle) yield matching error surfaces with narrow extrema and constrain the
amount of interframe translation that can be tracked with gradient descent searches.
CNN training is also computationally intensive and may require several graphics
processing units (GPUs) to be computationally viable [11].
9
2.1.4 Normalized Cross-correlation
The NCC algorithm is popular in feature detection and tracking because the
algorithm places few requirements on imagery, and no parameters need to be pre-defined
by the user [8]. NCC can be coupled with box filtering or integral image techniques to
further reduce redundant computations [12]. Still, NCC has weaknesses including
sensitivity to template scale, rotation, and perspective distortion [8]. These weaknesses
can be overcome for image-based flight data acquisition by orthogonalizing images of the
cockpit gauge panel so that the gauge panel appears normal to the camera. Then, cockpit
gauges can be transformed into an unwrapped frame of reference where only gauge
needle translation occurs as the needle changes value throughout flight. This introduces
rotation invariance into images of cockpit gauge images, rendering cross-correlation a
suitable algorithm for the problem.
2.2 Applications of Cross-correlation and NCC
Cross-correlation (and more specifically, NCC) is one of the most important
technologies for real-time object tracking in the field of image processing. In [12],
researchers found that NCC can be used to track low-dynamic objects (walking cows and
humans), medium-dynamic objects (helicopters), and high-dynamic objects (jet aircraft)
in video sequences with high contrast and a low signal-to-noise ratio. In [13], researchers
found that by setting an upper bound for correlation coefficients and calculating the
bound prior to the evaluation of correlation coefficients, NCC execution time can be
improved by a factor of 3.
In [14], researchers identified a weakness of NCC that applies directly to the work
presented in this thesis document. The authors of the paper state that NCC cannot
10

identify a target that is obscured by other objects or masked by terrain conditions. This
scenario can occur in cockpit imagery when glare obscures a portion or the entirety of the
gauge needle (target). The authors recognized that when the correlation score for a given
image was greater than or equal to 0.8, NCC successfully recognized moving targets
from IR video [14]. Identifying a correlation score threshold for true template detection
is critical for identifying false alarms from image artifacts like reflection from a glass
surface.
2.3 Projects on Gauge Needle Detection
In a MATLAB project aiming to identify a needle in a circular gauge, 2-D
convolution of an image of the gauge and an image of a number printed on the gauge was
used to identify a reference point to which relative coordinates to the center of the
circular gauge were known. From the center of the convolution, the center of rotation of
the needle is found by adding a fixed offset. 1-D convolution on a ring of pixels at a
given radius from the center of rotation was used to find the angle to which the needle
pointed with respect to the origin (center of the gauge) [15]. The gauge value to which
the needle pointed was not quantified.
This approach is problematic because a radial search area width of 1 pixel will not
perform well in a real cockpit environment. If reflective interference is present on the
glass surface of the gauge, the reflections could yield image intensities similar to the
intensity of the target needle. In this case, this technique could not be used to distinguish
between the gauge needle and interference.
11
CHAPTER III
IMAGE-BASED FLIGHT DATA ACQUISITION
METHODOLOGY
3.1 Camera Calibration
3.1.1 Distortion Parameters
As previously stated in Chapter 1, the perspective projection of a straight line in a
3-D scene is a straight line in the 2-D image domain. Therefore, for a given line that is
straight in the 3-D scene, any curvature of that line present in the 2-D image is due to lens
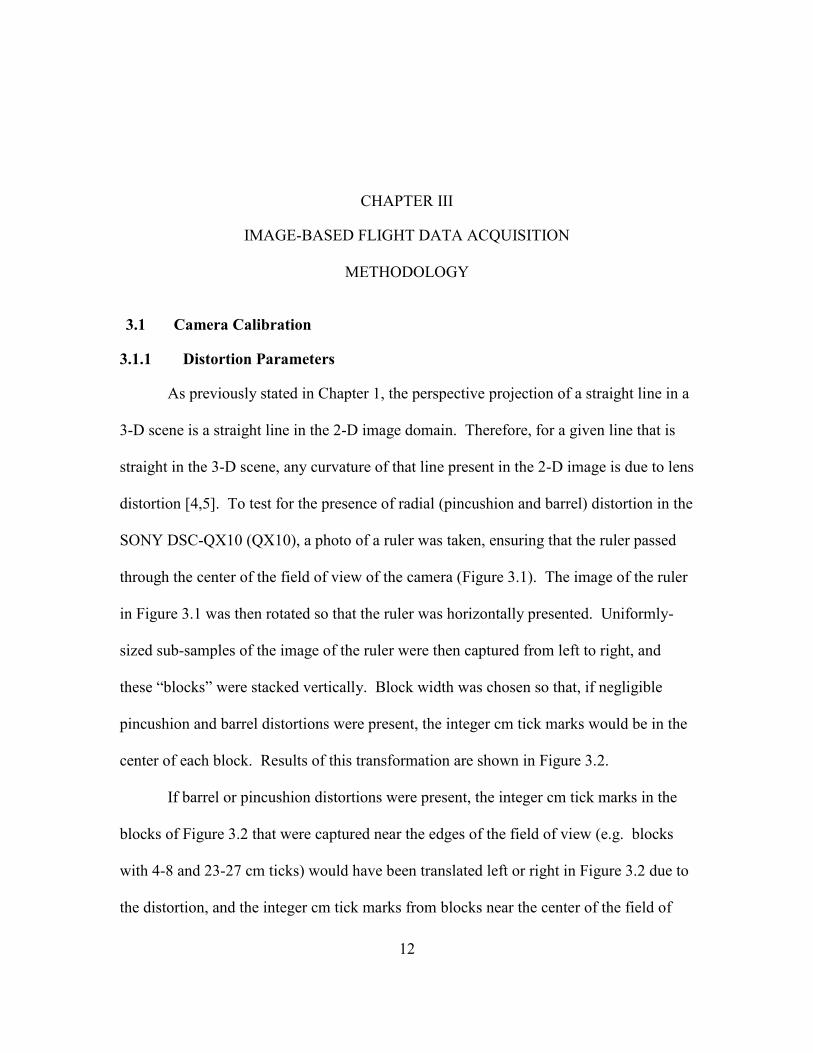
distortion [4,5]. To test for the presence of radial (pincushion and barrel) distortion in the
SONY DSC-QX10 (QX10), a photo of a ruler was taken, ensuring that the ruler passed
through the center of the field of view of the camera (Figure 3.1). The image of the ruler
in Figure 3.1 was then rotated so that the ruler was horizontally presented. Uniformly-
sized sub-samples of the image of the ruler were then captured from left to right, and
these “blocks” were stacked vertically. Block width was chosen so that, if negligible
pincushion and barrel distortions were present, the integer cm tick marks would be in the
center of each block. Results of this transformation are shown in Figure 3.2.
If barrel or pincushion distortions were present, the integer cm tick marks in the
blocks of Figure 3.2 that were captured near the edges of the field of view (e.g. blocks
with 4-8 and 23-27 cm ticks) would have been translated left or right in Figure 3.2 due to
the distortion, and the integer cm tick marks from blocks near the center of the field of
12
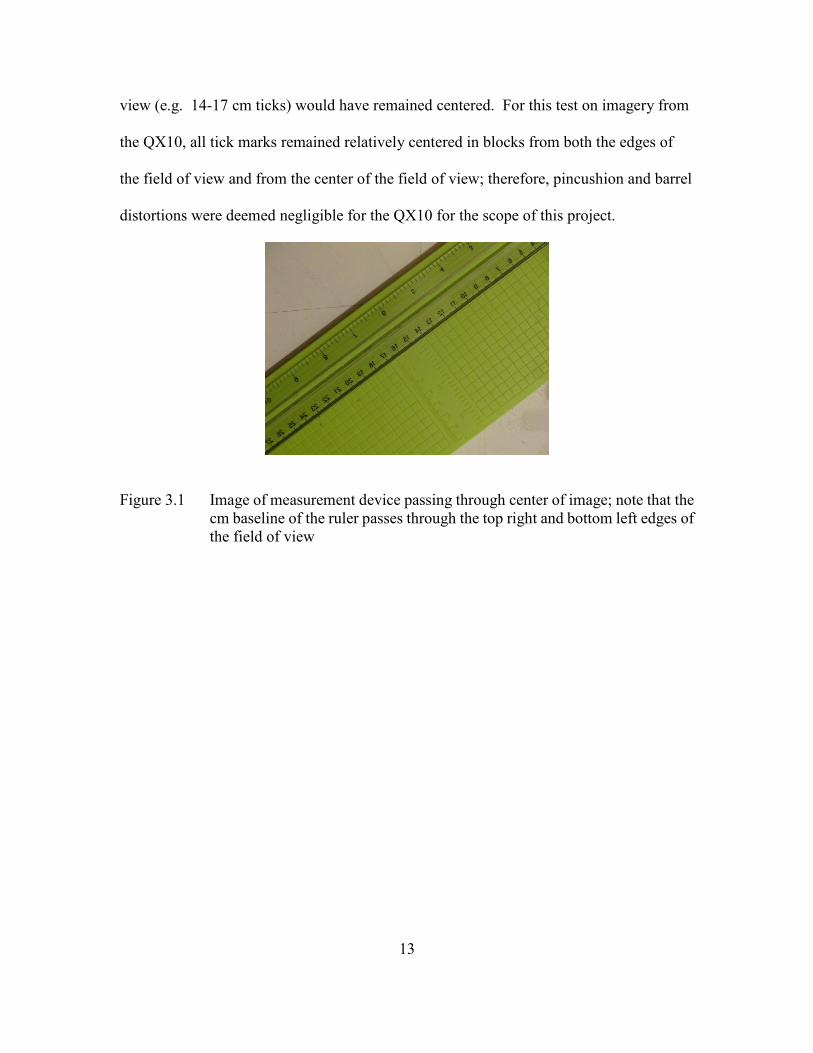
view (e.g. 14-17 cm ticks) would have remained centered. For this test on imagery from
the QX10, all tick marks remained relatively centered in blocks from both the edges of
the field of view and from the center of the field of view; therefore, pincushion and barrel
distortions were deemed negligible for the QX10 for the scope of this project.
Figure 3.1 Image of measurement device passing through center of image; note that the
cm baseline of the ruler passes through the top right and bottom left edges of
the field of view
13
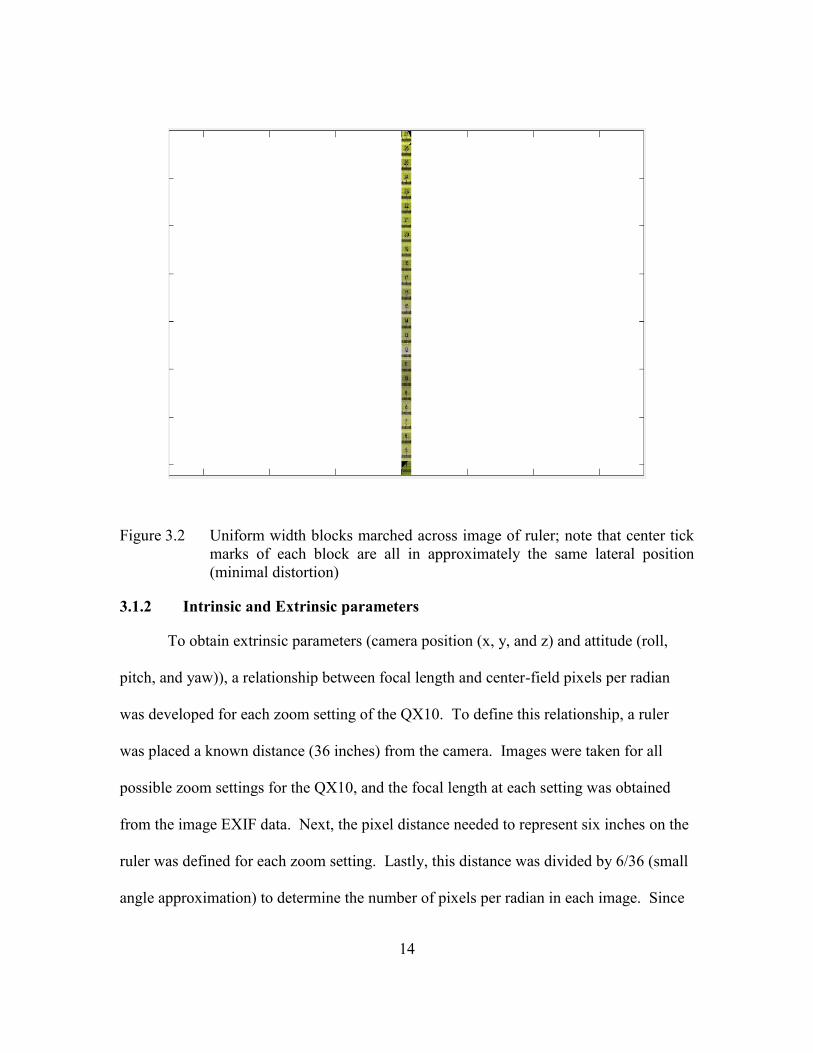
Figure 3.2 Uniform width blocks marched across image of ruler; note that center tick
marks of each block are all in approximately the same lateral position
(minimal distortion)
3.1.2 Intrinsic and Extrinsic parameters
To obtain extrinsic parameters (camera position (x, y, and z) and attitude (roll,
pitch, and yaw)), a relationship between focal length and center-field pixels per radian
was developed for each zoom setting of the QX10. To define this relationship, a ruler
was placed a known distance (36 inches) from the camera. Images were taken for all
possible zoom settings for the QX10, and the focal length at each setting was obtained
from the image EXIF data. Next, the pixel distance needed to represent six inches on the
ruler was defined for each zoom setting. Lastly, this distance was divided by 6/36 (small
angle approximation) to determine the number of pixels per radian in each image. Since
14
the QX10 does not have geometrically perfect optics, the mathematics relating
pixels/radian to focal length deviates slightly from the purely linear equation used to
relate the two quantities in a pinhole camera. To account for the geometric imperfections
present in the QX10 lens, a quadratic fit was used to develop an equation relating focal
length to pixels per radian for the QX10 (see Figure 3.3).
Figure 3.3 Focal length vs. pixels per radian and quadratic fit for SONY QX10
To obtain camera position (x, y, and z) and attitude (roll, pitch, and yaw), a script
written by Dale Carter of the MAAF was adapted for an image of a mock gauge (see
Figure 3.4). This script uses Jacobian iteration to model camera position and attitude
based on the location of three defined reference points (outsides of the 0, 18, and 27 tick
marks for the mock gauge) in the image. The script iteratively compares the error
between the location of the reference points in the camera model (based on a guess of
15
camera attitude and position) and the image. Small adjustments to the modeled camera
position and attitude are made until the error between the locations of the modeled
reference points and the reference points in the original image is 1x10 -7 inches.
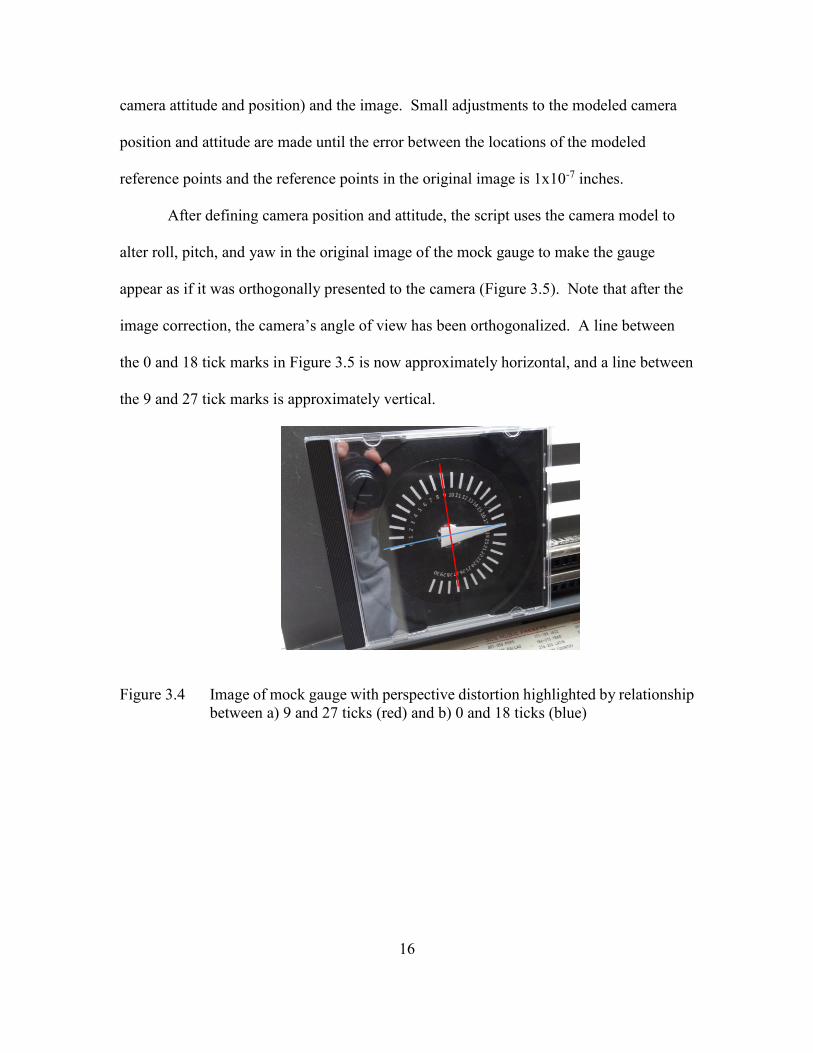
After defining camera position and attitude, the script uses the camera model to
alter roll, pitch, and yaw in the original image of the mock gauge to make the gauge
appear as if it was orthogonally presented to the camera (Figure 3.5). Note that after the
image correction, the camera’s angle of view has been orthogonalized. A line between
the 0 and 18 tick marks in Figure 3.5 is now approximately horizontal, and a line between
the 9 and 27 tick marks is approximately vertical.
Figure 3.4 Image of mock gauge with perspective distortion highlighted by relationship
between a) 9 and 27 ticks (red) and b) 0 and 18 ticks (blue)
16
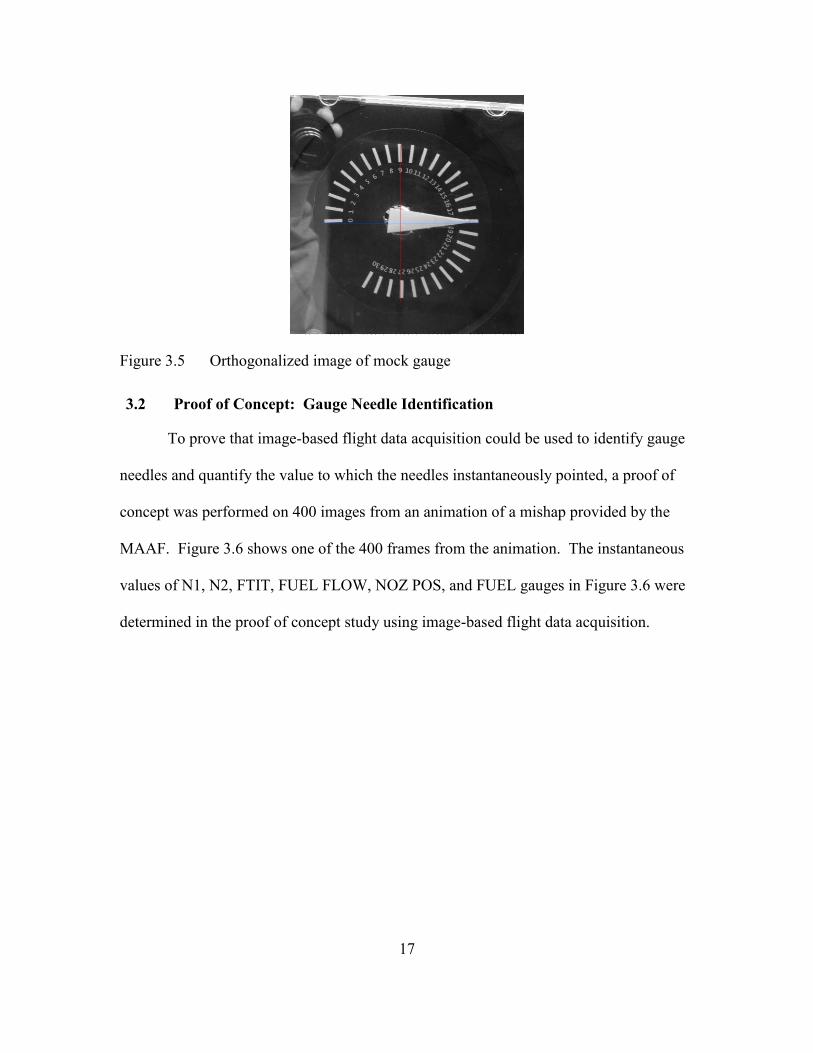
Figure 3.5 Orthogonalized image of mock gauge
3.2 Proof of Concept: Gauge Needle Identification
To prove that image-based flight data acquisition could be used to identify gauge
needles and quantify the value to which the needles instantaneously pointed, a proof of
concept was performed on 400 images from an animation of a mishap provided by the
MAAF. Figure 3.6 shows one of the 400 frames from the animation. The instantaneous
values of N1, N2, FTIT, FUEL FLOW, NOZ POS, and FUEL gauges in Figure 3.6 were
determined in the proof of concept study using image-based flight data acquisition.
17
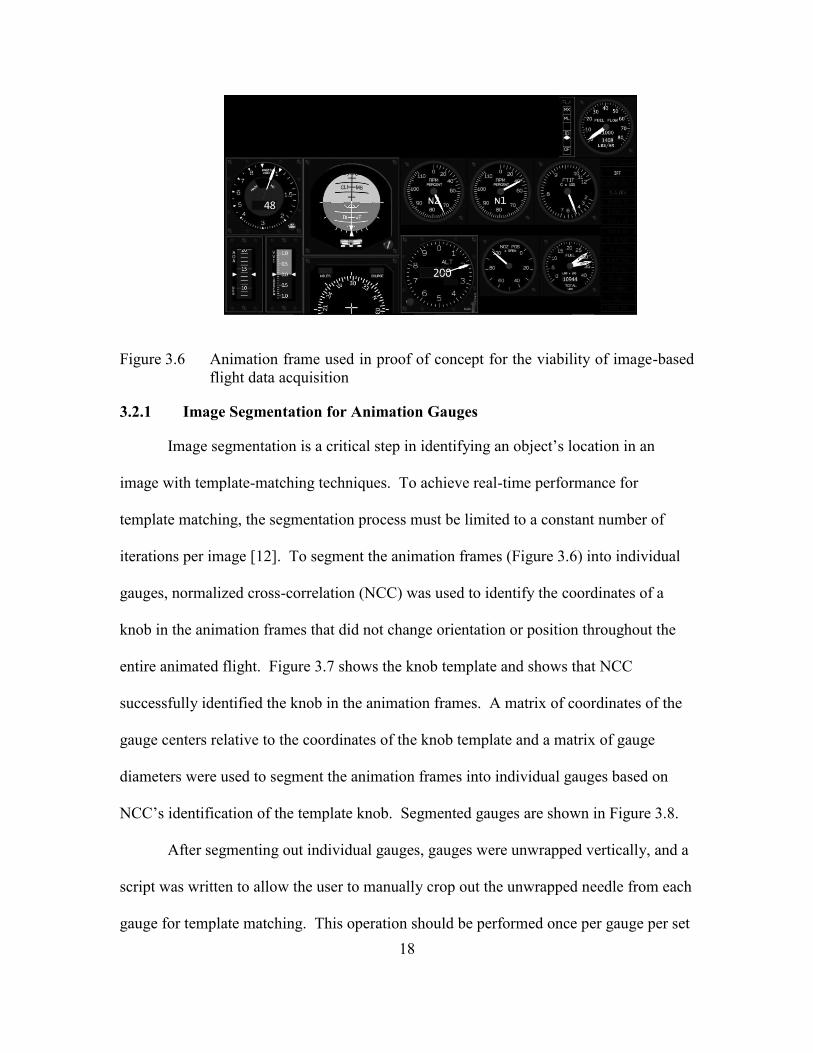
Figure 3.6 Animation frame used in proof of concept for the viability of image-based
flight data acquisition
3.2.1 Image Segmentation for Animation Gauges
Image segmentation is a critical step in identifying an object’s location in an
image with template-matching techniques. To achieve real-time performance for
template matching, the segmentation process must be limited to a constant number of
iterations per image [12]. To segment the animation frames (Figure 3.6) into individual
gauges, normalized cross-correlation (NCC) was used to identify the coordinates of a
knob in the animation frames that did not change orientation or position throughout the
entire animated flight. Figure 3.7 shows the knob template and shows that NCC
successfully identified the knob in the animation frames. A matrix of coordinates of the
gauge centers relative to the coordinates of the knob template and a matrix of gauge
diameters were used to segment the animation frames into individual gauges based on
NCC’s identification of the template knob. Segmented gauges are shown in Figure 3.8.
After segmenting out individual gauges, gauges were unwrapped vertically, and a
script was written to allow the user to manually crop out the unwrapped needle from each
gauge for template matching. This operation should be performed once per gauge per set
18
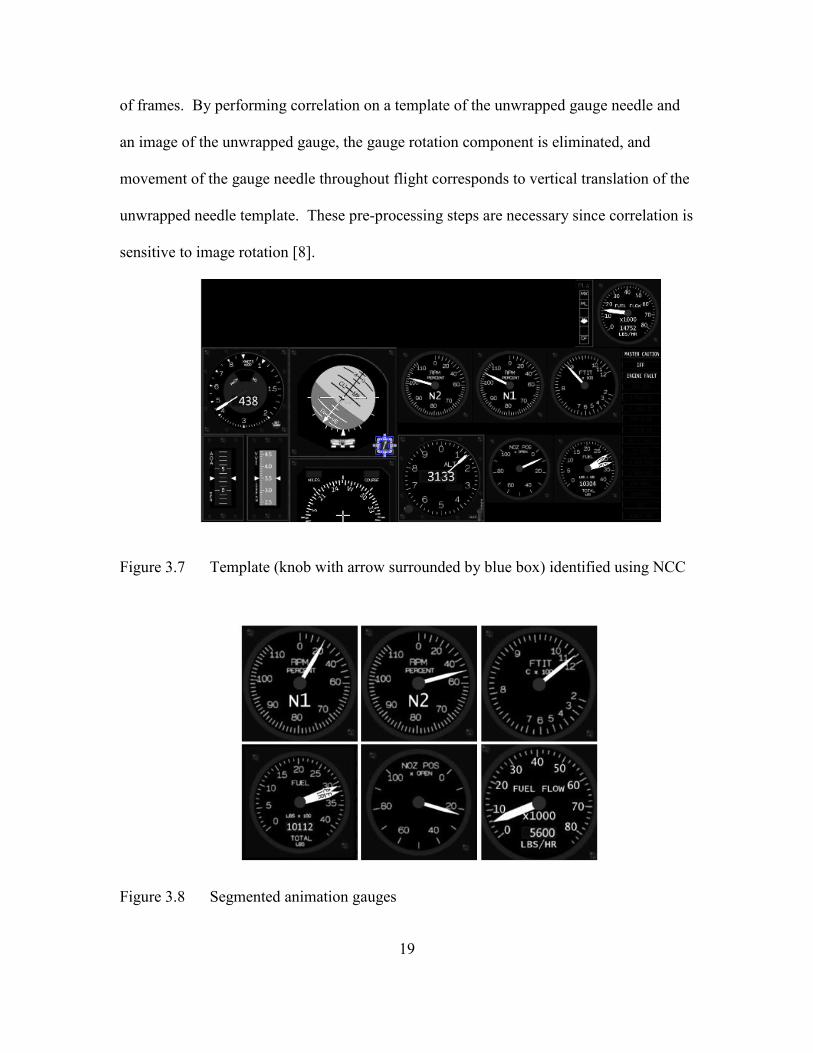
of frames. By performing correlation on a template of the unwrapped gauge needle and
an image of the unwrapped gauge, the gauge rotation component is eliminated, and
movement of the gauge needle throughout flight corresponds to vertical translation of the
unwrapped needle template. These pre-processing steps are necessary since correlation is
sensitive to image rotation [8].
Figure 3.7 Template (knob with arrow surrounded by blue box) identified using NCC
Figure 3.8 Segmented animation gauges
19
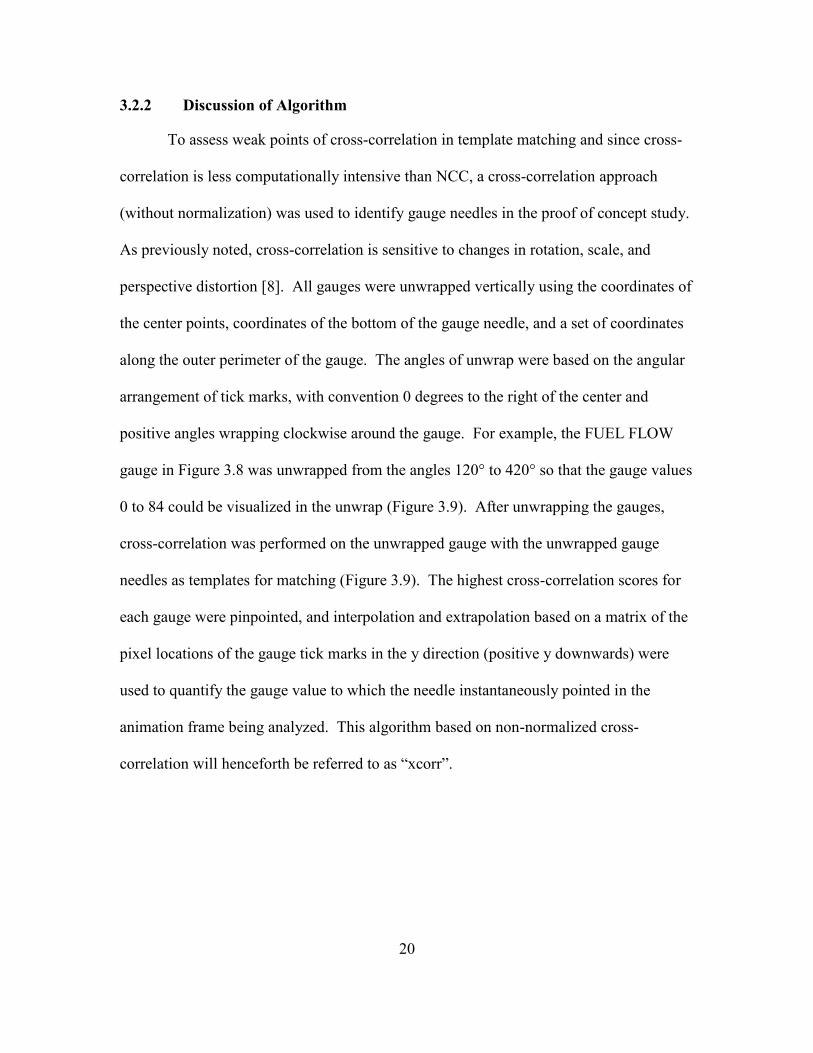
3.2.2 Discussion of Algorithm
To assess weak points of cross-correlation in template matching and since cross-
correlation is less computationally intensive than NCC, a cross-correlation approach
(without normalization) was used to identify gauge needles in the proof of concept study.
As previously noted, cross-correlation is sensitive to changes in rotation, scale, and
perspective distortion [8]. All gauges were unwrapped vertically using the coordinates of
the center points, coordinates of the bottom of the gauge needle, and a set of coordinates
along the outer perimeter of the gauge. The angles of unwrap were based on the angular
arrangement of tick marks, with convention 0 degrees to the right of the center and
positive angles wrapping clockwise around the gauge. For example, the FUEL FLOW
gauge in Figure 3.8 was unwrapped from the angles 120° to 420° so that the gauge values
0 to 84 could be visualized in the unwrap (Figure 3.9). After unwrapping the gauges,
cross-correlation was performed on the unwrapped gauge with the unwrapped gauge
needles as templates for matching (Figure 3.9). The highest cross-correlation scores for
each gauge were pinpointed, and interpolation and extrapolation based on a matrix of the
pixel locations of the gauge tick marks in the y direction (positive y downwards) were
used to quantify the gauge value to which the needle instantaneously pointed in the
animation frame being analyzed. This algorithm based on non-normalized cross-
correlation will henceforth be referred to as “xcorr”.
20
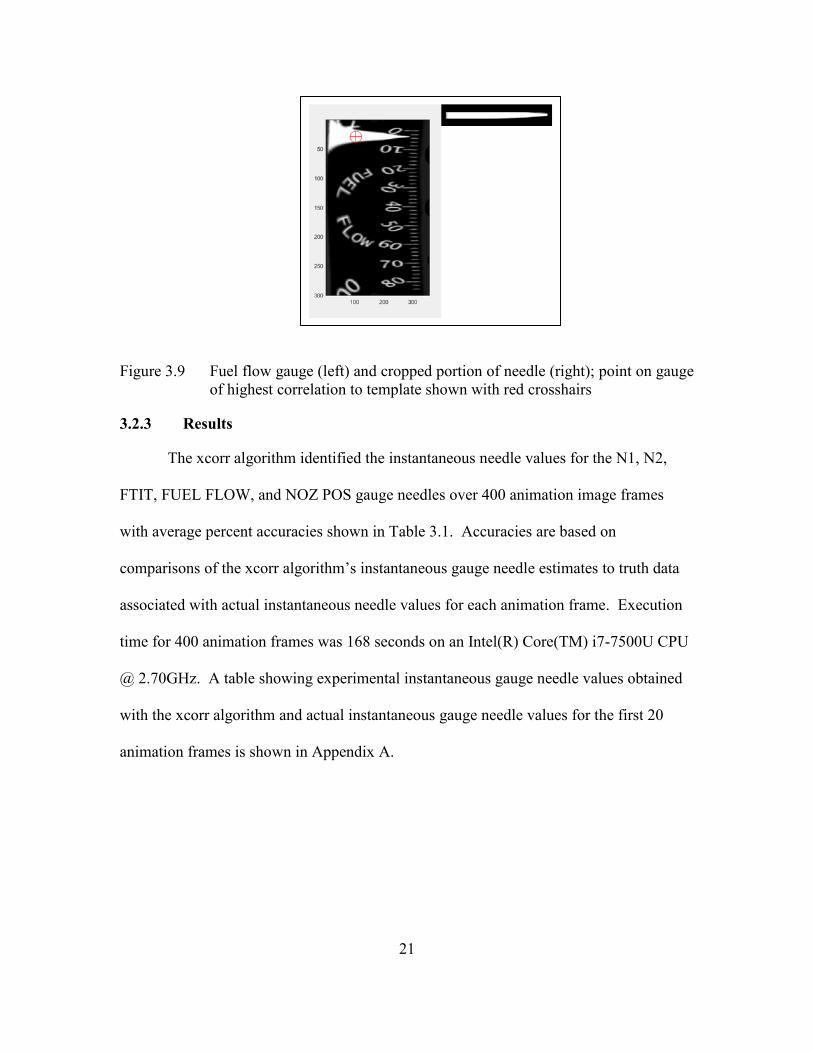
Figure 3.9 Fuel flow gauge (left) and cropped portion of needle (right); point on gauge
of highest correlation to template shown with red crosshairs
3.2.3 Results
The xcorr algorithm identified the instantaneous needle values for the N1, N2,
FTIT, FUEL FLOW, and NOZ POS gauge needles over 400 animation image frames
with average percent accuracies shown in Table 3.1. Accuracies are based on
comparisons of the xcorr algorithm’s instantaneous gauge needle estimates to truth data
associated with actual instantaneous needle values for each animation frame. Execution
time for 400 animation frames was 168 seconds on an Intel(R) Core(TM) i7-7500U CPU
@ 2.70GHz. A table showing experimental instantaneous gauge needle values obtained
with the xcorr algorithm and actual instantaneous gauge needle values for the first 20
animation frames is shown in Appendix A.
21
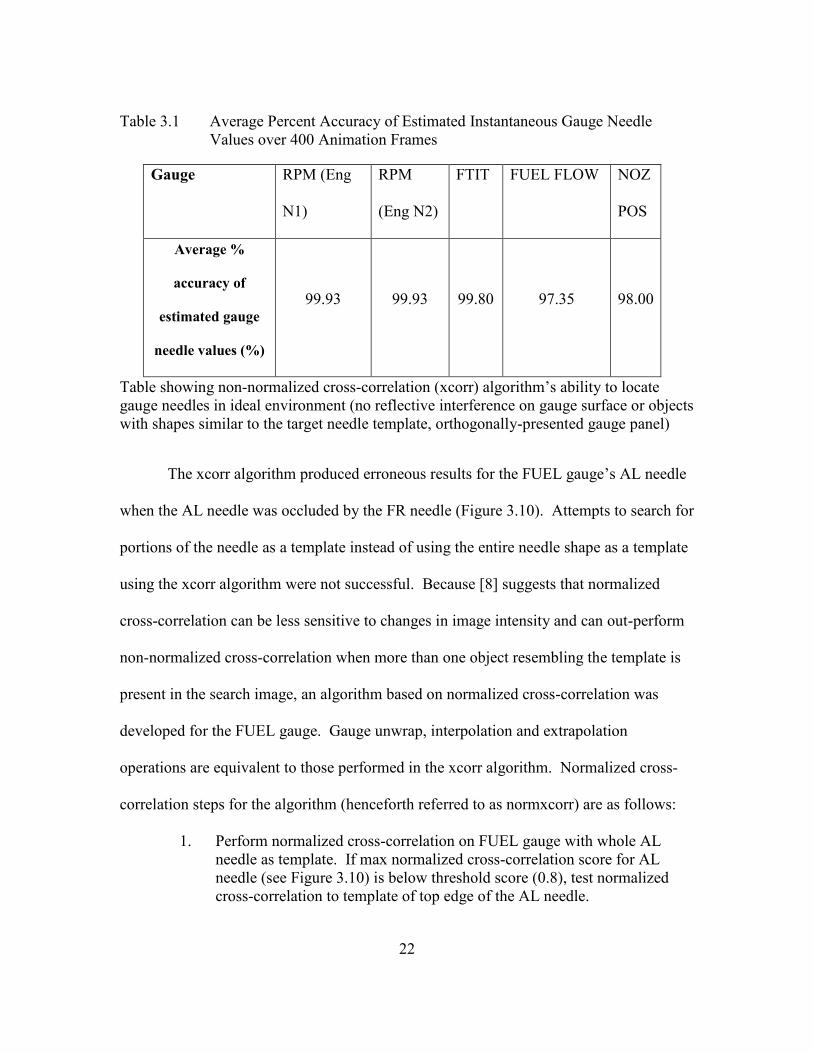
Table 3.1 Average Percent Accuracy of Estimated Instantaneous Gauge Needle
Values over 400 Animation Frames
Gauge RPM (Eng
N1)
RPM
(Eng N2)
FTIT FUEL FLOW NOZ
POS
Average %
accuracy of
estimated gauge
needle values (%)
99.93 99.93 99.80 97.35 98.00
Table showing non-normalized cross-correlation (xcorr) algorithm’s ability to locate
gauge needles in ideal environment (no reflective interference on gauge surface or objects
with shapes similar to the target needle template, orthogonally-presented gauge panel)
The xcorr algorithm produced erroneous results for the FUEL gauge’s AL needle
when the AL needle was occluded by the FR needle (Figure 3.10). Attempts to search for
portions of the needle as a template instead of using the entire needle shape as a template
using the xcorr algorithm were not successful. Because [8] suggests that normalized
cross-correlation can be less sensitive to changes in image intensity and can out-perform
non-normalized cross-correlation when more than one object resembling the template is
present in the search image, an algorithm based on normalized cross-correlation was
developed for the FUEL gauge. Gauge unwrap, interpolation and extrapolation
operations are equivalent to those performed in the xcorr algorithm. Normalized cross-
correlation steps for the algorithm (henceforth referred to as normxcorr) are as follows:
1. Perform normalized cross-correlation on FUEL gauge with whole AL
needle as template. If max normalized cross-correlation score for AL
needle (see Figure 3.10) is below threshold score (0.8), test normalized
cross-correlation to template of top edge of the AL needle.
22
2. If correlation score for top edge of AL needle is below threshold score
(0.8), test normalized cross-correlation score using template of bottom
edge of AL needle.
3. If correlation score for bottom edge of AL needle is below threshold score
(0.8), the needle must be fully occluded from view. Assign location of
occluded needle to the same location as the FR needle that is occluding it.
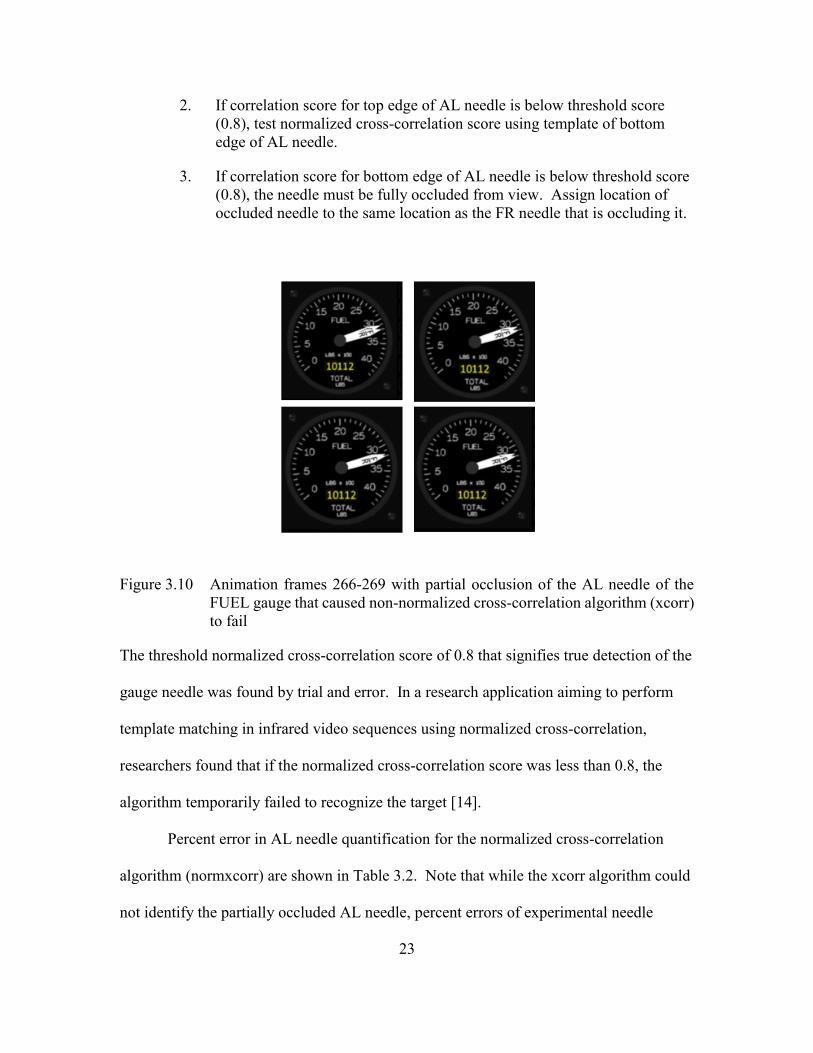
Figure 3.10 Animation frames 266-269 with partial occlusion of the AL needle of the
FUEL gauge that caused non-normalized cross-correlation algorithm (xcorr)
to fail
The threshold normalized cross-correlation score of 0.8 that signifies true detection of the
gauge needle was found by trial and error. In a research application aiming to perform
template matching in infrared video sequences using normalized cross-correlation,
researchers found that if the normalized cross-correlation score was less than 0.8, the
algorithm temporarily failed to recognize the target [14].
Percent error in AL needle quantification for the normalized cross-correlation
algorithm (normxcorr) are shown in Table 3.2. Note that while the xcorr algorithm could
not identify the partially occluded AL needle, percent errors of experimental needle
23
quantifications with the normxcorr algorithm in frames with AL needle occlusion are less
than +/- 0.42%. Xcorr execution time for 400 frames was 44.7 seconds for the FUEL
gauge analysis on an Intel(R) Core(TM) i7-7500U CPU @ 2.70GHz, while the
normxcorr algorithm execution time was 45.62 seconds.
Table 3.2 Object Detection When Target Is Partially Occluded (normxcorr
Algorithm)
Frame
number
Actual AL needle
value (from truth
data) (gauge units)
normxcorr AL needle
value (gauge units)
% Error of
normxcorr
estimates (%)
266 3115.556 3109.066 -0.21
267 3130.370 3141.046 0.34
268 3145.185 3157.035 0.37
269 3160.000 3173.025 0.41
Normxcorr algorithm target detection when objects similar to the target template are
present in the image and the target is partially occluded; normxcorr algorithm is more
suitable than xcorr algorithm for object detection under these conditions
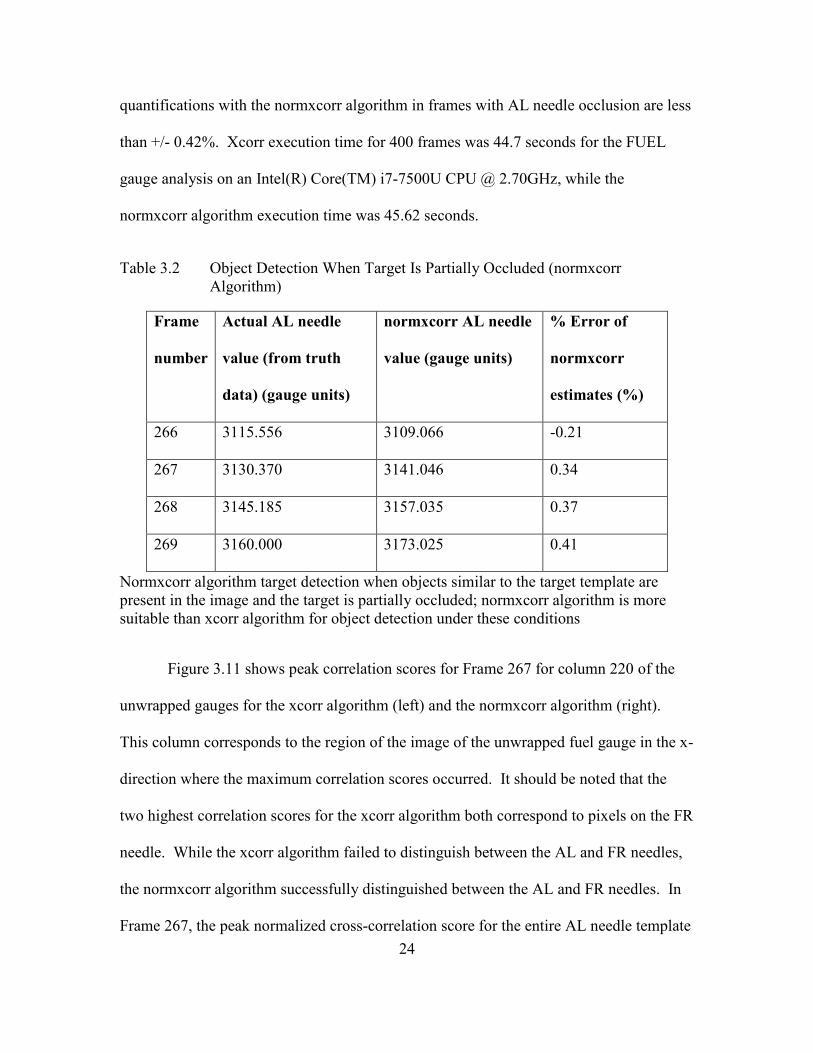
Figure 3.11 shows peak correlation scores for Frame 267 for column 220 of the
unwrapped gauges for the xcorr algorithm (left) and the normxcorr algorithm (right).
This column corresponds to the region of the image of the unwrapped fuel gauge in the x-
direction where the maximum correlation scores occurred. It should be noted that the
two highest correlation scores for the xcorr algorithm both correspond to pixels on the FR
needle. While the xcorr algorithm failed to distinguish between the AL and FR needles,
the normxcorr algorithm successfully distinguished between the AL and FR needles. In
Frame 267, the peak normalized cross-correlation score for the entire AL needle template
24
was less than 0.8, so normalized cross-correlation was performed using a template of the
top of the AL needle. For this normalized cross-correlation, a max score of 0.8374 was
achieved in column 220, row 225 (see Figure 3.11). This pixel is located on the top
portion of the AL needle in the image of the unwrapped gauge in the center of Figure
3.11. Over 400 animation frames, the normxcorr algorithm identified the instantaneous
value of the AL needle of the FUEL gauge with 99.71% accuracy and identified the
instantaneous value of the FR needle of the FUEL gauge with an average accuracy of
99.83%.
Figure 3.11 xcorr algorithm (left) fails to distinguish between AL and FR needles within
the unwrapped FUEL gauge for frame 267 (signified by two regions of peak
correlation scores corresponding to pixels on the FR needle), while
normxcorr algorithm (right) has one high correlation response corresponding
to the top of the AL needle.
25
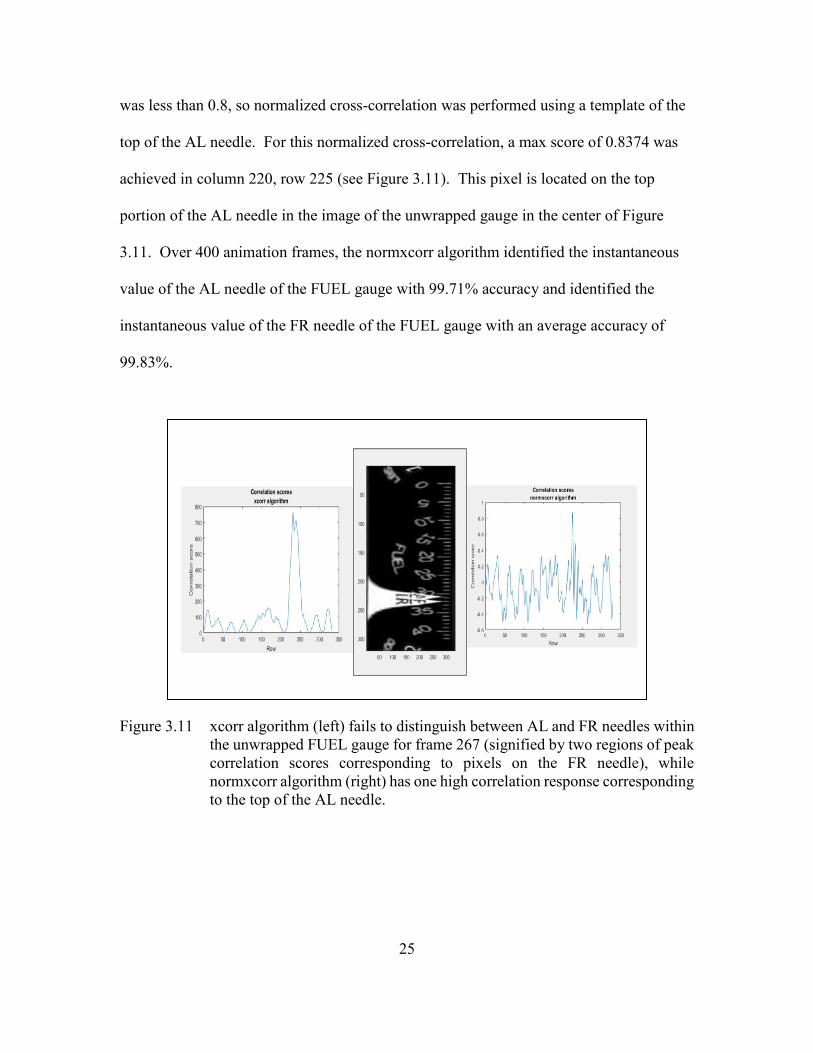
3.3 Proof of Concept: Needle Identification with Reflection Interference
After testing the ideal-case scenarios for image-based flight data recording, test
imagery from a grounded T-1A Jayhawk’s cockpit gauge panel was collected. This data
collection suggested that interference with the correlation algorithms used to implement
image-based flight data acquisition could be caused by reflections on gauge glass
surfaces. Figure 3.12 shows one of the T-1A cockpit gauges with reflective noise on the
glass surface covering the gauge.
Figure 3.12 T-1A cockpit gauge with reflective noise
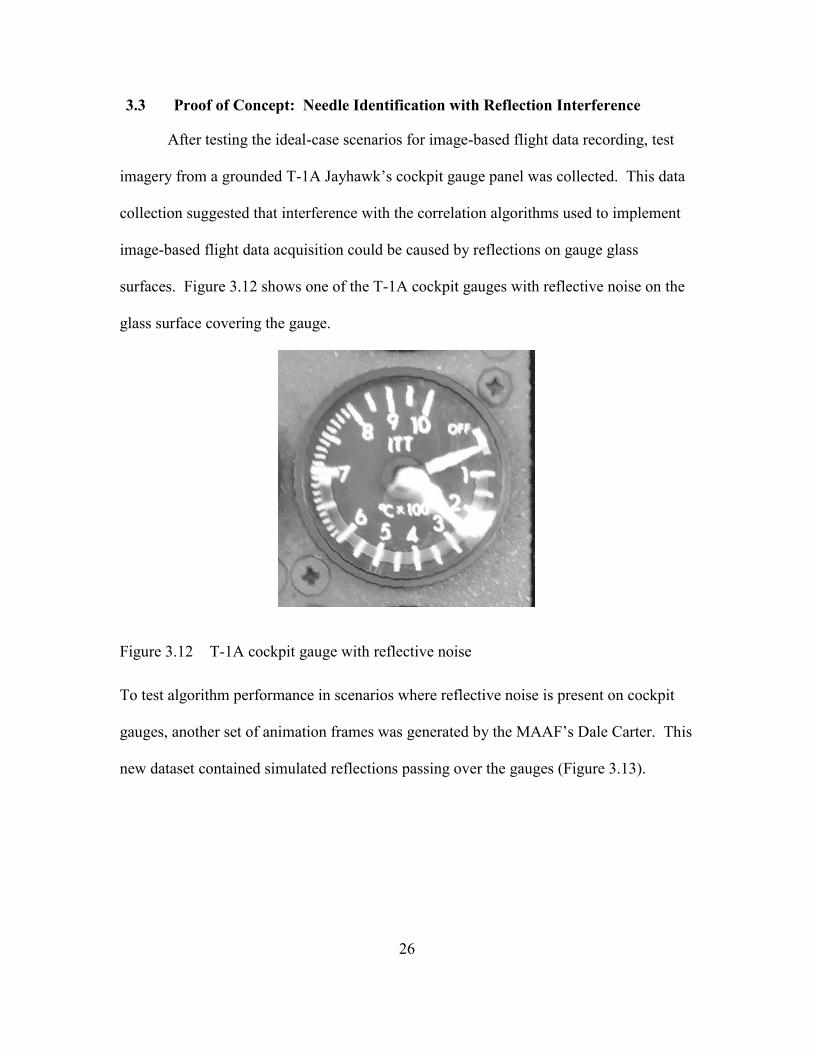
To test algorithm performance in scenarios where reflective noise is present on cockpit
gauges, another set of animation frames was generated by the MAAF’s Dale Carter. This
new dataset contained simulated reflections passing over the gauges (Figure 3.13).
26
Figure 3.13 Animation frame from dataset with simulated reflective noise added
3.3.1 Results
In some cases, reflective noise may completely cover the target gauge needle (e.g.
FTIT gauge in Figure 3.13). In these cases, template matching via correlation cannot be
used to identify the needle. To account for cases in which reflective noise completely
occludes the needle, images whose normalized cross-correlation score for the needle
template fell below 0.8 were flagged. Linear interpolation between the previous un-
flagged image frame and the most recent un-flagged image following the flagged image
was performed. After adding this functionality, the normxcorr algorithm identified
instantaneous needle values over 400 animation frames with percent accuracies listed in
Table 3.3. Percent accuracies are based on truth data containing actual instantaneous
gauge needle values for each of the 400 animation frames. Execution time for 400
animation frames was 231.1 seconds on an Intel(R) Core(TM) i7-7500U CPU @
2.70GHz. A table showing experimental instantaneous gauge needle values obtained
with the normxcorr algorithm and actual instantaneous gauge needle values for animation
frames 265-285 is shown in Appendix B.
27

Table 3.3 Average Percent Accuracy of Estimated Instantaneous Gauge Needle
Values over 400 Animation Frames with Reflections Present
Gauge RPM
(Eng N1)
RPM
(Eng N2)
FTIT FUEL
FLOW
NOZ
POS
FUEL
(AFT)
FUEL
(FWD)
Average %
accuracy of
estimated gauge
needle values (%)
99.99 99.87 99.99 96.94 97.72 99.71 99.83
Table showing normxcorr algorithm’s ability to locate gauge needles over 400 animation
frames with simulated reflections on gauge glass present
3.4 Needle Identification Testing: T-1A Cockpit Imagery
3.4.1 Image Segmentation for T-1A Cockpit
One of the raw images collected from the cockpit of a T-1A Jayhawk is shown in
Figure 3.14. Because the proposed design has not yet been deemed airworthy, analyses
could only be performed on images from grounded aircraft (powered off). The target
steam gauges for image-based flight data acquisition are shown within the red rectangle
in Figure 3.14.
Because correlation is sensitive to template rotation [8], steps had to be performed
to ensure that all images of the cockpit gauge panel were at the same orientation. To
place the test image in Figure 3.14 at a standard orientation, the image of the cockpit
gauge panel was rotated to ensure that the bank of black buttons (shown within blue
rectangle in Figure 3.16) was perfectly vertical on its left side. The aligned cockpit
image is shown in Figure 3.16. Normalized cross-correlation was then used to detect the
NI SETTING template (Figure 3.15) in the aligned cockpit image, and relative
28
coordinates of the gauge centers to the template were used to segment the aligned cockpit
image into individual gauges.
Figure 3.14 Raw image from T-1A Jayhawk cockpit data collection with target gauges
for image-based flight data recording contained in red rectangle
Figure 3.15 NI SETTING template used for gauge segmentation based on normalized
cross-correlation in T-1A cockpit imagery
29
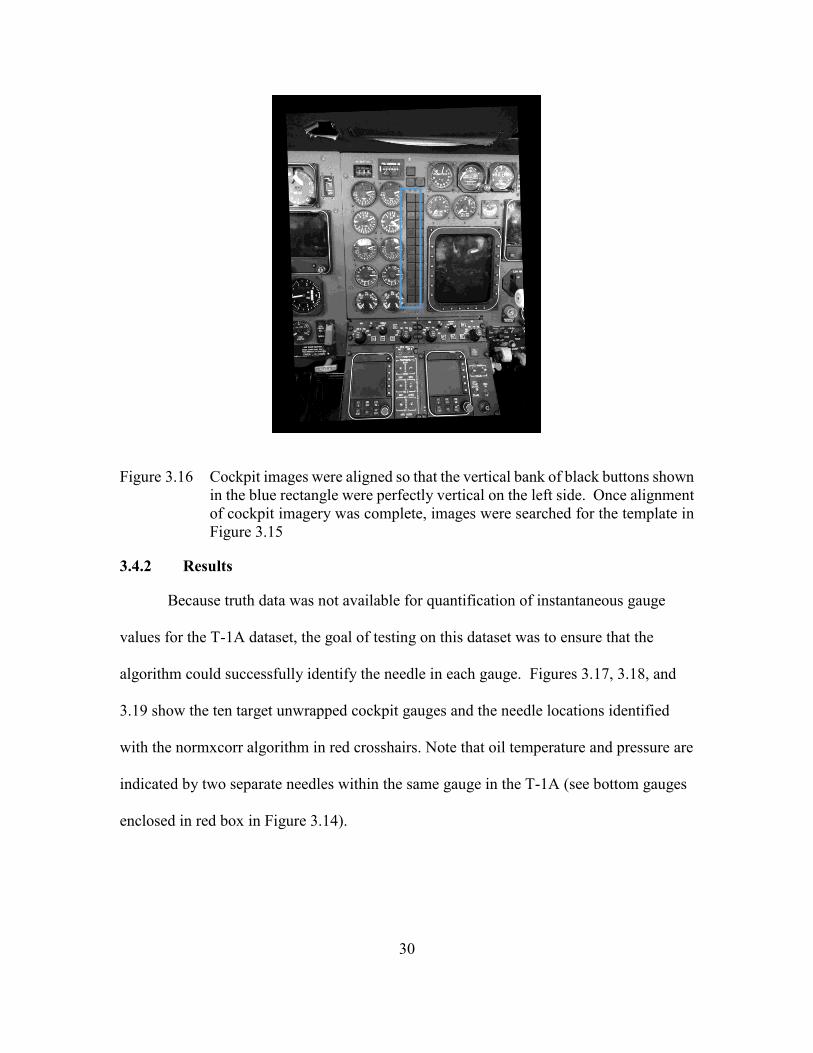
Figure 3.16 Cockpit images were aligned so that the vertical bank of black buttons shown
in the blue rectangle were perfectly vertical on the left side. Once alignment
of cockpit imagery was complete, images were searched for the template in
Figure 3.15
3.4.2 Results
Because truth data was not available for quantification of instantaneous gauge
values for the T-1A dataset, the goal of testing on this dataset was to ensure that the
algorithm could successfully identify the needle in each gauge. Figures 3.17, 3.18, and
3.19 show the ten target unwrapped cockpit gauges and the needle locations identified
with the normxcorr algorithm in red crosshairs. Note that oil temperature and pressure are
indicated by two separate needles within the same gauge in the T-1A (see bottom gauges
enclosed in red box in Figure 3.14).
30
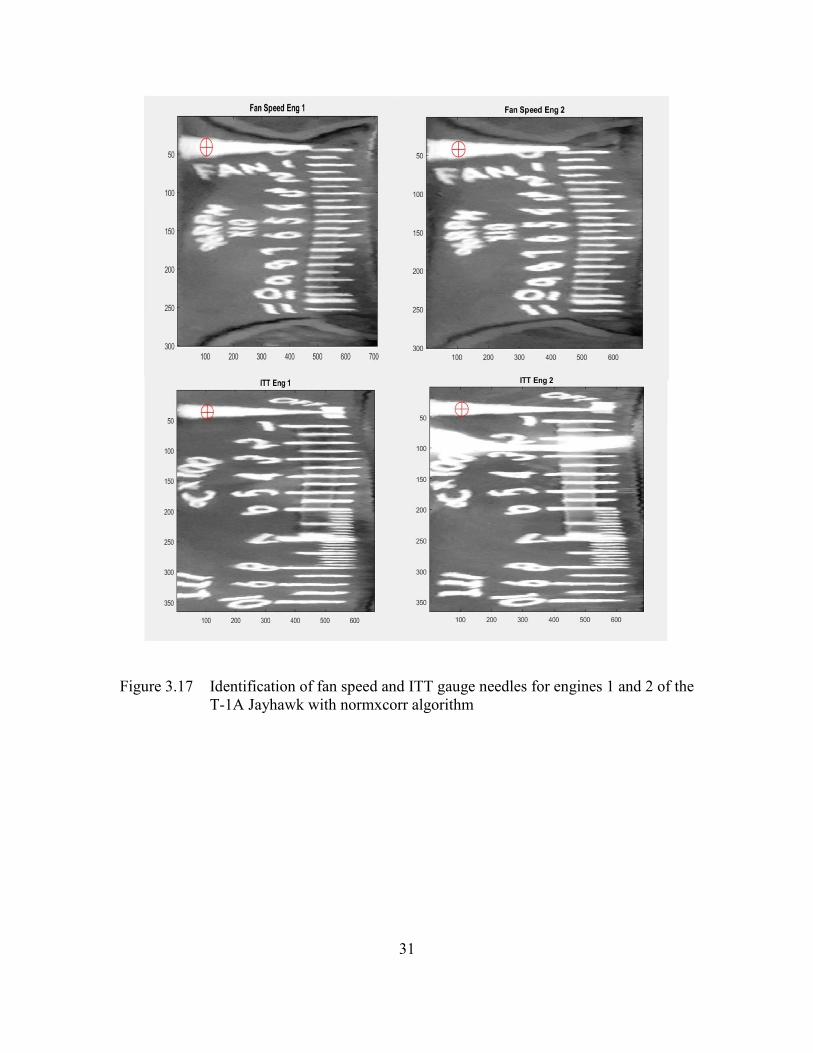
Figure 3.17 Identification of fan speed and ITT gauge needles for engines 1 and 2 of the
T-1A Jayhawk with normxcorr algorithm
31
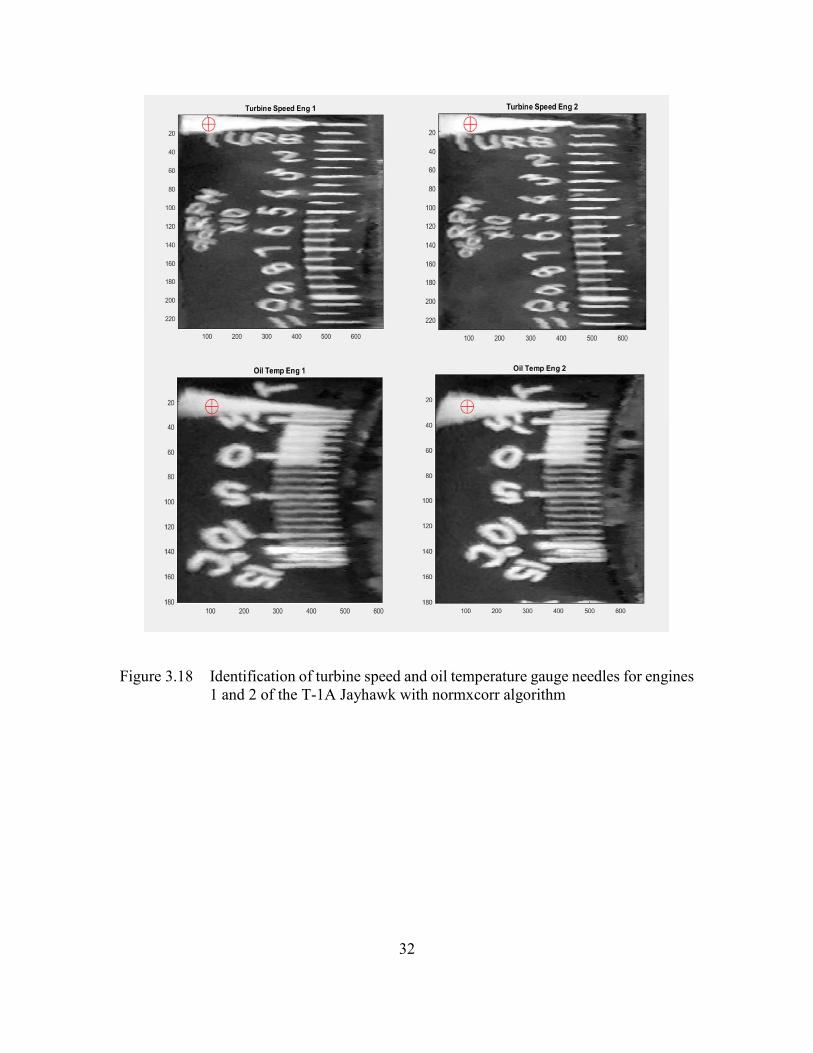
Figure 3.18 Identification of turbine speed and oil temperature gauge needles for engines
1 and 2 of the T-1A Jayhawk with normxcorr algorithm
32
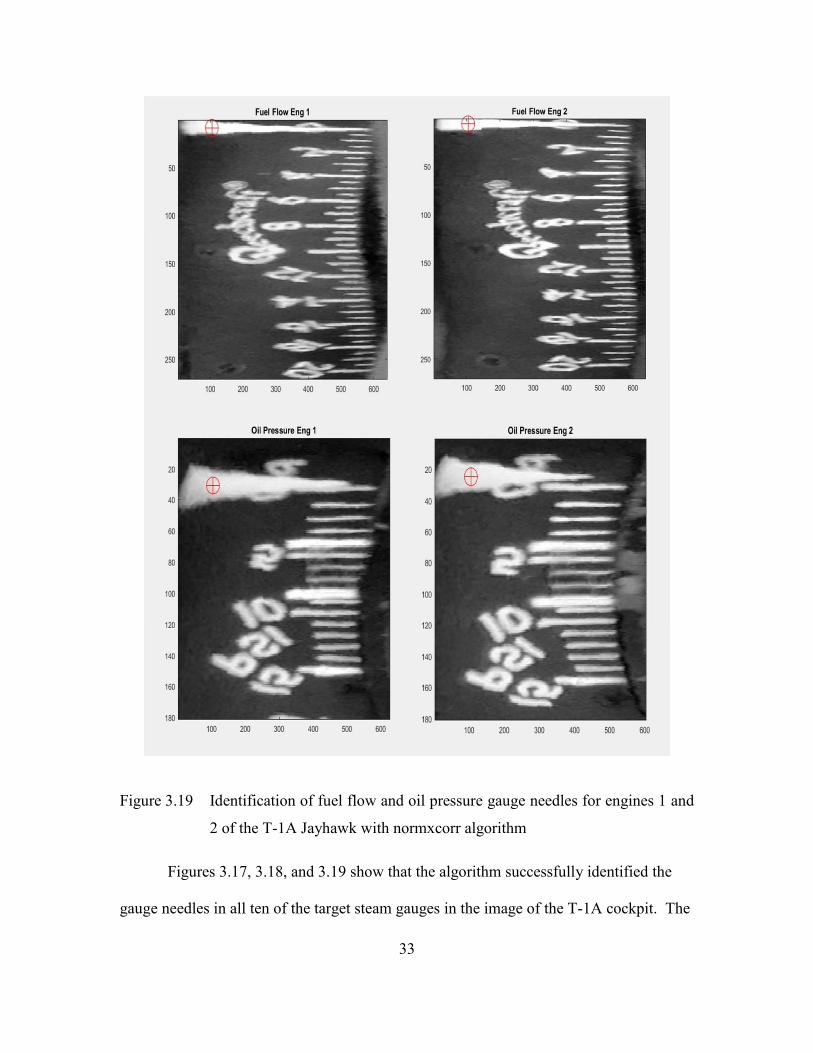
Figure 3.19 Identification of fuel flow and oil pressure gauge needles for engines 1 and
2 of the T-1A Jayhawk with normxcorr algorithm
Figures 3.17, 3.18, and 3.19 show that the algorithm successfully identified the
gauge needles in all ten of the target steam gauges in the image of the T-1A cockpit. The
33
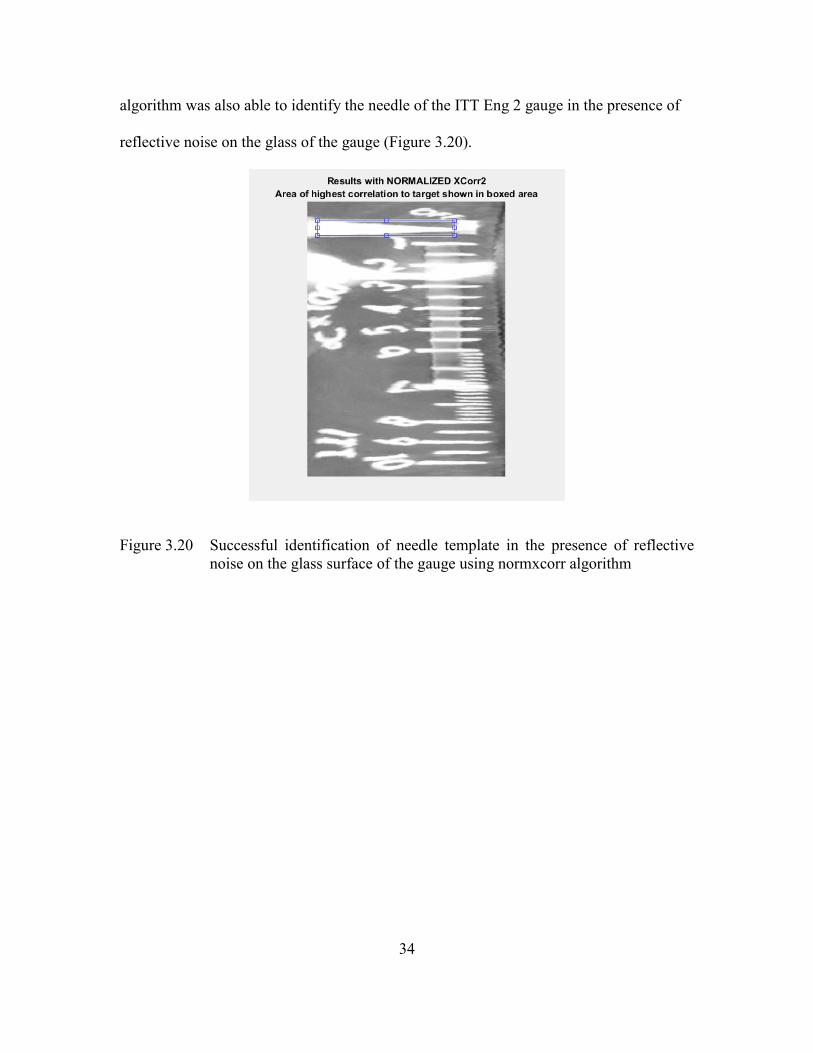
algorithm was also able to identify the needle of the ITT Eng 2 gauge in the presence of
reflective noise on the glass of the gauge (Figure 3.20).
Figure 3.20 Successful identification of needle template in the presence of reflective
noise on the glass surface of the gauge using normxcorr algorithm
34
CHAPTER IV
CONCLUSIONS AND FUTURE RESEARCH
The proof of concept studies performed to test the viability of image-based flight
data acquisition suggest that this method could be used to overcome a lack of digitally-
recorded FDR data. Over 400 animation frames of a simulated cockpit during flight,
image-based flight data acquisition was used to quantify instantaneous gauge needles
with accuracies greater than 97% when compared to true gauge needle values for each
animation frame.
The research presented in this paper also suggests that image-based flight data
acquisition can be used in situations where camera roll, partial target occlusion, or
reflective noise on gauge glass coverings occur during data collection. Image alignment
into a known frame of reference was used to remove any incidental camera roll that
occurred during data collection, and methodology based on normalized cross-correlation
was outlined to estimate gauge needle values when reflective noise on gauge glass
surfaces was present. In cases where gauge needles are completely occluded from view,
interpolation and extrapolation based on data before and after the occlusion can be used
to estimate gauge needle values during the occlusion.
Testing on imagery of T-1A cockpit gauges suggests that image-based flight data
acquisition could work in a real cockpit environment. The normalized cross-correlation
algorithm successfully identified gauge needles in ten target gauges in a T-1A cockpit.
35

The algorithm also successfully identified the gauge needle in the presence of reflective
noise on the gauge’s glass surface. This reflective noise did not occlude the needle, but
the noise and the gauge needle were similar in shape.
Planned future work includes working with the USAF’s MAAF to achieve
airworthiness for a camera so that image-based flight data acquisition can be field tested
during flight. After achieving airworthiness certification for an imaging platform, the
size of the testing data set can be increased, and more refinements to the data acquisition
algorithm can be made. Comparing data obtained with image-based flight data
acquisition against FDR data in a USAF aircraft that already has an FDR on board could
also be used to verify results in a real cockpit environment.
36
REFERENCES
[1] "Cockpit Voice Recorders (CVR) and Flight Data Recorders (FDR)", ntsb.gov, 2017.
[Online]. Available: https://www.ntsb.gov/news/Pages/cvr_fdr.aspx. [Accessed:
02- Nov- 2017].
[2] “DSC-QX10_QX100_brochure.pdf,” Sony Corporation, 2017, pp. 1-12.
[3] "What is Matlab", Cimss.ssec.wisc.edu, 2017. [Online]. Available:
http://cimss.ssec.wisc.edu/wxwise/class/aos340/spr00/whatismatlab.htm.
[Accessed: 03- Nov- 2017].
[4] B. Prescott and G. McLean, "Line-Based Correction of Radial Lens Distortion",
Graphical Models and Image Processing, Jan. 1997, pp. 39-47.
[5] D. C. Brown, “Close-range camera calibration”, PHOTOGRAMMETRIC
ENGINEERING, vol. 37, no. 8, 1971, pp. 855–866.
[6] J. Weng, P. Cohen and M. Herniou, "Camera calibration with distortion models and
accuracy evaluation", in IEEE Transactions on Pattern Analysis and Machine
Intelligence, vol. 14, no. 10, Oct 1992, pp. 965-980.
[7] "Nikon | Imaging Products | DSLR Camera Basics | Focal Length and Angle of view",
Imaging.nikon.com, 2017. [Online]. Available:
http://imaging.nikon.com/lineup/dslr/basics/19/01.htm. [Accessed: 02- Nov-
2017].
[8] J.P. Lewis, “Fast normalized cross-correlation”, Vision Interface, Canadian Image
Processing and Pattern Recognition Society, 1995, pp. 120–123.
[9] R.E. Fan, K.W. Chang, C.J. Hsieh, X.R. Wang, and C.J. Lin. “LIBLINEAR: A
library for large linear classification”, Journal of Machine Learning Research,
vol. 9, 2008, pp. 1871-1874.
[10] J. Ball, ‘Statistical Signal Processing Lectures’, Mississippi State University, 2017.
[11] Y. Yang, Y. Zhuang, F. Bi, H. Shi and Y. Xie, "M-FCN: Effective Fully
Convolutional Network-Based Airplane Detection Framework," in IEEE
Geoscience and Remote Sensing Letters, vol. 14, no. 8, pp. 1293-1297, Aug.
2017.
37
[12] G. Adhikari, S. K. Sahani, M. S. Chauhan and B. K. Das, "Fast real time object
tracking based on normalized cross correlation and importance of thresholding
segmentation," 2016 International Conference on Recent Trends in Information
Technology (ICRTIT), Chennai, 2016, pp. 1-5.
[13] G. Adhikari, S. Sahu, S. K. Sahani and B. K. Das, "Fast normalized cross
correlation with early elimination condition," 2012 International Conference on
Recent Trends in Information Technology, Chennai, Tamil Nadu, 2012, pp. 136-
140.
[14] I. Pham, R. Jalovecky and M. Polasek, "Using template matching for object
recognition in infrared video sequences," 2015 IEEE/AIAA 34th Digital Avionics
Systems Conference (DASC), Prague, 2015, pp. 8C5-1-8C5-9.
[15] "How Can I recognize/detect the Needle/hand in the below images? - MATLAB
Answers - MATLAB Central", Mathworks.com, 2017. [Online]. Available:
https://www.mathworks.com/matlabcentral/answers/231633-how-can-i-
recognize-detect-the-needle-hand-in-the-below-images. [Accessed: 05- Nov-
2017].
38

APPENDIX A
INSTANTANEOUS GAUGE NEEDLE VALUES OBTAINED WITH IMAGE-BASED
FLIGHT DATA ACQUISITION AND CORRESPONDING TRUTH DATA
39
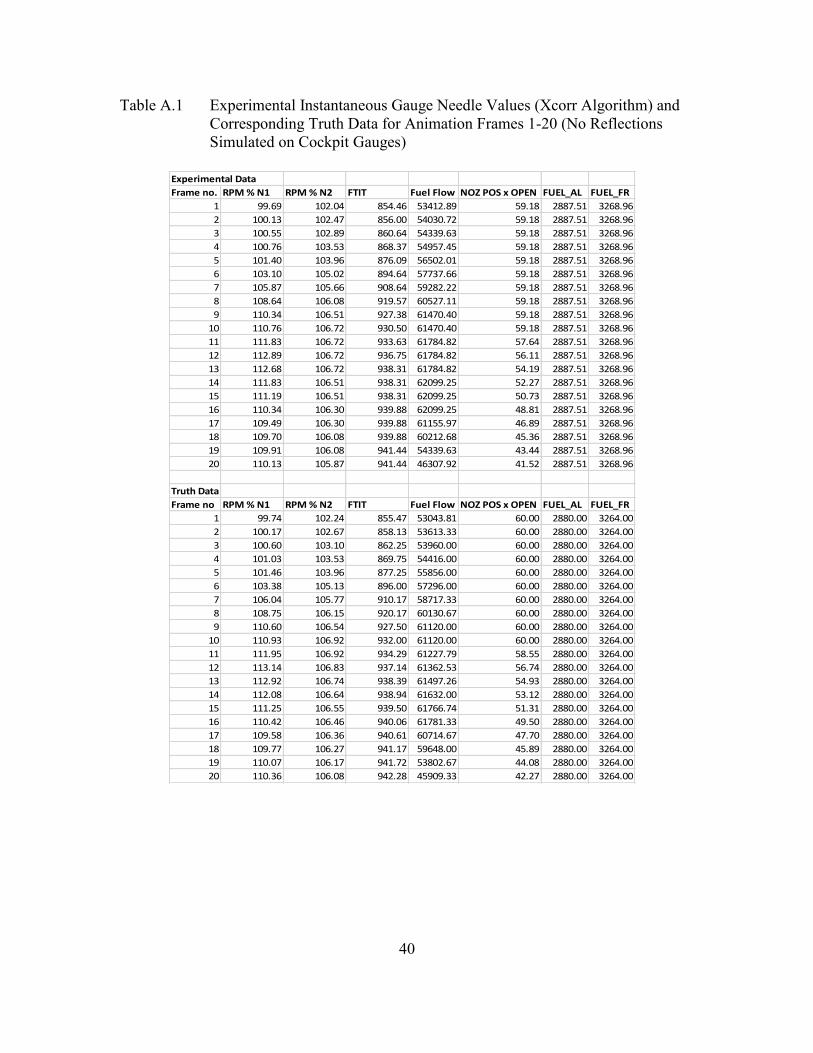
Table A.1 Experimental Instantaneous Gauge Needle Values (Xcorr Algorithm) and
Corresponding Truth Data for Animation Frames 1-20 (No Reflections
Simulated on Cockpit Gauges)
Experimental Data
Frame no. RPM % N1 RPM % N2 FTIT Fuel Flow NOZ POS x OPEN FUEL_AL FUEL_FR
1 99.69 102.04 854.46 53412.89 59.18 2887.51 3268.96
2 100.13 102.47 856.00 54030.72 59.18 2887.51 3268.96
3 100.55 102.89 860.64 54339.63 59.18 2887.51 3268.96
4 100.76 103.53 868.37 54957.45 59.18 2887.51 3268.96
5 101.40 103.96 876.09 56502.01 59.18 2887.51 3268.96
6 103.10 105.02 894.64 57737.66 59.18 2887.51 3268.96
7 105.87 105.66 908.64 59282.22 59.18 2887.51 3268.96
8 108.64 106.08 919.57 60527.11 59.18 2887.51 3268.96
9 110.34 106.51 927.38 61470.40 59.18 2887.51 3268.96
10 110.76 106.72 930.50 61470.40 59.18 2887.51 3268.96
11 111.83 106.72 933.63 61784.82 57.64 2887.51 3268.96
12 112.89 106.72 936.75 61784.82 56.11 2887.51 3268.96
13 112.68 106.72 938.31 61784.82 54.19 2887.51 3268.96
14 111.83 106.51 938.31 62099.25 52.27 2887.51 3268.96
15 111.19 106.51 938.31 62099.25 50.73 2887.51 3268.96
16 110.34 106.30 939.88 62099.25 48.81 2887.51 3268.96
17 109.49 106.30 939.88 61155.97 46.89 2887.51 3268.96
18 109.70 106.08 939.88 60212.68 45.36 2887.51 3268.96
19 109.91 106.08 941.44 54339.63 43.44 2887.51 3268.96
20 110.13 105.87 941.44 46307.92 41.52 2887.51 3268.96
Truth Data
Frame no RPM % N1 RPM % N2 FTIT Fuel Flow NOZ POS x OPEN FUEL_AL FUEL_FR
1 99.74 102.24 855.47 53043.81 60.00 2880.00 3264.00
2 100.17 102.67 858.13 53613.33 60.00 2880.00 3264.00
3 100.60 103.10 862.25 53960.00 60.00 2880.00 3264.00
4 101.03 103.53 869.75 54416.00 60.00 2880.00 3264.00
5 101.46 103.96 877.25 55856.00 60.00 2880.00 3264.00
6 103.38 105.13 896.00 57296.00 60.00 2880.00 3264.00
7 106.04 105.77 910.17 58717.33 60.00 2880.00 3264.00
8 108.75 106.15 920.17 60130.67 60.00 2880.00 3264.00
9 110.60 106.54 927.50 61120.00 60.00 2880.00 3264.00
10 110.93 106.92 932.00 61120.00 60.00 2880.00 3264.00
11 111.95 106.92 934.29 61227.79 58.55 2880.00 3264.00
12 113.14 106.83 937.14 61362.53 56.74 2880.00 3264.00
13 112.92 106.74 938.39 61497.26 54.93 2880.00 3264.00
14 112.08 106.64 938.94 61632.00 53.12 2880.00 3264.00
15 111.25 106.55 939.50 61766.74 51.31 2880.00 3264.00
16 110.42 106.46 940.06 61781.33 49.50 2880.00 3264.00
17 109.58 106.36 940.61 60714.67 47.70 2880.00 3264.00
18 109.77 106.27 941.17 59648.00 45.89 2880.00 3264.00
19 110.07 106.17 941.72 53802.67 44.08 2880.00 3264.00
20 110.36 106.08 942.28 45909.33 42.27 2880.00 3264.00
40
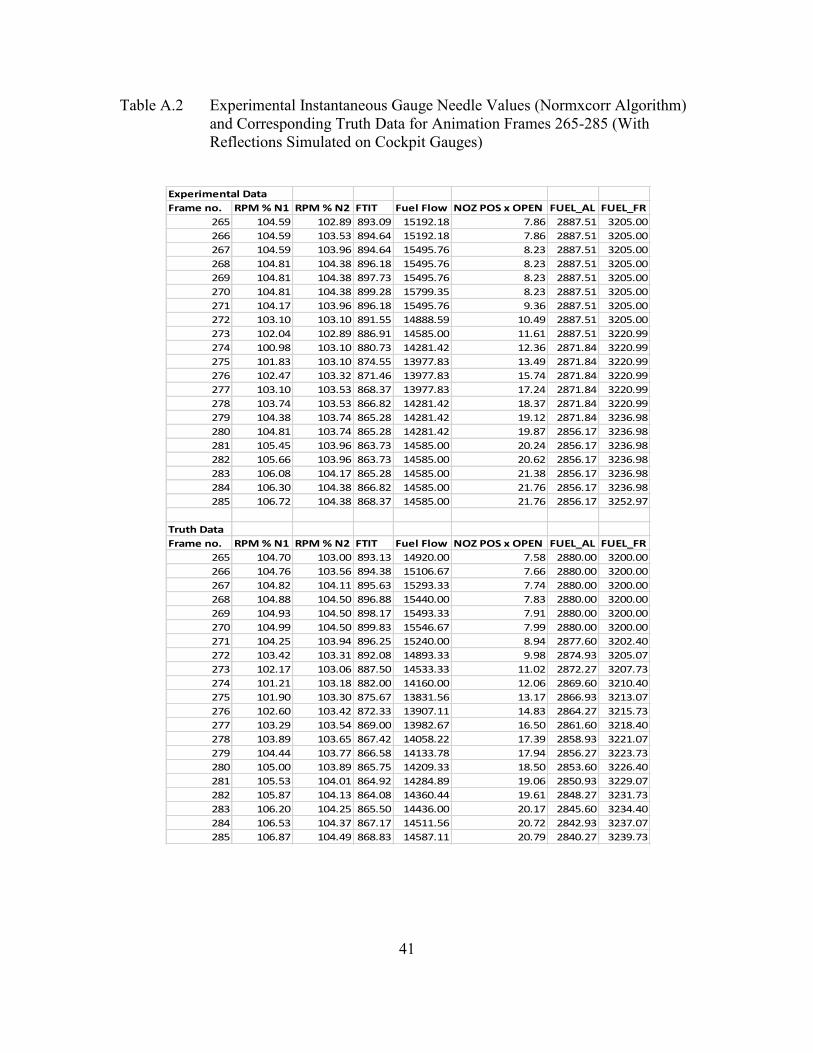
Table A.2 Experimental Instantaneous Gauge Needle Values (Normxcorr Algorithm)
and Corresponding Truth Data for Animation Frames 265-285 (With
Reflections Simulated on Cockpit Gauges)
Experimental Data
Frame no. RPM % N1 RPM % N2 FTIT Fuel Flow NOZ POS x OPEN FUEL_AL FUEL_FR
265 104.59 102.89 893.09 15192.18 7.86 2887.51 3205.00
266 104.59 103.53 894.64 15192.18 7.86 2887.51 3205.00
267 104.59 103.96 894.64 15495.76 8.23 2887.51 3205.00
268 104.81 104.38 896.18 15495.76 8.23 2887.51 3205.00
269 104.81 104.38 897.73 15495.76 8.23 2887.51 3205.00
270 104.81 104.38 899.28 15799.35 8.23 2887.51 3205.00
271 104.17 103.96 896.18 15495.76 9.36 2887.51 3205.00
272 103.10 103.10 891.55 14888.59 10.49 2887.51 3205.00
273 102.04 102.89 886.91 14585.00 11.61 2887.51 3220.99
274 100.98 103.10 880.73 14281.42 12.36 2871.84 3220.99
275 101.83 103.10 874.55 13977.83 13.49 2871.84 3220.99
276 102.47 103.32 871.46 13977.83 15.74 2871.84 3220.99
277 103.10 103.53 868.37 13977.83 17.24 2871.84 3220.99
278 103.74 103.53 866.82 14281.42 18.37 2871.84 3220.99
279 104.38 103.74 865.28 14281.42 19.12 2871.84 3236.98
280 104.81 103.74 865.28 14281.42 19.87 2856.17 3236.98
281 105.45 103.96 863.73 14585.00 20.24 2856.17 3236.98
282 105.66 103.96 863.73 14585.00 20.62 2856.17 3236.98
283 106.08 104.17 865.28 14585.00 21.38 2856.17 3236.98
284 106.30 104.38 866.82 14585.00 21.76 2856.17 3236.98
285 106.72 104.38 868.37 14585.00 21.76 2856.17 3252.97
Truth Data
Frame no. RPM % N1 RPM % N2 FTIT Fuel Flow NOZ POS x OPEN FUEL_AL FUEL_FR
265 104.70 103.00 893.13 14920.00 7.58 2880.00 3200.00
266 104.76 103.56 894.38 15106.67 7.66 2880.00 3200.00
267 104.82 104.11 895.63 15293.33 7.74 2880.00 3200.00
268 104.88 104.50 896.88 15440.00 7.83 2880.00 3200.00
269 104.93 104.50 898.17 15493.33 7.91 2880.00 3200.00
270 104.99 104.50 899.83 15546.67 7.99 2880.00 3200.00
271 104.25 103.94 896.25 15240.00 8.94 2877.60 3202.40
272 103.42 103.31 892.08 14893.33 9.98 2874.93 3205.07
273 102.17 103.06 887.50 14533.33 11.02 2872.27 3207.73
274 101.21 103.18 882.00 14160.00 12.06 2869.60 3210.40
275 101.90 103.30 875.67 13831.56 13.17 2866.93 3213.07
276 102.60 103.42 872.33 13907.11 14.83 2864.27 3215.73
277 103.29 103.54 869.00 13982.67 16.50 2861.60 3218.40
278 103.89 103.65 867.42 14058.22 17.39 2858.93 3221.07
279 104.44 103.77 866.58 14133.78 17.94 2856.27 3223.73
280 105.00 103.89 865.75 14209.33 18.50 2853.60 3226.40
281 105.53 104.01 864.92 14284.89 19.06 2850.93 3229.07
282 105.87 104.13 864.08 14360.44 19.61 2848.27 3231.73
283 106.20 104.25 865.50 14436.00 20.17 2845.60 3234.40
284 106.53 104.37 867.17 14511.56 20.72 2842.93 3237.07
285 106.87 104.49 868.83 14587.11 20.79 2840.27 3239.73
41