image acquisition
TRANSCRIPT
2Image Acquisition
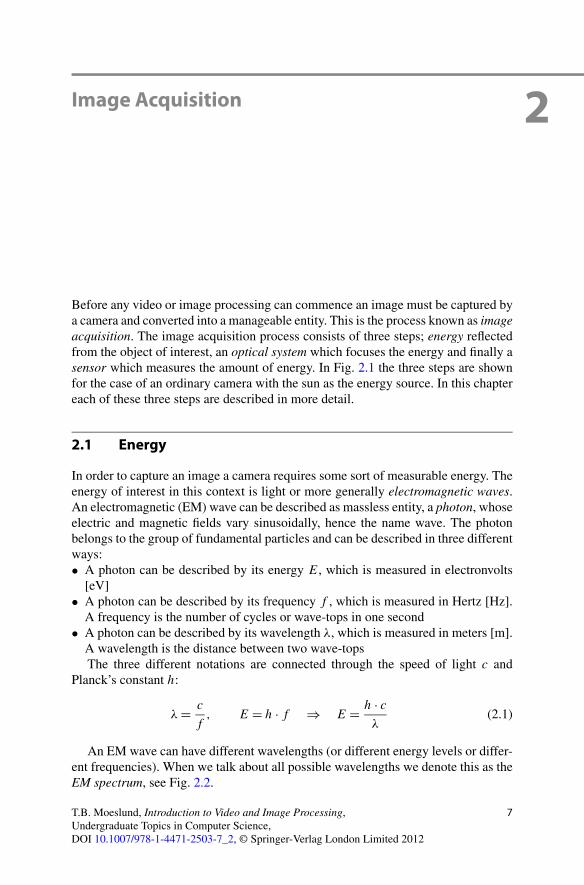
Before any video or image processing can commence an image must be captured bya camera and converted into a manageable entity. This is the process known as imageacquisition. The image acquisition process consists of three steps; energy reflectedfrom the object of interest, an optical system which focuses the energy and finally asensor which measures the amount of energy. In Fig. 2.1 the three steps are shownfor the case of an ordinary camera with the sun as the energy source. In this chaptereach of these three steps are described in more detail.
2.1 Energy
In order to capture an image a camera requires some sort of measurable energy. Theenergy of interest in this context is light or more generally electromagnetic waves.An electromagnetic (EM) wave can be described as massless entity, a photon, whoseelectric and magnetic fields vary sinusoidally, hence the name wave. The photonbelongs to the group of fundamental particles and can be described in three differentways:• A photon can be described by its energy E, which is measured in electronvolts
[eV]• A photon can be described by its frequency f , which is measured in Hertz [Hz].
A frequency is the number of cycles or wave-tops in one second• A photon can be described by its wavelength λ, which is measured in meters [m].
A wavelength is the distance between two wave-topsThe three different notations are connected through the speed of light c and
Planck’s constant h:
λ = c
f, E = h · f ⇒ E = h · c
λ(2.1)
An EM wave can have different wavelengths (or different energy levels or differ-ent frequencies). When we talk about all possible wavelengths we denote this as theEM spectrum, see Fig. 2.2.
T.B. Moeslund, Introduction to Video and Image Processing,Undergraduate Topics in Computer Science,DOI 10.1007/978-1-4471-2503-7_2, © Springer-Verlag London Limited 2012
7
8 2 Image Acquisition
Fig. 2.1 Overview of the typical image acquisition process, with the sun as light source, a tree asobject and a digital camera to capture the image. An analog camera would use a film where thedigital camera uses a sensor
In order to make the definitions and equations above more understandable, theEM spectrum is often described using the names of the applications where they areused in practice. For example, when you listen to FM-radio the music is transmittedthrough the air using EM waves around 100 · 106 Hz, hence this part of the EMspectrum is often denoted “radio”. Other well-known applications are also includedin the figure.
The range from approximately 400–700 nm (nm = nanometer = 10−9) is de-noted the visual spectrum. The EM waves within this range are those your eye (andmost cameras) can detect. This means that the light from the sun (or a lamp) in prin-ciple is the same as the signal used for transmitting TV, radio or for mobile phonesetc. The only difference, in this context, is the fact that the human eye can senseEM waves in this range and not the waves used for e.g., radio. Or in other words, ifour eyes were sensitive to EM waves with a frequency around 2 · 109 Hz, then yourmobile phone would work as a flash light, and big antennas would be perceived as“small suns”. Evolution has (of course) not made the human eye sensitive to suchfrequencies but rather to the frequencies of the waves coming from the sun, hencevisible light.
2.1.1 Illumination
To capture an image we need some kind of energy source to illuminate the scene.In Fig. 2.1 the sun acts as the energy source. Most often we apply visual light, butother frequencies can also be applied, see Sect. 2.5.

2.1 Energy 9
Fig. 2.2 A large part of the electromagnetic spectrum showing the energy of one photon, thefrequency, wavelength and typical applications of the different areas of the spectrum
Fig. 2.3 The effect of illuminating a face from four different directions
If you are processing images captured by others there is nothing much to doabout the illumination (although a few methods will be presented in later chapters)which was probably the sun and/or some artificial lighting. When you, however, arein charge of the capturing process yourselves, it is of great importance to carefullythink about how the scene should be lit. In fact, for the field of Machine Vision itis a rule-of-thumb that illumination is 2/3 of the entire system design and softwareonly 1/3. To stress this point have a look at Fig. 2.3. The figure shows four imagesof the same person facing the camera. The only difference between the four imagesis the direction of the light source (a lamp) when the images were captured!
Another issue regarding the direction of the illumination is that care must betaken when pointing the illumination directly toward the camera. The reason be-ing that this might result in too bright an image or a nonuniform illumination, e.g.,a bright circle in the image. If, however, the outline of the object is the only infor-
10 2 Image Acquisition
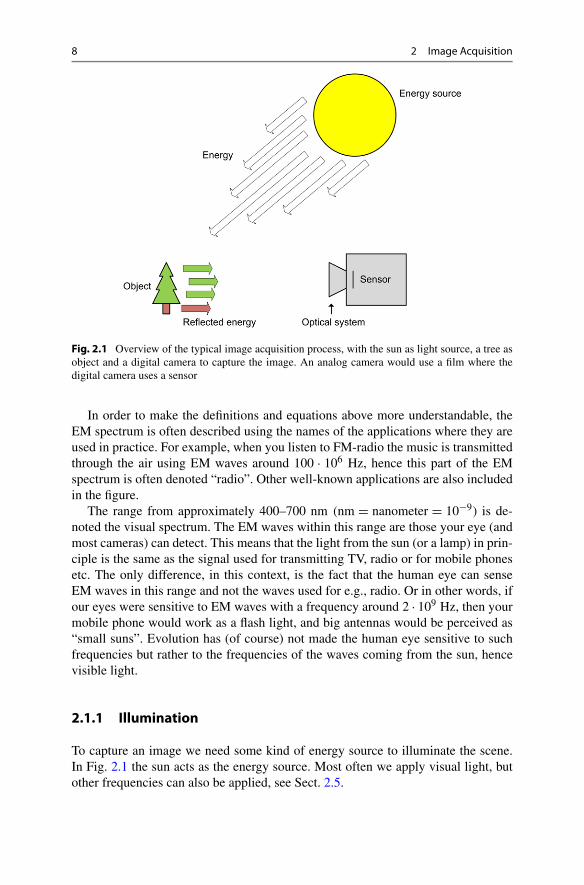
Fig. 2.4 Backlighting. The light source is behind the object of interest, which makes the objectstand out as a black silhouette. Note that the details inside the object are lost
mation of interest, then this way of illumination—denoted backlighting—can be anoptimal solution, see Fig. 2.4. Even when the illumination is not directed towardthe camera overly bright spots in the image might still occur. These are known ashighlights and are often a result of a shiny object surface, which reflects most ofthe illumination (similar to the effect of a mirror). A solution to such problems isoften to use some kind of diffuse illumination either in the form of a high numberof less-powerful light sources or by illuminating a rough surface which then reflectsthe light (randomly) toward the object.
Even though this text is about visual light as the energy form, it should be men-tioned that infrared illumination is sometimes useful. For example, when trackingthe movements of human body parts, e.g. for use in animations in motion pictures,infrared illumination is often applied. The idea is to add infrared reflecting markersto the human body parts, e.g., in the form of small balls. When the scene is illu-minated by infrared light, these markers will stand out and can therefore easily bedetected by image processing. A practical example of using infrared illumination isgiven in Chap. 12.
2.2 The Optical System
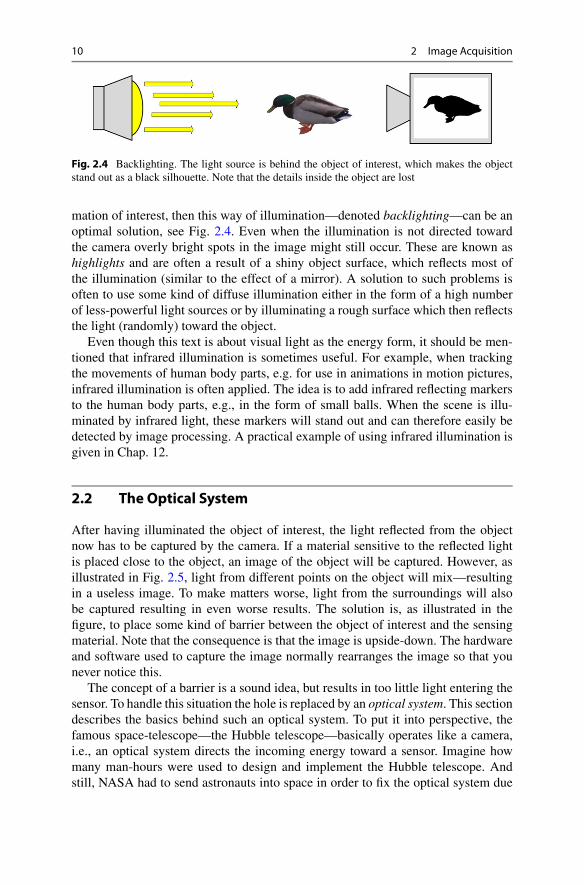
After having illuminated the object of interest, the light reflected from the objectnow has to be captured by the camera. If a material sensitive to the reflected lightis placed close to the object, an image of the object will be captured. However, asillustrated in Fig. 2.5, light from different points on the object will mix—resultingin a useless image. To make matters worse, light from the surroundings will alsobe captured resulting in even worse results. The solution is, as illustrated in thefigure, to place some kind of barrier between the object of interest and the sensingmaterial. Note that the consequence is that the image is upside-down. The hardwareand software used to capture the image normally rearranges the image so that younever notice this.
The concept of a barrier is a sound idea, but results in too little light entering thesensor. To handle this situation the hole is replaced by an optical system. This sectiondescribes the basics behind such an optical system. To put it into perspective, thefamous space-telescope—the Hubble telescope—basically operates like a camera,i.e., an optical system directs the incoming energy toward a sensor. Imagine howmany man-hours were used to design and implement the Hubble telescope. Andstill, NASA had to send astronauts into space in order to fix the optical system due
2.2 The Optical System 11
Fig. 2.5 Before introducing a barrier, the rays of light from different points on the tree hit multiplepoints on the sensor and in some cases even the same points. Introducing a barrier with a smallhole significantly reduces these problems
to an incorrect design. Building optical systems is indeed a complex science! Weshall not dwell on all the fine details and the following is therefore not accurate tothe last micro-meter, but the description will suffice and be correct for most usages.
2.2.1 The Lens
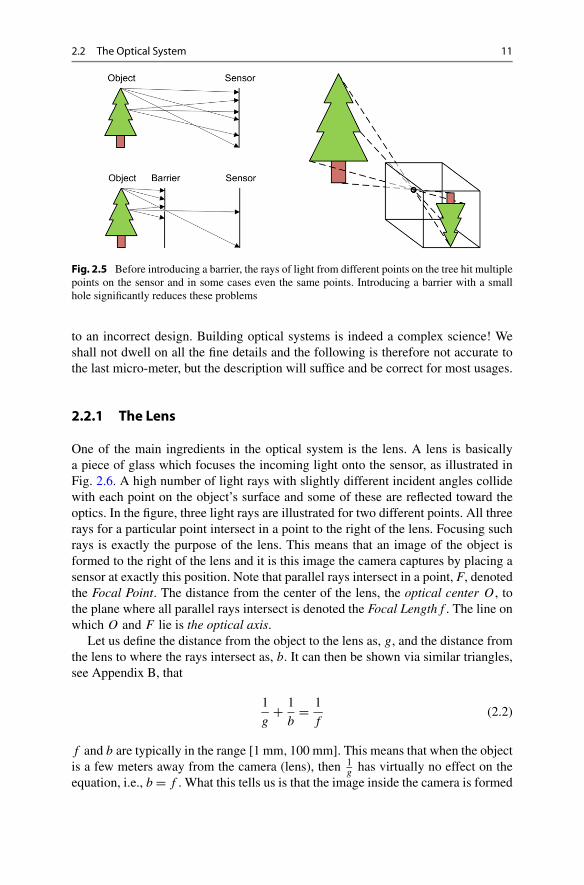
One of the main ingredients in the optical system is the lens. A lens is basicallya piece of glass which focuses the incoming light onto the sensor, as illustrated inFig. 2.6. A high number of light rays with slightly different incident angles collidewith each point on the object’s surface and some of these are reflected toward theoptics. In the figure, three light rays are illustrated for two different points. All threerays for a particular point intersect in a point to the right of the lens. Focusing suchrays is exactly the purpose of the lens. This means that an image of the object isformed to the right of the lens and it is this image the camera captures by placing asensor at exactly this position. Note that parallel rays intersect in a point, F, denotedthe Focal Point. The distance from the center of the lens, the optical center O , tothe plane where all parallel rays intersect is denoted the Focal Length f . The line onwhich O and F lie is the optical axis.
Let us define the distance from the object to the lens as, g, and the distance fromthe lens to where the rays intersect as, b. It can then be shown via similar triangles,see Appendix B, that
1
g+ 1
b= 1
f(2.2)
f and b are typically in the range [1 mm,100 mm]. This means that when the objectis a few meters away from the camera (lens), then 1
ghas virtually no effect on the
equation, i.e., b = f . What this tells us is that the image inside the camera is formed

12 2 Image Acquisition
Fig. 2.6 The figure showshow the rays from an object,here a light bulb, are focusedvia the lens. The real lightbulb is to the left and theimage formed by the lens is tothe right
at a distance very close to the focal point. Equation 2.2 is also called the thin lensequation.
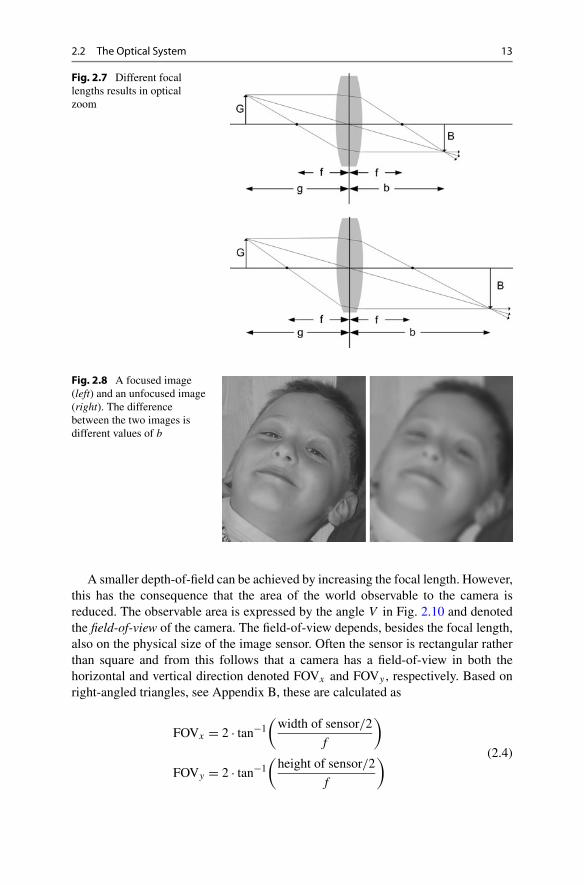
Another interesting aspect of the lens is that the size of the object in the image,B , increases as f increased. This is known as optical zoom. In practice f is changedby rearranging the optics, e.g., the distance between one or more lenses inside theoptical system.1 In Fig. 2.7 we show how optical zoom is achieved by changing thefocal length. When looking at Fig. 2.7 it can be shown via similar triangles that
b
B= g
G(2.3)
where G is the real height of the object. This can for example be used to computehow much a physical object will fill on the imaging censor chip, when the camera isplaced at a given distance away from the object.
Let us assume that we do not have a zoom-lens, i.e., f is constant. When wechange the distance from the object to the camera (lens), g, Eq. 2.2 shows us that b
should also be increased, meaning that the sensor has to be moved slightly furtheraway from the lens since the image will be formed there. In Fig. 2.8 the effect of notchanging b is shown. Such an image is said to be out of focus. So when you adjustfocus on your camera you are in fact changing b until the sensor is located at theposition where the image is formed.
The reason for an unfocused image is illustrated in Fig. 2.9. The sensor consistsof pixels, as will be described in the next section, and each pixel has a certain size.As long as the rays from one point stay inside one particular pixel, this pixel will befocused. If rays from other points also intersect the pixel in question, then the pixelwill receive light from more points and the resulting pixel value will be a mixture oflight from different points, i.e., it is unfocused.
Referring to Fig. 2.9 an object can be moved a distance of gl further away fromthe lens or a distance of gr closer to the lens and remain in focus. The sum of gl andgr defines the total range an object can be moved while remaining in focus. Thisrange is denoted as the depth-of-field.
1Optical zoom should not be confused with digital zoom, which is done through software.
2.2 The Optical System 13
Fig. 2.7 Different focallengths results in opticalzoom
Fig. 2.8 A focused image(left) and an unfocused image(right). The differencebetween the two images isdifferent values of b
A smaller depth-of-field can be achieved by increasing the focal length. However,this has the consequence that the area of the world observable to the camera isreduced. The observable area is expressed by the angle V in Fig. 2.10 and denotedthe field-of-view of the camera. The field-of-view depends, besides the focal length,also on the physical size of the image sensor. Often the sensor is rectangular ratherthan square and from this follows that a camera has a field-of-view in both thehorizontal and vertical direction denoted FOVx and FOVy , respectively. Based onright-angled triangles, see Appendix B, these are calculated as
FOVx = 2 · tan−1(
width of sensor/2
f
)
FOVy = 2 · tan−1(
height of sensor/2
f
) (2.4)
14 2 Image Acquisition
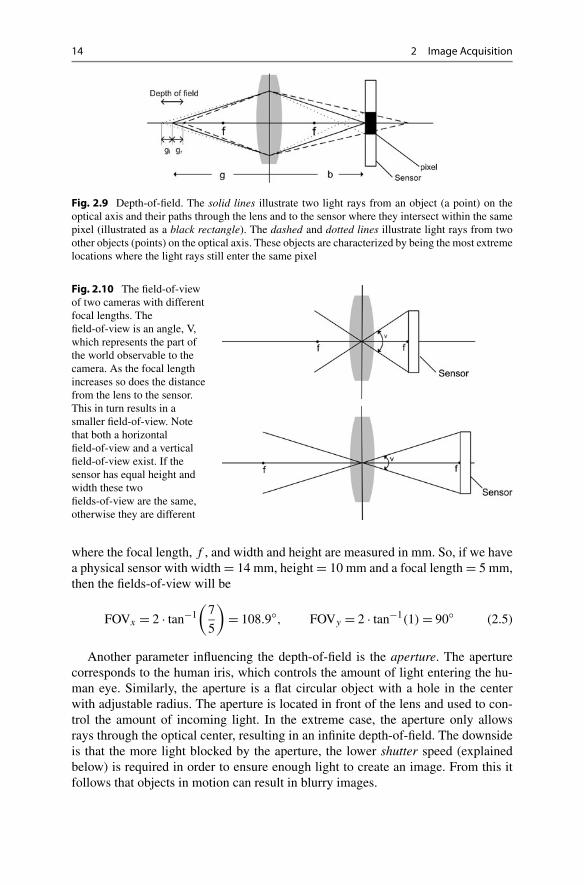
Fig. 2.9 Depth-of-field. The solid lines illustrate two light rays from an object (a point) on theoptical axis and their paths through the lens and to the sensor where they intersect within the samepixel (illustrated as a black rectangle). The dashed and dotted lines illustrate light rays from twoother objects (points) on the optical axis. These objects are characterized by being the most extremelocations where the light rays still enter the same pixel
Fig. 2.10 The field-of-viewof two cameras with differentfocal lengths. Thefield-of-view is an angle, V,which represents the part ofthe world observable to thecamera. As the focal lengthincreases so does the distancefrom the lens to the sensor.This in turn results in asmaller field-of-view. Notethat both a horizontalfield-of-view and a verticalfield-of-view exist. If thesensor has equal height andwidth these twofields-of-view are the same,otherwise they are different
where the focal length, f , and width and height are measured in mm. So, if we havea physical sensor with width = 14 mm, height = 10 mm and a focal length = 5 mm,then the fields-of-view will be
FOVx = 2 · tan−1(
7
5
)= 108.9◦, FOVy = 2 · tan−1(1) = 90◦ (2.5)
Another parameter influencing the depth-of-field is the aperture. The aperturecorresponds to the human iris, which controls the amount of light entering the hu-man eye. Similarly, the aperture is a flat circular object with a hole in the centerwith adjustable radius. The aperture is located in front of the lens and used to con-trol the amount of incoming light. In the extreme case, the aperture only allowsrays through the optical center, resulting in an infinite depth-of-field. The downsideis that the more light blocked by the aperture, the lower shutter speed (explainedbelow) is required in order to ensure enough light to create an image. From this itfollows that objects in motion can result in blurry images.
2.3 The Image Sensor 15
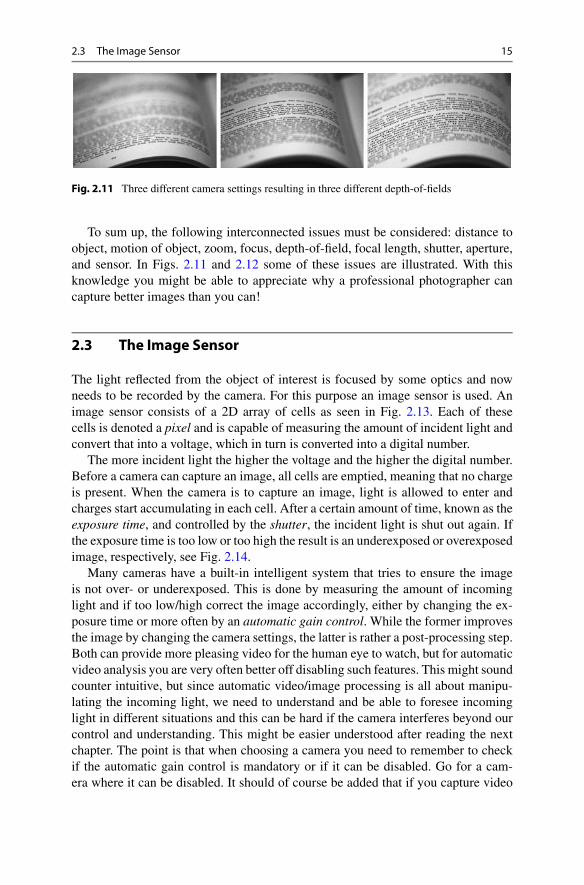
Fig. 2.11 Three different camera settings resulting in three different depth-of-fields
To sum up, the following interconnected issues must be considered: distance toobject, motion of object, zoom, focus, depth-of-field, focal length, shutter, aperture,and sensor. In Figs. 2.11 and 2.12 some of these issues are illustrated. With thisknowledge you might be able to appreciate why a professional photographer cancapture better images than you can!
2.3 The Image Sensor
The light reflected from the object of interest is focused by some optics and nowneeds to be recorded by the camera. For this purpose an image sensor is used. Animage sensor consists of a 2D array of cells as seen in Fig. 2.13. Each of thesecells is denoted a pixel and is capable of measuring the amount of incident light andconvert that into a voltage, which in turn is converted into a digital number.
The more incident light the higher the voltage and the higher the digital number.Before a camera can capture an image, all cells are emptied, meaning that no chargeis present. When the camera is to capture an image, light is allowed to enter andcharges start accumulating in each cell. After a certain amount of time, known as theexposure time, and controlled by the shutter, the incident light is shut out again. Ifthe exposure time is too low or too high the result is an underexposed or overexposedimage, respectively, see Fig. 2.14.
Many cameras have a built-in intelligent system that tries to ensure the imageis not over- or underexposed. This is done by measuring the amount of incominglight and if too low/high correct the image accordingly, either by changing the ex-posure time or more often by an automatic gain control. While the former improvesthe image by changing the camera settings, the latter is rather a post-processing step.Both can provide more pleasing video for the human eye to watch, but for automaticvideo analysis you are very often better off disabling such features. This might soundcounter intuitive, but since automatic video/image processing is all about manipu-lating the incoming light, we need to understand and be able to foresee incominglight in different situations and this can be hard if the camera interferes beyond ourcontrol and understanding. This might be easier understood after reading the nextchapter. The point is that when choosing a camera you need to remember to checkif the automatic gain control is mandatory or if it can be disabled. Go for a cam-era where it can be disabled. It should of course be added that if you capture video
16 2 Image Acquisition
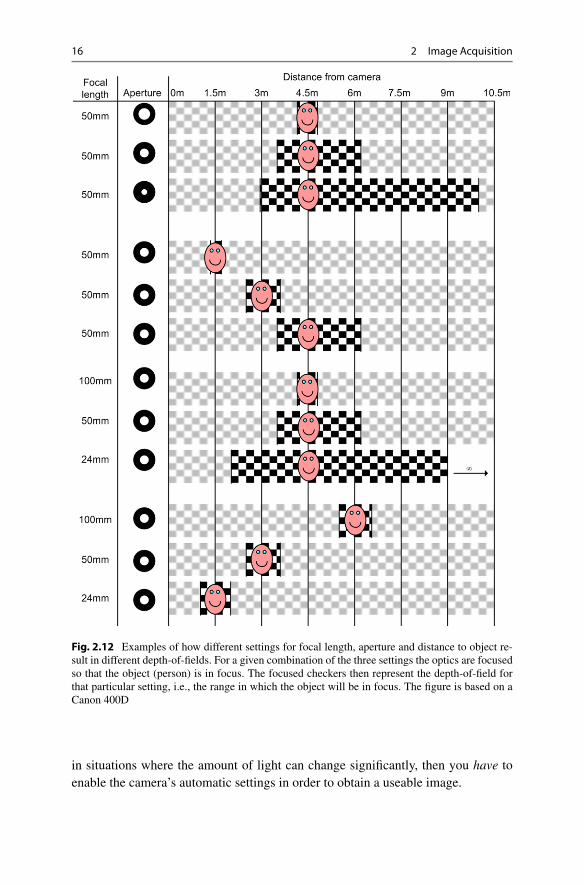
Fig. 2.12 Examples of how different settings for focal length, aperture and distance to object re-sult in different depth-of-fields. For a given combination of the three settings the optics are focusedso that the object (person) is in focus. The focused checkers then represent the depth-of-field forthat particular setting, i.e., the range in which the object will be in focus. The figure is based on aCanon 400D
in situations where the amount of light can change significantly, then you have toenable the camera’s automatic settings in order to obtain a useable image.
2.3 The Image Sensor 17
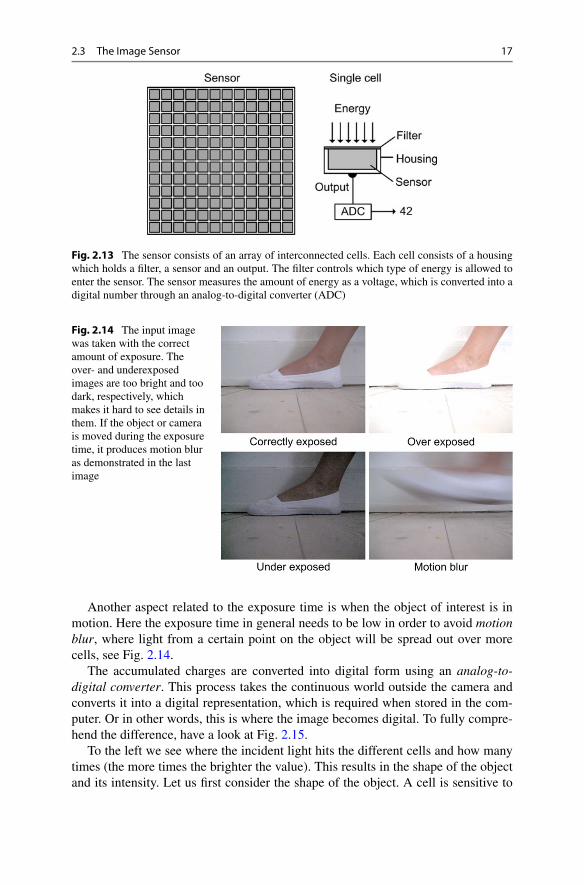
Fig. 2.13 The sensor consists of an array of interconnected cells. Each cell consists of a housingwhich holds a filter, a sensor and an output. The filter controls which type of energy is allowed toenter the sensor. The sensor measures the amount of energy as a voltage, which is converted into adigital number through an analog-to-digital converter (ADC)
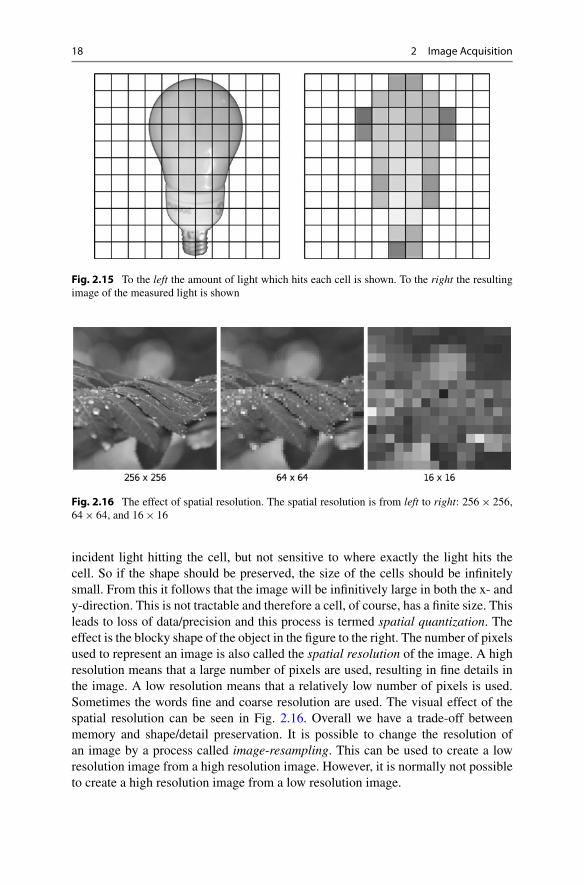
Fig. 2.14 The input imagewas taken with the correctamount of exposure. Theover- and underexposedimages are too bright and toodark, respectively, whichmakes it hard to see details inthem. If the object or camerais moved during the exposuretime, it produces motion bluras demonstrated in the lastimage
Another aspect related to the exposure time is when the object of interest is inmotion. Here the exposure time in general needs to be low in order to avoid motionblur, where light from a certain point on the object will be spread out over morecells, see Fig. 2.14.
The accumulated charges are converted into digital form using an analog-to-digital converter. This process takes the continuous world outside the camera andconverts it into a digital representation, which is required when stored in the com-puter. Or in other words, this is where the image becomes digital. To fully compre-hend the difference, have a look at Fig. 2.15.
To the left we see where the incident light hits the different cells and how manytimes (the more times the brighter the value). This results in the shape of the objectand its intensity. Let us first consider the shape of the object. A cell is sensitive to
18 2 Image Acquisition
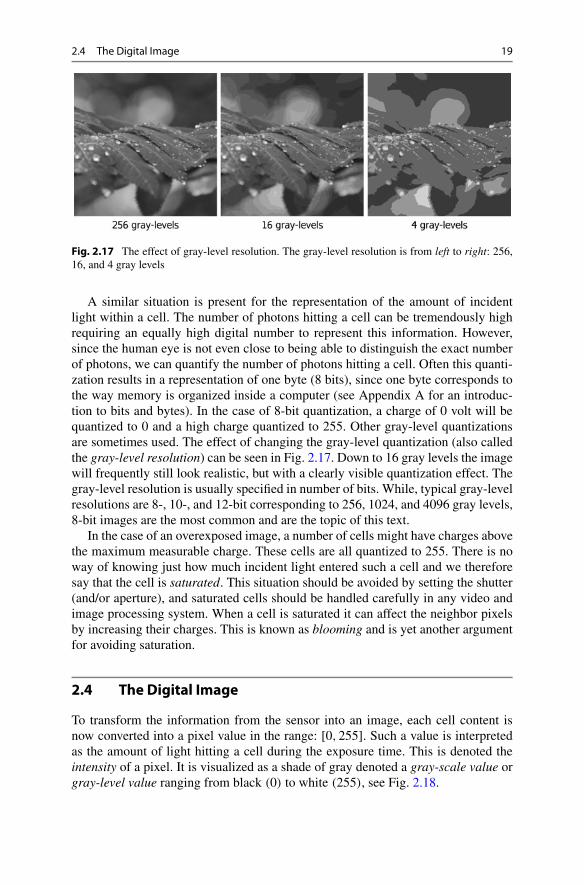
Fig. 2.15 To the left the amount of light which hits each cell is shown. To the right the resultingimage of the measured light is shown
Fig. 2.16 The effect of spatial resolution. The spatial resolution is from left to right: 256 × 256,64 × 64, and 16 × 16
incident light hitting the cell, but not sensitive to where exactly the light hits thecell. So if the shape should be preserved, the size of the cells should be infinitelysmall. From this it follows that the image will be infinitively large in both the x- andy-direction. This is not tractable and therefore a cell, of course, has a finite size. Thisleads to loss of data/precision and this process is termed spatial quantization. Theeffect is the blocky shape of the object in the figure to the right. The number of pixelsused to represent an image is also called the spatial resolution of the image. A highresolution means that a large number of pixels are used, resulting in fine details inthe image. A low resolution means that a relatively low number of pixels is used.Sometimes the words fine and coarse resolution are used. The visual effect of thespatial resolution can be seen in Fig. 2.16. Overall we have a trade-off betweenmemory and shape/detail preservation. It is possible to change the resolution ofan image by a process called image-resampling. This can be used to create a lowresolution image from a high resolution image. However, it is normally not possibleto create a high resolution image from a low resolution image.
2.4 The Digital Image 19
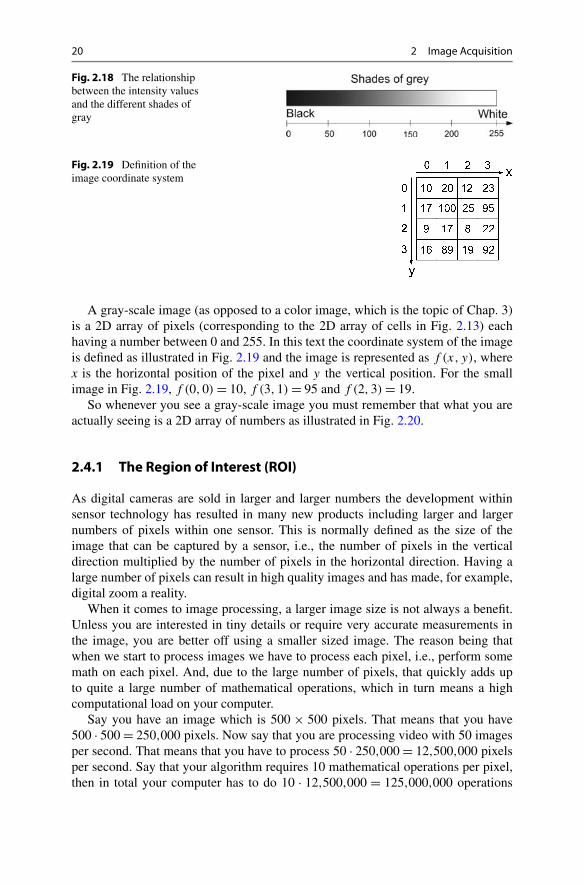
Fig. 2.17 The effect of gray-level resolution. The gray-level resolution is from left to right: 256,16, and 4 gray levels
A similar situation is present for the representation of the amount of incidentlight within a cell. The number of photons hitting a cell can be tremendously highrequiring an equally high digital number to represent this information. However,since the human eye is not even close to being able to distinguish the exact numberof photons, we can quantify the number of photons hitting a cell. Often this quanti-zation results in a representation of one byte (8 bits), since one byte corresponds tothe way memory is organized inside a computer (see Appendix A for an introduc-tion to bits and bytes). In the case of 8-bit quantization, a charge of 0 volt will bequantized to 0 and a high charge quantized to 255. Other gray-level quantizationsare sometimes used. The effect of changing the gray-level quantization (also calledthe gray-level resolution) can be seen in Fig. 2.17. Down to 16 gray levels the imagewill frequently still look realistic, but with a clearly visible quantization effect. Thegray-level resolution is usually specified in number of bits. While, typical gray-levelresolutions are 8-, 10-, and 12-bit corresponding to 256, 1024, and 4096 gray levels,8-bit images are the most common and are the topic of this text.
In the case of an overexposed image, a number of cells might have charges abovethe maximum measurable charge. These cells are all quantized to 255. There is noway of knowing just how much incident light entered such a cell and we thereforesay that the cell is saturated. This situation should be avoided by setting the shutter(and/or aperture), and saturated cells should be handled carefully in any video andimage processing system. When a cell is saturated it can affect the neighbor pixelsby increasing their charges. This is known as blooming and is yet another argumentfor avoiding saturation.
2.4 The Digital Image
To transform the information from the sensor into an image, each cell content isnow converted into a pixel value in the range: [0,255]. Such a value is interpretedas the amount of light hitting a cell during the exposure time. This is denoted theintensity of a pixel. It is visualized as a shade of gray denoted a gray-scale value orgray-level value ranging from black (0) to white (255), see Fig. 2.18.
20 2 Image Acquisition
Fig. 2.18 The relationshipbetween the intensity valuesand the different shades ofgray
Fig. 2.19 Definition of theimage coordinate system
A gray-scale image (as opposed to a color image, which is the topic of Chap. 3)is a 2D array of pixels (corresponding to the 2D array of cells in Fig. 2.13) eachhaving a number between 0 and 255. In this text the coordinate system of the imageis defined as illustrated in Fig. 2.19 and the image is represented as f (x, y), wherex is the horizontal position of the pixel and y the vertical position. For the smallimage in Fig. 2.19, f (0,0) = 10, f (3,1) = 95 and f (2,3) = 19.
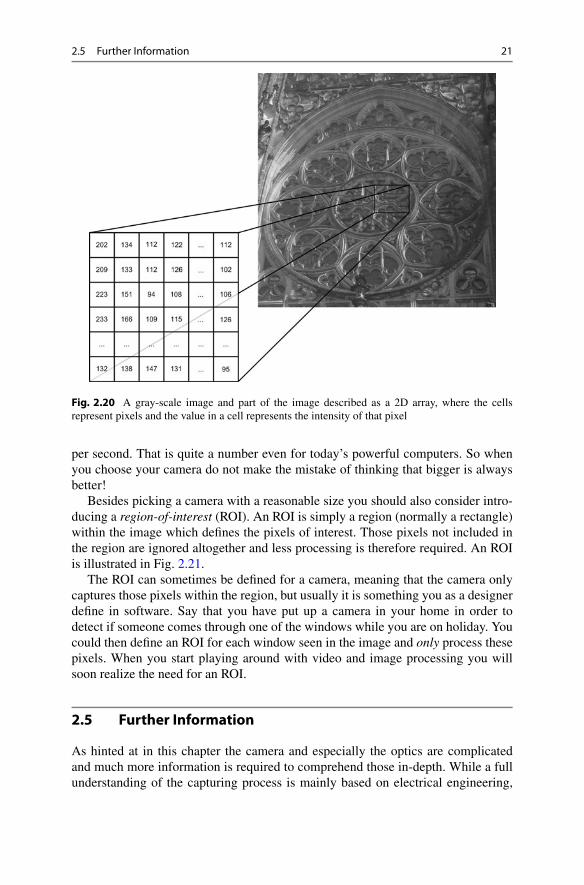
So whenever you see a gray-scale image you must remember that what you areactually seeing is a 2D array of numbers as illustrated in Fig. 2.20.
2.4.1 The Region of Interest (ROI)
As digital cameras are sold in larger and larger numbers the development withinsensor technology has resulted in many new products including larger and largernumbers of pixels within one sensor. This is normally defined as the size of theimage that can be captured by a sensor, i.e., the number of pixels in the verticaldirection multiplied by the number of pixels in the horizontal direction. Having alarge number of pixels can result in high quality images and has made, for example,digital zoom a reality.
When it comes to image processing, a larger image size is not always a benefit.Unless you are interested in tiny details or require very accurate measurements inthe image, you are better off using a smaller sized image. The reason being thatwhen we start to process images we have to process each pixel, i.e., perform somemath on each pixel. And, due to the large number of pixels, that quickly adds upto quite a large number of mathematical operations, which in turn means a highcomputational load on your computer.
Say you have an image which is 500 × 500 pixels. That means that you have500 · 500 = 250,000 pixels. Now say that you are processing video with 50 imagesper second. That means that you have to process 50 · 250,000 = 12,500,000 pixelsper second. Say that your algorithm requires 10 mathematical operations per pixel,then in total your computer has to do 10 · 12,500,000 = 125,000,000 operations
2.5 Further Information 21
Fig. 2.20 A gray-scale image and part of the image described as a 2D array, where the cellsrepresent pixels and the value in a cell represents the intensity of that pixel
per second. That is quite a number even for today’s powerful computers. So whenyou choose your camera do not make the mistake of thinking that bigger is alwaysbetter!
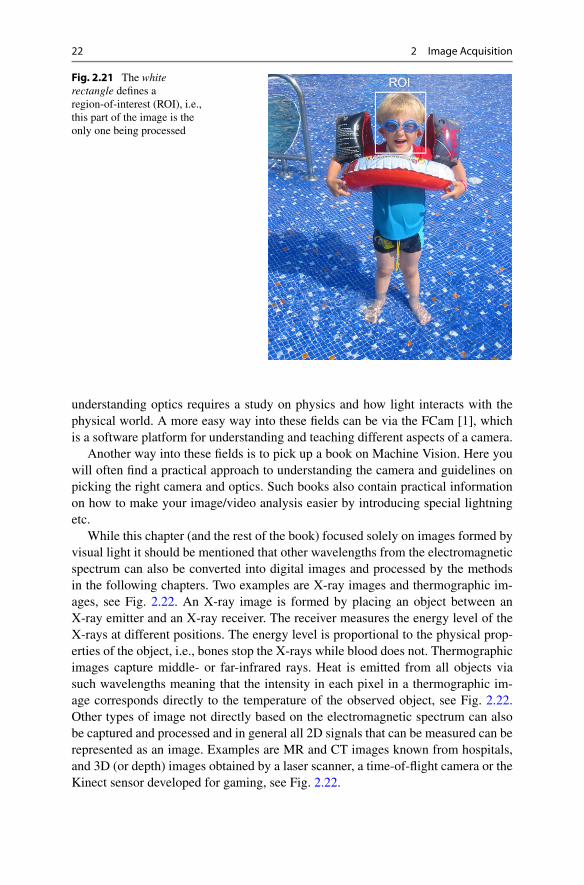
Besides picking a camera with a reasonable size you should also consider intro-ducing a region-of-interest (ROI). An ROI is simply a region (normally a rectangle)within the image which defines the pixels of interest. Those pixels not included inthe region are ignored altogether and less processing is therefore required. An ROIis illustrated in Fig. 2.21.
The ROI can sometimes be defined for a camera, meaning that the camera onlycaptures those pixels within the region, but usually it is something you as a designerdefine in software. Say that you have put up a camera in your home in order todetect if someone comes through one of the windows while you are on holiday. Youcould then define an ROI for each window seen in the image and only process thesepixels. When you start playing around with video and image processing you willsoon realize the need for an ROI.
2.5 Further Information
As hinted at in this chapter the camera and especially the optics are complicatedand much more information is required to comprehend those in-depth. While a fullunderstanding of the capturing process is mainly based on electrical engineering,
22 2 Image Acquisition
Fig. 2.21 The whiterectangle defines aregion-of-interest (ROI), i.e.,this part of the image is theonly one being processed
understanding optics requires a study on physics and how light interacts with thephysical world. A more easy way into these fields can be via the FCam [1], whichis a software platform for understanding and teaching different aspects of a camera.
Another way into these fields is to pick up a book on Machine Vision. Here youwill often find a practical approach to understanding the camera and guidelines onpicking the right camera and optics. Such books also contain practical informationon how to make your image/video analysis easier by introducing special lightningetc.
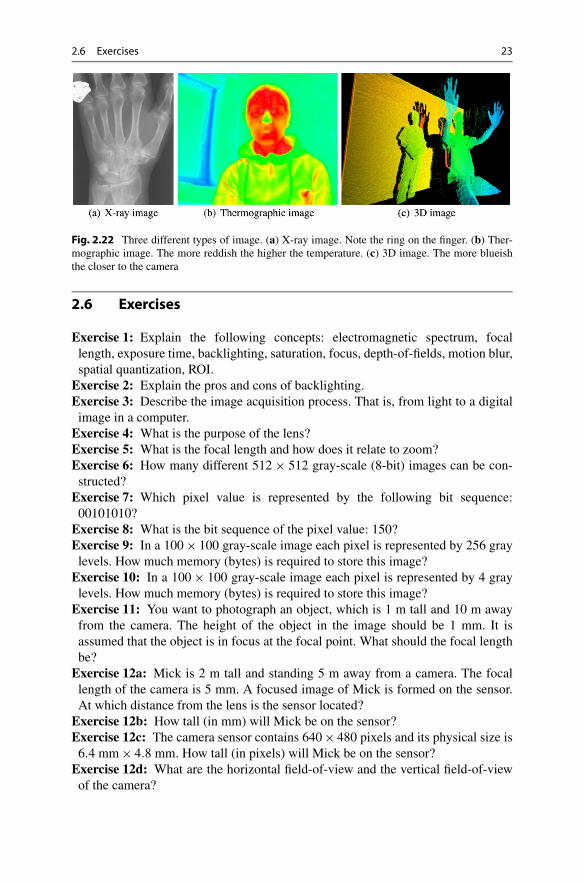
While this chapter (and the rest of the book) focused solely on images formed byvisual light it should be mentioned that other wavelengths from the electromagneticspectrum can also be converted into digital images and processed by the methodsin the following chapters. Two examples are X-ray images and thermographic im-ages, see Fig. 2.22. An X-ray image is formed by placing an object between anX-ray emitter and an X-ray receiver. The receiver measures the energy level of theX-rays at different positions. The energy level is proportional to the physical prop-erties of the object, i.e., bones stop the X-rays while blood does not. Thermographicimages capture middle- or far-infrared rays. Heat is emitted from all objects viasuch wavelengths meaning that the intensity in each pixel in a thermographic im-age corresponds directly to the temperature of the observed object, see Fig. 2.22.Other types of image not directly based on the electromagnetic spectrum can alsobe captured and processed and in general all 2D signals that can be measured can berepresented as an image. Examples are MR and CT images known from hospitals,and 3D (or depth) images obtained by a laser scanner, a time-of-flight camera or theKinect sensor developed for gaming, see Fig. 2.22.
2.6 Exercises 23
Fig. 2.22 Three different types of image. (a) X-ray image. Note the ring on the finger. (b) Ther-mographic image. The more reddish the higher the temperature. (c) 3D image. The more blueishthe closer to the camera
2.6 Exercises
Exercise 1: Explain the following concepts: electromagnetic spectrum, focallength, exposure time, backlighting, saturation, focus, depth-of-fields, motion blur,spatial quantization, ROI.
Exercise 2: Explain the pros and cons of backlighting.Exercise 3: Describe the image acquisition process. That is, from light to a digital
image in a computer.Exercise 4: What is the purpose of the lens?Exercise 5: What is the focal length and how does it relate to zoom?Exercise 6: How many different 512 × 512 gray-scale (8-bit) images can be con-
structed?Exercise 7: Which pixel value is represented by the following bit sequence:
00101010?Exercise 8: What is the bit sequence of the pixel value: 150?Exercise 9: In a 100 × 100 gray-scale image each pixel is represented by 256 gray
levels. How much memory (bytes) is required to store this image?Exercise 10: In a 100 × 100 gray-scale image each pixel is represented by 4 gray
levels. How much memory (bytes) is required to store this image?Exercise 11: You want to photograph an object, which is 1 m tall and 10 m away
from the camera. The height of the object in the image should be 1 mm. It isassumed that the object is in focus at the focal point. What should the focal lengthbe?
Exercise 12a: Mick is 2 m tall and standing 5 m away from a camera. The focallength of the camera is 5 mm. A focused image of Mick is formed on the sensor.At which distance from the lens is the sensor located?
Exercise 12b: How tall (in mm) will Mick be on the sensor?Exercise 12c: The camera sensor contains 640 × 480 pixels and its physical size is
6.4 mm × 4.8 mm. How tall (in pixels) will Mick be on the sensor?Exercise 12d: What are the horizontal field-of-view and the vertical field-of-view
of the camera?

24 2 Image Acquisition
Exercise 13: Show that 1g
+ 1b
= 1f
.
Additional exercise 1: How does the human eye capture light and how does thatrelate to the operations in a digital camera?
Additional exercise 2: How is auto-focus obtained in a digital camera?Additional exercise 3: How is night vision obtained in for example binoculars and
riflescopes?

http://www.springer.com/978-1-4471-2502-0