image acquisition and representation - doc...
TRANSCRIPT

Brent M. Dingle, Ph.D. 2015 Game Design and Development Program Mathematics, Statistics and Computer Science University of Wisconsin - Stout
Some Details
Image Acquisition and Representation
Lecture Objectives
• Previously – Image Acquisition and Generation – Image Display and Image Perception – HTML5 and Canvas
• Today – Brief summary of direction of study – What is a Digital Image?
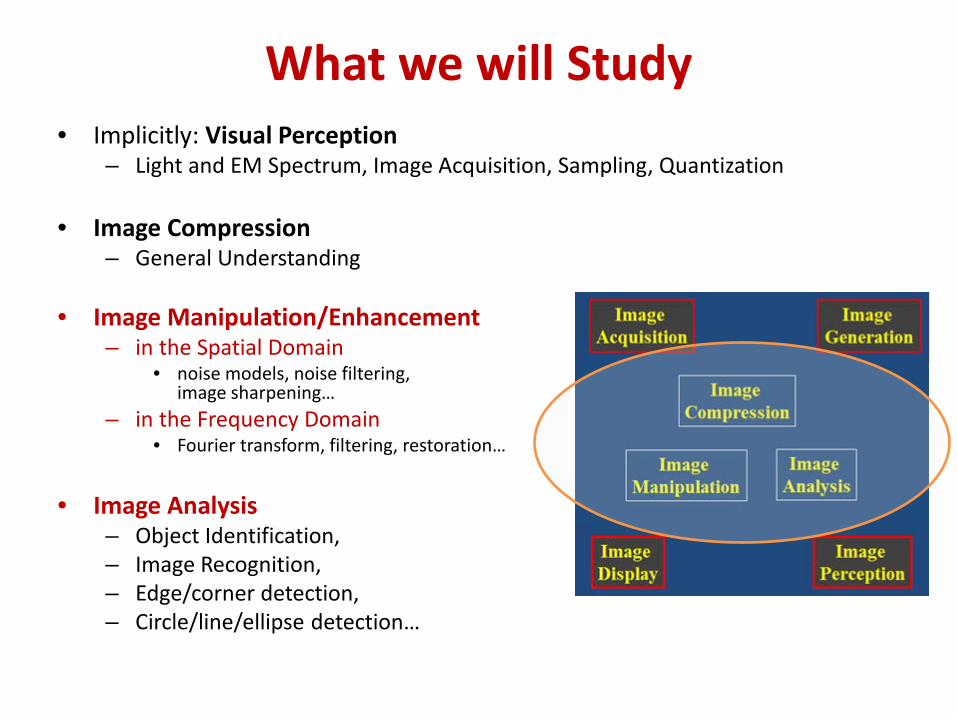
What we will Study • Implicitly: Visual Perception
– Light and EM Spectrum, Image Acquisition, Sampling, Quantization
• Image Compression – General Understanding
• Image Manipulation/Enhancement
– in the Spatial Domain • noise models, noise filtering,
image sharpening… – in the Frequency Domain
• Fourier transform, filtering, restoration…
• Image Analysis – Object Identification, – Image Recognition, – Edge/corner detection, – Circle/line/ellipse detection…
What’s useful in this? • Reasons for Compression
– Image data needs to be accessed at different time or location – Limited storage space and transmission bandwidth
• Reasons for Manipulation
– Image data acquisition was non-ideal, transmission was corrupted, or display device is less than optimal
• reasons for restoration, enhancement, interpolation… – Image data may contain sensitive content
• hide copyright, prevent counterfeit and forgery
• Reasons for Analysis – Reduce burden and error of human operators via automation – Allow a computer to “see” for various AI tasks

What we will Discover
• Digital Image Processing connects many dots – Linear Algebra, Matrix Theory and Statistics – Calculus and Fourier Transforms and Wavelets – AI, Neuroscience, and Psychology
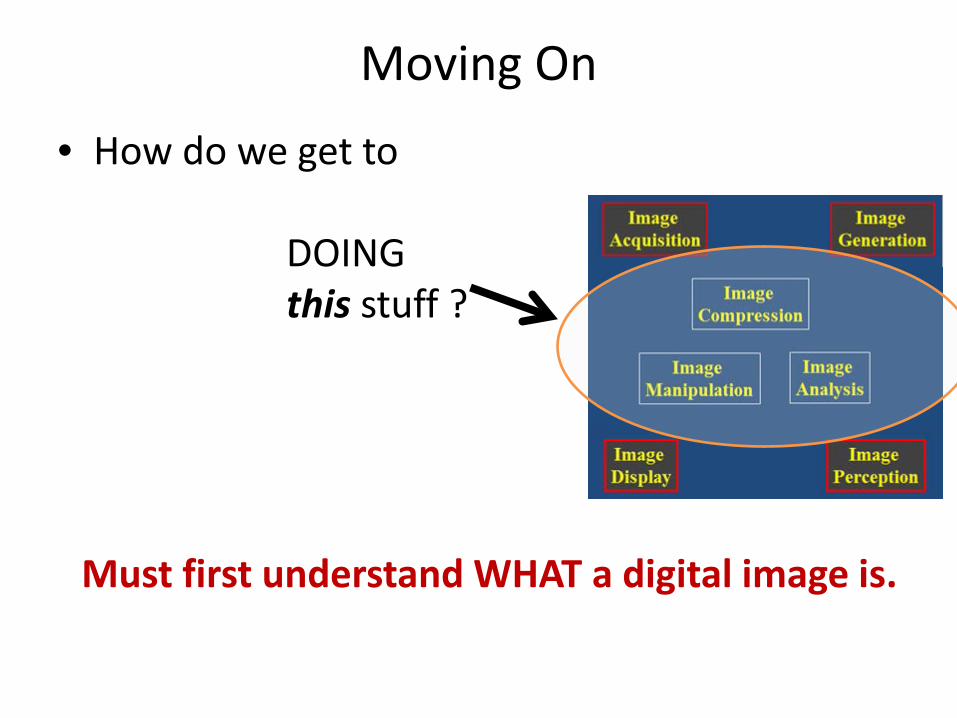
Moving On
• How do we get to DOING this stuff ?
Must first understand WHAT a digital image is.
What is a Digital Image?
• Recall – Digital Image Processing (DIP)
• Is computer manipulation of pictures, or images, that have been converted into numeric form
• Implies a Digital Image
– Is a picture or image converted to numeric form
• Let us look at what that really means…
What is a Digital Image?
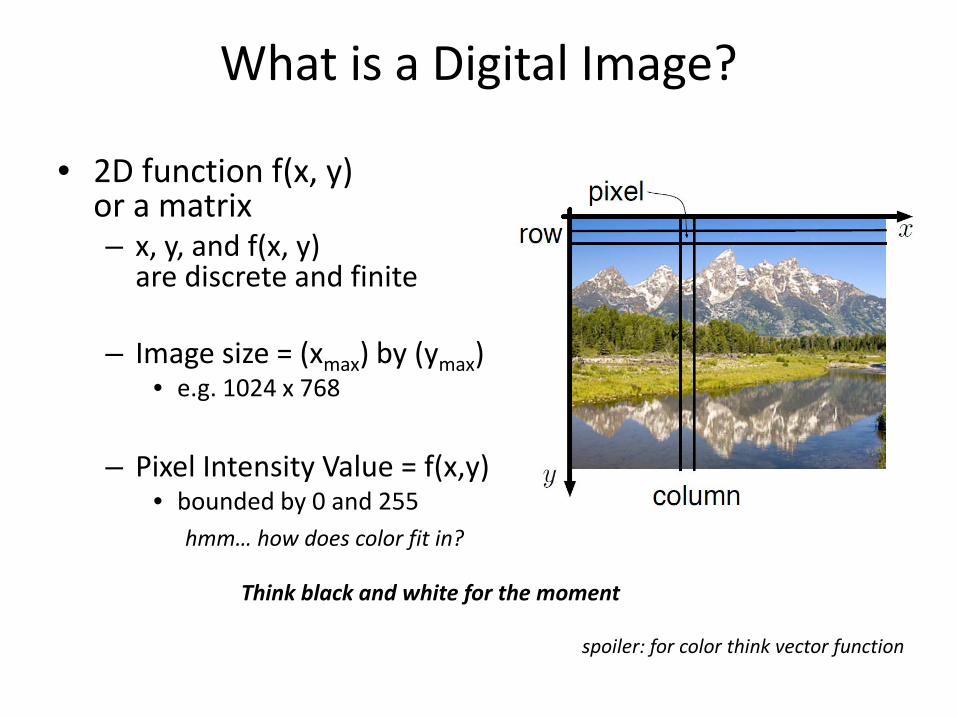
• 2D function f(x, y) or a matrix – x, y, and f(x, y)
are discrete and finite
– Image size = (xmax) by (ymax) • e.g. 1024 x 768
– Pixel Intensity Value = f(x,y)
• bounded by 0 and 255 hmm… how does color fit in?
Think black and white for the moment
spoiler: for color think vector function
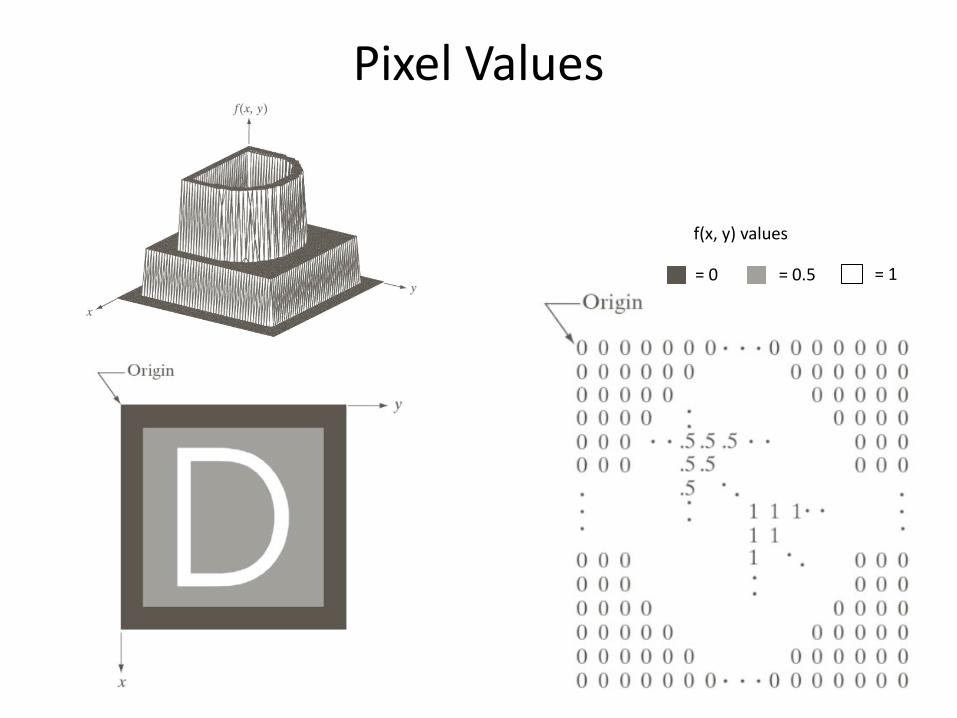
Pixel Values
= 0 = 0.5 = 1
f(x, y) values

How do we get the numbers?
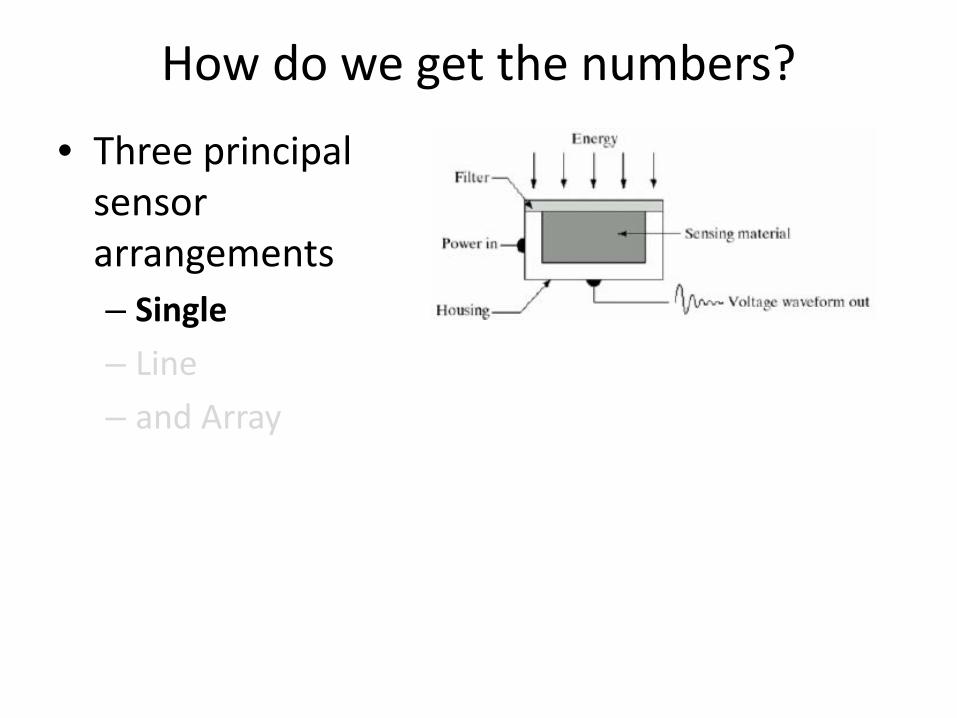
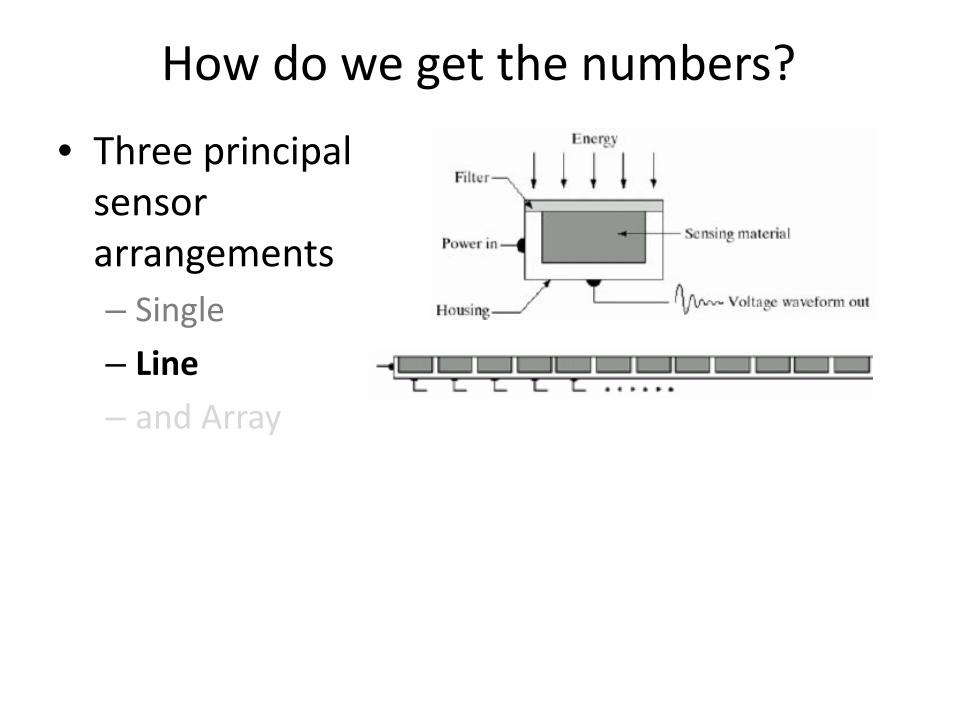
• Three principal sensor arrangements
How do we get the numbers?
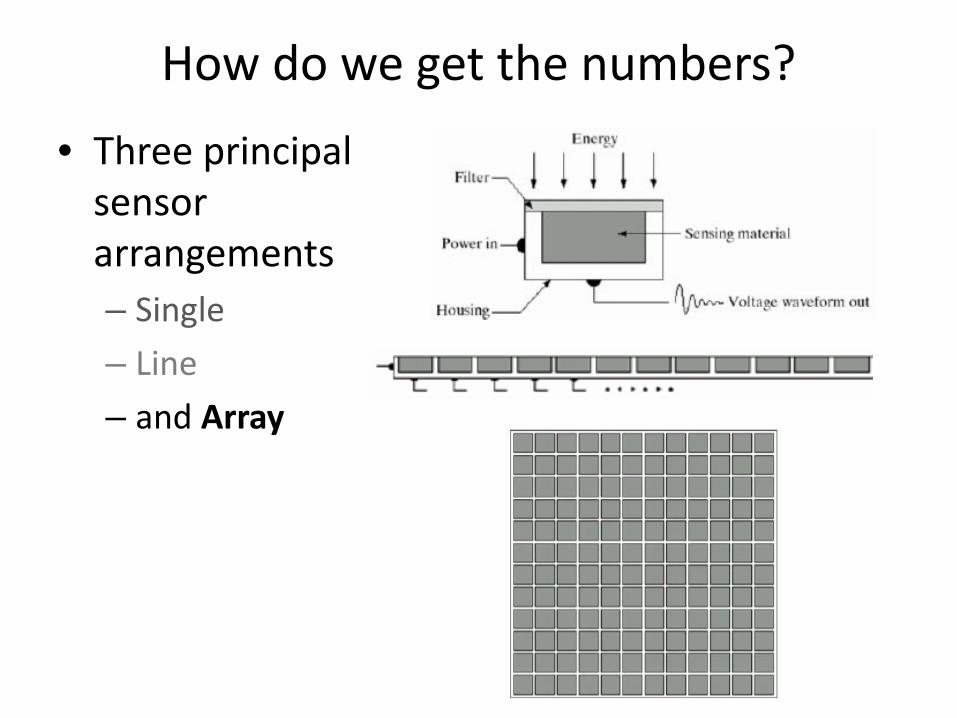
• Three principal sensor arrangements – Single – Line – and Array
How do we get the numbers?
• Three principal sensor arrangements – Single – Line – and Array
How do we get the numbers?
• Three principal sensor arrangements – Single – Line – and Array
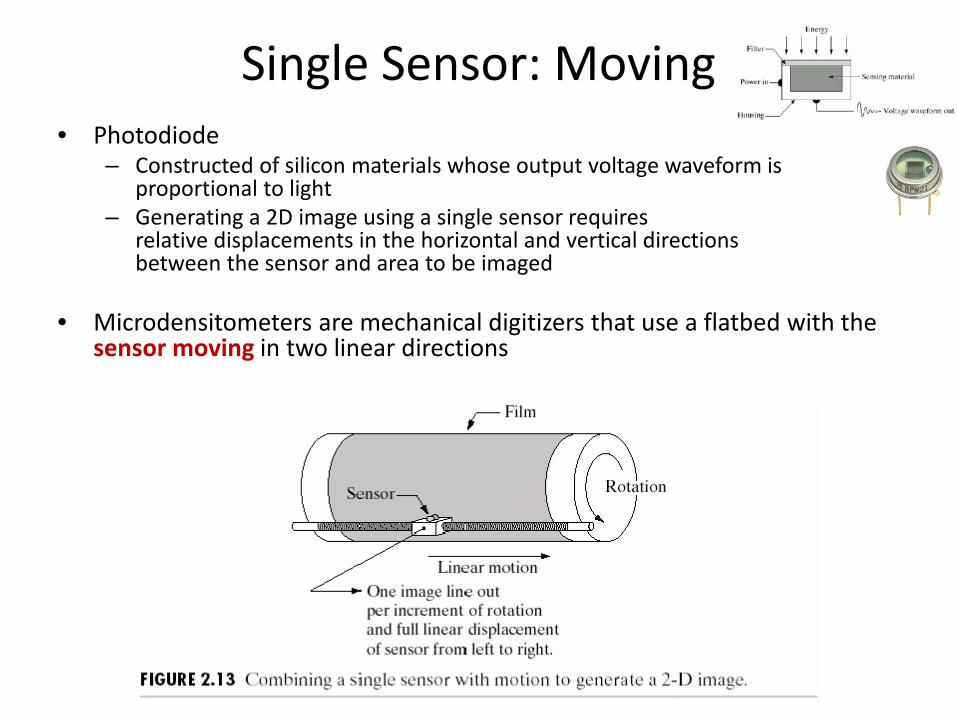
Single Sensor: Moving • Photodiode
– Constructed of silicon materials whose output voltage waveform is proportional to light
– Generating a 2D image using a single sensor requires relative displacements in the horizontal and vertical directions between the sensor and area to be imaged
• Microdensitometers are mechanical digitizers that use a flatbed with the sensor moving in two linear directions
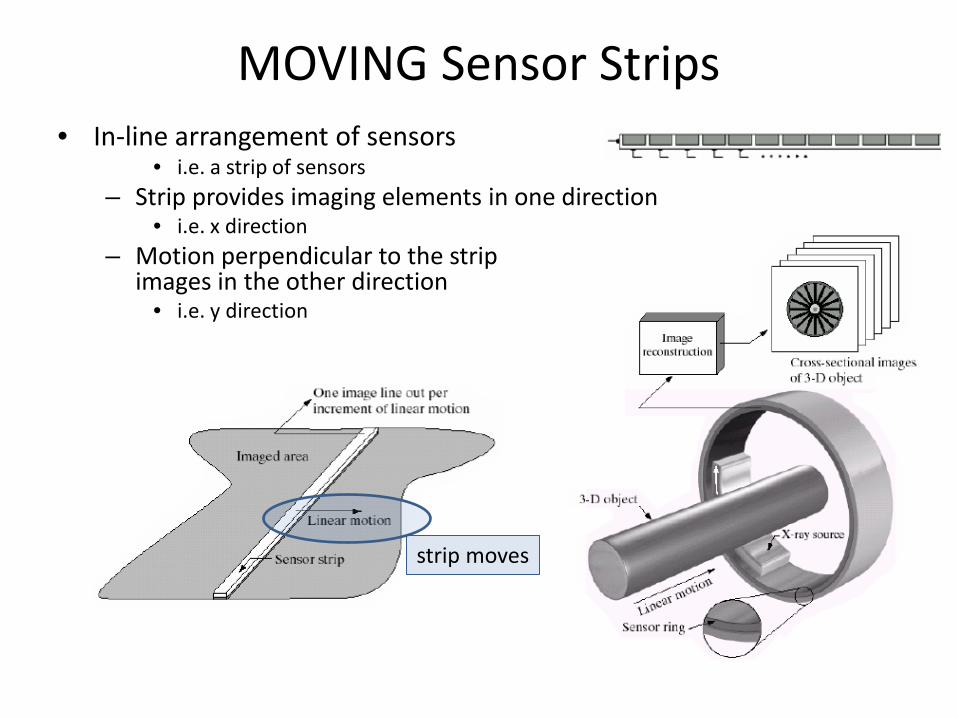
MOVING Sensor Strips • In-line arrangement of sensors
• i.e. a strip of sensors – Strip provides imaging elements in one direction
• i.e. x direction – Motion perpendicular to the strip
images in the other direction • i.e. y direction
strip moves
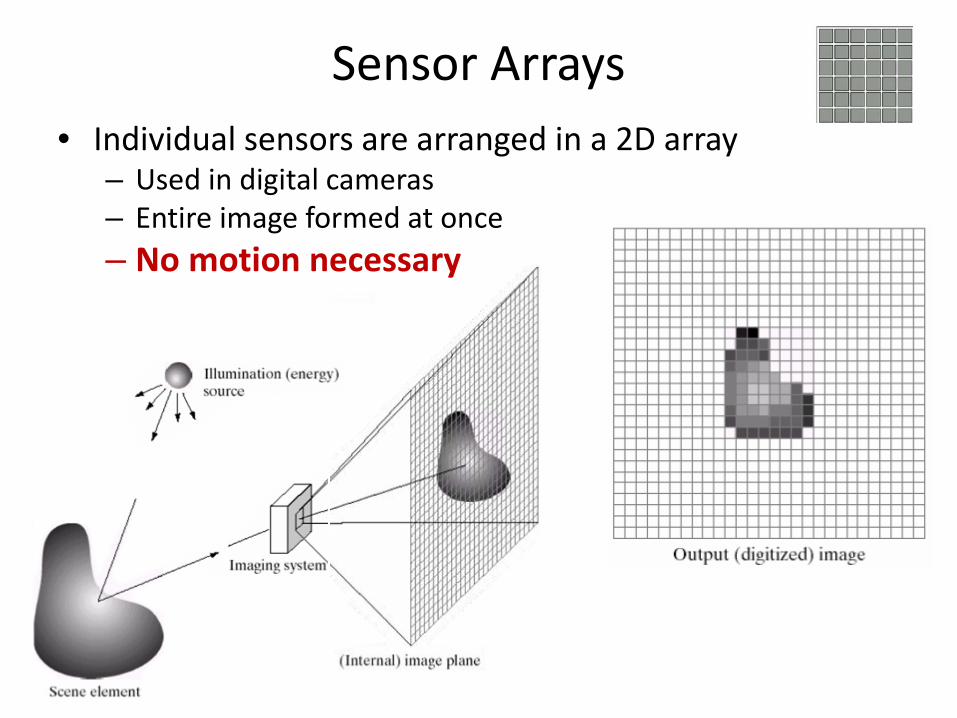
Sensor Arrays • Individual sensors are arranged in a 2D array
– Used in digital cameras – Entire image formed at once – No motion necessary
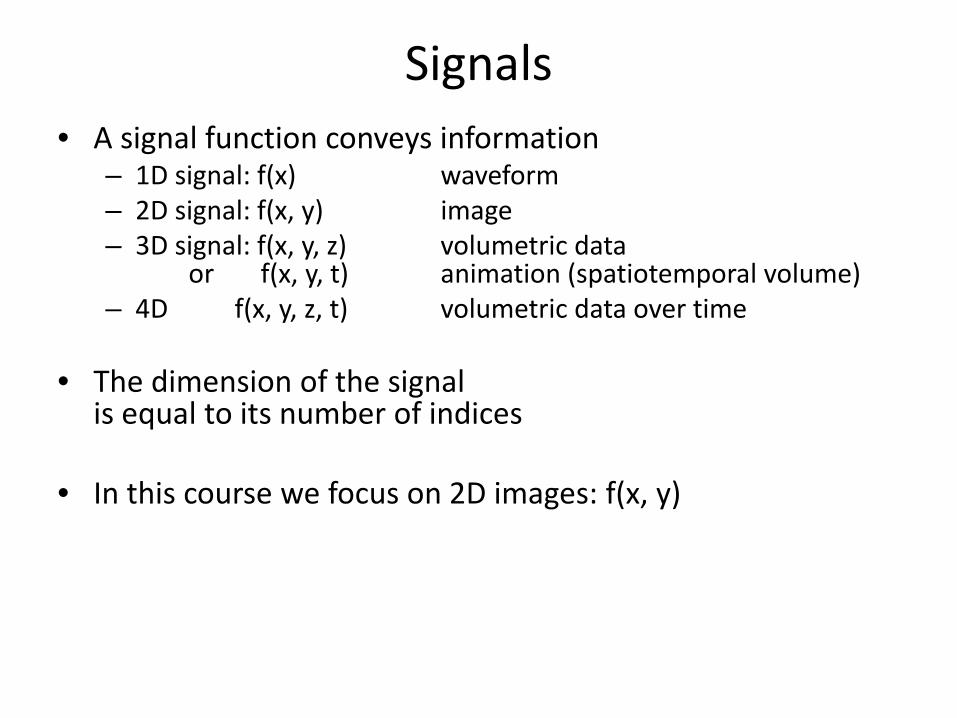
Signals • A signal function conveys information
– 1D signal: f(x) waveform – 2D signal: f(x, y) image – 3D signal: f(x, y, z) volumetric data
or f(x, y, t) animation (spatiotemporal volume) – 4D f(x, y, z, t) volumetric data over time
• The dimension of the signal
is equal to its number of indices
• In this course we focus on 2D images: f(x, y)
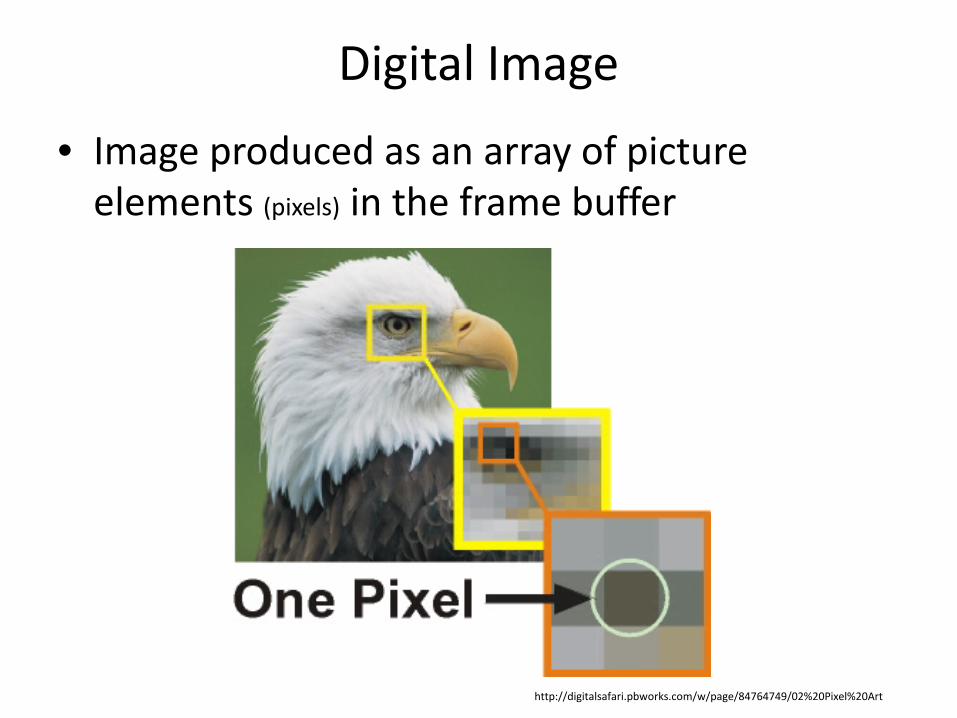
Digital Image
• Image produced as an array of picture elements (pixels) in the frame buffer
http://digitalsafari.pbworks.com/w/page/84764749/02%20Pixel%20Art
Image Classification • Images can be classified by
– whether they are defined over all points in the spatial domain – and whether their image values have finite or infinite precision
– If the position variables (x, y) are continuous
then the function is defined over all points in the spatial domain
– If (x,y) is discrete then the function can be sampled at only a finite set of points (i.e. the integers)
– The value that a function returns can also be classified by its precision, independently of x and y
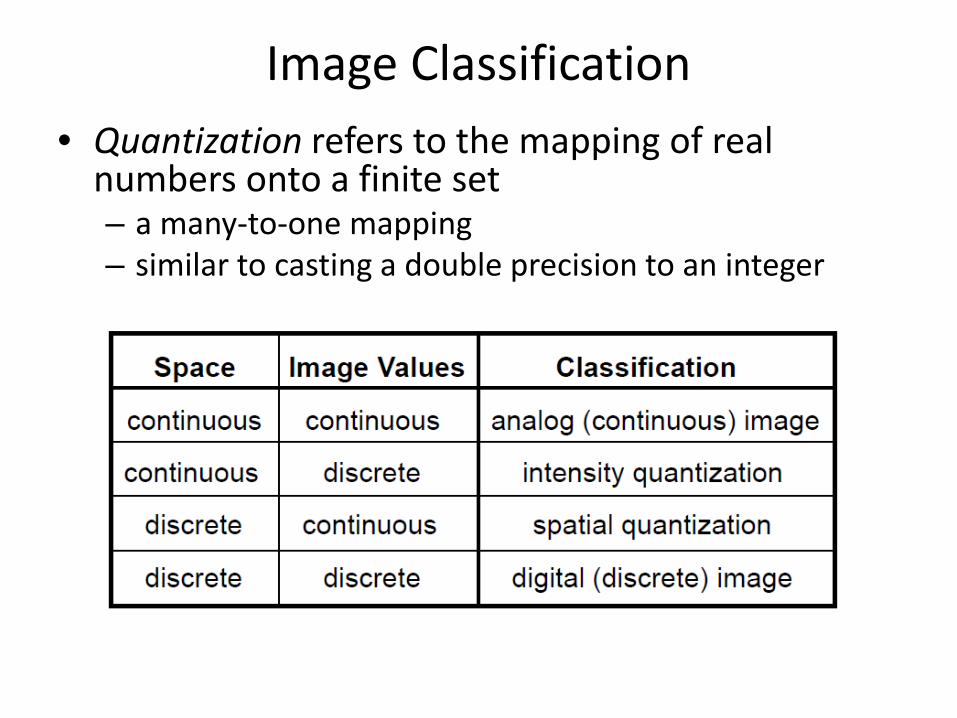
Image Classification • Quantization refers to the mapping of real
numbers onto a finite set – a many-to-one mapping – similar to casting a double precision to an integer
Digital Image: Summary
• Digital Image Processing (DIP) • Is computer manipulation of pictures, or images, that
have been converted into numeric form
• A Digital Image
• Is a picture or image converted to numeric form • In grey-scale the image can be thought of as
– 2D function f(x, y) or a matrix – x, y, and f(x, y) are discrete and finite – Image size = (xmax) by (ymax), e.g. 1024 x 768 – Pixel Intensity Value = f(x,y) ∈ [0, 255]
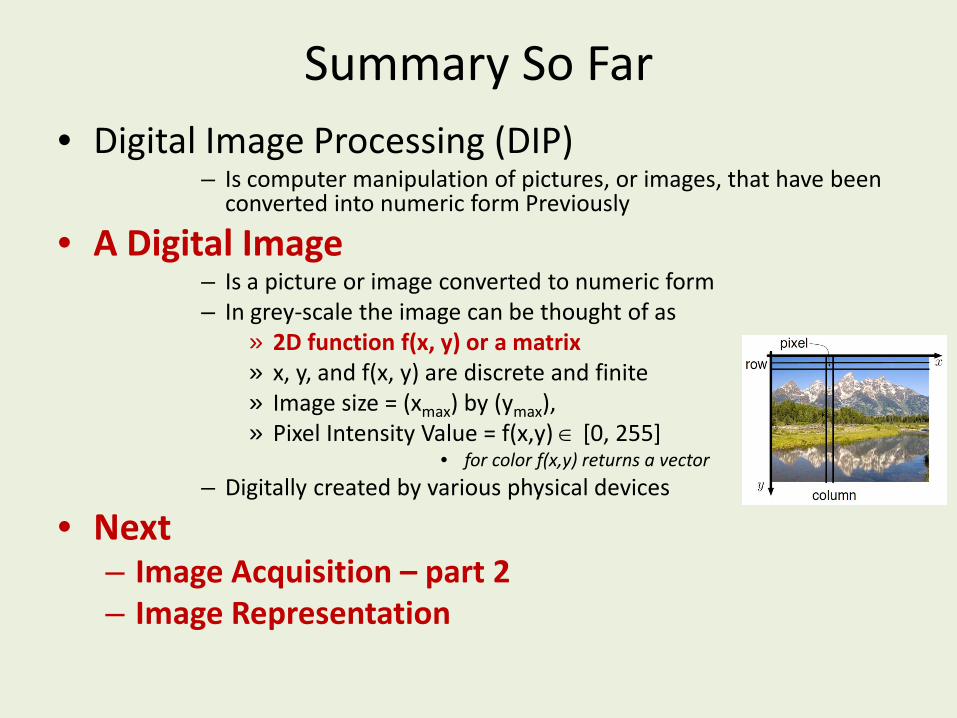
Summary So Far • Digital Image Processing (DIP)
– Is computer manipulation of pictures, or images, that have been converted into numeric form Previously
• A Digital Image – Is a picture or image converted to numeric form – In grey-scale the image can be thought of as
» 2D function f(x, y) or a matrix » x, y, and f(x, y) are discrete and finite » Image size = (xmax) by (ymax), » Pixel Intensity Value = f(x,y) ∈ [0, 255]
• for color f(x,y) returns a vector – Digitally created by various physical devices
• Next – Image Acquisition – part 2 – Image Representation
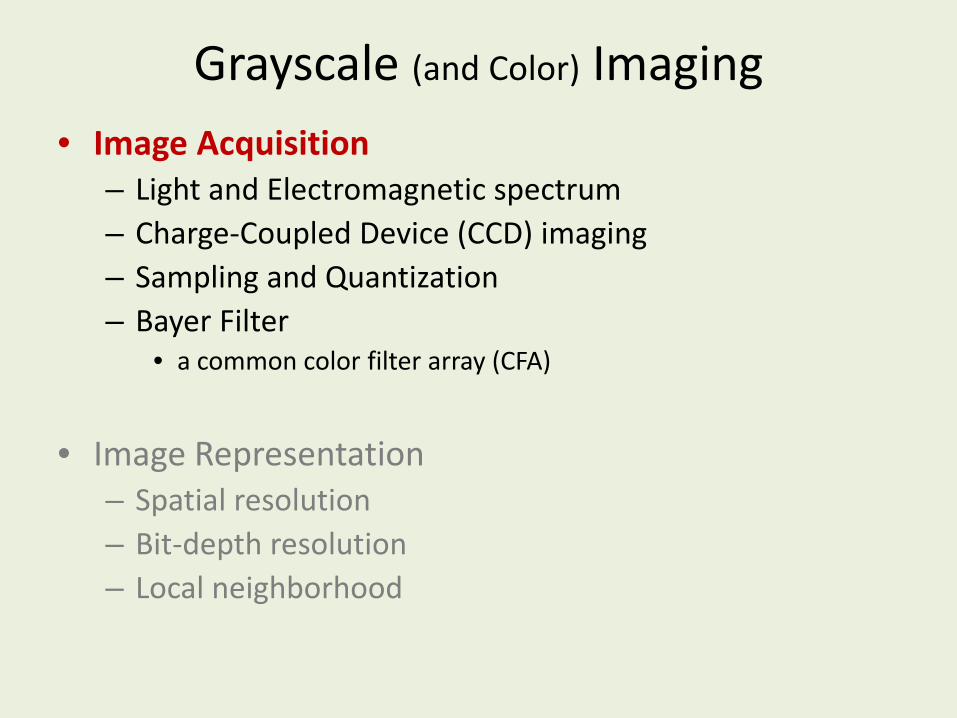
Grayscale (and Color) Imaging • Image Acquisition
– Light and Electromagnetic spectrum – Charge-Coupled Device (CCD) imaging – Sampling and Quantization – Bayer Filter
• a common color filter array (CFA)
• Image Representation
– Spatial resolution – Bit-depth resolution – Local neighborhood
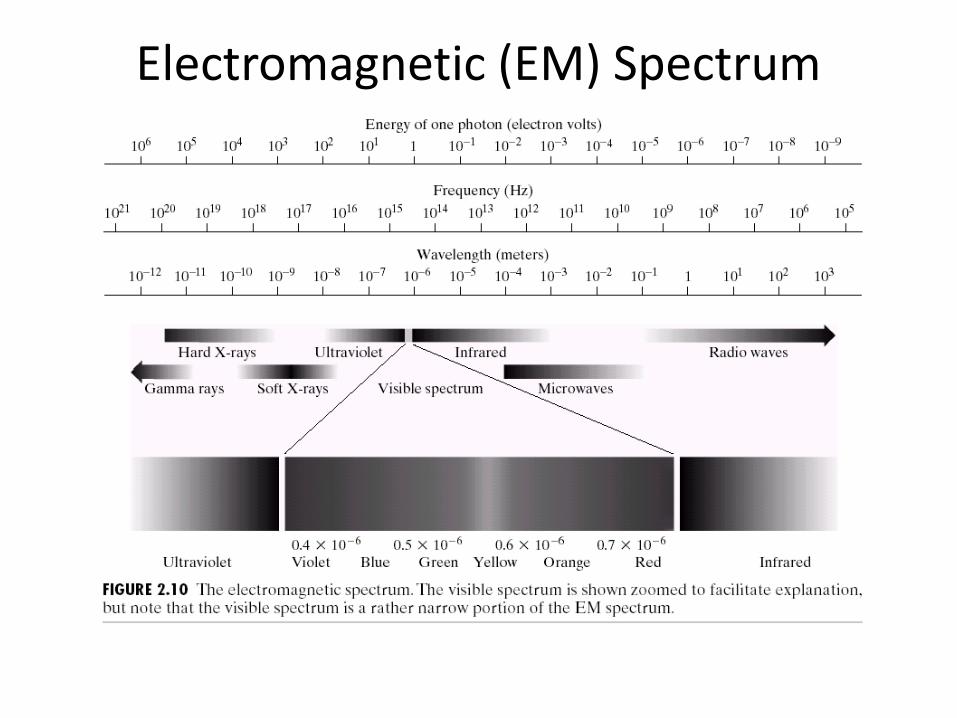
Electromagnetic (EM) Spectrum
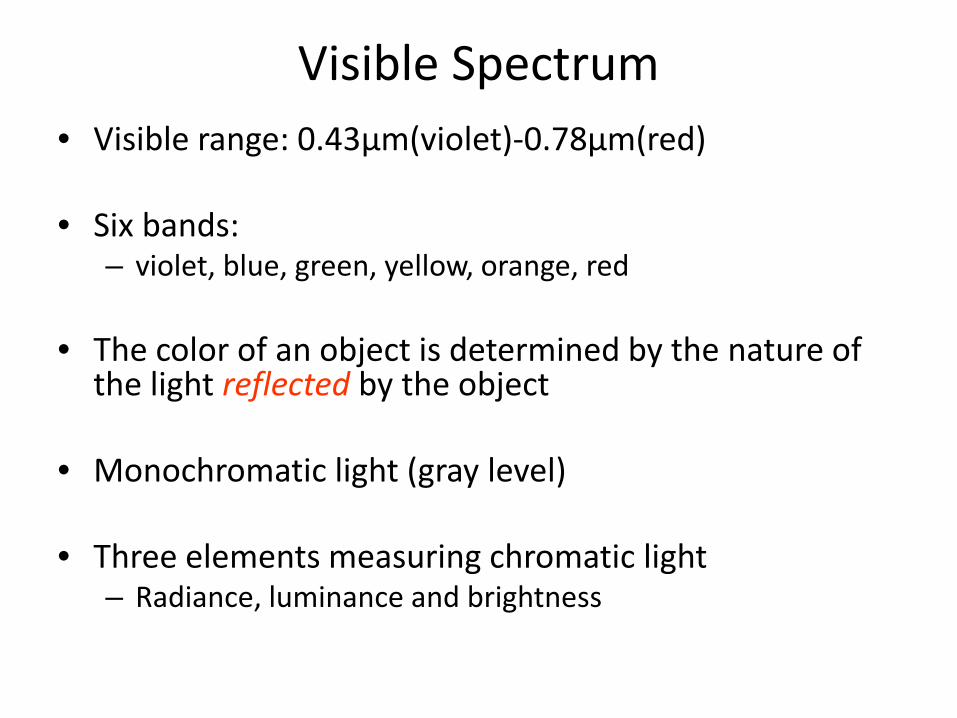
Visible Spectrum • Visible range: 0.43µm(violet)-0.78µm(red)
• Six bands:
– violet, blue, green, yellow, orange, red
• The color of an object is determined by the nature of the light reflected by the object
• Monochromatic light (gray level)
• Three elements measuring chromatic light – Radiance, luminance and brightness
Questions so far
• Questions on EM spectrum?
• Image Acquisition – Light and Electromagnetic spectrum – Charge-Coupled Device (CCD) imaging – Sampling and Quantization – Bayer Filter
• a common color filter array (CFA)
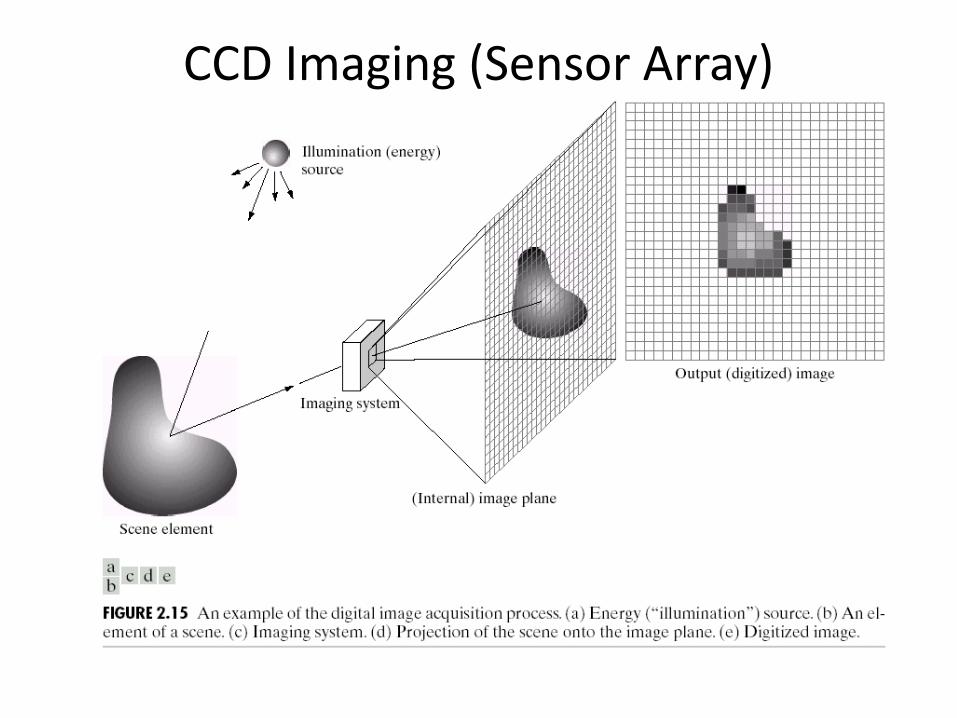
CCD Imaging (Sensor Array)
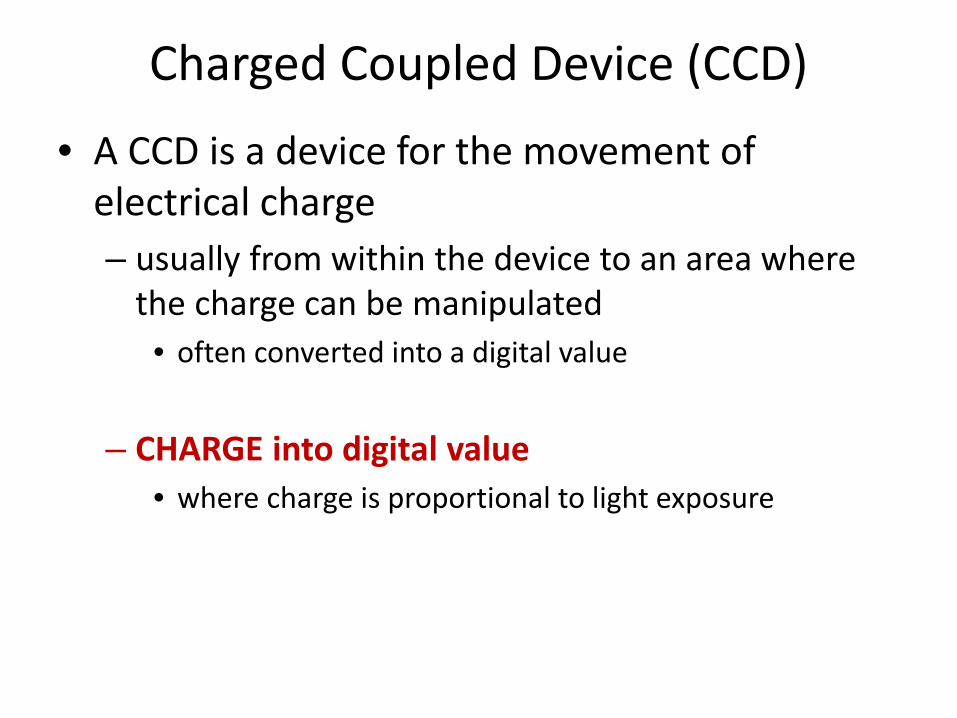
Charged Coupled Device (CCD)
• A CCD is a device for the movement of electrical charge – usually from within the device to an area where
the charge can be manipulated • often converted into a digital value
– CHARGE into digital value • where charge is proportional to light exposure
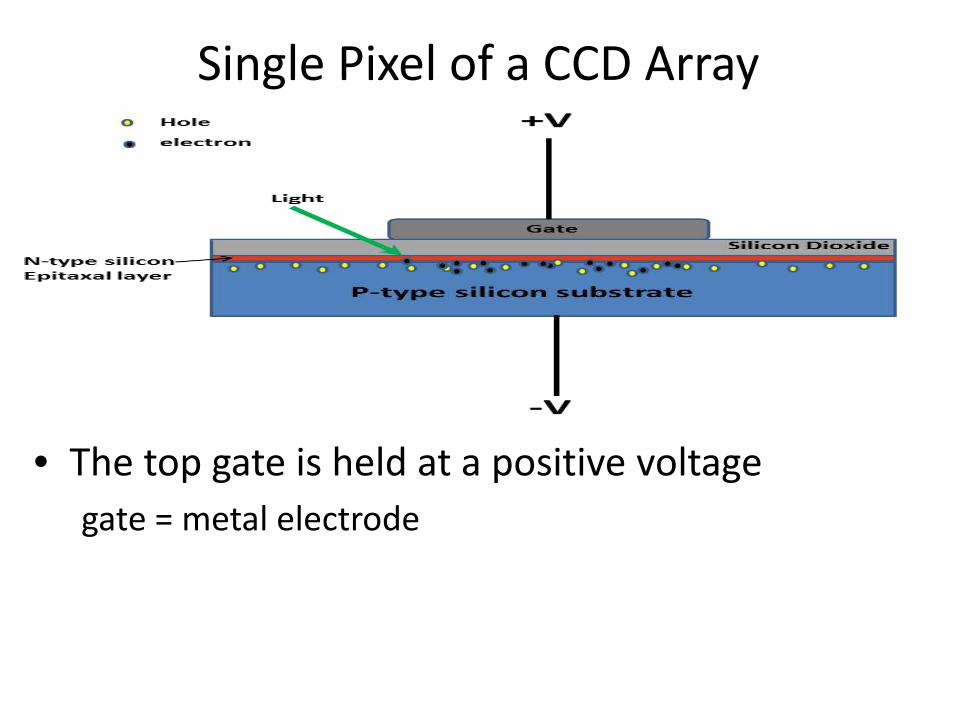
Single Pixel of a CCD Array
• The top gate is held at a positive voltage gate = metal electrode
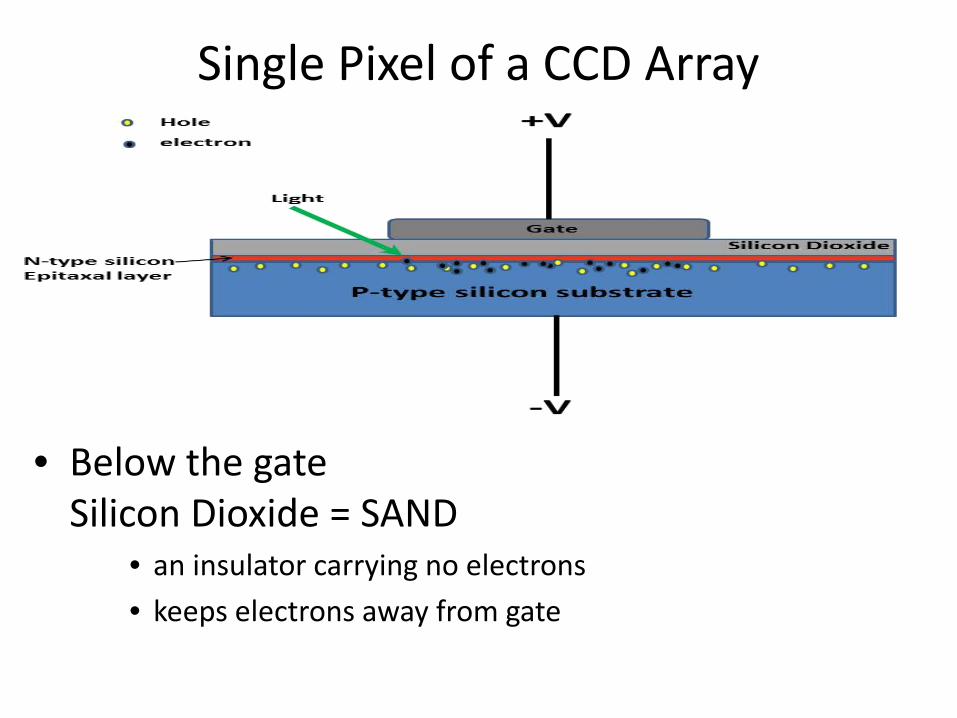
Single Pixel of a CCD Array
• Below the gate Silicon Dioxide = SAND
• an insulator carrying no electrons • keeps electrons away from gate
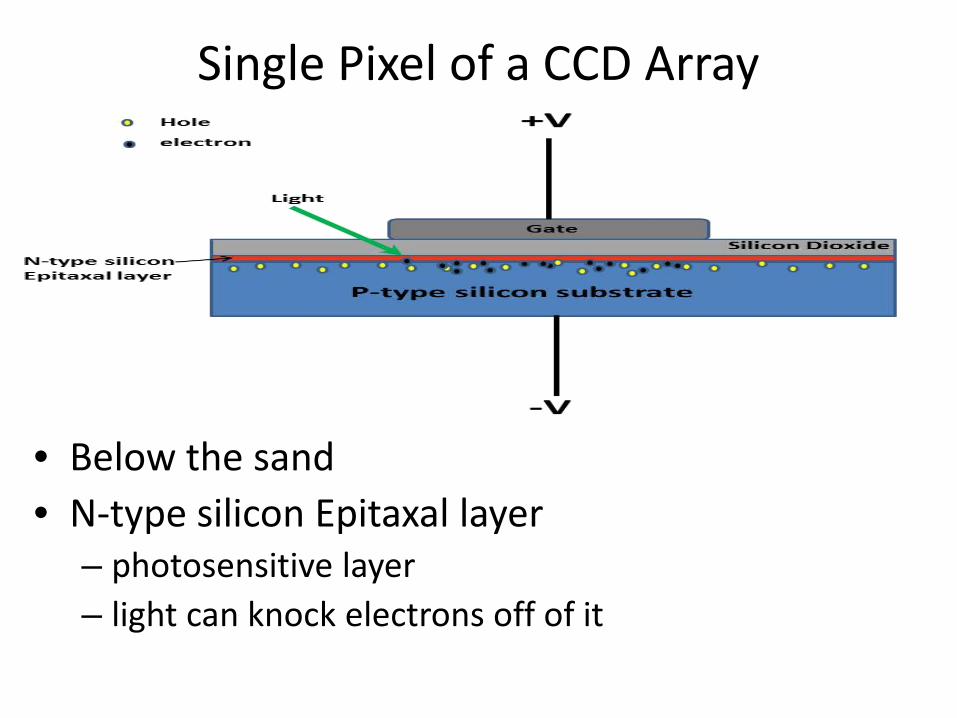
Single Pixel of a CCD Array
• Below the sand • N-type silicon Epitaxal layer
– photosensitive layer – light can knock electrons off of it

Single Pixel of a CCD Array
• Below the Epitaxal layer • P-type silicon layer
– kept at negative voltage
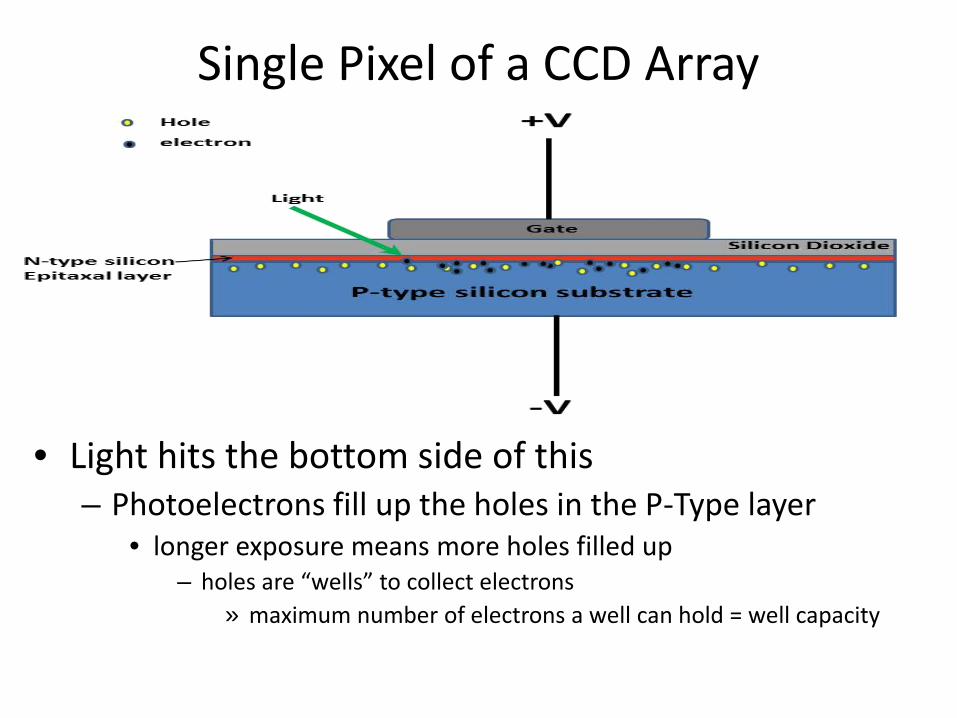
Single Pixel of a CCD Array
• Light hits the bottom side of this – Photoelectrons fill up the holes in the P-Type layer
• longer exposure means more holes filled up – holes are “wells” to collect electrons
» maximum number of electrons a well can hold = well capacity
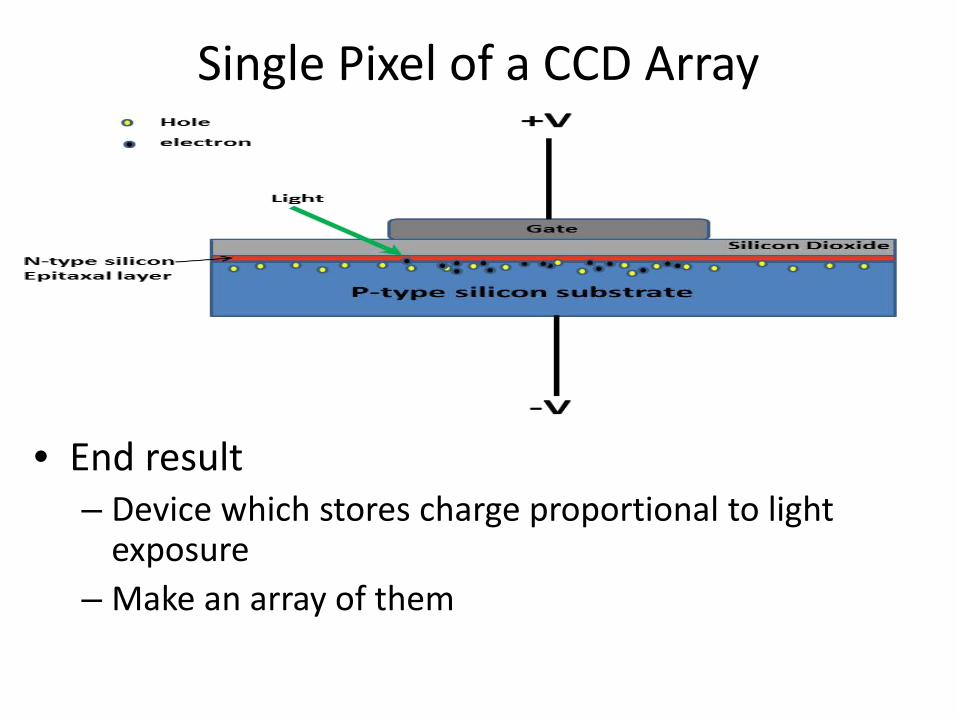
Single Pixel of a CCD Array
• End result – Device which stores charge proportional to light
exposure – Make an array of them
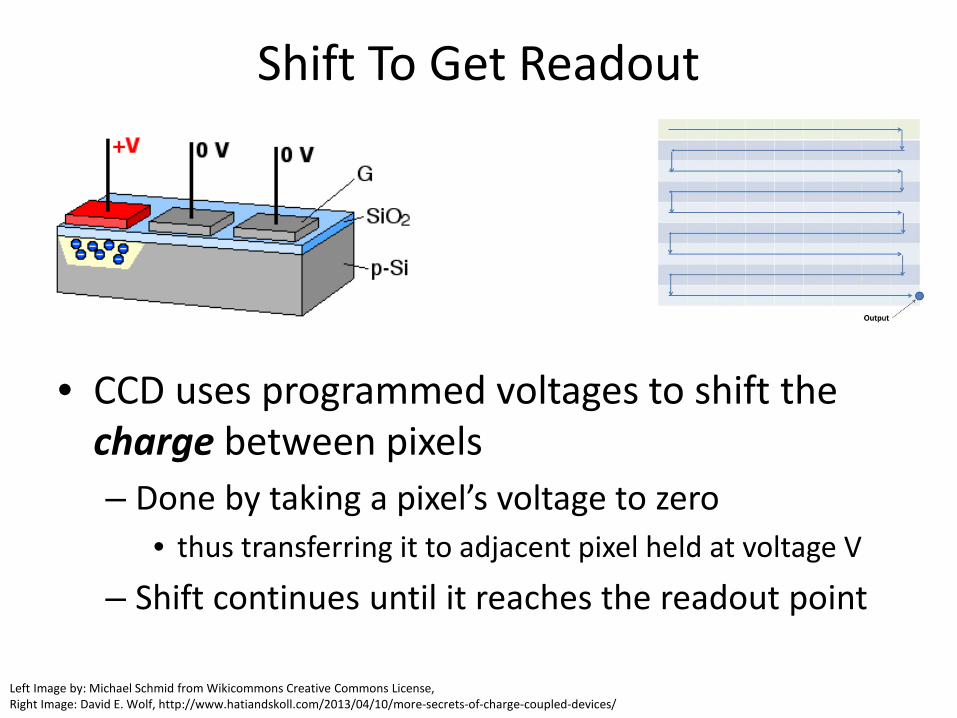
Shift To Get Readout
• CCD uses programmed voltages to shift the charge between pixels – Done by taking a pixel’s voltage to zero
• thus transferring it to adjacent pixel held at voltage V
– Shift continues until it reaches the readout point
Left Image by: Michael Schmid from Wikicommons Creative Commons License, Right Image: David E. Wolf, http://www.hatiandskoll.com/2013/04/10/more-secrets-of-charge-coupled-devices/
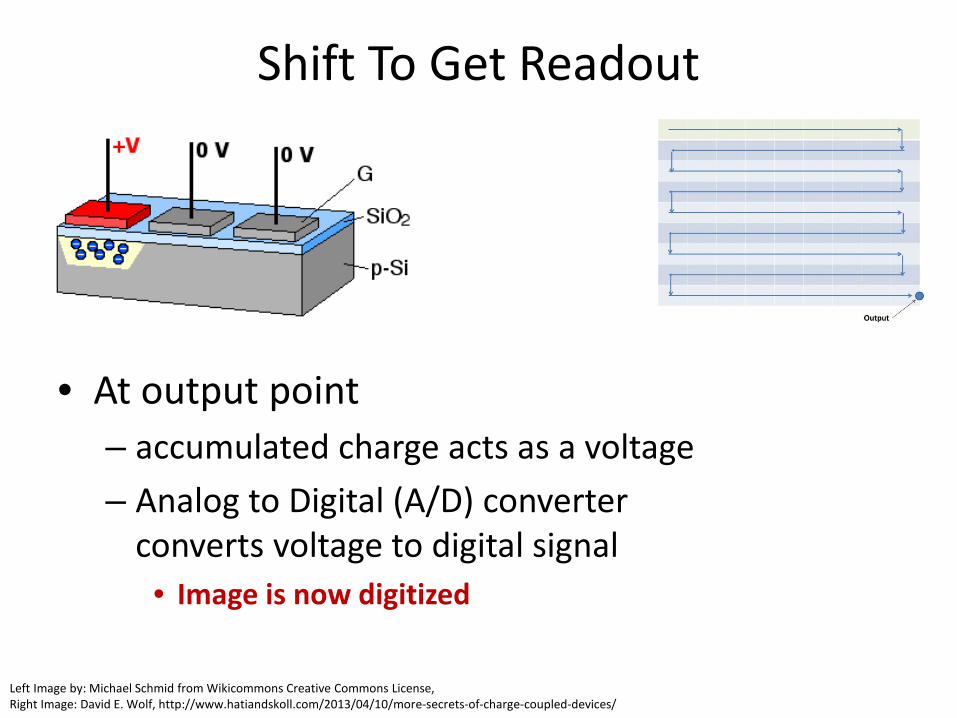
Shift To Get Readout
• At output point – accumulated charge acts as a voltage – Analog to Digital (A/D) converter
converts voltage to digital signal • Image is now digitized
Left Image by: Michael Schmid from Wikicommons Creative Commons License, Right Image: David E. Wolf, http://www.hatiandskoll.com/2013/04/10/more-secrets-of-charge-coupled-devices/
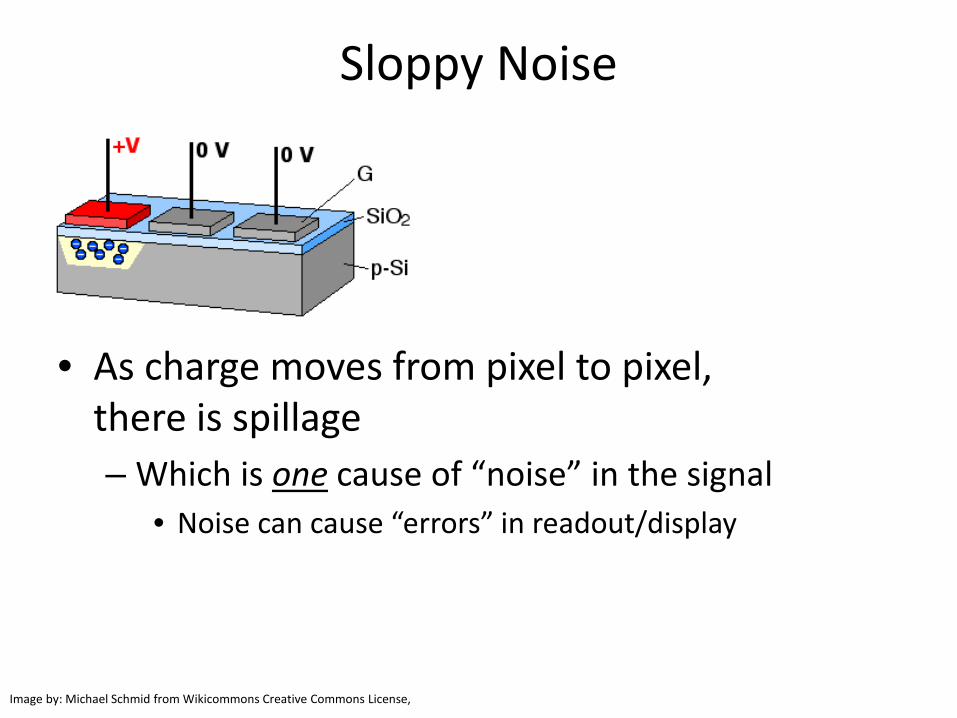
Sloppy Noise
• As charge moves from pixel to pixel, there is spillage – Which is one cause of “noise” in the signal
• Noise can cause “errors” in readout/display
Image by: Michael Schmid from Wikicommons Creative Commons License,
Questions so far
• Questions on CCD Hardware Aspects of Image Acquisition?
• Image Acquisition – Light and Electromagnetic spectrum – Charge-Coupled Device (CCD) imaging – Sampling and Quantization – Bayer Filter
• a common color filter array (CFA)
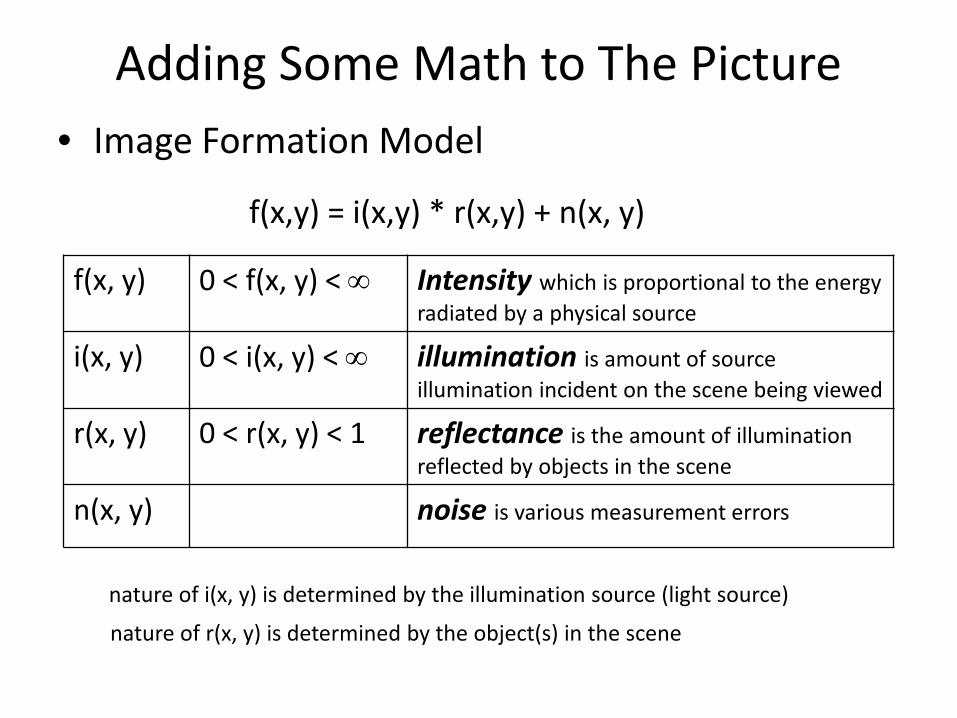
Adding Some Math to The Picture • Image Formation Model
f(x,y) = i(x,y) * r(x,y) + n(x, y)
f(x, y) 0 < f(x, y) < ∞ Intensity which is proportional to the energy radiated by a physical source
i(x, y) 0 < i(x, y) < ∞ illumination is amount of source illumination incident on the scene being viewed
r(x, y) 0 < r(x, y) < 1 reflectance is the amount of illumination reflected by objects in the scene
n(x, y) noise is various measurement errors
nature of i(x, y) is determined by the illumination source (light source)
nature of r(x, y) is determined by the object(s) in the scene
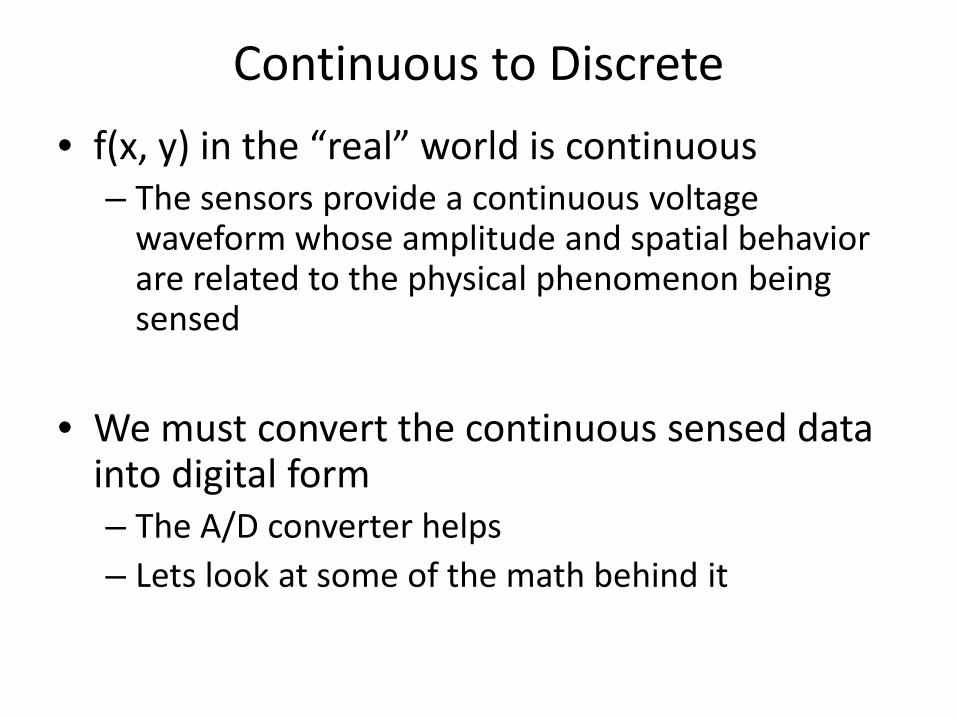
Continuous to Discrete • f(x, y) in the “real” world is continuous
– The sensors provide a continuous voltage waveform whose amplitude and spatial behavior are related to the physical phenomenon being sensed
• We must convert the continuous sensed data
into digital form – The A/D converter helps – Lets look at some of the math behind it
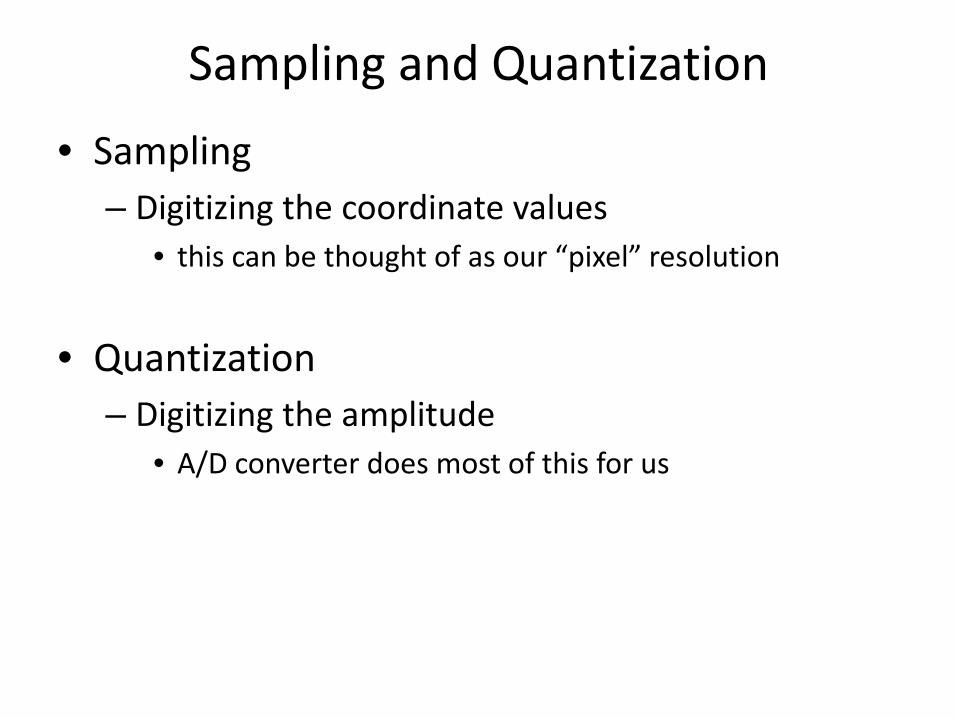
Sampling and Quantization
• Sampling – Digitizing the coordinate values
• this can be thought of as our “pixel” resolution
• Quantization – Digitizing the amplitude
• A/D converter does most of this for us
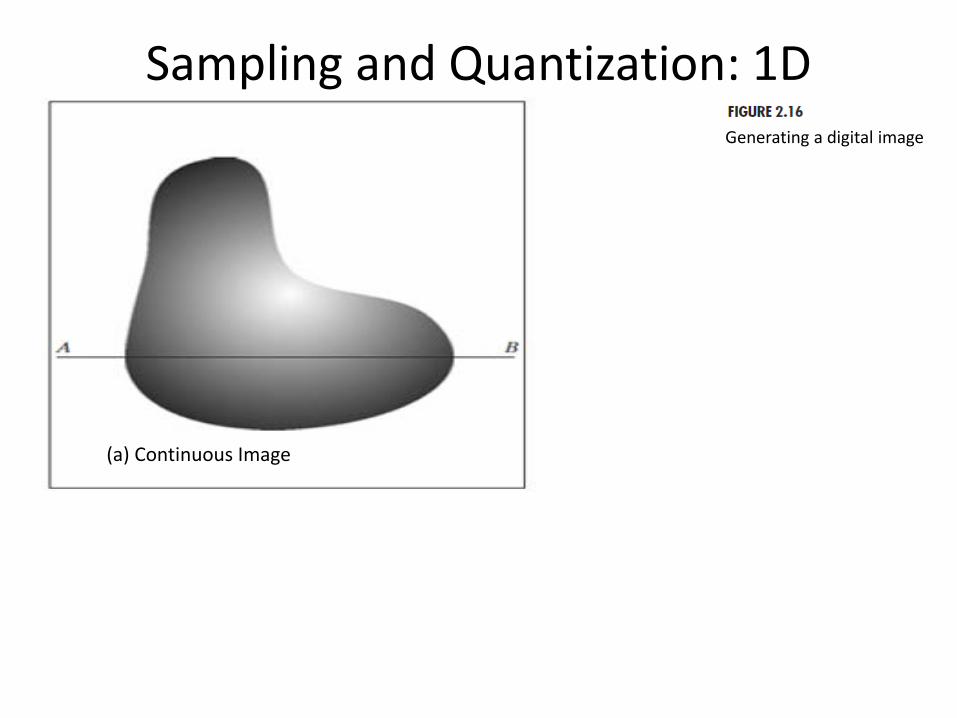
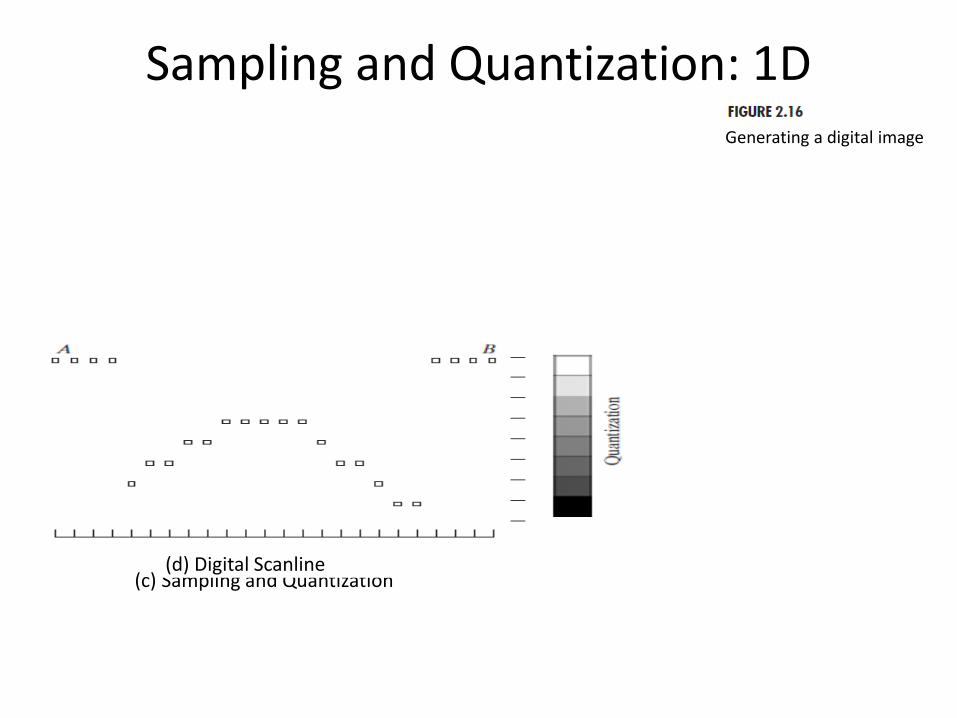
Sampling and Quantization: 1D Generating a digital image
(a) Continuous Image
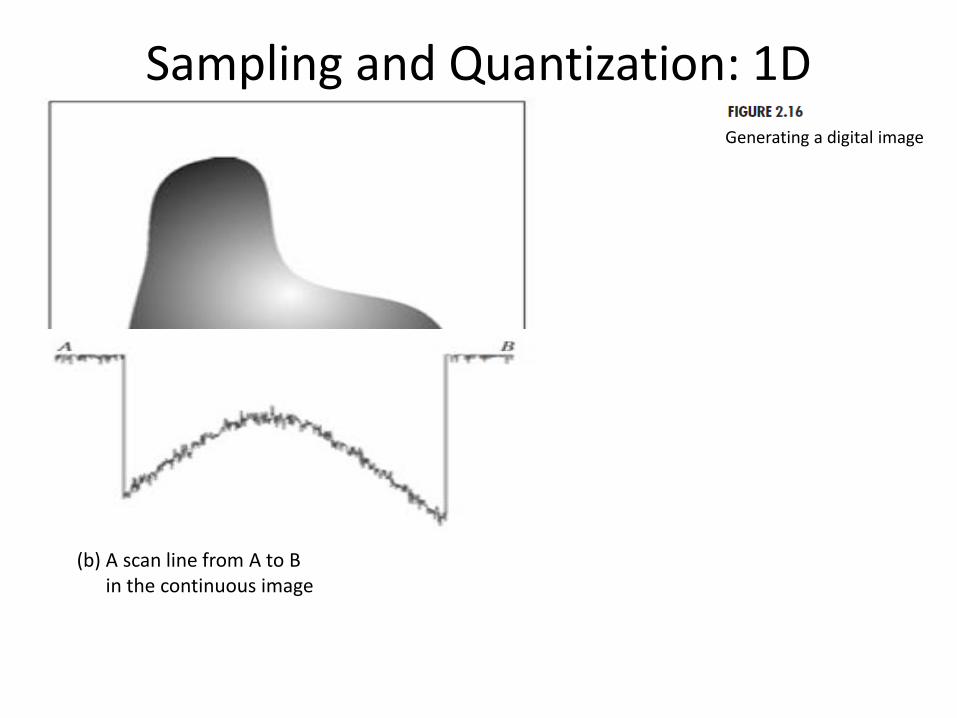
Sampling and Quantization: 1D Generating a digital image
(a) Continuous Image
(b) A scan line from A to B in the continuous image
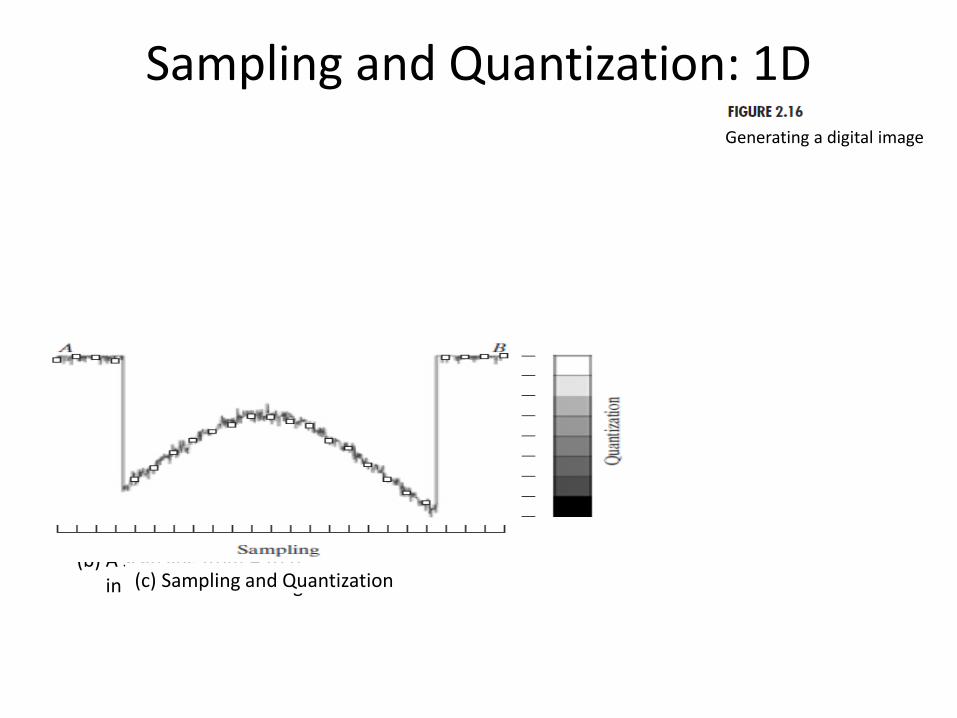
Sampling and Quantization: 1D Generating a digital image
(b) A scan line from A to B in the continuous image (c) Sampling and Quantization
Sampling and Quantization: 1D Generating a digital image
(c) Sampling and Quantization (d) Digital Scanline
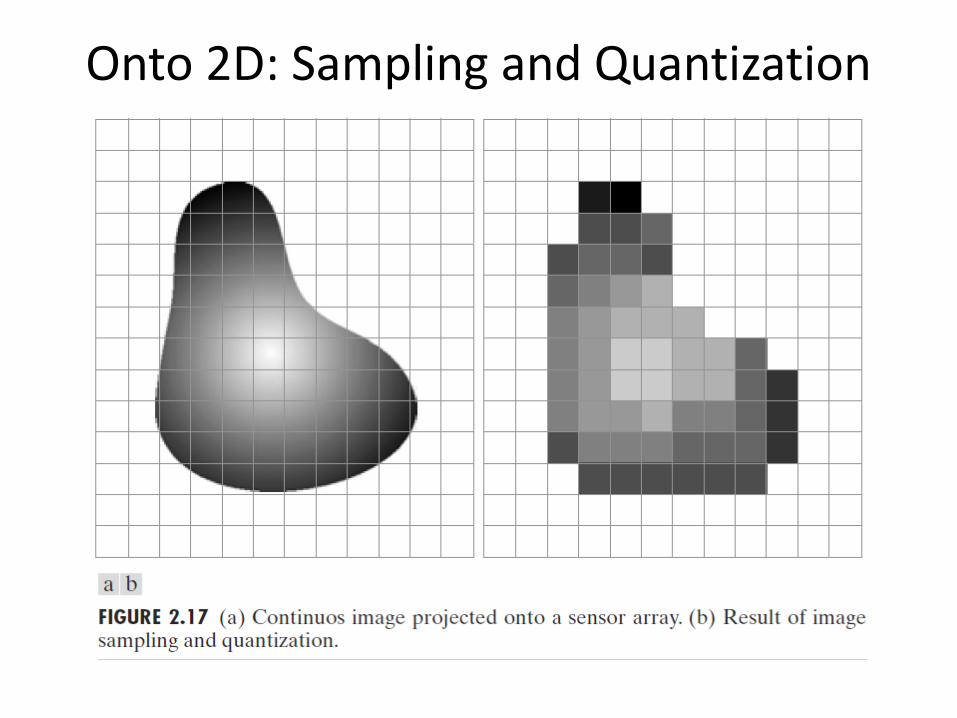
Onto 2D: Sampling and Quantization
Questions so far
• Questions on Sampling or Quantization?
• Image Acquisition – Light and Electromagnetic spectrum – Charge-Coupled Device (CCD) imaging – Sampling and Quantization – Bayer Filter
• a common color filter array (CFA)
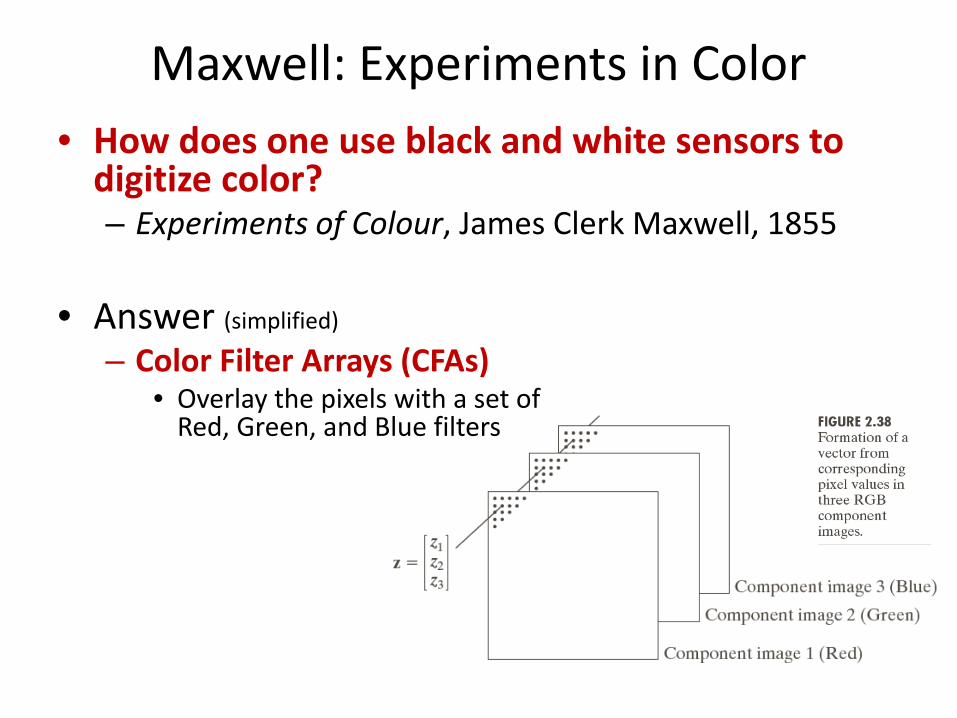
Maxwell: Experiments in Color • How does one use black and white sensors to
digitize color? – Experiments of Colour, James Clerk Maxwell, 1855
• Answer (simplified)
– Color Filter Arrays (CFAs) • Overlay the pixels with a set of
Red, Green, and Blue filters
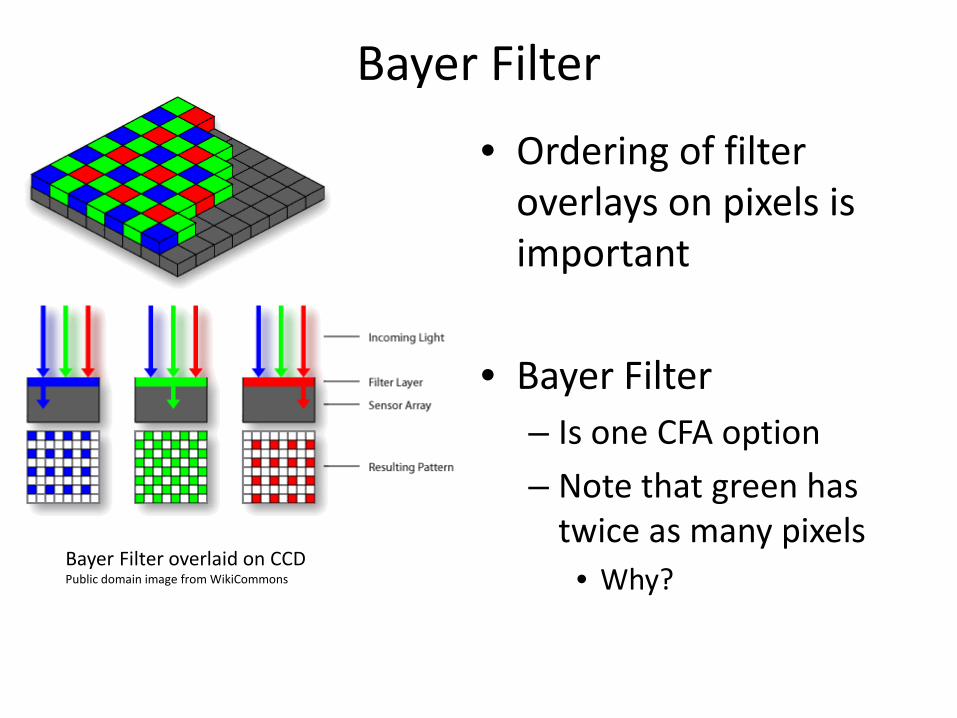
Bayer Filter
• Ordering of filter overlays on pixels is important
• Bayer Filter – Is one CFA option – Note that green has
twice as many pixels • Why?
Bayer Filter overlaid on CCD Public domain image from WikiCommons
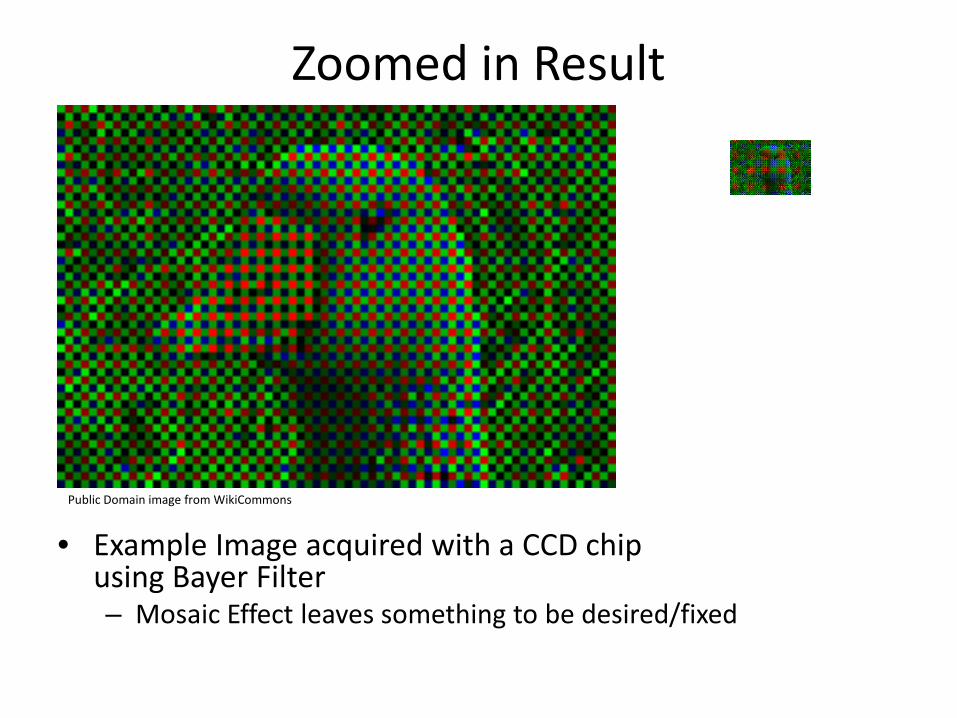
Zoomed in Result
• Example Image acquired with a CCD chip using Bayer Filter – Mosaic Effect leaves something to be desired/fixed
Public Domain image from WikiCommons
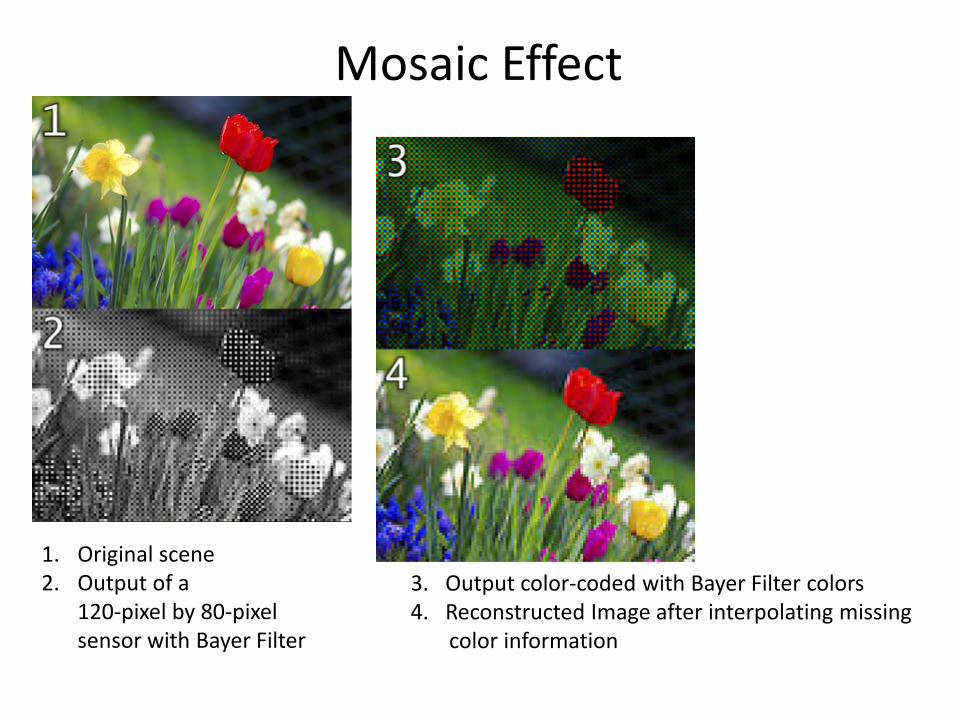
Mosaic Effect
1. Original scene 2. Output of a
120-pixel by 80-pixel sensor with Bayer Filter
3. Output color-coded with Bayer Filter colors 4. Reconstructed Image after interpolating missing color information
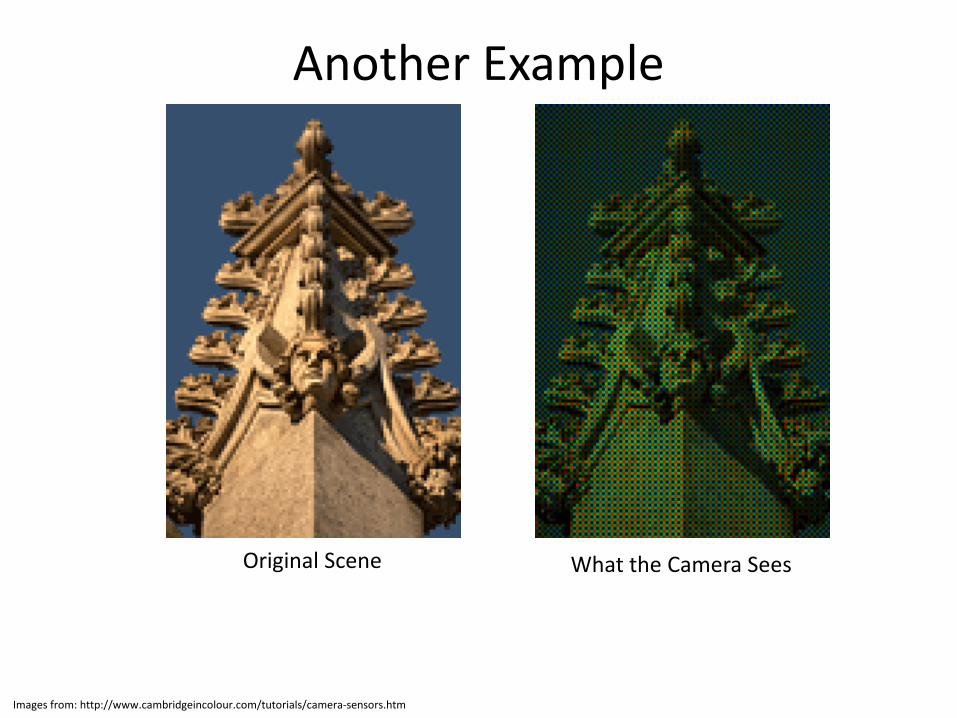
Another Example
Original Scene What the Camera Sees
Images from: http://www.cambridgeincolour.com/tutorials/camera-sensors.htm
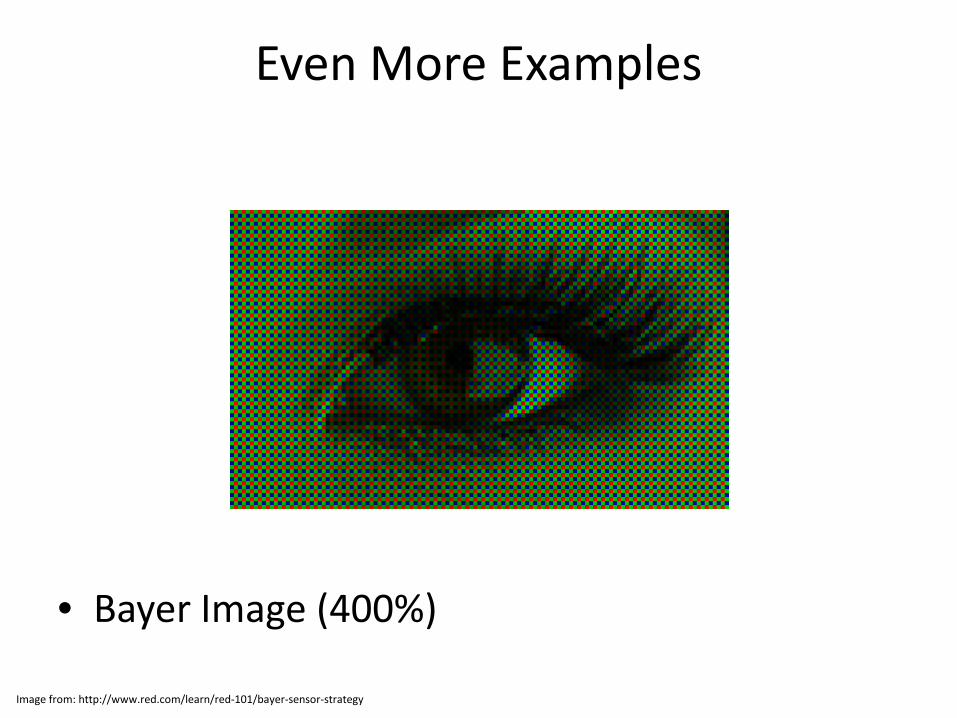
Even More Examples
• Bayer Image (400%)
Image from: http://www.red.com/learn/red-101/bayer-sensor-strategy
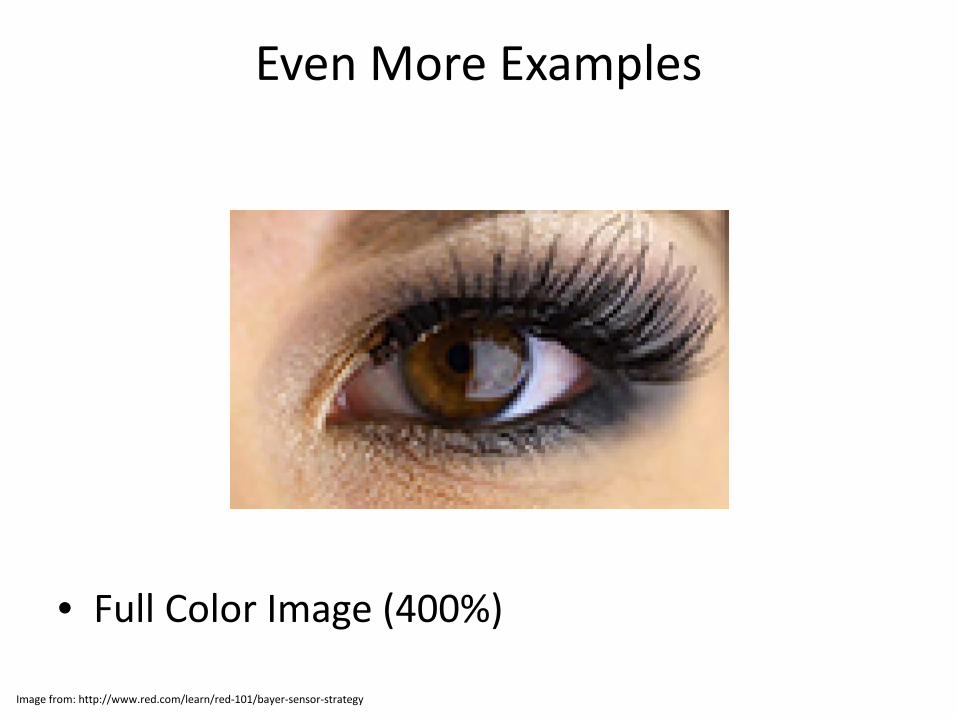
Even More Examples
• Full Color Image (400%)
Image from: http://www.red.com/learn/red-101/bayer-sensor-strategy
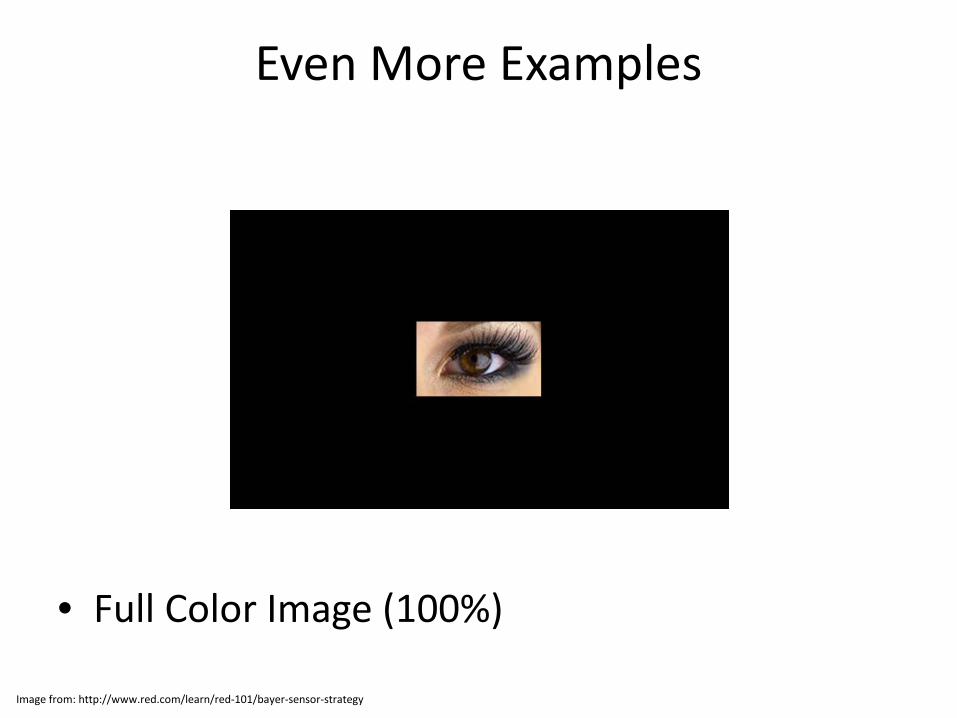
Even More Examples
• Full Color Image (100%)
Image from: http://www.red.com/learn/red-101/bayer-sensor-strategy
Mosaic Removal: CFA Interpolation • Bayer de-mosaicking is the process of translating
a CFA (Bayer array) of primary colors into a final image that contains full color information
• Interpolation methods
will be discussed in a later lecture
• The interested may check out various papers online
Paper 1: http://research.microsoft.com/en-us/um/people/lhe/papers/icassp04.demosaicing.pdf
Presentation 1: https://courses.cs.washington.edu/courses/cse467/08au/pdfs/lectures/09-Demosaicing.pdf
Paper 2: http://www.ece.ncsu.edu/imaging/Publications/2002/demosaicking-JEI-02.pdf
Paper 3: http://graphics.cs.williams.edu/papers/BayerJGT09/bayer-jgt09.pdf
Paper 4: https://hal.inria.fr/hal-00683233/PDF/AEIP_SOUMIS.pdf
Paper 5: http://research.microsoft.com/pubs/102068/Demosaicing_ICASSP04.pdf
Questions so far
• Questions on Bayer Filters? – Image Acquisition
• Light and Electromagnetic spectrum • Charge-Coupled Device (CCD) imaging • Sampling and Quantization • Bayer Filter
– a common color filter array (CFA)
Grayscale (and Color) Imaging • Image acquisition
– Light and Electromagnetic spectrum – Charge-Coupled Device (CCD) imaging – Bayer Filter
• a common color filter array (CFA) – Sampling and Quantization
• Image representation
– Spatial resolution – Bit-depth resolution – Local neighborhood
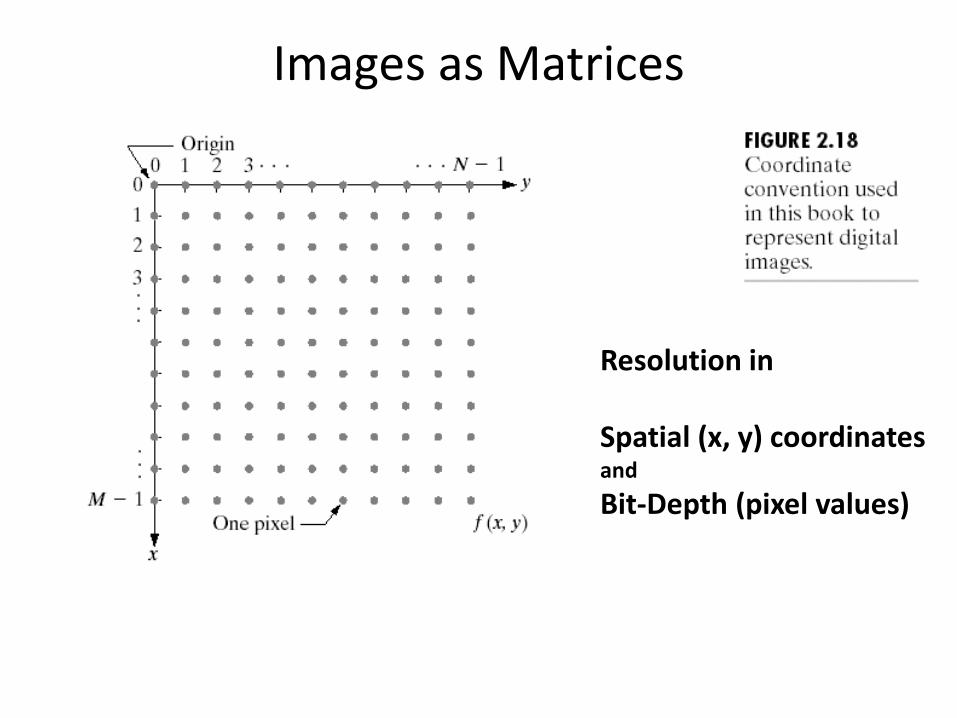
Images as Matrices
Resolution in Spatial (x, y) coordinates and Bit-Depth (pixel values)
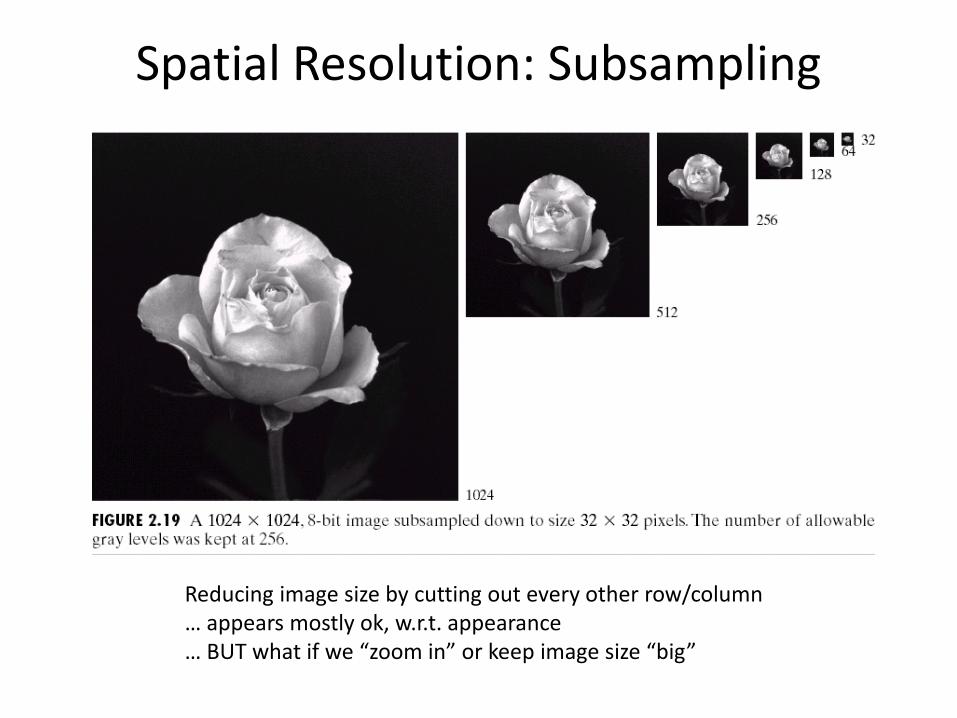
Spatial Resolution: Subsampling
Reducing image size by cutting out every other row/column … appears mostly ok, w.r.t. appearance … BUT what if we “zoom in” or keep image size “big”
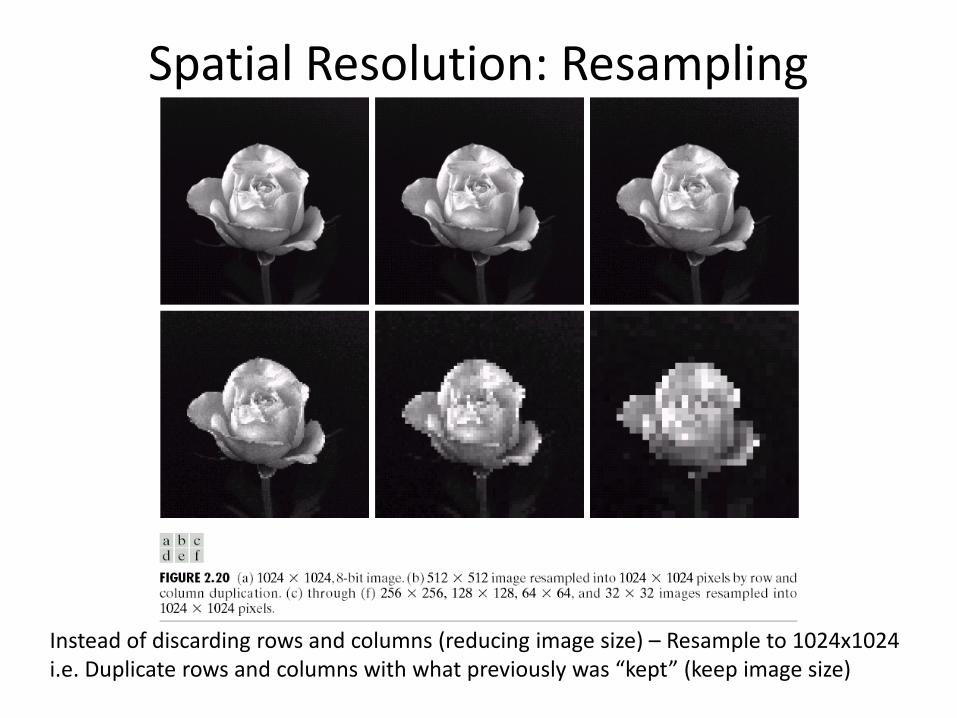
Spatial Resolution: Resampling
Instead of discarding rows and columns (reducing image size) – Resample to 1024x1024 i.e. Duplicate rows and columns with what previously was “kept” (keep image size)
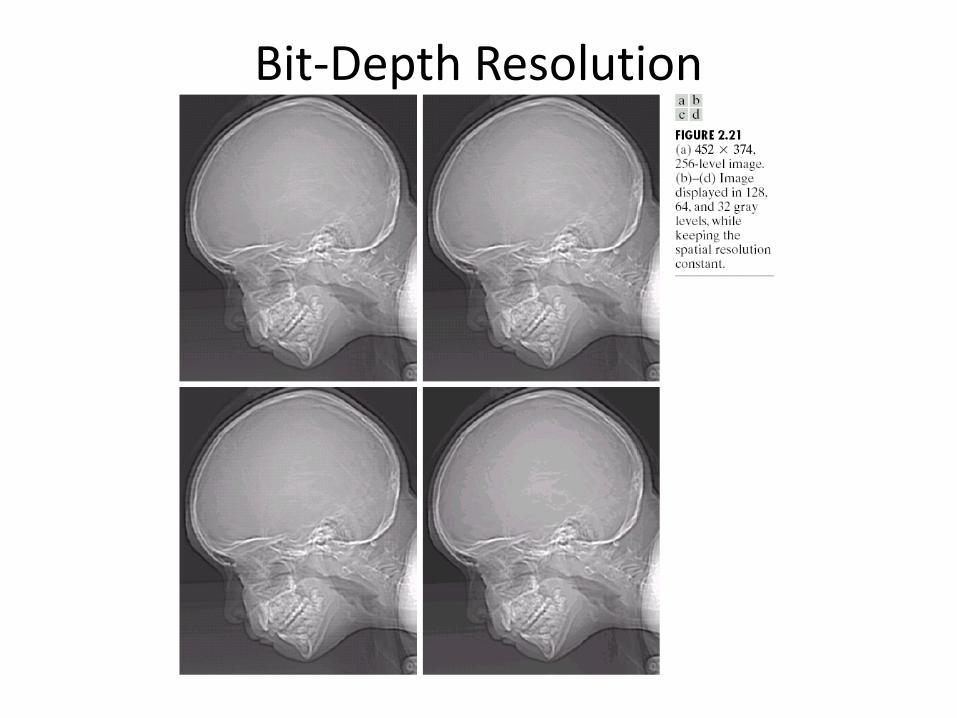
Bit-Depth Resolution
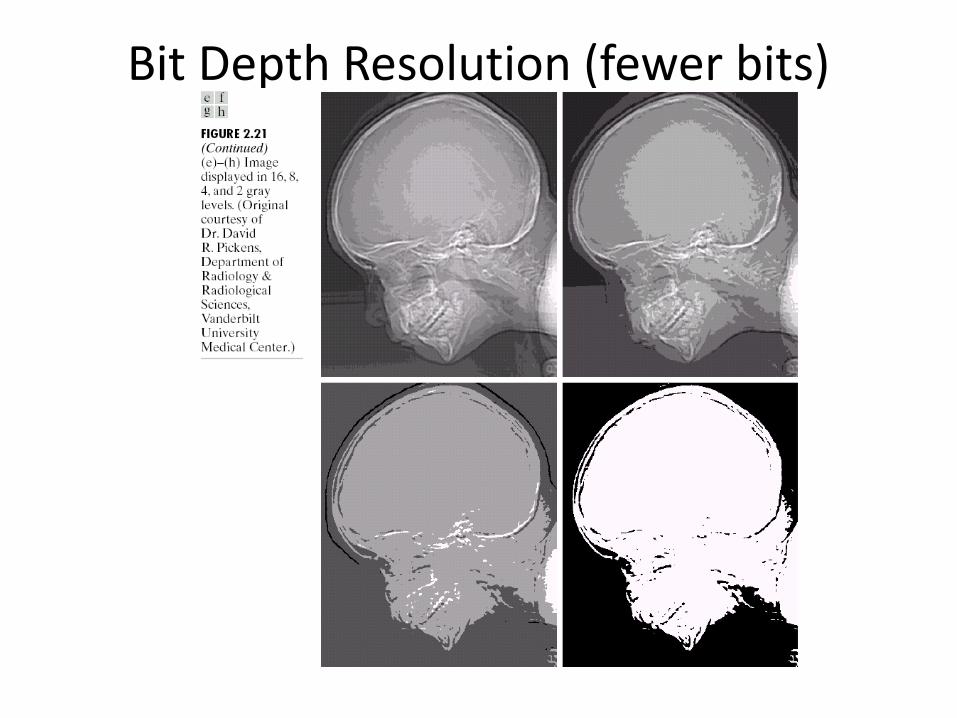
Bit Depth Resolution (fewer bits)
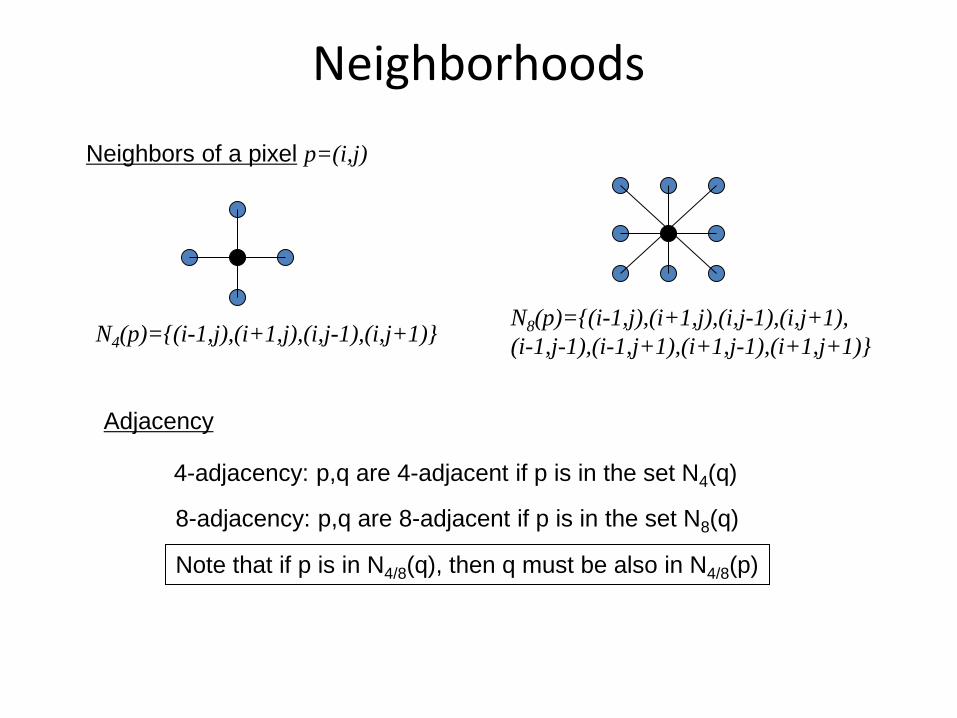
Neighborhoods Neighbors of a pixel p=(i,j)
N4(p)={(i-1,j),(i+1,j),(i,j-1),(i,j+1)} N8(p)={(i-1,j),(i+1,j),(i,j-1),(i,j+1), (i-1,j-1),(i-1,j+1),(i+1,j-1),(i+1,j+1)}
Adjacency
4-adjacency: p,q are 4-adjacent if p is in the set N4(q)
8-adjacency: p,q are 8-adjacent if p is in the set N8(q)
Note that if p is in N4/8(q), then q must be also in N4/8(p)
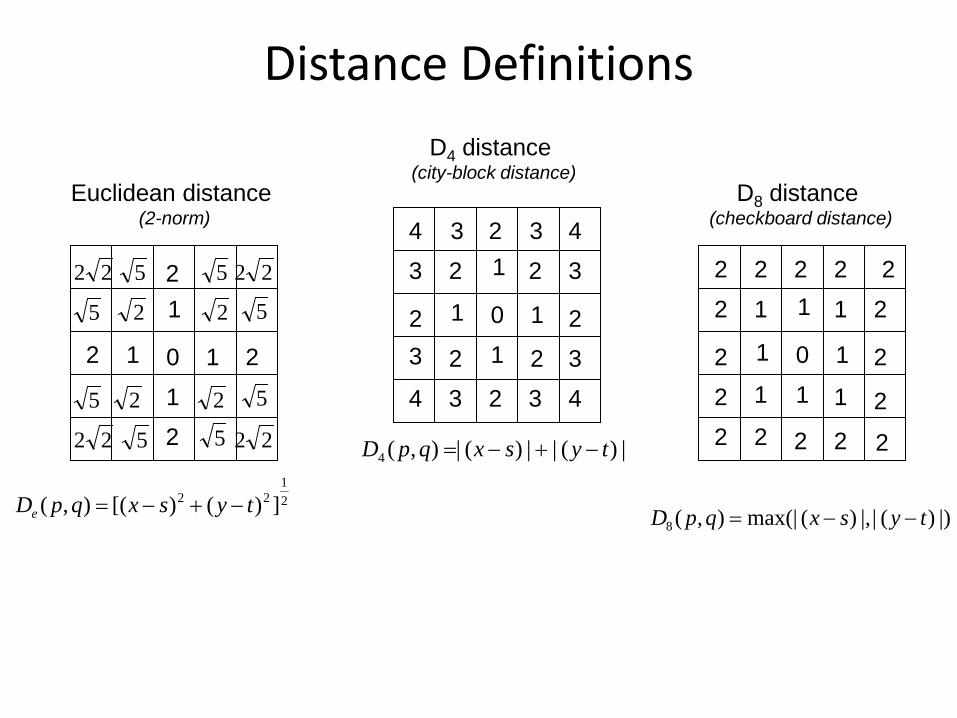
Distance Definitions
Euclidean distance (2-norm)
D4 distance (city-block distance)
D8 distance (checkboard distance)
0 1 1
1
1 0 1 1
1
1
0 1 1
1
1 1 1
1 1
2 2 2 2 2
2
2
2
2 2 2 2
2
2
2
2
2
2
2
2
2
2
2
2 3
3
3
3 3
3
3
3 4
4 4
4
2
2 2
2 2 2
22
22
22 22
22
5
5
55
5
5
5 5
21
22 ])()[(),( tysxqpDe −+−=
|)(||)(|),(4 tysxqpD −+−=
|))(||,)(max(|),(8 tysxqpD −−=
Summary • Image acquisition
– Light and Electromagnetic spectrum – Charge-Coupled Device (CCD) imaging – Sampling and Quantization – Bayer Filter
• Image representation
– Spatial resolution – Bit-depth resolution – Local neighborhood

Questions? • Beyond D2L
– Examples and information can be found online at:
• http://docdingle.com/teaching/cs.html
• Continue to more stuff as needed

Extra Reference Stuff Follows
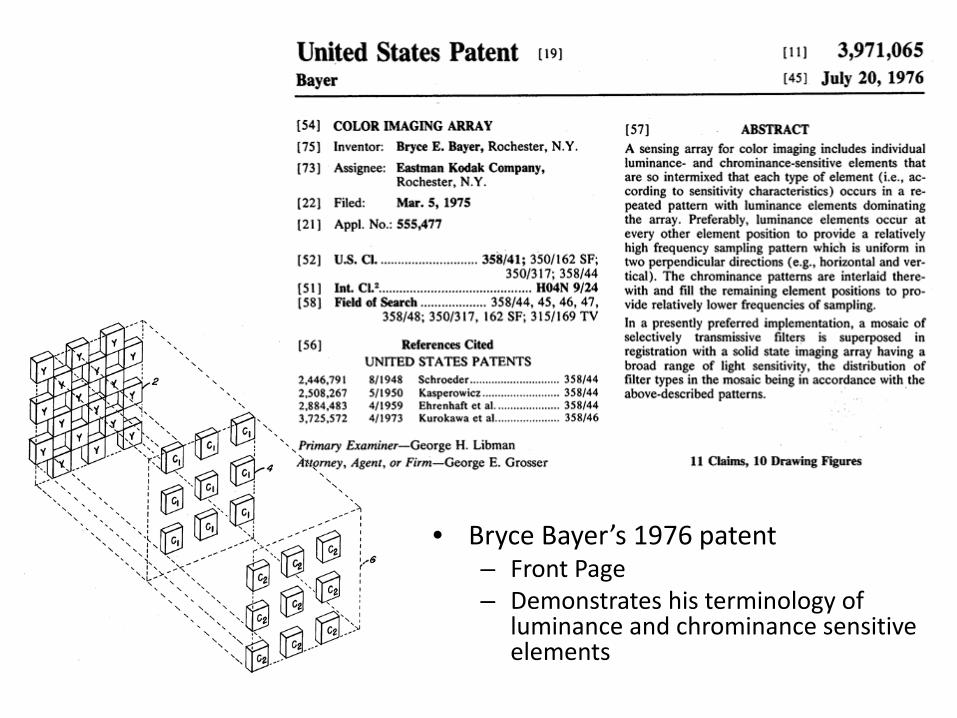
• Bryce Bayer’s 1976 patent – Front Page – Demonstrates his terminology of
luminance and chrominance sensitive elements
Credits • Much of the content derived/based on slides for use with the book:
– Digital Image Processing, Gonzalez and Woods
• Some layout and presentation style derived/based on presentations by – Donald House, Texas A&M University, 1999 – Bernd Girod, Stanford University, 2007 – Shreekanth Mandayam, Rowan University, 2009 – Igor Aizenberg, TAMUT, 2013 – Xin Li, WVU, 2014 – George Wolberg, City College of New York, 2015 – Yao Wang and Zhu Liu, NYU-Poly, 2015 – Sinisa Todorovic, Oregon State, 2015