iigdt - gd&t & measurement uncertainty - measurement uncertainty.pdf · © iigdt –...
TRANSCRIPT
© IIGDT – GD&T: Advanced Applications & Analysis – June 25, 2006
International Institute of GD&TInternational Institute of GD&T
2 Loring Road, Hopkins, MN 553052 Loring Road, Hopkins, MN 55305
www.iigdt.comwww.iigdt.com
GD&T & Measurement Uncertainty
International Institute of GD&TInternational Institute of GD&T
IIGDT
© IIGDT – GD&T: Advanced Applications & Analysis – June 25, 2006
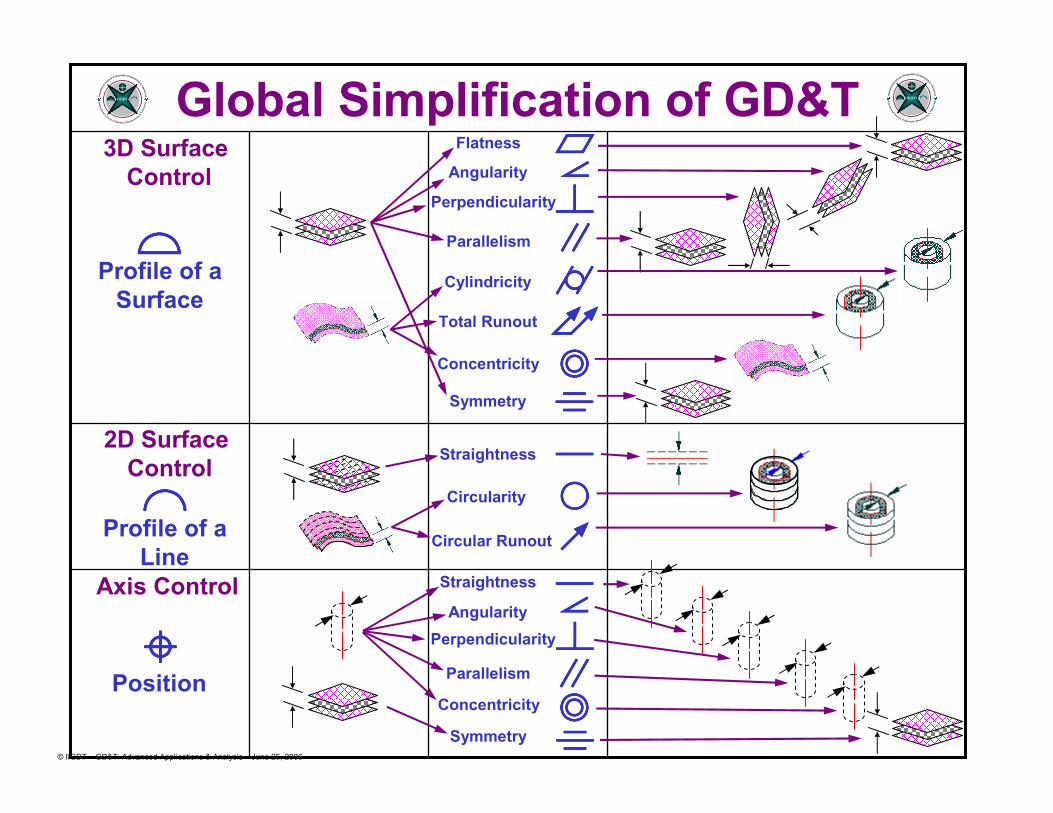
Global Simplification of GD&T
ÂÂÂÂ
‰‰‰‰
Profile of a
Surface
Profile of a
Line
3D Surface
Control
2D Surface
Control
Axis Control
ÍÍÍÍPosition
····Flatness
ÈÈÈÈËËËËÁÁÁÁAngularity
Perpendicularity
Parallelism
ÈÈÈÈËËËËÁÁÁÁAngularity
Perpendicularity
Parallelism
‡‡‡‡Straightness
‡‡‡‡Straightness
‚‚‚‚Circularity
„„„„Cylindricity
ÏÏÏÏCircular Runout
ÌÌÌÌTotal Runout
ÓÓÓÓSymmetry
ÓÓÓÓSymmetry
ÎÎÎÎConcentricity
ÎÎÎÎConcentricity
IIGDT IIGDT

© IIGDT – GD&T: Advanced Applications & Analysis – June 25, 2006
Measurement
Eyeball: L=Lest ± 1 inch
Tape: L=Lest ± 1/16 inch
Micrometer: L=Lest ± 0.001inch
Gage block comparator: L=Lest ± 1 microinch
Uncertainty
Cost of metrology
Profit
Target U
Dollars
© IIGDT – GD&T: Advanced Applications & Analysis – June 25, 2006
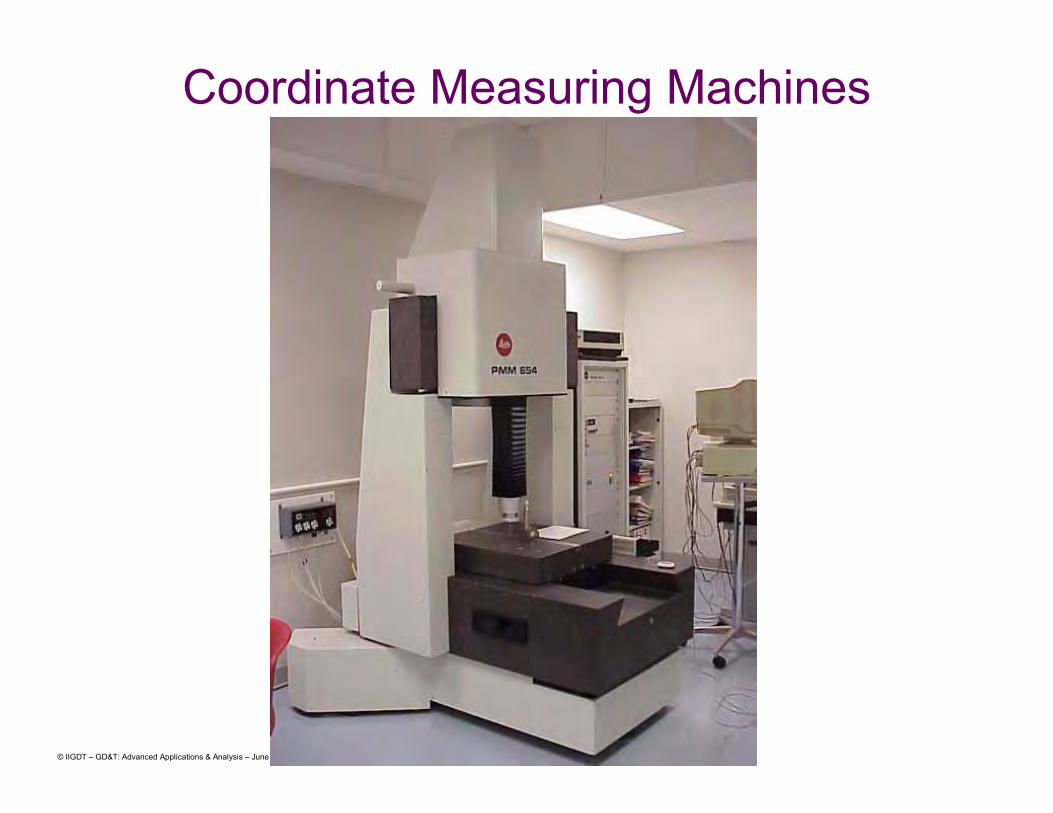
Coordinate Measuring Machines

© IIGDT – GD&T: Advanced Applications & Analysis – June 25, 2006
•Correlating Physical Measurements to Functional Parameters
-Input for FEA Models and Experimental Validation
•3D Characterization of Tooling & Product Components
-Standardized Software for Programming Efficiency & Analysis)
-Extraction of Surface Roughness, Waviness, Form
•Maintaining Commodity Plans with Key Measurement Suppliers
•CMMs, Vision Systems, Laser Sensors
Fly Height
Uc
Pitch Torque
2
++
2Roll
Torque
2TotalGramVar
2Slider's
ABSVar+
+P-SA P-StiffxGram Var(2)
POffsetxR-SA R-Stiffx +
Gram Var(2)
R Offsetx
P-LPtCust. SBO+R-LPt
CustSBO+
GramVar(1)
Cust.ZHV
SpringRate x +( ( () ) ) ) )( (
DriveDyn
Functional
Etched Tower Formed DimplePhysical-
Suspension
Physical-
Tooling
U1=Mat'l Thickness at bend area
U2=Width at bend area
U3=Length at bend area
U1=Datums
U2=Clamp Force
U3=Clamp Reference Location
U4=B.P. position at assembly
U5=B.P. edge break
U6=B.P. Flatness
U7=B.P. Squareness
U1=Tongue Flantess
U2=Loadbeam Profile
U3=Welding
U4=Heat Treat
U5=Dimple Location
U6=Dimple Height
U1=Flexure Mat'l Thickness
U2=Arm Length
U3=Arm WidthU1=Loadbeam profile under load
U2=Diameter
U3=Position of Tower
U4=Datums
U1=Loadbeam profile under load
U2=Apex Location
U3=Apex Shape
U1 + U2 + U3
2 22U1 + U2 + ... + U7
2 22
U1 + U2 + ... + U62 22
U1 + U2 + U3
2 22
U1 + U2 + ... + U42 22
U1 + U2 + U3
2 22
U1=Datums
U2=Dimple Punch Location
U3=Dimple Punch Shape
U1 + U2 + U3
2 22
FHSTG
2FHSRT
2FHPT
2
12 Contact
CMMs170 Non-Contact
Coordinate Meas. Systems
15+ Other Meas. Systems
(Orbotech, Cognex VM)Micro-Scale CMM
(Contact)
Micro-Scale CMM
(Non-Contact)
Open-Loop Scanning
Geometric Error Analysis
Thermal Modeling
Surface Analysis
3D Analysis
Non-Contact CMM’s
Other Meas. Systems
3D Measurement
Worcester Polytechnic Institute
Center for Holographic Studies and Laser micro-mechaTronics
LOAD BEAM DYNAMICSLOAD BEAM DYNAMICSOEH AND FEM RESULTS OEH AND FEM RESULTS -- MODE 2 AT 2,582 Hz MODE 2 AT 2,582 Hz
Contact
CMM’s
Physical to Functional Characteristic Hierarchy

© IIGDT – GD&T: Advanced Applications & Analysis – June 25, 2006
ASME B89 Committee on “Metrology”
Comprised of “7” Divisions:
• B89.1 – Length
• B89.2 – Angles
• B89.3 – Geometry
• B89.4 – Coordinate Measuring Technology
• B89.5 – General Principles and Definitions
• B89.6 – Environment
• B89.7 – Measurement Uncertainty

© IIGDT – GD&T: Advanced Applications & Analysis – June 25, 2006
B89.7 – Measurement Uncertainty
“Motivations”
• Need for a uniform approach (GUM) to the treatment of
uncertainty in ASME B89 document
• Need for simplified guidance documents as GUM moves into
industrial arena
• General dissatisfaction with quality of existing written
standards produced by ISO
Design
MeasurementMfg
GD&T
&
Uncertainty
ASME Y14.5M–1994 GUMASME Y14.5.1M–1994

© IIGDT – GD&T: Advanced Applications & Analysis – June 25, 2006
ASME B89.7 Committee
“Measurement Uncertainty”
• B89.7.1 - Guidelines for B89 Doc’s
• B89.7.2 - Inspection Planning
• B89.7.3 - Decision Rules
• B89.7.4 - General Principles
• B89.7.5 - Communications
• B89.7.6 - Uncertainty Considerations in Tolerancing
• B89.7.7 - Advanced Uncertainty Concepts
• B89.7.8 - Traceability
© IIGDT – GD&T: Advanced Applications & Analysis – June 25, 2006
expansion
bending
temperature
systematic effects
r
φ
∆r
random effects
probingprocess
long term stabilitykinematic anddynamic effects
∆x
x
measurement task
& strategy
basic axis geometry
x
z
y
∑ ∑∑= +=
−
= ∂∂
∂∂
+
∂∂
=N
i
ji
j
N
ij i
N
i
i
i
c xxux
f
x
fxu
x
fu
1 1
1
1
2
2
2 ),(2)(
Variances Covariances
software forevaluation ofmeasurement
[ ]∑ −⋅= 2(),( xxaaxJi
Objective Function:
)(),,()( xxaaxxdxdd iiii −⋅===Distance Equation:
Uncertainty
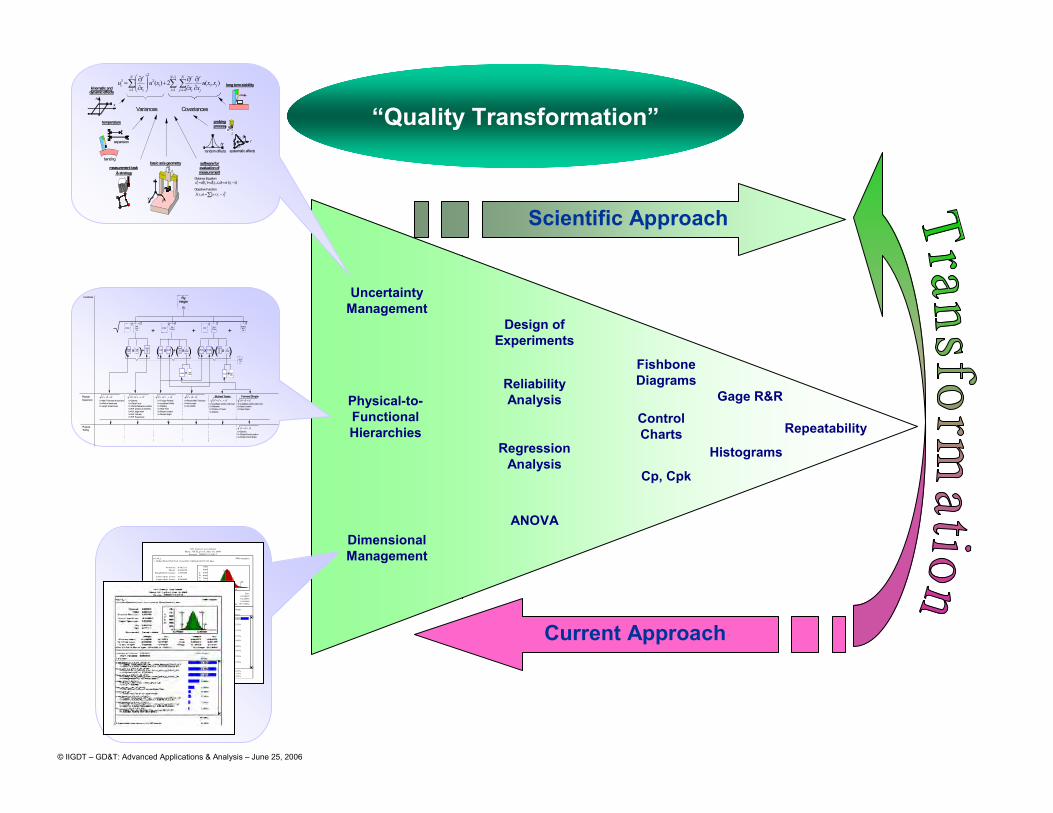
Management
Physical-to-
Functional
Hierarchies
Dimensional
Management
Design of
Experiments
Reliability
Analysis
Regression
AnalysisHistograms
Fishbone
Diagrams
Repeatability
Gage R&R
ANOVA
Control
Charts
Cp, Cpk
Scientific Approach
Current Approach
HTI Chassis Arm Model
Phase 3 HTI_p3.vsl, May 16, 2000
Session: 20000517-141912
sae14_r 5000 samples
-> Slider/Bond Pad SAE Assembly Method [A|F|0.12] deg
Nominal : 0.645211
Mean : 0.634629
Standard Deviation : 1.660454
Lower Spec Limit : N/A
Upper Spec Limit : 0.050000
Cp : N/A
Cpk : -0.126553
Distribution : Tested Normal
Sample Est Sample Est*
% < Low Limit N/A N/A Low -5.426040 -4.346695
% > High Limit 63.780000 63.761454 High 6.822226 5.615953
% Out of Spec 63.780000 63.761454 Range 12.248265 9.962649
95% C.I. for % Out of Spec : 62.447744 to 65.112256 * Est Range : 99.7300%
F
R
E
Q
0
100
200
300
400
500
600
700
-5.500000 2.500000
USL
-3S +3S
Nominal at Median : 0.645211 HLM Study
HLM Variance : 3.748766
Tolerance Effect
weld_base_p3_FEAT_44_GTP 39.90%-> Comp: weld_base_p3 Feat: weld_base_p3_FEAT_44-> (BONUS 0.00) CompPos(DIA) 0.1270(M)[A|B|C]
load_beam_st_FEAT_1_GTL 15.55%-> Comp: load_beam_st Feat: load_beam_st_FEAT_1-> Position(DIA) 0.0800[A|P]
slider_FEAT_2_GTS 15.55%-> Comp: slider Feat: slider_FEAT_2-> Size +- 0.0400
flex_cu_up___hti_p3_GM4 8.27%-> flex_cu_up___hti_p3 assembleop float
load_beam_st_FEAT_4_GTL 3.89%-> Comp: load_beam_st Feat: load_beam_st_FEAT_4-> Position(DIA) 0.0200(S)[A|B|C]
slider_pos_err 3.89%-> Slider Position Error zone 0.020
weld_base_p3_FEAT_12_GTL 3.82%-> Comp: weld_base_p3 Feat: weld_base_p3_FEAT_12-> (BONUS 0.00) Position(DIA) 0.0076(M)[A|D]
load_beam_st_FEAT_26_GTL 2.78%-> Comp: load_beam_st Feat: load_beam_st_FEAT_26-> Position(DIA) 0.0500[A|B|C]
weld_base_p3_FEAT_7_GTL 2.75%-> Comp: weld_base_p3 Feat: weld_base_p3_FEAT_7-> (BONUS 0.00) Position(DIA) 0.0076(M)[A|D]
96.41%
1 additional contributor(s) <= 2.75% each (Not Displayed) 1.64%
13 additional contributor(s) < 1.00% each 1.95%
“Quality Transformation”
Fly Height
Uc
Pitch Torque
2
++
2Roll
Torque
2TotalGramVar
2Slider'sABSVar+
+P-SA P-StiffxGram Var(2)
POffsetxR-SA R-Stiffx +
Gram Var(2)
R Offsetx
P-LPtCust. SBO+R-LPt
CustSBO+
GramVar(1)
Cust.ZHV
SpringRate x +( ( () ) ) ) )( (
DriveDyn
Functional
Etched Tower Formed DimplePhysical-
Suspension
Physical-
Tooling
U1=Mat'l Thickness at bend area
U2=Width at bend area
U3=Length at bend area
U1=Datums
U2=Clamp Force
U3=Clamp Reference Location
U4=B.P. position at assembly
U5=B.P. edge break
U6=B.P. Flatness
U7=B.P. Squareness
U1=Tongue Flantess
U2=Loadbeam Profile
U3=Welding
U4=Heat Treat
U5=Dimple Location
U6=Dimple Height
U1=Flexure Mat'l Thickness
U2=Arm Length
U3=Arm WidthU1=Loadbeam profile under load
U2=Diameter
U3=Position of Tower
U4=Datums
U1=Loadbeam profile under load
U2=Apex Location
U3=Apex Shape
U1 + U2 + U3
2 22U1 + U2 + ... + U7
2 22
U1 + U2 + ... + U62 22
U1 + U2 + U3
2 22
U1 + U2 + ... + U42 22
U1 + U2 + U32 22
U1=Datums
U2=Dimple Punch Location
U3=Dimple Punch Shape
U1 + U2 + U3
2 22
FHSTG
2FHSRT
2FHPT
2

© IIGDT – GD&T: Advanced Applications & Analysis – June 25, 2006
expansion
bending
temperature
systematic effects
r
φ
∆r
random effects
probingprocess
long term stabilitykinematic anddynamic effects
∆x
x
measurement task
& strategy
basic axis geometry
x
z
y
∑ ∑∑= +=
−
= ∂∂
∂∂
+
∂∂
=N
i
ji
j
N
ij i
N
i
i
i
c xxux
f
x
fxu
x
fu
1 1
1
1
2
2
2 ),(2)(
Variances Covariances
software forevaluation ofmeasurement
[ ]∑ −⋅= 2(),( xxaaxJ i
Objective Function:
)(),,()( xxaaxxdxdd iiii −⋅===Distance Equation:
Analytic Solutions
Graphic courtesy of Dr. Trapet - PTB
© IIGDT – GD&T: Advanced Applications & Analysis – June 25, 2006
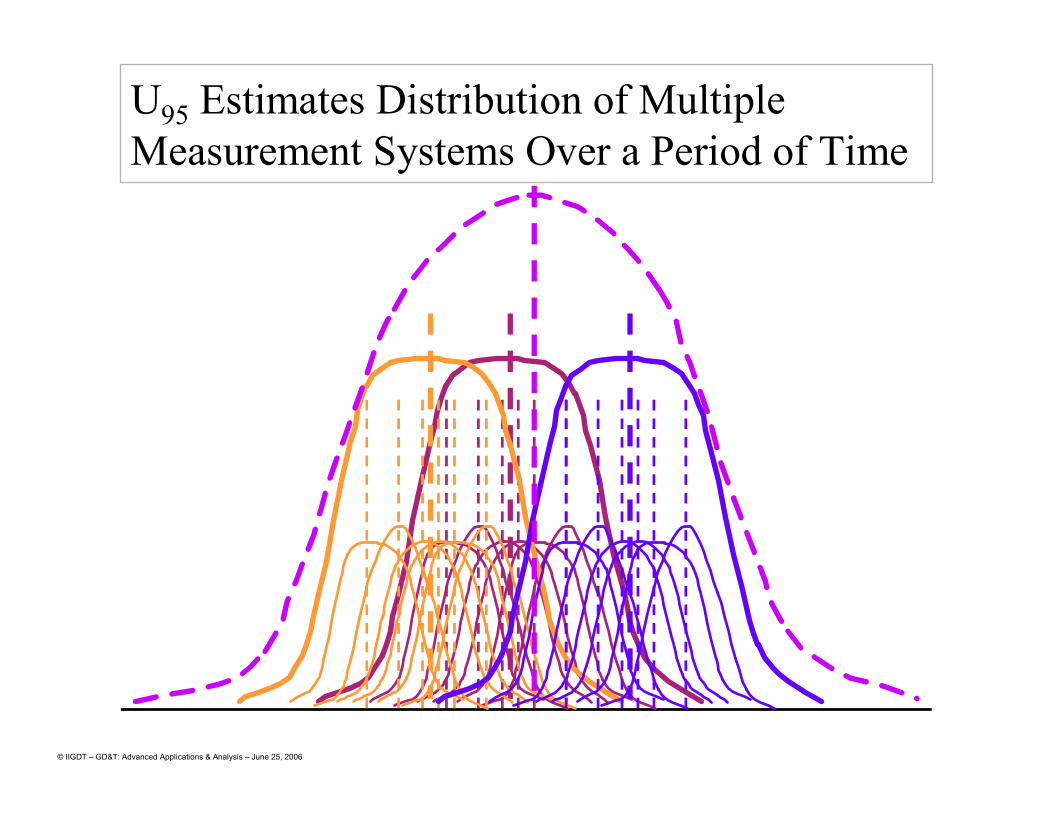
U95 Estimates Distribution of Multiple
Measurement Systems Over a Period of Time

© IIGDT – GD&T: Advanced Applications & Analysis – June 25, 2006
1. Environment
2. Reference Element for Measurement Equipment
3. Measurement Equipment
4. Measurement Setup
5. Software & Calculations
6. Metrologist / Operator
7. Measurement Object
8. Definition of the Characteristic
9. Measuring Procedure
10.Physical Constants & Conversion Factors
Sources of Error / Contributors toMeasurement Uncertainty

© IIGDT – GD&T: Advanced Applications & Analysis – June 25, 2006
1. Environment for the measurement
• Temperature: absolute temperature, time variance, spatial variance
• Vibration/noise
• Humidity
• Contamination
• Illumination
• Ambient pressure
• Air composition
• Air flow
• Gravity
• Transients in the power supply
• Pressured air (e.g. air bearings)
• Heat radiation
Sources of Error…

© IIGDT – GD&T: Advanced Applications & Analysis – June 25, 2006
2. Reference element of measurement equipment
• Uncertainty of the calibration
• Stability
• Scale mark quality
• Temperature expansion coefficient
• Physical principle: line scale, optical digital scale, magnetic digital
scale, spindle, rack & pinion, interferometer
Sources of Error…
+
+
+
+
+
+
++
+
+
+
++
+
+
+
+
+
+
+
+
+
+
++
+
+
+
++
+
+
+
++
True Center of
Sphere
Incorrect
Center of
Sphere
+++++
+
+
+ +
+
++
+
+
+
+
x+
True Center of
Sphere
Incorrect
Center of
Sphere
+++++
+
+
+ +
+
++
+
+
+
+
x
© IIGDT – GD&T: Advanced Applications & Analysis – June 25, 2006
3. Measurement equipment
• Interpretation system
• Magnification-electrical or mechanical - error wavelength!!
• Zero-point stability
• Force stability/absolute force
• Hysteresis
• Guides/slide-ways
• Temperature expansion
• Parallaxes
• Time since last calibration
• Responds characteristic
• Interpolation system - error wavelength
• Interpolation resolution
Sources of Error…

© IIGDT – GD&T: Advanced Applications & Analysis – June 25, 2006
4. Measurement setup (excl. the placement and clamping
of the workpiece)
• Cosine errors
• Abbe principle
• Temperature sensitivity
• Stiffness/rigidity
• Tip radius
• Form deviation of tip
• Stiffness of the probe system
• Optical aperture
• Interaction between workpiece and setup
• Warming up
Sources of Error…

© IIGDT – GD&T: Advanced Applications & Analysis – June 25, 2006
5. Software and calculations
• Rounding/Quantification
• Algorithms
• Implementation of algorithms
• Number of significant digits in the computation
• Sampling
• Filtering
• Correction of algorithm/Certification of algorithm
• Interpolation extrapolation
Sources of Error…

© IIGDT – GD&T: Advanced Applications & Analysis – June 25, 2006
6. Metrologist –operator
• Education
• Experience
• Training
• Physical disadvantages/ability
• Knowledge
• Honest
Sources of Error…

© IIGDT – GD&T: Advanced Applications & Analysis – June 25, 2006
7. Measurement Workpiece or Measuring Instrument
• Surface Roughness, Waviness, & Form
• Temperature expansion coefficient
• Weight
• Size
• Shape
• Magnetism
• Cleanliness
• Internal stress
• Creep characteristics
Sources of Error…
0
0.5
1
1.5
2
2.5
3
3.5
0
0.5
1
1.5
2
2.5
3
3.5
-10
0
10
X axis (mm)
Original Surface
Y axis (mm)
Z a
xis
(um
)
0
0.5
1
1.5
2
2.5
3
0
1
2
3
-10
0
10
X axis (mm)
Roughness
Y axis (mm)
Z a
xis
(um
)
0
0.5
1
1.5
2
2.5
3
0
0.5
1
1.5
2
2.5
3
-5
0
5
X axis (mm)
Waviness
Y axis (mm)
Z a
xis
(um
)

© IIGDT – GD&T: Advanced Applications & Analysis – June 25, 2006
8. Definition of the Characteristic
• Toleranced feature
• Reference system
• Degree of freedom
• Distance
• Angle
Sources of Error…

© IIGDT – GD&T: Advanced Applications & Analysis – June 25, 2006
9. Measuring procedure
• Number of measurements
• Order of measurements
• Duration of measurements
• Choice of principle of measurement
• Reference standard
• Alignment
• Clamping
• Fixturing
• Number of points
• Probing principle
• Drift check
Sources of Error…
© IIGDT – GD&T: Advanced Applications & Analysis – June 25, 2006
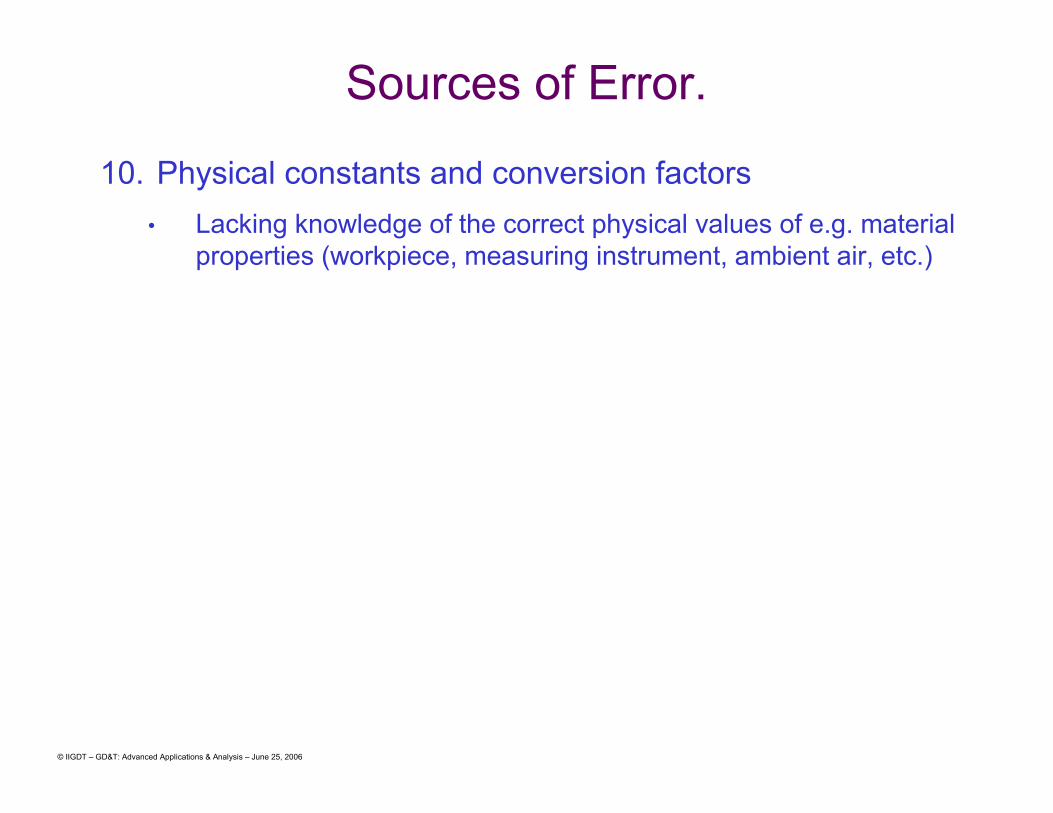
10. Physical constants and conversion factors
• Lacking knowledge of the correct physical values of e.g. material
properties (workpiece, measuring instrument, ambient air, etc.)
Sources of Error.

© IIGDT – GD&T: Advanced Applications & Analysis – June 25, 2006
Business Drivers to Support a Decision to
Invest into Aggressive GD&T Training
1. Increased Business due to Increased Capability
2. Increased Profit with Reduced or Eliminated Returns
3. Increased Recognition as a Leading Edge Supplier/Customer
4. Increased Customer Satisfaction Based on Improved Conditions
5. Increased Yield / Reduced Inspection (reduced scrap and rework)
6. Unambiguous and Understood Engineering Requirements
7. Better ability to predict and control processes