ifm assig
TRANSCRIPT

7/31/2019 ifm assig
http://slidepdf.com/reader/full/ifm-assig 1/12
SIVA SIVANI INSTITUTE OF MANAGEMENT
AN
ASSIGNMENT
OF
INTERNATIONAL FINANCIAL MANAGEMENT
SUBMITTED TO SUBMITTED BY
ANNAPURNA MADAM K.V.RAMA RAO
ROLL NO: 2B2 51

7/31/2019 ifm assig
http://slidepdf.com/reader/full/ifm-assig 2/12
World’s Biggest 10 Companies-2012
RANKING Company name location industry
1 JP Morgan chase U.S banking
2GENERALELECTRIC
U.S conglomerates
3 Bank of America U.S banking
4 EXXON MOBIL U.S Oil and gas operations
5 ICBC CHINA banking
6 BANCOSANTANDER
SPAIN banking
7 Wells Fargo U.S banking
8 HSBC holdings U.K banking
9 Royal Dutch sheel NETHERLANDS Oil and gas operations
10 BP (petroleum gaint) U.K Oil and gas operations
2011:
RANKING company name
1 Wal-Mart Stores2 Royal dutch sheel
3 EXXON MOBIL
4 BP
5 Sinopec group
6 China national petroleum
7 Sate grid
8 Toyota motors
9 Japan post holdings10 Chevron
2010:
1 Wal-Mart Stores2 Royal dutch sheel
3 EXXON MOBIL
4 BP
5 Toyota motors
6 Japan post holdings7 Sinopec group
8 State grid
9 AXA
10 China national petroleum
2009:

7/31/2019 ifm assig
http://slidepdf.com/reader/full/ifm-assig 3/12
ranking Company name
1 Royal dutch sheel
2 EXXON MOBIL
3 Wal-Mart Stores
4 BP
5 Chevron6 Total
7 Conoco Phillips
8 ING group
9 Sinopec
10 Toyota motors
Total no. of MNCs in the world
World top for multinational corporations
The World Investment Report 2009, published by the UNCTAD (United Nations Conference on
Trade and Development), states there is a total of 889,416 multinational companies (MNCs)
around the world: 82,053 parent corporations and 807,363 affiliates. In 2008, the 100 largest

7/31/2019 ifm assig
http://slidepdf.com/reader/full/ifm-assig 4/12
MNCs’™ sales combined amounted to nearly $8.5 trillion. The top three MNCs in 2009
(according to UNCTAD) are: Citigroup Inc., Allianz SE and ABN AMRO holding NV.
The distribution of MNCs with headquarters in different countries has expanded remarkably. In
1999, in the top eight countries (USA, Japan, Germany, UK, Netherlands, France, Switzerland
and Sweden), there were 1,572 MNCs with sales of over $50 billion but this number jumped to4,008 with sales of over $200 billion in 2008. Hence percentage growth was 140 per cent. Even
more astonishing, the number of MNCs outside the leading eight countries in 1999 was 167. In
2008 this had risen to 1,384. In other words, an increase of 729 per cent.
Not surprisingly, the United States had the largest number of MNCs in 1999 or 26 per cent of the
world total. Although the number of MNCs by 2008 rose by 150 per cent, the US share of the
world total dropped to 22 per cent.
The countries which registered the fastest growth of MNCs during these years were the
Netherlands (248 per cent) and Germany (213 per cent). The bad news for the UK was that itreported the smallest increase in MNCs – only 24 per cent. This reduced its share of the world
total from 19 per cent in 1999 to 8 per cent in 2008.
Why have so few new MNCs been registered in the UK compared to the Netherlands and
Germany? The Dutch and Germans concentrate on expanding exports. This is clearly one of the
reasons. The UK experienced a rapid expansion of financial services and not exports.
There are now some 3,000 MNCs with sales over $1 billion operating in five or more countries
with global sales of almost $55 billion. At the other end of the spectrum, there are 12,000 MNCs
with sales over $100 million with operations in three or more countries. Global sales come to
$63 billion.
Now if one considers growth, a striking pattern emerges. If the global economy over the years
from 1999 to 2008 expanded by about 2.5 per cent per annum, MNCs achieved about 12.5 per
cent annual growth. Aggregate global sales rose even faster. This rapid growth is due to the
lowering of trade barriers, international sourcing, liberalisation of markets and expansion of free
trade areas.
A new survey – Global Network Outlook 2009 by BRC Consultancy – estimates that the telecom
market will be flat for the next two years but will then again resume its previous growth. This is
because telecom traffic will increase due to the need to work harder for sales. MNCs during arecession will cut capital expenditure. This, in turn, creates business opportunities for a supplier
who can take on a greater role, including ‘wider provision of customer services equipment and/or
outsourcing of applications formerly resourced in house’. The outsourcing and ‘network
adjacent’ service offerings of the major network service providers may well therefore have a
potential role as ‘recession busters’. Every recession may have a silver lining for the dynamic
company which is alert to these opportunities.

7/31/2019 ifm assig
http://slidepdf.com/reader/full/ifm-assig 5/12
Much attention has been paid of late to the BRIC (Brazil, Russia, India and China) countries.
They are demanding a greater say in the running of the International Monetary Fund (IMF), the
World Bank and Brazil and India want a permanent seat in the UN Security Council. China and
others are pressing for a new currency (Special Drawing Rights) to replace the US dollar as the
leading world reserve currency.
How do they fare in the world of MNCs? Not very well. Of the 5,400 MNCs with sales over
$100 billion in the top 30 countries, 33 have their headquarters in India, followed by China with
22 and Brazil with 15. Russia does not appear at all due to its policy of excluding MNCs from
participation in its ‘strategic industries’. Since technology transfer is an important aspect of
MNCs, it is clear that Russia is at a disadvantage by excluding significant foreign investment in
its prime industries.
About three quarters of the world’s MNCs have their headquarters in just eight countries. Thes e
are the companies which the G20 regulators would like to have greater influence over. They
would like to curtail, for example, the ability of MNCs to enter a country, make a profit and thenleave. This applies especially to the developing world.
Will the G20 regulators be capable of doing this? No. Take, for instance, raw materials. China is
now attempting to buy a share of MNCs which export to China. If it succeeds, these MNCs will
become even more powerful economically. Beijing has no interest in curtailing the activities of
those MNCs in which it has a stake.
There will be some consolidation of MNCs during this recession. They will probably emerge
even more powerful than before. The G20′s dream of regulating them effectively is just that – a
dream
Top 10 most profitable companies in the world
Rank Company 500 Rank2010 $
(millions)
1 Exxon Mobil 2 30,460.0
2 AT&T 12 19,864.0
3 Chevron 3 19,024.0
4 Microsoft 38 18,760.0
5 J.P. Morgan Chase & Co. 13 17,370.0
6 Wal-Mart Stores 1 16,389.0
7 International Business 18 14,833.0

7/31/2019 ifm assig
http://slidepdf.com/reader/full/ifm-assig 6/12
Machines
8 Apple 35 14,013.0
9 Johnson & Johnson 40 13,334.0
10 Berkshire Hathaway 7 12,967.0
Top 10 fastest growers
Rank Company 500 Rank2010 % Growth
in EPS
1 Autoliv 329 5,225.0
2 Nash-Finch 449 1,738.1
3 Kroger 25 1,481.8
4 Broadcom 343 1,430.8
5 Harris 429 1,428.6
6 Owens Corning 448 1,374.0
7 BorgWarner 403 1,234.8
8 TRW Automotive Holdings 171 1,172.5
9 FedEx 73 1,112.9
10 Capital One Financial 134 712.2
Top 10 biggest employers
1. US Department of Defense = 3.2 Million
2. Peoples Liberation Army, China = 2.3 Million
3. Wal-Mart = 2.1 million
4. McDonalds = 1.9 million
5. UK National Health Service = 1.7 million
6. China National Petroleum Corporation = 1.6 million
7. State grid corporation of china = 1.5 million
8. Indian Railways = 1.4 Million

7/31/2019 ifm assig
http://slidepdf.com/reader/full/ifm-assig 7/12
9. Indian Armed Forces = 1.3 million
10. Hon hai precision Industry Foxconn = 1.2 million
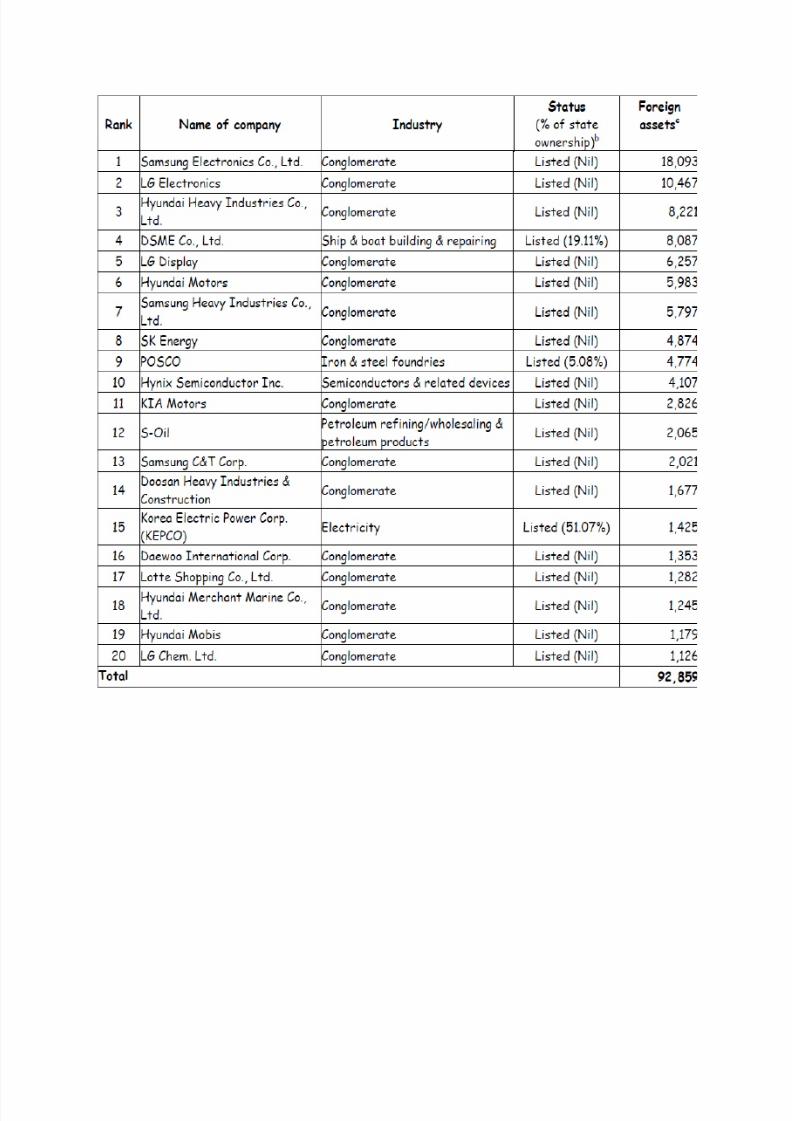
Top 20 of the largest MNCs ranked by the size of foreignassets
7/31/2019 ifm assig
http://slidepdf.com/reader/full/ifm-assig 8/12

7/31/2019 ifm assig
http://slidepdf.com/reader/full/ifm-assig 9/12
Best countries to invest
Rank Company 500 Rank 2010 %
1 Las Vegas Sands 342 207.6
2 CC Media Holdings 391 190.3
3 Cummins 186 142.7
4 Tenneco 386 132.1
5 Western Refining 298 124.6
6 TRW Automotive Holdings 171 120.7
7 BorgWarner 403 117.8
8 Dillard's 370 107.1
9 US Airways Group
208 106.8
10 Universal American 401 99.7
11 Wesco International 443 95.5
12 American International Group 17 92.2
13 Qwest Communications 209 91.0
14 Limited Brands 258 85.4
15 United Continental Holdings 114 84.5
16 Whole Foods Market 273 84.3
17 Foot Locker 446 83.9
18 Autoliv 329 83.8
19 Meritor 463 83.5
20 Family Dollar Stores 302 81.5

7/31/2019 ifm assig
http://slidepdf.com/reader/full/ifm-assig 10/12
Internet Exercise
SALES AND REVENUES:
DELL
Fiscal-Year 2012 Fourth Quarter and Full Year Highlights
Fourth Quarter Fiscal Year
(in millions) FY12 FY11 Change FY12 FY11 Change
Revenue $16,031 $15,692 2% $62,071 $61,494 1%
Operating
Income
(GAAP)
$931 $1,145 (19)% $4,431 $3,433 29%
Net Income
(GAAP)$764 $927 (18)% $3,492 $2,635 33%
EPS(GAAP)
$0.43 $0.48 (10)% $1.88 $1.35 39%
Operating
Income
(non-
GAAP)
$1,143 $1,286 (11)% $5,135 $4,149 24%
Net Income
(non-GAAP)$913 $1,018 (10)% $3,952 $3,106 27%
EPS (non-
GAAP)$0.51 $0.53 (4)% $2.13 $1.59 34%

7/31/2019 ifm assig
http://slidepdf.com/reader/full/ifm-assig 11/12
No. of Subsidiaries
ALINWARE
Alienware is a United States computer hardware subsidiary of Dell, Inc. It mainly assemblesthird party components into desktopsand laptops with custom enclosures. Alienware also offers
for sale rebadged computer peripherals, such as headsets, computer mice, monitors and
keyboards. Their hardware has a distinctive "sci-fi" style, typically including decorative lighting.
Alienware was founded in 1996 by Nelson Gonzalez and Alex Aguila. Alienware's corporate
headquarters is located in The Hammocks, unincorporated Miami-Dade County, Florida,
near Miami.
Gaming laptops
Gaming desktops
DELL subsidiaries countries exporting to imports of that companyAustria, Belgium, Channel Islands, Czech Republic, Denmark, England (UK), Finland, France, Germany,
Gibraltar (UK), Guernsey UK), Ireland, Isle Of Man (UK), Italy, Jersey (UK), Liechtenstein, Luxembourg,
Monaco, Netherlands, Norway, Poland, Portugal, Scotland (UK), Slovakia, South Africa, Spain, Sweden,
Switzerland, United Kingdom and Wales (UK).
Head quarters:
Dell, Inc. (NASDAQ: DELL) is an American multinational computer technology corporation
based in 1 Dell Way, Round Rock, Texas, United States, that develops, sells and supports
computers and related products and services. Bearing the name of its founder, Michael Dell, the
company is one of the largest technological corporations in the world, employing more than
103,300 people worldwide. Dell is listed at number 41 in the Fortune 500 list. It is the third
largest PC maker in the world after HP and Lenovo.
Dell has grown by both increasing its customer base and through acquisitions since its inception;
notable mergers and acquisitions including Alien ware (2006) and Perot Systems (2009). As of
2009, the company sold personal computers, servers, data storage devices, network switches,
software, and computer peripherals. Dell also sells HDTVs, cameras, printers, MP3 players and
other electronics built by other manufacturers. The company is well known for its innovations
in supply chain management and electronic commerce.
Fortune Magazine listed Dell as the sixth largest company in Texas by total revenue. It is the
second largest non-oil company in Texas – behind AT&T – and the largest company in
the Austin, Texas area

7/31/2019 ifm assig
http://slidepdf.com/reader/full/ifm-assig 12/12
Growth in 1990s and early 2000s
From 1997 to 2004, Dell enjoyed steady growth and it gained market share from competitors
even during industry slumps.
In 1996, Dell began selling computers through its website, and in 2002, it expanded its product
line to include televisions, handhelds, digital audio players, and printers. Dell's first acquisitionoccurred in 1999 with the purchase of Converge Net Technologies.
Dell surpassed Compaq to become the largest PC manufacturer in 1999. In 2002, when Compaq
merged with Hewlett Packard (the 4th place PC maker), the combined Hewlett Packard took the
top spot but struggled and Dell soon regained its lead
In 2003, the company was rebranded as simply "Dell Inc." to recognize the company's expansion
beyond computers.
In 2004, Michael Dell resigned as CEO while retaining the title of Chairman, handing the CEO
title to Kevin Rollins who was the President and COO. Under Rollins, Dell began to loosen its
ties to Microsoft and Intel, the two companies which were responsible for Dell's dominance in
the PC business. During that time, Dell acquired Alienware, which introduced several new items
to Dell products, including AMD microprocessors. To prevent cross-market products, Dell
continues to run Alien ware as a separate entity, but still a wholly owned subsidiary.