iea - montly oil market report - july 2011
TRANSCRIPT

8/6/2019 IEA - Montly Oil Market Report - July 2011
http://slidepdf.com/reader/full/iea-montly-oil-market-report-july-2011 1/69
13 Ju l y 201 1
HIGHLIGHTS
• The IEA announced on 23 June a coordinated release of 60 mb of strategic
stocks for an initial 30 days, in response to the ongoing Libyan crisis. The
Libya collective action aimed to provide a bridge between rising oil demand
in 3Q11 and extra supplies made available by major OPEC producers.
• Crude oil prices were volatile in June, after an initial bearish impact from
the collective action was tempered by non‐OPEC supply outages. Early
indications are that the stock release has helped realign sweet‐sour price
spreads, distorted by lost Libyan barrels, and flattened earlier Brent
backwardation. Brent and WTI were last trading at $116/bbl and $95/bbl.
• Global oil demand in 2012 is expected to rise by 1.5 mb/d year‐on‐year to
91.0 mb/d. Growth is driven entirely by non‐OECD countries, with OECD
demand
declining
slightly.
The
global
estimate
for
2011
is
raised
by
0.2 mb/d to 89.5 mb/d (+1.2 mb/d year‐on‐year), with upward non‐OECD
baseline revisions outweighing downward adjustments in the OECD on
persistent high prices and weaker economic activity.
• Global refinery throughputs are set to increase by 2.3 mb/d to 75.9 mb/d
from 2Q11 to 3Q11, on lower maintenance and as refiners strive to meet
seasonally higher demand. The sharp rise follows an exceptionally weak
2Q11, when runs were curtailed by extensive turnarounds, Libyan crude
and refining outages, earthquake damage in Japan and poor margins.
• Global oil supply in June increased by 1.2 mb/d from May, to average
88.3 mb/d, with OPEC crude rising by 0.8 mb/d to 30 mb/d as Saudi Arabia
boosted supply. Non‐OPEC supply is now seen averaging a lower 53.1 mb/d
in 2011, on prolonged production outages, before rising to 54 mb/d in 2012.
The ‘call on OPEC crude and stock change’ now rises by 1.3 mb/d in 3Q11 to
31.3 mb/d. It averages 30.7 mb/d for 2012, +0.1 mb/d versus 2011.
• OECD industry stocks rose by 23.9 mb to 2 680 mb or 58.6 days of forward
demand cover in May. Preliminary June data point to a decline in both
onshore OECD industry stocks and short‐term oil floating storage. This takes
end‐June onshore stocks close to five‐year average levels, after many
months of substantial overhang versus historical levels.

8/6/2019 IEA - Montly Oil Market Report - July 2011
http://slidepdf.com/reader/full/iea-montly-oil-market-report-july-2011 2/69

8/6/2019 IEA - Montly Oil Market Report - July 2011
http://slidepdf.com/reader/full/iea-montly-oil-market-report-july-2011 3/69
INTERNATIONAL ENERGY AGENCY ‐ O IL MARKET REPORT MARKET OVERVIEW
13 JULY 2011 3
PROVIDING LIQUIDITY TO A TIGHTER MARKET
This month provides a first detailed look at OMR projections for 2012, while also incorporating
consolidated annual 2009/2010 oil data for non‐OECD and OECD countries, respectively. With higher
underlying non‐OECD demand (but persistent weakness in the OECD), and a string of 2011 supply‐side
outages, over and above the one in Libya, the market ledger this month looks slightly tighter than a
month ago. Our balances for first‐half 2011 show demand continuing to run ahead of supply, if a little
less rapidly than in 2H10. Of course, upward price momentum has also come from the absence of
1.5 mb/d of light/sweet Libyan crude. The ‘call on OPEC crude and stock change’ is now 31.3 mb/d for
3Q11 (a significant, if as‐yet unquantifiable, portion of this will come from the IEA’s Libya collective
action). The ‘call’ then fluctuates between 29.8‐31.4 mb/d through end‐2012. Major producers have
recognised that demand for their oil is rising, with the seasonal uptick in 3Q11 refinery runs, and more
generally as economic growth and short‐term fuel substitution keep global and emerging market
demand growth robust. We welcome rising OPEC volumes seen in June (30.03 mb/d output), but the
market needs still more oil for 3Q.
-2.0
-1.5
-1.0
-0.5
0.0
0.5
1.0
83
84
85
86
87
88
89
90
1Q07 1Q08 1Q09 1Q10 1Q11
mb/dmb/dDemand/Supply Balance into 2Q11
Implied Stock Ch.&Misc to Bal (RHS)
Oil Demand
Oil Supply
Emergency Oil Stocks of 60 mb*
Made Available From IEA Action
36%
64%
Government
Stock Draw,
Lowered
Industry
Obligation,
* Likely split: 67% crude and 33% products
This backdrop is simply a more vivid version of the one underpinning the IEA action, which commenced
on 23 June. Member governments agreed to release 60 mb of strategic stocks for an initial 30 days, amid
an ongoing disruption to light‐sweet Libyan oil supplies, the anticipated rise in 3Q11 refiner and end‐user
demand and a likely hiatus before incremental OPEC barrels reach the market. Much ink has been spilt
subsequently suggesting that the IEA action comes three months too late, depletes emergency stockpiles
and has failed to reduce rampant crude and motor fuel prices. However, we feel compelled to point out
that critics cannot have their cake and eat it too.
Market intervention in late‐February, when the Libyan crisis broke and prices surged by at least $10/bbl,
would have been tempting, were price control really the prime motivation. But the presence of a supply
disruption, and sharply higher prices is not, by itself, justification for a collective action. Market context is
also important. Refiner crude demand was falling seasonally in March and April, but rising sharply in June
and moving higher still in July and August, despite modest refining margins. Early‐year industry stocks
looked comfortable back in March, and there was a presumption then that other OPEC producers would
immediately step in to boost supply to replace Libyan outages. In contrast, the absence up until June of
major OPEC increases implied a real possibility that commercial stocks could fall to the bottom of their
seasonal range, risking a renewed, damaging and sustained surge in international prices in 3Q11. The IEA
therefore decided to act to address this supply‐side issue, even though prices were then trending lower.
Moreover, the collective action is about providing short ‐term physical liquidity to the market: a
combination of draws in strategic stocks of light‐sweet crude and products and the added flexibility of
reduced mandatory obligations for refiners. So far, the action involves just over 1% of total IEA inventory
‐ hardly a depletion of reserves for future emergencies. That said, oil made available by the collective

8/6/2019 IEA - Montly Oil Market Report - July 2011
http://slidepdf.com/reader/full/iea-montly-oil-market-report-july-2011 4/69
8/6/2019 IEA - Montly Oil Market Report - July 2011
http://slidepdf.com/reader/full/iea-montly-oil-market-report-july-2011 5/69
INTERNATIONAL ENERGY AGENCY ‐ O IL MARKET REPORT DEMAND
13 JULY 2011 5
DEMAND
Summary
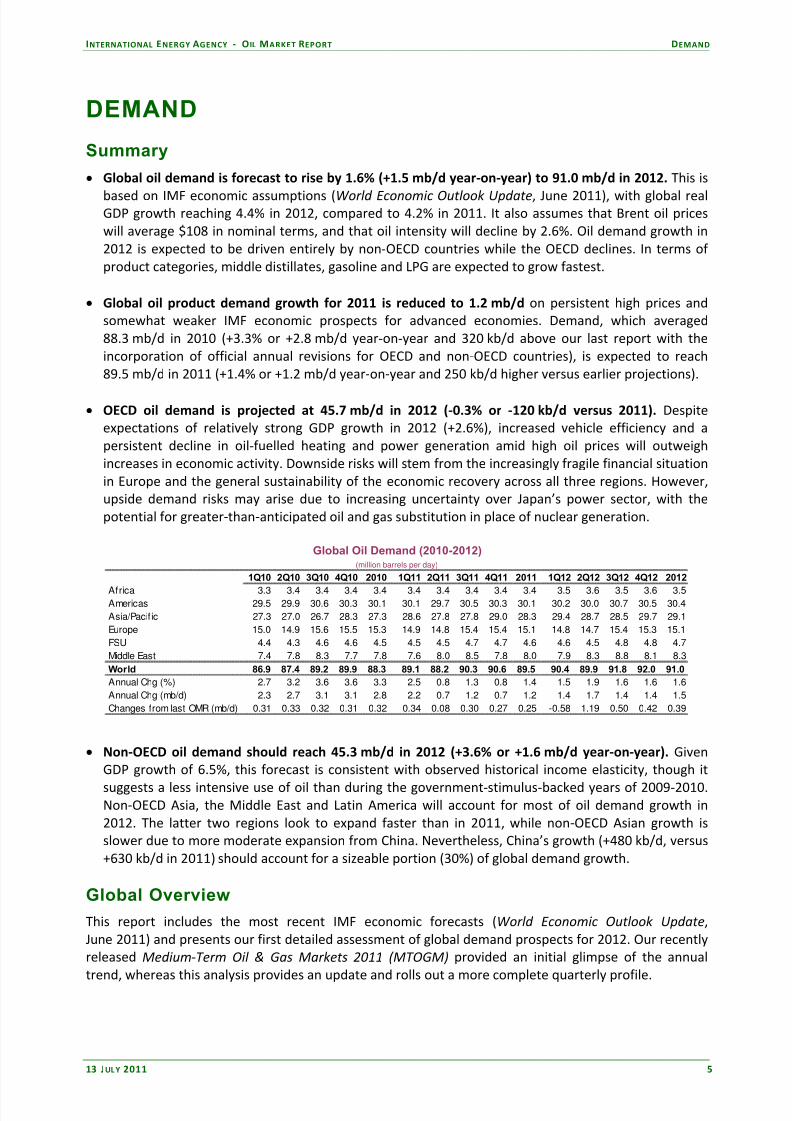
• Global oil demand is forecast to rise by 1.6% (+1.5 mb/d year‐on‐year) to 91.0 mb/d in 2012. This is
based on IMF economic assumptions (World Economic Outlook Update, June 2011), with global real
GDP growth reaching 4.4% in 2012, compared to 4.2% in 2011. It also assumes that Brent oil prices
will average $108 in nominal terms, and that oil intensity will decline by 2.6%. Oil demand growth in
2012 is expected to be driven entirely by non‐OECD countries while the OECD declines. In terms of
product categories, middle distillates, gasoline and LPG are expected to grow fastest.
• Global oil product demand growth for 2011 is reduced to 1.2 mb/d on persistent high prices and
somewhat weaker IMF economic prospects for advanced economies. Demand, which averaged
88.3 mb/d in 2010 (+3.3% or +2.8 mb/d year‐on‐year and 320 kb/d above our last report with the
incorporation of official annual revisions for OECD and non‐OECD countries), is expected to reach
89.5 mb/d in 2011 (+1.4% or +1.2 mb/d year‐on‐year and 250 kb/d higher versus earlier projections).
• OECD oil demand is projected at 45.7 mb/d in 2012 (‐0.3% or ‐120 kb/d versus 2011). Despite
expectations of relatively strong GDP growth in 2012 (+2.6%), increased vehicle efficiency and a
persistent decline in oil‐fuelled heating and power generation amid high oil prices will outweigh
increases in economic activity. Downside risks will stem from the increasingly fragile financial situation
in Europe and the general sustainability of the economic recovery across all three regions. However,
upside demand risks may arise due to increasing uncertainty over Japan’s power sector, with the
potential for greater‐than‐anticipated oil and gas substitution in place of nuclear generation.
Global Oil Demand (2010-2012)(million barrels per day)
1Q10 2Q10 3Q10 4Q10 2010 1Q11 2Q11 3Q11 4Q11 2011 1Q12 2Q12 3Q12 4Q12 2012
Africa 3.3 3.4 3.4 3.4 3.4 3.4 3.4 3.4 3.4 3.4 3.5 3.6 3.5 3.6 3.5Americas 29.5 29.9 30.6 30.3 30.1 30.1 29.7 30.5 30.3 30.1 30.2 30.0 30.7 30.5 30.4
Asia/Pacific 27.3 27.0 26.7 28.3 27.3 28.6 27.8 27.8 29.0 28.3 29.4 28.7 28.5 29.7 29.1
Europe 15.0 14.9 15.6 15.5 15.3 14.9 14.8 15.4 15.4 15.1 14.8 14.7 15.4 15.3 15.1
FSU 4.4 4.3 4.6 4.6 4.5 4.5 4.5 4.7 4.7 4.6 4.6 4.5 4.8 4.8 4.7
Middle East 7.4 7.8 8.3 7.7 7.8 7.6 8.0 8.5 7.8 8.0 7.9 8.3 8.8 8.1 8.3
World 86.9 87.4 89.2 89.9 88.3 89.1 88.2 90.3 90.6 89.5 90.4 89.9 91.8 92.0 91.0
Annual Chg (%) 2.7 3.2 3.6 3.6 3.3 2.5 0.8 1.3 0.8 1.4 1.5 1.9 1.6 1.6 1.6
Annual Chg (mb/d) 2.3 2.7 3.1 3.1 2.8 2.2 0.7 1.2 0.7 1.2 1.4 1.7 1.4 1.4 1.5
Changes from last OMR (mb/d) 0.31 0.33 0.32 0.31 0.32 0.34 0.08 0.30 0.27 0.25 -0.58 1.19 0.50 0.42 0.39
• Non‐OECD oil demand should reach 45.3 mb/d in 2012 (+3.6% or +1.6 mb/d year‐on‐year). Given
GDP growth of 6.5%, this forecast is consistent with observed historical income elasticity, though it
suggests a less intensive use of oil than during the government‐stimulus‐backed years of 2009‐2010.
Non‐OECD Asia, the Middle East and Latin America will account for most of oil demand growth in
2012. The latter two regions look to expand faster than in 2011, while non‐OECD Asian growth is
slower due to more moderate expansion from China. Nevertheless, China’s growth (+480 kb/d, versus
+630 kb/d in 2011) should account for a sizeable portion (30%) of global demand growth.
Global Overview
This report includes the most recent IMF economic forecasts (World Economic Outlook Update,
June 2011) and presents our first detailed assessment of global demand prospects for 2012. Our recently
released Medium‐Term Oil & Gas Markets 2011 (MTOGM) provided an initial glimpse of the annual
trend, whereas this analysis provides an update and rolls out a more complete quarterly profile.

8/6/2019 IEA - Montly Oil Market Report - July 2011
http://slidepdf.com/reader/full/iea-montly-oil-market-report-july-2011 6/69
DEMAND INTERNATIONAL ENERGY AGENCY ‐ O IL MARKET REPORT
6 13 JULY 2011
The economic outlook has changed little since the Fund’s
previous forecast in April 2011, with global GDP growth
adjusted only 0.1% lower in 2011 and unchanged for
2012. The economic assessment has grown more
cautious, however, with slowing 1H11 industrial activity in
the US, increased financial risk in the euro area and rising inflation, which is prompting monetary tightening in some
key emerging markets. Part of this economic pause is
arguably related to a temporary disruption of global
supply chains following the March earthquake and
tsunami in Japan. As such, after slowing in 2Q11,
economic growth should strengthen in the second half of
the year. Growth is expected to be driven largely by
emerging economies, with increased economic downside
risks in the OECD.
Indeed, oil demand growth in 2012 is expected to be driven entirely by non‐OECD countries (+3.6% or
+1.6 mb/d), while the OECD gently declines (‐0.3% or
‐0.1 mb/d). Non‐OECD Asia, Latin America and the Middle
East will account for virtually all of global growth in 2012,
with China generating 30%, though the overall non‐OECD
growth rate is slightly slower versus 2011. Structural
declines borne out through improved efficiency will
continue in the OECD, though stronger economic growth
versus 2011, particularly in the US and Japan, will provide
an offsetting demand support. Global product demand in
2012
will
be
led
by
middle
distillates,
gasoline
and
LPG.
Aside from economic growth, downside pressures from higher‐than‐expected oil prices also represent a
risk to the forecast. While we assume a nominal Brent price of $108/bbl and no significant changes to
emerging market price subsidy regimes in 2012, a higher price profile would weaken demand growth, in
particular through exacerbated declines in the OECD. Indeed, the most recent demand data for 2011 –
albeit preliminary – indicate that a combination of high oil prices (some $10/bbl above our current
annual assumption) and slower economic growth have sapped oil demand growth since the beginning of
the year. Total OECD demand contracted by 1.9% year‐on‐year in May and non‐OECD demand growth
stood at 4.8%. Nevertheless, this represents an uptick from April, when the OECD declined by 2.7% and
the non‐OECD grew by only 3.5%. As such, should price pressures ease and stronger economic growth
materialise,
as
assumed
by
this
forecast,
declines
in
global
demand
growth
would
level
off,
with
potentially subdued increases over the next 18 months.
World: Total Demand Growth by
Region, Actual & F'Cast
1.5
2.8
1.2
(1.0)(0.6)
1.5
(2.5)
(1.5)
(0.5)
0.5
1.5
2.5
3.5
2007 2008 2009 2010 2011 2012
mb/d
OECDNon-OECDWORLD
Real GDP vs. Oil Demand Growth
1981-2012
-4
-3
-2
-1
0
1
2
3
4
-2 0 2 4 6Global Real GDP Grow th, %
A n n u a l O i l D e m a n d
G r o w t h , %
2009
1982
1981
1983/2008
20102004
20071991
2011
2012
% change 2011 2012
WORLD 4.2 4.4
OECD 2.3 2.6
OECD, North America 2.7 2.8
OECD, Europe 2.4 2.0
OECD, Pacific 0.9 3.3
Non-OECD 6.5 6.5
Africa 3.9 4.8
Latin America 4.5 4.1
China (excl. Hong Kong) 9.6 9.5
Other Asia 6.5 6.4
Non-OECD Europe 2.2 3.8
FSU 5.0 4.6
Middle East 5.1 5.2
WORLD (0.1) (0.0)
OECD (0.1) (0.0)
OECD, North America (0.2) (0.2) OECD, Europe 0.4 (0.1)
OECD, Pacific (1.3) 0.6
Non-OECD (0.0) 0.0
Africa (0.0) (0.1)
Latin America (0.1) (0.1)
China (excl. Hong Kong) (0.0) 0.0
Other Asia (0.0) 0.0
Non-OECD Europe 0.0 (0.2)
FSU 0.1 0.0
Middle East 0.1 0.3
Sources: IMF, IEA
Current vs. PreviousOMR dated 12 May 2011
Real GDP GrowthOMR dated 13 July 2011

8/6/2019 IEA - Montly Oil Market Report - July 2011
http://slidepdf.com/reader/full/iea-montly-oil-market-report-july-2011 7/69
INTERNATIONAL ENERGY AGENCY ‐ O IL MARKET REPORT DEMAND
13 JULY 2011 7
Demand in 3Q11 is forecast to rise 1.3% (+1.2 mb/d) year‐
on‐year to 90.3 mb/d. Moreover, the quarter‐on‐quarter
increment (+2.2 mb/d), led by the OECD (+1.8 mb/d),
looks strong when compared to an especially weak 2Q11.
This global increase is higher than the 10‐year average
change from second to third quarter (+1.2 mb/d, excluding 2008). Part of this higher‐than‐normal jump
reflects implicitly stronger economic growth prospects for
3Q11 relative to 2Q11, particularly in the US and Japan,
where reconstruction activity from March’s devastating
earthquake and tsunami is evident. This support
augments anticipated seasonal rises in heating oil
purchases in Europe as well as summer transport fuel increases across a number of OECD markets.
However, it also benefits from more structural increases in oil‐fired power generation anticipated during
the summer, particularly in Japan, China and Saudi Arabia. Moreover, with uncertainty over viable
(Japan) and economic (China) generation capacity, greater‐than‐expected oil‐based generation
represents an upside risk to the forecast during this year and next.
Global Oil Demand Growth 2010/2011/2012thousand barrel s per day
(mb/d)
2010 2.80 3.3%
2011 1.20 1.4%
2012 1.47 1.6%
Global Demand Growth219
302245
218287 268
40125
54
North America
Latin America
Africa
Middle East
Europe
1459
959780
Asia
-109
-153
-37289
126 94
FSU516
-207
-3
Finally, this month’s issue also includes baseline revisions across all OECD regions, with most countries,
except the US, having submitted their official estimates for 2010 oil demand and, in some cases, revised
previous years as well. Overall, total OECD demand has been increased by 60 kb/d in 2010, with this
adjustment largely carried forward. On the non‐OECD side, the incorporation of additional official
estimates for 2009, notably for Russia and several Middle East countries, has revised up non‐OECD oil
demand by 230 kb/d for that year, with the adjustment, again, largely carried forward.
OECD
According to preliminary data, OECD inland deliveries (oil products supplied by refineries, pipelines and
terminals) contracted by 1.9% year‐on‐year in May. Demand declined by 3.0% in the OECD Pacific, with
weak deliveries of LPG, jet fuel/kerosene, residual fuel oil and ‘other products’. In OECD North America
(which includes US Territories), demand fell by 2.6%, largely on depressed gasoline, LPG and ‘other
products’
deliveries.
The
decline
in
OECD
Europe
demand
was
marginal
with
a
rebound
in
diesel
and
naphtha deliveries largely offsetting declines in gasoline and heating oil.
World: Total Oil Product Demand
(6)
(4)
(2)
-
2
4
6
Jan Apr Jul Oct Jan
Y-o-Y
% Chg
2008 2009 2010 2011

8/6/2019 IEA - Montly Oil Market Report - July 2011
http://slidepdf.com/reader/full/iea-montly-oil-market-report-july-2011 8/69
DEMAND INTERNATIONAL ENERGY AGENCY ‐ O IL MARKET REPORT
8 13 JULY 2011
OECD Demand based on Adjusted Preliminary Submissions - May 2011(million barrels per day)
mb/d % pa mb/d % pa mb/d % pa mb/d % pa mb/d % pa mb/d % pa mb/d % pa
OECD North Ame rica* 10.40 -3.7 1.62 -1.6 4.03 6.6 0.82 -3.6 0.93 -1.7 5.08 -6.94 22.88 -2.6
US50 8.83 -4.3 1.43 -0.8 3.45 7.5 0.38 -10.8 0.55 8.6 3.77 -7.9 18.42 -2.6
Canada 0.73 -0.2 0.10 -12.7 0.23 0.1 0.28 4.0 0.10 -0.9 0.71 0.0 2.15 -0.2
Mexico 0.78 -0.8 0.05 -3.2 0.30 3.3 0.13 3.3 0.19 -23.6 0.54 -9.0 2.00 -5.1
OECD Europe 2.21 -1.3 1.28 0.6 4.34 3.3 1.23 -16.0 1.18 4.1 3.64 1.9 13.88 0.0
Germany 0.50 2.7 0.19 -2.3 0.70 7.4 0.27 -22.6 0.15 12.2 0.68 22.3 2.50 4.9
United Kingdom 0.34 -5.5 0.31 -0.6 0.44 0.1 0.10 -6.0 0.06 15.3 0.30 -10.9 1.55 -3.5
France 0.19 4.5 0.16 0.5 0.70 7.0 0.13 -35.2 0.11 30.0 0.43 -2.9 1.72 -0.3
Italy 0.23 -3.4 0.10 -7.4 0.50 3.7 0.09 -2.4 0.11 0.0 0.39 -4.8 1.42 -1.4
Spain 0.12 -9.1 0.13 12.2 0.46 -3.2 0.13 -18.9 0.19 5.9 0.31 -1.7 1.33 -2.8
OECD Pacific 1.49 0.2 0.54 -13.5 1.03 1.6 0.41 -9.9 0.63 -7.2 2.77 -2.0 6.87 -3.0
Japan 0.94 -0.4 0.29 -18.3 0.36 2.1 0.31 -8.2 0.38 1.5 1.47 -2.4 3.75 -3.1
Korea 0.19 -2.6 0.11 -17.6 0.27 -4.1 0.09 -16.2 0.22 -22.6 1.13 -1.2 2.02 -6.4
Australia 0.31 1.0 0.12 3.9 0.35 3.3 0.00 0.0 0.02 4.5 0.16 -5.3 0.96 1.1
OECD Total 14.10 -3.0 3.44 -2.9 9.41 4.5 2.45 -11.2 2.74 -0.7 11.49 -3.1 43.64 -1.9
* Including US territo ries
RFO Other otal ProductsGasoline Jet/Kerosene Diesel Other Gasoil
Downward revisions to April preliminary data were large (‐610 kb/d) and concentrated in North America
and the Pacific. In the former, revisions stemmed from lower deliveries for all products except residual
fuel oil, with diesel revised down 460 kb/d. In the latter, a downward revision to ‘other products’ led the
adjustment. Revisions to OECD Europe, by contrast, were positive due to naphtha and heating oil. In all,
OECD demand growth stood at ‐2.7% for April, versus ‐1.2% previously. Total OECD oil product demand
is raised by 60 kb/d to 46.2 mb/d in 2010 following the incorporation of official annual submissions
across most countries except for the US. Growth, at +1.2% or +560 kb/d year‐on‐year, remains
unchanged given a similar adjustment for 2009. The prognosis for 2011, by contrast, has been trimmed
by 110 kb/d to 45.8 mb/d (‐0.8% or ‐390 kb/d versus the previous year), largely on weaker prospects for
North America. In 2012, OECD demand is expected to shrink by 0.3% (‐120 kb/d) to 45.7 mb/d.
OECD: Total Oil Product Demand
43
46
49
52
Jan Apr Jul Oct Jan
mb/d
Range 2006-2010 5-year avg
2010 2011
OECD: Demand by Driver, Y-o-Y Chg
(2.5)
(2.0)
(1.5)
(1.0)
(0.5)
-
0.5
1.0
2008 2009 2010 2011 2012
mb/d
Transport HeatingPower Gen. Other Total Dem .
North America
Preliminary data show oil product demand in North America (including US territories) falling by 2.6%
year‐on‐year in May, following a 1.6% decrease in April, due to high prices and slowing economic activity.
Indeed, the IMF’s latest assessment has revised down North American GDP growth for 2011 and 2012 by
0.2% to 2.7% and 2.8%, respectively. Much of this adjustment comes from the US, where downward
revisions to April monthly data were heavy and May/June preliminary data have been weak. Economic
growth and oil demand look to improve somewhat from 3Q11 onwards, though the sustainability of the
recovery remains an uncertainty, particularly with the US labour market remaining weak. Overall, North
American demand is set to fall 0.9% (‐210 kb/d) to 23.6 mb/d in 2011 and remain flat for 2012.

8/6/2019 IEA - Montly Oil Market Report - July 2011
http://slidepdf.com/reader/full/iea-montly-oil-market-report-july-2011 9/69

8/6/2019 IEA - Montly Oil Market Report - July 2011
http://slidepdf.com/reader/full/iea-montly-oil-market-report-july-2011 10/69
DEMAND INTERNATIONAL ENERGY AGENCY ‐ O IL MARKET REPORT
10 13 JULY 2011
respectively. After falling by 1.4% (‐30 kb/d) in 2011 to 2.0 mb/d, Mexican oil demand is expected to
remain unchanged on average for 2012.
Mexico: Motor Gasoline Demand
650
700
750
800
850
Jan Apr Jul Oct Jan
kb/d
Range 2006-2010 5-year avg2010 2011
Mexico: Diesel Demand
250
260
270
280
290
300310
320
Jan Apr Jul Oct Jan
kb/d
Range 2006-2010 5-year avg2010 2011
Europe
Preliminary inland data indicate that oil product demand in Europe remained essentially unchanged in
May versus 2010, with stronger deliveries of diesel and naphtha offsetting declines in heating oil and
gasoline. The contraction in heating oil demand likely signifies both structural decline and delays in
consumer tank refilling owing to prevailing high prices. The increase in naphtha demand stems almost
entirely from Germany, while diesel strength was due to higher readings across a range of countries.
However, this apparent rebound in transport demand may stem partially from fewer holidays versus the
prior year.
Revisions to preliminary April demand data were positive (+230 kb/d), with stronger‐than expected
readings for naphtha and heating oil more than offsetting weaker deliveries of jet fuel/kerosene and
diesel.
With
annual
official
submissions,
total
oil
product
demand
in
OECD
Europe
was
revised
up
by
130 kb/d to 14.6 mb/d in 2010, with declines (‐0.6% or ‐80 kb/d compared with the previous year)
reduced given a smaller baseline revision to 2009.
OECD Europe:
Total Oil Product Demand
13.5
14.0
14.5
15.0
15.5
16.0
16.5
Jan Apr Jul Oct Jan
mb/d
Range 2006-2010 5-year avg2010 2011
OECD Europe: Demand by Driver,
Y-o-Y Chg
(0.8)
(0.6)
(0.4)
(0.2)
-
0.2
2008 2009 2010 2011 2012
mb/d
Transport HeatingPower Gen. Other Total Dem .
The outlook for OECD Europe demand in 2011 is raised by 160 kb/d to 14.4 mb/d (‐1.1% or ‐160 kb/d
versus 2010) with a more robust economic growth assumption of 2.4%. In 2012, OECD Europe demand is
expected to decline by 0.4% (‐60 kb/d) to remain near 14.4 mb/d, with falls in most product categories
outweighing growth in distillates. Economic growth, at only 2.0% for 2012, remains a downside risk,
particularly with increased austerity measures and heightened financial risk from peripheral countries.
In May, according to preliminary data, oil product deliveries in Germany increased by 4.9% year‐on‐year
following a 1.8% rise in April. Demand growth was robust in naphtha (+30.0%) amid strong industrial

8/6/2019 IEA - Montly Oil Market Report - July 2011
http://slidepdf.com/reader/full/iea-montly-oil-market-report-july-2011 11/69
INTERNATIONAL ENERGY AGENCY ‐ O IL MARKET REPORT DEMAND
13 JULY 2011 11
production, and in diesel (+7.4%). However, the presence of two additional working days versus May
2010, due to the holiday calendar, may partly explain the jump in usage in the face of higher oil prices.
Higher economic growth – revised up by 0.7% to 3.2% for 2011 – was also supportive. Nevertheless,
German demand is expected to decline by 0.2% in 2011. With slowing GDP growth, at 2.0%, in 2012,
demand is forecast to fall by 0.5% (‐10 kb/d) to 2.5 mb/d.
Germany: Naphtha Demand
290
340
390
440
490
540
Jan Apr Jul Oct Jan
kb/d
Range 2006-2010 5-year avg
2010 2011
Germany: Diesel Demand
450
500
550
600
650
700
750
800
Jan Apr Jul Oct Jan
kb/d
Range 2006-2010 5-year avg
2010 2011 Total oil demand readings were mixed in other major European markets in May. In France (‐0.3% year‐
on‐year), diesel demand growth (+7.0%) was strong, again due to more working days, but may also
reflect upwardly revised economic growth. By contrast, heating oil deliveries remained weak (‐35.2%),
with warm weather and consumers delaying tank filling in the face of high prices. In Turkey (+6.7%)
diesel demand has surged on the back of strong economic growth – GDP growth for 2011 was revised up
by 4.1% to 8.7%. Overheating concerns remain and economic growth is expected to slow to 2.5% in
2012. Nevertheless, with annual increments expected at 2.5% (+20 kb/d) in both 2011 and 2012, Turkey
represents Europe’s strongest oil demand growth engine. Elsewhere, May featured falling demand in the
UK (‐3.5%), Italy (‐1.4%) and Spain (‐2.8%) where high oil prices and weaker economic prospects are
taking their toll on consumption.
France: Heating Oil Demand
120
220
320
420
520
620
Jan Apr Jul Oct Jan
kb/d
Range 2006-2010 5-year avg2010 2011
Turkey: Diesel Demand
100
150
200
250
300
Jan Apr Jul Oct Jan
kb/d
Range 2006-2010 5-year avg2010 2011
Pacific
Preliminary data indicate that oil product demand in the Pacific fell by 3.0% year‐on‐year in May. Weaker
economic activity in the aftermath of Japan’s devastating earthquake and tsunami has played a
significant role, with all product categories declining except for diesel and residual fuel oil. The latest IMF
assessment suggests that after declining on average by 1.4% during 2Q11‐3Q11, Japan’s economy will
rebound in 4Q11, growing by 0.8% year‐on‐year. This represents a lower annual GDP profile than in
previous assessments, with 2011 growth cut from +1.4% to ‐0.7%. Our forecast for 2011 sees demand
declining to 4.4 mb/d (‐0.2% or ‐10 kb/d year‐on‐year), as reductions linked to the earthquake and
tsunami are largely offset by boosts from reconstruction activity and oil burning for power generation.

8/6/2019 IEA - Montly Oil Market Report - July 2011
http://slidepdf.com/reader/full/iea-montly-oil-market-report-july-2011 12/69
DEMAND INTERNATIONAL ENERGY AGENCY ‐ O IL MARKET REPORT
12 13 JULY 2011
With GDP growth expected at 2.9% in 2012, Japanese oil demand is expected to resume its structural
decline, falling 1.5% (‐60 kb/d) to below 4.4 mb/d.
OECD Pacific:
Total Oil Product Demand
6.5
7.0
7.5
8.0
8.5
9.0
9.510.0
Jan Apr Jul Oct Jan
mb/d
Range 2006-2010 5-year avg2010 2011
OECD Pacific: Demand by Driver,
Y-o-Y Chg
(0.4)
(0.3)
(0.2)
(0.1)
-
0.1
2008 2009 2010 2011 2012
mb/d Transport HeatingPower Gen. Other Total Dem.
However, reconstruction and oil burning for electricity may provide upside demand support during 2H11
and potentially beyond. Japan’s oil demand is expected to grow by 0.4 mb/d from 2Q11 to 3Q11, led by
diesel, gasoline, fuel oil and ‘other products’ (which include crude for power generation). However,
deliveries of crude oil and fuel oil may yet surprise to the upside given potential struggles in meeting
peak summer power demand. Oil consumption by utilities has so far not shown a dramatic uptick, with
levels through June running only 50‐100 kb/d higher than last year. Yet the restart timing of undamaged
nuclear power plants that undertook maintenance shutdowns following the earthquake in March is
increasingly uncertain. Moreover, in the event that extra thermal generation capacity is needed to
compensate, it is unclear to what extent additional power needs will be met by LNG, oil or both. With
already warmer‐than‐normal June weather and authorities prescribing an array of power saving
measures for the summer, it is possible that crude and fuel oil purchases may strengthen by more than
anticipated to meet peak demand.
Japan: 2011 GDP Growth
Assumptions, Y-o-Y
(1.6)
(1.0)
(0.4)
0.2
0.8
1.4
2.0
2.6
1Q11 2Q11 3Q11 4Q11 2011
%
July 2011 OMR May 2011 OMRApril 2011 OMR 0
200
400
600
800
Jan Mar May Jul Sep Nov
kb/dJapan : Oil Consumption (Crude +
Fuel Oil) for Power Generation*
2007 2008 20092010 2011
*Main Utilities; Source: FEPC, IEA
Meanwhile, in Korea, oil product demand fell by 6.4% in May, with declines across all categories bar
naphtha. With economic growth revised up slightly to 4.5% for 2011, it appears that a combination of
interfuel substitution in power generation and high oil prices have sapped oil demand growth,
particularly in LPG and fuel oil. Nevertheless, demand for diesel and gasoline appeared to accelerate in
June, ahead of an announced price rise by refiners from 8 July. For 2011, Korean total product demand is
expected to fall by 1.7% (‐40 kb/d) to 2.2 mb/d. In 2012, demand declines slightly by 0.1% (remaining
near 2.2 mb/d), with falls in heating oil and fuel oil outweighing an expected rise in diesel and LPG.
Overall,
Pacific
demand
in
2011
is
expected
to
decline
by
0.2%
(‐
20
kb/d)
to
7.8
mb/d.
Relatively
stronger
demand growth in Australia and New Zealand should partly offset declines in Japan and Korea this year

8/6/2019 IEA - Montly Oil Market Report - July 2011
http://slidepdf.com/reader/full/iea-montly-oil-market-report-july-2011 13/69
INTERNATIONAL ENERGY AGENCY ‐ O IL MARKET REPORT DEMAND
13 JULY 2011 13
and next. Despite regional economic growth at 3.3% in 2012, OECD Pacific demand is expected to decline
by 0.7% (‐60 kb/d) as increases in reconstruction‐linked diesel demand in Japan are outweighed by falls
in gasoline and residual fuel oil. However, should power sector issues persist in Japan, with significant
nuclear capacity remaining offline, regional oil demand could yet surprise to the upside.
Japan: Diesel Demand
300
350
400
450
500
550
600
Jan Apr Jul Oct Jan
kb/d
Range 2006-2010 5-year avg2010 2011
Korea: LPG Demand
200
220
240
260
280
300
320
Jan Apr Jul Oct Jan
kb/d
Range 2006-2010 5-year avg2010 2011
Non-OECD
Preliminary data indicate that non‐OECD oil demand growth picked up in May (+4.8% or +2.0 mb/d year‐
on‐year) versus April. Total May demand is estimated at 43.9 mb/d, while April levels were revised up by
285 kb/d, both on baseline changes and revisions to preliminary readings, to 43.2 mb/d (+3.5% or
+1.5 mb/d year‐on‐year).
Non-OECD: Total Oil Product Demand
34
36
38
40
42
44
Jan Apr Jul Oct Jan
mb/d
Range 2006-2010 5-year avg2010 2011
Non-OECD: Gasoil Demand
10
11
11
12
12
13
13
14
14
Jan Apr Jul Oct Jan
mb/d
Range 2006-2010 5-year avg2010 2011
Non-OECD: Demand by Product(thousand barrels per day)
A n nu al C hg ( kb / d) A n nu al C hg ( %)
Mar-11 Apr-11 May-11 Apr-11 May-11 Apr-11 May-11
LPG & Ethane 4,966 4,872 4,899 222 233 4.8 5.0
Naphtha 2,650 2,707 2,737 13 183 0.5 7.2
Motor Gasoline 8,034 8,192 8,446 232 362 2.9 4.5
Jet Fuel & Kerosene 2,560 2,648 2,695 59 84 2.3 3.2
Gas/Diesel Oil 13,274 13,551 13,568 769 836 6.0 6.6
Residual Fuel Oil 5,579 5,455 5,535 3 120 0.1 2.2
Other Products 5,473 5,741 5,982 182 173 3.3 3.0
Total Products 42,536 43,165 43,862 1,480 1,991 3.5 4.8
Demand
Growth across most product categories was strong in May, with naphtha (+7.2% year‐on‐year), gasoil
(+6.6%) and LPG (+5.0%) posting the largest relative gains. Gasoil continued to lead in absolute terms
(+840
kb/d,
over
40%
of
total
non‐
OECD
growth),
growing
more
than
twice
as
much
as
gasoline,
its

8/6/2019 IEA - Montly Oil Market Report - July 2011
http://slidepdf.com/reader/full/iea-montly-oil-market-report-july-2011 14/69
DEMAND INTERNATIONAL ENERGY AGENCY ‐ O IL MARKET REPORT
14 13 JULY 2011
nearest rival (+360 kb/d). The FSU (+8.0% year‐on‐year), buoyed by Russia, Asia (+5.7%), driven by China,
and the Middle East (+4.2%), boosted by Saudi Arabia, provided the strongest regional growth.
Non‐OECD demand has been revised up by 250 kb/d on average over 2009‐2010, following updates to
2009 data from Russia and a few Middle East countries (Qatar, Israel, United Arab Emirates). Demand
has been raised for 2011 (+360 kb/d) on stronger‐than expected readings in the FSU, Asia and the Middle East. Growth for 2011 is now seen at 1.6 mb/d (+3.8%) and demand is seen averaging 43.7 mb/d. In 2012
demand is also expected to rise by 1.6 mb/d (+3.6%), climbing to 45.3 mb/d.
Non-OECD: Demand by Region(thousand barrels per day)
A n nu al C hg ( kb / d) A n nu al C hg ( %)
Mar-11 Apr-11 May-11 Apr-11 May-11 Apr-11 May-11
Africa 3,322 3,408 3,400 64 13 1.9 0.4
Asia 20,158 20,536 20,582 991 1,102 5.1 5.7
FSU 4,492 4,370 4,640 145 344 3.4 8.0
Latin America 6,407 6,462 6,440 171 209 2.7 3.4
Middle East 7,449 7,701 8,101 109 323 1.4 4.2
Non-OECD Europe 709 688 699 0 0 -0.1 0.0Total Products 42,536 43,165 43,862 1,480 1,991 3.5 4.8
Demand
China
China’s apparent oil demand growth accelerated slightly in May (+8.1% year‐on‐year), following an
increase of ‘only’ 7.7% in April. Naphtha (+15.8%), gasoil (+11.2%) and motor gasoline (+8.7%) were
particularly strong in May. The incorporation of revised refinery throughputs resulted in minor changes
to intra‐year demand back to 2005, but annual demand remains largely unchanged.
Concerns persist over the ability of Chinese utilities to meet power demand over the summer. Despite an
electricity tariff hike in April, the China Electricity Council has reported that generators were still running
at a loss in May (due to relatively higher coal prices) and that a capacity shortage of 30 GW may emerge
during the summer months. A 1 June increase of electricity tariffs for non‐residential users plus recent
heavy rains, boosting hydroelectric power, may provide some buffer to generation capacity.
China: Gasoil Demand
2,200
2,400
2,600
2,800
3,000
3,200
3,400
3,600
Jan Apr Jul Oct Jan
kb/d
Range 2006-2010 5-year avg2010 2011
China's GDP, Oil Demand & Implied
Income Elasticity
-
0.5
1.0
1.5
2.0
2001 2003 2005 2007 2009 2011
0%
5%
10%
15%
20%
Y-o-Y
Implied Elasticity Demand GrowthGDP Growth
Nevertheless, it is unclear whether the pricing policy will be evenly enforced by local authorities ‐ the
National Development and Reform Commission has indicated that preferential electricity prices for
industrial users have come about in some areas – and widespread use of diesel generators may emerge.
Our forecast sees Chinese gasoil demand hitting its summer high point of 3.5 mb/d in June, some 90 kb/d
above May levels, but the potential upside for summer months could be as much as 300 kb/d if 4Q10
experience, when coal‐fired generation was severely restricted, is any guide.

8/6/2019 IEA - Montly Oil Market Report - July 2011
http://slidepdf.com/reader/full/iea-montly-oil-market-report-july-2011 15/69
INTERNATIONAL ENERGY AGENCY ‐ O IL MARKET REPORT DEMAND
13 JULY 2011 15
Expectations for 2011 economic and oil demand growth have changed little since our last report with
GDP expanding by 9.6% and apparent demand growing by 6.9% (+630 kb/d) to 9.7 mb/d. In 2012, with
similar economic growth (+9.5%), oil demand is expected to rise by 5.0% (+480 kb/d) to 10.2 mb/d.
Product demand increases will be led by gasoil, gasoline and ‘other products’. While the former two
categories are seen growing less than in 2011, the results are consistent with envisaged reductions in oil
intensity over time. Still, the relationship between income and oil demand in China is notoriously difficult to gauge, with implied income elasticity fluctuating greatly over the past decade. Moreover, a
prolongation of power sector problems could add upside to gasoil demand.
China: Demand by Product(thousand barrels per day)
A n nu al C hg ( kb / d) A n nu al C hg ( %)
2010 2011 2012 2011 2012 2011 2012
LPG & Ethane 668 695 719 28 24 4.2 3.4
Naphtha 1,129 1,212 1,272 84 59 7.4 4.9
Motor Gasoline 1,546 1,661 1,749 115 88 7.4 5.3
Jet Fuel & Kerosene 368 392 414 24 22 6.4 5.5
Gas/Diesel Oil 3,142 3,379 3,534 237 155 7.5 4.6
Residual Fuel Oil 531 542 545 10 3 2.0 0.6
Other Products 1,685 1,815 1,948 131 133 7.8 7.3
Total Products 9,069 9,697 10,180 628 484 6.9 5.0
Demand
Other Non-OECD
Indian demand rose by 5.7% year‐on‐year in May,
following slower growth of 3.3% in April, with LPG
(+12.8%), gasoil (+10.2%) and gasoline (+7.8%) posting the
strongest gains. In June, authorities raised domestic prices
for gasoil, LPG and kerosene (by 9%, 14% and 20%,
respectively), the first such pricing adjustment in a year.
The government also reduced tariffs on imported diesel
and gasoline to 2.5% from 7.5% in an effort to provide
offsetting relief from the move, which will likely stoke
higher inflation in the short term. While the price
increases should help offset revenue losses by refiners
who have faced rising crude prices, the prices of the affected products remain regulated and the price
hikes are likely not enough to significantly dent oil demand growth in the short term.
India: Demand by Product
(thousand barrels per day)
A n nu al C hg ( kb / d) A n nu al C hg ( %)
2010 2011 2012 2011 2012 2011 2012
LPG & Ethane 455 492 523 37 31 8.0 6.3
Naphtha 200 194 183 -7 -11 -3.3 -5.5
Motor Gasoline 338 363 388 26 24 7.6 6.7
Jet Fuel & Kerosene 299 306 310 6 4 2.1 1.4
Gas/Diesel Oil 1,290 1,365 1,440 74 76 5.8 5.5
Residual Fuel Oil 194 187 192 -7 4 -3.5 2.2
Other Products 560 555 558 -6 3 -1.0 0.6
Total Products 3,337 3,461 3,593 124 132 3.7 3.8
Demand
As such, our forecast for Indian oil demand in 2011 continues to be driven primarily by expectations of
strong economic growth (+8.2%). Total product demand is seen rising by 3.7% (+125 kb/d) to 3.5 mb/d.
In 2012, GDP growth slows slightly, to 7.8%. Yet, oil demand growth is seen maintaining its pace,
expanding by 3.8% (+130 kb/d) to 3.6 mb/d, led by gasoil, LPG and gasoline.
0.5
1.01.5
2.0
2.5
3.0
3.5
4.0
Jan 03 Jan 05 Jan 07 Jan 09 Jan 11
Jan 2003= 1.0
India: Crude vs Product Prices
Gasoline KeroseneDiesel Crude
Source:Reuters, IEA

8/6/2019 IEA - Montly Oil Market Report - July 2011
http://slidepdf.com/reader/full/iea-montly-oil-market-report-july-2011 16/69
DEMAND INTERNATIONAL ENERGY AGENCY ‐ O IL MARKET REPORT
16 13 JULY 2011
In Russia, May total product demand soared by 9.7%
year‐on‐year, with gasoil (+17.8%) and gasoline (+12.1%)
posting large gains. With retail prices recently lowered, at
the government’s behest, gasoline shortages have
emerged, even with the imposition of sizeable export
duties, which look likely to continue in the short term. Annual government submissions have yielded upward
revisions to LPG (+175 kb/d) and residual fuel oil (+50
kb/d) for 2009‐2010, which have been largely carried
forward. Based on GDP growth of 4.8%, Russian total
product demand is expected to rise by 2.7% (+90 kb/d) in
2011 to 3.4 mb/d. With economic growth at 4.5%, 2012
oil demand is seen increasing by 1.6% (+50 kb/d), but still
near 3.4 mb/d.
Russia: Demand by Product(thousand barrels per day)
A n nu al C hg ( kb / d) A n nu al C hg ( %)
2010 2011 2012 2011 2012 2011 2012
LPG & Ethane 495 512 530 17 18 3.5 3.5
Naphtha 289 294 299 5 5 1.7 1.8
Motor Gasoline 775 766 769 -9 3 -1.2 0.4
Jet Fuel & Kerosene 255 263 268 8 5 3.2 1.7
Gas/Diesel Oil 631 657 673 26 16 4.1 2.5
Residual Fuel Oil 290 295 277 5 -18 1.6 -5.9
Other Products 540 576 600 37 23 6.8 4.0
Total Products 3,275 3,363 3,416 88 52 2.7 1.6
Source: Petromarket RG, IEA
Demand
In Brazil, oil demand grew by only 0.5% year‐on‐year in
April, led by jet fuel/kerosene (+11.9%) and gasoil (+2.6%).
Gasoline declined by 0.2% as ethanol consumption fell.
Still, seasonally higher ethanol production and vehicle data
showing a 27% year‐on‐year increase in May sales suggests
potentially more supportive demand ahead. Brazil’s
economy is expected to grow by 4.1% in 2011 and 3.6% in
2012. However, growth was revised down in both years on
average by 0.4% and high inflation continues to be a
concern. In 2011, oil product demand is projected to grow
by 2.6% to 2.8 mb/d while 2012 should see growth of 2.9%
(+80 kb/d) to 2.9 mb/d, led by middle distillates and
gasoline.
Brazil: Demand by Product(thousand barrels per day)
A n nu al C hg ( kb / d) A n nu al C hg ( %)
2010 2011 2012 2011 2012 2011 2012
LPG & Ethane 219 222 225 3 3 1.3 1.4
Naphtha 166 167 169 1 2 0.6 1.1
Motor Gasoline 792 825 859 33 34 4.2 4.1
Jet Fuel & Kerosene 110 122 132 11 10 10.4 8.3
Gas/Diesel Oil 886 922 956 36 34 4.0 3.7
Residual Fuel Oil 187 167 157 -20 -9 -10.7 -5.7
Other Products 374 380 386 6 6 1.7 1.6
Total Products 2,733 2,804 2,884 70 80 2.6 2.9
Demand
Russia: Motor Gasoline Demand
550
600
650
700
750
800
850
Jan Apr Jul Oct Jan
kb/d
Range 2006-2010 5-year avg2010 2011
Source: Petromarket RG, IEA
Brazil: Jet Fuel & Kerosene Demand
70
80
90
100
110
120
130
140
Jan Apr Jul Oct Jan
kb/d
Range 2006-2010 5-year avg2010 2011

8/6/2019 IEA - Montly Oil Market Report - July 2011
http://slidepdf.com/reader/full/iea-montly-oil-market-report-july-2011 17/69
INTERNATIONAL ENERGY AGENCY ‐ O IL MARKET REPORT DEMAND
13 JULY 2011 17
Saudi Arabia’s Power Generation from Crude
A recent, yet overlooked, global demand issue relates to oil‐fired power generation in several large
countries. The most obvious example is Japan, following the shut‐in of a majority of the country’s nuclear
reactors in the wake of March’s earthquake and tsunami. However, oil‐fired generation outside of the OECD
represents a major demand driver, reflecting strong emerging market economic performance and rising electricity needs amid shortages of alternative supplies such as hydropower or natural gas.
Whereas the fuels of choice are typically residual fuel oil – for large‐scale plants – and gasoil – better suited
for small‐scale generators as, for example, in China – the direct burning of medium/heavy, sweet crudes is
increasingly favoured in some countries. On the one hand, direct crude burn pollutes less than high‐sulphur
residual fuel oil; on the other hand, this is a convenient outlet for large oil producers eager to maintain
production in periods of weak global demand, as in the recent Great Recession in 2009.
Saudi Arabia is typical of this trend. Direct crude burn (based on implied numbers from JODI data), averaged
less than 200 kb/d for most of the 2000s, but more than doubled in 2009 (450 kb/d), coinciding with the
collapse of global oil demand. Yet, despite the economic rebound, direct crude burn has continued to rise
steadily and is on track to reach a new historical record in 2011 (600 kb/d), potentially capping future Saudi
crude
exports,
despite
rising
production.
Meanwhile,
residual
fuel
oil
demand
has
fallen
sharply,
by
roughly
a third, to 250‐300 kb/d.
Saudi Arabia: Oil-Fired Power Generation
150
200
250
300
350
400
450
500
550
600
2006 2007 2008 2009 2010 2011
kb/d
Fuel Oil Dem and
Implied Direct
Crude Burn
Saudi Arabia: Implied Direct Crude Burn
-
200
400
600
800
1,000
1,200
J a n - 0
6
J a n - 0
7
J a n - 0
8
J a n - 0
9
J a n - 1
0
J a n - 1
1
J a n - 1
2
kb/d
"Other Products"
Demand
Implied Direct Crude
Burn
This new pattern of direct crude burning has implications for global demand seasonality. Indeed, the
difference between peak and trough Saudi direct crude demand has increased sharply, from about 180 kb/d
over 2002‐2008 to roughly 660 kb/d since 2009. Treating direct crude burn as a component of ‘other
products’ demand, as this report does, compounds the traditional OECD‐driven, third‐quarter global product
demand swing – and wreaks havoc with ‘historical average seasonality’ used by many analysts as a guide for
demand projections. More generally, as previous issues of this report have already highlighted, a new, non‐
OECD‐driven global seasonality is emerging but is not yet in place. Evidence of such a shift continues to build
– namely, a surge in Chinese gasoil use in 4Q10, on the back of restrictions on coal‐fired power generation,
which boosted global demand sharply during a quarter when non‐OECD demand normally eases.
Saudi Arabia: Direct Crude Burn*(thousand barrels per day)
% kb/d
2002 195.3 112.3 200.7 179.4
2003 182.9 107.9 147.9 140.9 -21.5% -38.5
2004 181.8 114.0 135.6 144.8 2.8% 3.9
2005 195.3 121.6 132.9 158.6 9.5% 13.8
2006 208.0 139.8 215.5 170.2 7.3% 11.5
2007 241.3 135.9 172.4 188.2 10.6% 18.1
2008 287.3 160.9 246.4 219.7 16.7% 31.5
2009 626.1 316.1 622.8 437.4 99.1% 217.7
2010 676.5 398.4 631.5 527.9 20.7% 90.5
2011 741.5 439.8 717.8 581.6 10.2% 53.7*Crude burning = crude productio n - refining throughput - net exports - sto ck change
Source: IEA fro m JODI
Year Yearly GrowthApril -
September
October -
March
Yearly
Average
Peak vs.
Trough

8/6/2019 IEA - Montly Oil Market Report - July 2011
http://slidepdf.com/reader/full/iea-montly-oil-market-report-july-2011 18/69
SUPPLY INTERNATIONAL ENERGY AGENCY ‐ O IL MARKET REPORT
18 13 JULY 2011
SUPPLY
Summary
• Global oil supply rose by 1.2 mb/d to 88.3 mb/d in June on a hefty 0.8 mb/d increase in OPEC crude
output and with non‐OPEC production up by 0.4 mb/d. Year‐on‐year, global oil production was
1.3 mb/d higher, split between OPEC NGLs and OPEC crude.
• OPEC crude oil supply in June surged to 30.03 mb/d, up by nearly 850 kb/d, due to a sharp rise in
supply from Saudi Arabia. Current group production, however, remains well short of the 31.3 mb/d
‘call on OPEC crude and stock change’ projected for 3Q11 and the 30.6 mb/d envisaged for 4Q11.
• For 2012, the ‘call’ is pegged at 30.7 mb/d on average, up 100 kb/d from average 2011 levels. Libya’s
civil war, underway since late February, has radically altered the near‐term outlook for OPEC’s crude
oil production capacity through the first half of 2012, which thereafter posts a marked recovery.
Indeed, from 1Q12 to 4Q12, capacity is expected to expand by nearly 1.3 mb/d, amid assumed Libyan
recovery and expansions from Angola, Iraq and the UAE.
• Non‐OPEC oil supply rose by 0.4 mb/d to 52.5 mb/d in June, on a seasonal rise in biofuels output and
following maintenance in the North Sea. Production for 2011 is revised down by 0.2 mb/d on baseline
adjustments to non‐OECD volumes, as well as prolonged production outages in a series of countries,
and is now seen averaging 53.1 mb/d. In 2012, non‐OPEC supply is projected to rise to 54.0 mb/d,
driven by higher output in non‐crude liquids, as well as higher conventional crude supply from
Canada, Brazil, Australia, China and others.
OPEC and Non-OPEC Oil SupplyYear-on-Year Change
-0.5
0.0
0.5
1.0
1.5
2.02.5
3.0
3.5
Mar 10 Jun 10 Sep 10 Dec 10 Mar 11 Jun 11
mb/d
OPEC Crude Non-OPECOPEC NGLs Total Supply
OPEC and Non-OPEC Oil Supply
50
52
54
56
58
60
62
Jan 11 Jul 11 Jan 12 Jul 12
mb/d
28.0
28.5
29.0
29.5
30.0
30.5
31.0mb/d
Non-OPEC OPEC NGLsOPEC Crude - RS
All world oil supply data for June discussed in this report are IEA estimates. Estimates for OPEC countries,
Alaska, Peru and Russia are supported by preliminary June supply data.
Note: Random events present downside risk to the non‐OPEC production forecast contained in this report. These
events can include accidents, unplanned or unannounced maintenance, technical problems, labour strikes,
political unrest, guerrilla activity, wars and weather‐related supply losses. Specific allowance has been made in
the forecast for scheduled maintenance in all regions and for typical seasonal supply outages (including
hurricane‐related stoppages) in North America. In addition, from May 2011, a nationally allocated (but not field‐
specific) reliability adjustment has also been applied for the non‐OPEC forecast to reflect a historical tendency
for unexpected events to reduce actual supply compared with the initial forecast. This totals ‒200 kb/d for
non‐OPEC as a whole, with downward adjustments focused in the OECD.
The non‐OPEC and OPEC NGL supply sections this month focus on the roll out of our detailed 2012 forecast,
with discussion of key trends in production. However, to avoid duplication, several of the themes underpinning
this analysis are elaborated upon in the MTOGM 2011 Edition , released on 16 June 2011. Readers should
consult the MTOGM for more detailed discussion of factors affecting supply in 2012 and beyond.

8/6/2019 IEA - Montly Oil Market Report - July 2011
http://slidepdf.com/reader/full/iea-montly-oil-market-report-july-2011 19/69
INTERNATIONAL ENERGY AGENCY ‐ O IL MARKET REPORT SUPPLY
13 JULY 2011 19
OPEC Crude Oil Supply
OPEC crude oil supply in June surged to 30.03 mb/d, up by nearly 850 kb/d from May due to a sharp rise
in production from Saudi Arabia. Five months into Libya’s protracted civil war, fellow OPEC members
now appear to be moving to replace lost supplies from the war‐torn country.
OPEC‐11 supplies, which exclude Iraq because it does not have an official output target, rose by around
800 kb/d, to 27.31 mb/d. OPEC’s 8 June Vienna gathering collapsed in disarray because the majority of
members rejected proposals put forward by Saudi Arabia and other Gulf members to collectively agree
to increase output to make up for lost Libyan production. That said, more than half of the 11 producing
countries with output targets appeared to have raised production in June. Saudi Arabia, however,
provided the lion’s share, accounting for almost 90% of incremental June supplies.
OPEC Crude Oil Production
28
29
3031
32
33
Jan Mar May Jul Sep Nov Jan
mb/d
2008 2009 2010 2011
Entire series based on OPEC C ompositio n as of J anuary 2009
onwards (including Angola & Ecuador & excluding Indonesia)
Quarterly Call on OPEC Crude + Stock
Change
26
27
28
2930
31
32
1Q 2Q 3Q 4Q
mb/d
2010 2011 2012
Entire series based on OPEC Co mposit ion as o f January 2009
onwards (including Angola & Ecuador & excluding Indonesia)
The unexpected acrimony that emerged among members at the June conference, largely along the lines
of those with and without spare production capacity, may have temporarily altered the group’s dynamics
going forward. Indeed, the unusual occurrence of price hawk Iran holding the presidency for the first
time in more than 35 years, was reportedly behind the meeting ending without even an official
communiqué. A proposal put forward at last month’s OPEC ministerial conference by the group’s current
President, Iran’s acting oil minister Mohammad Aliabadi, to hold a meeting in Tehran in September to
review the market, was roundly rejected by key Gulf members. The end of Iran’s term this year may
make for more harmonious gatherings once again going forward, with the next formal Ministerial
meeting scheduled for 14 December 2011 in Vienna. Internal OPEC politics aside, production is now
5.19 mb/d above a long‐outdated official output target of 24.845 mb/d, agreed in late 2008.
Current crude oil production of just over 30 mb/d, however, is still well short of the 31.3 mb/d ‘call on
OPEC crude and stock change’ projected for 3Q11, and the 30.6 mb/d envisaged for 4Q11. The steep
1.3 mb/d quarterly increase in the ‘call’ between 2Q and 3Q eases for 3Q and 4Q, but is still 600 kb/d
above June production levels. The ‘call’ for 2011 has been raised by 0.4 mb/d to 30.6 mb/d due to higher
forecast demand and lower non‐OPEC supply. For 2012, the ‘call’ is pegged at 30.7 mb/d on average, up
100 kb/d from average 2011 levels.
Higher current production has correspondingly reduced OPEC spare capacity to an estimated 3.2 mb/d in
June. Indeed, the group’s spare capacity is expected to remain limited while Libyan supplies are
constrained. Libyan production is reportedly running at minimal levels, below 100 kb/d, but expansion of
the northern no‐fly zone to include the eastern oilfields under the control of the new National
Transitional Council, if it occurs, could enable a restart of production in 2H11. Indeed, we estimate
Libyan production may be restored to 200 kb/d by end‐2011 and gradually increase to an average
700 kb/d by 2012. Between 2011 and 2012 total OPEC production capacity is expected to post modest
increases, with the recovery in Libyan production offset by natural decline rates and a dearth of new
projects (see ‘OPEC Crude Production Capacity Remains Constrained Through 2012’ ).

8/6/2019 IEA - Montly Oil Market Report - July 2011
http://slidepdf.com/reader/full/iea-montly-oil-market-report-july-2011 20/69

8/6/2019 IEA - Montly Oil Market Report - July 2011
http://slidepdf.com/reader/full/iea-montly-oil-market-report-july-2011 21/69

8/6/2019 IEA - Montly Oil Market Report - July 2011
http://slidepdf.com/reader/full/iea-montly-oil-market-report-july-2011 22/69
SUPPLY INTERNATIONAL ENERGY AGENCY ‐ O IL MARKET REPORT
22 13 JULY 2011
OPEC Crude Production Capacity Remains Constrained Through 2012
Libya’s civil war, which erupted in mid‐February, has radically altered the near‐term outlook for OPEC’s
crude oil production capacity through the first half of 2012 but thereafter capacity should post a marked
recovery. At first glance, it appears the group’s capacity
is slated to increase by only 155 kb/d to 34.44 mb/d
between 2011‐2012. However, the yearly averages mask a sharp recovery seen by end‐2012. Indeed, from
1Q12 to 4Q12, capacity is expected to expand by a full
1.3 mb/d, with Libya showing a significant recovery,
followed by respectable increases by Iraq, the UAE,
Angola and Algeria.
After posting a sharp 1.1 mb/d drop in crude capacity in
1Q11, OPEC’s capacity low point is expected to be hit in
1Q12, in large part reflecting the ongoing decline in
Iranian production. Iran’s crude oil production capacity
is set to fall by around 150 kb/d, to 3.55 mb/d by 2012,
due to the country’s increasing isolation following stiffer international sanctions implemented in mid‐2010,
as well as its generally unfavourable investment terms. Even China is now showing tepid interest in the
country, and Iranian officials recently said they will cancel Iran's South Pars Phase‐11 gas field project if state
CNPC continues to delay the project.
OPEC is expected to struggle to maintain capacity until Libyan supplies start to recover in 2H12. However,
Libyan capacity is not expected to reach pre‐crisis production levels until end‐2013 (see ‘MTOGM, 16 June
2011, ‘Libya Faces Long Haul to Restore Production Capacity’ ).
Aside from Libya, just three other OPEC members are on course to post significant capacity gains by 2012.
Iraqi capacity is slated to rise steadily, from 2.71 mb/d in 1Q11 to 3.06 mb/d by 4Q12. Logistical constraints
curb southern exports until 2H12, which in turn may force companies to contain their production expansion
plans. However, recent increases in production from the Kurdish region hold the promise of significantly
increasing production capacity and with it an upward revision to our forecast by end‐2011.
The UAE is next in the queue in volume terms, with capacity expected to increase by around 175 kb/d to
2.92 mb/d from 3Q11 to 4Q12. The Emirates are slated to bring online five different expansion projects with
nameplate capacity of 420 kb/d over the 2011‐12 period. However, since the MTOGM report was completed
there have been fairly significant management changes at the oil ministry and state oil companies, reportedly
due to persistent development delays, so timelines may be pushed back beyond our original forecast.
Angolan projects, however, appear to be well on schedule, with capacity set to rise by a net 160 kb/d to
2.11 mb/d between 3Q11 and 4Q12. The 220 kb/d Pazflor project and the 150 kb/d PSVM will be online by
end‐2011.
1Q11 2Q11 3Q11 4Q11 1Q12 2Q12 3Q12 4Q12 2011 2012 ∆ 2011-12
Algeria 1,312 1,337 1,337 1,337 1,285 1,285 1,365 1,427 1,330 1,341 11
Angola 1,812 1,798 1,947 2,002 1,902 1,934 2,125 2,108 1,891 2,018 127
Ecuador 501 501 531 531 517 517 536 536 515 526 10
Iran 3,704 3,707 3,717 3,682 3,535 3,535 3,580 3,548 3,702 3,549 -153
Iraq 2,713 2,738 2,784 2,784 2,841 2,841 3,063 3,063 2,755 2,952 197
Kuwait 2,544 2,544 2,544 2,544 2,511 2,511 2,511 2,511 2,544 2,511 -33
Libya 1,150 200 200 200 450 599 816 931 435 700 265
Nigeria 2,733 2,730 2,727 2,699 2,601 2,591 2,580 2,611 2,722 2,596 -126
Qatar 1,017 1,017 1,037 1,037 1,032 1,032 1,032 1,032 1,027 1,032 5
Saudi Arabia* 12,036 12,036 12,036 12,036 11,823 11,823 11,823 11,823 12,036 11,823 -213
UAE 2,693 2,693 2,743 2,743 2,760 2,810 2,810 2,915 2,719 2,824 106
Venezuela 2,572 2,644 2,639 2,586 2,539 2,532 2,627 2,580 2,611 2,570 -41Total OPEC 34,786 33,945 34,242 34,182 33,796 34,010 34,867 35,084 34,287 34,441 155
(thousand barrels per day)
OPEC Average Sustainable Crude Oil Production Capacity
32.8
33.2
33.6
34.0
34.4
34.8
35.2
1Q11 2Q11 3Q11 4Q11 1Q12 2Q12 3Q12 4Q12
mb/d OPEC Crude Oil Production Capacity
1Q11 - 4Q12

8/6/2019 IEA - Montly Oil Market Report - July 2011
http://slidepdf.com/reader/full/iea-montly-oil-market-report-july-2011 23/69
INTERNATIONAL ENERGY AGENCY ‐ O IL MARKET REPORT SUPPLY
13 JULY 2011 23
The 2012 Outlook for Non-OPEC Supply
Overview
Non‐OPEC supply is expected to grow a robust 0.9 mb/d in 2012, to 54.0 mb/d, as previewed in the
recently published Medium‐Term Oil & Gas Markets 2011 report (MTOGM). Growth for 2010‐2011 is
trimmed slightly, to 0.5 mb/d, following baseline revisions to 2010, as well as new and prolonged
production shut‐ins for a long list of countries in mid‐2011. A return to near 1 mb/d annual growth would
put 2012 back on a par with supply increments seen in 2009‐2010, as well as the 2000‐2004 period, and
can be seen as the result of sustained upstream investment on the back of high oil prices and success at
slowing decline rates at mature assets.
-0.4
-0.2
0.0
0.2
0.4
0.6
0.8
1.0
1.2
1.4
1996 1999 2002 2005 2008 2011
mb/d Total Non-OPEC Supply, y-o-y chg
49
50
51
52
53
54
55
Jan Mar May Jul Sep Nov Jan
mb/d Non-OPEC Total Oil Supply
2008 20092010 20112011 forecast 2012 forecast
The inclusion of finalised annual supply data for another 23 non‐OECD countries results in a lower 2009
baseline of 51.5 mb/d (‐50 kb/d compared to the previous report), while 2010 average output is adjusted
down by ‐85 kb/d to 52.6 mb/d. Revisions are spread across the board, but notable adjustments include
Egyptian, Vietnamese, Malaysian and Uzbekistani NGL production. For 2011, revisions are mostly carried
through, to which is added the impact of ongoing and new short‐term supply outages in a string of
countries. In addition to those already highlighted in recent reports (Argentina, Canada, Norway, Sudan,
the UK and Yemen), strikes, seasonal maintenance and technical problems are currently also affecting
output in Australia, Brazil, Kazakhstan, Malaysia and Vietnam. In sum, these are estimated to curb
0.7 mb/d from 2Q11 and 3Q11 non‐OPEC supply. New shut‐ins, coupled with the baseline changes and
recent production data, result in the overall 2011 non‐OPEC supply estimate being lowered by 0.2 mb/d
to 53.1 mb/d.
1Q10 2Q10 3Q10 4Q10 2010 1Q11 2Q11 3Q11 4Q11 2011 1Q12 2Q12 3Q12 4Q12 2012
North America 13.9 14.1 14.1 14.4 14.1 14.4 14.2 14.0 14.3 14.2 14.6 14.3 14.2 14.5 14.4
Europe 4.5 4.2 3.8 4.2 4.2 4.1 3.9 4.0 4.3 4.1 4.3 4.0 3.9 4.1 4.1
Pacific 0.6 0.6 0.6 0.6 0.6 0.5 0.6 0.6 0.6 0.6 0.7 0.7 0.7 0.7 0.7
Total OECD 19.1 18.9 18.5 19.2 18.9 19.1 18.6 18.6 19.3 18.9 19.6 19.0 18.9 19.3 19.2
Former USSR 13.5 13.5 13.5 13.6 13.5 13.7 13.6 13.7 13.8 13.7 13.7 13.8 13.6 13.7 13.7
Europe 0.1 0.1 0.1 0.1 0.1 0.1 0.1 0.1 0.1 0.1 0.1 0.1 0.1 0.1 0.1
China 4.0 4.1 4.1 4.2 4.1 4.2 4.1 4.3 4.3 4.2 4.3 4.3 4.3 4.3 4.3
Other Asia 3.7 3.7 3.7 3.7 3.7 3.7 3.5 3.5 3.5 3.6 3.5 3.5 3.5 3.5 3.5
Latin America 4.0 4.1 4.1 4.1 4.1 4.2 4.1 4.4 4.5 4.3 4.5 4.6 4.6 4.6 4.6
Middle East 1.7 1.7 1.7 1.7 1.7 1.7 1.6 1.7 1.7 1.7 1.8 1.8 1.8 1.7 1.8
Africa 2.5 2.5 2.5 2.5 2.5 2.5 2.5 2.5 2.6 2.5 2.6 2.6 2.6 2.6 2.6
Total Non-OECD 29.6 29.7 29.9 30.0 29.8 30.1 29.7 30.2 30.5 30.1 30.6 30.6 30.4 30.5 30.5
Processing Gains 2.0 2.1 2.1 2.1 2.1 2.2 2.1 2.1 2.2 2.2 2.3 2.2 2.2 2.3 2.3
Global Biofuels 1.4 2.0 2.1 1.8 1.8 1.5 1.9 2.3 2.0 1.9 1.6 2.0 2.4 2.1 2.1
Total Non-OPEC 52.1 52.6 52.6 53.2 52.6 52.8 52.4 53.1 54.0 53.1 54.0 53.9 54.0 54.3 54.0
Annual Chg (mb/d) 1.2 1.3 0.9 0.9 1.1 0.7 -0.2 0.5 0.8 0.5 1.2 1.5 0.8 0.3 0.9
Changes from last OMR (mb/d) -0.1 -0.1 -0.1 -0.1 -0.1 -0.1 -0.2 -0.3 -0.2 -0.2
Non-OPEC Supply(million barrels per day)

8/6/2019 IEA - Montly Oil Market Report - July 2011
http://slidepdf.com/reader/full/iea-montly-oil-market-report-july-2011 24/69
SUPPLY INTERNATIONAL ENERGY AGENCY ‐ O IL MARKET REPORT
24 13 JULY 2011
Underlying strength in non‐OPEC supply means that 2012 output is projected to grow by 0.9 mb/d to
54.0 mb/d, on the assumption that the above‐mentioned outages are short‐term in nature and will be
resolved before the end of the year. Incremental supply will in large part come from non‐crude output,
including Canadian oil sands‐derived liquids, biofuels, NGLs and refinery processing gains. Brazil, Canada,
Australia, Colombia, China and Yemen each add over 50 kb/d of total new supply (albeit, Yemen only as it
recovers from shut‐in 2011 volumes). Oman, the US, Russia and Ghana add 30‐50 kb/d each. The most pronounced annual declines in oil production are projected for Mexico, Indonesia, Malaysia and Sudan,
which see output fall by 30‐60 kb/d. By contrast, Norway and the UK are expected to see marginal
growth (of around +25 kb/d each), as production recovers at key fields that experienced significant
problems in 2011, e.g. the Gullfaks complex and Buzzard, and some new capacity start‐ups.
-800
-600
-400
-200
0
1Q 2Q 3Q 4Q
kb/d Non-OPEC Supply 2011Selected Shut-ins & Adjustments
Argentina protests/damage Buzzard outagesCanada Horizon fire Malaysia Kikeh outagesNorway maintenance Sudan outagesUK maintenance US hurricane adjustment
Yemen outages
-100
-50
0
50
100
150
200
B r a z i l
C a n a d a
B i o f u e l s
A u s t r a l i a
N G L s
P r o c G a i n
C o l o m b i a
C h i n a
Y e m e n
O m a n
U S
R u s s i a
K a z a k h .
S y r i a
S u d a n
M a l a y s i a
I n d o n e s i a
M e x i c o
kb/d Non-OPEC Supply2012 Annual Change
OECD
OECD total oil supply is expected to rise by 0.3 mb/d, to 19.2 mb/d in 2012, with growth in North
America of 0.2 mb/d (Canada and the US, but not Mexico) and 0.1 mb/d in the Pacific (Australia)
contributing
the
lion’s
share.
OECD
Europe
should
see
a
minor
rise
(+15
kb/d),
unusually,
as
the
North
Sea recovers from pronounced outages in 2011, and capacity is added at some smaller projects. This
would be the first annual increment since 2000.
5.5
6.0
6.5
7.0
7.5
8.0
8.5
Jan Mar May Jul Sep Nov Jan
mb/d US Total Oil Supply
2008 20092010 20112011 forecast 2012 forecast
3.0
3.13.23.33.43.53.63.73.83.9
Jan Mar May Jul Sep Nov Jan
mb/d Canada Total Oil Supply
2008 20092010 20112011 forecast 2012 forecast
Oil production in the US is projected to rise by around 50 kb/d in 2012, to 7.9 mb/d. Growth stems from
the Other Lower‐48 and, to a lesser extent, from Texas and the Gulf of Mexico. Oil production in
California and Alaska, as well as NGLs output, should decline. Onshore growth is driven by increasing
volumes of light tight oil, often referred to as shale oil, produced in unconventional formations and a key
source of future liquids growth in the US (see After the Shale Gas Revolution, Now It’s Oil’s Turn in the
recent MTOGM for more detail). Output in the Gulf of Mexico remains affected by drilling delays at many
fields and new developments, though this is more than offset by the ramp‐up of production at two new
complexes, Chinook/Cascade and Great White/Silvertip/Tobago. The 2011 hurricane season has started,

8/6/2019 IEA - Montly Oil Market Report - July 2011
http://slidepdf.com/reader/full/iea-montly-oil-market-report-july-2011 25/69
INTERNATIONAL ENERGY AGENCY ‐ O IL MARKET REPORT SUPPLY
13 JULY 2011 25
with the first storms hitting the region. This year’s storm season is expected to be heavier‐than‐average,
and the forecast includes the usual adjustment based on the five‐year average shut‐in production
volumes, which stand at an average ‐115 kb/d for the third and fourth quarters of both 2011 and 2012.
Canada’s oil production is set to rise by 170 kb/d, to 3.6 mb/d in 2012, as bitumen and mined, upgraded
synthetic crude from oil sands increase by 90 kb/d and 75 kb/d respectively, in addition to incremental NGLs supply of 45 kb/d. Other conventional crude declines marginally. Oil sands‐driven growth is
expected to see Canada remain non‐OPEC’s largest source of incremental supply in the medium term.
In Mexico, oil production is projected to decline by 60 kb/d to 2.9 mb/d in 2012, as output from the
mature Cantarell field continues to slide – albeit more slowly than in the 2005‐2010 period – and
Ku‐Maloob‐Zaap (KMZ) volumes hit a plateau of around 850 kb/d. Additions at some smaller fields fail to
offset this decline. This projection contrasts with state oil company Pemex’s own view that oil production
will stabilise around current volumes in the short‐term and increase to 3 mb/d by 2015. In the absence of
major new projects at the development stage, it is difficult to see how this target will be reached.
Norway will see oil production increase by 25 kb/d, to 2.2 mb/d in 2012, with new oil from Yme and
Skarv from the latter half of 2011. Norway’s Oil Ministry recently published an energy white paper,
outlining its plan to slow structural decline in oil production by encouraging wider use of enhanced oil
recovery techniques and the development of new, northern areas. It also hopes to speed up permitting
and development time for fast‐track projects and bring down upstream costs vis‐à‐vis other North Sea
producing areas. Partners ConocoPhillips and Total have just officially launched the kind of programme
the ministry is envisaging. For US$11.5 billion, they hope to extend the working life of Ekofisk, Norway’s
oldest producing field, and neighbouring Eldfisk, by another 40 years, squeezing out another 470 mboe.
1.8
2.0
2.2
2.4
2.6
2.8
Jan Mar May Jul Sep Nov Jan
mb/d Norway Total Oil Supply
2008 20092010 20112011 forecast 2012 forecast
1.1
1.2
1.3
1.4
1.5
1.6
1.7
1.8
Jan Mar May Jul Sep Nov Jan
mb/d UK Total Oil Supply
2008 20092010 20112011 forecast 2012 forecast
Similarly, the UK is projected to experience a brief hiatus in oil production decline, with output rising by
20 kb/d to 1.3 mb/d in 2012. This is largely due to an assumed return to normal output levels around
200 kb/d at the country’s largest field, Buzzard, which in the course of installation of a fourth platform
has experienced protracted outages in recent months. We assume normal output levels at Buzzard will
be reached in the course of August 2011. Following an upstream tax rise announced earlier this year
amid protest by industry, the government in July unveiled proposals for a broadening of exceptions to
the rule for various ‘marginal’, i.e. small, challenging or remote, fields. Statoil, which had previously
threatened to put its Bressay and Mariner field developments on hold, promptly announced they had
been reactivated. Even prior to the recent announcement, equity partner Maersk had given its go‐ahead
for the development of the 60 kb/d Golden Eagle field, to start production in 2014.
The OECD Pacific will see total oil supply increase by 0.1 mb/d, to reach 0.7 mb/d in 2012. This is due to a
projected rise in Australia’s oil production by 115 kb/d, to 620 kb/d, which sees incremental output at
the Van Gogh and Pyrenees fields, recovery at Cossack, which saw its floating production, storage and

8/6/2019 IEA - Montly Oil Market Report - July 2011
http://slidepdf.com/reader/full/iea-montly-oil-market-report-july-2011 26/69
SUPPLY INTERNATIONAL ENERGY AGENCY ‐ O IL MARKET REPORT
26 13 JULY 2011
offloading (FPSO) vessel exchanged in 2011, and new oil from the Kitan and Montara/Skua
developments, which are expected to start production in late 2011 and early 2012 respectively.
Non-OECD
Oil production in the Former Soviet Union (FSU) is projected to rise by just 45 kb/d, to 13.7 mb/d, in
2012, with limited new upstream projects only just offsetting mature field decline. Russia is expected to
see a continuation of 2011’s trends, with output rising slowly at Rosneft, TNK‐BP and in NGLs, but
dipping for Lukoil, Surgutneftegaz and other companies. Rosneft’s large Vankor field is scheduled to hit
400 kb/d in the course of 2012. Overall production growth will slow to only 30 kb/d, with output rising to
10.6 mb/d in 2012. This compares with a rise of 100 kb/d in 2011 and 240 kb/d in 2010. Recent positive
noises about changes to the tax regime could encourage more investment and ultimately higher
production growth.
9.9
10.0
10.1
10.2
10.3
10.410.5
10.6
10.7
Jan Mar May Jul Sep Nov Jan
mb/d Russia Total Oil Supply
2008 20092010 20112011 forecast 2012 forecast
1.3
1.4
1.5
1.6
1.7
1.8
Jan Mar May Jul Sep Nov Jan
mb/d Kazakhstan Total Oil Supply
2008 20092010 20112011 forecast 2012 forecast
Kazakhstan, while still on track to see production increase in the medium‐term, is projected to see a
small
dip
in
output
in
2012,
falling
by
20
kb/d
to
1.6
mb/d.
Looking
further
ahead,
the
start‐
up
of
the
super‐giant Kashagan field may be postponed yet again. Officially, the consortium developing the field is
bound to pump first oil by late 2013 or face penalties, but apparent disagreements both within the
consortium and between the consortium and authorities, may now see first oil delayed into 2014. The
field was originally designed to start production in 2005, but delays and rampant cost inflation have
caused chronic project slippage.
Some consortium partners are now reportedly looking to exit the project, and while some national oil
companies might take their position, this could lead to more contractual delays. The start‐up date of the
second phase of the project is now effectively on hold and is only likely after 2020. Some surmise that
the entire second phase could now be at risk, as the chronic delays mean that consortium partners may
not
be
able
to
see
significant
returns
before
their
leases
expire.
Rather
than
let
this
happen,
it
seems
most likely that the state would step in and find new developers. This forecast currently assumes that
small volumes of Kashagan oil will be pumped in late‐2013, but that first‐phase capacity of 370 kb/d will
only be reached by early 2016.
Total non‐OECD Asia‐Pacific oil production will remain flat in 2012, with some growth in China and India
offset by declining production in Indonesia and Malaysia. China’s oil production is projected to rise by
70 kb/d to 4.3 mb/d in 2012, with increases in Changqing, Yanchang and in offshore fields. India is
expected to experience growth in oil production of 20 kb/d on rising output from its Mangala‐Bhagyam‐
Aishwariya complex in Rajasthan, though at the time of writing, there were indications that start‐up at
the 50 kb/d Bhagyam field would be delayed into late 2011. Malaysia is currently experiencing problems
at its offshore Kikeh field, where production has been curbed to around half its capacity of 100 kb/d for
several months. That and steady decline elsewhere mean that Malaysia’s oil production could fall by

8/6/2019 IEA - Montly Oil Market Report - July 2011
http://slidepdf.com/reader/full/iea-montly-oil-market-report-july-2011 27/69
INTERNATIONAL ENERGY AGENCY ‐ O IL MARKET REPORT SUPPLY
13 JULY 2011 27
33 kb/d to 585 kb/d in 2012, albeit 2013 should see production rise again, as the Gumusut and Malikai
developments start up. In the absence of any significant rise in output at its Banyu Urip field, where
production remains stalled at around 20 kb/d, Indonesia is projected to see supply decline by 50 kb/d, to
865 kb/d in 2012.
3.7
3.8
3.9
4.0
4.1
4.2
4.3
4.4
Jan Mar May Jul Sep Nov Jan
mb/d China Total Oil Supply
2008 20092010 20112011 forecast 2012 forecast
0.8
0.9
1.0
1.1
Jan Mar May Jul Sep Nov Jan
mb/d Indonesia Total Oil Supply
2008 20092010 20112011 forecast 2012 forecast
Latin America is the region with strongest growth in output in 2012, with supplies rising by 270 kb/d to
4.6 mb/d. Brazil is the main contributor, expected to see total oil production increase by 175 kb/d to
2.4 mb/d as output rises from new offshore developments, including volumes from pre‐salt strata.
Despite there being a long list of new upstream projects, some concerns remain about spiralling costs
and the ability of the domestic supply and service industry to satisfy an ambitious project schedule with
mandatory local content. State oil company Petrobras recently delayed again the publication of its much‐
anticipated 2011‐2015 plan, allegedly on wrangling over costs, especially for ambitious downstream
projects and resulting government fears of higher fuel prices and inflation. Colombia is the region’s other
key source of growth. Production there is projected to rise by 85 kb/d, to just over 1.0 mb/d in 2012, on
rising output in the Llanos region. In Argentina, strikes that had been hitting oil production in the Santa
Cruz region, reportedly fizzled out in late June. Production in April, May and June is estimated to have
been curbed by around 100 kb/d. Projections for 2012 see production flat from 2011, at 675 kb/d.
1.8
1.9
2.0
2.1
2.2
2.3
2.4
2.5
Jan Mar May Jul Sep Nov Jan
mb/d Brazil Total Oil Supply
2008 20092010 20112011 forecast 2012 forecast
0.5
0.6
0.7
0.8
0.9
1.0
1.1
Jan Mar May Jul Sep Nov Jan
mb/d Colombia Total Oil Supply
2008 20092010 20112011 forecast 2012 forecast
In the Middle East, oil production is set to rise by 75 kb/d, to 1.8 mb/d, in 2012, as output in crisis‐
stricken Yemen is assumed to recover, and on rising volumes in Oman. In Yemen, around 120 kb/d is
expected to remain shut‐in during 3Q11, only recovering towards the end of the year – assuming repairs
to a key crude pipeline can be made if the political situation improves. As a result, annual production is
expected to rise by 55 kb/d to 250 kb/d in 2012. In Syria, production appears currently unaffected by the
deteriorating political situation, despite news reports indicating lower expected exports in July. Oil
production remains in decline and is expected to fall by 25 kb/d to 345 kb/d in 2012. In Oman,
production is expected to rise by 50 kb/d to 970 kb/d in 2012 due to various enhanced oil recovery (EOR)
projects and some new, small field developments.

8/6/2019 IEA - Montly Oil Market Report - July 2011
http://slidepdf.com/reader/full/iea-montly-oil-market-report-july-2011 28/69
SUPPLY INTERNATIONAL ENERGY AGENCY ‐ O IL MARKET REPORT
28 13 JULY 2011
Africa’s oil production is set to increase by 30 kb/d, to 2.6 mb/d in 2012, as production rises in
newcomers Ghana (+30 kb/d) and Uganda (+10 kb/d), as well as marginally in Congo (+20 kb/d) and
Equatorial Guinea (+10 kb/d). By contrast, oil production in Sudan (now split into northern and southern
halves; but for the meantime still listed as one in our databases) and Egypt should decline marginally.
FSU Exports FSU net oil exports reached 9.50 mb/d in May, a 550 kb/d fall from April’s exceptionally high level of
10.05 mb/d. Crude exports plummeted by 530 kb/d to 6.38 mb/d as volumes declined across all
seaborne and pipeline routes as the economics of exporting crude deteriorated over the month. This was
attributed to fluctuations in the Urals reference prices used to calculate the Russian crude export tax. In
May this was based on the average price of Urals between 15 March and 14 April, and amounted to
$453.7/mt, a $30/mt increase over the April level. However, in early May Urals fell sharply by $12/bbl,
remaining well below March–April levels for the duration of the month. Therefore, many producers
preferred to hold over shipments until economics improved. As such, exports are expected to pick‐up
again in June. On a regional basis, cargoes sent via Baltic ports plummeted by 200 kb/d after Primorsk
and Gdansk volumes declined by 100 kb/d each. Shipments from Black Sea ports fell by 100 kb/d after
declines from the Ukrainian ports of Odessa and Feodosiya combined with a 70 kb/d dip in CPC flows.
Volumes sent to Kozmino and China through the ESPO remained close to capacity at a combined
600 kb/d.
Latest month vs.
Apr 11 May 10
Crude
Black Sea 2.00 1.86 1.81 1.92 1.82 1.89 1.92 1.77 1.67 -0.10 -0.27
Baltic 1.60 1.60 1.66 1.56 1.60 1.48 1.58 1.73 1.54 -0.19 -0.18
Arctic/FarEast 0.74 0.98 1.07 0.87 0.97 0.87 0.84 0.92 0.83 -0.09 -0.20
BTC 0.80 0.77 0.81 0.81 0.80 0.72 0.78 0.79 0.70 -0.09 -0.15
Crude Seaborne 5.15 5.22 5.35 5.17 5.19 4.96 5.12 5.22 4.74 -0.48 -0.80
Druzhba Pipeline 1.11 1.13 1.09 1.16 1.14 1.14 1.16 1.14 1.11 -0.03 0.04
Other Routes 0.40 0.42 0.41 0.40 0.43 0.53 0.54 0.55 0.53 -0.02 0.12
Total Crude Exports 6.66 6.76 6.86 6.73 6.76 6.63 6.83 6.91 6.38 -0.53 -0.64
Of Which: Transneft 3.93 4.00 4.02 4.04 4.02 4.15 4.33 4.36 4.17 -0.19 0.01
Products
Fuel oil 1.41 1.54 1.67 1.63 1.51 1.43 1.40 1.78 1.79 0.01 0.02
Gasoil 0.95 0.88 0.89 0.82 0.81 0.90 0.92 0.85 0.79 -0.06 -0.12
Other Products 0.53 0.43 0.44 0.43 0.37 0.48 0.51 0.56 0.58 0.02 0.11
Total Product 2.89 2.85 3.01 2.88 2.69 2.81 2.83 3.19 3.15 -0.04 0.01
Total Exports 9.54 9.61 9.86 9.61 9.45 9.44 9.65 10.09 9.53 -0.57 -0.63
Imports 0.06 0.06 0.04 0.08 0.08 0.06 0.05 0.04 0.03 -0.02 0.00
Net Exports 9.49 9.55 9.82 9.53 9.37 9.39 9.61 10.05 9.50 -0.55 -0.63Sources: Argus Media Ltd, IEA estimates1
Transneft data exclude Russian CPC volumes.2Includes Vacuum Gas Oil
May 11
FSU Net Exports of Crude & Petroleum Products(million barrels per day)
2009 2010 2Q2010 3Q2010 4Q2010 1Q2011 Mar 11 Apr 11
Since Russian product export taxes are also based on the lagged price of Urals, the above factors
conspired to erode economics and thus product exports fell by 40 kb/d. Gasoil was hit hardest,
decreasing by 60 kb/d with increased supplies into the domestic market.
Starting in this issue, we have changed our data sources and have therefore revised our entire FSU
export data series historically. This change has resulted in an average downward revision of 10 kb/d to
net FSU exports for the January 2009‐March 2011 period. Within the regional breakout, Arctic/Far East
crude has been increased by on average 260 kb/d on the increased visibility of exports from Arctic ports
and flows moving through the Kenkiyak–Alashankou pipeline from Kazakhstan to China. Additionally, we
have reclassified vacuum gasoil from gasoil into fuel oil, based on its likely use as a refinery feedstock,
with volumes averaging 260 kb/d from 2009 onwards.

8/6/2019 IEA - Montly Oil Market Report - July 2011
http://slidepdf.com/reader/full/iea-montly-oil-market-report-july-2011 29/69
INTERNATIONAL ENERGY AGENCY ‐ O IL MARKET REPORT OECD STOCKS
13 JULY 2011 29
OECD STOCKS
Summary
• OECD industry stocks rose for a second consecutive month, gaining 23.9 mb in May, to 2 680 mb or
58.6 days of forward demand cover. The bulk of the increase stemmed from product restocking,
while April inventory is revised down by 11 mb. Despite the May stockbuild, the surplus to the
five‐year average narrowed from 16.4 mb in April to 10.3 mb in May.
• June preliminary data indicate a 2.9 mb decline in OECD commercial inventories. Crude oil fell by
6.6 mb as draws in the US outweighed European restocking. Refined product holdings rose by 7.1 mb,
led by a seasonal build in ‘other products’. This contrasts with an average five‐year increase of 2.6 mb.
• Short‐term oil floating storage fell to 54.4 mb in June, from 56.1 mb in May. Crude floating storage
declined by 2.1 mb to 40.6 mb, led by the offloading of Iranian crude in the Middle East Gulf, while
seaborne product storage rose by 0.4 mb to 13.8 mb on increases in the Asia‐Pacific.
• On 23 June, the IEA announced a coordinated release of 60 mb of oil in response to ongoing supply
disruptions in Libya and an anticipated increase in oil demand in 3Q11. Government stocks account
for 40 mb, while lowered stockholding obligations on industry will provide operators with additional
flexibility amounting to a further 20 mb.
OECD Industry Total Oil StocksRelative to Five-Year Average
-50
0
50
100
150
200
May 09 Nov 09 May 10 Nov 10 May 11
mb
Pacific North AmericaEurope OECD
OECD Gasoline Stocks
330
350
370
390
410
Jan Mar May Jul Sep Nov Jan
mb
Range 2006-2010 Avg 2006-20102010 2011
OECD Inventory Position at End-May and Revisions to Preliminary Data
OECD industry stocks rose for a second consecutive month, gaining by 23.9 mb in May, to 2 680 mb or
58.6 days. This was in line both with the last report’s preliminary expectations, and with a 30.0 mb
five‐year average build. Crude and ‘other oils’ grew only slightly, by 2.1 mb, while the bulk of the stock
increase (21.8 mb) stemmed from product restocking. ‘Other products’ built by 12.5 mb, in line with
seasonal trends, while a 3.8 mb gain in distillates is much lower than a 15.1 mb average increase over the
past five years. However, gasoline inventories rose counter‐seasonally by 7.6 mb, as refinery output in
the US outweighed product demand.
N. Am Europe Pacific Total N. Am Europe Pacific Total N. Am Europe Pacific Total
Crude Oil 4.3 1.6 -4.4 1.4 0.14 0.05 -0.14 0.05 0.30 0.00 0.02 0.32
Gasoline 9.0 0.4 -1.8 7.6 0.29 0.01 -0.06 0.25 0.01 0.04 0.01 0.06
Middle Distillates -4.5 5.1 3.3 3.8 -0.15 0.16 0.11 0.12 -0.24 0.10 -0.06 -0.21
Residual Fuel Oil -1.2 -0.7 -0.3 -2.2 -0.04 -0.02 -0.01 -0.07 -0.04 -0.01 0.02 -0.03
Other Products 11.9 0.5 0.2 12.5 0.38 0.02 0.01 0.40 -0.26 0.00 -0.05 -0.31
Total Products 15.1 5.3 1.4 21.8 0.49 0.17 0.04 0.70 -0.53 0.13 -0.09 -0.49
Other Oils1
-0.2 0.2 0.7 0.7 -0.01 0.01 0.02 0.02 -0.02 -0.05 -0.02 -0.09Total Oil 19.2 7.1 -2.3 23.9 0.62 0.23 -0.08 0.77 -0.25 0.07 -0.08 -0.26
1 Other oils includes NGLs, feedstocks and other hydrocarbons.
(million barrels per day)(million barrels per day)(million barrels)
May (preliminary) First Quarter 2011
Preliminary Industry Stock Change in May 2011 and First Quarter 2011

8/6/2019 IEA - Montly Oil Market Report - July 2011
http://slidepdf.com/reader/full/iea-montly-oil-market-report-july-2011 30/69
OECD STOCKS INTERNATIONAL ENERGY AGENCY ‐ O IL MARKET REPORT
30 13 JULY 2011
OECD forward demand cover remained below year‐ago levels at 58.6 days in May, down from 59.2 days
in April; nevertheless, stock cover still stood 2.1 days above the five‐year average. April OECD inventories
built by 23.2 mb, slower than a previously reported 34.5 mb increase, as stock levels were revised down
by 11.3 mb upon receipt of more complete monthly data. Downward adjustments were largely centred
in crude and gasoline. Moreover, monthly conversion factors for Canadian data were reconciled with
those for annual data.
(million barrels)
North America Europe Pacific OECD
Mar 11 Apr 11 Mar 11 Apr 11 Mar 11 Apr 11 Mar 11 Apr 11
Crude Oil 0.3 -4.4 -0.6 -9.3 -0.1 -0.6 -0.5 -14.3
Gasoline 0.1 0.0 0.1 -3.4 0.0 0.3 0.1 -3.1
Middle Distillates -0.3 4.1 0.9 -4.4 0.0 1.0 0.7 0.7
Residual Fuel Oil 0.0 0.8 -0.4 -0.4 0.0 0.0 -0.4 0.4
Other Products -0.1 0.7 0.0 -0.5 0.0 -1.1 0.0 -0.9
Total Products -0.3 5.6 0.6 -8.7 0.0 0.2 0.3 -2.9
Other Oils1
0.2 6.2 0.1 -0.3 0.0 0.0 0.2 5.8
Total Oil 0.2 7.4 0.0 -18.3 -0.1 -0.4 0.0 -11.3
1 Other oils includes NGLs, feedstocks and other hydrocarbons.
Revisions versus 16 June 2011 Oil Market Report
Despite the seasonal monthly stockbuild, the surplus of OECD industry stock levels to the five‐year
average narrowed from 16.4 mb in April to 10.3 mb in May. The overhang remained centred on US crude
and European distillates. However, crude oil stock levels in Europe changed dramatically following
a 1 mb/d drop in crude imports, resulting from the halt to Libyan exports and production outages in the
North Sea. Crude stocks now look to have plunged sharply by 20.5 mb from January to May and have
transformed a 2.3 mb surplus to the five‐year average evident at the beginning of 2011 into
a 29.9 mb deficit.
OECD Crude Oil StocksRelative to Five-Year Average
-40
-20
0
20
40
6080
100
May 09 Nov 09 May 10 Nov 10 May 11
mb
Pacific North AmericaEurope OECD
OECD Europe Crude Oil Stocks
300
310
320
330
340350
360
Jan Mar May Jul Sep Nov Jan
mb
Range 2006-2010 Avg 2006-20102010 2011
Preliminary Euroilstock data for June indicate a 6.0 mb build in European crude stocks, but this was
outweighed by draws elsewhere. Overall, OECD total oil inventories dropped by 2.9 mb in June.
Short‐term oil floating storage also fell in June to 54.4 mb, from 56.1 mb in May. Crude oil held offshore
on vessels declined by 2.1 mb, as the offloading of Iranian crude oil in the Middle East Gulf offset
additions in the US Gulf. Products floating storage increased by a marginal 0.4 mb, following additions to
products held in the Asia‐Pacific. Further product offloading in the Mediterranean and the release of
a vessel held off West Africa provided partial offset.
The IEA’s Libya Collective Action Explained
On 23 June at 3 pm Paris time, the IEA announced a release of 60 mb of oil as a response to the ongoing
supply disruption of Libyan light sweet crude, an anticipated oil demand increase in 3Q11, and to act as a
bridge to incremental supplies from major producers. Although the IEA’s Libya Collective Action was agreed
upon by all 28 member countries, the action is undertaken by 12 member countries, specifically those with
strategic stocks and a share of more than 1% in the total oil consumption of all IEA countries.

8/6/2019 IEA - Montly Oil Market Report - July 2011
http://slidepdf.com/reader/full/iea-montly-oil-market-report-july-2011 31/69
INTERNATIONAL ENERGY AGENCY ‐ O IL MARKET REPORT OECD STOCKS
13 JULY 2011 31
The IEA’s Libya Collective Action Explained (continued)
The release has been carried out according to standard practices in each of the 12 countries; their
procedures are regularly reviewed and rehearsed. Five countries (Belgium, Germany, Korea, the Netherlands
and the US) are releasing stocks from public reserves via tender, auction or direct sale. Eight countries
(Belgium, France, Italy, Japan, Poland, Spain, Turkey and the UK) lowered the emergency reserves obligation
on market operators (Belgium is using both public and industry stocks in this action). The release from public
stocks accounts for nearly 40 mb, and obligated industry stocks around 20 mb.
At the end of June the US offered 30.2 mb of light sweet SPR crude via auction. Of 90 bids received, 28 bids
were accepted, totalling over 30.6 mb. Uptake of the 2011 tender has been greater than that for the IEA’s
Katrina Collective Action of 2005. At that time 30 mb were also offered for tender, with only 11 mb sold, in
addition to 11.4 mb taken up just prior to the Katrina Action via a US SPR loan program.
In Germany, 4.2 mb, evenly split between crude and products, were tendered in early July. Of this, 66% was
taken up; 1.62 mb of crude oil, 0.5 mb of gasoline and 0.65 mb of diesel. During the Katrina Action in 2005,
the market took up 25% of the offers (3.63 mb offered; 0.96 mb bought). In Belgium, Korea and the
Netherlands, at writing, all stocks offered appear likely to be taken up by the market.
In countries with mandatory industry stocks, governments require importers, refiners, product suppliers or
wholesalers to hold a minimum number of days of stocks. Generally, the days of stocks are based on a
percentage of the previous year’s sales, consumption or imports. In a collective action, a uniform reduction
in the stockholding obligation for all operators is the preferred approach in most of these countries. When
the industry obligation specifies oil products (gasoline, diesel/gasoil, kerosene, fuel oil), the lowered
obligation is usually also product‐specific, as shown in the table below.
Total Public Industry Crude Refined Residual Jet Fuel/
Oil Product Gasoline Diesel Fuel Oil Kerosene
United States 30,640 30,640 30,640Total IEA North America 30,640 30,640 30,640
Japan 7,915 7,915 3,958 * 3,957 *
Korea 3,467 3,467 1,998 1,469 300 1,169
Total IEA Pacific 11,382 3,467 7,915 5,956 5,426 300 1,169
Belgium 797 95 702 797 43 654 6 95
France 3,242 3,242 3,242 476 2,375 64 327
Germany 2,770 2,770 1,620 1,150 500 650
Italy 2,524 2,524 2,524 1,183 373 968
Netherlands 1,173 1,173 1,023 150 150
Poland 959 959 310 650 139 510
Spain 2,274 2,274 2,274 331 1,799 144
Turkey 1,071 1,071 1,071 176 895
United Kingdom 3,000 3,000 600 * 2,400 *Total IEA Europe 17,811 4,038 13,773 3,553 14,258 2,848 7,407 1,181 422
Total IEA 59,833 38,145 21,688 40,149 19,684 3,148 8,576 1,181 422
* The breakdown in crude and product has been estimated; overall stockholding obligations on industry, which include bothcrude and refined products, have been lowered in these countries.
Emergency Oil Stocks Made Available From IEA Actionthousand barrels
Of which:
Operators generally have the flexibility to meet their product obligation at least partly with crude oil,
according to product yields. Hence, when the obligation is relaxed, it is up to the company to decide
whether to lower product stocks or crude oil stocks, or a combination of both, according to its own needs
and market circumstances. While relaxing the stock obligation on operators might be a less visible response,
or be seen as a more diluted measure, since no formally announced sales or physical movements may occur,
it is no less effective. The lowered obligations give operators the opportunity to make additional oil available
over the coming months, and they will use this greater flexibility according to market circumstances.
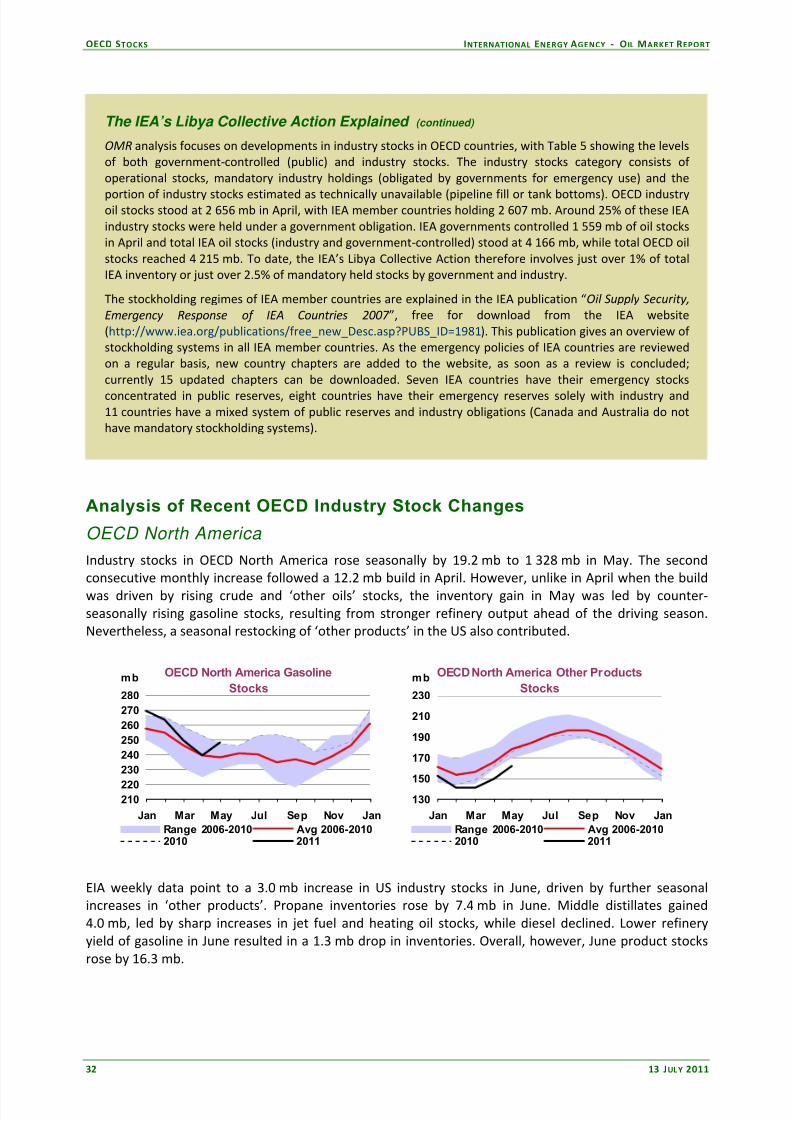
8/6/2019 IEA - Montly Oil Market Report - July 2011
http://slidepdf.com/reader/full/iea-montly-oil-market-report-july-2011 32/69
OECD STOCKS INTERNATIONAL ENERGY AGENCY ‐ O IL MARKET REPORT
32 13 JULY 2011
The IEA’s Libya Collective Action Explained (continued)
OMR analysis focuses on developments in industry stocks in OECD countries, with Table 5 showing the levels
of both government‐controlled (public) and industry stocks. The industry stocks category consists of
operational stocks, mandatory industry holdings (obligated by governments for emergency use) and the
portion of industry stocks estimated as technically unavailable (pipeline fill or tank bottoms). OECD industry oil stocks stood at 2 656 mb in April, with IEA member countries holding 2 607 mb. Around 25% of these IEA
industry stocks were held under a government obligation. IEA governments controlled 1 559 mb of oil stocks
in April and total IEA oil stocks (industry and government‐controlled) stood at 4 166 mb, while total OECD oil
stocks reached 4 215 mb. To date, the IEA’s Libya Collective Action therefore involves just over 1% of total
IEA inventory or just over 2.5% of mandatory held stocks by government and industry.
The stockholding regimes of IEA member countries are explained in the IEA publication “Oil Supply Security,
Emergency Response of IEA Countries 2007 ”, free for download from the IEA website
(http://www.iea.org/publications/free_new_Desc.asp?PUBS_ID=1981). This publication gives an overview of
stockholding systems in all IEA member countries. As the emergency policies of IEA countries are reviewed
on a regular basis, new country chapters are added to the website, as soon as a review is concluded;
currently 15 updated chapters can be downloaded. Seven IEA countries have their emergency stocks
concentrated in public reserves, eight countries have their emergency reserves solely with industry and
11 countries have a mixed system of public reserves and industry obligations (Canada and Australia do not
have mandatory stockholding systems).
Analysis of Recent OECD Industry Stock Changes
OECD North America
Industry stocks in OECD North America rose seasonally by 19.2 mb to 1 328 mb in May. The second
consecutive monthly increase followed a 12.2 mb build in April. However, unlike in April when the build
was driven by rising crude and ‘other oils’ stocks, the inventory gain in May was led by counter‐
seasonally rising gasoline stocks, resulting from stronger refinery output ahead of the driving season.
Nevertheless, a seasonal restocking of ‘other products’ in the US also contributed.
OECD North America Gasoline
Stocks
210220
230
240
250
260
270
280
Jan Mar May Jul Sep Nov Jan
mb
Range 2006-2010 Avg 2006-20102010 2011
OECD North America Other Products
Stocks
130
150
170
190
210
230
Jan Mar May Jul Sep Nov Jan
mb
Range 2006-2010 Avg 2006-20102010 2011
EIA weekly data point to a 3.0 mb increase in US industry stocks in June, driven by further seasonal
increases in ‘other products’. Propane inventories rose by 7.4 mb in June. Middle distillates gained
4.0 mb, led by sharp increases in jet fuel and heating oil stocks, while diesel declined. Lower refinery
yield of gasoline in June resulted in a 1.3 mb drop in inventories. Overall, however, June product stocks
rose by 16.3 mb.
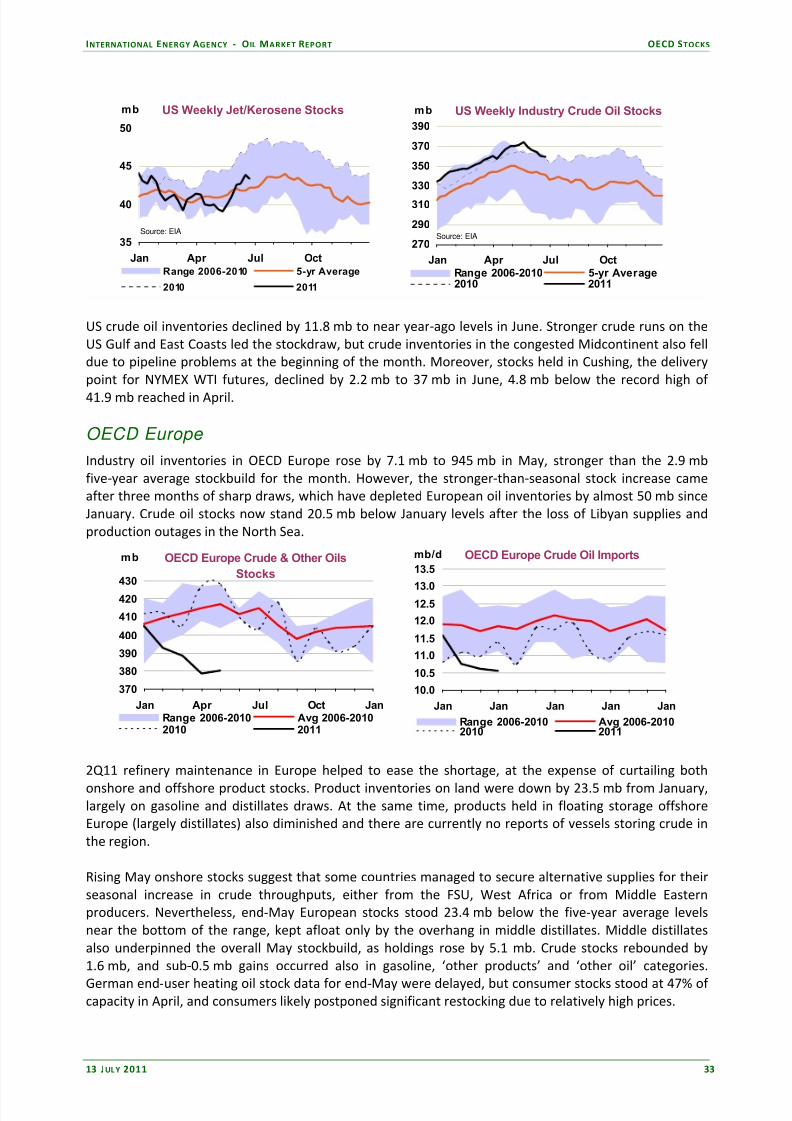
8/6/2019 IEA - Montly Oil Market Report - July 2011
http://slidepdf.com/reader/full/iea-montly-oil-market-report-july-2011 33/69
INTERNATIONAL ENERGY AGENCY ‐ O IL MARKET REPORT OECD STOCKS
13 JULY 2011 33
US Weekly Jet/Kerosene Stocks
35
40
45
50
Jan Apr Jul Oct
mb
Range 2006-2010 5-yr Average
2010 2011
Source: EIA
US Weekly Industry Crude Oil Stocks
270
290
310
330
350
370
390
Jan Apr Jul Oct
mb
Range 2006-2010 5-yr Average2010 2011
Source: EIA
US crude oil inventories declined by 11.8 mb to near year‐ago levels in June. Stronger crude runs on the
US Gulf and East Coasts led the stockdraw, but crude inventories in the congested Midcontinent also fell
due to pipeline problems at the beginning of the month. Moreover, stocks held in Cushing, the delivery
point for NYMEX WTI futures, declined by 2.2 mb to 37 mb in June, 4.8 mb below the record high of
41.9 mb reached in April.
OECD Europe
Industry oil inventories in OECD Europe rose by 7.1 mb to 945 mb in May, stronger than the 2.9 mb
five‐year average stockbuild for the month. However, the stronger‐than‐seasonal stock increase came
after three months of sharp draws, which have depleted European oil inventories by almost 50 mb since
January. Crude oil stocks now stand 20.5 mb below January levels after the loss of Libyan supplies and
production outages in the North Sea.
OECD Europe Crude & Other Oils
Stocks
370
380
390
400
410
420
430
Jan Apr Jul Oct Jan
mb
Range 2006-2010 Avg 2006-20102010 2011
OECD Europe Crude Oil Imports
10.0
10.5
11.0
11.5
12.0
12.513.0
13.5
Jan Jan Jan Jan Jan
mb/d
Range 2006-2010 Avg 2006-20102010 2011
2Q11 refinery maintenance in Europe helped to ease the shortage, at the expense of curtailing both
onshore and offshore product stocks. Product inventories on land were down by 23.5 mb from January,
largely on gasoline and distillates draws. At the same time, products held in floating storage offshore
Europe (largely distillates) also diminished and there are currently no reports of vessels storing crude in
the region.
Rising May onshore stocks suggest that some countries managed to secure alternative supplies for their
seasonal increase in crude throughputs, either from the FSU, West Africa or from Middle Eastern
producers. Nevertheless, end‐May European stocks stood 23.4 mb below the five‐year average levels
near the bottom of the range, kept afloat only by the overhang in middle distillates. Middle distillates
also underpinned the overall May stockbuild, as holdings rose by 5.1 mb. Crude stocks rebounded by
1.6 mb, and sub‐0.5 mb gains occurred also in gasoline, ‘other products’ and ‘other oil’ categories.
German end‐user heating oil stock data for end‐May were delayed, but consumer stocks stood at 47% of
capacity in April, and consumers likely postponed significant restocking due to relatively high prices.

8/6/2019 IEA - Montly Oil Market Report - July 2011
http://slidepdf.com/reader/full/iea-montly-oil-market-report-july-2011 34/69
OECD STOCKS INTERNATIONAL ENERGY AGENCY ‐ O IL MARKET REPORT
34 13 JULY 2011
OECD Europe Total Products Stocks
500
520
540
560
580
600
Jan Mar May Jul Sep Nov Jan
mb
Range 2006-2010 Avg 2006-20102010 2011
German End-User Heating Oil Stocks
% of Storage Capacity
40
45
50
55
60
65
70
Jan Mar May Jul Sep Nov Jan
%
Range 2006-2010 Avg 2006-20102010 2011
Preliminary June data from Euroilstock point to a 0.6 mb stockbuild in the EU‐15 and Norway, as gains in
crude oil holdings balanced product draws. Crude oil stocks rose by 6.0 mb, sharply building in the UK,
Austria, Germany and France. Products declined by 5.3 mb, led by falling gasoline and distillate
inventories in Germany, the Netherlands and the UK. Meanwhile, refined oil product inventories held in
Northwest European independent storage rose marginally, as rising gasoline and naphtha stocks
outweighed draws in jet fuel, gasoil and fuel oil.
OECD Pacific
Industry oil inventories in the OECD Pacific declined by 2.3 mb to 408 mb in May. The draw strongly
contrasted with a 10.3 mb seasonal five‐year average build, but it came after a sharp 25.5 mb Japanese
post‐quake and tsunami restocking in April. Following the March disaster, the Japanese government
relaxed the stockholding obligation on industry from 70 days to 45 days of domestic consumption
equivalent. The relaxation expired on 21 May and Japanese refiners also reinstated product exports to
Singapore while waiting for domestic demand to pick up.
OECD Pacific Crude Oil Stocks
155
160
165
170
175
180
185
190
Jan Apr Jul Oct Jan
mb
Range 2006-2010 Avg 2006-2010
2010 2011
Japan Weekly Gasoline Stocks
10
11
12
13
14
15
16
17
Jan Apr Jul Oct
mb
Range 2006-10 5-yr Average2010 2011
Source: PAJ
Meanwhile, Korean refiners absorbed some redirected crude cargoes in April, boosted refinery runs and
exported the products to fill the gap in regional supplies. However, as the temporary surge in crude
imports faded in May, elevated refinery runs drew 5.2 mb of Korean crude stocks in May. Overall, Pacific
crude stocks declined by 4.4 mb in May, partly balanced by a 3.3 mb increase in middle distillates.
Weekly data from the Petroleum Association of Japan (PAJ) suggest a 6.6 mb draw in Japanese industry
inventories in June. As refiners ramped up runs, crude oil stocks declined by 0.8 mb and ‘other oils’ fell
by a further 2.0 mb. Japanese product exports to Singapore rebounded to pre‐disaster levels and product
stocks also fell by 3.8 mb, led by declines in middle distillates and ‘other products’.

8/6/2019 IEA - Montly Oil Market Report - July 2011
http://slidepdf.com/reader/full/iea-montly-oil-market-report-july-2011 35/69
INTERNATIONAL ENERGY AGENCY ‐ O IL MARKET REPORT OECD STOCKS
13 JULY 2011 35
Recent Developments in China and Singapore Stocks
Chinese commercial oil inventories fell by an equivalent of 3.6 mb (data are reported in terms of
percentage stock change), to just below 350 mb in May, according to China Oil, Gas and Petrochemicals
(China OGP). Commercial crude oil inventories decreased by 3.5% (‐7.4 mb) from April, as already‐high
refinery runs rose again, in order to maintain domestic supplies amid concerns that power shortages will
hike diesel demand again. Meanwhile product stocks climbed by 2.6% (+3.7 mb) month‐on‐month,
driven by gains in all categories. Gasoline stocks rose by 1.0% (+0.6 mb), diesel by 3.0% (+2.2 mb), and
kerosene by 8.0% (+0.9 mb).
China Monthly Oil Stock Change*
(15)
(10)
(5)
0
5
10
15
20
Nov 10 Jan 11 Mar 11 May 11
mb
Crude Gasoline Gasoil Kerosene
*Since August 2010, COGP only reports percentage stock change
Singapore Weekly Middle Distillate
Stocks
4
68
10
12
14
16
18
Jan Apr Jul Oct
mb
Range 2006-2010 5-yr Average2010 2011
Source: International Enterprise
Refined oil product inventories in Singapore rose by 1.0 mb in June. Middle distillate stocks gained
1.2 mb as jet fuel and gasoil imports from Japan returned to February levels and provided partial relief
following lower deliveries from China due to concerns over power shortages. Light distillate stocks,
including naphtha and gasoline, declined by 0.4 mb on stronger regional exports to cover for refinery
maintenance. Gasoline stocks dropped to the five‐year average from their April record highs. Fuel oil
inventories rose by 0.2 mb, as western arbitrage arrivals offset strong bunker fuel demand.

8/6/2019 IEA - Montly Oil Market Report - July 2011
http://slidepdf.com/reader/full/iea-montly-oil-market-report-july-2011 36/69
OECD STOCKS INTERNATIONAL ENERGY AGENCY ‐ O IL MARKET REPORT
36 13 JULY 2011
1 Days of forward demand are based on average demand over the next three months
Days1 Million Barrels
Regional OECD End-of-Month Industry Stocks(in days of forward demand and millions barrels of total oil)
OECD Total Oil
50
52
54
56
58
60
62
Jan Mar May Jul Sep Nov Jan
Days
Range 2006-2010 Avg 2006-2010
2010 2011
North America
48
50
52
54
56
5860
Jan Mar May Jul Sep Nov Jan
Days
Range 2006-2010 Avg 2006-2010
2010 2011
Europe
58
60
62
64
66
68
7072
Jan Mar May Jul Sep Nov Jan
Days
Range 2006-2010 Avg 2006-2010
2010 2011
Pacific
44
46
48
50
52
54
56
58
Jan Mar May Jul Sep Nov Jan
Days
Range 2006-2010 Avg 2006-2010
2010 2011
North America
1,200
1,250
1,300
1,350
1,400
1,450
Jan Mar May Jul Sep Nov Jan
mb
Range 2006-2010 Avg 2006-2010
2010 2011
Europe
900
920
940
960
980
1,000
1,020
Jan Mar May Jul Sep Nov Jan
mb
Range 2006-2010 Avg 2006-2010
2010 2011
Pacific
360
380
400
420
440
460
480
Jan Mar May Jul Sep Nov Jan
mb
Range 2006-2010 Avg 2006-2010
2010 2011
OECD Total Oil
2,550
2,600
2,650
2,700
2,750
2,800
Jan Mar May Jul Sep Nov Jan
mb
Range 2006-2010 Avg 2006-2010
2010 2011

8/6/2019 IEA - Montly Oil Market Report - July 2011
http://slidepdf.com/reader/full/iea-montly-oil-market-report-july-2011 37/69
INTERNATIONAL ENERGY AGENCY ‐ O IL MARKET REPORT PRICES
13 JULY 2011 37
PRICES
Summary
• Crude oil prices were volatile over the course of June in response to conflicting market drivers, with
benchmark crudes trading in a wide $9‐15/bbl range. The initial bearish impact on prompt prices from
the IEA’s Libya collective action was tempered by significant supply outages among non‐OPEC
producers, especially the North Sea, with prices retracing their losses by early July. Oil sold under the IEA
action will filter into consuming markets in July and August. The more immediate impact may prove to
be the realignment of sweet/sour crude price spreads, earlier distorted by the loss of lighter Libyan
crude, and a flattening of erstwhile backwardation. Benchmarks Brent and WTI were last trading around
$116/bbl and $95/bbl.
• Weaker crude prices in June generally supported product crack spreads, but light ends saw
differentials decline and stay weak. Middle distillates crack spreads improved slightly while the largest
improvement was at the bottom of the barrel, with fuel oil discounts narrowing in June. Refining
margins were down in June month‐on‐month, but generally stronger after the IEA collective action.
• Well before the IEA stock release pressured prices lower, managed money traders were cutting
their net long exposures in light, sweet crude oil contracts, off by 40% since mid‐April to 21 June
2011. However, in the last week of June, long positions increased again, in part on renewed
expectations of stronger demand coupled with constrained supplies.
• Despite higher production from OPEC’s Middle East producers, benchmark crude tanker rates
remained depressed throughout June. The Middle East Gulf – Japan VLCC rate has remained close to,
or below, break‐even levels for much of the past three months due to a combination of high bunker
fuel prices, sluggish demand and swelling tonnage.
70
80
90
100
110
120
130
Jun 10 Sep 10 Dec 10 Mar 11 Jun 11
$/bbl Crude FuturesFront Month Close
NYMEX WTI ICE Brent
Source: ICE, NYMEX
92
96
100
104
108
112
116
120
M1 2 3 4 5 6 7 8 9 10 11 12
$/bblNYMEX WTI & ICE Brent
Forward Price Curves
NYMEX WTI ICE Brent
Source: ICE, NYMEX
8 July 2011
Market Overview
Oil market sentiment rapidly shifted from fears of shortfalls of light, sweet crude to the possibility of
oversupply after the 23 June IEA collective action. Prices initially fell by $3‐5/bbl, but within days
retraced their losses amid stronger economic news and what now look like misplaced fears that the
temporary IEA measure might discourage OPEC producers from increasing output as planned during the
peak summer demand period. Chronic production outages in the North Sea, coupled with seasonal field
maintenance, also added upward momentum, with mounting concern that supply will be eclipsed by
seasonally stronger demand in 3Q11. However, in recent days prices turned lower again on renewed
concerns about the Eurozone debt crisis and fears recent economic developments may undermine oil
demand growth. At writing, prices for benchmark Brent and WTI futures were trading around $116/bbl
and $95/bbl.

8/6/2019 IEA - Montly Oil Market Report - July 2011
http://slidepdf.com/reader/full/iea-montly-oil-market-report-july-2011 38/69
PRICES INTERNATIONAL ENERGY AGENCY ‐ O IL MARKET REPORT
38 13 JULY 2011
With extra supply from the IEA’s collective action likely to take time to filter onto the market the Brent
market quickly shrugged off the IEA stock release and refocused its attention on the chronic monthly
supply shortfalls of North Sea Forties and other grades
evident since February. Problems at the key Buzzard field,
part of the Forties complex, have led to a significant loss of
supply over the past five months. Indeed, current estimates for lost production from Buzzard top 12 mb from February
to June. Seasonal scheduled maintenance will further
reduce North Sea supplies in July and August. Buzzard is the
largest field in the UK with production of around 200 kb/d.
North Sea Forties is a key blend used for setting the Dated
Brent price.
In addition to reduced North Sea crude production, supply
outages elsewhere in non‐OPEC countries, which include Yemen, Canada and Argentina, were estimated
at just shy of 700 kb/d in 2Q11 and are forecast to post a similar loss for 3Q11 (see Non‐OPEC Supply ).
Despite market scepticism that OPEC would follow through on delivering more barrels to the market in
the wake of the IEA release, our latest estimates suggest that OPEC supply was up by nearly 850 kb/d, to
30.03 mb/d in June, with Saudi Arabia accounting for 85% of the group’s increase (see OPEC Supply ).
Seasonally stronger oil demand in 3Q11 is expected to increase the ‘call on OPEC crude and stock
change’ by a steep 1.3 mb/d from 2Q11 levels. The end of large‐scale maintenance programmes at
refineries in Europe, Asia and the US is also leading to brisk demand for crude.
While refiners opted not to take up Saudi Arabia’s offer of extra barrels, including new hybrid crudes
similar to lost Libyan supplies, for the April‐June period, there are indications that buyers are showing
more interest for July and August, especially in Asia. However, others say August prices set by Saudi
Aramco
are
too
expensive,
which
may
discourage
increased
liftings.
-20
-15
-10
-5
0
5
10
Jun 10 Sep 10 Dec 10 Mar 11 Jun 11
$/bblCrude Futures
Forward Spreads
WTI M1-M12 Brent M1-M12
Source: ICE, NYMEX
-1
0
1
2
3
4
5
Jun 10 Sep 10 Dec 10 Mar 11 Jun 11
$/bblLight Sweet Mediterranean Crude
Differentials to Dated Brent
Azeri Light - Dated BrentSaharan Blend - Dated Brent
Data source: Platts analysis
While benchmark crude prices were largely back to where they were before the IEA’s collective decision
to release stocks, the action has led to a narrowing of the sweet‐sour crude price spreads, which
ballooned to peak levels following the onset of civil war in Libya. The release of light‐sweet SPR crude in
the US is seen as diverting alternative supplies into Europe and Asia, helping to nullify the impact of lost
Libyan barrels.
In addition, the extra crude supply added downward pressure on prompt month contracts. The forward
price curve for M1‐M12 Brent contract briefly moved out of backwardation immediately following the
IEA’s announcement. Before that, the Brent M1‐M12 spread averaged around $3.25/bbl in June but
post‐IEA action it tumbled into contango at ‐$0.40/bbl on average for the last week of June. Worries over
2H11 supply and demand fundamentals, however, once again pushed Brent M1‐M12 into relatively
1.0
1.1
1.2
1.3
1.4
1.5
1.6
1.7
Jan Mar May Jul Sep Nov Jan
mb/d UK Total Oil Supply
2008 20092010 20112011 forecast 2012 forecast

8/6/2019 IEA - Montly Oil Market Report - July 2011
http://slidepdf.com/reader/full/iea-montly-oil-market-report-july-2011 39/69
INTERNATIONAL ENERGY AGENCY ‐ O IL MARKET REPORT PRICES
13 JULY 2011 39
shallow backwardation, at around $0.80/bbl in the first week of July. Markets have been closely tracking
supply and demand data in recent weeks, with the tenuous links with the S&P 500 and other economic
and financial market data seemingly less important for now.
800
1000
1200
1400
60
70
80
90
100
110
120
Jan 10 May 10 Sep 10 Jan 11 May 11
IndexUS$/bblNYMEX WTI vs S&P 500
NYMEX WTI S&P 500 (RHS)
Source: NYMEX
NYMEX WTI vs US Dollar Index
60
70
80
90
100
110
120
Jan 10 May 10 Sep 10 Jan 11 May 11
US$/bbl
70
75
80
85
90
Index
NYMEX WTI US Dollar Index (inversed RHS)
Source: ICE, NYM EX
Apr May Jun Jun-May % Week Commencing:
Avg Chg Chg 06 Jun 13 Jun 20 Jun 27 Jun 04 Jul
NYMEX
Light Sweet Crude Oil 110.04 101.36 96.29 -5.07 -5.3 100.01 95.89 92.85 93.73 97.10
RBOB 137.25 130.02 123.93 -6.09 -4.9 125.82 124.99 120.81 123.57 128.04
No.2 Heating Oil 134.66 124.48 125.04 0.56 0.4 129.62 127.71 120.19 120.69 127.24
No.2 Heating Oil ($/mmbtu) 23.12 21.37 21.47 0.10 0.4 22.25 21.92 20.63 20.72 21.84
Henry Hub Natural Gas ($/mmbtu) 4.27 4.34 4.52 0.18 4.0 4.79 4.51 4.29 4.32 4.23
ICE
Brent 123.09 114.52 113.90 -0.62 -0.5 117.49 116.72 109.85 110.28 115.11
Gasoil 137.60 126.91 127.24 0.32 0.3 130.61 131.20 123.06 122.41 127.10
Prompt Month DifferentialsNYMEX WTI - ICE Brent -13.05 -13.17 -17.61 -4.45 -17.48 -20.83 -17.00 -16.56 -18.01
NYMEX No.2 Heating Oil - WTI 24.62 23.13 28.75 5.62 29.61 31.82 27.34 26.97 30.14
NYMEX RBOB - WTI 27.21 28.66 27.64 -1.02 25.80 29.11 27.96 29.85 30.94
NYMEX 3-2-1 Crack (RBOB) 26.35 26.82 28.01 1.19 27.07 30.01 27.75 28.89 30.67
NYMEX No.2 - Natural Gas ($/mmbt 18.85 17.03 16.95 -0.08 17.47 17.42 16.35 16.40 17.61
ICE Gasoil - ICE Brent 14.51 12.39 13.33 0.94 13.11 14.48 13.21 12.12 11.99
Source: ICE, NYMEX
Prompt Month Oil Futures Prices(monthly and weekly averages, $/bbl)
Futures Markets
Managed money traders have been cutting their net long exposures in light, sweet crude oil contracts
since mid‐April on both CME and ICE Exchanges. Money managers cut net‐long positions in NYMEX WTI
crude oil by 40%, from 267 539 contracts in early April to 162 190 contracts on 21 June, just before the
IEA announced its 60 mb stock release. They continued to reduce their net long position following the
release. However, in the last week of June, they increased their long position by 9 637 to 159 641
contracts in New York. In the meantime, managed money traders also reduced net long exposure in WTI
contracts traded in London from almost 50 000 to 12 330 from April to the week following the release.
Money managers increased their long positions by 3 768 to 16 098 contracts in the week of 5 July.
Producers decreased their net shorts position during the month of June; they held 25.5% of the short
and 14.5% of the long contracts in CME WTI futures‐only contracts. Swap dealers, who accounted for
33.5% and 32.7% of the open interest on the long side and short side, respectively, reinforced a recent
trend of dwindling net short by adding 20 774 gross long contracts. On the other hand, both producers
and swap dealers remained net short in London ICE WTI contracts.
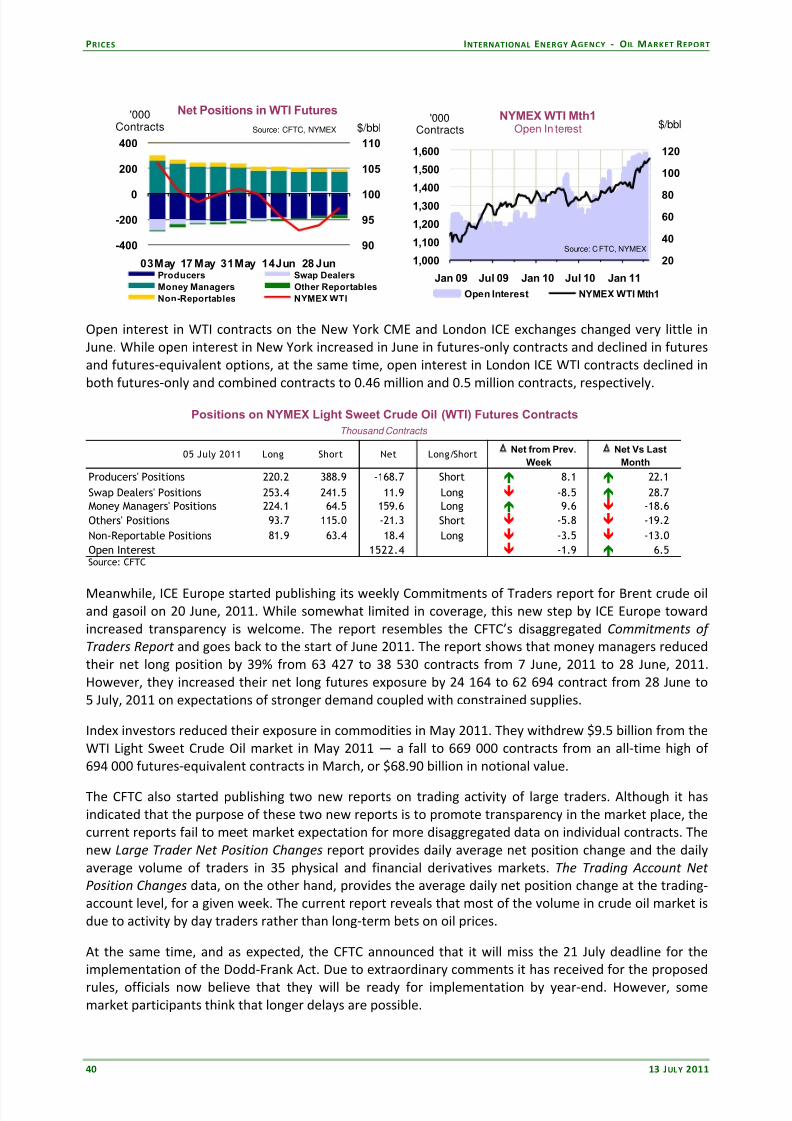
8/6/2019 IEA - Montly Oil Market Report - July 2011
http://slidepdf.com/reader/full/iea-montly-oil-market-report-july-2011 40/69
PRICES INTERNATIONAL ENERGY AGENCY ‐ O IL MARKET REPORT
40 13 JULY 2011
90
95
100
105
110
-400
-200
0
200
400
03 May 17 May 31 May 14 Jun 28 Jun
$/bbl'000
Contracts
Net Positions in WTI Futures
Producers Swap Dealers
Money Managers Other Reportables
Non-Reportables NYMEX WTI
Source: CFTC, NYMEX
20
40
60
80
100
120
1,000
1,100
1,200
1,300
1,400
1,500
1,600
Jan 09 Jul 09 Jan 10 Jul 10 Jan 11
'000Contracts
$/bblNYMEX WTI Mth1
Open In terest
Open Interest NYMEX WTI Mth1
Source: CFTC, NYMEX
Open interest in WTI contracts on the New York CME and London ICE exchanges changed very little in
June. While open interest in New York increased in June in futures‐only contracts and declined in futures
and futures‐equivalent options, at the same time, open interest in London ICE WTI contracts declined in
both futures‐only and combined contracts to 0.46 million and 0.5 million contracts, respectively.
05 July 2011 Long Short Net Long/ShortΔ Net from Prev.
Week
Δ Net Vs Last
Month
Producers' Positions 220.2 388.9 -168.7 Short 8.1 22.1
Swap Dealers' Positions 253.4 241.5 11.9 Long -8.5 28.7
Money Managers' Positions 224.1 64.5 159.6 Long 9.6 -18.6
Others' Positions 93.7 115.0 -21.3 Short -5.8 -19.2
Non-Reportable Positions 81.9 63.4 18.4 Long -3.5 -13.0
Open Interest 1522.4 -1.9 6.5
Source: CFTC
Thousand Contracts
Positions on NYMEX Light Sweet Crude Oil (WTI) Futures Contracts
Meanwhile, ICE Europe started publishing its weekly Commitments of Traders report for Brent crude oil
and gasoil on 20 June, 2011. While somewhat limited in coverage, this new step by ICE Europe toward
increased transparency is welcome. The report resembles the CFTC’s disaggregated Commitments of
Traders Report and goes back to the start of June 2011. The report shows that money managers reduced
their net long position by 39% from 63 427 to 38 530 contracts from 7 June, 2011 to 28 June, 2011.
However, they increased their net long futures exposure by 24 164 to 62 694 contract from 28 June to
5 July, 2011 on expectations of stronger demand coupled with constrained supplies.
Index investors reduced their exposure in commodities in May 2011. They withdrew $9.5 billion from the
WTI Light Sweet Crude Oil market in May 2011 — a fall to 669 000 contracts from an all‐time high of
694 000 futures‐equivalent contracts in March, or $68.90 billion in notional value.
The CFTC also started publishing two new reports on trading activity of large traders. Although it has
indicated that the purpose of these two new reports is to promote transparency in the market place, the
current reports fail to meet market expectation for more disaggregated data on individual contracts. The
new Large Trader Net Position Changes report provides daily average net position change and the daily
average volume of traders in 35 physical and financial derivatives markets. The Trading Account Net
Position Changes data, on the other hand, provides the average daily net position change at the trading‐
account level, for a given week. The current report reveals that most of the volume in crude oil market is
due to activity by day traders rather than long‐term bets on oil prices.
At the same time, and as expected, the CFTC announced that it will miss the 21 July deadline for the
implementation of the Dodd‐Frank Act. Due to extraordinary comments it has received for the proposed
rules, officials now believe that they will be ready for implementation by year‐end. However, some
market participants think that longer delays are possible.

8/6/2019 IEA - Montly Oil Market Report - July 2011
http://slidepdf.com/reader/full/iea-montly-oil-market-report-july-2011 41/69
INTERNATIONAL ENERGY AGENCY ‐ O IL MARKET REPORT PRICES
13 JULY 2011 41
Is WTI Weakness Purely Physical?
Prices for crude oil benchmarks WTI and Brent have historically been related. In general WTI light sweet
crude oil sold at a 5% premium to Brent crude oil between 1994 and 2010. However, this relationship
between WTI and Brent crude oil totally collapsed in 2011. Brent crude oil sold at an average premium of
$13/bbl in 1H11, or 13%, reaching $23/bbl in mid‐June.
That Brent might sell at a premium over WTI is not a new phenomenon. However, the magnitude as well as
the duration of the current episode raises questions about the causes of this new ‘reality’ and whether the
weakening of WTI and strengthening of Brent prices are temporary or permanent phenomena.
This report has long noted the combination of rising Canadian and onshore US crude supplies into Cushing,
sluggish US demand recovery after the recession and bottlenecks facing the shipment of crude from Cushing to
the Gulf Coast refining hub. This has led to a record
increase in stock levels in Cushing, thereby depressing
WTI crude prices, especially in the front end of the
futures curve. At the same time, lower supplies from
the North Sea, the loss of Libyan crude and rising
demand from large emerging market economies,
especially in China, have exerted upward pressure on
the price of Brent crude oil. In addition, given its ready
access to seaborne markets, Brent crude has gained
more acceptance as a global oil benchmark.
Some argue that physical supply and demand cannot
explain the magnitude and the duration of divergence
between Brent and WTI crude oil prices due to a
simple economic principle: arbitrage. The arbitrage principle suggests that if goods are close subsitutes and
easily transported, then they should sell for a similar price. Since the transportation costs from Cushing to
the Gulf of Mexico is not more than $10/bbl, and carry from the Gulf of Mexico to Europe costs an additional
$3‐4/bbl, a spread above $15/bbl should not be sustainable. The suggested conclusion is that, aside from
physical demand and supply considerations, financial factors might have played some role in widening the
spread between Brent and WTI crude oil prices.
There are basically two arguments as to how financial markets could play a role in widening the spread. In
the first place, it is argued that, amid anticipation of rules on hard position limits by the CFTC, some
speculators and commodity index dealers may have migrated from New York (Nymex) to London (ICE) in
order to avoid such position limits. However, open interest data published by CFTC and ICE Europe do not
support this hypothesis. Open interest in CME NYMEX WTI contracts has risen by 3.5% since January. Open
interest in both ICE WTI and Brent contracts declined by 20% and 7% in the same period, respectively.
Although data on speculators’ positions on Brent crude oil became available too recently (June 2011) to
allow for comparisions, evidence from the ICE WTI contract suggests that the overall positions of speculators
and swap dealers declined between January and July.
The second hypothesis is related to changes in the structure of the forward curve for Brent and WTI crudes. Up
until
December
2010,
both
WTI
and
Brent
were
in
deep
contango.
However,
starting
last
December,
the
Brent
forward curve displayed a steep backwardation, while the WTI curve has stayed in contango. One of the
components of the returns in total‐return commodity index investments is the roll yield, which is generated by
the rolling of expiring nearby futures into the first‐deferred contracts. Depending on whether the forward
curve is in contango (when longer‐dated futures prices are higher than nearby contracts) or, in backwardation
(when nearby prices are higher than longer‐dated futures prices), the roll yield is either negative (in contango)
or positive (in backwardation). All other things equal, and assuming flexibility to switch positions across Brent
and WTI, investment by commodity index traders in Brent contracts relative to WTI futures contracts should be
expected to have increased since December due to a more positive roll yield in Brent. This shift should also be
reinforced by the increase in the share of Brent and decline in the share of WTI crude oil in commodity indices.
However, empirical evidence on the role of commodity index traders on prices is mixed; therefore further
study is needed to assess the role of index funds on widening the spread.
At the same time, many market observers disagree with the notion that massive WTI‐Brent spread necessarily
imply a violation of the arbitrage principle. In the first place, those commentators argue that Brent and WTI,
-25
-20
-15
-10
-5
0
5
Jun 10 Sep 10 Dec 10 Mar 11 Jun 11
$/bbl WTI vs Dated Brent Differential
Data source: Platts analysis
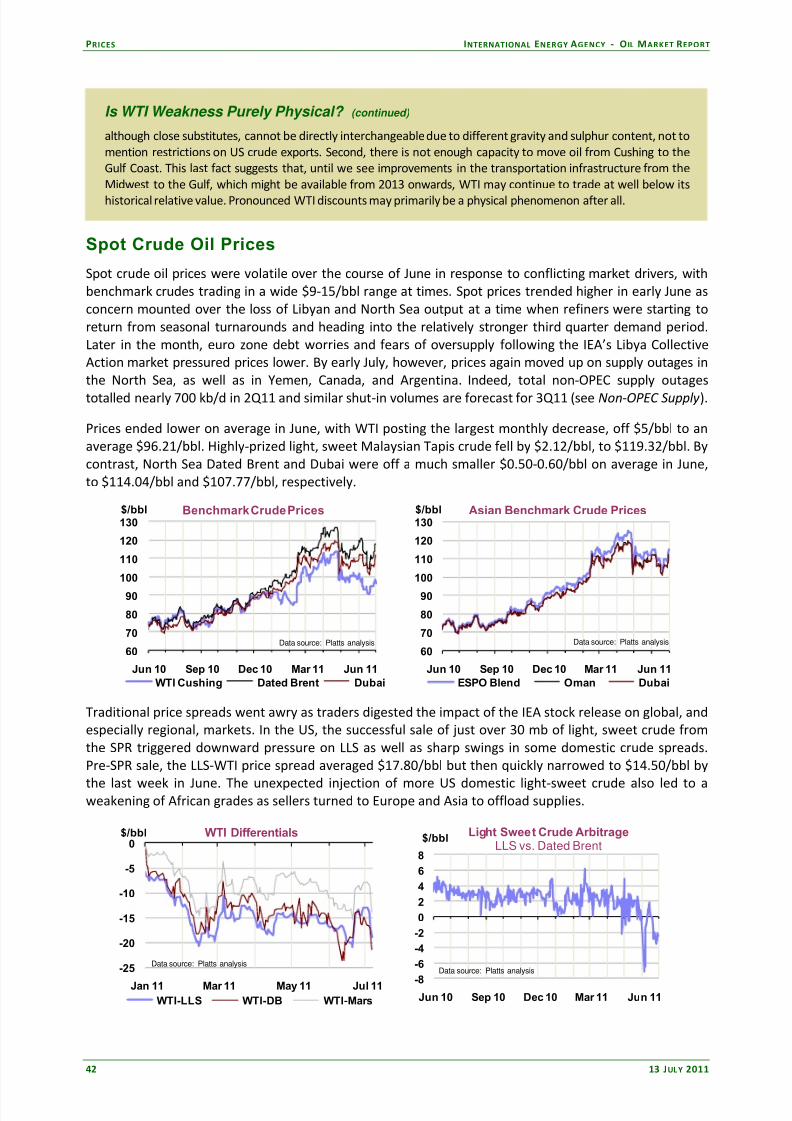
8/6/2019 IEA - Montly Oil Market Report - July 2011
http://slidepdf.com/reader/full/iea-montly-oil-market-report-july-2011 42/69
PRICES INTERNATIONAL ENERGY AGENCY ‐ O IL MARKET REPORT
42 13 JULY 2011
Is WTI Weakness Purely Physical? (continued)
although close substitutes, cannot be directly interchangeable due to different gravity and sulphur content, not to
mention restrictions on US crude exports. Second, there is not enough capacity to move oil from Cushing to the
Gulf Coast. This last fact suggests that, until we see improvements in the transportation infrastructure from the
Midwest to the Gulf, which might be available from 2013 onwards, WTI may continue to trade at well below its
historical relative value. Pronounced WTI discounts may primarily be a physical phenomenon after all.
Spot Crude Oil Prices
Spot crude oil prices were volatile over the course of June in response to conflicting market drivers, with
benchmark crudes trading in a wide $9‐15/bbl range at times. Spot prices trended higher in early June as
concern mounted over the loss of Libyan and North Sea output at a time when refiners were starting to
return from seasonal turnarounds and heading into the relatively stronger third quarter demand period.
Later in the month, euro zone debt worries and fears of oversupply following the IEA’s Libya Collective
Action market pressured prices lower. By early July, however, prices again moved up on supply outages in
the North Sea, as well as in Yemen, Canada, and Argentina. Indeed, total non‐OPEC supply outages
totalled nearly 700 kb/d in 2Q11 and similar shut‐in volumes are forecast for 3Q11 (see Non‐OPEC Supply ).
Prices ended lower on average in June, with WTI posting the largest monthly decrease, off $5/bbl to an
average $96.21/bbl. Highly‐prized light, sweet Malaysian Tapis crude fell by $2.12/bbl, to $119.32/bbl. By
contrast, North Sea Dated Brent and Dubai were off a much smaller $0.50‐0.60/bbl on average in June,
to $114.04/bbl and $107.77/bbl, respectively.
60
70
80
90
100
110
120
130
Jun 10 Sep 10 Dec 10 Mar 11 Jun 11
$/bbl Benchmark Crude Prices
WTI Cushing Dated Brent Dubai
Data source: Platts analysis
60
70
80
90
100
110
120
130
Jun 10 Sep 10 Dec 10 Mar 11 Jun 11
$/bbl Asian Benchmark Crude Prices
ESPO Blend Oman Dubai
Data source: Platts analysis
Traditional price spreads went awry as traders digested the impact of the IEA stock release on global, and
especially regional, markets. In the US, the successful sale of just over 30 mb of light, sweet crude from
the SPR triggered downward pressure on LLS as well as sharp swings in some domestic crude spreads.
Pre‐SPR sale, the LLS‐WTI price spread averaged $17.80/bbl but then quickly narrowed to $14.50/bbl by
the last week in June. The unexpected injection of more US domestic light‐sweet crude also led to a weakening of African grades as sellers turned to Europe and Asia to offload supplies.
-25
-20
-15
-10
-5
0
Jan 11 Mar 11 May 11 Jul 11
$/bbl WTI Differentials
WTI-LLS WTI-DB WTI-Mars
Data source: Platts analysis
-8
-6
-4
-2
0
2
4
6
8
Jun 10 Sep 10 Dec 10 Mar 11 Jun 11
$/bblLight Sweet Crude Arbitrage
LLS vs. Dated Brent
Data source: Platts analysis

8/6/2019 IEA - Montly Oil Market Report - July 2011
http://slidepdf.com/reader/full/iea-montly-oil-market-report-july-2011 43/69
INTERNATIONAL ENERGY AGENCY ‐ O IL MARKET REPORT PRICES
13 JULY 2011 43
Moreover, pricier Dated Brent crude initially led to a record widening of its premium over WTI, to
$23.71/bbl on 13 June, but post‐SPR sale the spread narrowed again to around $15/bbl. However,
renewed concern about lower North Sea output saw the spread widen once more on 8 July to $21.50/bbl
( see ‘Is WTI Weakness Purely Physical?’).
With the US awash with light, sweet crude—or soon to be so in July and August following the SPR sale—African grades are now moving to Europe instead. US buying interest in relatively more expensive light
crudes was already curtailed in June as more sophisticated refineries capable of running sour, heavier
grades came back online.
Adding further complexity, despite inflated prices for Brent, prices for competing European and African
crudes weakened, which also helped narrow the sweet‐sour spread. The influx of competing grades also
added downward pressure on Azeri crude— hitherto a preferred replacement for lost Libyan grades. A
smaller Russian export programme for July, however, helped narrow price differentials to Brent in
the Mediterranean.
-4-202468
101214
Jun 10 Sep 10 Dec 10 Mar 11 Jun 11
$/bbl Brent vs. Dubai
EFS & Physical
ICE Brent M1 - Dubai Swaps M1
Dated Brent - Dubai Mth1
Data source: Platts analysis
0
2
4
6
8
10
12
14
16
Jun 10 Sep 10 Dec 10 Mar 11 Jun 11
$/bbl Sweet-Sour Differentials
Bonny Light - Urals Me d Tapis - Dubai
Data source: Platts analysis
The Brent/Dubai spread, a barometer of the premium for light sweet grades over heavy sour supplies
and a benchmark for moving Atlantic basin crudes eastward, widened on average in June, to ‐$6.27/bbl
compared with ‐$6.18/bbl in May. However, this masked the overall narrowing trend after the stock
release. The Brent/Dubai spread reached a monthly high of ‐$9.27/bbl on June 14 and then plummeted
to a low of ‐$1.60/bbl on 23 June . By end June, the spread was running at ‐$4‐5/bbl but widened again
to over ‐$7/bbl in early July on expectations of increased Mideast supplies.
Spot Crude Oil Prices and Differentials
Table Unavailable
Available in the subscription version.
To subscribe, visit: http://www.iea.org/w/omrss/default.aspx
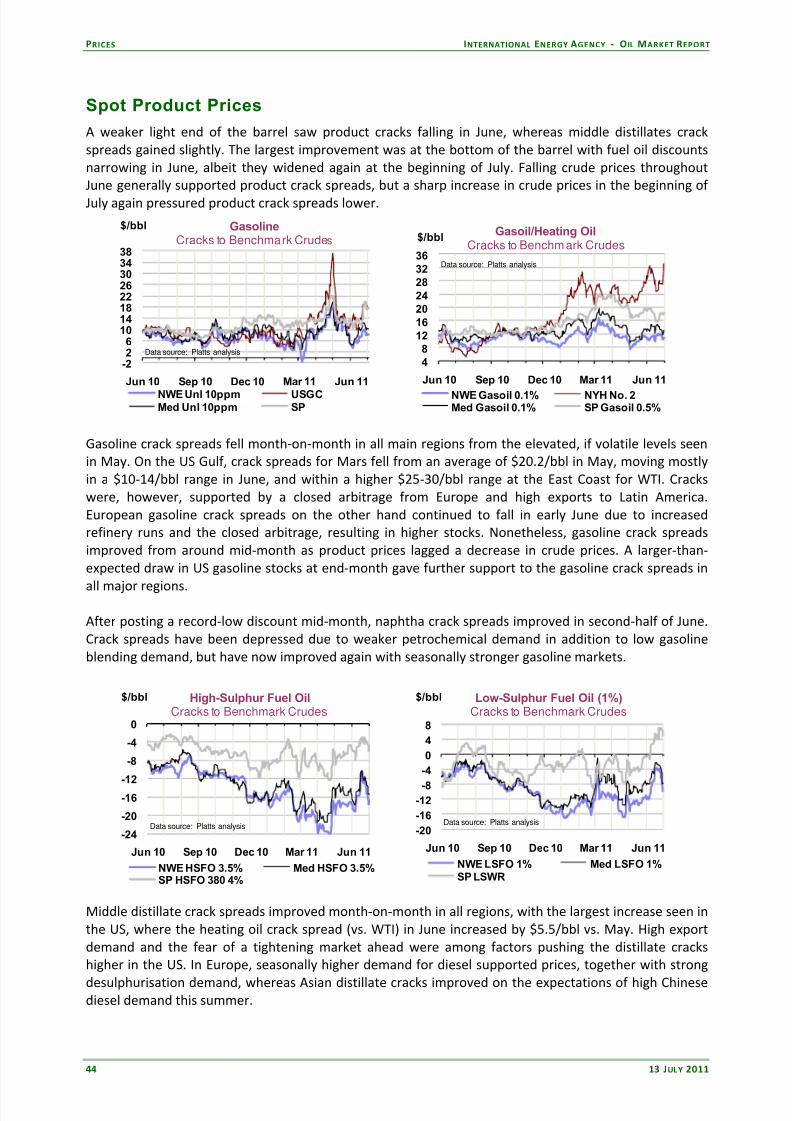
8/6/2019 IEA - Montly Oil Market Report - July 2011
http://slidepdf.com/reader/full/iea-montly-oil-market-report-july-2011 44/69
PRICES INTERNATIONAL ENERGY AGENCY ‐ O IL MARKET REPORT
44 13 JULY 2011
Spot Product Prices
A weaker light end of the barrel saw product cracks falling in June, whereas middle distillates crack
spreads gained slightly. The largest improvement was at the bottom of the barrel with fuel oil discounts
narrowing in June, albeit they widened again at the beginning of July. Falling crude prices throughout
June generally supported product crack spreads, but a sharp increase in crude prices in the beginning of
July again pressured product crack spreads lower.
-226
1014182226303438
Jun 10 Sep 10 Dec 10 Mar 11 Jun 11
$/bbl GasolineCracks to Benchmark Crudes
NWE Unl 10ppm USGCMed Unl 10ppm SP
Data source: Platts analysis
48
12162024283236
Jun 10 Sep 10 Dec 10 Mar 11 Jun 11
$/bblGasoil/Heating Oil
Cracks to Benchmark Crudes
NWE Gasoil 0.1% NYH No. 2Med Gasoil 0.1% SP Gasoil 0.5%
Data source: Platts analysis
Gasoline crack spreads fell month‐on‐month in all main regions from the elevated, if volatile levels seen
in May. On the US Gulf, crack spreads for Mars fell from an average of $20.2/bbl in May, moving mostly
in a $10‐14/bbl range in June, and within a higher $25‐30/bbl range at the East Coast for WTI. Cracks
were, however, supported by a closed arbitrage from Europe and high exports to Latin America.
European gasoline crack spreads on the other hand continued to fall in early June due to increased
refinery runs and the closed arbitrage, resulting in higher stocks. Nonetheless, gasoline crack spreads
improved from around mid‐month as product prices lagged a decrease in crude prices. A larger‐than‐
expected draw in US gasoline stocks at end‐month gave further support to the gasoline crack spreads in
all major regions.
After posting a record‐low discount mid‐month, naphtha crack spreads improved in second‐half of June.
Crack spreads have been depressed due to weaker petrochemical demand in addition to low gasoline
blending demand, but have now improved again with seasonally stronger gasoline markets.
-24
-20
-16
-12
-8
-4
0
Jun 10 Sep 10 Dec 10 Mar 11 Jun 11
$/bbl High-Sulphur Fuel OilCracks to Benchmark Crudes
NWE HSFO 3.5% Med HSFO 3.5%SP HSFO 380 4%
Data source: Platts analysis
-20
-16
-12-8
-4
0
4
8
Jun 10 Sep 10 Dec 10 Mar 11 Jun 11
$/bbl Low-Sulphur Fuel Oil (1%)Cracks to Benchmark Crudes
NWE LSFO 1% Med LSFO 1%SP LSWR
Data source: Platts analysis
Middle distillate crack spreads improved month‐on‐month in all regions, with the largest increase seen in
the US, where the heating oil crack spread (vs. WTI) in June increased by $5.5/bbl vs. May. High export
demand and the fear of a tightening market ahead were among factors pushing the distillate cracks
higher in the US. In Europe, seasonally higher demand for diesel supported prices, together with strong
desulphurisation demand, whereas Asian distillate cracks improved on the expectations of high Chinese
diesel demand this summer.

8/6/2019 IEA - Montly Oil Market Report - July 2011
http://slidepdf.com/reader/full/iea-montly-oil-market-report-july-2011 45/69
INTERNATIONAL ENERGY AGENCY ‐ O IL MARKET REPORT PRICES
13 JULY 2011 45
Low‐sulphur fuel oil crack spreads saw large improvements month‐on‐month in all regions, supported by
high Asian demand. The Singapore LSWR (vs. Dubai) spread was pushed into positive territory in June,
averaging $1.2/bbl vs. a discount of $4.2/bbl in May. Also high‐sulphur fuel oil crack spreads improved,
but the gains were more muted than for low‐sulphur fuel oils as refineries have been running more
heavy and sour crudes lately.
Refining Margins
Refining margins declined month‐on‐month in June in all regions except China and simple refineries in
Singapore. Weak middle distillates crack spreads and high fuel oil discounts in the beginning of the
month weighed on margins, together with weak gasoline crack spreads in Europe.
-12-10-8-6-4-20246
Jan Feb Mar Apr May Jun Jul
$/bbl NWE Refining Margins
Brent Cracking Brent H'skimmingUrals Cracking Urals H'skimming
-10
-5
0
5
10
15
Jan Feb Mar Apr May Jun Jul
$/bbl USGC Margins
Maya Coking LLS Cracking
Mars Coking Mars CrackingBrent Cracking
Spot Product Prices
Table Unavailable
Available in the subscription version.
To subscribe, visit: http://www.iea.org/w/omrss/default.aspx

8/6/2019 IEA - Montly Oil Market Report - July 2011
http://slidepdf.com/reader/full/iea-montly-oil-market-report-july-2011 46/69
PRICES INTERNATIONAL ENERGY AGENCY ‐ O IL MARKET REPORT
46 13 JULY 2011
Although margins were weaker month‐on‐month, in general they strengthened towards month‐end as
most product cracks improved on higher demand and somewhat lower stock levels, in particular for
gasoline. Moving into July, margins fell again as product prices lagged behind an increase in crude prices.
Refining margins in Europe were still at depressed levels and fell further month‐on–month in June, but
trended upwards in the second half of the month. Urals hydroskimming margins were unchanged
month‐on‐month as the fuel oil discount narrowed but the average calculated loss was still above $5/bbl. In the Mediterranean, notional Es Sider hydroskimming margins showed a small improvement as the
market now looks less tight for light, sweet crudes as well as the narrowing discounts for fuel oils.
Selected Refining Margins in Major Refining Centres($/bbl)
Monthly Average Change Average for week ending:
Apr 11 May 11 Jun 11 Jun 11-May 11 10 Jun 17 Jun 24 Jun 01 Jul 08 Jul
NW Europe Brent (Cracking) -0.13 1.23 -0.28 -1.51 -1.04 -1.42 0.02 1.38 0.29
Urals (Cracking) 2.96 3.06 1.40 -1.66 0.93 0.70 1.78 2.27 0.64
Brent (Hydroskimming) -3.94 -3.21 -3.39 -0.18 -4.44 -4.53 -2.76 -1.26 -2.90
Urals (Hydroskimming) -5.39 -5.21 -5.21 0.00 -6.02 -5.97 -4.40 -3.73 -6.24
Mediterranean Es Sider (Cracking) 2.01 2.25 0.75 -1.50 -0.23 -0.32 1.21 2.63 1.36
Urals (Cracking) 0.21 1.55 -0.32 -1.87 -1.33 -1.50 0.23 1.46 0.22
Es Sider (Hydroskimming) -3.56 -4.32 -3.67 0.65 -4.81 -4.62 -2.84 -1.52 -3.54
Urals (Hydroskimming) -8.80 -7.01 -7.37 -0.36 -8.36 -8.60 -6.64 -5.45 -7.31
US Gulf Coast Bonny (Cracking) -1.96 0.04 -1.90 -1.95 -1.90 -3.14 -2.31 0.19 0.92
Brent (Cracking) -4.14 -1.68 -4.04 -2.36 -4.69 -5.66 -3.96 -1.36 -2.00
LLS (Cracking) 0.19 2.77 2.67 -0.10 1.98 4.52 0.51 5.68 6.70
Mars (Cracking) 0.08 3.27 2.25 -1.01 0.98 3.19 1.05 5.48 6.05
Mars (Coking) 4.35 7.32 4.67 -2.64 3.46 6.07 3.31 7.52 8.81
Maya (Coking) 6.95 7.89 5.32 -2.58 4.82 6.94 4.92 5.41 7.17
US West Coast ANS (Cracking) 0.58 -1.62 -3.07 -1.44 -2.63 -0.92 -6.00 -2.39 -1.69
Kern (Cracking) 0.66 1.19 4.00 2.81 2.61 4.78 4.50 6.55 6.93Oman (Cracking) 4.05 1.68 -0.79 -2.48 -1.05 -1.60 -1.66 1.48 2.23
Kern (Coking) 14.15 11.59 11.05 -0.55 9.86 12.58 10.83 12.56 12.93
Singapore Dubai (Hydroskimming) -2.12 -1.96 -1.82 0.14 -1.62 -2.22 -1.79 -1.54 -0.94
Tapis (Hydroskimming) -10.65 -10.20 -9.24 0.97 -10.66 -10.83 -7.94 -6.17 -6.12
Dubai (Hydrocracking) 2.36 2.03 0.96 -1.07 1.41 0.87 0.79 0.81 2.20
Tapis (Hydrocracking) -8.38 -7.81 -8.24 -0.43 -9.23 -9.61 -7.37 -5.91 -5.66
China Cabinda (Hydroskimming) -6.57 -6.98 -5.38 1.60 -7.10 -6.85 -2.99 -2.71 -2.98
Daqing (Hydroskimming) -6.45 -7.43 -2.34 5.09 -3.86 -3.98 -0.37 0.95 -1.39
Dubai (Hydroskimming) -2.38 -2.24 -2.08 0.16 -1.90 -2.49 -2.06 -1.72 -1.09
Daqing (Hydrocracking) -2.39 -2.57 0.09 2.66 -0.89 -1.45 1.63 2.59 0.84
Dubai (Hydrocracking) 2.16 1.82 0.78 -1.04 1.19 0.67 0.61 0.75 2.20
Sources: IEA, Purvin & Gertz Inc.
For the purposes of this report, refining margins are calculated for various complexity configurations, each optimised for processing the specific crude in a specific refining centre on a 'full-
cost' basis. Consequentl y, reported margins should be taken as an indication, or proxy, of changes in profitability for a given refining centre. No attempt is made to model or otherwise
comment upon the relative economics of specific refineries running individual crude slates and producing custom product sales, nor are these calculations intended to infer the marginal
values of crudes for pricing purposes.
*The China refinery margin calculation represents a model based on spot product import/export parity, and does not reflect internal pricing regulations.
US Gulf refining margins all fell in June, losing $1.00‐2.60/bbl compared with May, with the exception of
LLS cracking margins, which were unchanged month‐on‐month after crude economics improved on the
narrowing premiums for light sweet crudes in the second half of the month. The main reason for the fall
was weaker gasoline product cracks in June compared with the very high gasoline prices seen in early
May. Also on the US West Coast, refining margins fell on average in June. Kern cracking margins
improved, however, as the high fuel oil yields from this crude helped increase refined value.
In Asia, refining margins at simple refineries improved slightly on average in June, whereas margins at more complex units weakened. Narrowing fuel oil discounts supported the hydroskimming margins,

8/6/2019 IEA - Montly Oil Market Report - July 2011
http://slidepdf.com/reader/full/iea-montly-oil-market-report-july-2011 47/69
INTERNATIONAL ENERGY AGENCY ‐ O IL MARKET REPORT PRICES
13 JULY 2011 47
together with a lower premium for Tapis towards the end of the month. Weaker gasoline crack spreads
in June compared with May are among the factors behind the decrease in hydrocracking margins. In
China, calculated refining margins mostly improved in June supported by a strong LSWR price.
End-User Product Prices in June
End‐user prices in selected IEA countries declined in May and June, after rising the previous five months.
In part, retail prices were affected by relatively lower crude oil prices, but also by a more ‘stable’ US
dollar during 2Q11. May and June saw a reversal in the depreciation of the US dollar compared to
previous months. This helps explain the change of trend in end‐user prices, in US dollars ex‐tax, during
the period.
Domestic Currencies vs USD
(Index base June 2010)
80
85
90
95
100
105
Jun-10 Sep-10 Dec-10 Mar-11 Jun-11
Euro GBP Yen CAN
End-User Product PricesMonthly Changes in USD, ex-tax
1.62%-3.86% -1.69% -0.88%-8.0%
-5.0%
-2.0%
1.0%
4.0%
Gasoline Diesel Heat.Oil LSFO
F rance Germany Italy
Spain Japan C anada
United Sta tes United Kingdo m A verage
Gasoline prices fell by 1.1% in May and by 3.9% in June, nonetheless they are now 39% above year ago
levels. Diesel prices decreased by 2.7% and 1.7% in May and June, respectively, while the annual
increase is a hefty 41.3%. With respect to the remaining surveyed products, heating oil contracted by
0.9% and low‐sulphur fuel oil (LSFO) increased by 1.6% in June. On a yearly basis, heating oil rose by
41.2%
and
LSFO
by
50%.
The strongest decline in gasoline and diesel prices occurred in the US, down by 7.2% and 3.9%,
respectively. The Euro‐zone also saw diminishing prices for gasoline especially in Germany (4.9%) and
France (3.4%), while diesel had a sizable decrease only in Italy (1.5%). Heating oil end‐user prices fell in
all surveyed countries, but plummeted in Canada by 3.8% in June. LSFO prices saw mixed movements
across countries, gaining value in France (2.5%) and Germany (3.4%), but falling in Spain (1.1%) and
Japan (2.10%).
Freight
Benchmark crude tanker rates remained depressed throughout June due to soft fundamentals and
despite signs of rising OPEC supply. The Middle East Gulf – Japan VLCC rate has remained at close to, or
below, break‐even levels for much of the past three months due to a combination of relatively high
bunker fuel prices, sluggish demand and swelling tonnage. Some upward momentum was generated in
June on the back of increased demand, although the swollen fleet easily absorbed this and consequently
rates soon fell back down to below their early‐month levels by month‐end. Rates on the North Sea –
Northwest Europe Aframax route have remained stagnant since early‐May, hovering close to $6/mt.
With the upward momentum from May’s firming dissipating, rates on the Suezmax West Africa – US
Atlantic coast voyage languished below $12/mt for much of June on low enquiries and plentiful vessel
availability. Reports suggest that most owners are trying to buttress rates above break‐even levels by
slow steaming, which has the benefit of reducing bunker fuel consumption and tying up vessels for
longer. Unless there is an uptick in tanker demand in 2H11 this trend is likely to continue.
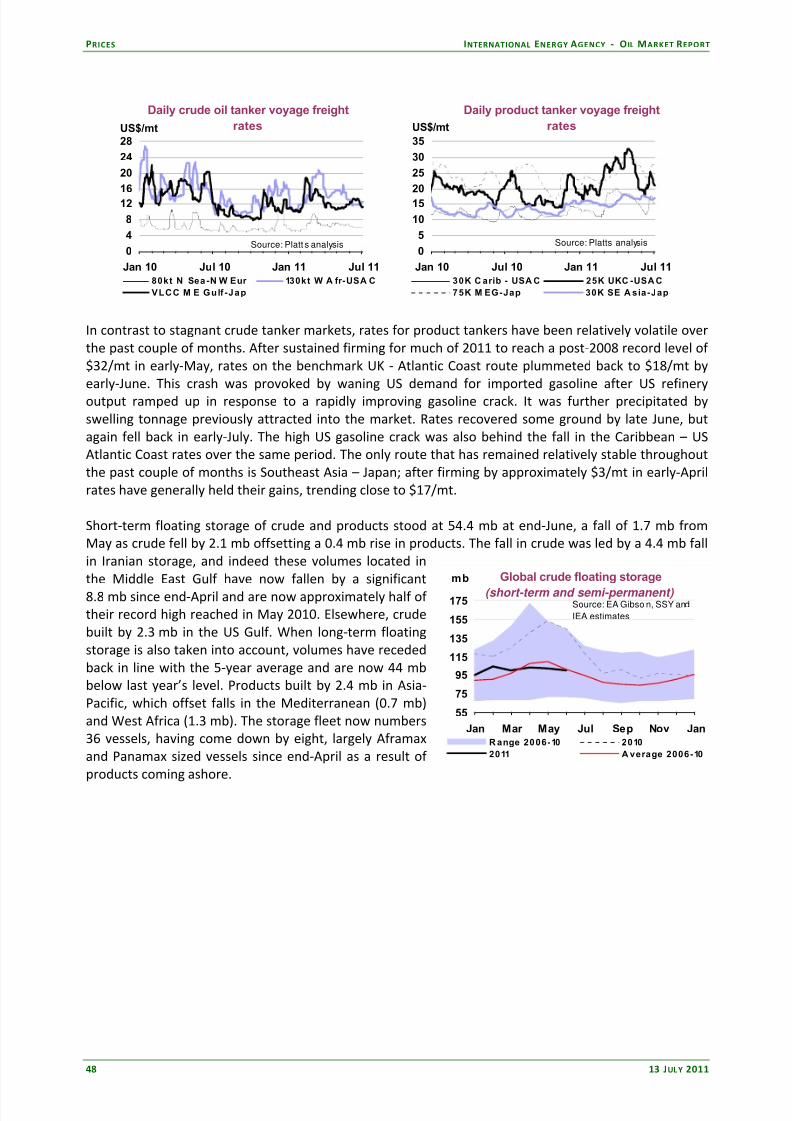
8/6/2019 IEA - Montly Oil Market Report - July 2011
http://slidepdf.com/reader/full/iea-montly-oil-market-report-july-2011 48/69
PRICES INTERNATIONAL ENERGY AGENCY ‐ O IL MARKET REPORT
48 13 JULY 2011
Daily crude oil tanker voyage freight
rates
0
4
8
12
16
20
24
28
Jan 10 Jul 10 Jan 11 Jul 11
US$/mt
80kt N Sea-N W Eur 130kt W A fr-USA C
VLCC M E Gulf -Jap
Source: Platt s analysis
Daily product tanker voyage freight
rates
0
5
10
15
20
25
30
35
Jan 10 Jul 10 Jan 11 Jul 11
US$/mt
30K C arib - USA C 25K UKC -USA C
75K M EG-Jap 30K SE A sia-Jap
Source: Platts analysis
In contrast to stagnant crude tanker markets, rates for product tankers have been relatively volatile over
the past couple of months. After sustained firming for much of 2011 to reach a post‐2008 record level of
$32/mt in early‐May, rates on the benchmark UK ‐ Atlantic Coast route plummeted back to $18/mt by
early‐June. This crash was provoked by waning US demand for imported gasoline after US refinery
output ramped up in response to a rapidly improving gasoline crack. It was further precipitated by
swelling tonnage previously attracted into the market. Rates recovered some ground by late June, but
again fell back in early‐July. The high US gasoline crack was also behind the fall in the Caribbean – US
Atlantic Coast rates over the same period. The only route that has remained relatively stable throughout
the past couple of months is Southeast Asia – Japan; after firming by approximately $3/mt in early‐April
rates have generally held their gains, trending close to $17/mt.
Short‐term floating storage of crude and products stood at 54.4 mb at end‐June, a fall of 1.7 mb from
May as crude fell by 2.1 mb offsetting a 0.4 mb rise in products. The fall in crude was led by a 4.4 mb fall
in Iranian storage, and indeed these volumes located in
the Middle East Gulf have now fallen by a significant
8.8 mb since end‐April and are now approximately half of
their record high reached in May 2010. Elsewhere, crude
built by 2.3 mb in the US Gulf. When long‐term floating
storage is also taken into account, volumes have receded
back in line with the 5‐year average and are now 44 mb
below last year’s level. Products built by 2.4 mb in Asia‐
Pacific, which offset falls in the Mediterranean (0.7 mb)
and West Africa (1.3 mb). The storage fleet now numbers
36 vessels, having come down by eight, largely Aframax
and Panamax sized vessels since end‐April as a result of
products coming ashore.
Global crude floating storage
(short-term and semi-permanent)
55
75
95
115
135
155
175
Jan Mar May Jul Sep Nov Jan
mb
R ange 2006-10 2010
2011 A verage 2006-10
Source: EA Gibso n, SSY and
IEA estimates

8/6/2019 IEA - Montly Oil Market Report - July 2011
http://slidepdf.com/reader/full/iea-montly-oil-market-report-july-2011 49/69
INTERNATIONAL ENERGY AGENCY ‐ O IL MARKET REPORT REFINING
13 JULY 2011 49
REFINING
Summary
• Global refinery throughputs are forecast to increase by 2.3 mb/d from 2Q11 to 3Q11, to reach
75.9 mb/d to meet seasonally higher oil product demand. Refinery maintenance falls sharply from
May onwards, and slightly better margins evident in recent weeks could support runs further. Annual
growth in throughput has, however, slowed in line with demand patterns, from 2.2 mb/d on average
in the previous four quarters to ‐50 kb/d in 2Q11 and 480 kb/d in 3Q11.
• 2Q11 global refinery runs are estimated to have averaged 73.6 mb/d, down 945 kb/d from 1Q11 and
slipping below year‐ago levels on a quarterly basis for the first time since 4Q09. The loss of Libyan
crude supplies and refining capacity as well as lower runs in Japan due to earthquake damage
amplified normal seasonal maintenance shutdowns. Poor margins further cut runs in some regions.
• OECD crude runs increased marginally in May, to 35.28 mb/d, from 35.21 mb/d in April, the season’s
low point. Improved utilisation rates in Europe and slightly stronger North American throughputs
were mostly offset by lower Pacific runs, as refiners there extended maintenance shutdowns. OECD
runs are estimated sharply higher from June onwards, reaching a high of 37.5 mb/d in August, as both
US and Japanese refiners complete scheduled turnarounds, while European runs are seen climbing on
seasonally stronger demand and slightly improved economics.
• OECD refinery yields increased for gasoline and ‘other products’, and fell for all other product
categories in April. OECD gasoline yields increased 0.36 percentage points (pp) mostly due to a higher
share in Europe. Yields are, however, still below the five‐year range. OECD gasoil/diesel yields have
been trending downward so far this year, and fell further by 0.6 pp in April. Declines in both OECD
North America and Europe offset an increase in the Pacific.
71
72
73
74
75
76
77
Jan Mar May Jul Sep Nov Jan
mb/dGlobal RefiningCrude Throughput
Range 06-10 Average 06-10
2010 2011
0.0
2.0
4.0
6.0
8.0
Sep-10 Dec-10 Mar-11 Jun-11 Sep-11
mb/d Firm Global Refinery Shutdowns
OECD NAM OECD Europe
OECD Pacific ROWEst. 'yet-to-be reported' World Y-1
Global Refinery Overview
Global refinery crude throughput estimates for 2Q11 are unchanged overall from last month’s report, at
73.6 mb/d. Lower submissions by OECD Europe for April and May were offset by higher‐than‐expected
runs in the OECD Pacific and several non‐OECD countries. The exceptionally weak 2Q11 levels, which
were almost 1 mb/d lower than 1Q11, and below year‐earlier levels for the first time since 4Q09,
resulted from a variety of factors. In addition to the traditional 2Q seasonal peak in refinery maintenance
and lull in oil product demand, the earthquake that hit Japan in March of this year and the Libya crisis
significantly affected global refinery operations. While Japanese crude throughputs surprised to the
upside in June, recovering to last year’s level earlier than expected, two refineries remain closed due to
damage sustained in the disaster. The Libyan crisis not only cut off crude supplies to regular customers in
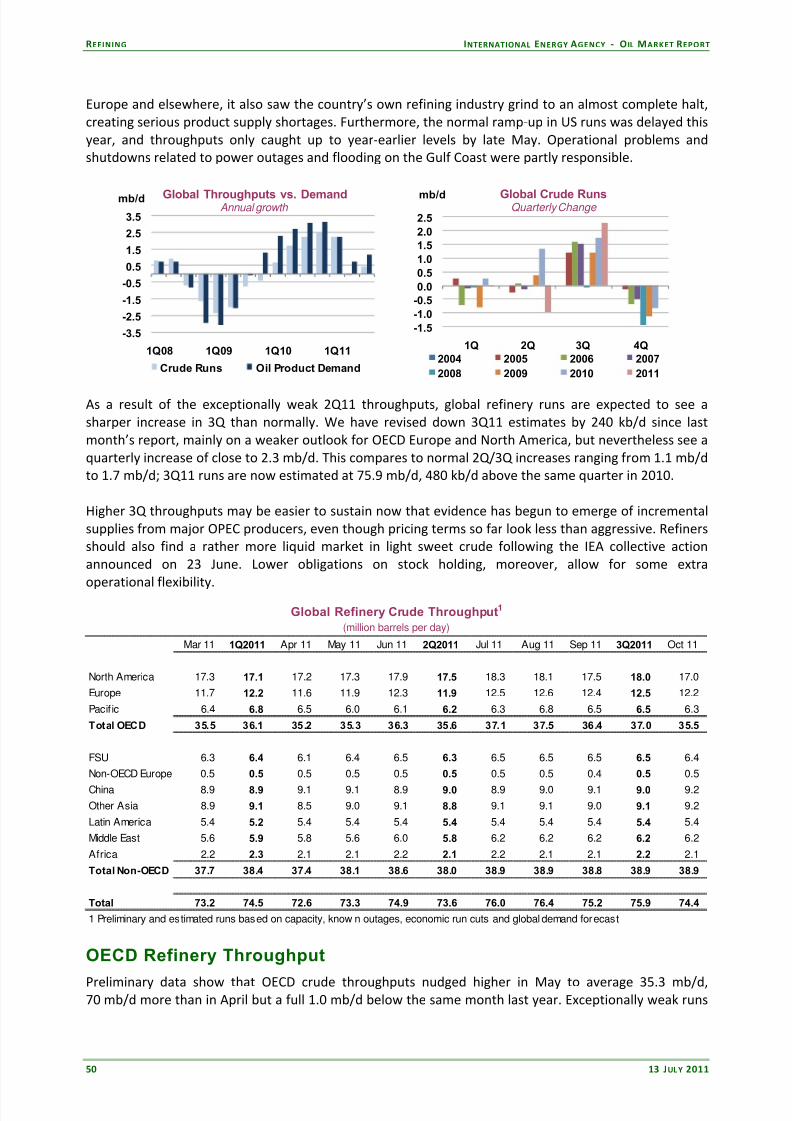
8/6/2019 IEA - Montly Oil Market Report - July 2011
http://slidepdf.com/reader/full/iea-montly-oil-market-report-july-2011 50/69
REFINING INTERNATIONAL ENERGY AGENCY ‐ O IL MARKET REPORT
50 13 JULY 2011
Europe and elsewhere, it also saw the country’s own refining industry grind to an almost complete halt,
creating serious product supply shortages. Furthermore, the normal ramp‐up in US runs was delayed this
year, and throughputs only caught up to year‐earlier levels by late May. Operational problems and
shutdowns related to power outages and flooding on the Gulf Coast were partly responsible.
-3.5
-2.5
-1.5
-0.5
0.5
1.5
2.5
3.5
1Q08 1Q09 1Q10 1Q11
mb/d Global Throughputs vs. DemandAnnual growth
Crude Runs Oil Product Demand
-1.5
-1.0
-0.5
0.0
0.5
1.0
1.5
2.0
2.5
1Q 2Q 3Q 4Q
mb/d Global Crude RunsQuarterly Change
2004 2005 2006 2007
2008 2009 2010 2011
As a result of the exceptionally weak 2Q11 throughputs, global refinery runs are expected to see a
sharper increase in 3Q than normally. We have revised down 3Q11 estimates by 240 kb/d since last
month’s report, mainly on a weaker outlook for OECD Europe and North America, but nevertheless see a
quarterly increase of close to 2.3 mb/d. This compares to normal 2Q/3Q increases ranging from 1.1 mb/d
to 1.7 mb/d; 3Q11 runs are now estimated at 75.9 mb/d, 480 kb/d above the same quarter in 2010.
Higher 3Q throughputs may be easier to sustain now that evidence has begun to emerge of incremental
supplies from major OPEC producers, even though pricing terms so far look less than aggressive. Refiners
should also find a rather more liquid market in light sweet crude following the IEA collective action
announced on 23 June. Lower obligations on stock holding, moreover, allow for some extra
operational flexibility.
Global Refinery Crude Throughput1
(million barrels per day)
Mar 11 1Q2011 Apr 11 May 11 Jun 11 2Q2011 Jul 11 Aug 11 Sep 11 3Q2011 Oct 11
North America 17.3 17.1 17.2 17.3 17.9 17.5 18.3 18.1 17.5 18.0 17.0
Europe 11.7 12.2 11.6 11.9 12.3 11.9 12.5 12.6 12.4 12.5 12.2
Pacif ic 6.4 6.8 6.5 6.0 6.1 6.2 6.3 6.8 6.5 6.5 6.3
Total OECD 35.5 36.1 35.2 35.3 36.3 35.6 37.1 37.5 36.4 37.0 35.5
FSU 6.3 6.4 6.1 6.4 6.5 6.3 6.5 6.5 6.5 6.5 6.4
Non-OECD Europe 0.5 0.5 0.5 0.5 0.5 0.5 0.5 0.5 0.4 0.5 0.5
China 8.9 8.9 9.1 9.1 8.9 9.0 8.9 9.0 9.1 9.0 9.2
Other Asia 8.9 9.1 8.5 9.0 9.1 8.8 9.1 9.1 9.0 9.1 9.2
Latin America 5.4 5.2 5.4 5.4 5.4 5.4 5.4 5.4 5.4 5.4 5.4
Middle East 5.6 5.9 5.8 5.6 6.0 5.8 6.2 6.2 6.2 6.2 6.2
Africa 2.2 2.3 2.1 2.1 2.2 2.1 2.2 2.1 2.1 2.2 2.1
Total Non-OECD 37.7 38.4 37.4 38.1 38.6 38.0 38.9 38.9 38.8 38.9 38.9
Total 73.2 74.5 72.6 73.3 74.9 73.6 76.0 76.4 75.2 75.9 74.4
1 Preliminary and estimated runs based on capacity, know n outages, economic run cuts and global demand forecast
OECD Refinery Throughput
Preliminary data show that OECD crude throughputs nudged higher in May to average 35.3 mb/d,
70 mb/d more than in April but a full 1.0 mb/d below the same month last year. Exceptionally weak runs
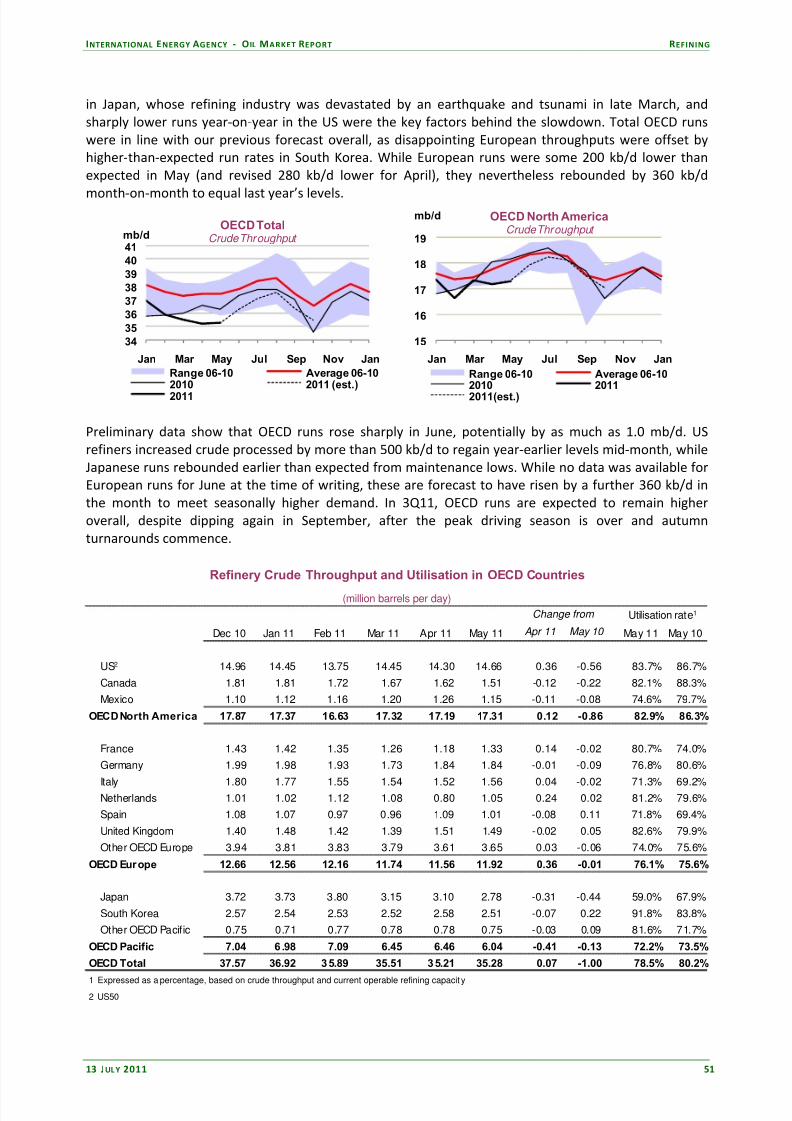
8/6/2019 IEA - Montly Oil Market Report - July 2011
http://slidepdf.com/reader/full/iea-montly-oil-market-report-july-2011 51/69
INTERNATIONAL ENERGY AGENCY ‐ O IL MARKET REPORT REFINING
13 JULY 2011 51
in Japan, whose refining industry was devastated by an earthquake and tsunami in late March, and
sharply lower runs year‐on‐year in the US were the key factors behind the slowdown. Total OECD runs
were in line with our previous forecast overall, as disappointing European throughputs were offset by
higher‐than‐expected run rates in South Korea. While European runs were some 200 kb/d lower than
expected in May (and revised 280 kb/d lower for April), they nevertheless rebounded by 360 kb/d
month‐on‐month to equal last year’s levels.
3435
36373839
4041
Jan Mar May Jul Sep Nov Jan
mb/dOECD Total
Crude Throughput
Range 06-10 Average 06-102010 2011 (est.)2011
15
16
17
18
19
Jan Mar May Jul Sep Nov Jan
mb/d OECD North AmericaCrude Throughput
Range 06-10 Average 06-102010 20112011(est.)
Preliminary data show that OECD runs rose sharply in June, potentially by as much as 1.0 mb/d. US
refiners increased crude processed by more than 500 kb/d to regain year‐earlier levels mid‐month, while
Japanese runs rebounded earlier than expected from maintenance lows. While no data was available for
European runs for June at the time of writing, these are forecast to have risen by a further 360 kb/d in
the month to meet seasonally higher demand. In 3Q11, OECD runs are expected to remain higher
overall, despite dipping again in September, after the peak driving season is over and autumn
turnarounds commence.
Refinery Crude Throughput and Utilisation in OECD Countries
(million barrels per day)
Change from Utilisation rate1
Dec 10 Jan 11 Feb 11 Mar 11 Apr 11 May 11 Apr 11 May 10 May 11 May 10
US2 14.96 14.45 13.75 14.45 14.30 14.66 0.36 -0.56 83.7% 86.7%
Canada 1.81 1.81 1.72 1.67 1.62 1.51 -0.12 -0.22 82.1% 88.3%
Mexico 1.10 1.12 1.16 1.20 1.26 1.15 -0.11 -0.08 74.6% 79.7%
OECD North America 17.87 17.37 16.63 17.32 17.19 17.31 0.12 -0.86 82.9% 86.3%
France 1.43 1.42 1.35 1.26 1.18 1.33 0.14 -0.02 80.7% 74.0%
Germany 1.99 1.98 1.93 1.73 1.84 1.84 -0.01 -0.09 76.8% 80.6%
Italy 1.80 1.77 1.55 1.54 1.52 1.56 0.04 -0.02 71.3% 69.2%Netherlands 1.01 1.02 1.12 1.08 0.80 1.05 0.24 0.02 81.2% 79.6%
Spain 1.08 1.07 0.97 0.96 1.09 1.01 -0.08 0.11 71.8% 69.4%
United Kingdom 1.40 1.48 1.42 1.39 1.51 1.49 -0.02 0.05 82.6% 79.9%
Other OECD Europe 3.94 3.81 3.83 3.79 3.61 3.65 0.03 -0.06 74.0% 75.6%
OECD Europe 12.66 12.56 12.16 11.74 11.56 11.92 0.36 -0.01 76.1% 75.6%
Japan 3.72 3.73 3.80 3.15 3.10 2.78 -0.31 -0.44 59.0% 67.9%
South Korea 2.57 2.54 2.53 2.52 2.58 2.51 -0.07 0.22 91.8% 83.8%
Other OECD Pacific 0.75 0.71 0.77 0.78 0.78 0.75 -0.03 0.09 81.6% 71.7%
OECD Pacific 7.04 6 .98 7.09 6.45 6.46 6.04 -0.41 -0.13 72.2% 73.5%
OECD Total 37.57 36.92 35.89 35.51 35.21 35.28 0.07 -1.00 78.5% 80.2%
1 Expressed as a percentage, based on crude throughput and current operable refining capacit y2 US50

8/6/2019 IEA - Montly Oil Market Report - July 2011
http://slidepdf.com/reader/full/iea-montly-oil-market-report-july-2011 52/69

8/6/2019 IEA - Montly Oil Market Report - July 2011
http://slidepdf.com/reader/full/iea-montly-oil-market-report-july-2011 53/69
INTERNATIONAL ENERGY AGENCY ‐ O IL MARKET REPORT REFINING
13 JULY 2011 53
Repsol’s 220 kb/d Bilbao refinery in Spain halted operations in June due to a strike. The expansion of the
company’s Cartagena refinery to double production capacity to 220 kb/d is scheduled for completion in
4Q2011. The upgrade will also significantly cut Spain’s import needs of diesel and kerosene, as 50% of
the output of the expanded plant will be middle distillates and especially diesel. Company officials have
also stated that after the upgrade the refinery will be able to process up to 76% of cheaper heavy crudes,
up from 4% at present. In the UK, reports were that Total had successfully restarted a 110 kb/d crude unit at its Lindsey refinery in early July. The unit had been closed since June 2010 due to damage
sustained in a fire.
11.4
11.9
12.4
12.9
13.4
13.9
14.4
Jan Mar May Jul Sep Nov Jan
mb/d OECD EuropeCrude Throughput
Range 06-10 Average 06-102010 20112011(est.)
0.0
0.5
1.0
1.5
2.0
Jan Mar May Jul Sep Nov Jan
mb/d OECD EuropeFirm Shutdowns
Range 06-10 2010
2011 reported 2011 forecast
OECD Pacific refinery crude runs have been revised higher for both May and June since last month’s
report, by 200 kb/d and 150 kb/d respectively. In May, preliminary monthly data for South Korea were
again stronger than anticipated, at 2.5 mb/d. Both runs and product exports declined slightly month‐on‐
month in May, by 1.1% and 2.5% respectively, according to data released by state‐run Korea National Oil
Corporation. A partial shutdown of GS Caltex’s heavy oil upgrading units in June reduced diesel output
and led the company to ask for an emergency supply of 870 kb from the government’s strategic stocks.
Caltex was forced to shut a 60 kb/d vacuum residue hydrocracker for an estimated two weeks in June as
well as a 70 kb/d desulphurisation units for a few days, impacting upon diesel supplies at a time of rising
demand (ahead of a planned price increase in July).
5.5
6.0
6.5
7.0
7.5
8.0
Jan Mar May Jul Sep Nov Jan
mb/dOECD Pacific
Crude Throughput
Range 06-10 Average 06-102010 20112011 est.
Japan Weekly Refinery Throughput
2.5
3.0
3.5
4.0
4.5
5.0
Jan Apr Jul Oct
mb/d
Range 2006-10 5-yr Average2010 2011
Source: PAJ, IEA estimates
Weekly data from the Petroleum Association of Japan (PAJ) show that Japanese refinery throughputs
rebounded from seasonal lows earlier than expected and had surpassed 3 mb/d in the week ending
18 June. As a result, June totals were revised up by more than 200 kb/d compared to our previous
expectations. JX Nippon successfully restarted the 190 kb/d crude distillation unit at its 250 kb/d Kashima
refinery on 4 June and the 63 kb/d condensate splitter by mid‐month, despite the continued closure of
the VLCC berth at the refinery. The company was allowed to use 1.9 mb of strategic stocks stored at the
plant, while allocating the same volume of crude stored at its Kire crude import terminal in the south of
the country. JX has announced it plans to operate the plant at 60% utilisation until autumn when it
expects damaged facilities, including the VLCC berth, to be restored. Two refineries, with a combined
capacity of 365 kb/d, remain closed due to damage sustained during the earthquake and tsunami.

8/6/2019 IEA - Montly Oil Market Report - July 2011
http://slidepdf.com/reader/full/iea-montly-oil-market-report-july-2011 54/69

8/6/2019 IEA - Montly Oil Market Report - July 2011
http://slidepdf.com/reader/full/iea-montly-oil-market-report-july-2011 55/69
INTERNATIONAL ENERGY AGENCY ‐ O IL MARKET REPORT REFINING
13 JULY 2011 55
Non-OECD Refinery Throughput
Non‐OECD refinery runs are forecast to rise from 38.0 mb/d in 2Q11 to 38.9 mb/d on average in 3Q11,
mainly on higher Middle Eastern, Other Asian and Russian throughputs. The inclusion of some
consolidated historical data for a number of countries has lowered the 2006‐2009 estimates by 100 kb/d
on average with adjustments partly carried through the forecast. Spring maintenance in main non‐OECD
countries and outages seen in 2Q11, led to a dip in runs from 38.8 mb/d in January to only 37.4 mb/d in
April. The completion of work and the commissioning of some new capacity are expected to take runs
back to 38.9 mb/d in July and August when seasonal summer demand is at its highest.
3334
35
36
37
38
39
40
Jan Mar May Jul Sep Nov Jan
mb/dNon-OECD TotalCrude Throughput
Range 06-10 Average 06-10
2010 2011(est.)
5.56.0
6.5
7.0
7.5
8.0
8.5
9.0
9.5
Jan Mar May Jul Sep Nov Jan
mb/dChina
Crude Throughput
2008 20092010 20112011 (est.)
Chinese refinery runs for May averaged 9.1 mb/d, 55 kb/d higher than our previous forecast.
Throughputs are expected to decline slightly over June and July, as several refineries undertake
maintenance. Refiners cut crude imports in May by some 200 kb/d from April in anticipation of lower run
rates. Crude imports in June fell 5.5% month on month, to 4.8 mb/d. The government abolished import
duties on jet fuel and gasoil and import duties on gasoline were lowered from 5% to 1%, while fuel oil
import duties were cut from 6% to 1% from 1 July on concerns over potential supply shortages in
the summer.
7.0
7.5
8.0
8.5
9.0
9.5
Jan Mar May Jul Sep Nov Jan
mb/dOther Asia
Crude Throughput
Range 06-10 Average 06-10
2010 2011(est.)
2.52.83.03.33.53.84.04.34.5
Jan Mar May Jul Sep Nov Jan
mb/dIndia
Crude Throughput
2007 2008 2009
2010 2011 2011 est.
Indian crude throughputs are estimated to have averaged 4.0 mb/d in May, largely unchanged from April
but some 160 kb/d above a year earlier. The Indian Prime Minister officially opened the 120 kb/d Bina
refinery in May. Although the refinery is not included in May Ministry data, operations should start soon.
The Ministry said in a statement in July that India’s state refiners are now losing 2.4 billion rupees
($54.3 million) a day on sales of diesel, kerosene and cooking gas at regulated prices, less than half the
4.9 billion rupees they were losing daily before prices were raised late June. India’s state refiners are
compensated for some of their losses through cash subsidies or bonds from the government, and
through discounts on their crude purchases from India’s upstream players.

8/6/2019 IEA - Montly Oil Market Report - July 2011
http://slidepdf.com/reader/full/iea-montly-oil-market-report-july-2011 56/69
REFINING INTERNATIONAL ENERGY AGENCY ‐ O IL MARKET REPORT
56 13 JULY 2011
Indonesia’s April throughputs were very weak, at around 600 kb/d, compared to levels of 800 kb/d
normally (and 80 kb/d lower than our estimate). The explosion and fire at the Cilacap refinery on 2 April,
thought to have been operating at 350 kb/d before the blast, forced the plant to shut for some 10 days.
Pakistan reportedly had to boost imports of gasoline in June after three of the country’s five refineries
closed. Attock’s Morgah plant had to shut, as did National Refinery Limited’s Karachi refinery and Byco’s
Balochistan plant. It is not clear how many days the shutdowns lasted. In Vietnam, the country’s sole Dung Quat refinery will remain closed for two months starting in mid‐July, according to the operator.
Vietnam has stopped reporting monthly data to JODI since October 2010.
Middle Eastern crude throughput estimates are largely unchanged from previous reports, despite the
incorporation of some annual data and an upward adjustment to UAE runs, which previously included
only Abu Dhabi crude and some condensates. Regional runs are now seen rising from 5.6 mb/d in May to
6.0 mb/d in June and 6.2 mb/d in July, on higher Saudi Arabian and Kuwaiti runs. The restart of the
400 kb/d PetroRabigh in Saudi Arabia, after a six‐week full shutdown in June is underpinning the sharp
increase in Saudi domestic crude demand, and together with seasonal increases in crude oil direct burn
(see Saudi Arabia’s Power from Crude in the demand section), is absorbing a significant part of recent
Saudi production increases. Kuwait’s 190 kb/d Shuaiba refinery was ramping up production in May, after a month‐long maintenance shutdown. In Yemen, the 130 kb/d Aden refinery restarted on 20 June after
receiving a donation of Arab Light crude from Saudi Arabia. The refinery had to close, as output of
Yemeni Light Marib crude was shuttered after an attack on the main pipeline in March.
5.55.7
5.9
6.1
6.3
6.5
Jan Mar May Jul Sep Nov Jan
mb/dMiddle East
Crude Throughput
Range 06-10 Average 06-10
2010 2011(est.)
1.4
1.5
1.6
1.7
1.8
1.9
2.0
2.1
Jan Mar May Jul Sep Nov Jan
mb/dSaudi Arabia
Crude Throughput
2007 2008 2009
2010 2011 est.
FSU refinery crude runs estimates for 2Q11 and 3Q11 are largely unchanged since last month’s report, at
6.3 mb/d and 6.5 mb/d respectively. Russian crude runs were nevertheless some 170 kb/d higher than
expected in May, at 5.1 mb/d, up from 4.94 mb/d in April and 4.78 mb/d in May last year. Revisions to
historical estimates based on annual data were minimal, taking 2009 estimates only 25 kb/d lower.
5.6
5.8
6.0
6.2
6.4
6.6
Jan Mar May Jul Sep Nov Jan
mb/d FSUCrude Throughput
Range 06-10 Average 06-102010 20112011(est.)
2.0
2.1
2.2
2.3
2.4
2.5
2.6
Jan Mar May Jul Sep Nov Jan
mb/d AfricaCrude Throughput
Range 06-10 Average 06-10
2010 2011 est.
In Africa, regional runs are still low following the near complete shut down of refinery operations in Libya
due to lack of crude or damage to facilities. According to news reports, Libya’s 120 kb/d Azzawiya

8/6/2019 IEA - Montly Oil Market Report - July 2011
http://slidepdf.com/reader/full/iea-montly-oil-market-report-july-2011 57/69
INTERNATIONAL ENERGY AGENCY ‐ O IL MARKET REPORT REFINING
13 JULY 2011 57
refinery near Tripoli had to halt operations in mid‐June as rebels cut off the crude supply pipeline to the
plant. Also the 20 kb/d Tobruk refinery sustained damage and had to halt operations for an estimated
two weeks in June, cutting off gasoline supplies to rebel forces fighting the Gaddafi regime. The country’s
largest refinery in Ras Lanuf has been shut since late February. It looks likely that all of the country’s
refineries are out of operation at the moment. Chad’s first refinery, a Chinese‐funded plant outside of
N’Djamena, started operating in late June. The plant has an initial capacity of 20 kb/d, but could be expanded to 50 or 60 kb/d at a later stage.
OECD Refinery Yields
OECD refinery yields increased for gasoline and other products, and fell for all other product categories
in April. OECD gasoline yields increased by 0.4 percentage points (pp), mostly on account of higher
European gasoline yields. Yields are however still below the five‐year range. In OECD North America,
yields were almost unchanged vs. March, and are now slightly above last year’s level. OECD Pacific yields
increased somewhat as well, and in April stood at the five‐year average. OECD gasoil/diesel yields have
been trending downward so far this year, and fell further by 0.6 pp in April. Declines in both OECD North
America and Europe offset an increase in the Pacific. OECD gross refinery output in April fell by 440 kb/d
compared with March, and was almost 2 mb/d lower than the five‐year average amid exceptionally low
runs in both OECD North America and Europe.
32%
33%
34%
35%
36%
37%
Jan Apr Jul Oct Jan
OECD - GasolineRefinery Yield - Five-year Range
Range 2006-10 5-yr Average2010 2011
28%
29%
30%
31%
32%
Jan Apr Jul Oct Jan
OECD - Gasoil / DieselRefinery Yield - Five-year Range
Range 2006-10 5-yr Average2010 2011
In OECD North America, gasoline yields increased slightly, ramping up for the summer driving season,
whereas gasoil/diesel yields declined by 1.0 pp, partly reflecting weaker product cracks for middle
distillates. Refineries in OECD Europe increased gasoline yields in April at the expense of both naphtha
and gasoil/diesel. Gasoline yields are however low both compared to last year’s level and the five‐year
average, standing 0.3 pp and 0.8 pp below, respectively. Naphtha yields fell in line with seasonal trends.
In the OECD Pacific, gasoil/diesel yields increased by 0.6 pp in April, as demand was strong and a
tightening market pushed product cracks higher.
44%
45%
46%
47%
48%
49%
50%
Jan Apr Jul Oct Jan
OECD N. America - GasolineRefinery Yield - Five-year Range
Range 2006-10 5-yr Average
2010 2011
25%
26%
27%
28%
29%
30%
Jan Apr Jul Oct Jan
OECD Pacific - Gasoil / DieselRefinery Yield - Five-year Range
Range 2006-10 5-yr Average
2010 2011
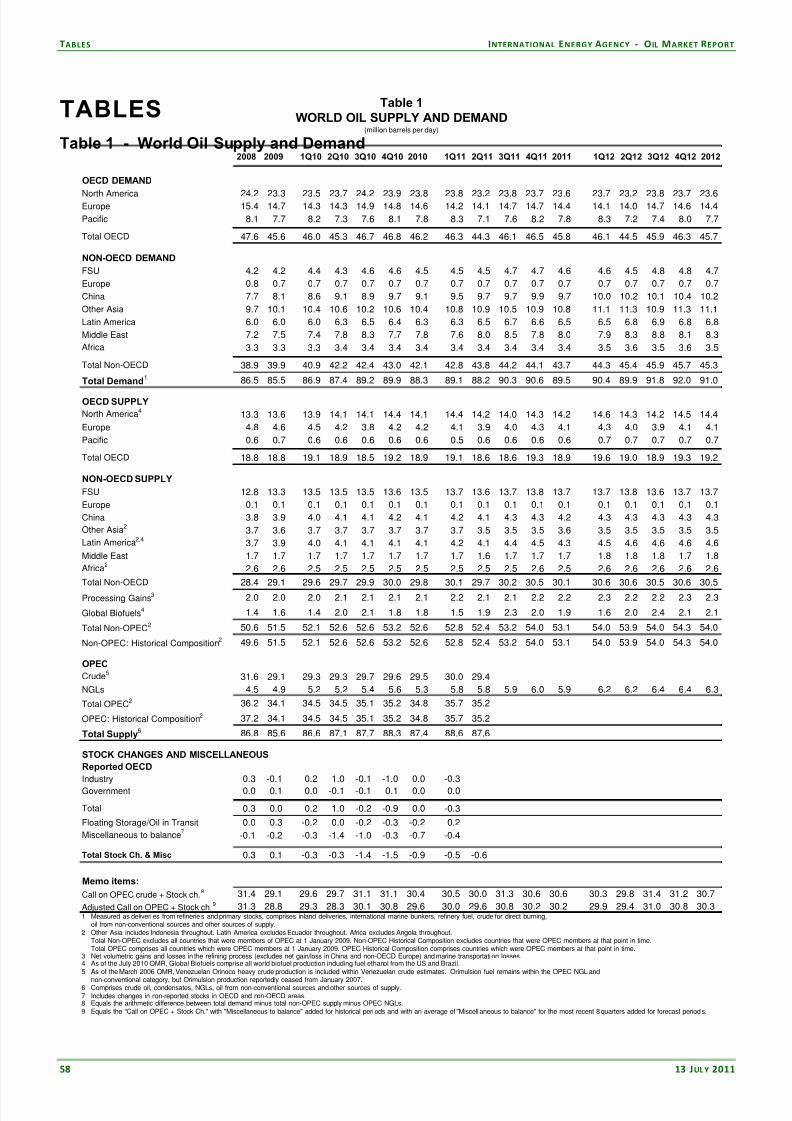
8/6/2019 IEA - Montly Oil Market Report - July 2011
http://slidepdf.com/reader/full/iea-montly-oil-market-report-july-2011 58/69
TABLES INTERNATIONAL ENERGY AGENCY ‐ O IL MARKET REPORT
58 13 JULY 2011
TABLES
Table 1 - World Oil Supply and Demand
Table 1WORLD OIL SUPPLY AND DEMAND
(million barrels per day)
2008 2009 1Q10 2Q10 3Q10 4Q10 2010 1Q11 2Q11 3Q11 4Q11 2011 1Q12 2Q12 3Q12 4Q12 2012
OECD DEMAND
North America 24.2 23.3 23.5 23.7 24.2 23.9 23.8 23.8 23.2 23.8 23.7 23.6 23.7 23.2 23.8 23.7 23.6Europe 15.4 14.7 14.3 14.3 14.9 14.8 14.6 14.2 14.1 14.7 14.7 14.4 14.1 14.0 14.7 14.6 14.4
Pacific 8.1 7.7 8.2 7.3 7.6 8.1 7.8 8.3 7.1 7.6 8.2 7.8 8.3 7.2 7.4 8.0 7.7
Total OECD 47.6 45.6 46.0 45.3 46.7 46.8 46.2 46.3 44.3 46.1 46.5 45.8 46.1 44.5 45.9 46.3 45.7
NON-OECD DEMAND
FSU 4.2 4.2 4.4 4.3 4.6 4.6 4.5 4.5 4.5 4.7 4.7 4.6 4.6 4.5 4.8 4.8 4.7
Europe 0.8 0.7 0.7 0.7 0.7 0.7 0.7 0.7 0.7 0.7 0.7 0.7 0.7 0.7 0.7 0.7 0.7
China 7.7 8.1 8.6 9.1 8.9 9.7 9.1 9.5 9.7 9.7 9.9 9.7 10.0 10.2 10.1 10.4 10.2
Other Asia 9.7 10.1 10.4 10.6 10.2 10.6 10.4 10.8 10.9 10.5 10.9 10.8 11.1 11.3 10.9 11.3 11.1
Latin America 6.0 6.0 6.0 6.3 6.5 6.4 6.3 6.3 6.5 6.7 6.6 6.5 6.5 6.8 6.9 6.8 6.8
Middle East 7.2 7.5 7.4 7.8 8.3 7.7 7.8 7.6 8.0 8.5 7.8 8.0 7.9 8.3 8.8 8.1 8.3
Africa 3.3 3.3 3.3 3.4 3.4 3.4 3.4 3.4 3.4 3.4 3.4 3.4 3.5 3.6 3.5 3.6 3.5
Total Non-OECD 38.9 39.9 40.9 42.2 42.4 43.0 42.1 42.8 43.8 44.2 44.1 43.7 44.3 45.4 45.9 45.7 45.3
Total Demand1 86.5 85.5 86.9 87.4 89.2 89.9 88.3 89.1 88.2 90.3 90.6 89.5 90.4 89.9 91.8 92.0 91.0
OECD SUPPLY
North America413.3 13.6 13.9 14.1 14.1 14.4 14.1 14.4 14.2 14.0 14.3 14.2 14.6 14.3 14.2 14.5 14.4
Europe 4.8 4.6 4.5 4.2 3.8 4.2 4.2 4.1 3.9 4.0 4.3 4.1 4.3 4.0 3.9 4.1 4.1
Pacific 0.6 0.7 0.6 0.6 0.6 0.6 0.6 0.5 0.6 0.6 0.6 0.6 0.7 0.7 0.7 0.7 0.7
Total OECD 18.8 18.8 19.1 18.9 18.5 19.2 18.9 19.1 18.6 18.6 19.3 18.9 19.6 19.0 18.9 19.3 19.2
NON-OECD SUPPLY
FSU 12.8 13.3 13.5 13.5 13.5 13.6 13.5 13.7 13.6 13.7 13.8 13.7 13.7 13.8 13.6 13.7 13.7
Europe 0.1 0.1 0.1 0.1 0.1 0.1 0.1 0.1 0.1 0.1 0.1 0.1 0.1 0.1 0.1 0.1 0.1
China 3.8 3.9 4.0 4.1 4.1 4.2 4.1 4.2 4.1 4.3 4.3 4.2 4.3 4.3 4.3 4.3 4.3
Other Asia2
3.7 3.6 3.7 3.7 3.7 3.7 3.7 3.7 3.5 3.5 3.5 3.6 3.5 3.5 3.5 3.5 3.5
Latin America2,43.7 3.9 4.0 4.1 4.1 4.1 4.1 4.2 4.1 4.4 4.5 4.3 4.5 4.6 4.6 4.6 4.6
Middle East 1.7 1.7 1.7 1.7 1.7 1.7 1.7 1.7 1.6 1.7 1.7 1.7 1.8 1.8 1.8 1.7 1.8
Africa2
2.6 2.6 2.5 2.5 2.5 2.5 2.5 2.5 2.5 2.5 2.6 2.5 2.6 2.6 2.6 2.6 2.6
Total Non-OECD 28.4 29.1 29.6 29.7 29.9 30.0 29.8 30.1 29.7 30.2 30.5 30.1 30.6 30.6 30.5 30.6 30.5
Processing Gains3 2.0 2.0 2.0 2.1 2.1 2.1 2.1 2.2 2.1 2.1 2.2 2.2 2.3 2.2 2.2 2.3 2.3
Global Biofuels4 1.4 1.6 1.4 2.0 2.1 1.8 1.8 1.5 1.9 2.3 2.0 1.9 1.6 2.0 2.4 2.1 2.1
Total Non-OPEC2 50.6 51.5 52.1 52.6 52.6 53.2 52.6 52.8 52.4 53.2 54.0 53.1 54.0 53.9 54.0 54.3 54.0
Non-OPEC: Historical Composition2 49.6 51.5 52.1 52.6 52.6 53.2 52.6 52.8 52.4 53.2 54.0 53.1 54.0 53.9 54.0 54.3 54.0
OPEC
Crude531.6 29.1 29.3 29.3 29.7 29.6 29.5 30.0 29.4
NGLs 4.5 4.9 5.2 5.2 5.4 5.6 5.3 5.8 5.8 5.9 6.0 5.9 6.2 6.2 6.4 6.4 6.3
Total OPEC2 36.2 34.1 34.5 34.5 35.1 35.2 34.8 35.7 35.2
OPEC: Historical Composition2 37.2 34.1 34.5 34.5 35.1 35.2 34.8 35.7 35.2
Total Supply6 86.8 85.6 86.6 87.1 87.7 88.3 87.4 88.6 87.6
STOCK CHANGES AND MISCELLANEOUS
Reported OECD
Industry 0.3 -0.1 0.2 1.0 -0.1 -1.0 0.0 -0.3
Government 0.0 0.1 0.0 -0.1 -0.1 0.1 0.0 0.0
Total 0.3 0.0 0.2 1.0 -0.2 -0.9 0.0 -0.3
Floating Storage/Oil in Transit 0.0 0.3 -0.2 0.0 -0.2 -0.3 -0.2 0.2
Miscellaneous to balance7
-0.1 -0.2 -0.3 -1.4 -1.0 -0.3 -0.7 -0.4
Total Stock Ch. & Misc 0.3 0.1 -0.3 -0.3 -1.4 -1.5 -0.9 -0.5 -0.6
Memo items:
Call on OPEC crude + Stock ch.8 31.4 29.1 29.6 29.7 31.1 31.1 30.4 30.5 30.0 31.3 30.6 30.6 30.3 29.8 31.4 31.2 30.7
Adjusted Call on OPEC + Stock ch.9 31.3 28.8 29.3 28.3 30.1 30.8 29.6 30.0 29.6 30.8 30.2 30.2 29.9 29.4 31.0 30.8 30.31 Measured as deliveri es from refineries and primary stocks, comprises inland deliveries, international marine bunkers, refinery fuel, crude for direct burning,
oil from non-conventional sources and other sources of supply.2 Other Asia includes Indonesia throughout. Latin America excludes Ecuador throughout. Africa excludes Angola throughout.
Total Non-OPEC excludes all countries that were members of OPEC at 1 January 2009. Non-OPEC Historical Composition excludes countries that were OPEC members at that point in time.Total OPEC comprises all countries which were OPEC members at 1 January 2009. OPEC Historical Composition comprises countries which were OPEC members at that point in time.
3 Net volumetric gains and losses in the refining process (excludes net gain/loss in China and non-OECD Europe) and marine transportati on losses.4 As of the July 2010 OMR, Global Biofuels comprise all world biofuel production including fuel ethanol from the US and Brazil.5 As of the March 2006 OMR, Venezuelan Orinoco heavy crude production is included within Venezuelan crude estimates. Orimulsion fuel remains within the OPEC NGL and
non-conventional category, but Orimulsion production reportedly ceased from January 2007.6 Comprises crude oil, condensates, NGLs, oil from non-conventional sources and other sources of supply.7 Includes changes in non-reported stocks in OECD and non-OECD areas.8 Equals the arithmetic difference between total demand minus total non-OPEC supply minus OPEC NGLs.9 Equals the "Call on OPEC + Stock Ch." with "Miscellaneous to balance" added for historical peri ods and with an average of "Miscell aneous to balance" for the most recent 8 quarters added for forecast periods.

8/6/2019 IEA - Montly Oil Market Report - July 2011
http://slidepdf.com/reader/full/iea-montly-oil-market-report-july-2011 59/69
INTERNATIONAL ENERGY AGENCY ‐ O IL MARKET REPORT TABLES
13 JULY 2011 59
Table 1a - World Oil Supply and Demand: Changes from Last Month’s Table 1Table 1AWORLD OIL SUPPLY AND DEMAND: CHANGES FROM LAST MONTH'S TABLE 1
(million barrels per day)
2008 2009 1Q10 2Q10 3Q10 4Q10 2010 1Q11 2Q11 3Q11 4Q11 2011 1Q12 2Q12 3Q12 4Q12 2012
OECD DEMANDNorth America - - -0.1 -0.1 -0.1 -0.1 -0.1 -0.1 -0.5 -0.2 -0.1 -0.2
Europe 0.1 - 0.1 0.1 0.1 0.1 0.1 0.1 0.2 0.2 0.1 0.2
Pacific - - - - - - - - -0.2 - - -
Total OECD 0.1 0.1 0.1 0.1 0.1 0.1 0.1 - -0.4 -0.1 - -0.1
NON-OECD DEMAND
FSU - 0.2 0.2 0.2 0.2 0.2 0.2 0.2 0.3 0.2 0.2 0.3
Europe - - - - - - - - - - - -
China - - - - - - - - - - - -
Other Asia - - - - - - - - - - - -
Latin America - - - - - - - - - - - -
Middle East - - - - - - - - 0.1 0.1 - 0.1
Africa - - - - - - - - - - - -
Total Non-OECD - 0.2 0.3 0.3 0.3 0.2 0.3 0.3 0.5 0.4 0.3 0.4
Total Demand 0.1 0.3 0.3 0.3 0.3 0.3 0.3 0.3 0.1 0.3 0.3 0.2
OECD SUPPLY
North America - - - - - - - - 0.2 - - 0.1
Europe - - - - - - - - -0.1 - - -
Pacific - - - - - - - - - - - -
Total OECD - - - - - - - - 0.1 - - -
NON-OECD SUPPLY
FSU - - - - - - - - -0.1 0.1 - -
Europe - - - - - - - - - - - -
China - - - - - - - - - - - -
Other Asia - - - - - - - - -0.1 -0.1 - -0.1
Latin America- - - - - - - - -0.1 -0.1 -0.1 -0.1Middle East - - - - - - - - - -0.1 - -
Africa - - - - - - - - -0.1 -0.1 - -0.1
Total Non-OECD - - -0.1 -0.1 -0.1 -0.1 -0.1 -0.1 -0.3 -0.3 -0.2 -0.2
Processing Gains - - - - - - - - - - - -
Global Biofuels - - - - - - - - - - - -
Total Non-OPEC - - -0.1 -0.1 -0.1 -0.1 -0.1 -0.1 -0.2 -0.3 -0.2 -0.2
Non-OPEC: historical composition - - -0.1 -0.1 -0.1 -0.1 -0.1 -0.1 -0.2 -0.3 -0.2 -0.2
OPEC
Crude - - - - - - - -
NGLs - - - - - - - - - - - -
Total OPEC - - - - - - - -
OPEC: historical composition - - - - - - - -
Total Supply - - -0.1 -0.1 -0.1 -0.1 -0.1 -0.1
STOCK CHANGES AND MISCELLANEOUS
REPORTED OECD
Industry - - - - - -0.1 - 0.1
Government - - - - - - - -
Total - - - - - -0.1 - 0.1
Floating Storage/Oil in Transit - - - - - - - -
Miscellaneous to balance -0.1 -0.3 -0.4 -0.4 -0.4 -0.3 -0.4 -0.5
Total Stock Ch. & Misc -0.1 -0.3 -0.4 -0.4 -0.4 -0.4 -0.4 -0.4
Memo items:
Call on OPEC crude + Stock ch. 0.1 0.3 0.4 0.4 0.4 0.4 0.4 0.4 0.3 0.6 0.5 0.4Adjusted Call on OPEC + Stock ch. - - - - - 0.1 - -0.1 -0.1 0.2 0.1 -When submitting their monthly oil statistics, OECD Member countries periodically update data for prior periods. Similar updates to non-OECD data can occur.
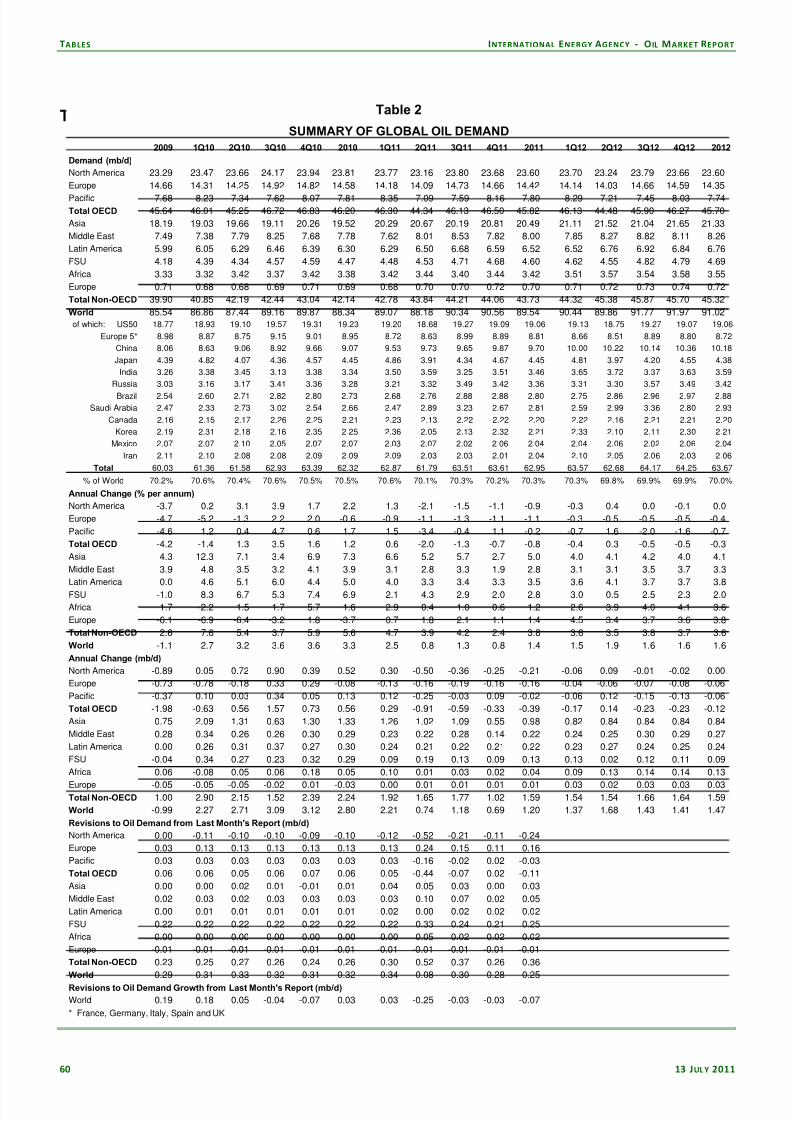
8/6/2019 IEA - Montly Oil Market Report - July 2011
http://slidepdf.com/reader/full/iea-montly-oil-market-report-july-2011 60/69
TABLES INTERNATIONAL ENERGY AGENCY ‐ O IL MARKET REPORT
60 13 JULY 2011
Table 2 - Summary of Global Oil DemandTable 2
SUMMARY OF GLOBAL OIL DEMAND2009 1Q10 2Q10 3Q10 4Q10 2010 1Q11 2Q11 3Q11 4Q11 2011 1Q12 2Q12 3Q12 4Q12 2012
Demand (mb/d)
North America 23.29 23.47 23.66 24.17 23.94 23.81 23.77 23.16 23.80 23.68 23.60 23.70 23.24 23.79 23.66 23.60
Europe 14.66 14.31 14.25 14.92 14.82 14.58 14.18 14.09 14.73 14.66 14.42 14.14 14.03 14.66 14.59 14.35
Pacific 7.68 8.23 7.34 7.62 8.07 7.81 8.35 7.09 7.59 8.16 7.80 8.29 7.21 7.45 8.03 7.74Total OECD 45.64 46.01 45.25 46.72 46.83 46.20 46.30 44.34 46.13 46.50 45.82 46.13 44.48 45.90 46.27 45.70
Asia 18.19 19.03 19.66 19.11 20.26 19.52 20.29 20.67 20.19 20.81 20.49 21.11 21.52 21.04 21.65 21.33
Middle East 7.49 7.38 7.79 8.25 7.68 7.78 7.62 8.01 8.53 7.82 8.00 7.85 8.27 8.82 8.11 8.26
Latin America 5.99 6.05 6.29 6.46 6.39 6.30 6.29 6.50 6.68 6.59 6.52 6.52 6.76 6.92 6.84 6.76
FSU 4.18 4.39 4.34 4.57 4.59 4.47 4.48 4.53 4.71 4.68 4.60 4.62 4.55 4.82 4.79 4.69
Africa 3.33 3.32 3.42 3.37 3.42 3.38 3.42 3.44 3.40 3.44 3.42 3.51 3.57 3.54 3.58 3.55
Europe 0.71 0.68 0.68 0.69 0.71 0.69 0.68 0.70 0.70 0.72 0.70 0.71 0.72 0.73 0.74 0.72
Total Non-OECD 39.90 40.85 42.19 42.44 43.04 42.14 42.78 43.84 44.21 44.06 43.73 44.32 45.38 45.87 45.70 45.32
World 85.54 86.86 87.44 89.16 89.87 88.34 89.07 88.18 90.34 90.56 89.54 90.44 89.86 91.77 91.97 91.02
of which: US50 18.77 18.93 19.10 19.57 19.31 19.23 19.20 18.68 19.27 19.09 19.06 19.13 18.75 19.27 19.07 19.06
Europe 5* 8.98 8.87 8.75 9.15 9.01 8.95 8.72 8.63 8.99 8.89 8.81 8.66 8.51 8.89 8.80 8.72
China 8.06 8.63 9.06 8.92 9.66 9.07 9.53 9.73 9.65 9.87 9.70 10.00 10.22 10.14 10.36 10.18
Japan 4.39 4.82 4.07 4.36 4.57 4.45 4.86 3.91 4.34 4.67 4.45 4.81 3.97 4.20 4.55 4.38
India 3.26 3.38 3.45 3.13 3.38 3.34 3.50 3.59 3.25 3.51 3.46 3.65 3.72 3.37 3.63 3.59
Russia 3.03 3.16 3.17 3.41 3.36 3.28 3.21 3.32 3.49 3.42 3.36 3.31 3.30 3.57 3.49 3.42
Brazil 2.54 2.60 2.71 2.82 2.80 2.73 2.68 2.76 2.88 2.88 2.80 2.75 2.86 2.96 2.97 2.88
Saudi Arabia 2.47 2.33 2.73 3.02 2.54 2.66 2.47 2.89 3.23 2.67 2.81 2.59 2.99 3.36 2.80 2.93
Canada 2.16 2.15 2.17 2.26 2.25 2.21 2.23 2.13 2.22 2.22 2.20 2.22 2.16 2.21 2.21 2.20
Korea 2.19 2.31 2.18 2.16 2.35 2.25 2.36 2.05 2.13 2.32 2.21 2.33 2.10 2.11 2.30 2.21
Mexico 2.07 2.07 2.10 2.05 2.07 2.07 2.03 2.07 2.02 2.06 2.04 2.04 2.06 2.02 2.06 2.04
Iran 2.11 2.10 2.08 2.08 2.09 2.09 2.09 2.03 2.03 2.01 2.04 2.10 2.05 2.06 2.03 2.06
Total 60.03 61.36 61.58 62.93 63.39 62.32 62.87 61.79 63.51 63.61 62.95 63.57 62.68 64.17 64.25 63.67
% of World 70.2% 70.6% 70.4% 70.6% 70.5% 70.5% 70.6% 70.1% 70.3% 70.2% 70.3% 70.3% 69.8% 69.9% 69.9% 70.0%
Annual Change (% per annum)
North America -3.7 0.2 3.1 3.9 1.7 2.2 1.3 -2.1 -1.5 -1.1 -0.9 -0.3 0.4 0.0 -0.1 0.0
Europe -4.7 -5.2 -1.3 2.2 2.0 -0.6 -0.9 -1.1 -1.3 -1.1 -1.1 -0.3 -0.5 -0.5 -0.5 -0.4
Pacific -4.6 1.2 0.4 4.7 0.6 1.7 1.5 -3.4 -0.4 1.1 -0.2 -0.7 1.6 -2.0 -1.6 -0.7
Total OECD -4.2 -1.4 1.3 3.5 1.6 1.2 0.6 -2.0 -1.3 -0.7 -0.8 -0.4 0.3 -0.5 -0.5 -0.3
Asia 4.3 12.3 7.1 3.4 6.9 7.3 6.6 5.2 5.7 2.7 5.0 4.0 4.1 4.2 4.0 4.1
Middle East 3.9 4.8 3.5 3.2 4.1 3.9 3.1 2.8 3.3 1.9 2.8 3.1 3.1 3.5 3.7 3.3
Latin America 0.0 4.6 5.1 6.0 4.4 5.0 4.0 3.3 3.4 3.3 3.5 3.6 4.1 3.7 3.7 3.8
FSU -1.0 8.3 6.7 5.3 7.4 6.9 2.1 4.3 2.9 2.0 2.8 3.0 0.5 2.5 2.3 2.0
Africa 1.7 -2.2 1.5 1.7 5.7 1.6 2.9 0.4 1.0 0.6 1.2 2.6 3.9 4.0 4.1 3.6
Europe -6.1 -6.9 -6.4 -3.2 1.8 -3.7 0.7 1.8 2.1 1.1 1.4 4.5 3.4 3.7 3.6 3.8
Total Non-OECD 2.6 7.6 5.4 3.7 5.9 5.6 4.7 3.9 4.2 2.4 3.8 3.6 3.5 3.8 3.7 3.6
World -1.1 2.7 3.2 3.6 3.6 3.3 2.5 0.8 1.3 0.8 1.4 1.5 1.9 1.6 1.6 1.6
Annual Change (mb/d)
North America -0.89 0.05 0.72 0.90 0.39 0.52 0.30 -0.50 -0.36 -0.25 -0.21 -0.06 0.09 -0.01 -0.02 0.00
Europe -0.73 -0.78 -0.18 0.33 0.29 -0.08 -0.13 -0.16 -0.19 -0.16 -0.16 -0.04 -0.06 -0.07 -0.08 -0.06
Pacific -0.37 0.10 0.03 0.34 0.05 0.13 0.12 -0.25 -0.03 0.09 -0.02 -0.06 0.12 -0.15 -0.13 -0.06
Total OECD -1.98 -0.63 0.56 1.57 0.73 0.56 0.29 -0.91 -0.59 -0.33 -0.39 -0.17 0.14 -0.23 -0.23 -0.12
Asia 0.75 2.09 1.31 0.63 1.30 1.33 1.26 1.02 1.09 0.55 0.98 0.82 0.84 0.84 0.84 0.84
Middle East 0.28 0.34 0.26 0.26 0.30 0.29 0.23 0.22 0.28 0.14 0.22 0.24 0.25 0.30 0.29 0.27
Latin America 0.00 0.26 0.31 0.37 0.27 0.30 0.24 0.21 0.22 0.21 0.22 0.23 0.27 0.24 0.25 0.24
FSU -0.04 0.34 0.27 0.23 0.32 0.29 0.09 0.19 0.13 0.09 0.13 0.13 0.02 0.12 0.11 0.09
Africa 0.06 -0.08 0.05 0.06 0.18 0.05 0.10 0.01 0.03 0.02 0.04 0.09 0.13 0.14 0.14 0.13
Europe -0.05 -0.05 -0.05 -0.02 0.01 -0.03 0.00 0.01 0.01 0.01 0.01 0.03 0.02 0.03 0.03 0.03Total Non-OECD 1.00 2.90 2.15 1.52 2.39 2.24 1.92 1.65 1.77 1.02 1.59 1.54 1.54 1.66 1.64 1.59
World -0.99 2.27 2.71 3.09 3.12 2.80 2.21 0.74 1.18 0.69 1.20 1.37 1.68 1.43 1.41 1.47
Revisions to Oil Demand from Last Month's Report (mb/d)
North America 0.00 -0.11 -0.10 -0.10 -0.09 -0.10 -0.12 -0.52 -0.21 -0.11 -0.24
Europe 0.03 0.13 0.13 0.13 0.13 0.13 0.13 0.24 0.15 0.11 0.16
Pacific 0.03 0.03 0.03 0.03 0.03 0.03 0.03 -0.16 -0.02 0.02 -0.03
Total OECD 0.06 0.06 0.05 0.06 0.07 0.06 0.05 -0.44 -0.07 0.02 -0.11
Asia 0.00 0.00 0.02 0.01 -0.01 0.01 0.04 0.05 0.03 0.00 0.03
Middle East 0.02 0.03 0.02 0.03 0.03 0.03 0.03 0.10 0.07 0.02 0.05
Latin America 0.00 0.01 0.01 0.01 0.01 0.01 0.02 0.00 0.02 0.02 0.02
FSU 0.22 0.22 0.22 0.22 0.22 0.22 0.22 0.33 0.24 0.21 0.25
Africa 0.00 0.00 0.00 0.00 0.00 0.00 0.00 0.05 0.02 0.02 0.02
Europe -0.01 -0.01 -0.01 -0.01 -0.01 -0.01 -0.01 -0.01 -0.01 -0.01 -0.01
Total Non-OECD 0.23 0.25 0.27 0.26 0.24 0.26 0.30 0.52 0.37 0.26 0.36
World 0.29 0.31 0.33 0.32 0.31 0.32 0.34 0.08 0.30 0.28 0.25
Revisions to Oil Demand Growth from Last Month's Report (mb/d)
World 0.19 0.18 0.05 -0.04 -0.07 0.03 0.03 -0.25 -0.03 -0.03 -0.07
* France, Germany, Italy, Spain and UK
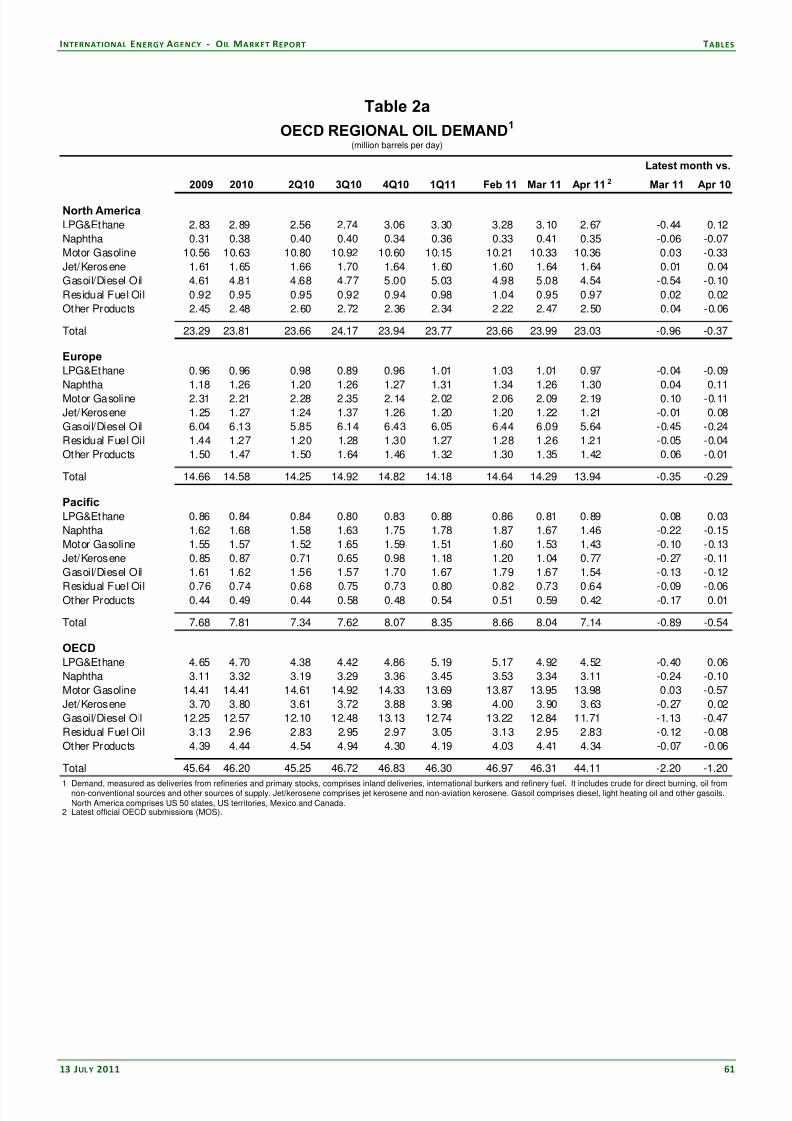
8/6/2019 IEA - Montly Oil Market Report - July 2011
http://slidepdf.com/reader/full/iea-montly-oil-market-report-july-2011 61/69
INTERNATIONAL ENERGY AGENCY ‐ O IL MARKET REPORT TABLES
13 JULY 2011 61
Table 2a - OECD Regional Oil DemandTable 2a
OECD REGIONAL OIL DEMAND1
(million barrels per day)
2009 2010 2Q10 3Q10 4Q10 1Q11 Feb 11 Mar 11 Apr 11 2 Mar 11 Apr 10
North AmericaLPG&Ethane 2.83 2.89 2.56 2.74 3.06 3.30 3.28 3.10 2.67 -0.44 0.12
Naphtha 0.31 0.38 0.40 0.40 0.34 0.36 0.33 0.41 0.35 -0.06 -0.07
Motor Gasoline 10.56 10.63 10.80 10.92 10.60 10.15 10.21 10.33 10.36 0.03 -0.33
Jet/Kerosene 1.61 1.65 1.66 1.70 1.64 1.60 1.60 1.64 1.64 0.01 0.04
Gasoil/Diesel Oil 4.61 4.81 4.68 4.77 5.00 5.03 4.98 5.08 4.54 -0.54 -0.10
Residual Fuel Oil 0.92 0.95 0.95 0.92 0.94 0.98 1.04 0.95 0.97 0.02 0.02
Other Products 2.45 2.48 2.60 2.72 2.36 2.34 2.22 2.47 2.50 0.04 -0.06
Total 23.29 23.81 23.66 24.17 23.94 23.77 23.66 23.99 23.03 -0.96 -0.37
EuropeLPG&Ethane 0.96 0.96 0.98 0.89 0.96 1.01 1.03 1.01 0.97 -0.04 -0.09
Naphtha 1.18 1.26 1.20 1.26 1.27 1.31 1.34 1.26 1.30 0.04 0.11
Motor Gasoline 2.31 2.21 2.28 2.35 2.14 2.02 2.06 2.09 2.19 0.10 -0.11
Jet/Kerosene 1.25 1.27 1.24 1.37 1.26 1.20 1.20 1.22 1.21 -0.01 0.08
Gasoil/Diesel Oil 6.04 6.13 5.85 6.14 6.43 6.05 6.44 6.09 5.64 -0.45 -0.24
Residual Fuel Oil 1.44 1.27 1.20 1.28 1.30 1.27 1.28 1.26 1.21 -0.05 -0.04
Other Products 1.50 1.47 1.50 1.64 1.46 1.32 1.30 1.35 1.42 0.06 -0.01
Total 14.66 14.58 14.25 14.92 14.82 14.18 14.64 14.29 13.94 -0.35 -0.29
PacificLPG&Ethane 0.86 0.84 0.84 0.80 0.83 0.88 0.86 0.81 0.89 0.08 0.03
Naphtha 1.62 1.68 1.58 1.63 1.75 1.78 1.87 1.67 1.46 -0.22 -0.15
Motor Gasoline 1.55 1.57 1.52 1.65 1.59 1.51 1.60 1.53 1.43 -0.10 -0.13
Jet/Kerosene 0.85 0.87 0.71 0.65 0.98 1.18 1.20 1.04 0.77 -0.27 -0.11
Gasoil/Diesel Oil 1.61 1.62 1.56 1.57 1.70 1.67 1.79 1.67 1.54 -0.13 -0.12
Residual Fuel Oil 0.76 0.74 0.68 0.75 0.73 0.80 0.82 0.73 0.64 -0.09 -0.06Other Products 0.44 0.49 0.44 0.58 0.48 0.54 0.51 0.59 0.42 -0.17 0.01
Total 7.68 7.81 7.34 7.62 8.07 8.35 8.66 8.04 7.14 -0.89 -0.54
OECDLPG&Ethane 4.65 4.70 4.38 4.42 4.86 5.19 5.17 4.92 4.52 -0.40 0.06
Naphtha 3.11 3.32 3.19 3.29 3.36 3.45 3.53 3.34 3.11 -0.24 -0.10
Motor Gasoline 14.41 14.41 14.61 14.92 14.33 13.69 13.87 13.95 13.98 0.03 -0.57
Jet/Kerosene 3.70 3.80 3.61 3.72 3.88 3.98 4.00 3.90 3.63 -0.27 0.02
Gasoil/Diesel Oil 12.25 12.57 12.10 12.48 13.13 12.74 13.22 12.84 11.71 -1.13 -0.47
Residual Fuel Oil 3.13 2.96 2.83 2.95 2.97 3.05 3.13 2.95 2.83 -0.12 -0.08
Other Products 4.39 4.44 4.54 4.94 4.30 4.19 4.03 4.41 4.34 -0.07 -0.06
Total 45.64 46.20 45.25 46.72 46.83 46.30 46.97 46.31 44.11 -2.20 -1.20
1 Demand, measured as deliveries from refineries and primary stocks, comprises inland deliveries, international bunkers and refinery fuel. It includes crude for direct burning, oil fromnon-conventional sources and other sources of supply. Jet/kerosene comprises jet kerosene and non-aviation kerosene. Gasoil comprises diesel, light heating oil and other gasoils.North America comprises US 50 states, US territories, Mexico and Canada.
2 Latest official OECD submissions (MOS).
Latest month vs.

8/6/2019 IEA - Montly Oil Market Report - July 2011
http://slidepdf.com/reader/full/iea-montly-oil-market-report-july-2011 62/69
TABLES INTERNATIONAL ENERGY AGENCY ‐ O IL MARKET REPORT
62 13 JULY 2011
Table 2b - OECD Oil Demand and % Growth in Demand in Selected OECD CountriesTable 2b
OIL DEMAND IN SELECTED OECD COUNTRIES1
(million barrels per day)
2009 2010 2Q10 3Q10 4Q10 1Q11 Feb 11 Mar 11 Apr 11 2 Mar 11 Apr 10
United States3
LPG 2.05 2.11 1.80 2.00 2.26 2.47 2.43 2.30 1.92 -0.38 0.14Naphtha 0.25 0.27 0.28 0.28 0.23 0.27 0.24 0.31 0.25 -0.06 -0.04Motor Gasoline 9.00 9.06 9.22 9.31 9.01 8.62 8.68 8.77 8.79 0.03 -0.34Jet/Kerosene 1.41 1.45 1.46 1.48 1.45 1.40 1.41 1.42 1.47 0.05 0.06Gasoil 3.63 3.80 3.70 3.76 3.94 3.95 3.87 4.00 3.69 -0.31 -0.02Residual Fuel Oil 0.51 0.55 0.53 0.54 0.57 0.62 0.64 0.55 0.60 0.05 0.02Other Products 1.92 1.99 2.11 2.19 1.86 1.87 1.75 1.98 1.98 0.00 -0.12
Total 18.77 19.23 19.10 19.57 19.31 19.20 19.00 19.33 18.70 -0.63 -0.30
JapanLPG 0.50 0.48 0.48 0.44 0.47 0.54 0.55 0.47 0.58 0.11 0.08Naphtha 0.72 0.77 0.70 0.73 0.81 0.79 0.86 0.70 0.63 -0.07 -0.10Motor Gasoline 0.99 1.00 0.97 1.08 1.00 0.95 0.98 0.96 0.88 -0.08 -0.12Jet/Kerosene 0.55 0.55 0.43 0.36 0.62 0.80 0.84 0.69 0.46 -0.23 -0.11Diesel 0.43 0.41 0.39 0.42 0.43 0.41 0.44 0.40 0.39 -0.01 -0.03Other Gasoil 0.42 0.43 0.39 0.38 0.44 0.48 0.54 0.45 0.40 -0.05 -0.03Residual Fuel Oil 0.41 0.40 0.37 0.43 0.39 0.42 0.45 0.38 0.34 -0.03 -0.02Other Products 0.39 0.41 0.35 0.51 0.40 0.47 0.44 0.52 0.32 -0.19 0.00
Total 4.39 4.45 4.07 4.36 4.57 4.86 5.09 4.58 4.01 -0.57 -0.34
GermanyLPG 0.10 0.10 0.11 0.11 0.09 0.10 0.10 0.09 0.11 0.01 -0.01Naphtha 0.36 0.41 0.38 0.41 0.41 0.48 0.48 0.48 0.46 -0.01 0.11Motor Gasoline 0.47 0.46 0.48 0.48 0.45 0.43 0.44 0.45 0.46 0.01 -0.02Jet/Kerosene 0.19 0.18 0.19 0.20 0.18 0.17 0.16 0.17 0.19 0.02 0.03Diesel 0.64 0.67 0.68 0.71 0.69 0.63 0.65 0.69 0.67 -0.02 -0.02Other Gasoil 0.42 0.43 0.33 0.45 0.47 0.37 0.43 0.34 0.18 -0.15 -0.08Residual Fuel Oil 0.16 0.15 0.14 0.16 0.16 0.16 0.16 0.16 0.15 -0.01 0.01Other Products . . . . . . . . . . .
Total 2.45 2.49 2.40 2.65 2.53 2.38 2.45 2.45 2.33 -0.12 0.04
ItalyLPG 0.10 0.11 0.09 0.09 0.11 0.12 0.14 0.12 0.09 -0.03 -0.01Naphtha 0.10 0.12 0.12 0.12 0.11 0.11 0.10 0.12 0.12 0.01 0.00Motor Gasoline 0.25 0.24 0.25 0.26 0.24 0.22 0.23 0.23 0.24 0.01 0.00Jet/Kerosene 0.09 0.10 0.10 0.11 0.09 0.09 0.09 0.10 0.09 0.00 0.01Diesel 0.49 0.49 0.50 0.50 0.50 0.47 0.50 0.49 0.50 0.01 0.00Other Gasoil 0.13 0.12 0.10 0.11 0.14 0.11 0.13 0.10 0.08 -0.02 -0.02Residual Fuel Oil 0.18 0.13 0.12 0.13 0.12 0.10 0.11 0.10 0.10 0.00 -0.03Other Products 0.20 0.23 0.22 0.26 0.25 0.21 0.22 0.19 0.23 0.04 0.02
Total 1.54 1.53 1.50 1.58 1.56 1.43 1.50 1.45 1.46 0.02 -0.04
FranceLPG 0.12 0.15 0.13 0.13 0.17 0.17 0.18 0.15 0.13 -0.02 -0.02Naphtha 0.13 0.13 0.14 0.12 0.10 0.13 0.14 0.12 0.14 0.02 -0.01Motor Gasoline 0.20 0.19 0.20 0.20 0.18 0.17 0.17 0.17 0.20 0.02 -0.01Jet/Kerosene 0.15 0.15 0.15 0.16 0.14 0.14 0.14 0.14 0.15 0.01 0.02Diesel 0.67 0.69 0.70 0.71 0.69 0.69 0.71 0.71 0.71 0.00 -0.01Other Gasoil 0.32 0.30 0.23 0.27 0.34 0.35 0.40 0.29 0.20 -0.09 -0.07Residual Fuel Oil 0.10 0.09 0.09 0.08 0.09 0.08 0.08 0.08 0.09 0.00 0.00Other Products 0.18 0.17 0.19 0.19 0.15 0.13 0.13 0.15 0.17 0.02 0.00
Total 1.87 1.86 1.82 1.87 1.86 1.86 1.95 1.82 1.78 -0.04 -0.09
United KingdomLPG 0.15 0.14 0.16 0.12 0.13 0.14 0.14 0.13 0.17 0.03 -0.01
Naphtha 0.02 0.03 0.03 0.03 0.02 0.03 0.03 0.03 0.03 0.01 0.00Motor Gasoline 0.37 0.35 0.36 0.36 0.34 0.34 0.34 0.35 0.35 0.00 -0.02Jet/Kerosene 0.33 0.33 0.30 0.33 0.34 0.34 0.33 0.34 0.31 -0.03 0.02Diesel 0.43 0.45 0.44 0.45 0.44 0.45 0.46 0.46 0.43 -0.04 0.00Other Gasoil 0.12 0.12 0.11 0.14 0.12 0.11 0.12 0.13 0.11 -0.02 -0.01Residual Fuel Oil 0.08 0.06 0.06 0.06 0.07 0.07 0.07 0.05 0.07 0.02 -0.01Other Products 0.14 0.14 0.15 0.15 0.15 0.15 0.15 0.14 0.16 0.02 0.01
Total 1.65 1.62 1.61 1.63 1.60 1.62 1.65 1.63 1.61 -0.02 -0.02
CanadaLPG 0.35 0.35 0.35 0.33 0.36 0.38 0.39 0.37 0.36 -0.01 0.01Naphtha 0.05 0.08 0.08 0.09 0.08 0.09 0.08 0.10 0.09 -0.01 0.00Motor Gasoline 0.73 0.73 0.74 0.77 0.73 0.70 0.71 0.69 0.73 0.04 0.00Jet/Kerosene 0.11 0.11 0.11 0.12 0.11 0.11 0.10 0.11 0.09 -0.02 -0.02Diesel 0.23 0.22 0.22 0.22 0.23 0.22 0.24 0.21 0.09 -0.11 -0.11Other Gasoil 0.28 0.31 0.27 0.31 0.34 0.35 0.38 0.33 0.27 -0.07 0.01Residual Fuel Oil 0.10 0.10 0.11 0.09 0.11 0.11 0.14 0.09 0.10 0.01 -0.01Other Products 0.31 0.30 0.29 0.34 0.30 0.28 0.28 0.29 0.27 -0.02 0.00
Total 2.16 2.21 2.17 2.26 2.25 2.23 2.32 2.19 2.00 -0.19 -0.121 Demand, measured as deliveries from refineries and primary stocks, comprises inland deliveries, international bunkers and refinery fuel. It includes crude for direct burning, oil from
non-conventional sources and other sources of supply. Jet/kerosene comprises jet kerosene and non-aviation kerosene. Gasoil comprises diesel, l ight heating oil and other gasoil s.2 Latest official OECD submissions (MOS).
3 US figures exclude US territories.
Latest month vs.
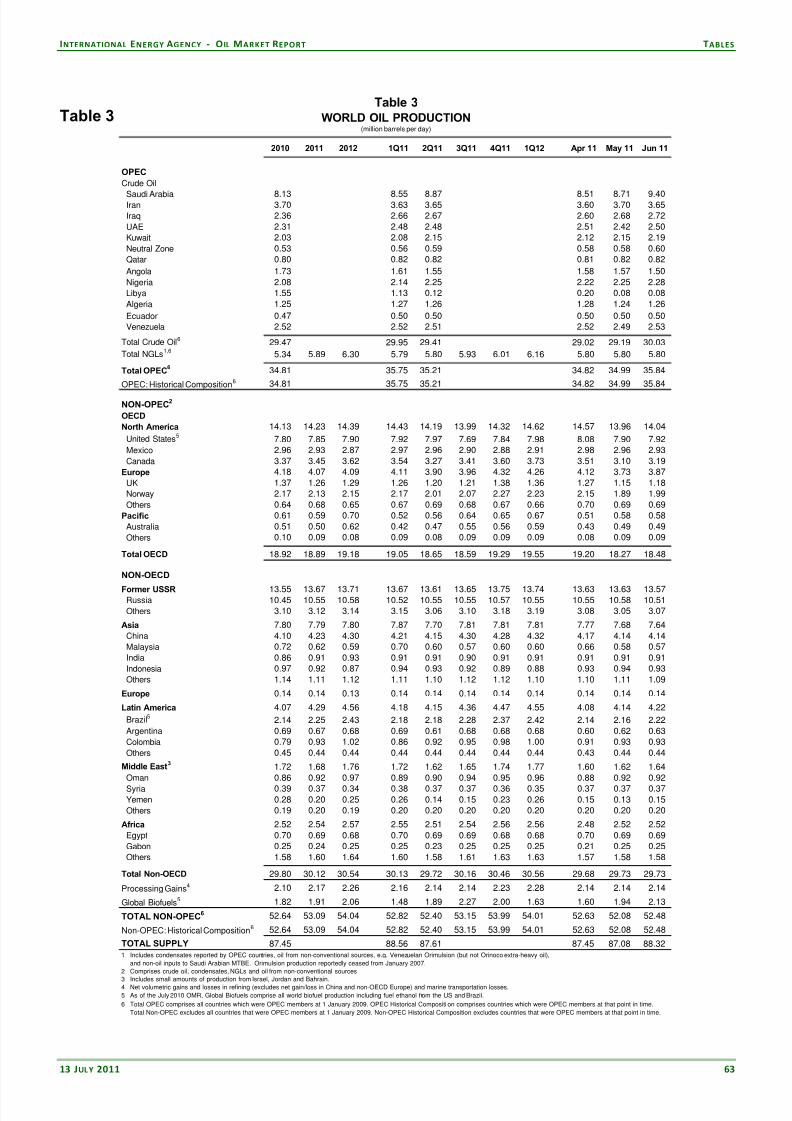
8/6/2019 IEA - Montly Oil Market Report - July 2011
http://slidepdf.com/reader/full/iea-montly-oil-market-report-july-2011 63/69
INTERNATIONAL ENERGY AGENCY ‐ O IL MARKET REPORT TABLES
13 JULY 2011 63
Table 3 - World Oil ProductionTable 3
WORLD OIL PRODUCTION(million barrels per day)
2010 2011 2012 1Q11 2Q11 3Q11 4Q11 1Q12 Apr 11 May 11 Jun 11
OPEC
Crude Oil
Saudi Arabia 8.13 8.55 8.87 8.51 8.71 9.40Iran 3.70 3.63 3.65 3.60 3.70 3.65Iraq 2.36 2.66 2.67 2.60 2.68 2.72
UAE 2.31 2.48 2.48 2.51 2.42 2.50Kuwait 2.03 2.08 2.15 2.12 2.15 2.19
Neutral Zone 0.53 0.56 0.59 0.58 0.58 0.60Qatar 0.80 0.82 0.82 0.81 0.82 0.82
Angola 1.73 1.61 1.55 1.58 1.57 1.50
Nigeria 2.08 2.14 2.25 2.22 2.25 2.28Libya 1.55 1.13 0.12 0.20 0.08 0.08
Algeria 1.25 1.27 1.26 1.28 1.24 1.26
Ecuador 0.47 0.50 0.50 0.50 0.50 0.50Venezuela 2.52 2.52 2.51 2.52 2.49 2.53
Total Crude Oil6 29.47 29.95 29.41 29.02 29.19 30.03
Total NGLs1,6
5.34 5.89 6.30 5.79 5.80 5.93 6.01 6.16 5.80 5.80 5.80
Total OPEC6 34.81 35.75 35.21 34.82 34.99 35.84
OPEC: Historical Composition6 34.81 35.75 35.21 34.82 34.99 35.84
NON-OPEC2
OECD
North America 14.13 14.23 14.39 14.43 14.19 13.99 14.32 14.62 14.57 13.96 14.04
United States57.80 7.85 7.90 7.92 7.97 7.69 7.84 7.98 8.08 7.90 7.92
Mexico 2.96 2.93 2.87 2.97 2.96 2.90 2.88 2.91 2.98 2.96 2.93
Canada 3.37 3.45 3.62 3.54 3.27 3.41 3.60 3.73 3.51 3.10 3.19
Europe 4.18 4.07 4.09 4.11 3.90 3.96 4.32 4.26 4.12 3.73 3.87
UK 1.37 1.26 1.29 1.26 1.20 1.21 1.38 1.36 1.27 1.15 1.18Norway 2.17 2.13 2.15 2.17 2.01 2.07 2.27 2.23 2.15 1.89 1.99
Others 0.64 0.68 0.65 0.67 0.69 0.68 0.67 0.66 0.70 0.69 0.69
Pacific 0.61 0.59 0.70 0.52 0.56 0.64 0.65 0.67 0.51 0.58 0.58
Australia 0.51 0.50 0.62 0.42 0.47 0.55 0.56 0.59 0.43 0.49 0.49
Others 0.10 0.09 0.08 0.09 0.08 0.09 0.09 0.09 0.08 0.09 0.09
Total OECD 18.92 18.89 19.18 19.05 18.65 18.59 19.29 19.55 19.20 18.27 18.48
NON-OECD
Former USSR 13.55 13.67 13.71 13.67 13.61 13.65 13.75 13.74 13.63 13.63 13.57Russia 10.45 10.55 10.58 10.52 10.55 10.55 10.57 10.55 10.55 10.58 10.51Others 3.10 3.12 3.14 3.15 3.06 3.10 3.18 3.19 3.08 3.05 3.07
Asia 7.80 7.79 7.80 7.87 7.70 7.81 7.81 7.81 7.77 7.68 7.64China 4.10 4.23 4.30 4.21 4.15 4.30 4.28 4.32 4.17 4.14 4.14Malaysia 0.72 0.62 0.59 0.70 0.60 0.57 0.60 0.60 0.66 0.58 0.57India 0.86 0.91 0.93 0.91 0.91 0.90 0.91 0.91 0.91 0.91 0.91Indonesia 0.97 0.92 0.87 0.94 0.93 0.92 0.89 0.88 0.93 0.94 0.93Others 1.14 1.11 1.12 1.11 1.10 1.12 1.12 1.10 1.10 1.11 1.09
Europe 0.14 0.14 0.13 0.14 0.14 0.14 0.14 0.14 0.14 0.14 0.14
Latin America 4.07 4.29 4.56 4.18 4.15 4.36 4.47 4.55 4.08 4.14 4.22
Brazil5 2.14 2.25 2.43 2.18 2.18 2.28 2.37 2.42 2.14 2.16 2.22Argentina 0.69 0.67 0.68 0.69 0.61 0.68 0.68 0.68 0.60 0.62 0.63Colombia 0.79 0.93 1.02 0.86 0.92 0.95 0.98 1.00 0.91 0.93 0.93
Others 0.45 0.44 0.44 0.44 0.44 0.44 0.44 0.44 0.43 0.44 0.44
Middle East3
1.72 1.68 1.76 1.72 1.62 1.65 1.74 1.77 1.60 1.62 1.64Oman 0.86 0.92 0.97 0.89 0.90 0.94 0.95 0.96 0.88 0.92 0.92
Syria 0.39 0.37 0.34 0.38 0.37 0.37 0.36 0.35 0.37 0.37 0.37Yemen 0.28 0.20 0.25 0.26 0.14 0.15 0.23 0.26 0.15 0.13 0.15Others 0.19 0.20 0.19 0.20 0.20 0.20 0.20 0.20 0.20 0.20 0.20
Africa 2.52 2.54 2.57 2.55 2.51 2.54 2.56 2.56 2.48 2.52 2.52Egypt 0.70 0.69 0.68 0.70 0.69 0.69 0.68 0.68 0.70 0.69 0.69Gabon 0.25 0.24 0.25 0.25 0.23 0.25 0.25 0.25 0.21 0.25 0.25Others 1.58 1.60 1.64 1.60 1.58 1.61 1.63 1.63 1.57 1.58 1.58
Total Non-OECD 29.80 30.12 30.54 30.13 29.72 30.16 30.46 30.56 29.68 29.73 29.73
Processing Gains4 2.10 2.17 2.26 2.16 2.14 2.14 2.23 2.28 2.14 2.14 2.14
Global Biofuels5 1.82 1.91 2.06 1.48 1.89 2.27 2.00 1.63 1.60 1.94 2.13
TOTAL NON-OPEC6 52.64 53.09 54.04 52.82 52.40 53.15 53.99 54.01 52.63 52.08 52.48
Non-OPEC: Historical Composition6 52.64 53.09 54.04 52.82 52.40 53.15 53.99 54.01 52.63 52.08 52.48
TOTAL SUPPLY 87.45 88.56 87.61 87.45 87.08 88.321 Includes condensates reported by OPEC countries, oil from non-conventional sources, e.g. Venezuelan Orimulsion (but not Orinoco extra-heavy oil),
and non-oil inputs to Saudi Arabian MTBE. Orimulsion production reportedly ceased from January 2007.
2 Comprises crude oil, condensates, NGLs and oil from non-conventional sources
3 Includes small amounts of production from Israel, Jordan and Bahrain.4 Net volumetric gains and losses in refining (excludes net gain/loss in China and non-OECD Europe) and marine transportation losses.
5 As of the July 2010 OMR, Global Biofuels comprise all world biofuel production including fuel ethanol from the US and Brazil.
6 Total OPEC comprises all countries which were OPEC members at 1 January 2009. OPEC Historical Compositi on comprises countries which were OPEC members at that point in time.
Total Non-OPEC excludes all countries that were OPEC members at 1 January 2009. Non-OPEC Historical Composition excludes countries that were OPEC members at that point in time.
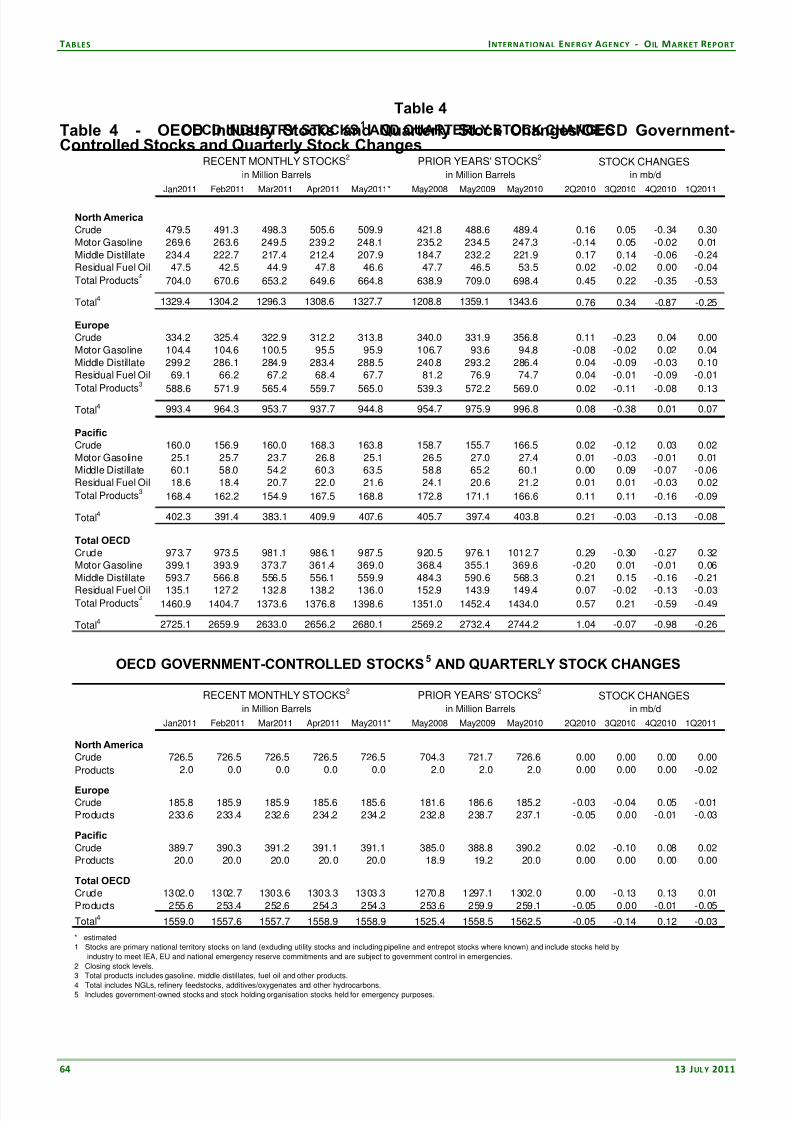
8/6/2019 IEA - Montly Oil Market Report - July 2011
http://slidepdf.com/reader/full/iea-montly-oil-market-report-july-2011 64/69
TABLES INTERNATIONAL ENERGY AGENCY ‐ O IL MARKET REPORT
64 13 JULY 2011
Table 4 - OECD Industry Stocks and Quarterly Stock Changes/OECD Government-Controlled Stocks and Quarterly Stock Changes
OECD INDUSTRY STOCKS1 AND QUARTERLY STOCK CHANGES
RECENT MONTHLY STOCKS2
PRIOR YEARS' STOCKS2
STOCK CHANGESin Million Barrels in Million Barrels in mb/d
Jan2011 Feb2011 Mar2011 Apr2011 May2011* May2008 May2009 May2010 2Q2010 3Q2010 4Q2010 1Q2011
North AmericaCrude 479.5 491.3 498.3 505.6 509.9 421.8 488.6 489.4 0.16 0.05 -0.34 0.30
Motor Gasoline 269.6 263.6 249.5 239.2 248.1 235.2 234.5 247.3 -0.14 0.05 -0.02 0.01
Middle Distillate 234.4 222.7 217.4 212.4 207.9 184.7 232.2 221.9 0.17 0.14 -0.06 -0.24Residual Fuel Oil 47.5 42.5 44.9 47.8 46.6 47.7 46.5 53.5 0.02 -0.02 0.00 -0.04
Total Products 704.0 670.6 653.2 649.6 664.8 638.9 709.0 698.4 0.45 0.22 -0.35 -0.53
Total4 1329.4 1304.2 1296.3 1308.6 1327.7 1208.8 1359.1 1343.6 0.76 0.34 -0.87 -0.25
EuropeCrude 334.2 325.4 322.9 312.2 313.8 340.0 331.9 356.8 0.11 -0.23 0.04 0.00
Motor Gasoline 104.4 104.6 100.5 95.5 95.9 106.7 93.6 94.8 -0.08 -0.02 0.02 0.04
Middle Distillate 299.2 286.1 284.9 283.4 288.5 240.8 293.2 286.4 0.04 -0.09 -0.03 0.10Residual Fuel Oil 69.1 66.2 67.2 68.4 67.7 81.2 76.9 74.7 0.04 -0.01 -0.09 -0.01
Total Products
3
588.6 571.9 565.4 559.7 565.0 539.3 572.2 569.0 0.02 -0.11 -0.08 0.13
Total4 993.4 964.3 953.7 937.7 944.8 954.7 975.9 996.8 0.08 -0.38 0.01 0.07
PacificCrude 160.0 156.9 160.0 168.3 163.8 158.7 155.7 166.5 0.02 -0.12 0.03 0.02
Motor Gasoline 25.1 25.7 23.7 26.8 25.1 26.5 27.0 27.4 0.01 -0.03 -0.01 0.01Middle Distillate 60.1 58.0 54.2 60.3 63.5 58.8 65.2 60.1 0.00 0.09 -0.07 -0.06Residual Fuel Oil 18.6 18.4 20.7 22.0 21.6 24.1 20.6 21.2 0.01 0.01 -0.03 0.02
Total Products3168.4 162.2 154.9 167.5 168.8 172.8 171.1 166.6 0.11 0.11 -0.16 -0.09
Total4 402.3 391.4 383.1 409.9 407.6 405.7 397.4 403.8 0.21 -0.03 -0.13 -0.08
Total OECDCrude 973.7 973.5 981.1 986.1 987.5 920.5 976.1 1012.7 0.29 -0.30 -0.27 0.32Motor Gasoline 399.1 393.9 373.7 361.4 369.0 368.4 355.1 369.6 -0.20 0.01 -0.01 0.06
Middle Distillate 593.7 566.8 556.5 556.1 559.9 484.3 590.6 568.3 0.21 0.15 -0.16 -0.21
Residual Fuel Oil 135.1 127.2 132.8 138.2 136.0 152.9 143.9 149.4 0.07 -0.02 -0.13 -0.03Total Products 1460.9 1404.7 1373.6 1376.8 1398.6 1351.0 1452.4 1434.0 0.57 0.21 -0.59 -0.49
Total4 2725.1 2659.9 2633.0 2656.2 2680.1 2569.2 2732.4 2744.2 1.04 -0.07 -0.98 -0.26
OECD GOVERNMENT-CONTROLLED STOCKS5
AND QUARTERLY STOCK CHANGES
RECENT MONTHLY STOCKS2
PRIOR YEARS' STOCKS2
STOCK CHANGESin Million Barrels in Million Barrels in mb/d
Jan2011 Feb2011 Mar2011 Apr2011 May2011* May2008 May2009 May2010 2Q2010 3Q2010 4Q2010 1Q2011
North AmericaCrude 726.5 726.5 726.5 726.5 726.5 704.3 721.7 726.6 0.00 0.00 0.00 0.00
Products 2.0 0.0 0.0 0.0 0.0 2.0 2.0 2.0 0.00 0.00 0.00 -0.02
EuropeCrude 185.8 185.9 185.9 185.6 185.6 181.6 186.6 185.2 -0.03 -0.04 0.05 -0.01Products 233.6 233.4 232.6 234.2 234.2 232.8 238.7 237.1 -0.05 0.00 -0.01 -0.03
PacificCrude 389.7 390.3 391.2 391.1 391.1 385.0 388.8 390.2 0.02 -0.10 0.08 0.02Products 20.0 20.0 20.0 20.0 20.0 18.9 19.2 20.0 0.00 0.00 0.00 0.00
Total OECDCrude 1302.0 1302.7 1303.6 1303.3 1303.3 1270.8 1297.1 1302.0 0.00 -0.13 0.13 0.01
Products 255.6 253.4 252.6 254.3 254.3 253.6 259.9 259.1 -0.05 0.00 -0.01 -0.05
Total4 1559.0 1557.6 1557.7 1558.9 1558.9 1525.4 1558.5 1562.5 -0.05 -0.14 0.12 -0.03
* estimated
1 Stocks are primary national territory stocks on land (excluding utility stocks and including pipeline and entrepot stocks where known) and include stocks held by
industry to meet IEA, EU and national emergency reserve commitments and are subject to government control in emergencies.
2 Closing stock levels.
3 Total products includes gasoline, middle distillates, fuel oil and other products.
4 Total includes NGLs, refinery feedstocks, additives/oxygenates and other hydrocarbons.5 Includes government-owned stocks and stock holding organisation stocks held for emergency purposes.
Table 4

8/6/2019 IEA - Montly Oil Market Report - July 2011
http://slidepdf.com/reader/full/iea-montly-oil-market-report-july-2011 65/69
INTERNATIONAL ENERGY AGENCY ‐ O IL MARKET REPORT TABLES
13 JULY 2011 65
Table 5 - Total Stocks on Land in OECD Countries/Total OECD Stocks
Table 5
TOTAL STOCKS ON LAND IN OECD COUNTRIES1
('millions of barrels' and 'days')
3
Stock Days Fwd2Stock Days Fwd Stock Days Fwd Stock Days Fwd Stock Days Fwd
eve eman eve eman eve eman eve eman eve eman
North AmericaCanada 171.7 76 178.4 79 197.1 86 185.1 82 186.3 -Mexico 51.5 25 54.4 27 49.0 24 44.5 22 45.0 -United States4
1781.4 94 1840.7 94 1858.7 97 1795.5 94 1769.5 -
Total4
2026.7 86 2095.6 87 2127.0 89 2047.2 86 2022.9 87
Pacific
Australia 41.5 43 42.7 45 40.5 41 38.1 39 39.1 -Japan 581.5 143 597.1 137 581.8 127 588.3 121 576.9 -
Korea 163.6 75 167.3 78 173.5 74 165.4 70 170.2 -New Zealand 8.1 61 8.9 59 8.2 53 8.2 51 8.0 -
Total 794.7 108 816.0 107 804.0 100 800.0 96 794.2 112
Europe5
Austria 22.7 85 20.1 69 18.9 65 19.7 78 19.0 -Belgium 35.3 66 37.8 62 34.3 51 33.6 50 37.0 -Czech Republic 21.7 106 20.4 99 21.1 105 21.2 117 21.5 -
Denmark 27.2 171 28.2 160 26.5 157 25.3 162 20.8 -Finland 32.5 166 28.5 134 28.5 121 27.8 127 26.9 -France 171.8 94 170.1 91 163.4 88 168.2 91 167.4 -Germany 288.8 120 280.4 106 285.6 113 286.8 121 289.4 -Greece 35.6 105 33.9 98 36.3 95 34.3 92 33.9 -Hungary 16.8 115 17.0 107 15.9 103 15.9 119 17.4 -Ireland 12.7 81 12.8 87 11.4 68 9.8 63 10.8 -Italy 129.2 86 132.5 84 126.6 81 133.3 93 132.2 -Luxembourg 0.8 13 0.7 11 0.7 12 0.6 10 0.5 -Netherlands 131.0 125 138.8 137 120.9 122 125.9 129 125.9 -Norway 21.1 90 22.1 107 20.8 77 20.8 81 21.1 -Poland 62.5 115 63.8 106 64.2 108 65.5 123 62.8 -Portugal 23.4 84 24.9 87 22.8 84 22.9 89 23.5 -Slovak Republic 9.5 122 9.3 99 8.6 101 8.3 109 9.0 -Spain 132.0 93 134.1 94 133.0 92 133.2 93 132.9 -Sweden 39.3 113 35.4 103 34.4 94 32.3 94 33.7 -
Switzerland 37.8 166 38.1 148 37.7 146 36.8 156 36.6 -Turkey 58.1 88 58.4 80 58.5 90 58.5 100 58.3 -United Kingdom 93.4 58 96.1 59 94.5 59 88.8 55 92.8 -
Total 1403.2 98 1403.2 94 1364.7 92 1369.6 96 1373.6 97
Total OECD 4224.6 93 4314.8 93 4295.7 92 4216.8 91 4190.7 95
DAYS OF IEA Net Imports6 - 145 - 146 - 145 - 146 - 146
1 Total Stocks are industry and government-controlled stocks (see breakdown in table below). Stocks are primary national territory stocks on land (excluding utility stocksand including pipeline and entrepot stocks where known) they include stocks held by industry t o meet IEA, EU and national emergency reserves commitments and aresubject to government control in emergencies.
2 Note that days of forward demand represent the stock level divided by the forward quarter average daily demand and is very different from the days of netimports used for the calculation of IEA Emergency Reserves.
3 End March 2011 forward demand figures are IEA Secretariat forecasts.4 US figures exclude US territories. Total includes US territories.5 Data not available for Iceland.6 Reflects stock levels and prior calendar year's net imports adjusted according to IEA emergency reserve definitions (see www.iea.org/netimports.asp). Net exporting IEA countries are exclude
TOTAL OECD STOCKS
CLOSING STOCKS Total Industry Total Industry
1Q2008 4082 1529 2553 86 32 54
2Q2008 4110 1526 2584 88 33 55
3Q2008 4164 1522 2641 88 32 56
4Q2008 4206 1527 2679 90 33 57
1Q2009 4278 1547 2731 96 35 61
2Q2009 4306 1561 2745 95 35 61
3Q2009 4327 1564 2763 94 34 60
4Q2009 4205 1564 2641 92 34 58
1Q2010 4225 1567 2658 93 35 59
2Q2010 4315 1562 2753 93 34 59
3Q2010 4296 1549 2746 92 33 59
4Q2010 4217 1561 2656 91 34 57
1Q2011 4191 1558 2633 95 35 59
1 Includes government-owned stocks and stock holding organisation stocks held for emergency purposes.2 Days of forward demand calculated using actual demand except in 1Q2011 (when latest forecasts are used).
End March 2011
Millions of Barrels
Government1
controlledGovernment
1
controlled
Days of Fwd. Demand 2
End June 2010End March 2010 End September 2010 End December 2010

8/6/2019 IEA - Montly Oil Market Report - July 2011
http://slidepdf.com/reader/full/iea-montly-oil-market-report-july-2011 66/69
TABLES INTERNATIONAL ENERGY AGENCY ‐ O IL MARKET REPORT
66 13 JULY 2011
Table 6 - IEA Member Country Destinations of Selected Crude StreamsTable 6
IEA MEMBER COUNTRY DESTINATIONS OF SELECTED CRUDE STREAMS1
(million barrels per day)
Year Earlier 2008 2009 2010 2Q10 3Q10 4Q10 1Q11 Feb 11 Mar 11 Apr 11 Apr 10 change
Saudi Light & Extra LightNorth America 0.70 0.52 0.69 0.69 0.73 0.75 0.71 0.61 0.70 0.63 0.84 -0.22Europe 0.70 0.59 0.66 0.64 0.74 0.69 0.70 0.68 0.68 0.79 0.71 0.07Pacific 1.22 1.28 1.21 1.17 1.15 1.26 1.33 1.31 1.39 1.25 1.31 -0.06
Saudi MediumNorth America 0.64 0.40 0.36 0.36 0.33 0.36 0.33 0.34 0.34 0.32 0.37 -0.05Europe 0.05 0.02 0.00 0.00 - - - - - - 0.00 -Pacific 0.39 0.34 0.34 0.37 0.30 0.37 0.39 0.35 0.42 0.33 0.36 -0.03
Saudi HeavyNorth America 0.07 0.03 0.02 0.02 0.03 0.01 0.02 0.02 0.02 0.02 0.02 0.00Europe 0.09 0.02 0.00 0.00 0.00 - 0.00 - - - 0.00 -Pacific 0.24 0.15 0.22 0.19 0.23 0.21 0.20 0.24 0.18 0.22 0.21 0.01
Iraqi Basrah LightNorth America 0.60 0.40 0.36 0.43 0.29 0.29 0.21 0.23 0.24 0.46 0.34 0.12Europe 0.21 0.12 0.09 0.09 0.13 0.08 0.03 0.00 0.03 0.01 0.04 -0.03
Pacific 0.15 0.24 0.29 0.19 0.26 0.38 0.40 0.56 0.35 0.42 0.20 0.22
Iraqi KirkukNorth America 0.08 0.06 0.03 0.03 0.05 0.04 0.11 0.07 0.12 0.05 0.03 0.03Europe 0.23 0.31 0.27 0.27 0.25 0.23 0.21 0.22 0.23 0.29 0.28 0.00Pacific - - - - - - - - - - - -
Iranian LightNorth America - - - - - - - - - - - -Europe 0.23 0.15 0.24 0.24 0.33 0.18 0.24 0.30 0.26 0.36 0.28 0.08Pacific 0.08 0.07 0.04 0.07 0.04 0.01 0.06 0.06 0.07 0.02 0.07 -0.05
Iranian HeavyNorth America - - - - - - - - - - - -Europe 0.49 0.40 0.49 0.47 0.70 0.43 0.34 0.24 0.45 0.36 0.38 -0.02Pacific 0.61 0.57 0.52 0.44 0.53 0.52 0.63 0.57 0.69 0.42 0.43 -0.01
Venezuelan Light & MediumNorth America 0.62 0.39 0.14 0.21 0.08 0.16 0.06 - - 0.12 - -Europe 0.06 0.07 0.02 0.02 0.05 0.01 0.03 0.02 0.04 0.02 0.01 0.00Pacific - - - - - - - - - - - -
Venezuelan 22 API and heavier North America 0.65 0.75 0.86 0.83 0.96 0.75 0.89 0.84 0.85 0.83 0.86 -0.03Europe 0.07 0.07 0.06 0.06 0.06 0.05 0.04 0.06 0.04 0.04 0.07 -0.04Pacific - - - - - - - - - - - -
Mexican MayaNorth America 1.02 0.93 0.91 0.96 0.94 0.92 0.82 0.80 0.77 0.71 0.98 -0.27Europe 0.14 0.10 0.11 0.11 0.11 0.09 0.14 0.16 0.14 0.14 0.11 0.03Pacific - - - - - - - - - - - -
Mexican IsthmusNorth America 0.01 0.01 0.04 0.02 0.02 0.09 0.05 0.06 0.10 0.09 0.01 0.08Europe 0.01 0.01 0.02 0.02 - 0.05 0.01 - - - 0.03 -Pacific - - - - - - - - - - - -
Russian UralsNorth America 0.05 0.15 0.08 0.13 0.08 0.03 0.01 - 0.02 - 0.14 -Europe 1.81 1.72 1.80 1.86 1.88 1.71 1.76 1.65 1.85 2.00 1.99 0.01Pacific - - - - - - - - - - - -
Nigerian LightNorth America 0.68 0.54 0.60 0.64 0.64 0.58 0.62 0.67 0.44 0.57 0.60 -0.02Europe 0.29 0.32 0.34 0.29 0.31 0.49 0.40 0.44 0.34 0.27 0.34 -0.07Pacific - 0.00 - - - - 0.05 0.03 0.06 0.03 - -
Nigerian MediumNorth America 0.27 0.21 0.25 0.29 0.25 0.22 0.20 0.19 0.13 0.24 0.33 -0.09Europe 0.14 0.13 0.09 0.09 0.09 0.11 0.14 0.16 0.19 0.14 0.06 0.08Pacific - - - - - - - - - - - -
1 Data based on monthly submissions from IEA countries to the crude oil import register (in '000 bbl), subject to availability. May differ from Table 8 of the Report.
IEA North America includes United States and Canada.
IEA Europe includes all countries in OECD Europe except Hungary. The Slovak Republic and Poland is excluded through December 2007 but included thereafter.
IEA Pacific data includes Australia, New Zealand, Korea and Japan.2 Iraqi Total minus Kirkuk.
3 Iranian Total minus Iranian Light.
4 33° API and lighter (e.g., Bonny Light, Escravos, Qua Iboe and Oso Condensate).
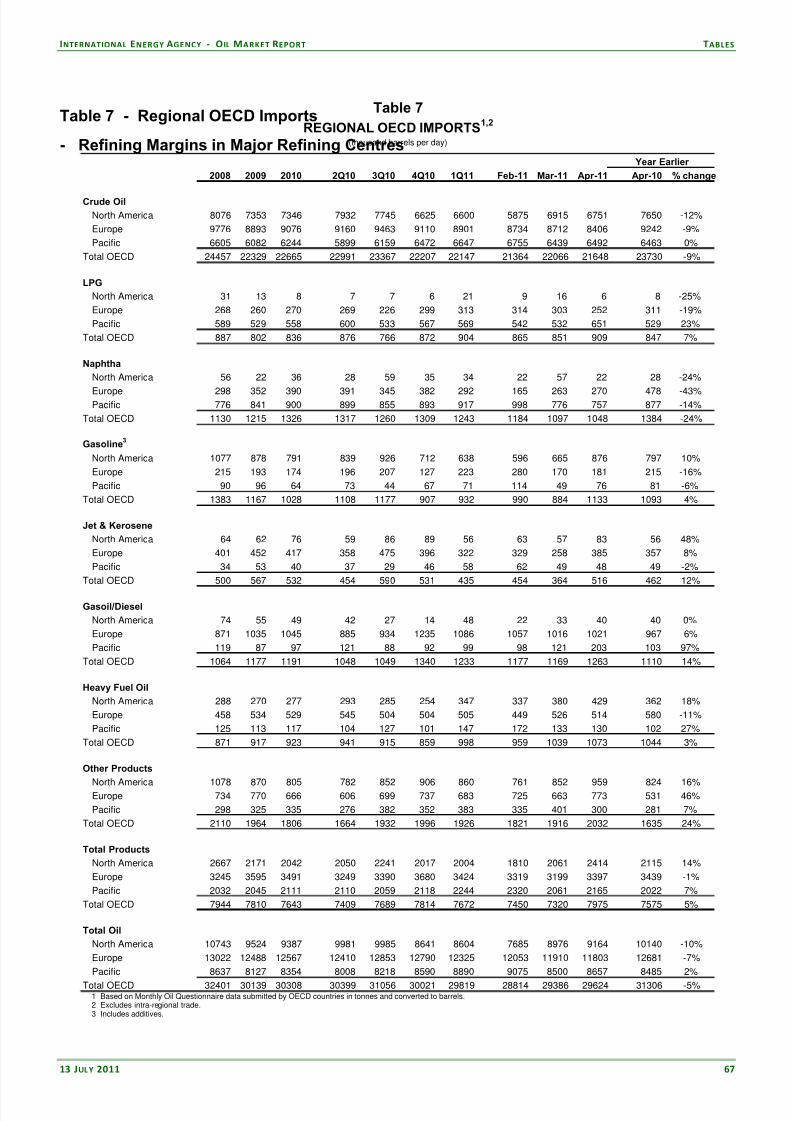
8/6/2019 IEA - Montly Oil Market Report - July 2011
http://slidepdf.com/reader/full/iea-montly-oil-market-report-july-2011 67/69
INTERNATIONAL ENERGY AGENCY ‐ O IL MARKET REPORT TABLES
13 JULY 2011 67
Table 7 - Regional OECD Imports
- Refining Margins in Major Refining Centres
Table 7
REGIONAL OECD IMPORTS1,2
(thousand barrels per day)
Year Earlier
2008 2009 2010 2Q10 3Q10 4Q10 1Q11 Feb-11 Mar-11 Apr-11 Apr-10 % change
Crude Oil
North America 8076 7353 7346 7932 7745 6625 6600 5875 6915 6751 7650 -12%
Europe 9776 8893 9076 9160 9463 9110 8901 8734 8712 8406 9242 -9%
Pacific 6605 6082 6244 5899 6159 6472 6647 6755 6439 6492 6463 0%
Total OECD 24457 22329 22665 22991 23367 22207 22147 21364 22066 21648 23730 -9%
LPG
North America 31 13 8 7 7 6 21 9 16 6 8 -25%
Europe 268 260 270 269 226 299 313 314 303 252 311 -19%
Pacific 589 529 558 600 533 567 569 542 532 651 529 23%
Total OECD 887 802 836 876 766 872 904 865 851 909 847 7%
Naphtha
North America 56 22 36 28 59 35 34 22 57 22 28 -24%
Europe 298 352 390 391 345 382 292 165 263 270 478 -43%Pacific 776 841 900 899 855 893 917 998 776 757 877 -14%
Total OECD 1130 1215 1326 1317 1260 1309 1243 1184 1097 1048 1384 -24%
Gasoline3
North America 1077 878 791 839 926 712 638 596 665 876 797 10%
Europe 215 193 174 196 207 127 223 280 170 181 215 -16%
Pacific 90 96 64 73 44 67 71 114 49 76 81 -6%
Total OECD 1383 1167 1028 1108 1177 907 932 990 884 1133 1093 4%
Jet & Kerosene
North America 64 62 76 59 86 89 56 63 57 83 56 48%
Europe 401 452 417 358 475 396 322 329 258 385 357 8%
Pacific 34 53 40 37 29 46 58 62 49 48 49 -2%
Total OECD 500 567 532 454 590 531 435 454 364 516 462 12%
Gasoil/Diesel
North America 74 55 49 42 27 14 48 22 33 40 40 0%
Europe 871 1035 1045 885 934 1235 1086 1057 1016 1021 967 6%
Pacific 119 87 97 121 88 92 99 98 121 203 103 97%
Total OECD 1064 1177 1191 1048 1049 1340 1233 1177 1169 1263 1110 14%
Heavy Fuel Oil
North America 288 270 277 293 285 254 347 337 380 429 362 18%
Europe 458 534 529 545 504 504 505 449 526 514 580 -11%
Pacific 125 113 117 104 127 101 147 172 133 130 102 27%
Total OECD 871 917 923 941 915 859 998 959 1039 1073 1044 3%
Other Products
North America 1078 870 805 782 852 906 860 761 852 959 824 16%Europe 734 770 666 606 699 737 683 725 663 773 531 46%
Pacific 298 325 335 276 382 352 383 335 401 300 281 7%
Total OECD 2110 1964 1806 1664 1932 1996 1926 1821 1916 2032 1635 24%
Total Products
North America 2667 2171 2042 2050 2241 2017 2004 1810 2061 2414 2115 14%
Europe 3245 3595 3491 3249 3390 3680 3424 3319 3199 3397 3439 -1%
Pacific 2032 2045 2111 2110 2059 2118 2244 2320 2061 2165 2022 7%
Total OECD 7944 7810 7643 7409 7689 7814 7672 7450 7320 7975 7575 5%
Total Oil
North America 10743 9524 9387 9981 9985 8641 8604 7685 8976 9164 10140 -10%
Europe 13022 12488 12567 12410 12853 12790 12325 12053 11910 11803 12681 -7%
Pacific 8637 8127 8354 8008 8218 8590 8890 9075 8500 8657 8485 2%
Total OECD 32401 30139 30308 30399 31056 30021 29819 28814 29386 29624 31306 -5%1 Based on Monthly Oil Questionnaire data submitted by OECD countries in tonnes and converted to barrels.2 Excludes intra-regional trade.3 Includes additives.

8/6/2019 IEA - Montly Oil Market Report - July 2011
http://slidepdf.com/reader/full/iea-montly-oil-market-report-july-2011 68/69
© © OOEECCDD / /IIEEAA 22001111.. AAllll RRiigghhttss RReesseer r vveedd
The International Energy Agency (IEA) makes every attempt to ensure, but does not guarantee, the accuracy and completeness of the information or the clarity
of content of the Oil Market Report (hereafter the OMR). The IEA shall not be
liable to any party for any inaccuracy, error or omission contained or provided in
this OMR or for any loss, or damage, whether or not due to reliance placed by
that party on information in this OMR.
The Executive Director and Secretariat of the IEA are responsible for the
publication of the OMR. Although some of the data are supplied by IEA
Member‐country governments, largely on the basis of information they in turn
receive from oil companies, neither these governments nor these oil companies necessarily share the Secretariat’s views or conclusions as expressed in the
OMR. The OMR is prepared for general circulation and is distributed for general information only. Neither the information nor any opinion expressed in the
OMR constitutes an offer, or an invitation to make an offer, to buy or sell any
securities or any options, futures or other derivatives related to such securities.
This OMR is the copyright of the OECD/IEA and is subject to terms and conditions of use. These terms and conditions are available on the IEA website at http://www.iea.org/oilmar/licenceomr.html. In relation to the Subscriber Edition (as defined in the OMR's online terms and conditions), all Platts information is sourced from © 2011 Platts and is published here with the
permission of Platts – a division of The McGraw‐Hill Companies, Inc. The spot crude and product price assessments are based on daily Platts prices, converted
when appropriate to US$ per barrel according to the Platts specification of products. The graphs marked ‘Data Source: Platts analysis’ are also based on
Platts data. Any reproduction of information from the spot crude and product price tables, or of the graphs marked ‘Data Source: Platts analysis’ requires the
prior permission of Platts.

8/6/2019 IEA - Montly Oil Market Report - July 2011
http://slidepdf.com/reader/full/iea-montly-oil-market-report-july-2011 69/69
Editorial Enquiries
Editor David FyfeHead, Oil Industry and Markets Division (+33) 0*1 40 57 65 90
Demand Eduardo Lopez (+33) 0*1 40 57 65 93
Michael Waldron (+33) 0*1 40 57 66 18
OPEC Supply/Prices Diane Munro
(+33) 0*1 40 57 65 94
Non-OPEC Supply Julius Walker (+33) 0*1 40 57 65 22
julius.walker @iea.org
Oil Price Formation Bahattin Buyuksahin (+33) 0*1 40 57 67 18
Refining Toril Bosoni (+33) 0*1 40 57 67 18
OECD Stocks/Statistics Martina Repikova (+33) 0*1 40 57 67 16
Statistics /Trade/Freight Andrew Wilson (+33) 0*1 40 57 66 78
Editorial Assistant Esther Ha
(+33) 0*
1 40 57 65 96 [email protected]
Fax: (+33) 0*1 40 57 65 99* 0 - only within France
Media Enquiries
IEA Press Office (+33) 0* 1 40 57 65 54
User’s Guide and Glossary to the IEA Oil Market Report
For information on the data sources, definitions, technical terms and general approach used in preparing
the Oil Market Report (OMR) Medium-Term Oil and Gas Markets (MTOGM)and Annual Statistical Supplement
Subscription and Delivery Enquiries
Oil Market Report SubscriptionsInternational Energy Agency
BP 586-75726 PARIS Cedex 15, France (+33) 0*
1 40 57 67 72 [email protected] (+33) 0* 1 40 57 66 90