ids-research.wikispaces.comids-research.wikispaces.com/.../chapter+1-5-edited1.docx · web...
TRANSCRIPT

CHAPTER I
INTRODUCTION
A. Background of the Study
Through the years, garbage has influenced people’s lives. They have affected our
world in a small way, yet brought significant outcomes. Indeed they have become a huge
part of our everyday lives. As time passes by, the problem brought by this rubbish
becomes worse.
Recycling (process in which wastes are reused) is the solution for this problem.
This process reclaims the original material and uses it in new products. There are so
many things that can be recycled-either biodegradable or not. Example of these materials
is one of the people’s common excess or trash: crab shells. Aside from its use in the
kitchen these crabs have far more use than people have imagined.
Crabs comprise about 4,500 species of Arthropods in the order Decapoda, class
crustacean. Most crabs feed on small fishes or worms or else scavenge along the shore or
sea bottom. They help in cleaning our bodies of water. Here in the Philippines, crabs are
often used mostly in cooking.
Like almost all varieties of shells, crab shells are composed of almost 95%
Calcium Carbonate. A main component of seashells, shells of snails, oyster shells, crab

2
shells and others, is a chemical compound which is calcium carbonate, which is believed
to be a potential pH buffer.
Buffer solutions contain a weak acid and a conjugate base, or a weak base and a
conjugate acid. It has a remarkable property of resisting to drastic change in its pH level
even though a strong acid or base is added.
B. Statement of the Problem
This study focuses on the evaluation of crushed crab shells as a potential pH
buffer.
Sub-problems:
1. What is the characteristic of the experimental buffer in terms of:
a) Buffer pH; and
b) Buffer capacity?
2. What is the effectiveness of the experimental pH buffer when compared to water
upon the addition of:
a) Weak acid
b) Weak base?
3. In which type of substance (weak acid or weak base) is the experimental buffer
most effective?
4. Is there a significant difference between the trend of the pH changes of
experimental buffer and water upon the addition of:
a) Weak acid
b) Weak base?

3
C. Hypothesis
There is no significant difference between the trend of the pH changes of
experimental buffer and water upon the addition of either weak acid or weak base.
D. Objectives of the Study
This study generally aims to produce a pH buffer from crushed crab shells. It also
aims to:
1. Determine which substance does the experimental buffer have the most effect.
2. Compare the changes of pH level of water and the experimental buffer.
E. Significance of the Study
Crab shells are one of the many household garbage if not disposed properly will
threaten the ecology. Crab shells have a lot of calcium carbonate which have many uses
in the environment, and one of it is the feasibility of being a pH buffer. A buffer resists
to any drastic change in the substance’s pH level. A very good example of buffer is our
blood, which is buffered by a bicarbonate-carbonic acid buffer. As we know, the drinks
like fruit juices that we drink are very acidic but because our blood is a pH buffer, our
blood doesn’t lower its pH value that low. Our blood’s normal pH level ranges from
7.35-7.45. But once our blood’s pH level drops below 7.35 or rises above 7.45, it will
cause acidosis or alkalosis respectively. Beyond the range of 6.8-7.8, it will cause death.
Industrially, buffer solutions are used in fermentation processes and in setting the correct
conditions for dyes used in coloring fabrics. They are also used in chemical analysis and
calibration of pH meters.

4
Furthermore, nowadays buffers are slowly known because of the rapid change in
our environments nature, such as formation of acid rain. Acid rain comes from the
accumulation of acids and toxic substances resulting from human activities such as
burning of fossil-fuels. Precipitation that has a pH value of less than 5.6 is considered to
be abnormally acidic. The pH of soil is critical to the health of vegetation and soil
microorganisms.
The feasibility of creating experimental pH buffers from the shell of the crab is
just a first step in saving mother earth. Recycling should not be just done often but it
should be made a habit so that everybody can help saving our slowly changing planet.
People in areas which are very affected with acid rains will find crab shells
helpful. The availability of nutrients in the soil for their vegetations would be more/less
maintained because of the less change in the pH level of the soil.
F. Scope and Limitations
This study focuses on determining the potential of crushed crab shells as pH
buffer to weak acids and weak bases. This study focuses only on blue crabs (Callinectes
sapidus) shells and not on other potential components. The comparison in the changes in
pH of the experimental buffer and that of distilled waters upon every addition of weak
acid or weak base was monitored. The experimental buffer was tested on both dilute
vinegar (pH=4.23) and dilute ammonia (pH=10.83). Tests on elements, compounds, and
living organisms were not included in this study. The test for pH which used a digital pH
meter and the whole experimentation process was done at the chemistry laboratory of
MSU-IIT Integrated Developmental School during the school year 2011 – 2012.

5
G. Definition of Terms
Calcium Carbonate It is a component of animal shells and is believed to
be a potential pH buffer. For this study, source is
from crab shells.
Buffer It is a substance that has the ability to change pH
very little when a small amount of strong or weak
acid or base is added to it. For this study, it refers
to the solution with crushed crab shells.
Buffer capacity It is the maximum amount of either diluted vinegar
or diluted ammonia that can be added before a
significant change in the pH will occur.
Buffer pH It is the resulting sample pH of to the buffer
solution. In this study, it refers to the pH of the
solution with crushed crab shells.
Experimental Buffer This refers to the solution with 100mL of distilled
water as solvent and 0.5 grams of crushed crab
shells as solute.
pH It is the measure of acidity or basicity, with lower
numbers indicate it is more acidic and higher
numbers indicate it is more basic. It this study, it
refers to the reading measured by a digital pH
meter.

6

CHAPTER II
REVIEW OF RELATED LITERATURE AND STUDIES
The pH concept was developed in 1909 by Soren Peder Lauritz Sorensen, a
Danish biochemist in Carlsberg Laboratory. It was revised to the modern pH in 1924
after it became apparent that electromotive force in cells depends on activity rather than
concentration of hydrogen ions. The pH concept is a convenient method of expressing
hydrogen ion concentration, which in other term the acidity or basicity of a substance.
(Mendoza & Religioso, 1997)
By definition,
pH= -log [H+] (1)
Figure 1. A pH scale Source: http://www.elmhurst.edu/~chm/vchembook/184ph.html

8
The pH of soil determines the availability of nutrients to plants. When acid rain
infiltrates the soil, important nutrients are leached away from the soil through runoff, into
the bodies of water or other aquatic habitats.
The pH scale ranges from 0-14 as shown in Figure 1. A neutral solution like
water has a pH equal to 7. A pH value lower than 7, means that the solution is acidic,
while a pH value higher than 7, means that the solution is alkaline or basic. The pH
measurements are important in medicine, biology, chemistry, agriculture, forestry, food
science, environmental science, oceanography, civil engineering and many other
applications. Some pH values of common substances are shown in Table 1. (Mendoza &
Religioso, 1997)
Table 1. The pH value of common substancesSubstance pH Substance pH
Hydrochloric acid 0 Urine 6.1Gastric juice 1.6-1.8 Milk 6.3-6.6Kalamansi 2.2 Blood 7.4
Vinegar 2.4-3.4 Baking soda 9Apple 3.0 Detergent 9.5-10.5
Carbonated drink 3.1 Ammonia 11Orange 3.5 Bleaching powder 12Tomato 4.2 NaOH 14
Source: Mendoza & Religioso, 1997
A way to measure the pH of a liquid is the use of pH Meter. It consists of a
special measuring probe (a glass electrode) connected to an electronic meter that
measures and displays the pH reading.
Another way to determine pH of solutions visually is by the use of pH indicators,
a halochromic solution. It causes the color of the solution to change depending on the pH
value. There are known natural indicators extracted from red cabbage, violets, roses,

9
camote tops, red apple skin, beets, cherries, red onion, yellow onion, radish skin, tomato
and turnip skin. Examples of common indicators are shown in Table 2.
Table 2. Common Indicators
Indicator pH at which Color Changes
Color at Lower pH
Color at higher pH
Methyl Orange 4 Red YellowMethyl Red 5 Red Yellow
Litmus 7 Red YellowPhenolphthalein 9 Colorless RedThymophthalei
n 10 Colorless Blue
Alizarin yellow 11 Yellow RedSource: Mendoza & Religioso, 1997
Nature has a way of maintaining constancy. The pH of biological fluids is
maintained by buffers. A buffer solution is an aqueous solution containing a weak acid
and its conjugate base, or a weak base and its conjugate acid. It has a remarkable property
of maintaining almost constant pH even though a strong acid or base is added to the
solution.
Acid-base buffers confer resistance to a change in the pH of a solution when hy-
drogen ions (protons) or hydroxide ions are added or removed. An acid-base buffer typi-
cally consists of a weak acid, and its conjugate base (salt) as seen in Equation 2. HA and
A- are generic symbols for an acid and its deprotonated form, the conjugate base.
(2)
Buffers work because the concentrations of the weak acid and its salt are large
compared to the amount of protons or hydroxide ions added or removed. When protons
are added to the solution from an external source, some of the base component of the buf-

10
fer is converted to the weak-acid component (thus using up most of the protons added);
when hydroxide ions are added to the solution (or, equivalently, protons are removed
from the solution), protons are dissociated from some of the weak-acid molecules of the
buffer, converting them to the base of the buffer (and thus replenishing most of the pro-
tons removed). However, the change in acid and base concentrations is small relative to
the amounts of these species present in solution. Hence, the ratio of acid to base changes
only slightly. Thus, the effect on the pH of the solution is small, within certain limitations
on the amount of H+ or OH- added or removed.
By far the most important buffer for maintaining acid-base balance in the blood is
the carbonic-acid-bicarbonate buffer. The simultaneous equilibrium reactions of interest
are
(3)
To more clearly show the two equilibrium reactions in the carbonic-acid-bicar-
bonate buffer, Equation 3 is rewritten to show the direct involvement of water:
(4)
The equilibrium on the left is an acid-base reaction that is written in the reverse
format from Equation 2. Carbonic acid (H2CO3) is the acid and water is the base. The
conjugate base for H2CO3 is HCO3- (bicarbonate ion). Carbonic acid also dissociates
rapidly to produce water and carbon dioxide, as shown in the equilibrium on the right of
Equation 4. This second process is not an acid-base reaction, but it is important to the
blood's buffering capacity, as seen from Equation 5.

11
(5)
Equation 5 is in a similar form to the Henderson-Hasselbach equation, an equa-
tion that relates pH to pKa of a weak acid and its conjugate base. Equation 5, does not
meet the strict definition of a Henderson-Hasselbach equation, because this equation
takes into account a non-acid-base reaction (i.e., the dissociation of carbonic acid to car-
bon dioxide and water), and the ratio in parentheses is not the concentration ratio of the
acid to the conjugate base. However, the relationship shown in Equation 5 is frequently
referred to as the Henderson-Hasselbach equation for the buffer in physiological applica-
tions.
In Equation 5, pK is equal to the negative log of the equilibrium constant, K, for
the buffer (Equation 6).
where K=Ka/K2 (from Equation 4)(6)
This quantity provides an indication of the degree to which HCO3- reacts with
H+ (or with H3O+ as written in Equation 4) to form H2CO3, and subsequently to form
CO2 and H2O. In the case of the carbonic-acid-bicarbonate buffer, pK=6.1 at normal body
temperature.
As shown in Equation 5, the pH of the buffered solution (i.e., the blood) is depen-
dent only on the ratio of the amount of CO2 present in the blood to the amount
of HCO3- (bicarbonate ion) present in the blood (at a given temperature, so that pK re-
mains constant). This ratio remains relatively constant, because the concentrations of
both buffer components (HCO3- and CO2) are very large, compared to the amount of
H+ added to the blood during normal activities and moderate exercise. When H+ is added

12
to the blood as a result of metabolic processes, the amount of HCO3- (relative to the
amount of CO2) decreases; however, the amount of the change is tiny compared to the
amount of HCO3- present in the blood. This optimal buffering occurs when the pH is
within approximately 1 pH unit from the pK value for the buffering system, i.e., when the
pH is between 5.1 and 7.1.
However, the normal blood pH of 7.4 is outside the optimal buffering range;
therefore, the addition of protons to the blood due to strenuous exercise may be too great
for the buffer alone to effectively control the pH of the blood. When this happens, other
organs must help control the amounts of CO2 and HCO3- in the blood. The lungs remove
excess CO2 from the blood (helping to raise the pH via shifts in the equilibria in Equation
4), and the kidneys remove excess HCO3- from the body (helping to lower the pH). The
lungs' removal of CO2 from the blood is somewhat impeded during exercise when the
heart rate is very rapid; the blood is pumped through the capillaries very quickly, and so
there is little time in the lungs for carbon dioxide to be exchanged for oxygen. The ways
in which these three organs help to control the blood pH through the bicarbonate buffer
system are highlighted in Figure 2, below. (Casiday & Fay, 1999)
Figure 2. This figure shows the major organs that help control the blood concentrations of CO2 and HCO3
-, and thus help control the pH of the blood. Removing CO2 from the blood helps increase the pH. Removing HCO3
- from the blood helps lower the pH.

13
Two important characteristics of a buffer are its capacity and its effective pH
range. Buffer capacity is the amount of acid or base the buffer can neutralize before the
pH begins to change to an appreciable degree. The buffer capacity depends on the
amount of acid and base from which the buffer is made. The pH of the buffer depends on
the Ka for the acid and on the relative concentrations of the acid and base that comprise
the buffer. For example, [H+] for a 1-L that is 1M in acetic acid and 1M in sodium
acetate will be the same as for 1-L solution that is 0.1M acetic acid and 0.1M in sodium
acetate using Henderson-Hasselbach equation. However, the first solution has a greater
buffering capacity, because it contains more acetic acid and acetate. The greater the
amount of the conjugate acid-base pair, the more resistant is the ratio of their
concentrations, and hence the pH, is to change.
The pH range of any buffers is the pH range over which the buffer acts
effectively. Buffers most effectively resist s change in pH in either when the
concentrations of weak acid and conjugate base are about the same. According to
Henderson-Hasselbach equation, when the concentrations of weak acid ad conjugate base
are equal, pH = pKa. This relationship gives the optimal pH of any buffer. Thus, we
usually try to select a buffer whose acid form has a pKa close to the desired pH. In
practice, we find that if the concentration of one component of the buffer is more than 10
times the concentration of the other component, the buffering action is poor. Because log
10 = 1, buffers usually have a usuable range within ± pH unit of pKa (that is, a range of
pH = pKa ± 1) (Brown, et.al, 2009)

14
A study in 2008 conducted by Barrientos, Ponciano & Tan, which formulated an
antacid instead of pH buffer with the use of crushed oyster shells, is similar to this study
only that this study made use of crushed crab shells.
Calcium carbonate, (CaCO3), which is one of the most widespread minerals, is
believed to be a potential pH buffer. It is the chief constituent of limestone and marble,
and is also the main component of the shells of marine organisms, snails, pearls, and
eggshells. Utilization of this compound for the formulation of blackboard chalk is
common. Another common utilization of calcium carbonate is when it is used
medicinally as a calcium supplement or as an antacid, but excessive consumption can be
hazardous. It is stable as a solid and water has less sufficient solvating capability to cause
the ions to separate and come into solution. Law of polar and ionic compounds supports
the solubility of CaCO3 in water. (Vivian Corry & Christopher Cooper. (1980)
Calcium carbonate shares the typical properties of other carbonates. Notably, it reacts
with strong acids, releasing carbon dioxide in the following reaction below
CaCO3(s) + 2 HCl(aq) CaCl2(aq) + CO2(g) + H2O(l) (7)
It releases carbon dioxide on heating (to above 840°C in the case of CaCO3), to form cal-
cium oxide, commonly called quicklime, with reaction enthalpy 178 kJ / mole as shown
in the reaction below.
CaCO3 CaO + CO2 (8)
Calcium carbonate will react with water that is saturated with carbon dioxide to form the
soluble calcium bicarbonate in the following reaction.

15
CaCO3 + CO2 + H2O Ca(HCO3)2 (9)
This reaction is important in the erosion of carbonate rocks, forming caverns, and leads to
hard water in many regions (“Calcium carbonate”, n.d.).
Like any other marine organism with shells, crabs, which are crustaceans
characterized by a hard crust or shell, have shells comprised almost 95% of CaC O3.
They have as many as 19 pairs of appendages with five pairs of which are developed into
walking legs. Their size ranges from a pea crab, which is may be less than 1.5 millimeter
from leg tip to leg tip, to the Japanese spider crab, which is may be 3.5 meters from leg
tip to leg tip. (Barrientos, Ponciano & Tan, 2008)
Crabs, as a part of the phylum Anthropoda in class Crustacea, are usually valued
food to many. They feed on animal and vegetable garbage themselves. Without them, the
sea would become polluted and clogged with the decaying animal and vegetable matter
that they normally eat. Crabs’ gender and age could also be determined by their physical
appearances. Table 3 defines the gender and age of blue crabs (Callinectes sapidus).

16
Table 3. Crab’s gender and age
The male crab, or jimmy, has blue claws and an underside "apron" which looks like an upside-down T or the "Washington Monument." Large male crabs are also called channelers.
The she-crab or immature female crab has an inverted V-shaped apron. Females have orange tipped claws.
A mature female has a widened apron with a semicircular bell shape that looks like the U.S. Capitol building.
She is called a sook. A Sponge Crab is a female that has an egg mass that looks like an orange sponge on her belly. Let these go, so there will be many productive crab harvests in the future.
(http://skipjack.net/le_shore/crab/crab_ages.htm, Identifying Crab Gender and Age)
Here in the Philippines, more people recognize crabs as a yummy recipe than a
very helpful animal to our bodies of water. No matter how challenging it is to open and
collect the meat in it, Filipinos always have this dish in most occasions. Some cook it as
“Rellenong Alimango”, some as “Crab Meat with Cauliflowers” and some as “Chilli
Crabs”, but what happens after satisfying their tummies? People throw it. Such a waste,
isn’t it? (“Crab Recipes”, 2010)

17
The fate of these forlorn crab shells will be changed from being zero to hero.
Many tried to help on this mission. One study conducted by Arocha (2009) turned crab
shells into a chalk. The products were evaluated in terms of color, texture, and writability.
And the results were that the color and texture were rated excellent, while for the
writability was rated as good in the three samples.
Another study conducted by Jutba (2007), determined the effect of recycled crab
shell unto hardness of exoskeleton of pre-molt mud crabs (Scylla serrata). It showed that
the recycled shell diet was made to harden the exoskeleton of old crabs since young crabs
need to molt in order to grow. According to the study, crab industries can feed the weak
crabs using the recycled shell diet and prevent them (crabs) to molt so as to be sold.
While a study conducted by Barrientos, Ponciano & Tan (2008) formulated a
experimental buffer using crushed oyster shells. It turned out that the buffer was found
out to be an antacid because it was very effective to acid than base.
This study focused on crab shells as potential buffer where crab shells were
processed into a very useful solution, not only a solution that is a mixture of a solute and
a solvent, but also a solution that could lessen the problem caused by irresponsible
disposal of crab shells.

CHAPTER III
METHODOLOGY
A. Research Design
This employs experimental research design to verify the potential of crushed crab
shells as buffer solution. The study determined the potential of crushed crab shells as a
buffer solution. Solutions were prepared under constant volume of water at 100
milliliters and constant amount of crushed crab shells at 0.5 grams.
Its potential as buffer were tested on dilute ammonia (pH= 10.83) and dilute
vinegar (pH=4.23). The pH change of each sample of experimental buffer and the water
after a weak base or a weak acid is added, were measured using a digital pH meter.
Changes in pH in each set-up determine the crushed crab shells' potential as buffer.
B. Materials and Equipments
Materials
Crab Shells
Beakers
Distilled Water
Graduated cylinder
Filter funnel & paper
Mortar and pestle
Teaspoons
Tissue
Stirring rod
Wash bottle

19
Equipment
Digital pH meter
Analytical balance
Chemicals
Vinegar
Ammonia
C. General Procedures:
Preparation of Materials
Crabs were bought at the Pala-o Market then their shells were collected.
Ammonia was provided by the IDS Chemistry Laboratory while the vinegar was
provided by the researchers. Each chemical was diluted with distilled water until each
pH are equal at 10.83 and 4.23 for the ammonia and vinegar, respectively.
Crushing Crab Shells
For the crushing of the shells to be easier, dry the crab shells first then remove the
thin transparent membrane attached to the inner part of the shells that helps hold the shell
together. Use mortar and pestle to crush the crabs into powder like particle size.
Preparation of Experimental Buffer Solutions
Distilled water was used as solvent and crushed crab shells as solute. One
hundred milliliters of distilled water was measured using a graduated cylinder while 0.5
grams of crushed crab shells were weighed using an analytical balance. The crushed crab
shells were then dissolved in the distilled water. It was then filtered using a filter paper to
remove undissolved particles. Two sets were prepared for acid and base treatment for
each set-up (experimental and control).

20
Determination of pH level
The pH of the different samples of experimental pH buffer was initially measured
using digital pH meter. Each experimental buffer were then be subjected to two test
substances, weak acid and weak base. The test substances were added drop by drop to
each samples of experimental buffer. After the 15th drop, diluted ammonia or diluted
vinegar were added by milliliter. The medicine dropper that was used has a calibration of
15 drops per milliliter. After every drop/ mL added, the experimental buffer was stirred
thoroughly, allowed to settle for some time, then the pH level was measured using the
digital pH meter. Addition of the test substances were stopped until there is a notably big
difference in its pH, this signals that the buffer has reached its limit or buffer capacity.
Total amount of test substances used were recorded.
D. Statistical Tools for Data Analysis
The data gathered were analyzed and interpreted using appropriate tools. The
statistical tool used was the Z-test paired observation to compare the changes in pH level
between water and the solution after every addition of weak base or weak acid.
Z-test
Z=( x1−x2 )−(µ1−µ2)
√ δ 12
n1+√ δ2
2
n2
Where x = actual mean = hypothesized mean = the standard deviation for the resulting pH n = number of samples

21
Figure 3 Flowchart
Use of statistical tool to summarize data
Data gathering
Determination of pH level
Calibration of pH meter
Preparation of experimental buffer solution
Preparation of Materials

CHAPTER IV
RESULTS AND DISCUSSION
This chapter presents the output of the data gathered in assessing the potential of
crushed crab shells as a buffer.
Two sets of crushed crab shells added with distilled water were prepared. One
was added with weak acid and the other one with weak base. The weak acid used was
diluted vinegar which has a pH of 4.23 while the weak base we used was diluted
ammonia which has a pH of 10.83. The volume of both water and experimental buffer
were kept constant at 100 mL. Initial pH and pH changes after every addition of weak
acid or weak base were recorded.
For the solubility of the crushed crab shells in distilled water, not much of the
crab shells were dissolved in the distilled water ( 0.2 g/ 100 mL) despite very fine
particle size. Some particles settled at the bottom of the beaker. This is probably because
calcium carbonate will react with water that is saturated with carbon dioxide to form the
soluble calcium bicarbonate. Since distilled water used is most likely not saturated with
carbon dioxide, only few crushed crab shells were dissolved.
However, despite the low solubility of the crushed crab shells, it still showed
potential as a buffer compared to pure distilled water only. Results of the pH changes are
shown in Table 4.

23
Table 4. The Average pH Changes of Water and Experimental Buffer
VOLUMEADDED
pH VALUES UPON ADDITION OFBASE ACID
WATER EXPERIMENTAL BUFFER WATER EXPERIMENTAL
BUFFER0 7.30 9.86 7.32 9.871 drop 8.41 9.88 7.17 9.861mL 9.91 9.98 6.30 9.722mL 10.07 10.04 6.10 9.643mL 10.15 10.06 5.98 9.624mL 10.24 10.09 5.89 9.595mL 10.31 10.11 5.81 9.5610mL 10.40 10.19 5.50 9.4815mL 10.44 10.24 5.32 9.4320mL 10.50 10.28 5.23 9.38
Table 4 records of the changes in pH level of water and the experimental buffer
when added with dilute ammonia (pH = 10.83) and dilute vinegar (pH = 4.23). On the
first drop of the base and acid on the water, the change was drastic; it changed by 15.21%
and 2.05% respectively. While for the experimental buffer, the change was minimal by
only 0.20% upon addition of weak base and 0.10% upon addition of weak acid. As few
drops of dilute ammonia were added, the changes of the pH level of water were relatively
big compared to the changes of the solution. Overall, the solution’s changes in pH level
were consistently small while the changes in pH level of the water were inconsistent,
some were big and some were small. The overall change in pH level of water upon
addition of 20 mL weak base was from 7.30 to 10.51 while on the experimental buffer, it
was from 9.86 to 10.29. The experimental buffer changed by 4.36% ([H+] = 8.68 x 10-
11M) while the water changed by 43.97% ([H+] = 5.01 x 10⁻⁸M). On the addition of 20
mL weak acid, the overall pH change of the water was from 7.32 to 5.22 while that of
experimental buffer is from 9.87 to 9.37. The experimental buffer changed by 5.07%
([H+] = 2.92 x 10⁻¹⁰M) while the water changed by 28.70% ([H+] = 5.98 x 10⁻⁶M).

24
Figure 3 shows the difference of the initial pH level and the final pH level of both
water and the solution after the addition of drops/mL of diluted ammonia. The blue-line
marks the changes in pH level of the solution in every addition of the weak base and the
green-line for the water. It shows that water had a higher change in pH level than the
experimental buffer. The pH level of water rose by 3.21 while the solution’s pH level
rose by 0.43 after adding 315 drops/ 21 mL of diluted ammonia.
0 2 4 6 8 10 12 14 30 60 90120
150180
210240
270300
0
0.5
1
1.5
2
2.5
3
3.5
Changes in pH Level
solutionwater
No. of drops
Diffe
renc
e of
fina
l pH
and
initi
al p
H
Figure 4. Changes in pH Level of Water and Experimental Buffer After The Addition of Weak Base (ammonia)
25
Figure 4 shows the difference of the final pH level and the pH level of both water
and the experimental buffer after the addition of drops/mL of diluted vinegar. The
maroon-line marks the changes in pH level of the experimental buffer in every addition
of the weak acid and the blue-line for the water. It shows that water had a higher change
in pH level than the experimental buffer. The pH level of water dropped by 2.10 while
the experimental buffer’s pH level dropped by 0.5 after adding 315 drops/ 21 mL of
diluted vinegar.
1 4 7 10 13 30 75120
165210
255300
0
0.5
1
1.5
2
2.5
Changes in pH level
waterexperimental buffer
No. of drops
Diffe
renc
e of
fina
l pH
and
initi
al p
H
Figure 5. Changes in pH Level of Water and Experimental Buffer After The Addition of Weak Acid (vinegar)
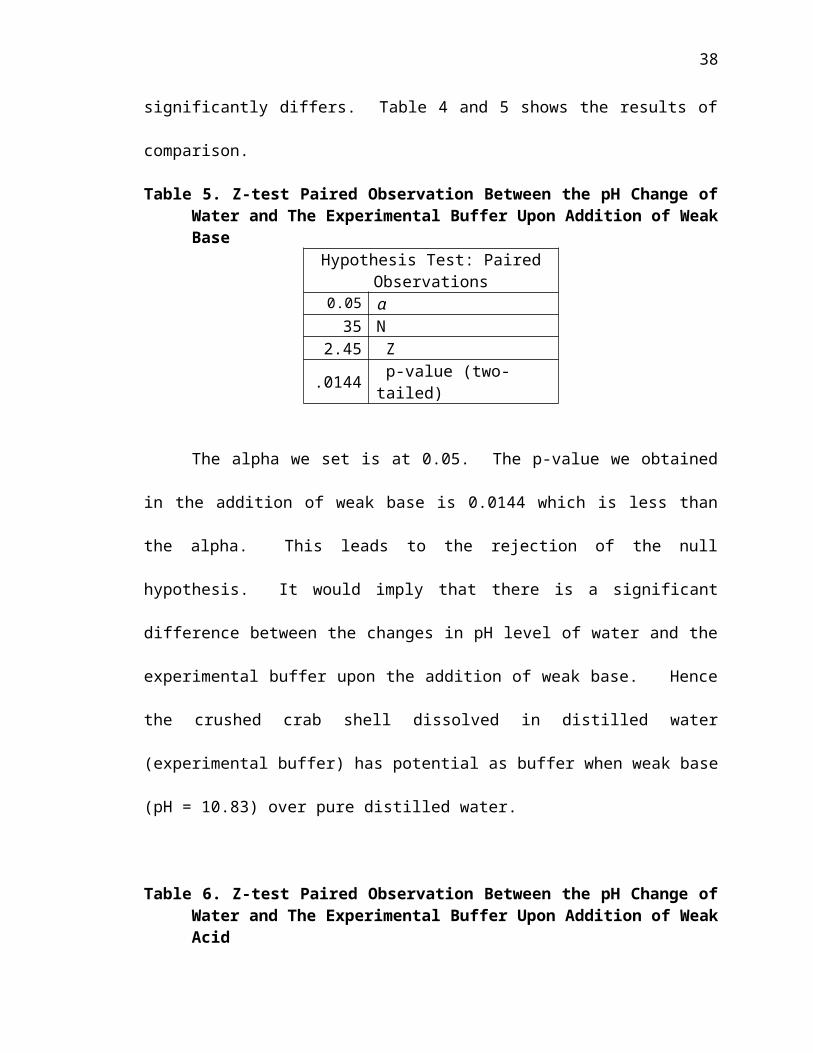
The pH changes between that of distilled water and experimental buffer upon
addition of weak base and weak acid were then statistically compared to verify if it
significantly differs. Table 4 and 5 shows the results of comparison.

26
Table 5. Z-test Paired Observation Between the pH Change of Water and The Experimental Buffer Upon Addition of Weak Base
Hypothesis Test: Paired Observations0.05 α
35 N2.45 Z
.0144 p-value (two-tailed)
The alpha we set is at 0.05. The p-value we obtained in the addition of weak base
is 0.0144 which is less than the alpha. This leads to the rejection of the null hypothesis.
It would imply that there is a significant difference between the changes in pH level of
water and the experimental buffer upon the addition of weak base. Hence the crushed
crab shell dissolved in distilled water (experimental buffer) has potential as buffer when
weak base (pH = 10.83) over pure distilled water.
Table 6. Z-test Paired Observation Between the pH Change of Water and The Experimental Buffer Upon Addition of Weak Acid
Hypothesis Test: Paired Observations0.05 α
35 N7.86 Z
3.77 x 10⁻¹⁵ p-value (two-tailed)
The alpha we set is at 0.05. The p-value we obtained from the addition of weak
acid is 3.77 x 10⁻¹⁵, which is also less than the alpha. This leads to the rejection of the
null hypothesis. It would imply that there is a significant difference between the changes
in pH level of water and the experimental buffer upon the addition of weak acid. Hence
the crushed crab shell dissolved in distilled water (experimental buffer) has potential as
buffer when weak acid (pH = 4.23) over pure distilled water.

CHAPTER V
CONCLUSIONS AND RECOMMENDATIONS
A. Summary
The changes in pH level of distilled water and the experimental buffer (crushed
crab shells dissolved in distilled water) are determined by adding weak acid (vinegar, pH
= 4.23) or weak base (ammonia, pH = 10.83). The pH level was measured using a digital
pH meter. In every addition of drop/mL of weak base and weak acid, the change in pH
level was recorded.
For the solubility of the crushed crab shells in distilled water, not much of the
crab shells were dissolved in the distilled water ( 0.2 g/ 100 mL) despite very fine
particle size.
Overall, the solution’s changes in pH level were consistently small while the
changes in pH level of the water were inconsistent, some were big and some were small.
Upon addition of 20 mL weak base, the experimental buffer changed by 4.36% ([H+] =
8.68 x 10⁻¹¹M) while distilled water changed by 43.97% ([H+] = 5.01 x 10⁻⁸M). On the
addition of 20 mL weak acid, experimental buffer changed by 5.07% ([H+] = 2.92 x 10-
10M) while the water changed by 28.70% ([H+] = 5.98 x 10⁻⁶M).
28
Z-test paired observation was used for data analysis at the 0.05 level of
significance, which led to the rejection of the null hypothesis since the p-values obtained
from both the addition of diluted vinegar and diluted ammonia were less than the alpha.
B. Conclusions
Based on the results gathered, the following conclusions are made:
1. The crushed crab shells are potential pH buffer since changes in pH change of
the experimental buffer on the first drop were only 0.2% in the addition of
weak base and 0.1% in the addition of weak acid compared to 15. 21% and
2.05%, respectively, in distilled water.
2. The buffer capacity of the experimental buffer is definitely greater than 21 mL
of weak acid or weak base.
3. The crushed crab shells are more effective as pH buffer during addition of
weak base since the final change in pH upon addition of weak base was more
minimal than in the addition of weak acid.
4. There is a significant difference between the trend of the pH changes of exper-
imental buffer and water upon the addition of either weak acid or weak base.

29
C. Recommendations
The following are recommended to further enhance the result of this study:
1. Use other substance that could be a source of calcium carbonate and could
be a potential pH buffer.
2. Try other species or variety of crabs.
3. Test on strong base and strong acid.
4. Maximize buffer capacity determination
5. Find ways to fully dissolve the crab shells in water like increasing the tem-
perature to increase solubility or find means to saturate water with carbon
dioxide.
6. Enhance and develop the buffers appearance close to the commercially
available pH buffer.
7. Compare results of pH changes with that of commercial buffer.

REFERENCES
Books
Brown, Theodore E., H. Eugene H LeMay, Bruce E. Bursten, Catherine Murphy, Patrick Woodward (2009). Chemistry: The Central Science. 11th edition (pages 726-727). Prentice-Hall Publishing, Inc.
Campbell, Neil A., Lawrence G. Mithcell & Jane B. Reece. (2000). Biology –Concepts and Connections: International Edition © Pearson Education Asia Pte Ltd
Groiler: Encyclopedia of Knowledge (No. 5C-D) © MCMXCL Groiler Incorpo-rated
Mendoza, Estrella E. & Teresita F. Religioso. (1997). Science and Technology – Chemistry; Second Edition © Phoenix Publishing House Inc.
Vivian Corry & Christopher Cooper. (1980). New Encyclopedia of Science (No. 4, Ca-Er) © Orbis Publishing Limited
Internet
Calcium Carbonate. (n.d.). Retrieved April 3, 2012 from http://www.tutorgig.info/ed/Calcium_carbonate
Casiday, Rachel and Regina Fay (1999). Blood, Sweat and Buffers: pH Regulation During Exercise. Department of Chemistry, Washington University. St. Louis, MO 63130. Retrieved April 3, 2012 from http://www.chemistry.wustl.edu/~edudev/LabTutorials/Buffer/Buffer.html
Crab’s Gender and Age. (2010, January 11). Retrieved September 23, 2011, Website: http://skipjack.net/le_shore/crab/crab_ages.htm

31
Crab recipes. (2010, June 18). Retrieved September 23, 2011, Website: http://www.aquaticfilipinorecipes.filipinovegetarianrecipe.com/crab_recipes.htm
pH color charts. (2010, February 20). Retrieved September 23, 2011, Website: http://www.ncsu.edu/sciencejunction/depot/experiments/water/lessons/pH/
Unpublished Research
Arocha, Izel Faith Abrasaldo. (2009). Utilization of Seashells for Chalk Formulation. MSU-IIT Integrated Developmental School.
Barrientos, Yasmin Nicole A.; Ponciano, Riza O.; & Tan, Katherine R.. (2008). The Potential of Crushed Oyster Shells as a Buffer.
Jutba, Danessa Ausejo. (2007). Effect of Recycled Crab Shells Unto Hardness of Exoskeleton of Pre-Molt Mud Crabs. MSU-IIT Integrated Developmental School.

32
APPENDIX A
DOCUMENTATION
Figure 6. Preparation of Materials
Figure 8. During Experimentation 1
Figure 7. Crushing Crab Shells
Figure 9. During Experimentation 2
Figure 10. Analysis of Data

33
APPENDIX B
RAW DATA GATHERED
Table 7. The pH Changes Upon Addition of Weak Base & Weak Acid
# ofDROPS / mL
pH VALUES UPON ADDITION OFBASE ACID
WATER BUFFER WATER BUFFERO drops 7.3 9.86 7.32 9.871 drop 8.41 9.88 7.17 9.862 drops 8.60 9.88 7.07 9.853 drops 8.88 9.90 6.99 9.834 drops 9.14 9.91 6.86 9.825 drops 9.31 9.91 6.78 9.816 drops 9.56 9.92 6.70 9.797 drops 9.61 9.93 6.65 9.788 drops 9.68 9.93 6.59 9.789 drops 9.73 9.93 6.54 9.7710 drops 9.77 9.94 6.48 9.7611 drops 9.81 9.95 6.44 9.7512 drops 9.84 9.96 6.39 9.7313 drops 9.87 9.96 6.36 9.7314 drops 9.89 9.97 6.33 9.7315 drops 9.91 9.98 6.30 9.72
2 mL 10.07 10.04 6.10 9.643 mL 10.15 10.06 5.98 9.624 mL 10.24 10.09 5.89 9.595 mL 10.31 10.11 5.81 9.566 mL 10.34 10.14 5.75 9.547 mL 10.37 10.15 5.68 9.538 mL 10.39 10.16 5.60 9.519 mL 10.40 10.18 5.54 9.4910 mL 10.40 10.19 5.50 9.4811 mL 10.41 10.20 5.47 9.4712 mL 10.42 10.20 5.43 9.4513 mL 10.43 10.21 5.39 9.4514 mL 10.43 10.22 5.36 9.4415 mL 10.44 10.24 5.32 9.4316 mL 10.45 10.25 5.29 9.4117 mL 10.46 10.26 5.27 9.4018 mL 10.48 10.27 5.26 9.3919 mL 10.49 10.27 5.24 9.3820 mL 10.50 10.28 5.23 9.3821 mL 10.51 10.29 5.22 9.37

34
APPENDIX C
SAMPLE CALCULATIONS
Table 8. Z-test Paired Observation Between the pH Change of Water and The Experimental Buffer Upon Addition of Weak Base
Hypothesis Test: Paired Observations
0.00000 hypothesized value0.09171 mean w0.01229 mean b0.07943 mean difference (w - b)0.19199 std. dev.0.03245 std. Error
35 N
2.45 Z.0144 p-value (two-tailed)
Table 9. Z-test Paired Observation Between the pH Change of Water and The Experimental Buffer Upon Addition of Weak Acid
Hypothesis Test: Paired Observations
0.00000 hypothesized value0.06000 mean w0.01429 mean a0.04571 mean difference (w - a)0.03441 std. dev.0.00582 std. error
35 N
7.86 Z3.77E-15 p-value (two-tailed)

35
Table 10. Percent Change of the pH of Water and Experimental Buffer After theAddition of Weak Acid and Weak Base
pH VALUES UPON ADDITION OFWEAK ACID WEAK BASE
WATER EXPERIMENTAL BUFFER WATER EXPERIMENTAL
BUFFERINITIAL 7.32 9.87 7.3 9.861ST DROP 7.17 9.86 8.41 9.88
% CHANGE 2.05 % 0.10 % 15.21 % 0.20 %
Where
%CHANGE=| pH AFTER 1 st DROP−INITIAL pHINITIAL pH |
Table 11. Change in Hydrogen Concentration After Addition of Weak Acid andWeak Base
UPON ADDITION OFWEAK ACID WEAK BASE
WATER BUFFER WATER BUFFER
INITIALpH 7.32 9.87 7.3 9.86
[H+¿¿] 4.79 x 10⁻⁸ 1.35 x10⁻¹⁰ 5.01 x10⁻⁸ 1.38 x10⁻¹⁰
20 mLpH 5.23 9.38 10.50 10.28
[H+¿¿] 5.88 x10⁻⁶ 4.17 x 10⁻¹⁰ 3.16 x10⁻¹¹ 5.25 x10⁻¹¹
CHANGEpH 2.1 0.50 3.21 0.43
[H+¿¿] 5.98 x10⁻⁶ 2.92 x10⁻¹⁰ 5.01 x10⁻⁸ 8.68 x10⁻¹¹
Where
¿
Change in ¿

36
APPENDIX D
CALIBRATION OF pH METER
1. Press the power button on your digital pH meter to turn it on.
2. Calibrate your digital pH meter according to manufacturer's instructions. Most
calibrations will have you test two solutions on opposite ends of the pH scale. As
an example, you may submerge the probe into a solution with a pH of 4, clean it
off, then test a solution with a pH of 10.
3. Clean off the probe with distilled water once the calibration is successful, and
submerge the probe into the solution you want to be tested. Remove after getting
a reading, clean it off and test again just to be certain it was accurate the first time.
Record the result.

37
CURRICULUM VITAE
Name: Marx Caesar S. Barluado
Nickname: MC,Marx
Place of Birth: Mindanao Sanitarium Hospital, Iligan City
Date of Birth: 22 August 1996
Home Address: #0023 Dona Juana Sub Pala-O, Iligan City
Religion: Roman Catholic
Gender: Male
Father’s Name: Mr. Allen B. Barluado
Mother’s Name:Mrs. Sylbeth S. Barluado
Educational Background:
Elementary Name of School: La Salle Academy
Address: Bro. Jeffrey Raymund Road
Date of Graduation: March 20, 2009
Secondary Name of School: MSU-IIT Integrated Developmental School
Address: A. Bonifacio Ave., Brgy. Tibanga, Iligan City
Honor and Rewards Received:
Elementary Second Honors Grade 1 to Grade 5
Third Honors 6
38
CURRICULUM VITAE
Name: Mishari Rashid M. Lucman
Nickname: Teddyboy, Mish
Place of Birth: Mercy Hospital, Iligan City
Date of Birth: 17 June 1996
Home Address: 0013 Laville Subd. Tubod, Iligan City
Religion: Islam
Gender: Male
Father’s Name: Haroun Alrashid A. Lucman
Mother’s Name: Omaimah M. Lucman
Educational Background:
Elementary Name of School: La Salle Academy
Address: Raymond Jeffrey Road Villaverde, Iligan City
Date of Graduation: March 20, 2009
Secondary Name of School: MSU-IIT Integrated Developmental School
Address: A. Bonifacio Ave., Brgy. Tibanga, Iligan City
Honor and Rewards Received:
Elementary First Honors Grade 2 to Grade 6
Graduated Valedictorian
Secondary First Honors 1st yr to 3rd yr