id , maarten messagie, jelle smekens, noshin omar
TRANSCRIPT

energies
Article
Cost Projection of State of the Art Lithium-IonBatteries for Electric Vehicles Up to 2030
Gert Berckmans * ID , Maarten Messagie, Jelle Smekens, Noshin Omar, Lieselot Vanhaverbekeand Joeri Van Mierlo
MOBI Research Group, Vrije Universiteit Brussel, Pleinlaan 2, 1050 Brussels, Belgium;[email protected] (M.M.); [email protected] (J.S.); [email protected] (N.O.);[email protected] (L.V.); [email protected] (J.V.M.)* Correspondence: [email protected]; Tel.: +32-2629-3399
Academic Editor: K.T. ChauReceived: 20 July 2017; Accepted: 24 August 2017; Published: 1 September 2017
Abstract: The negative impact of the automotive industry on climate change can be tackled bychanging from fossil driven vehicles towards battery electric vehicles with no tailpipe emissions.However their adoption mainly depends on the willingness to pay for the extra cost of the tractionbattery. The goal of this paper is to predict the cost of a battery pack in 2030 when consideringtwo aspects: firstly a decade of research will ensure an improvement in material sciences alteringa battery’s chemical composition. Secondly by considering the price erosion due to the productioncost optimization, by maturing of the market and by evolving towards to a mass-manufacturingsituation. The cost of a lithium Nickel Manganese Cobalt Oxide (NMC) battery (Cathode: NMC6:2:2 ; Anode: graphite) as well as silicon based lithium-ion battery (Cathode: NMC 6:2:2 ; Anode:silicon alloy), expected to be on the market in 10 years, will be predicted to tackle the first aspect.The second aspect will be considered by combining process-based cost calculations with learningcurves, which takes the increasing battery market into account. The 100 dollar/kWh sales barrier willbe reached respectively between 2020-2025 for silicon based lithium-ion batteries and 2025–2030 forNMC batteries, which will give a boost to global electric vehicle adoption.
Keywords: process-based cost modeling; NMC battery; silicon lithium-ion battery; market prediction;learning curves
1. Introduction
Throughout the last decades, the emission of greenhouse gases have increased dramatically;however, their negative impact on the climate has been demonstrated [1,2]. To limit these adversaryeffects of climate change, several actions are undertaken on a worldwide scale, for example it has beenagreed at COP21 in Paris to keep the temperature rise limited to maximum 2 ◦C [3]. Additionally, stepsare undertaken by the European Commission to have a cleaner environment by setting new ambitiousenvironmental targets. For example the EU target is to have a CO2 reduction by 20% compared to thelevels of 2008 as stated in their white paper [4]. Improving urban air quality and reducing its impacton climate change of transport comes down to (1) reducing the total consumption of kilometers byimproving efficiency of the service and (2) providing the remainder of needed transport without fossilfuels. A technological option to substitute fossil based km is to use battery electric vehicles, poweredby renewable fuels. To ensure a minimum of driving range a large, expensive battery is required forbattery electric vehicles, explaining their high cost which is limiting its mass-adoption. The cost andperformance of the battery, the most expensive component in a vehicle, is directly linked with theadaption of electric vehicles. The adoption towards battery electric vehicles mainly depends on the
Energies 2017, 10, 1314; doi:10.3390/en10091314 www.mdpi.com/journal/energies

Energies 2017, 10, 1314 2 of 20
willingness to pay for the extra cost of the traction battery. Therefore will this paper study the priceevolution of an automotive battery up to 2030 and answer the following questions. What is thus areasonable price of a 1 kWh lithium battery in 2030? Can we expect an erosion of the price due to aproduction cost optimization in a mass-manufacturing situation?
In an initial phase, the current market of electric and hybrid vehicles is analyzed. Additionally,its sales up to 2030 are predicted based on historical data. Cost of a battery is inversely linked withthe growth of the market of electric vehicles, since larger production quantities leads to lowers costper unit. In this study this effect will not be taken into account, resulting in an underestimationor a very conservative estimation of the amount of EVs. In a second phase the cost and salesprice of a battery are calculated and predicted up to 2030 based upon an innovative methodology.This innovative methodology will combine process-based cost modeling with learning curves to copewith the evolution from an immature to a mature battery market. Another innovative aspect is thatcurrent state of the art battery chemistries will be used alongside with battery chemistries which arebelieved to become the state of the art in 2030. A roadmap of future battery technologies will bepresented, out of which a promising battery chemistry will be chosen.
2. Market and Technology Landscape of Electric Vehicles
This section will analyze the current global automotive market as well as the technological splitbetween internal combustion driven vehicles, hybrid and electric vehicles. The current technologicalsplit is expected to change due to firstly the increased awareness regarding climate change and secondlythe decreasing cost of electric vehicles. Based on historical sales figures a prediction of global sales ofvehicles up to 2030 will be made, including the evolution of the technological split.
2.1. State of the Art—BEV
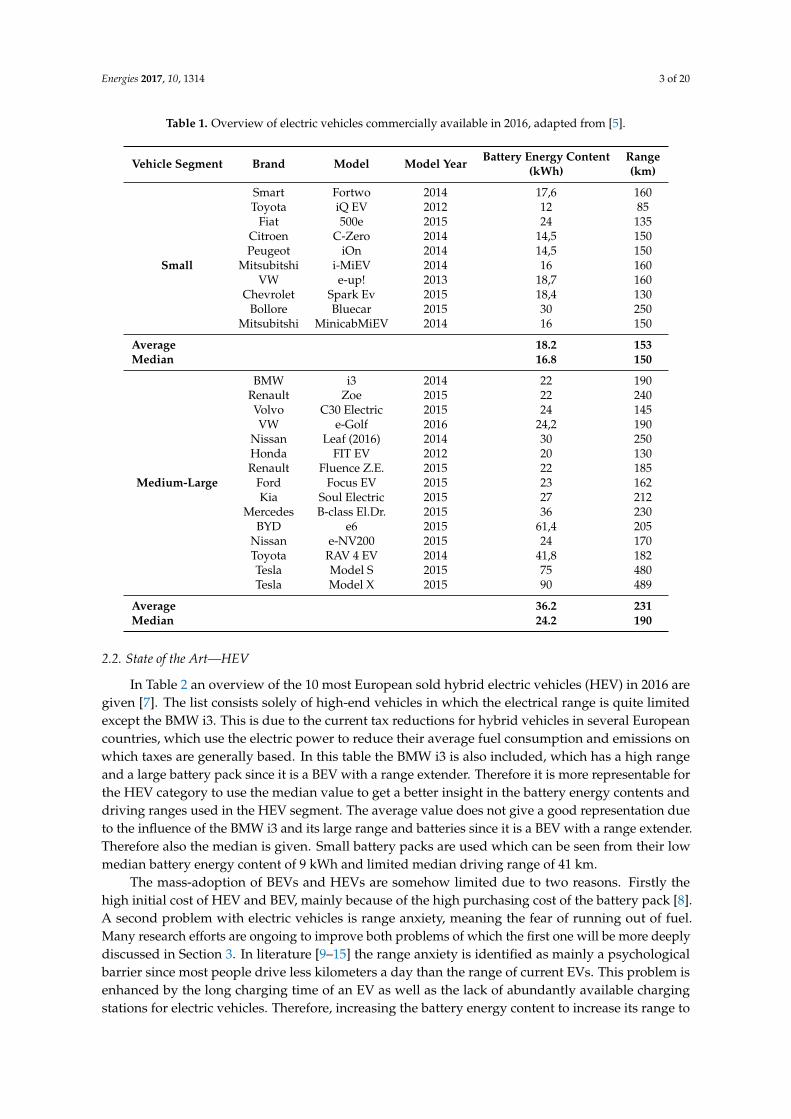
An overview of the most sold BEVs in the small and medium-large segment of 2016 are shownin Table 1, adapted from [5]. This is a non-exhaustive list, for example vehicles which do not reach100 km/h are omitted as well as vehicles sold in low quantities. It can be seen that in the segment ofsmall cars, which are mainly city cars, rather small batteries are used with an average energy contentof 18.2 kWh and a range of 150 km. The average values are quite coherent since the median givescomparable results. In this segment rather small batteries are used due to two reasons. Firstly a batteryrepresents 75% of an EVs powertrain cost [6], which means that implementing a bigger battery wouldsignificantly increase the overall cost. Secondly, because space is often limited in a city car to place abigger battery. In the segment of medium to large cars it is clear from Table 1 that bigger batteries areused, namely on average a battery energy content of 36.2 kWh and of course a larger average rangeof 231 km. However, due to the large battery of the Tesla’s the average can be misleading and themedian gives a better representation of the current market, meaning an energy content of 24.2 kWhand a range of 190 km. This is consistent with the higher cost and size of these vehicles.
Energies 2017, 10, 1314 3 of 20
Table 1. Overview of electric vehicles commercially available in 2016, adapted from [5].
Vehicle Segment Brand Model Model Year Battery Energy Content Range(kWh) (km)
Small
Smart Fortwo 2014 17,6 160Toyota iQ EV 2012 12 85
Fiat 500e 2015 24 135Citroen C-Zero 2014 14,5 150Peugeot iOn 2014 14,5 150
Mitsubitshi i-MiEV 2014 16 160VW e-up! 2013 18,7 160
Chevrolet Spark Ev 2015 18,4 130Bollore Bluecar 2015 30 250
Mitsubitshi MinicabMiEV 2014 16 150
Average 18.2 153Median 16.8 150
Medium-Large
BMW i3 2014 22 190Renault Zoe 2015 22 240Volvo C30 Electric 2015 24 145VW e-Golf 2016 24,2 190
Nissan Leaf (2016) 2014 30 250Honda FIT EV 2012 20 130Renault Fluence Z.E. 2015 22 185
Ford Focus EV 2015 23 162Kia Soul Electric 2015 27 212
Mercedes B-class El.Dr. 2015 36 230BYD e6 2015 61,4 205
Nissan e-NV200 2015 24 170Toyota RAV 4 EV 2014 41,8 182Tesla Model S 2015 75 480Tesla Model X 2015 90 489
Average 36.2 231Median 24.2 190
2.2. State of the Art—HEV
In Table 2 an overview of the 10 most European sold hybrid electric vehicles (HEV) in 2016 aregiven [7]. The list consists solely of high-end vehicles in which the electrical range is quite limitedexcept the BMW i3. This is due to the current tax reductions for hybrid vehicles in several Europeancountries, which use the electric power to reduce their average fuel consumption and emissions onwhich taxes are generally based. In this table the BMW i3 is also included, which has a high rangeand a large battery pack since it is a BEV with a range extender. Therefore it is more representable forthe HEV category to use the median value to get a better insight in the battery energy contents anddriving ranges used in the HEV segment. The average value does not give a good representation dueto the influence of the BMW i3 and its large range and batteries since it is a BEV with a range extender.Therefore also the median is given. Small battery packs are used which can be seen from their lowmedian battery energy content of 9 kWh and limited median driving range of 41 km.
The mass-adoption of BEVs and HEVs are somehow limited due to two reasons. Firstly thehigh initial cost of HEV and BEV, mainly because of the high purchasing cost of the battery pack [8].A second problem with electric vehicles is range anxiety, meaning the fear of running out of fuel.Many research efforts are ongoing to improve both problems of which the first one will be more deeplydiscussed in Section 3. In literature [9–15] the range anxiety is identified as mainly a psychologicalbarrier since most people drive less kilometers a day than the range of current EVs. This problem isenhanced by the long charging time of an EV as well as the lack of abundantly available chargingstations for electric vehicles. Therefore, increasing the battery energy content to increase its range to

Energies 2017, 10, 1314 4 of 20
about 500 km, so having a comparable battery capacity as a Tesla of about 75–90 kWh will significantlyspeed up the adoption of EVs. To implement such batteries their energy density has to increasesignificantly, since battery with such high energy content are to large to fit in small city cars.
Table 2. Overview of most sold hybrid electric vehicles in 2016 in Europe (10 most popular).
Vehicle Segment Brand Model Model Year Battery Energy Content Range(kWh) (km)
Medium-Large
VW Passat GTE 2015 9,9 50Mitsubishi Outlander PHEV 2013 12 52
Volvo XC90 PHEV 2015 9,2 40Mercedes GLC350e 2016 8,7 34
BMW 225xe Active Tourer 2015 7,6 41Mercedes C350e 2015 6,5 31
BMW 330e 2015 7,6 40BMW X5 40e 2015 9 31Audi A3 e-Tron 2014 9 50BMW i3 range extended 2013 22 320
Average 18.2 153Median 9 41
2.3. Electric Vehicle Prediction Up to 2030
The following paragraph will make a prediction of the global sales of electric, hybrid, classicalcombustion engine vehicles as well as other types of vehicles such as compressed natural gas (CNG),liquefied petroleum gas (LPG), fuel cells vehicles, which will be combined in the category others.Based upon a literature review [16–21] a prediction of the technology split is shown in Figure 1. In 2015the global sales are still dominated (99.3%) by the classical combustion engine(ICE) based vehicles,even by 2030 more ICE than electric vehicles are sold however its dominance decreases significantly.Due to the increasing effort of the automotive manufacturers more and more HEV and BEV modelsare available on the market, increasing the choice for consumers, which was quite limited up to inthe past. In 2030 25% of all vehicles sold will be either fully electric or hybrid, requiring an enormousamount of batteries. To get a better idea of the quantities this analysis is expanded by combiningthe previous figure with the expected global sales of vehicles predictions worldwide, which can beseen in Figure 2. Only limited sources are available in literature [22–28] which predict the globalsales up to 2030. Therefore it was opted to make a prediction based upon the sales in the past, morespecifically the global sales between 2010 and 2015 were analyzed [28]. Since only a small period oftime is analyzed a linear approximation is used, predicting in 2020, 2025, 2030 receptively 107, 122 and138 million vehicles sold yearly. The linear approximation can be clearly seen in the increase of thetotal amount of vehicles sold, Figure 2. The peak of ICE vehicles will be reached in 2020 with a sales ofmore than 100 millions. By 2030 roughly 10 million BEVs and 20 million HEVs will be sold on a yearly.When assuming 75–90 kWh is needed for BEV, HEV will require half of the capacity roughly 23 billionkWh of battery are required yearly which is a very large potential market for battery manufactures.

Energies 2017, 10, 1314 5 of 20
Figure 1. Evolution of the technology split between electric vehicles (EV), hybrid electric vehicles(HEV), internal combustion engines (ICE) and other up to 2030.
Figure 2. Global vehicles sales predictions up to 2030 including the evolution of the technological splitbetween EV, HEV, ICE and others.
Energies 2017, 10, 1314 6 of 20
3. Battery Discussion
Batteries have become an indispensable product in society; they are being used in a variety ofproducts ranging from cellphones up to electric vehicles. The most popular battery technologies arethe lithium-ion batteries due to their high energy- and power-density as well as their high lifetimecompared to other types [29].
The electrochemical storage of energy in a lithium-ion battery is achieved through intercalation inthe positive and negative electrode, shown by Equation (1) [30].
Li+ + e− + θ ←→ Li− θ (1)
With:θ The insertion materialθ − Li Lithium inserted in material θ
e− An electronLi+ A lithium-ion
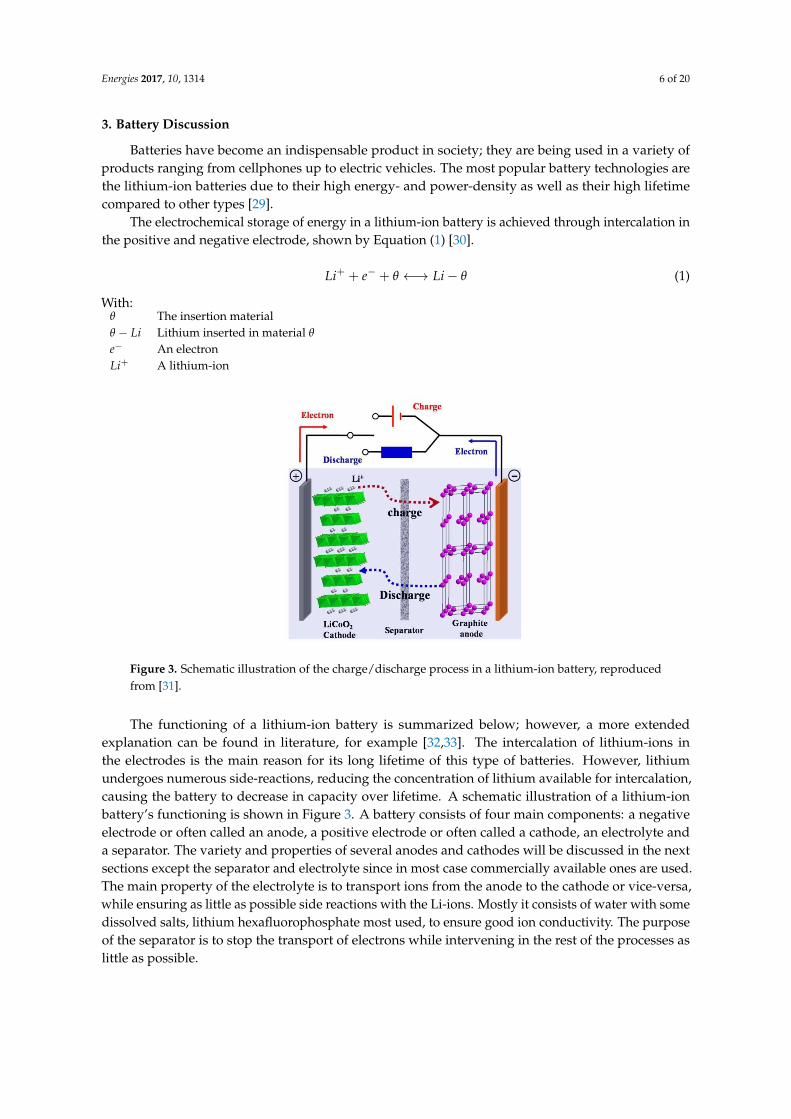
Figure 3. Schematic illustration of the charge/discharge process in a lithium-ion battery, reproducedfrom [31].
The functioning of a lithium-ion battery is summarized below; however, a more extendedexplanation can be found in literature, for example [32,33]. The intercalation of lithium-ions inthe electrodes is the main reason for its long lifetime of this type of batteries. However, lithiumundergoes numerous side-reactions, reducing the concentration of lithium available for intercalation,causing the battery to decrease in capacity over lifetime. A schematic illustration of a lithium-ionbattery’s functioning is shown in Figure 3. A battery consists of four main components: a negativeelectrode or often called an anode, a positive electrode or often called a cathode, an electrolyte anda separator. The variety and properties of several anodes and cathodes will be discussed in the nextsections except the separator and electrolyte since in most case commercially available ones are used.The main property of the electrolyte is to transport ions from the anode to the cathode or vice-versa,while ensuring as little as possible side reactions with the Li-ions. Mostly it consists of water with somedissolved salts, lithium hexafluorophosphate most used, to ensure good ion conductivity. The purposeof the separator is to stop the transport of electrons while intervening in the rest of the processes aslittle as possible.

Energies 2017, 10, 1314 7 of 20
3.1. State of the Art—Anode
Twenty years ago graphite (372 mAh/g [34]) was first commercialized [35] as anode material in alithium-ion battery and up to now it is still being used in most lithium-ion batteries. Its low cost, goodelectrochemical performance, low volume expansion during charging and discharging as well as thatit is abundantly available, explains the widely accepted use of graphite as anode material [33,35,36].Many research efforts allowed to optimize this material resulting it is almost reaching its maximumtheoretical capacity and only incremental improvements can be expected [29]. However, by addingsmall amounts of metals with high theoretical energy densities, such as silicon (4200 mAh/g [37]),the overall energy density can be increased [38]. Adding high concentrations of these additionalcomponents cause numerous problems such as volume expansions up to 300% as well as reducedlifetime despite the current numerous research efforts, for example using silicon as nano-particles suchas in [37].
Other often used anodes materials used are lithium alloyed metals with as most popular Li4Ti5O12
LTO (175 mAh/g [35]). More noble metals are used resulting in a higher price than graphite. Otherdisadvantages are its lower energy capacity and reduced cell voltage compared to graphite. Howeverits exceptional good stability over its lifetime makes it the ideal anodes in specific cases explaining itswide usage.
An overview of the two most used anode materials is shown in Table 3 [34,35].
Table 3. Anode materials—Overview including specific energy density, cost and lifetime.
Anode Material Energy Density Cost Lifetime(mAh/g)
Graphite 372 Medium MediumLi4Ti5O12 (LTO) 175 High High
3.2. State of the Art—Cathode
The selection of the most suited cathode material is strongly dependent on the application itself.A selection has to be made of which key property is the most important for an application. The keyproperties of a battery are: energy density, power density, cost and lifetime. An overview of the mostused cathode materials can be found in Table 4 [29,33,36,38–45].
Table 4. Cathode materials—Overview including energy density cost and lifetime.
Cathode Material Energy Density Cost Lifetime(Wh/kg)
LiCoO2 (LCO) 546 Medium MediumLiMn2O4 (LMO) 410–492 Low Low
LiNiMnCoO2 (NMC) 610–650 High HighLiFePO4 (LFP) 518–587 Medium High
LiNiCoAlO2 (NCA) 680–760 High Medium
The oldest commercially used electrodes are LiMn2O4 (LMO) due to the low cost, however thelifetime is limited which is considered to be the biggest disadvantage but they are still frequentlyused. LiCoO2 (LCO) another old electrode, characterized with a medium cost and high energy, hassome safety drawbacks but is still used frequently. LiNiMnCoO2 (NMC), a combination of LCO, LMOand nickel, is gaining popularity due to its high lifetime as well as its high energy density. The exactmixture of Ni, Mn and Co will define the property of the cathode of which a variety exist such asNMC (1:1:1), NMC (5:3:2), ... The trend is to use Ni rich NMC since this gives an increased energydensity. It is mainly used where cost is less important. LiFePO4 (LFP) has excellent lifetime propertiesand is frequently used in combination with an LTO anode to get an excellent overall lifetime of the

Energies 2017, 10, 1314 8 of 20
battery. LiNiCoAlO2 (NCA), a relatively new cathode, has a very high energy density however it ispotentially thermally unstable stability, meaning a reduced safety.
3.3. State of the Art—Roadmap
Demands on lifetime and energy/power density are ever increasing to extend the duration inwhich the battery can be used. Hence, there is a continuous need to further improve lithium-ionbatteries [46]. This section will explain which future trends can be expected during the next decades,an overview is given in Figure 4, which is limited to lithium-ion batteries. Other types, such assodium-ion, zinc air, lithium-air are still in a very early phase and thus omitted from this overview.
Figure 4. Roadmap of Lithium-ion based batteries from present up to >10 years.
The world of batteries is changing very rapidly which is the reason why it is very hard to predictthe most promising battery chemistry. It can be disrupted very easily if a novel type/chemistry isdiscovered in material sciences with superior properties. However some trends are already visiblewhen limiting to lithium-ion based batteries.
The first clear trend is to use different electrodes which have a significant higher theoreticalcapacity such as sulfur (1672 mAh/g [47]), silicon (4200 mAh/g [37]) and lithium metal(3860 mA/g [48]). This will inherently increase the energy density of the cell since the electrodes itselfcan store more energy. A second trend is to increase the voltage limit of a single cell to around 5 V sinceit is a harmonized voltage value used in the field of electronics. This trend will also increase the cellsenergy density due to its definition which can be simply represented as integral of the actual capacitymultiplied with the actual voltage. The third trend is to go towards solid state electrolytes since usingliquid electrolytes can cause safety problems when leaking. In general it can be concluded that in thenear future the energy density and safety are the two key topics, in which significant improvement canbe expected during the next decade [32].
To make predictions further than a decade is extremely difficult but lithium-magnesium is worthmentioning. It has superior energy density and is abundantly available, but is still in a very earlyphase [49].
In this paper, as already mentioned, the goal is to perform a price estimation up to 2030. The bestoverall chemistry now in 2015 is NMC (6:2:2) as cathode combined with graphite as anode due totheir high energy density and lifetime. It can be seen in literature many research efforts or ongoingon silicon based cells. Therefore in 2030 namely a silicon-alloy anode combined a nickel rich cathode(NMC (6:2:2)) to maximize its energy content will be most likely on the market. An overview of thetwo battery chemistries, used this research as well as their pack energy density is shown in Table 5.Throughout these two battery types will be referred to as battery I and battery II.

Energies 2017, 10, 1314 9 of 20
Table 5. Overview of the cell chemistries used for cost calculations. The first one will be referred to asthe NMC battery and the second one as the silicon based lithium-ion battery.
Battery I Battery II
Positive electrode NMC (6:2:2) NMC (6:2:2)Negative electrode Graphite Silicon Alloy [50]
Pack energy density 155 Wh/kg 205 Wh/kg
3.4. Battery Cell Manufacturing
Several architectures and designs of battery cells exist such as cylindrical cells, pouch cells, hardcasing with a variety of positions for the tabs [51]. However in all these designs three main processescan be identified as described in Table 6 [33]. Also in this table the material inputs (+) and outputs (−)are shown since material cost is the main cost of a battery, which will be demonstrated in Section 3.5.
The first step is electrode manufacturing in which the electrodes themselves are being prepared.The active material, conductive agents, solvents and binder are mixed to a slurry which is coated ontoa current collector (aluminium for the positive tab and copper for the negative one). After which thecells are dried, in order to vaporise the solvents. To ensure a good electrical connection between theslurry and current collector the electrodes are calendared, which consists of pressing the two firmlytogether. As a last step in this electrode manufacturing the electrodes are cut to their correct size.
The second step is to make a cells assembly or a multilayer combination of a positive electrode,separator and negative electrode. These multilayers can be created through stacking or winding tocreate respectively pouch and cylindrical cells. Afterwards the cells are packaged (hard casing/softcasing/...) and temporarily sealed. The cells undergo a drying procedure to ensure no solvents remainafter which they are filled with electrolyte and permanently sealed.
The battery cell is now ready to use, however to ensure stable and good quality of it its has toundergo some electrical formation cycles. These formation cycles are critical for the lifetime of thecell since its stabilizes the chemical structure of the cell. The final step is to test the cell’s electricalperformance to maintain a good quality control.
Table 6. Battery cell manufacturing process summary including material in- and outflow.
Manufacturing Process Material
Electrode Manufacturing
Slurry Mixing
+ Active Material+ Conductive agent+ Solvents+ Binder
Coating + Al/Cu foilDrying − SolventsCalendaringCutting + Remaining al/Cu foil
Cell Assembly
Stacking/Winding+ Separator+ Adhesive Tape+ Al/Cu tabs
Packaging (Pouch/Case) + Pouch Foil/casingTemporary sealing + SolventsDryingFilling − Remaining al/Cu foilPermanent Seal
Formation FormationCell Testing

Energies 2017, 10, 1314 10 of 20
3.5. Process-Based Cost Modeling
This section will focus on cost and sales prices calculations and predictions by using process-basedcost modeling of several battery chemistries. The methodology of process-based cost modeling is tocalculate costs based on detailed process descriptions, which are well defined for batteries [52,53]. Thismethodology is being used in several application fields including battery cost calculations [54–58].Battery production for automotive cells are still in an early phase and not yet in mass production.This means optimizations in the production process are possible by upscaling and by building moreproduction plants. Process-based modeling can be combined with learning or dynamic curves,which are dependent on growth of the production capacity as demonstrated in other applicationfields [59]. This study [59] has performed a thorough analysis about the price evaluation of chemicalproducts during a decade and linking the impact of increasing production capacities to the evolutionof prices. For analysis of the price evolutions up to 2030 process-based cost modeling extended withlearning curves will be used. The main drawbacks of this approach are that the exact process andcomposition of the battery chemistry has to be known. This can be overcome by combining recentlypublished patents, which describe the processes in detail, as well as by performing an extendedliterature review.
The cost of two different cell chemistries will be analyzed, namely battery I (NMC(6:2:2) +Graphite) and battery II (NMC(6:2:2) + silicon alloy). NMC based batteries can be seen as the currentstate of the art batteries and silicon based ones as state of the art batteries in 10–15 years as shownby the roadmap in Figure 4. Process-based cost modeling is used in order to calculate the detailedmaterial cost in dollar/kWh for each battery type. The methodology, including the key equations,are represented in Figure 5. In the first step the manufacturing procedure is split into logical substepsof which the material and energy in and outflows are analyzed, which is done in Section 3.4. In thisstep also the excess material, used during the manufacturing, should be taken into account. The nextstep will calculate the cost of goods sold, which entails the material, energy, labor and overheadcosts. Two additional assumptions are made regarding the labor and overhead cost, which can beapproximated by respectively 15% and 8% as demonstrated in [60]. When comparing with othercalculations done in literature [54,56,61] similar assumptions were used. The sales price including themanufacturer’s and retailer’s profit are taken into account. A profit margin of 35% for the manufactureris used, which is high but it entails novel products requiring a high profit margin [60]. When thesebatteries are not directly sold by the manufacturer and additional profit margin of 15% by the retaileris added. This leads to the final sales price. The prediction of the prices will be detailed in Section 3.6.
Throughout this paper several assumptions are made. Firstly all prices will be expressed indollar/kWh in 2015. All prices will be expressed in price in 2015 to make it easier to compare theevolutions. This will imply that the price of a battery will be higher in 2030 than predicted due to theinflation, which will occur between 2015 and 2030.
Figure 5. Overview of the used methodology including learning curves.

Energies 2017, 10, 1314 11 of 20
3.5.1. Battery I—Cost Calculation
The process of manufacturing of NMC lithium-ion batteries is well known; however, a variety oftypes are still possible. A NMC with ratio 6:2:2 will be used as a baseline for this calculations since thisnickel rich type has a high energy density and is considered the current state of the art. It is also suitedto increase the overall cell voltage which was described as one of the future trends. This NMC 6:2:2cathode will be combined with standards binders, conductive agents and as anode graphite. The costprice calculations of a battery pack including a simple passive battery managements system (BMS)and casing are visually represented in Figure 6. The cost of 432 dollar/kWh is dominated by materialcost representing 65% of the overall cost. Similar results can be found in literature [56,62] in which thematerial cost varies between 60–80%. The two most costly components are the positive and negativeelectrode. These require noble materials and are used in high quantities in a battery pack explainingtheir high cost. A detailed breakdown analysis of the negative electrode is also shown in Figure 6in which it is clear that the active material is the main driver of the cost of the electrode (62% of thenegative electrode cost). A similar trend can be seen in the positive electrode.
When including the profit margins of the producer and middle man a sales price of 670 dollar/kwhis reached. The breakdown is visualized in Figure 7. Also here the expensive electrodes represent asignificant cost of 28%. Since these prices are valid for low production quantities, it is hard to comparethem with the pricing of an automotive battery pack, however comparisons can be found varying from700–1300 Dollar/kWh [63–65] of battery packs sold in lower quantities.
Figure 6. Cost breakdown of battery I with a special focus on the anode composition.

Energies 2017, 10, 1314 12 of 20
Figure 7. Sales price of battery I.
3.5.2. Battery II—Cost Calculation
This section will quantify the impact of using silicon-based batteries, with a higher energy density,compared to the classical NMC combined with graphite. The difference between the two is mainly inthe negative electrode which uses silicon alloy in stead of graphite. Many varieties of silicon basedlithium-ion batteries are available, however the ones in which silicon is used as an alloy are the mostpromising. As a baseline the following patent WO2016089666 A1 [50] will be used for making a siliconalloy with high lifetime and high energy density. The exact calculation of the composition of this activematerial composed from raw materials is shown in Table 7. The other components such as binder,conductive agents are kept constant. In reality different materials are required, however in a similarquantity and at a comparable cost explaining why these cost are kept con.
To calculate the total cost per kWh of battery II the increased energy density of the pack shouldbe taken into account. For battery I and battery II receptively the following energy densities areused 155 Wh/kg and 205 Wh/kg. This is an increase of 33% which can be expected from materialcalculations. Silicon has a 10 times higher theoretical capacity than graphite, but a mixture is usedas shown by its composition. The cost breakdown is visualized in Figure 8 in which the negativeelectrode cost is decreased from 24% for battery I to 19% for battery II. The main impact howevercomes from the higher energy density explaining a significantly lower cost of silicon based batteriescompared top NMC. This makes a total sales price of 456 Dollar/kWh compared to 431 dollar/kWhfrom NMC, visualized in Figure 9. This is large price reduction of 30%. However it should be statedthat this battery is not yet a commercial product and some extra research should be done to increaseits lifetime.
Table 7. Anode active material battery II—detailed.
Material Amount Price in 2015(kg) (Dollar)
Si73FeI7C10 0.6 2.76Graphite 0.128 1.25
Carbon nanotubes 0.16 4.17Carboxy methyl cellulose 0.032 2.96
LiPAA 0.08 11.25
Total 1 22.39

Energies 2017, 10, 1314 13 of 20
Figure 8. Cost breakdown of battery II with a special focus on the anode composition.
Figure 9. Sales price of battery II.
3.6. Evolution of Cost in Time
The prediction of cost up to 2030 for automotive batteries based upon battery I and battery II willbe detailed in this section. The cost and prices calculated in previous sections are only valid for smallproduction quantities. Therefore the current cost of goods sold for automotive NMC battery packswill be used as a baseline, which is around 300 dollar/kWh according to literature [54,66,67]. Addingthe assumed profit margin as stipulated in Figure 5 results in a sales price of 466 dollar/kWh. Alsothe relative amounts, calculated in the previous sections will be kept constant meaning labor 15%,overhead 8% and material cost 76% of the costs of goods sold (300 dollar/kWh).

Energies 2017, 10, 1314 14 of 20
Figure 10. Overview of the used methodology including its key equations.
As previously mentioned there is a clear link in doubling the production capacity of the industryand price reductions as shown by [59]. Three different types of cost can be analyzed with their ownlearning/discount rate per doubling capacity of the industry. The calculations of the costs of goodssold and the sales price calculations for predictions up to 2030 are shown in Figure 10. Combiningprocess based modeling with these learning curves are a new approach to tackle the price predictions ofbatteries. Firstly the material cost is analyzed by Lieberman, [59] and a reduction of 23.5% can be foundper doubling production capacity, corresponding to a discount factor of 0.765 of material cost. While foroverhead and labor cost receptively the classical “six-tenths-rule” and “two-tenths-rule” [59] are used.The six-tenths-rule gives a relationship between size and cost as shown by following formula [68]:
Cost2
Cost1= (
Scale2
Scale1)0.6
This shows that for a size doubling the total cost increases to 151,4% instead of doubling. This canbe achieved by for example building a new plant. When this total cost is redistributed over the twoplants, the cost for each plant reduced to 75.7% of its original cost. This translate thus in a reduction of24.3% per plant or a discount rate of 0.757 for overhead cost. Labor cost follows the two-tenths-rulemeaning thus in the previous equation 0.6 should be replaced by 0.2. This results in a discount factorof 0.574 or a reduction by 42.6% for each size doubling for labor costs. For completeness the marketgrowth for EV and BEV from 2015 up to 2030 are summarized in Table 8, based upon the predictionsmade in Section 2.3.
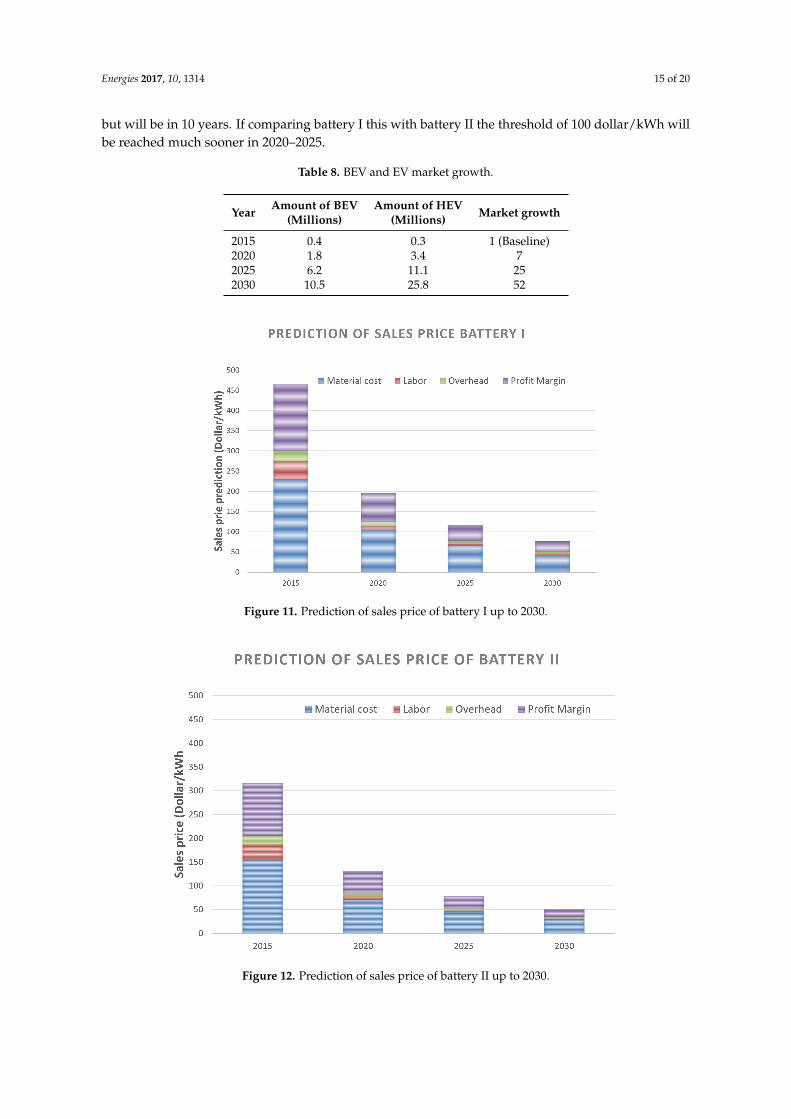
In Figure 11 the prediction of sales cost for battery II is shown. By 2020 a significant price reductionis expected (more than half of the total sales price) due to the rapid growth of the battery market,linked to the EVs one. The threshold of 100 dollar/kWh will be reached between 2025 and 2030.
The same approach is used for battery II. The price in 2015 is calculated using the same proportionof the sales price between NMC and silicon for the previous sections. After which the profit marginsare added, resulting in a sales price of 317 dollar/kWh. The prediction of its price evolution is shownin Figure 12. One important remark is that silicon based lithium-ion batteries are not yet on the market
Energies 2017, 10, 1314 15 of 20
but will be in 10 years. If comparing battery I this with battery II the threshold of 100 dollar/kWh willbe reached much sooner in 2020–2025.
Table 8. BEV and EV market growth.
Year Amount of BEV Amount of HEV Market growth(Millions) (Millions)
2015 0.4 0.3 1 (Baseline)2020 1.8 3.4 72025 6.2 11.1 252030 10.5 25.8 52
Figure 11. Prediction of sales price of battery I up to 2030.
Figure 12. Prediction of sales price of battery II up to 2030.

Energies 2017, 10, 1314 16 of 20
3.7. Comparison
This section will compare the price predictions available in literature [69–75] of lithium-ionbatteries in 2020, visualized in Figure 13. In this figure it can be seen that the prices are rankedfrom low to high, which also coincides with when the price was predicted. The Boston ConsultingGroup [71] predicted in 2010 an average price of 300 dollar/kWh, which is the oldest and highestprice in the listed comparison. In 2012 and 2015 receptively Roland and Berger [73,74] and Avicenne[72] predicted a price of 275 and 250 dollar/kWh. The predictions in 2016 made by P3 Consulting[75] and GTM Research [69] even shows lower costs of 210 and 217 dollar/kWh. The most recentprediction made by Tesla [70] even 150 dollar/kWh can be expected in 2015. The predictions made bythis research gives result of 195 and 131 dollar/kWh, which is in the same line as the recent predictions.However silicon based batteries can have a beneficial impact on the cost it is unlikely that it is alreadycommercially available in 2020 but most likely by 2025.
Figure 13. Sales price prediction of lithium-ion batteries in 2020.
4. Conclusions
From the previous analysis it is clear that the electric automotive market is still in itsinnovators/introduction stage [76]. However in the near future a step towards mass-adoption/growth is expected. One of the indicators is to analyze the publications and patents about the electricautomotive industry which is currently booming. BEVs still have a small driving range howevera large effort was done by the manufacturers to significantly extend the choice of electric vehiclesduring the last years. The most popular HEVs are the higher priced vehicles in which cost plays is lessimportant. Currently the market is still dominated by classical combustion engine vehicles however itsdominance will decrease from 99% in 2015 to 68% in 2030. The market of electric vehicles (HEVs andBEVs) will have to increase by a factor of 52, which means a huge investment in battery manufacturingwill be required to cope with this increase. This mass production will be one of the driving forces ofthe decreasing cost of battery pack.
The trends deduced from the roadmap of lithium-ion batteries show that within the next decadeimprovements regarding energy density and safety can be expected. To anticipate on this trend ainnovative approach is used in which process-based cost calculations are used on two types of battery
Energies 2017, 10, 1314 17 of 20
chemistries, one which can be considered as state of the art in 2015, namely NMC and one whichwill be considered as state of the art in 2030, namely silicon based lithium-ion batteries. Additionally,this methodology is combined with learning curves to which will include the maturing of the batterymarket. Material costs represent the majority of costs in a battery pack (66%) of which the activematerial, responsible for the intercalation of li-ions, is the most costly component. By using siliconbased batteries a cost reduction per kWh of 30%. The limit of 100 Dollar/kWh will be reached in2020–2025 for silicon based batteries and in 2025–2030 for NMC batteries. This low price will have asignificant impact on the overall price of an electric vehicles since the battery represents the largestcost. This price reduction will aide in the mass adoption of electric vehicles.
Author Contributions: Gert Berckmans performed the research and wrote the paper. The supervisors:Lieselot Vanhaverbeke and Joeri Van Mierlo as well as Maarten Messagie, Jelle Smekens and Noshin Omarprovided interesting disucssions adn interesting insights inS the research. All authors read and approved thefinal manuscript.
Conflicts of Interest: The authors declare not conflicts of interest.
References
1. Hooftman, N.; Oliveira, L.; Messagie, M.; Coosemans, T.; Mierlo, J.V. Environmental Analysis of Petrol,Diesel and Electric Passenger Cars in a Belgian Urban Setting. Energies 2016, 9, 84.
2. Oliveira, L.; Messagie, M.; Rangaraju, S.; Sanfelix, J.; Rivas, M.H.; Mierlo, J.V. Key issues oflithium-ion batteries e from resource depletion to environmental performance indicators. J. Clean. Prod.2015, 108, 354–362.
3. COP21. Available online: http://www.cop21paris.org/about/cop21/ (accessed on 19 April 2017).4. European Commission. White Paper: European Transport Policy for 2010: Time to Decide; Technical Report;
European Commission: Luxemburg, 2001.5. Grunditz, E.A.; Thiringer, T. Performance Analysis of Current BEVs—Based on a Comprehensive Review of
Specifications. IEEE Trans. Transp. Electr. 2016, 2, 270–289.6. Wolfram, A.P.; Lutsey, N. Electric Vehicles: Literature Review of Technology Costs and Carbon Emissions;
The International Council on Clean Transportation: Washington, DC, USA, 2016; pp. 1–23.7. European Alternative Fuels Observatory. Available online: http://www.eafo.eu/vehicle-statistics/m1
(accessed on 15 March 2017).8. Delucchi, M.E.; Lipman, T. An Analysis of the Retail and Lifecycle Cost of Barrery-Powered Electric Vehicles.
Transp. Res. Part D 2001, 6, 371–404.9. Neubauer, J.; Wood, E. The impact of range anxiety and home, workplace, and public charging infrastructure
on simulated battery electric vehicle lifetime utility. J. Power Source 2014, 257, 12–20.10. Rauh, N.; Franke, T.; Krems, J.F. Understanding the Impact of Electric Vehicle Driving Experience on
Range Anxiety. J. Hum. Factors Ergon. Soc. 2015, 57, 177–187.11. Franke, T.; Neumann, I.; Bühler, F.; Cocron, P.; Krems, J.F. Experiencing Range in an Electric Vehicle:
Understanding Psychological Barriers. Appl. Psychol. 2012, 61, 368–391.12. Franke, T.; Krems, J.F. What drives range preferences in electric vehicle users? Transp. Policy 2013, 30, 56–62.13. Pearre, N.S.; Kempton, W.; Guensler, R.L.; Elango, V.V. Electric vehicles: How much range is required for a
day’s driving? Transp. Res. Part C Emerg. Technol. 2011, 19, 1171–1184.14. Dong, J.; Liu, C.; Lin, Z. Charging infrastructure planning for promoting battery electric vehicles:
An activity-based approach using multiday travel data. Transp. Res. Part C Emerg. Technol. 2014, 38, 44–55.15. Bakker, J. Contesting Range Anxiety: The Role of Electric Vehicle Charging Infrastructure in the Transportation
Transition. Master’s Thesis, Eindhoven University of Technology, Eindhoven, The Netherlands, 2011.16. International Energy Agency (IEA). Technology Roadmap: Electric and Plug-in Hybrid Electric Vehicles; Technical
Report; International Energy Agency (IEA): Paris, France, 2011.17. Klynveld Peat Marwick Goerdeler KPMG’s Global Automotive Executive Survey. Available online: https://
assets.kpmg.com/content/dam/kpmg/xx/pdf/2017/01/global-automotive-executive-survey-2017.pdf(accessed on 16 May 2017).

Energies 2017, 10, 1314 18 of 20
18. Lazard & Roland Berger. Global Automotive Supplier Study 2013. Available online: https://www.rolandberger.com/en/Publications/pub_global_automotive_supplier_study_by_roland_berger_and_lazard.html (accessedon 10 May 2017).
19. International Energy Agency. Global EV Outlook 2016 Electric Vehicles Initiative; IEA: Lisbon, Portugal, 2016;pp. 1–51.
20. Mac Donald, J. Electric Vehicles to Be 35% of Global New Car Sales by 2040. Available online:https://about.bnef.com/blog/electric-vehicles-to-be-35-of-global-new-car-sales-by-2040/ (accessed on4 October 2017).
21. Global Trends to 2025: A Transformed World; Lukoil: Moscow, Russia, 2015.22. King, N. Global Light Vehicle Sales Forecast to Exceed 100 Million Units in 2019. Available online:
http://blog.euromonitor.com/2015/07/global-light-vehicle-sales-forecast-to-exceed-100-million-units-in-2019.html (accessed on 25 May 2017).
23. Goldman Sachs. Cars 2025. Available online: http://www.goldmansachs.com/our-thinking/technology-driving-innovation/cars-2025/ (accessed on 5 April 2017).
24. Price Waterhouse Coopers. PWC: Prediction; Electric Cars: A Market Outlook: The Future of Plug-in HybridElectric and All-Electric Vehicles in Hungary; Technical Report; PWC: Prediction: London, UK, 2014.
25. Statista. Available online: https://www.statista.com/statistics/267128/outlook-on-worldwide-passenger-car-sales/ (accessed on 17 March 2017).
26. Information Handling Services Automotive. Global Light Vehicle Forecast: Readying For The Next Stage;Technical Report; IHS Automotive: London, UK, 15 October 2015.
27. International Energy Agency. Electric and Plug-In Hybrid Vehicle Roadmap; International EnvironmentalAgency: Lisbon, Portugal, 2010; p. 4.
28. Oica. Oica: Sales Figures; Technical Report; Oica: Paris, France, 2017.29. Deng, D. Li-ion batteries: Basics, progress, and challenges. Energy Sci. Eng. 2015, 3, 385–418.30. Fuller, T.F.; Doyle, M.; Newman, J. Simulation and Optimization of the Dual Lithium Ion Insertion Cell.
J. Electrochem. Soc. 1994, 141, 1.31. Xu, G.L.; Wang, Q.; Fang, J.C.; Xu, Y.F.; Li, J.T.; Huang, L.; Sun, S.G. Tuning the structure and property of
nanostructured cathode materials of lithium ion and lithium sulfur batteries Gui-Liang. J. Mater. Chem. A2014, 2, 19941–19962.
32. Gopalakrishnan, R.; Goutam, S.; Oliveira, L.M.; Timmermans, J.M.; Omar, N.; Messagie, M.; Bossche, P.V.D.;Mierlo, J.V. A comprehensive study on rechargeable energy storage technologies. J. Electrochem. EnergyConvers. Storage 2017, 13, 1–107.
33. Smekens, J.; Gopalakrishnan, R.; Van den Steen, N.; Omar, N.; Hegazy, O.; Hubin, A.; Van Mierlo, J. Influenceof electrode density on the performance of Li-ion batteries: Experimental and simulation results. Energies2016, 9, 104.
34. Kheirabadi, N.; Shafiekhani, A. Graphene/Li-Ion battery. J. Appl. Phys. 2012, 112, 1–19.35. Nitta, N.; Wu, F.; Lee, J.T.; Yushin, G. Li-ion battery materials: Present and future. Mater. Today 2015,
18, 252–264.36. Mekonnen, Y.; Sundararajan, A.; Sarwat, A.I. A Review of Cathode and Anode Materials for Lithium-Ion
Batteries. In Proceedings of the 2016 SoutheastCon, Norfolk, VA, USA, 30 March–3 April 2016; pp. 2–7.37. Su, X.; Wu, Q.; Li, J.; Xiao, X.; Lott, A.; Lu, W.; Sheldon, B.W.; Wu, J. Silicon-Based Nanomaterials for
Lithium-Ion Batteries: A Review. Adv. Energy Mater. 2013, 4, 1–23.38. Blomgren, G.E. The Development and Future of Lithium Ion Batteries. J. Electrochem. Soc. 2017, 164,
A5019–A5025.39. Fergus, J.W. Recent developments in cathode materials for lithium ion batteries. J. Power Source
2010, 195, 939–954.40. Mizushima, K.; Jones, P.C.; Wiseman, P.J.; Goodenough, J.B. LixCoO2: A new cathode material for batteries
of high energy density. Solid State Ion. 1981, 3-4, 171–174.41. Liu, C.; Neale, Z.G.; Cao, G. Understanding electrochemical potentials of cathode materials in rechargeable
batteries. Mater. Today 2016, 19, 109–123.42. Julien, C.M.; Mauger, A.; Zaghib, K.; Groult, H. Comparative Issues of Cathode Materials for Li-Ion Batteries.
Inorganics 2014, 2, 132–154.
Energies 2017, 10, 1314 19 of 20
43. Meyers, R.A.; Doeff, M.M. Encyclopedia of Sustainability Science and Technology; Springer: New York, NY, USA,2012; pp. 529–564.
44. Heyns, M.; Vereecken, P. Materials for the Next Generation Batteries (Some) Ways of Storing Electricity; TechnicalReport; KU Leuven: Leuven, Belgium, 2013.
45. Meeus, M.; Pace, G. Current and Future Development of Battery Technology and Its Suitability within Smart Grids;Technical Report; Ghent University: Ghent, Belgium, 2013.
46. Noorden, R.V. The rechargeable revolution: A better battery. Nature 2014, 507, 26–28.47. Preefer, M. Lithium-Sulfur Batteries and Discharge Products from Cycling Why Li-S Batteries? Technical Report;
Materials Research Laboratory at UCSB: Santa Barbara, CA, USA, 2016.48. Xu, W.; Wang, J.; Ding, F.; Chen, X.; Nasybulin, E.; Zhang, Y.; Zhang, J.G. Lithium metal anodes for
rechargeable batteries. Energy Environ. Sci. 2014, 7, 513–537.49. Aurbach, D.; Gofer, Y.; Lu, Z.; Schechter, A.; Chusid, O.; Gizbar, H.; Cohen, Y.; Ashkenazi, V.; Moshkovich, M.;
Turgeman, R.; etal. A short review on the comparison between Li battery systems and rechargeablemagnesium battery technology. J. Power Source 2001, 97–98, 28–32.
50. Figgemeier, E. Electrode Composition Comprising Carbon Naotubes, Electrochemical Cell and Method ofMaking Electrochemical Cells. Patent EP 3029759 A1, 6 August 2016.
51. Kurfer, J.; Westermeier, M.; Tammer, C.; Reinhart, G. Production of large-area lithium-ion cells—Preconditioning , cell stacking and quality assurance. CIRP Ann. Manuf. Technol. 2012, 61, 1–4.
52. Field, F.R. Fundamentals of Process-Based Cost Modeling Session Goal & Outline Review of Process-Based CostModel; Technical Report; MIT: Cambridge, MA, USA, 2017.
53. Field, F.; Kirchain, R.; Roth, R. Process cost modeling: Strategic engineering and economic evaluation ofMaterials technologies. JOM J. Miner. Met. Mater. Soc. 2007, 59, 21–32.
54. Patry, G.; Romagny, A.; Martinet, S.; Froelich, D. Cost modeling of lithium-ion battery cells forautomotive applications. Energy Sci. Eng. 2015, 3, 71–82.
55. Isaacs, J.A.; Tanwani, A.; Healy, M.L.; Dahlben, L.J. Economic assessment of single-walled carbonnanotube processes. J. Nanoparticle Res. 2010, 12, 551–562.
56. Nelson, P.A.; Gallagher, K.G.; Bloom, I.; Dees, D.W. Modeling the Performance and Cost of Lithium-Ion Batteriesfor Electric-Drive Vehicles; Argonne National Lab: Lemont, IL, USA, 2011; pp. 1–102.
57. Wood, D.L.; Li, J.; Daniel, C. Prospects for reducing the processing cost of lithium ion batteries. J. Power Source2015, 275, 234–242.
58. Henriksen, G.L.; Amine, K.; Liu, J.; Nelson, P.A. ANL-03/5 Materials Cost Evaluation Report for High-PowerLi-Ion HEV Batteries; Argonne National Lab: Lemont, IL, USA, 2002; Volume 1.
59. Lieberman, M. The Learning Curve and Pricing in the Chemical Processing industries. RAND J. Econ. 1984,15, 213–228.
60. Gaines, L.; Cuenca, R. Costs of Lithium-Ion Batteries for Vehicles; Center for Transportation Research, EnergyDivision, Argonne National Labratorye: Lemont, IL, USA, 2000.
61. Nykvist, B.; Nilsson, M. Rapidly falling costs of battery packs for electric vehicles. Nat. Clim. Chang. 2015,5, 329–332.
62. Anderson, D. An evaluation of current and future costs for lithium-ion batteries for use in electrified vehiclepowertrains. arXiv 2009, arXiv:1011.1669v3.
63. Alibaba. Available online: https://www.alibaba.com/showroom/li-ion-nmc-battery.html (accessed on15 April 2017).
64. Aliexpress. Available online: http://www.aliexpress.com/popular/nmc-battery.html (accessed on15 April 2017).
65. Batteryspace. Available online: http://www.batteryspace.com/LiNiMnCo-Cells/Packs.aspx (accessed on15 April 2017).
66. Chung, D.; Elgqvist, E.; Santhanagopalan, S. Automotive Lithium-ion Cell Manufacturing: Regional CostStructures and Supply Chain Considerations; Clean Energy Manufacturing Analysis Center (CEMAC): Golden,CO, USA, 2016.
67. Ashley, S. Battling the High Cost of EV Batteries; SAE: Washington, DC, USA, 2015.68. Sweeting, J. Project Cost Estimating: Principles and Practice; Institution of Chemical Engineers: Rugby, UK,
1997; pp. 150–170.

Energies 2017, 10, 1314 20 of 20
69. Lacy, S. Stem CTO: Lithium-Ion Battery Prices Fell 70% in the Last 18 Months. Available online:https://www.greentechmedia.com/articles/read/stem-cto-weve-seen-battery-prices-fall-70-in-the-last-18-months (accessed on 4 June 2017).
70. Lambert, F. Electric Vehicle Battery Cost Dropped 80% in 6 Years down to $227/kWh – Tesla Claims to BeBelow $190/kWh. Available online: https://electrek.co/2017/01/30/electric-vehicle-battery-cost-dropped-80-6-years-227kwh-tesla-190kwh/ (accessed on 6 May 2017).
71. The Boston Consulting Group. Batteries for Electric cars: Challanges Opportunities, and the outlook to 2020;Technical Report; The Boston Consulting Group: Boston, MA, USA, 2010.
72. Pillot, C. Battery Market Development for Consumer Electronics, Automotive, and Industrial: MaterialsRequirements and Trends. In Proceedings of the 5th Israeli Power Sources Conference 2015, Herzelia, Israel,20–21 May 2015; Volume 1.
73. Roland and Berger. Technology & Market Drivers for Stationary and Automotive Battery Systems.In Proceedings of the Batteries 2012, Nice, France, 24–26 October 2012.
74. Roland and Berger. The Lithium-Ion Battery Value Chain. In Proceedings of the Batteries 2012, Nice, France,24–26 October 2012.
75. P3 Consulting Group. Cost Developments of Battery Systems; Technical Report; P3 Consulting Group, Inc.:Coral Gables, FL, USA, 2016.
76. Haupt, R.; Kloyer, M.; Lange, M. Patent indicators for the technology life cycle development. Res. Policy2007, 36, 387–398.
c© 2017 by the authors. Licensee MDPI, Basel, Switzerland. This article is an open accessarticle distributed under the terms and conditions of the Creative Commons Attribution(CC BY) license (http://creativecommons.org/licenses/by/4.0/).