i/a systems performance and use considerations susan rask, m.s., r.s. barnstable county department...
TRANSCRIPT

I/A Systems Performance and Use
Considerations
Susan Rask, M.S., R.S. Barnstable County Department of Health and
EnvironmentFebruary 9, 2009
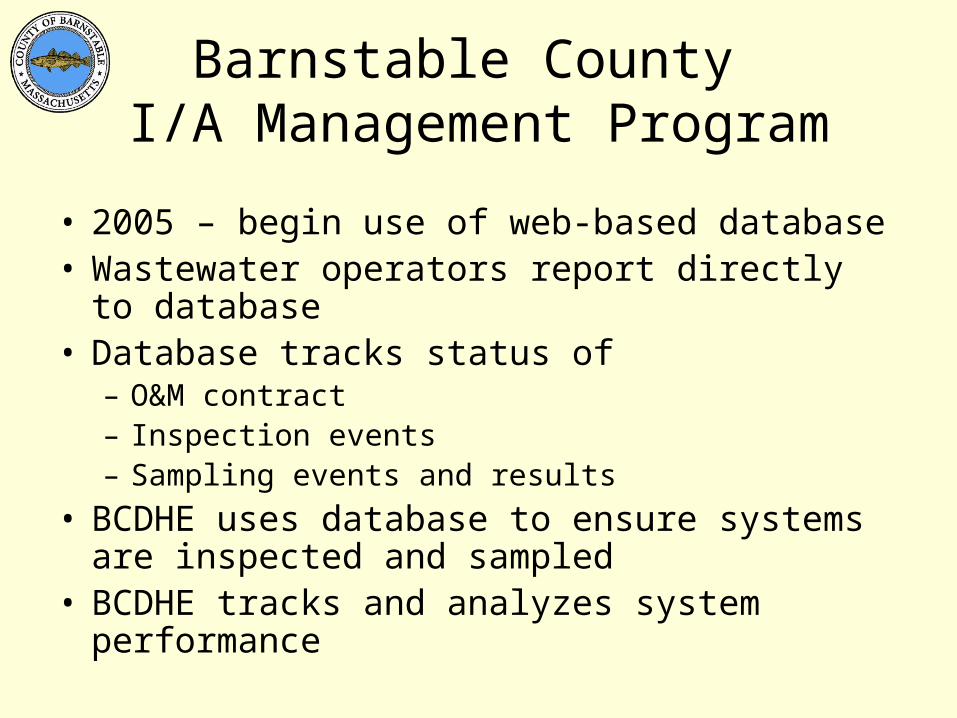
Barnstable County I/A Management Program
• 2005 – begin use of web-based database• Wastewater operators report directly to database • Database tracks status of
– O&M contract– Inspection events– Sampling events and results
• BCDHE uses database to ensure systems are inspected and sampled
• BCDHE tracks and analyzes system performance
I/A systemsTopics for discussion
• How well do they work?
• What are the short and long term costs of installation and use?
• Management issues
• How do they fit with town’s Wastewater Planning efforts?
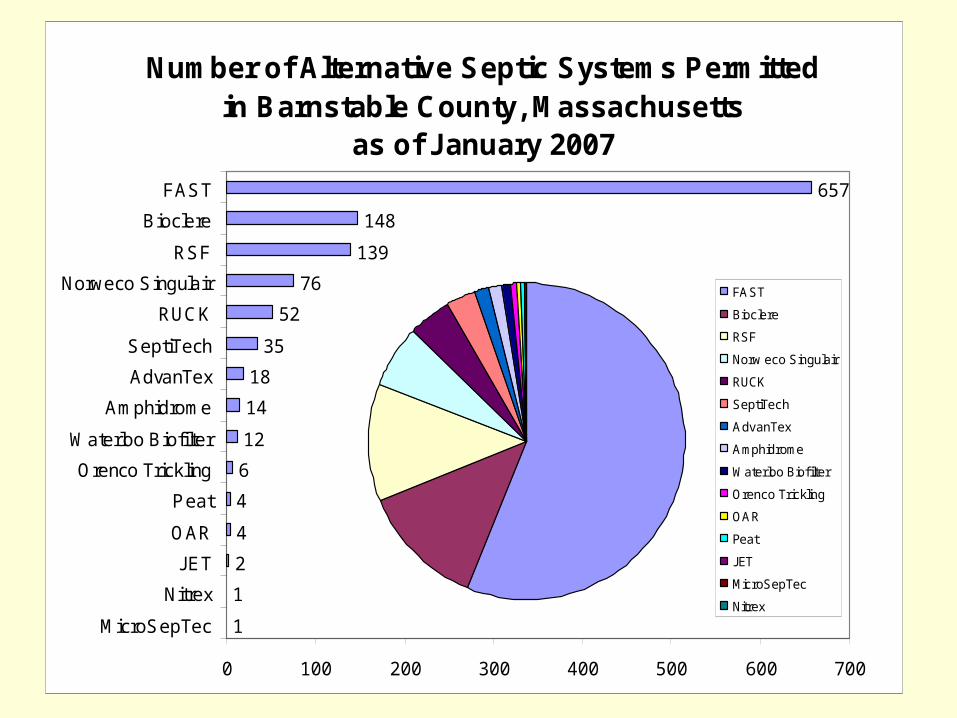
Number of Alternative Septic Systems Permitted in Barnstable County, Massachusetts
as of January 2007
1
1
2
4
4
6
12
14
18
35
52
76
139
148
657
0 100 200 300 400 500 600 700
MicroSepTec
Nitrex
JET
OAR
Peat
Orenco Trickling
Waterloo Biofilter
Amphidrome
AdvanTex
SeptiTech
RUCK
Norweco Singulair
RSF
Bioclere
FAST
FAST
Bioclere
RSF
Norw eco Singulair
RUCK
SeptiTech
AdvanTex
Amphidrome
Waterloo Biof ilter
Orenco Trickling
OAR
Peat
JET
MicroSepTec
Nitrex

Current Number of I/A systems
Number of I/A systems Barnstable County total
0
500
1000
1500
2001 2005 2008
Number of I/Asystems
Permits by Town
Number % of total
Barnstable 66 4.7%
Bourne 110 7.9%
Brewster 34 2.4%
Chatham 115 8.2%
Dennis 193 13.8%
Eastham 126 9.0%
Falmouth 177 12.7%
Harwich 27 1.9%
Mashpee 275 19.7%
Orleans 42 3.0%
Provincetown 18 1.3%
Sandwich 25 1.8%
Truro 17 1.2%
Wellfleet 85 6.1%
Yarmouth 85 6.1%
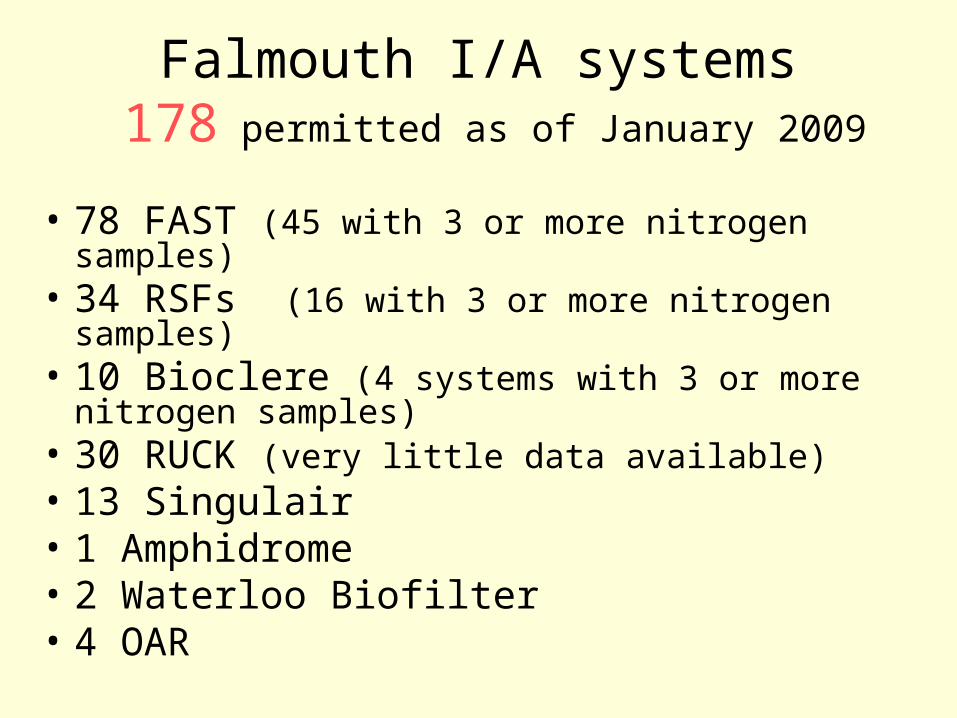
Falmouth I/A systems 178 permitted as of January 2009
• 78 FAST (45 with 3 or more nitrogen samples)• 34 RSFs (16 with 3 or more nitrogen samples)• 10 Bioclere (4 systems with 3 or more nitrogen
samples)• 30 RUCK (very little data available)• 13 Singulair • 1 Amphidrome• 2 Waterloo Biofilter• 4 OAR

Wastewater Treatment for Nitrogen Reduction
Can be configured in many ways.
All have:
• Anaerobic (septic tank )(urea → NH4)
• Aerobic component where nitrification (NH4 → NO3) occurs
• Anaerobic component where denitrification (NO3 → N2 gas) occurs

Bioclere (Trickle filter)

Individual Residential On-site I/AsFactors affecting Performance
• To keep costs low and to keep maintenance minimal for homeowners, most are designed to be as simple and as passive as possible
• Gravity flow where possible• Water flows through system by hydraulic
displacement i.e. Water In = Water Out

Factors affecting Performance
• No Surge Capacity results in varying amounts of residence time and therefore treatment of individual “slugs” of water
• Results in inconsistent levels of treatment

Factors affecting Performance
• Residential Wastewater is highly variable in strength and composition– From residence to residence– From hour to hour and day to day within one
residence
– Results in inconsistent levels of treatment
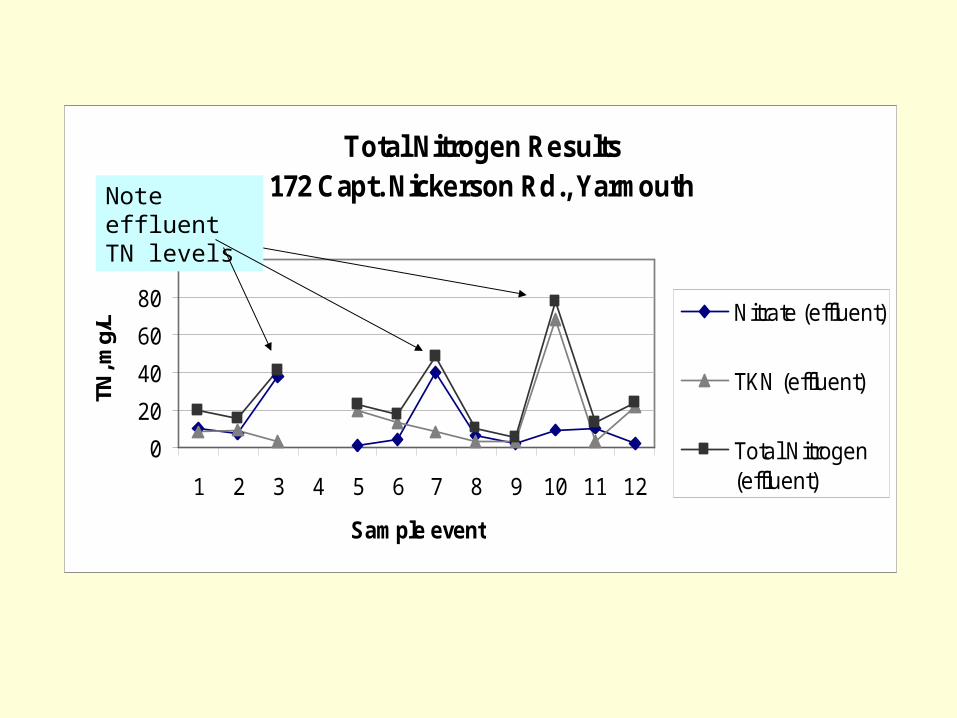
Total Nitrogen Results 172 Capt. Nickerson Rd., Yarmouth
0
20
40
60
80
100
1 2 3 4 5 6 7 8 9 10 11 12
Sample event
TN, m
g/L Nitrate (effluent)
TKN (effluent)
Total Nitrogen(effluent)
Note effluent TN levels
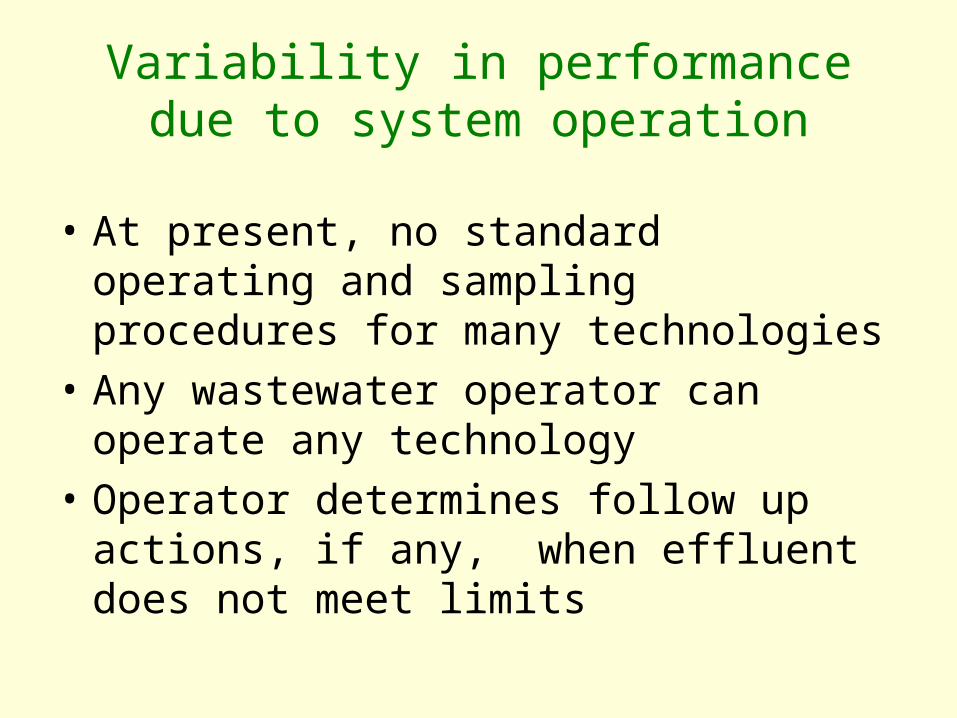
Variability in performance due to system operation
• At present, no standard operating and sampling procedures for many technologies
• Any wastewater operator can operate any technology
• Operator determines follow up actions, if any, when effluent does not meet limits
Data ConsiderationsAll that glitters is not gold
The 19 mg/L total nitrogen requirement
What does it really mean?
What are the assumptions?
19 mg/L
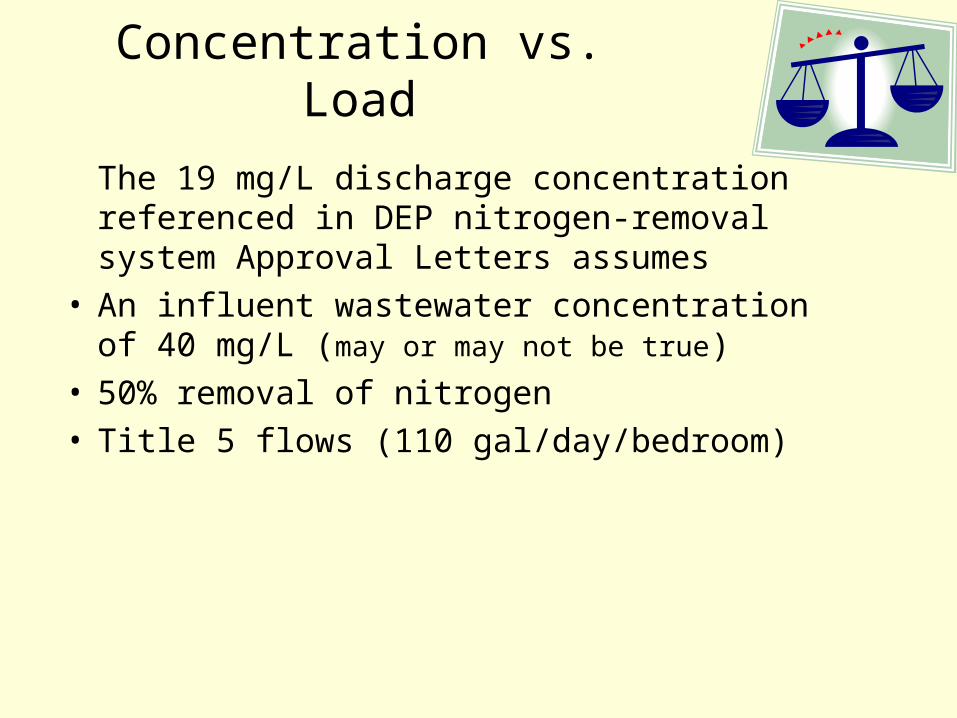
Concentration vs. Load
The 19 mg/L discharge concentration referenced in DEP nitrogen-removal system Approval Letters assumes
• An influent wastewater concentration of 40 mg/L (may or may not be true)
• 50% removal of nitrogen• Title 5 flows (110 gal/day/bedroom)
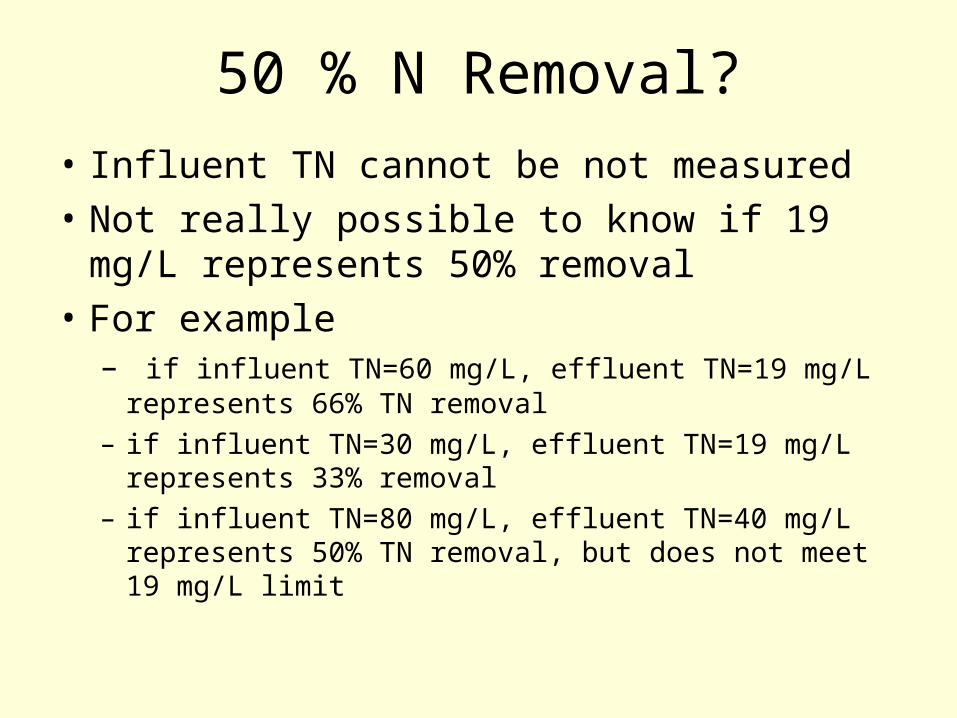
50 % N Removal?
• Influent TN cannot be not measured• Not really possible to know if 19 mg/L
represents 50% removal• For example
– if influent TN=60 mg/L, effluent TN=19 mg/L represents 66% TN removal
– if influent TN=30 mg/L, effluent TN=19 mg/L represents 33% removal
– if influent TN=80 mg/L, effluent TN=40 mg/L represents 50% TN removal, but does not meet 19 mg/L limit
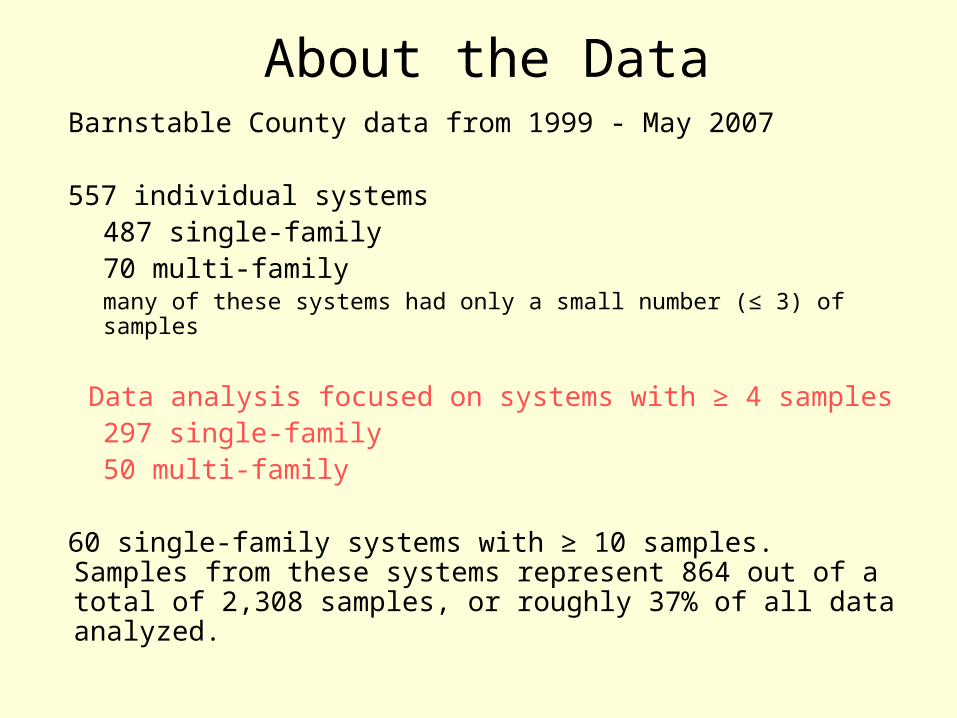
About the DataBarnstable County data from 1999 - May 2007
557 individual systems487 single-family70 multi-familymany of these systems had only a small number (≤ 3) of samples
Data analysis focused on systems with ≥ 4 samples297 single-family50 multi-family
60 single-family systems with ≥ 10 samples. Samples from these systems represent 864 out of a total of 2,308 samples, or roughly 37% of all data analyzed.
0
20
40
60
80
All Technologies Combined - Systems Ranked by Median Value
Tot
al N
itro
gen
(mg/
L)
0
20
40
60
80
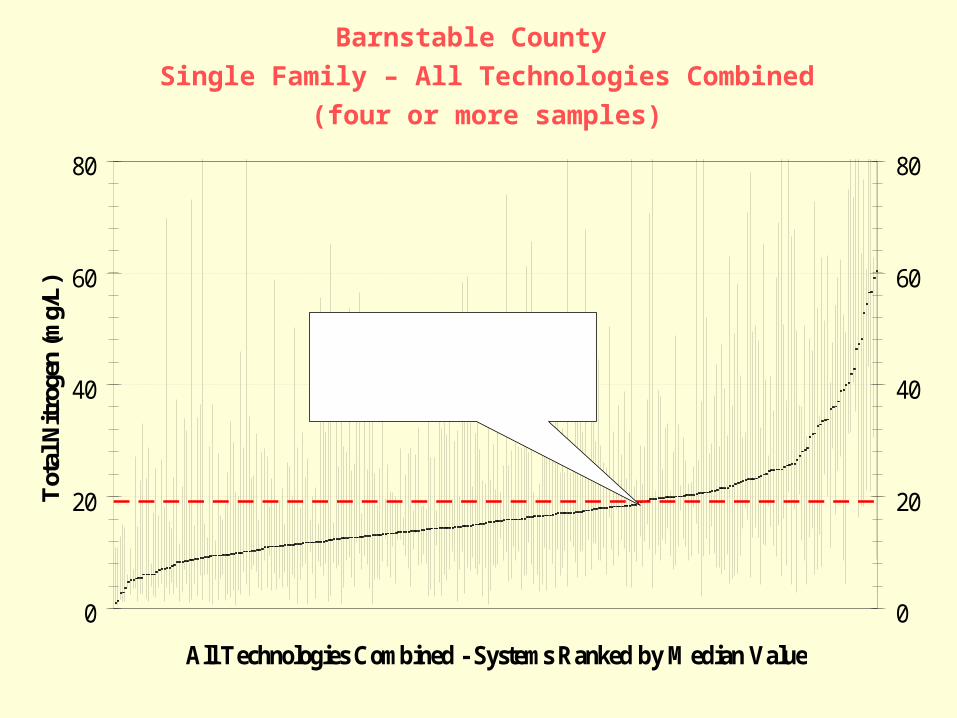
206 of 297 (69%) systems have median TN of 19 mg/L or less.
Barnstable County
Single Family – All Technologies Combined
(four or more samples)
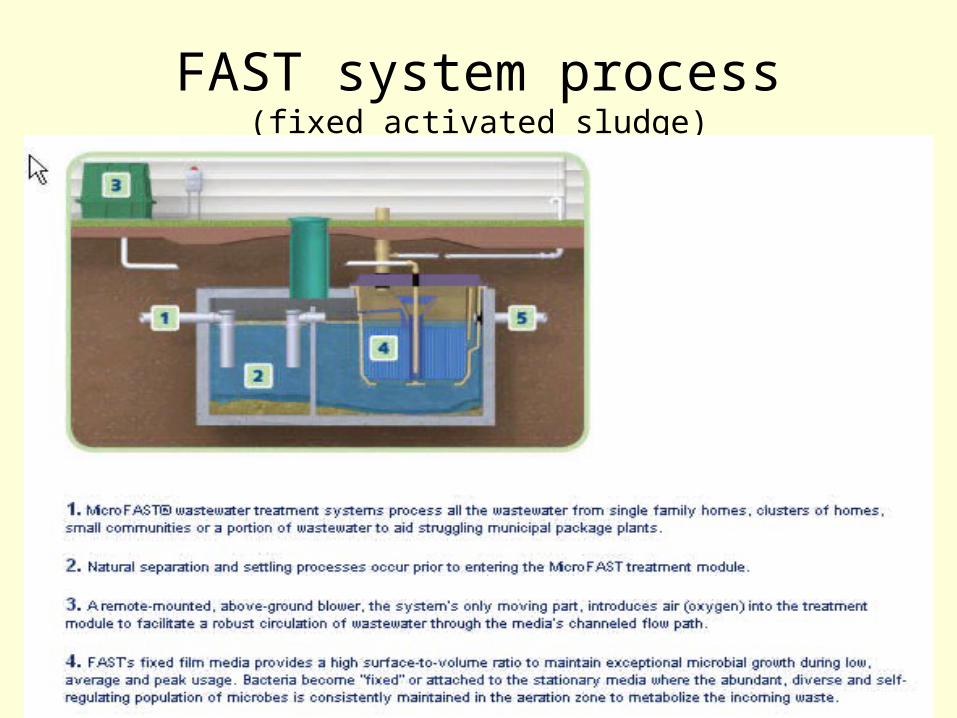
FAST system process(fixed activated sludge)
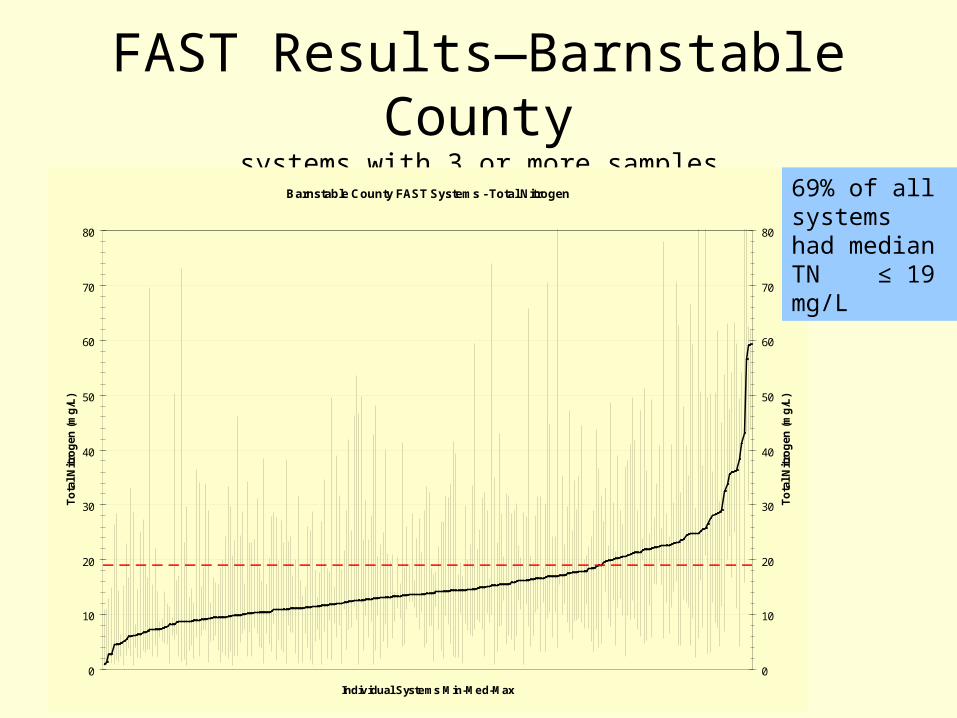
FAST Results—Barnstable Countysystems with 3 or more samples
Barnstable County FAST Systems - Total Nitrogen
0
10
20
30
40
50
60
70
80
Individual Systems Min-Med-Max
To
tal N
itro
gen
(m
g/L
)
0
10
20
30
40
50
60
70
80
To
tal N
itro
gen
(m
g/L
)
69% of all systems had median TN ≤ 19 mg/L

0
20
40
60
80
Systems Ranked by Median Value
To
tal
Nit
rog
en (
mg
/L)
0
20
40
60
80
69 of 88 (78%) systems have median TN of 19 mg/L or less.
Single-Family FAST
Barnstable County Results
(Systems with eight or more samples)
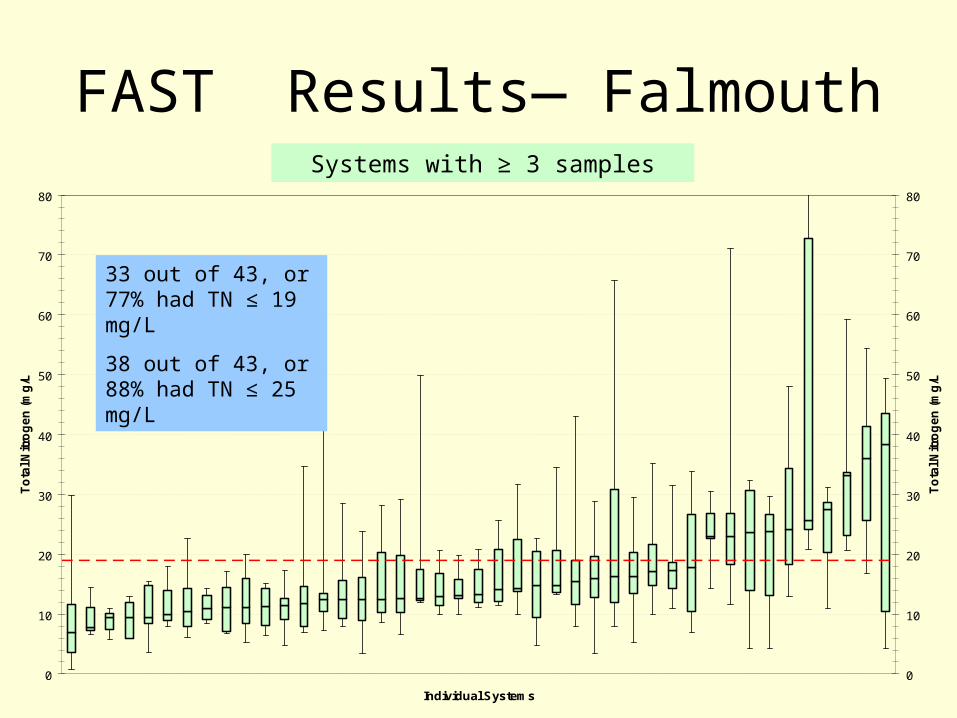
Falmouth FAST Systems
0
10
20
30
40
50
60
70
80
Individual Systems
To
tal N
itro
ge
n (
mg
/L)
0
10
20
30
40
50
60
70
80
To
tal N
itro
ge
n (
mg
/L)
FAST Results— Falmouth
33 out of 43, or 77% had TN ≤ 19 mg/L
38 out of 43, or 88% had TN ≤ 25 mg/L
Systems with ≥ 3 samples
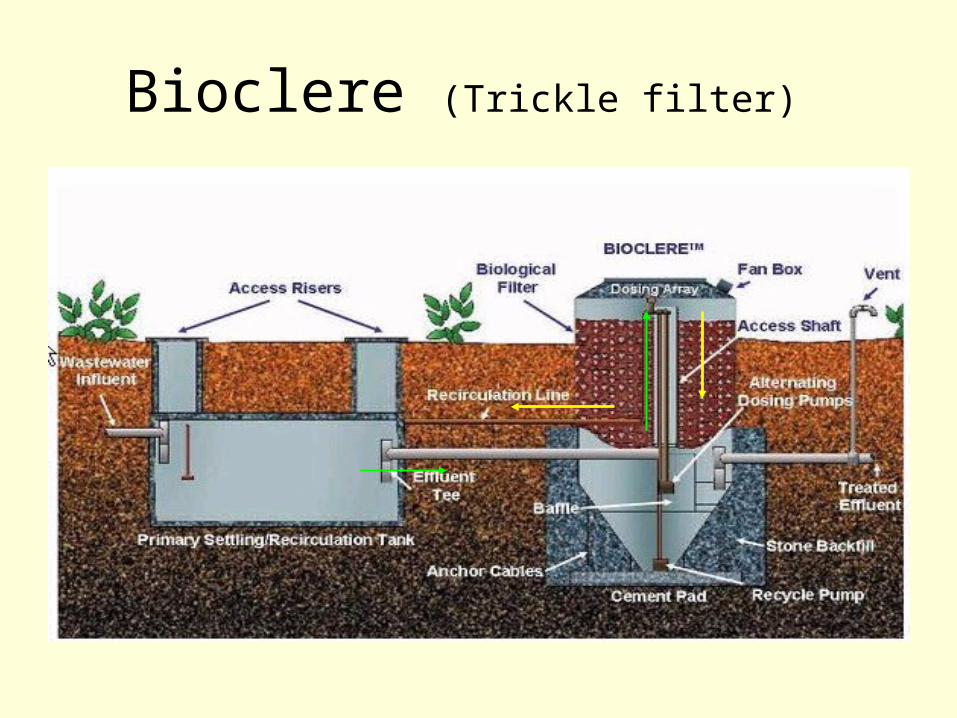
Bioclere (Trickle filter)
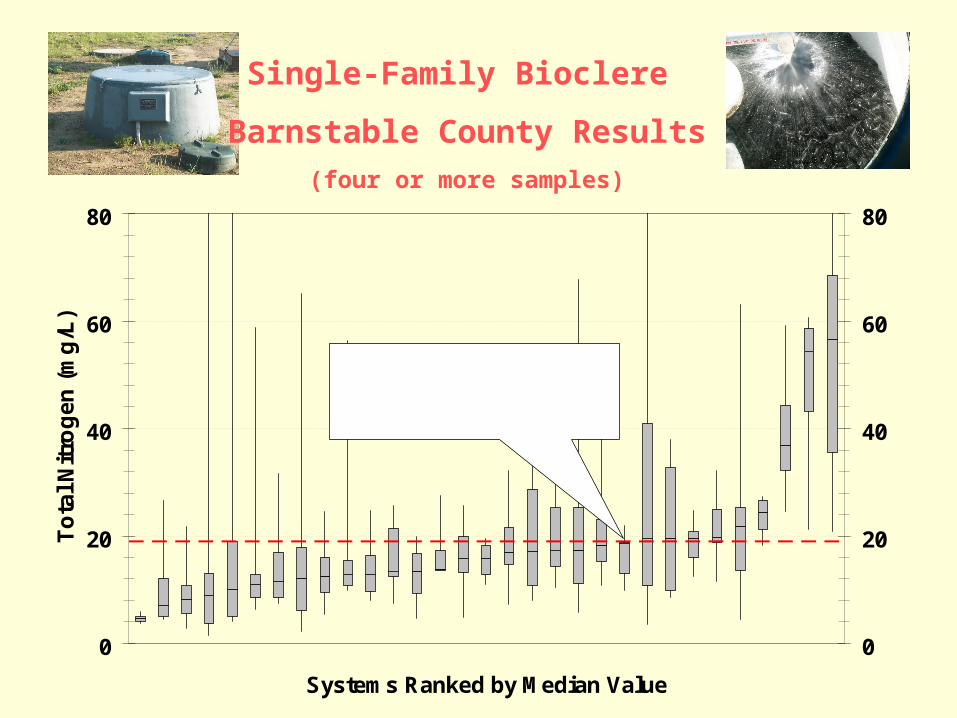
Single-Family Bioclere
Barnstable County Results
(four or more samples)
0
20
40
60
80
Systems Ranked by Median Value
To
tal
Nit
rog
en
(m
g/L
)
0
20
40
60
80
22 of 31 (71%) systems have median TN of 19 mg/L or less.
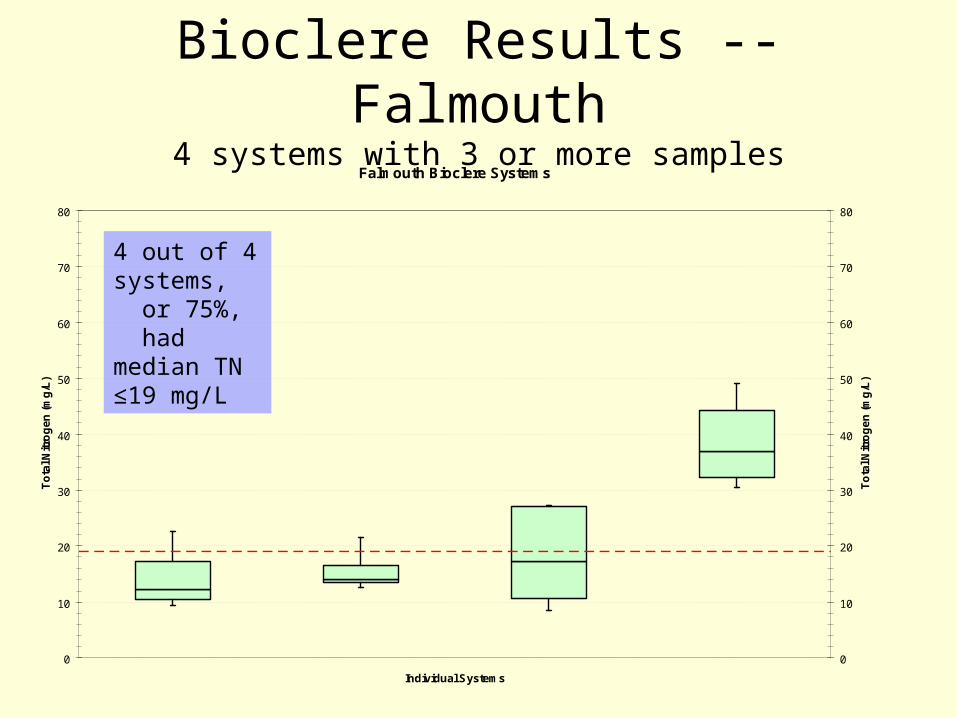
Bioclere Results --Falmouth4 systems with 3 or more samples
4 out of 4 systems, or 75%, had median TN ≤19 mg/L
Falmouth Bioclere Systems
0
10
20
30
40
50
60
70
80
Individual Systems
To
tal N
itro
ge
n (
mg
/L)
0
10
20
30
40
50
60
70
80
To
tal N
itro
ge
n (
mg
/L)

Recirculating Sand Filter (RSF)trickle filter
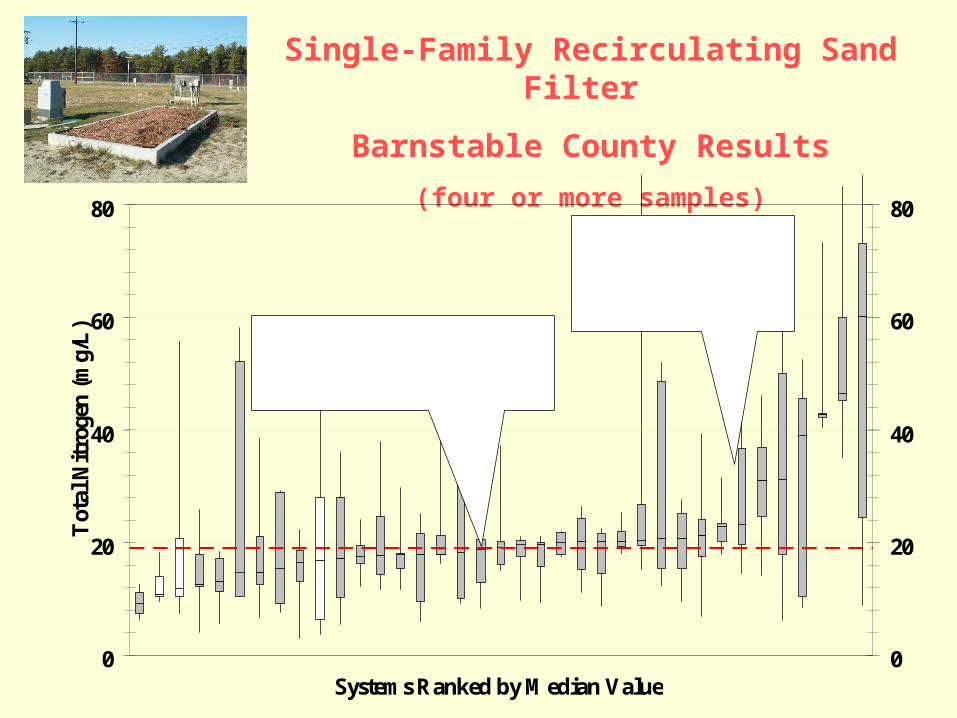
Single-Family Recirculating Sand Filter
Barnstable County Results
(four or more samples)
0
20
40
60
80
Systems Ranked by Median Value
Tot
al N
itro
gen
(m
g/L
)
0
20
40
60
80
18 of 37 (49%) systems have median TN of 19 mg/L or less.
31 of 37 systems (84%) have median TN of 25 mg/L or less.
Falmouth RSF Systems
0
10
20
30
40
50
60
70
80
Individual Systems
To
tal N
itro
ge
n (
mg
/L)
0
10
20
30
40
50
60
70
80
To
tal N
itro
ge
n (
mg
/L)
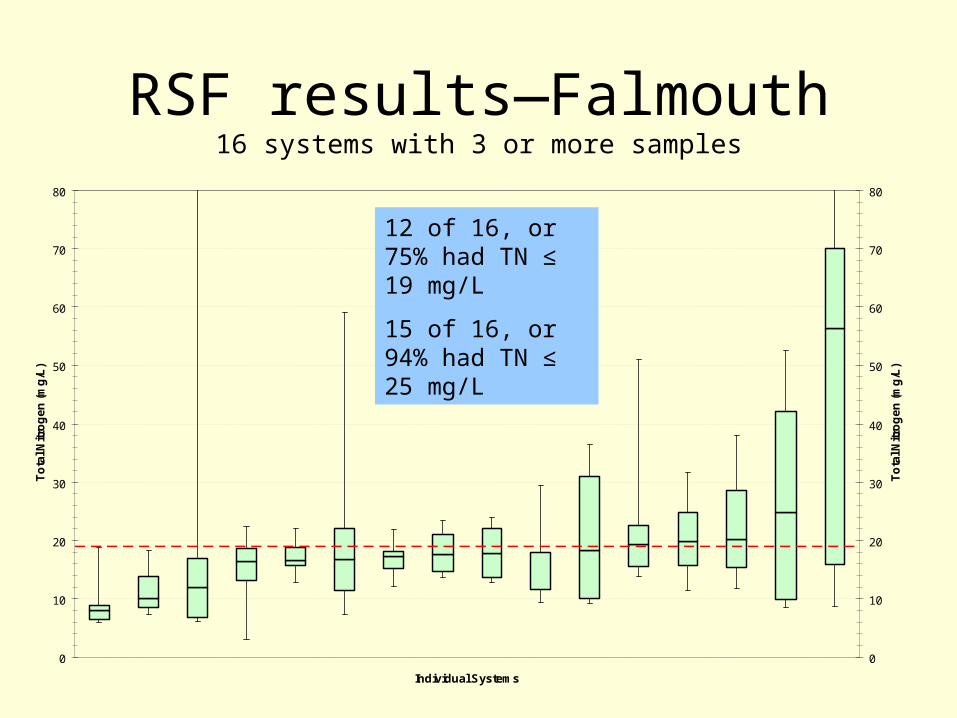
12 of 16, or 75% had TN ≤ 19 mg/L
15 of 16, or 94% had TN ≤ 25 mg/L
RSF results—Falmouth16 systems with 3 or more samples
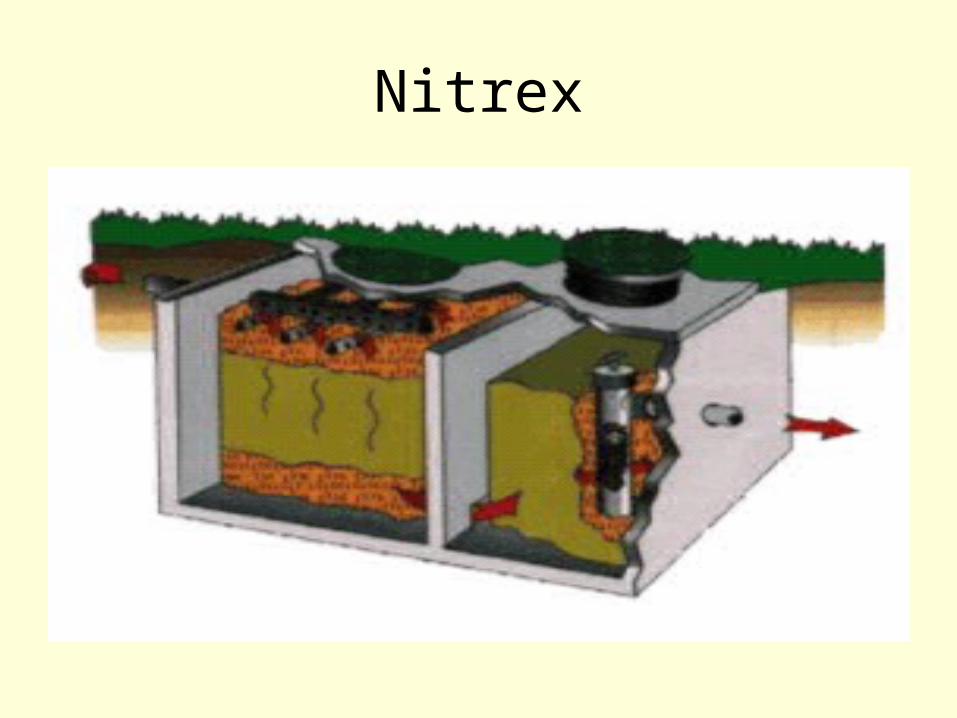
Nitrex

Nitrex process summary
• Wastewater is passed through septic tank, then through an aerobic unit where it is nitrified.
• Nitrified wastewater flows through the Nitrex unit by gravity. The unit contains a proprietary nitrate-reactive media. Inside the unit, the wastewater is denitrified, with loss of nitrogen as N2 gas.

Eastham Nitrex multi-family housing
Nitrex Total Nitrogen Comparison, 15 Dory Lane, Eastham
0
5
10
15
20
25
30
1 3 5 7 9 11 13 15
Sampling Event
Tota
l Nitro
gen (m
g/L
)
Influent TN Effluent TN 12 mg/L Limit
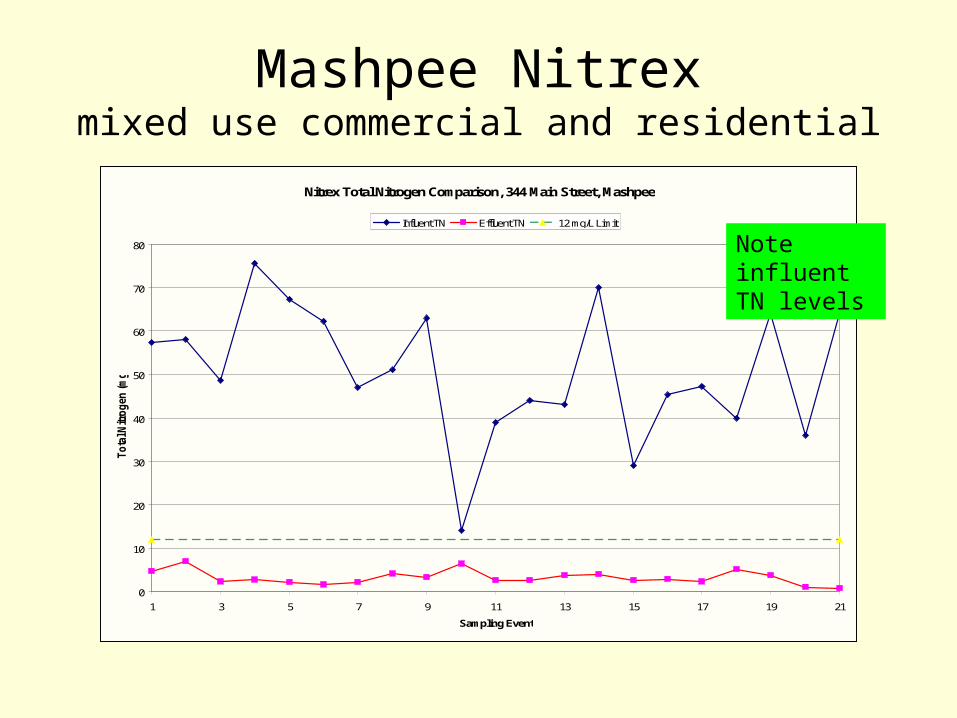
Mashpee Nitrexmixed use commercial and residential
Nitrex Total Nitrogen Comparison, 344 Main Street, Mashpee
0
10
20
30
40
50
60
70
80
1 3 5 7 9 11 13 15 17 19 21
Sampling Event
Tota
l Nitro
gen (m
g/L
)
Influent TN Effluent TN 12 mg/L Limit
Note influent TN levels
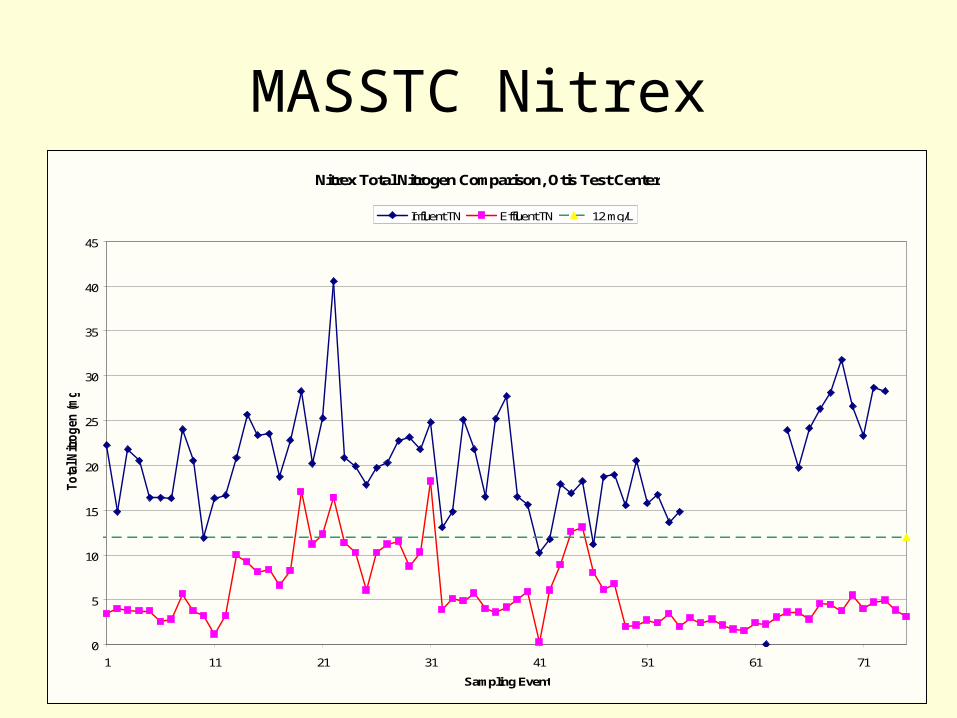
MASSTC NitrexNitrex Total Nitrogen Comparison, Otis Test Center
0
5
10
15
20
25
30
35
40
45
1 11 21 31 41 51 61 71
Sampling Event
Tota
l Nitro
gen (m
g/L
)
Influent TN Effluent TN 12 mg/L
0.00%
10.00%
20.00%
30.00%
40.00%
50.00%
60.00%
70.00%
80.00%
90.00%
100.00%
Sin
gle
-Fa
mily
Mu
lti-
Fa
mily
FA
ST
Bio
cle
re
Sin
gu
lair
RS
F
RU
CK
Se
pti
Te
ch
RS
F(2
5 m
g/L
)
n=297
n=50
n=88n=31
n=14
n=37
n=10
n=8
n=37
Percentage compliance (90%) to allow for General Use Approvalfor nitrogen removal credits.
Summary
90 %

Performance Conclusions
• No innovative/alternative (I/A) onsite septic system technology has demonstrated performance to the degree necessary to gain General Use Approval for 19 mg/L or less Total Nitrogen at the discharge.
• The true efficacy of I/A technologies is obscured somewhat by the absence of water use and influent nitrogen concentration data from homes served.
Bottom Line
• Hard to know how much variability in effluent quality is due to –Inherent ability of each I/A technology to remove N–Operator actions (or lack thereof)–Variability in individual home wastewater strength and
flow–Inconsistency in way systems are sampled
Likely that performance will not improve until we can control more of these variables

I/A Systems: Considerations for Use
• Perception that I/A systems are quick and inexpensive fix
• Not True– Variable performance– At best, remove 50% of nitrogen – Costly over life of system– Stringent O&M and sampling requirements
when used for nitrogen reduction– Impose management burden on town
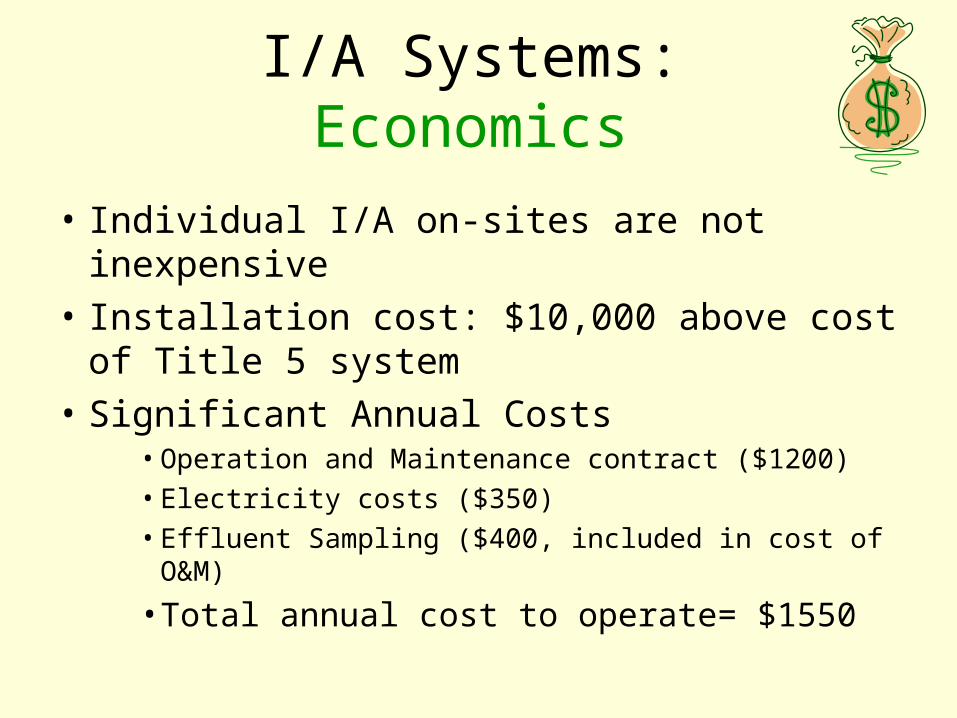
I/A Systems: Economics
• Individual I/A on-sites are not inexpensive
• Installation cost: $10,000 above cost of Title 5 system
• Significant Annual Costs• Operation and Maintenance contract ($1200)• Electricity costs ($350)• Effluent Sampling ($400, included in cost of O&M)
• Total annual cost to operate= $1550

I/A Systems: Economics Present value cost of I/A system
• Present value analysis brings all costs associated with system installation, maintenance and operation of the system, over the entire life of the system, into present dollars
i.e. How much money would I have to set aside today to cover all costs associated with the system over it’s life span?

I/A Systems: Economics Present value cost of I/A system
• Assumptions:– Installation cost $10,000– Annual O&M contract $1200/yr– Electricity to operate $350/yr– Quarterly inspection and effluent sampling– 20 year life of system– 5% interest rate
Yields present value of roughly $35,000.
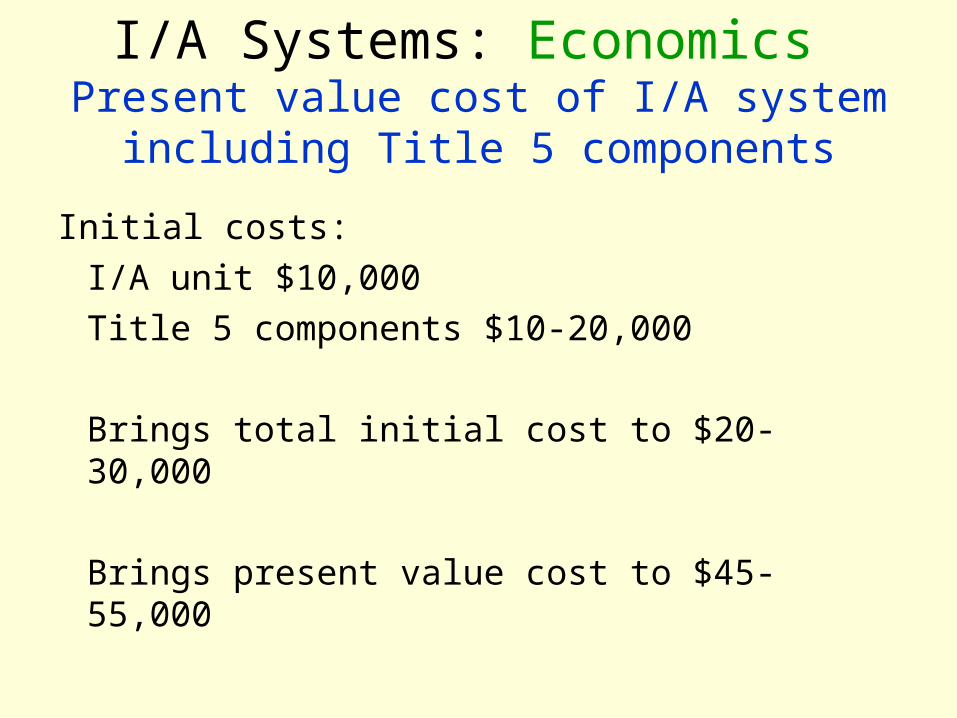
I/A Systems: Economics Present value cost of I/A system including
Title 5 components
Initial costs:
I/A unit $10,000
Title 5 components $10-20,000
Brings total initial cost to $20-30,000
Brings present value cost to $45-55,000
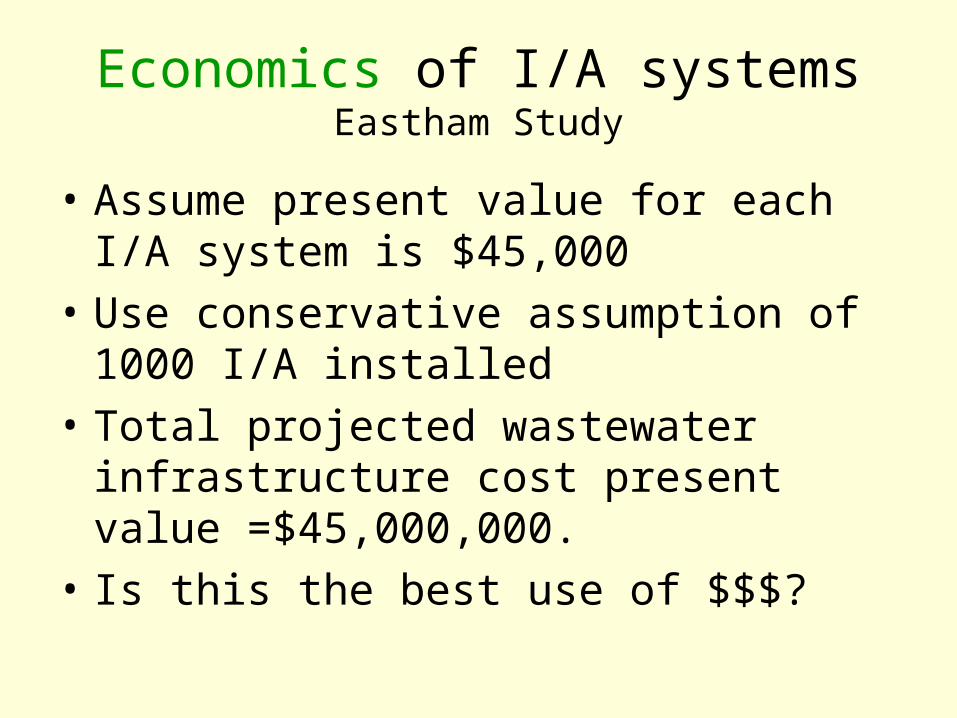
Economics of I/A systemsEastham Study
• Assume present value for each I/A system is $45,000
• Use conservative assumption of 1000 I/A installed
• Total projected wastewater infrastructure cost present value =$45,000,000.
• Is this the best use of $$$?
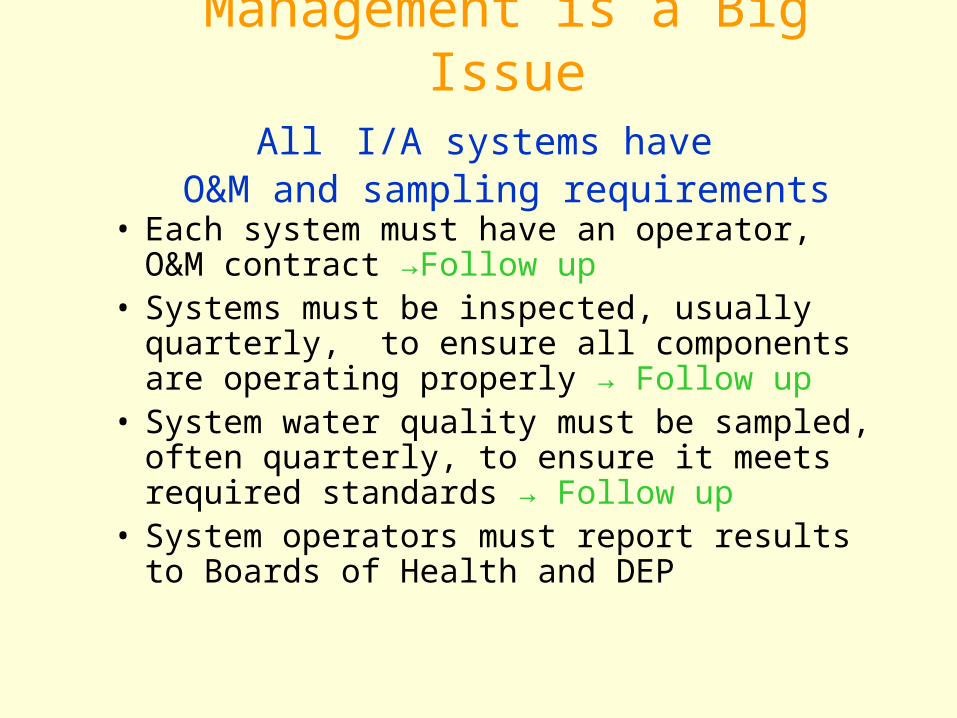
Management is a Big IssueAll I/A systems have
O&M and sampling requirements
• Each system must have an operator, O&M contract →Follow up
• Systems must be inspected, usually quarterly, to ensure all components are operating properly → Follow up
• System water quality must be sampled, often quarterly, to ensure it meets required standards → Follow up
• System operators must report results to Boards of Health and DEP
I/A Management Issues
• People want to put these systems in the ground and forget about them, the way we’ve always been able to do with our Title 5 systems.
• Homeowners resist paying annual costs, so maintenance contracts lapse, O&M and sampling are not performed
Management for performance
– Many systems do not always operate optimally and, unless followed up by Health Dept. staff, many operators seem to show little interest in re-visiting a system to adjust its performance.
– Extra visits by the system operator to adjust system cost owners extra operator and lab fees.
– Financial disincentive for operators to follow up poorly performing systems aggressively, for fear that extra costs will cause owner to contract with a less expensive operator.

Management
• Real estate transfer:– Current owner is required to notify buyer of
presence of I/A system and associated O&M and sampling requirements.
– Notification frequently does not occur, leaving buyers unhappy, resistant to complying with expensive requirements, in need of education about what is required of them.

Management • Seasonally occupied homes
– Estimate 40% of all systems county-wide are likely seasonal use
– All technologies work by biological treatment of wastes. It takes at least 4-6 weeks after start up to bring the bacterial populations up to effective levels.
– Full nitrogen reduction is not achieved until 4-6 weeks after seasonal start-up.
– Difficult to follow up on systems that perform poorly, because season ends and house is closed
Management
• Is there adequate Health Department or other staff time to ensure systems– Have O&M contract– Are inspected– Are sampled as required– Are adjusted as needed to optimize performance
A management plan is needed before committing to a large number of these systems
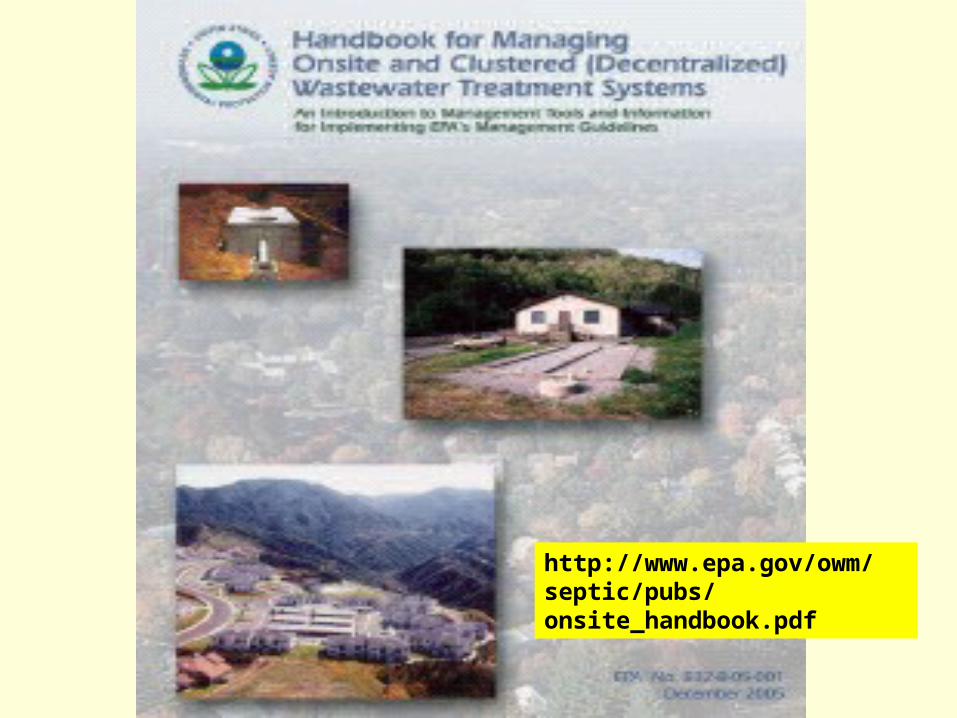
EPA guidance
http://www.epa.gov/owm/septic/pubs/onsite_handbook.pdf

Management Issues
• I/A treatment systems are performance based
• US EPA recommends that performance-based systems be operated and managed by Responsible Management Entity (RME)
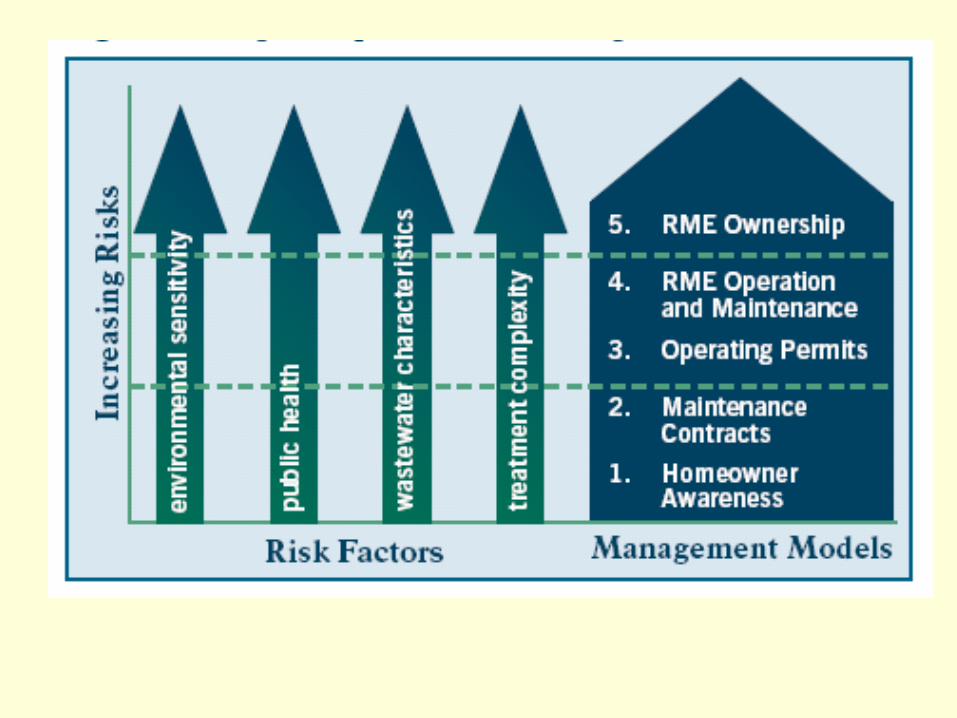

US EPA management models
• 5 levels• Barnstable County fits Level 4: “Areas of
moderate to high environmental sensitivity where reliable and sustainable system operation and maintenance is required (sole source aquifers, wellhead or source water protection zones, critical aquatic habitats, and outstanding value resource waters)”.
• US EPA Recommends creation a Responsible Management Entity (RME) for Operation
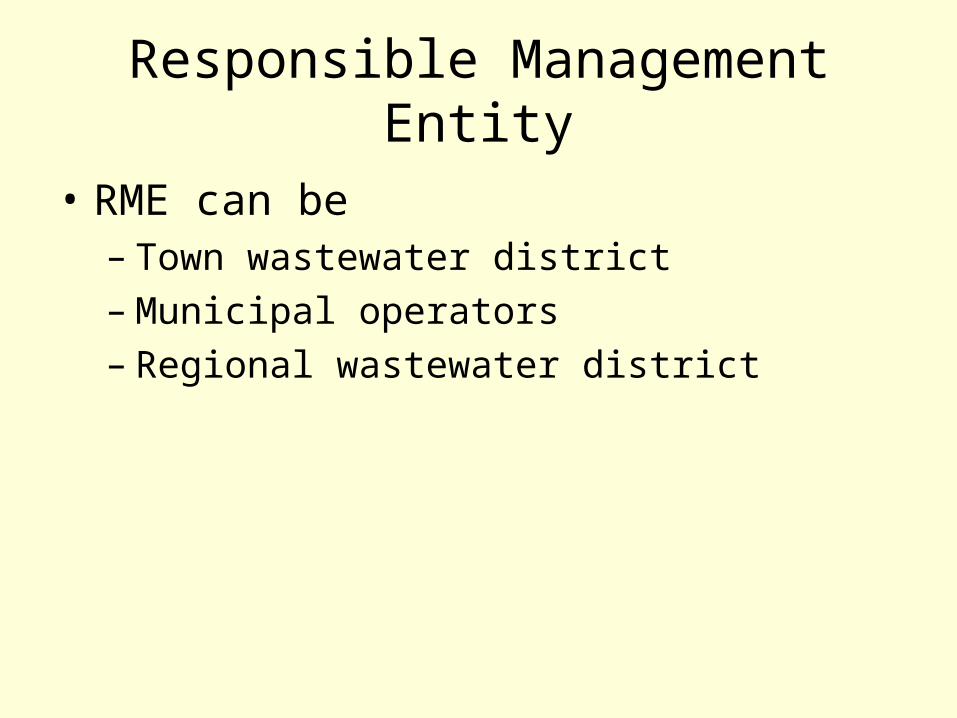
Responsible Management Entity
• RME can be – Town wastewater district – Municipal operators– Regional wastewater district
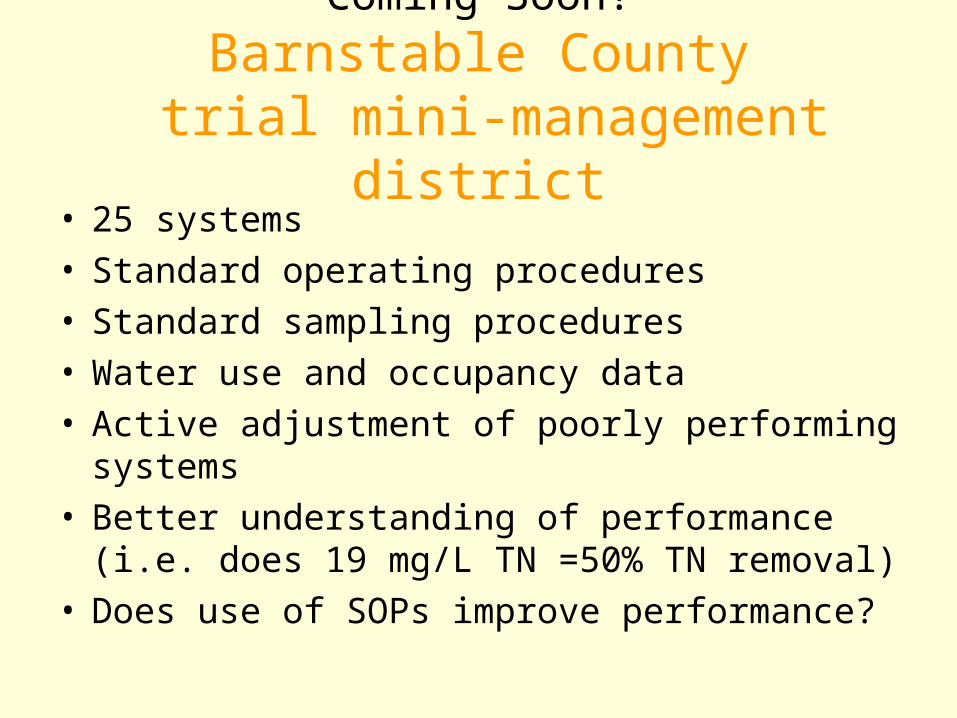
Coming Soon!
Barnstable County trial mini-management district
• 25 systems• Standard operating procedures• Standard sampling procedures• Water use and occupancy data• Active adjustment of poorly performing systems • Better understanding of performance (i.e. does
19 mg/L TN =50% TN removal)• Does use of SOPs improve performance?
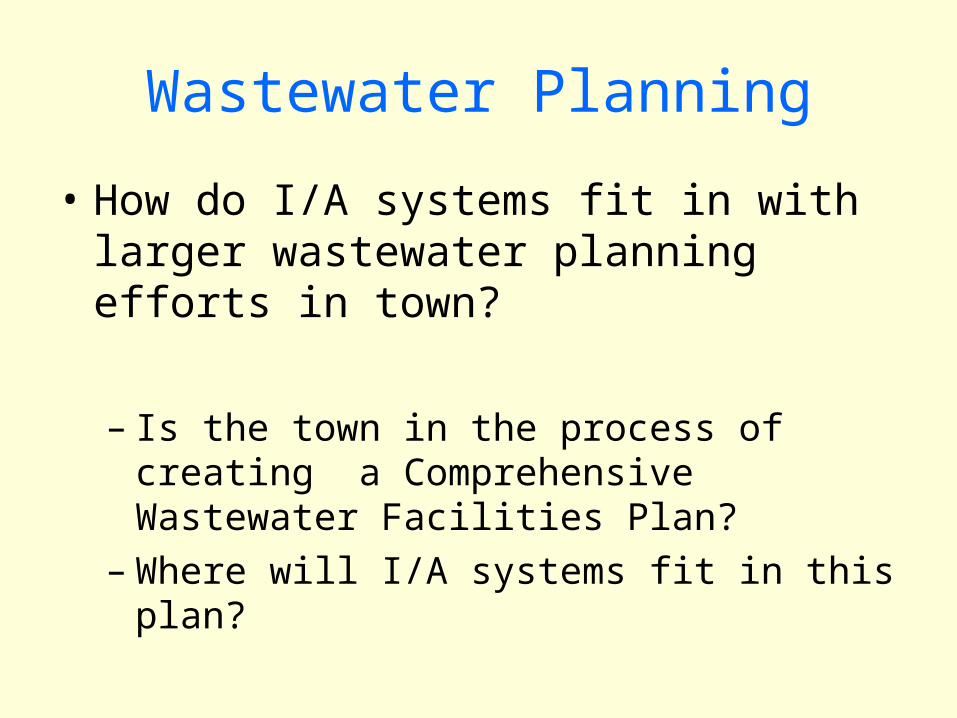
Wastewater Planning
• How do I/A systems fit in with larger wastewater planning efforts in town?
– Is the town in the process of creating a Comprehensive Wastewater Facilities Plan?
– Where will I/A systems fit in this plan?
Town Wastewater Planning
I/A System Benefits
• Some % nitrogen is removed• These systems are available now• May be good answer in areas
– where sewering is too costly due to low housing density
– sewering won’t happen in foreseeable future– for large developments in areas not intended for
sewering

Town Wastewater Planning
– A planned approach is better than installing systems randomly all over town.
– For example:• Will systems be used to remediate or prevent a
problem in a specific area, in a planned way? • Or will they be installed randomly when systems
needing upgrades with variances come before the Board of Health?
– Systems installed randomly will likely have little impact on improving groundwater nitrogen levels
Town Wastewater Planning
• Installation of I/A systems may preclude better wastewater solutions – Once owners have spent the money to
upgrade their system to I/A, they are unlikely to support cost of sewering their neighborhood

Questions ?QUESTIONS?