barnstable county, massachusetts · barnstable county, massachusetts (all jurisdictions) community...
TRANSCRIPT
Federal Emergency Management AgencyFLOOD INSURANCE STUDY NUMBER
25027CV000A
BARNSTABLE COUNTY, MASSACHUSETTS (ALL JURISDICTIONS) COMMUNITY NAME COMMUNITY NUMBER BARNSTABLE, TOWN OF 250001 BOURNE, TOWN OF 255210 BREWSTER, TOWN OF 250003 CHATHAM, TOWN OF 250004 DENNIS, TOWN OF 250005 EASTHAM, TOWN OF 250006 FALMOUTH, TOWN OF 255211 HARWICH, TOWN OF 250008 MASHPEE, TOWN OF 250009 ORLEANS, TOWN OF 250010 PROVINCETOWN, TOWN OF 255218 SANDWICH, TOWN OF 250012 TRURO, TOWN OF 255222 WELLFLEET, TOWN OF 250014 YARMOUTH, TOWN OF 250015
PRELIMINARY May 12, 2009
BARNSTABLE COUNTY
NOTICE TO FLOOD INSURANCE STUDY USERS
Communities participating in the National Flood Insurance Program have established repositories of flood hazard data for floodplain management and flood insurance purposes. This Flood Insurance Study (FIS) may not contain all data available within the repository. It is advisable to contact the community repository for any additional data. Selected Flood Insurance Rate Map panels for the community contain information that was previously shown separately. In addition, former flood hazard zone designations have been changed as follows:
Old Zone New Zone A1 through A30 AE V1 through V30 VE
B X C X
Part or all of this Flood Insurance Study may be revised and republished at any time. In addition, part of this Flood Insurance Study may be revised by the Letter of Map Revision process, which does not involve republication or redistribution of the Flood Insurance Study. It is, therefore, the responsibility of the user to consult with community officials and to check the community repository to obtain the most current Flood Insurance Study components. Initial Countywide FIS Effective Date:
ii
TABLE OF CONTENTS Page
1.0 INTRODUCTION 1
1.1 Purpose of Study 1
1.2 Authority and Acknowledgments 1
1.3 Coordination 5
2.0 AREA STUDIED 6
2.1 Scope of Study 6
2.2 Community Description 14
2.3 Principal Flood Problems 16
2.4 Flood Protection Measures 20
3.0 ENGINEERING METHODS 21
3.1 Precountywide Coastal Hydrologic Analyses 22
3.2 Precountywide Coastal Hydraulic Analyses 24
3.3 Countywide Coastal Analyses 28
3.4 Vertical Datum 95
4.0 FLOODPLAIN MANAGEMENT APPLICATIONS 96
4.1 Floodplain Boundaries 97
5.0 INSURANCE APPLICATIONS 98
6.0 FLOOD INSURANCE RATE MAP 99
7.0 OTHER STUDIES 103
8.0 LOCATION OF DATA 103
9.0 BIBLIOGRAPHY AND REFERENCES 103
iii
TABLE OF CONTENTS – continued
Page
FIGURES
Figure 1 – Transect Schematic 73
TABLES
Table 1 – CCO Meetings Dates for Precountywide FIS 5 Table 2 – Flooding Sources Studied by Detailed Methods 6 Table 3 - Flooding Sources Studied by Approximate Methods 10 Table 4 - Letters of Map Change 13 Table 5 - Population and Total Area by Community 14 Table 6 –Countywide Summary of Stillwater Elevations 29 Table 7 –Countywide Transect Descriptions 39 Table 8 –Countywide Transect Data 73 Table 9 – Community History Map 100 Exhibit 1 - Flood Insurance Rate Map Index Flood Insurance Rate Map
1
FLOOD INSURANCE STUDY BARNSTABLE, MASSACHUSETTS [ALL JURISDICTIONS] 1.0 INTRODUCTION
1.1 Purpose of Study
This Flood Insurance Study (FIS) revises and updates information on the existence and severity of flood hazards in the geographic area of Barnstable County, including the Towns of Barnstable, Bourne, Brewster, Chatham, Dennis, Eastham, Falmouth, Harwich, Mashpee, Orleans, Provincetown, Sandwich, Truro, Wellfleet and Yarmouth (referred to collectively herein as Barnstable County), and aids in the administration of the National Flood Insurance Act of 1968 and the Flood Disaster Protection Act of 1973. This study has developed flood-risk data for various areas of the community that will be used to establish actuarial flood insurance rates and to assist the community in its efforts to promote sound floodplain management. Minimum floodplain management requirements for participation in the National Flood Insurance Program (NFIP) are set forth in the Code of Federal Regulations at 44 CFR, 60.3. In some States or communities, floodplain management criteria or regulations may exist that are more restrictive or comprehensive than the minimum Federal requirements. In such cases, the more restrictive criteria take precedence, and the State (or other jurisdictional agency) will be able to explain them.
1.2 Authority and Acknowledgments The sources of authority for this FIS report are the National Flood Insurance Act of 1968 and the Flood Disaster Protection Act of 1973. This FIS was prepared to incorporate all the communities within Barnstable in a countywide format. Information on the authority and acknowledgements for each jurisdiction included in this countywide FIS, as compiled from their previously printed FIS reports, is shown below:
Barnstable, Town of The hydrologic and hydraulic analyses in the February 19, 1985 study represent a revision of the original analyses by the New England Division of the U.S. Army Corps of Engineers (USACE) for the Federal Emergency Management Agency (FEMA), under Inter Agency Agreement No. IAA-H-02-73 and IAA-H-19-74, Project Order No.

2
Barnstable, Town of cont’d 14 and 15, respectively. The updated version was prepared by Anderson-Nichols & Co., Inc., for FEMA, under Contract No. H-4605. This work was completed in September 1983.
Bourne, Town of For the December 5, 1984, FIS report and June 5, 1985, FIRM, the hydrologic and hydraulic analyses (which revised the analyses prepared by the USACE for the January 2, 1976, FIS) were prepared by Anderson-Nichols & Co., Inc., for the Federal Emergency Management Agency (FEMA), under Contract No. H-4605. That work was completed in September 1983.
For the August 9, 1999 revision, revised coastal analyses were prepared by ENSR Consulting & Engineering for FEMA under Contract No. EMW-93-C-420 1. Mapping was provided by James W. Sewall Co. This work was completed in October 1994. Dewberry & Davis subsequently revised the ENSR Consulting & Engineering analyses for FEMA.
Brewster, Town of The hydrologic and hydraulic analyses for
the December 19, 1985 study were prepared by PRC Harris for FEMA, under Contract No. H-4776 (completed in August 1980) and under Contract Modification No. M010. This study was completed in August 1983.
Chatham, Town of The hydrologic and hydraulic analyses in the
January 16, 1992 study represent a revision of the previous analyses prepared by Anderson-Nichols & Co., Inc., for FEMA, under Contract No. H-4605. The work for that study was completed in September 1983. The 1992 revised hydrologic and hydraulic analyses of Chatham Harbor/Pleasant Bay reflecting the breaching of Nauset Beach in the updated study were prepared by Stone & Webster Engineering Corporation (SWEC), for FEMA under Contract No. EM-89-C-2817.
3
Chatham, Town of cont’d The work for this updated study was completed in January 1990.
Dennis, Town of The hydrologic and hydraulic analyses in the
July 3, 1986 study represent a revision of the original analyses by USACE for FEMA, under Inter-Agency Agreement No. IAA-H-2-73, Project Order No. 2. The hydrologic and hydraulic analyses for this study were conducted by Schoenfeld Associates, Inc., under subcontract to the COE. The updated version was prepared by Anderson-Nichols & Co, Inc., under agreement with FEMA, under Contract No. H-4605. This study was completed in September 1983. The hydrologic and hydraulic analyses in the updated 1986 study were computed by Anderson-Nichols & Co., Inc.
Eastham, Town of The hydrologic and hydraulic analyses for
the July 3, 1986 study were prepared by PRC Harris for the FEMA, under Contract No. H-4776 (completed in May 1981) and under Contract Modification No. M010. This study was completed in August 1983.
Falmouth, Town of The hydrologic and hydraulic analyses in the
May 15, 1986 study represent a revision of the original analyses by Anderson-Nichols & Co., Inc., for FEMA. The original work was completed in 1979. The updated version was also prepared by Anderson-Nichols & Co., Inc., for FEMA, under Contract NO. H-4605. This work was completed in August 1983.
Harwich, Town of The hydrologic and hydraulic analyses in the December 3, 1991 study represent two revisions of the original analyses. The first revision was prepared by Anderson-Nichols & Co., Inc., for FEMA, under Contract No. H-4605, and was completed in August 1983. The second revision was prepared by Dewberry & Davis, under Contract No. EMW-89-C-2906, and was completed in August 1990.
4
Mashpee, Town of The hydrologic and hydraulic analyses in the
December 5, 1984 study represent a revision of the original analyses by the USACE, New England Division, for FEMA, under Inter-Agency Agreement No. IAA-H-2-73, Project Order 14, and Inter-Agency Agreement No. IAA-H-1974, Project Order 15. The 1984 updated version was prepared by Anderson-Nichols & Co., Inc., under agreement with FEMA, under Contract No. H-4605. This work was completed in August 1983. The hydrologic and hydraulic analyses in the updated study were computed by Anderson-Nichols & Co.
Orleans, Town of The hydrologic and hydraulic analyses for
the original September 4, 1986 study were prepared by PRC Harris for FEMA, under Contract No. H-4776 (completed in June 1981) and under Contract Modification No. M010. That study was completed in August 1983. In the December 3, 1991 revision, the hydrologic analyses for Pleasant Bay, which includes Little Pleasant Bay, The River, and the Namequoit River estuaries, were revised by Dewberry & Davis. This work was completed in August 1990.
Provincetown, Town of The hydrologic and hydraulic analyses for
the December 19, 1984 study were prepared by Anderson-Nichols & Co., Inc., for FEMA, under Contract No. H-4605. This work was completed in September 1983.
Sandwich, Town of The hydrologic and hydraulic analyses in the
original June 18, 1980 study were prepared by Anderson-Nichols & Co., Inc., for FEMA, under Contract No. H-4605. The October 1983 revision was prepared by Anderson-Nichols & Co., Inc., for FEW,under Contract No. H-4605. A second 1985 revision, also prepared by Anderson -Nichols & Co., Inc., incorporated wave height and wave runup analyses. The third
5
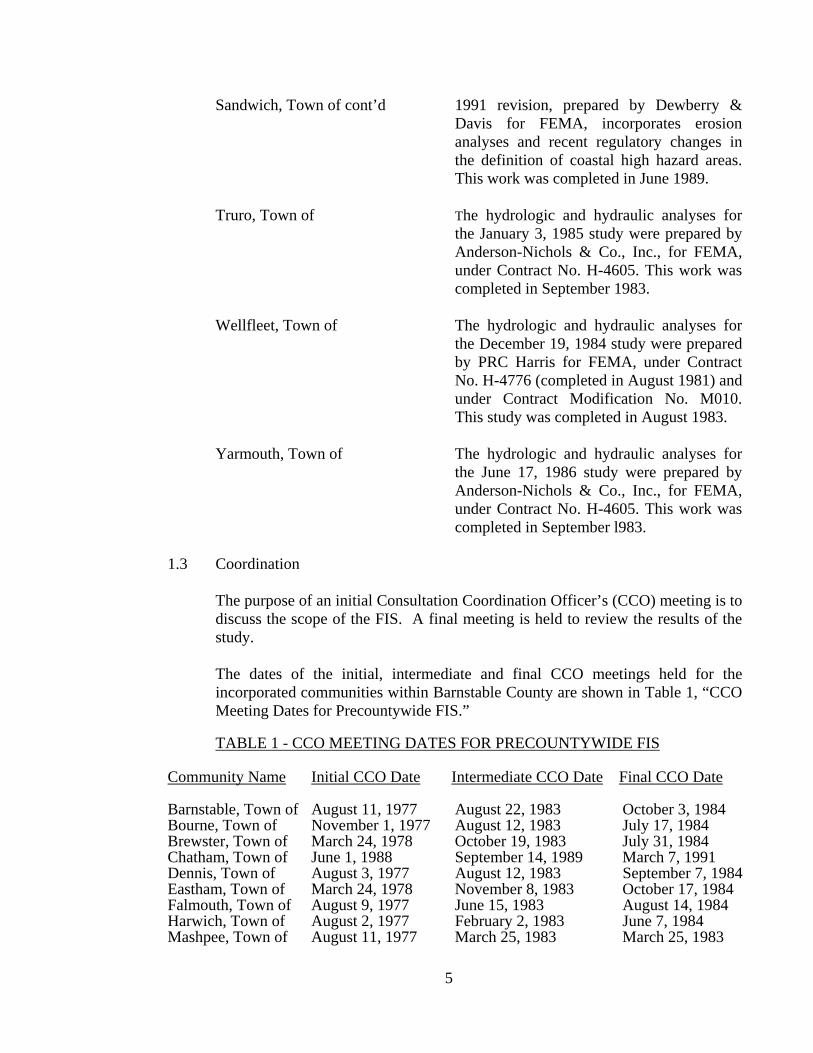
Sandwich, Town of cont’d 1991 revision, prepared by Dewberry & Davis for FEMA, incorporates erosion analyses and recent regulatory changes in the definition of coastal high hazard areas. This work was completed in June 1989.
Truro, Town of The hydrologic and hydraulic analyses for
the January 3, 1985 study were prepared by Anderson-Nichols & Co., Inc., for FEMA, under Contract No. H-4605. This work was completed in September 1983.
Wellfleet, Town of The hydrologic and hydraulic analyses for
the December 19, 1984 study were prepared by PRC Harris for FEMA, under Contract No. H-4776 (completed in August 1981) and under Contract Modification No. M010. This study was completed in August 1983.
Yarmouth, Town of The hydrologic and hydraulic analyses for
the June 17, 1986 study were prepared by Anderson-Nichols & Co., Inc., for FEMA, under Contract No. H-4605. This work was completed in September l983.
1.3 Coordination
The purpose of an initial Consultation Coordination Officer’s (CCO) meeting is to discuss the scope of the FIS. A final meeting is held to review the results of the study. The dates of the initial, intermediate and final CCO meetings held for the incorporated communities within Barnstable County are shown in Table 1, “CCO Meeting Dates for Precountywide FIS.” TABLE 1 - CCO MEETING DATES FOR PRECOUNTYWIDE FIS
Community Name Initial CCO Date Intermediate CCO Date Final CCO Date Barnstable, Town of August 11, 1977 August 22, 1983 October 3, 1984 Bourne, Town of November 1, 1977 August 12, 1983 July 17, 1984 Brewster, Town of March 24, 1978 October 19, 1983 July 31, 1984 Chatham, Town of June 1, 1988 September 14, 1989 March 7, 1991 Dennis, Town of August 3, 1977 August 12, 1983 September 7, 1984 Eastham, Town of March 24, 1978 November 8, 1983 October 17, 1984 Falmouth, Town of August 9, 1977 June 15, 1983 August 14, 1984 Harwich, Town of August 2, 1977 February 2, 1983 June 7, 1984 Mashpee, Town of August 11, 1977 March 25, 1983 March 25, 1983

6
TABLE 1 - CCO MEETING DATES FOR PRECOUNTYWIDE FIS – cont’d
Community Name Initial CCO Date Intermediate CCO Date Final CCO Date Orleans, Town of March, 24 1978 November 8, 1983 October, 18 1984 Provincetown, August 2, 1977 July 19, 1983 March 30, 1984 Town of Sandwich, Town of August 2, 1977 March 17, 1983 June 18, 1984 Truro, Town of August 5, 1977 July 19, 1983 August 6, 1984 Wellfleet, Town of March 30, 1978 October 19, 1983 October 19, 1983 Yarmouth, Town of August 3, 1977 July 11, 1983 July 19, 1984
For this Countywide FIS, the initial Consultation Coordination Officer (CCO) meeting was held during the last week of November, 2006, and was attended by representatives of FEMA, ENSR Corporation, and community officials. The results of the study were reviewed at the final CCO meeting held on ______________________________, and was attended by representatives of _____________________________________________________________. All problems raised at that meeting have been addressed in this study.
2.0 AREA STUDIED
2.1 Scope of Study
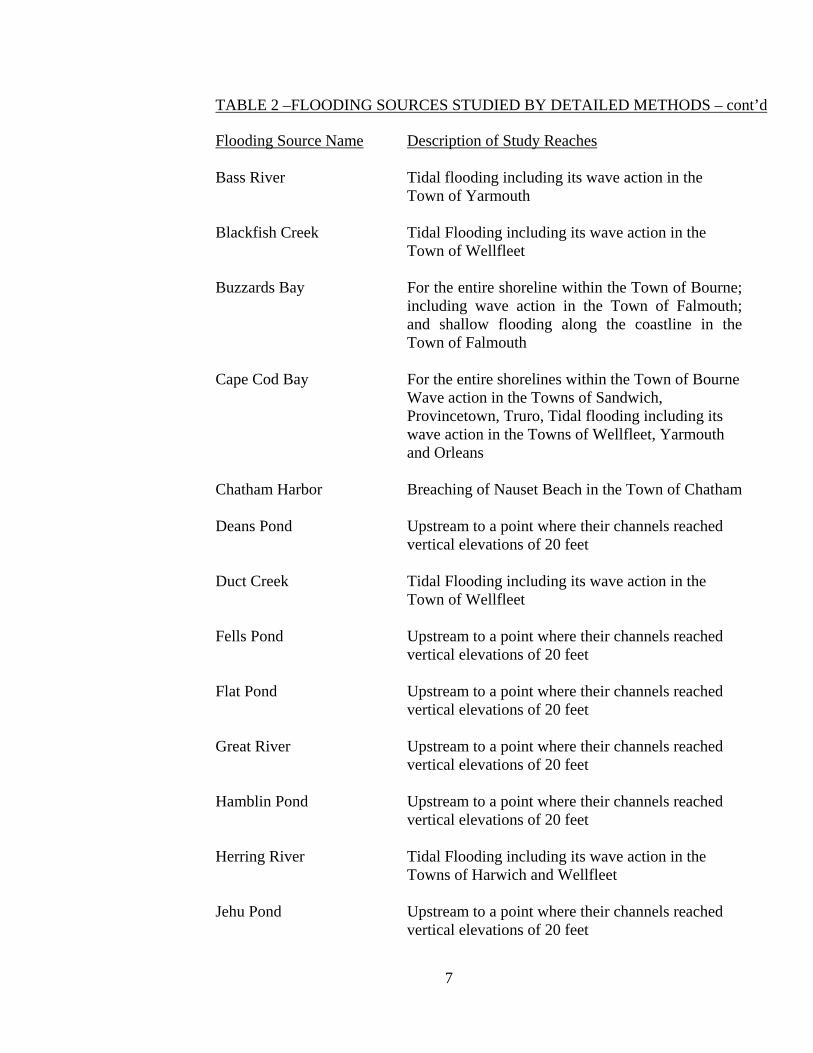
This FIS report covers the geographic area of Barnstable County, Massachusetts, including the incorporated communities listed in Section 1.1. The areas studied by detailed methods were selected with priority given to all known flood hazards and areas of project development or proposed construction. All or portions of the flooding sources listed in Table 2, “Flooding Sources Studied by Detailed Methods,” were studied by detailed methods in the precountywide FISs. Limits of detailed study are indicated on the Flood Profiles (Exhibit 1) and on the FIRM. The areas studied by detailed methods were selected with priority given to all known flood hazards and areas of projected development or proposed construction.
TABLE 2 –FLOODING SOURCES STUDIED BY DETAILED METHODS
Flooding Source Name Description of Study Reaches
Area of shallow flooding Within the corporate limits of the Towns of Truro
and Wellfleet
Atlantic Ocean Wave action and flooding in the Town of Provincetown; wave action in the Towns of Orleans and Truro; Tidal Flooding, including wave action in the Town of Wellfleet.
7
TABLE 2 –FLOODING SOURCES STUDIED BY DETAILED METHODS – cont’d
Flooding Source Name Description of Study Reaches Bass River Tidal flooding including its wave action in the
Town of Yarmouth Blackfish Creek Tidal Flooding including its wave action in the
Town of Wellfleet Buzzards Bay For the entire shoreline within the Town of Bourne;
including wave action in the Town of Falmouth; and shallow flooding along the coastline in the Town of Falmouth
Cape Cod Bay For the entire shorelines within the Town of Bourne
Wave action in the Towns of Sandwich, Provincetown, Truro, Tidal flooding including its wave action in the Towns of Wellfleet, Yarmouth and Orleans
Chatham Harbor Breaching of Nauset Beach in the Town of Chatham Deans Pond Upstream to a point where their channels reached
vertical elevations of 20 feet Duct Creek Tidal Flooding including its wave action in the
Town of Wellfleet Fells Pond Upstream to a point where their channels reached
vertical elevations of 20 feet Flat Pond Upstream to a point where their channels reached
vertical elevations of 20 feet Great River Upstream to a point where their channels reached
vertical elevations of 20 feet Hamblin Pond Upstream to a point where their channels reached
vertical elevations of 20 feet Herring River Tidal Flooding including its wave action in the
Towns of Harwich and Wellfleet Jehu Pond Upstream to a point where their channels reached
vertical elevations of 20 feet
8
TABLE 2 –FLOODING SOURCES STUDIED BY DETAILED METHODS – cont’d
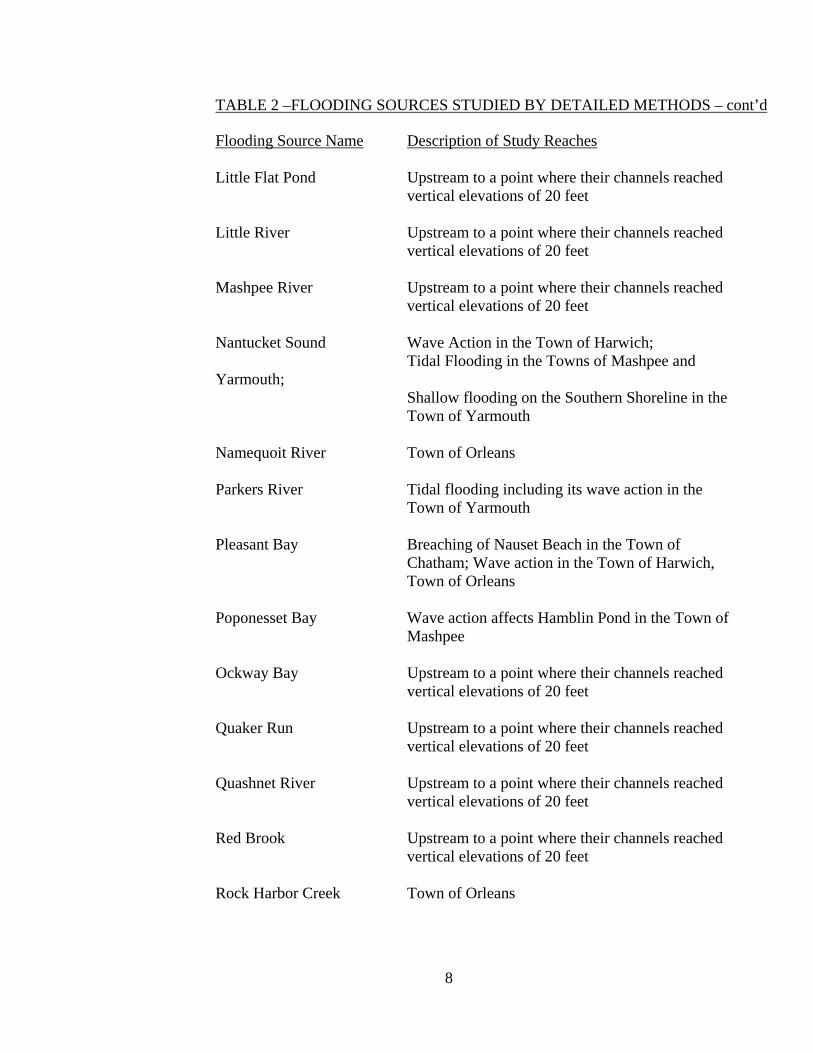
Flooding Source Name Description of Study Reaches Little Flat Pond Upstream to a point where their channels reached
vertical elevations of 20 feet Little River Upstream to a point where their channels reached
vertical elevations of 20 feet Mashpee River Upstream to a point where their channels reached
vertical elevations of 20 feet Nantucket Sound Wave Action in the Town of Harwich;
Tidal Flooding in the Towns of Mashpee and Yarmouth;
Shallow flooding on the Southern Shoreline in the Town of Yarmouth
Namequoit River Town of Orleans Parkers River Tidal flooding including its wave action in the
Town of Yarmouth Pleasant Bay Breaching of Nauset Beach in the Town of
Chatham; Wave action in the Town of Harwich, Town of Orleans
Poponesset Bay Wave action affects Hamblin Pond in the Town of
Mashpee Ockway Bay Upstream to a point where their channels reached
vertical elevations of 20 feet Quaker Run Upstream to a point where their channels reached
vertical elevations of 20 feet Quashnet River Upstream to a point where their channels reached
vertical elevations of 20 feet
Red Brook Upstream to a point where their channels reached vertical elevations of 20 feet
Rock Harbor Creek Town of Orleans
9
TABLE 2 –FLOODING SOURCES STUDIED BY DETAILED METHODS – cont’d
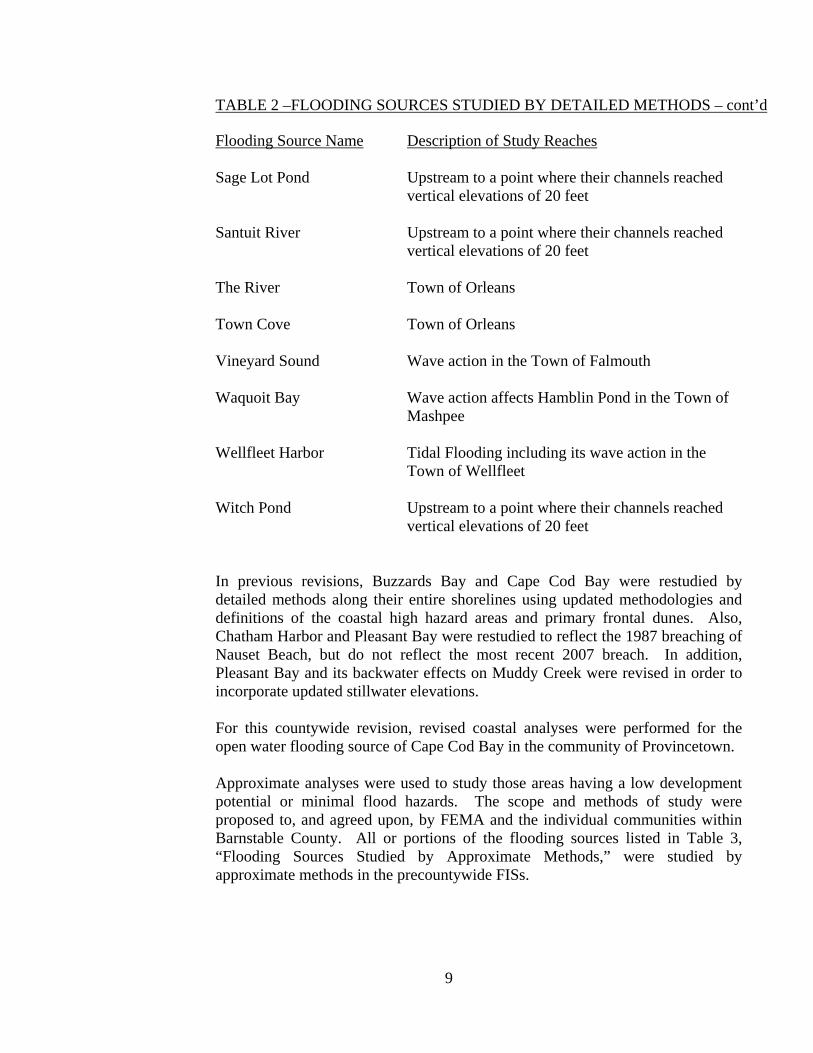
Flooding Source Name Description of Study Reaches Sage Lot Pond Upstream to a point where their channels reached
vertical elevations of 20 feet Santuit River Upstream to a point where their channels reached
vertical elevations of 20 feet The River Town of Orleans Town Cove Town of Orleans
Vineyard Sound Wave action in the Town of Falmouth Waquoit Bay Wave action affects Hamblin Pond in the Town of
Mashpee
Wellfleet Harbor Tidal Flooding including its wave action in the Town of Wellfleet
Witch Pond Upstream to a point where their channels reached
vertical elevations of 20 feet
In previous revisions, Buzzards Bay and Cape Cod Bay were restudied by detailed methods along their entire shorelines using updated methodologies and definitions of the coastal high hazard areas and primary frontal dunes. Also, Chatham Harbor and Pleasant Bay were restudied to reflect the 1987 breaching of Nauset Beach, but do not reflect the most recent 2007 breach. In addition, Pleasant Bay and its backwater effects on Muddy Creek were revised in order to incorporate updated stillwater elevations. For this countywide revision, revised coastal analyses were performed for the open water flooding source of Cape Cod Bay in the community of Provincetown.
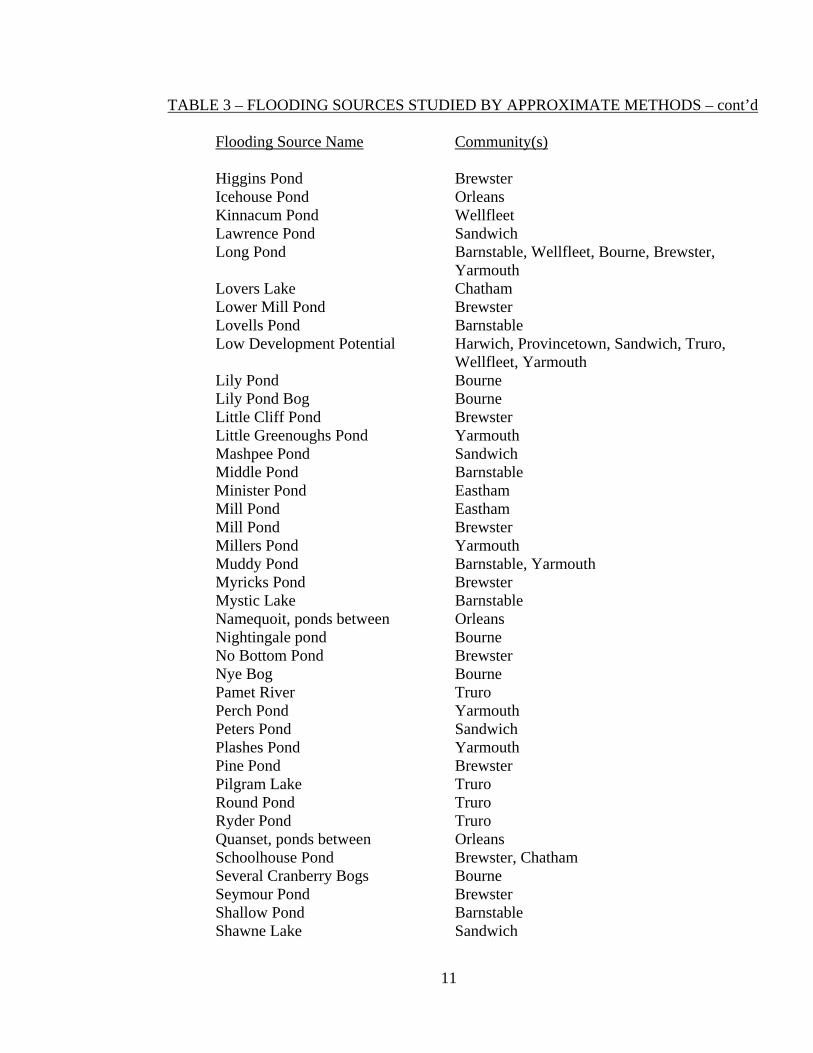
Approximate analyses were used to study those areas having a low development potential or minimal flood hazards. The scope and methods of study were proposed to, and agreed upon, by FEMA and the individual communities within Barnstable County. All or portions of the flooding sources listed in Table 3, “Flooding Sources Studied by Approximate Methods,” were studied by approximate methods in the precountywide FISs.

10
TABLE 3 – FLOODING SOURCES STUDIED BY APPROXIMATE METHODS
Flooding Source Name Community(s) Baker Pond Orleans
Bassetts Lot Pond Yarmouth Bearse Pond Barnstable Beaton Bog Bourne Bennett Pond Bourne Blackfish Creek Wellfleet Blueberry Pond Brewster Cahoon Pond Brewster Cape Cod National Seashore Truro Clapps Pond Provincetown Clay Pond Bourne Cliff Pond Brewster, Orleans Cluffs Pond Bourne Cobbs Pond Brewster Cranberry Bogs Orleans Crystal Lake Orleans Dennis Pond Yarmouth Deep Pond Orleans Depot Pond Eastham Duck Pond Provincetown, Wellfleet Dyer Pond Wellfleet Elbow Pond Brewster Ellis Pond Bourne Elishas Pond Yarmouth Emery Pond Chatham Flax Pond Bourne, Brewster Freeman Pond Bourne Fresh Brook Wellfleet Cedar Pond Orleans Goat Pasture Pond Bourne Goose Pond Chatham Gould Pond Orleans Grassy Pond Brewster Great Herring Pond Bourne Great Pond Bourne, Eastham, Wellfleet, Truro Greenland Pond Brewster Greenoughs Pond Yarmouth Halfway Pond Yarmouth Hamblin Pond Barnstable Herring Pond Eastham Horse Pond Yarmouth
Horseleech Pond Truro
11
TABLE 3 – FLOODING SOURCES STUDIED BY APPROXIMATE METHODS – cont’d
Flooding Source Name Community(s) Higgins Pond Brewster Icehouse Pond Orleans Kinnacum Pond Wellfleet Lawrence Pond Sandwich Long Pond Barnstable, Wellfleet, Bourne, Brewster,
Yarmouth Lovers Lake Chatham Lower Mill Pond Brewster Lovells Pond Barnstable Low Development Potential Harwich, Provincetown, Sandwich, Truro,
Wellfleet, Yarmouth Lily Pond Bourne Lily Pond Bog Bourne Little Cliff Pond Brewster Little Greenoughs Pond Yarmouth Mashpee Pond Sandwich Middle Pond Barnstable Minister Pond Eastham Mill Pond Eastham Mill Pond Brewster Millers Pond Yarmouth
Muddy Pond Barnstable, Yarmouth Myricks Pond Brewster Mystic Lake Barnstable Namequoit, ponds between Orleans Nightingale pond Bourne No Bottom Pond Brewster Nye Bog Bourne Pamet River Truro Perch Pond Yarmouth Peters Pond Sandwich Plashes Pond Yarmouth Pine Pond Brewster Pilgram Lake Truro Round Pond Truro Ryder Pond Truro Quanset, ponds between Orleans Schoolhouse Pond Brewster, Chatham Several Cranberry Bogs Bourne Seymour Pond Brewster Shallow Pond Barnstable Shawne Lake Sandwich
12
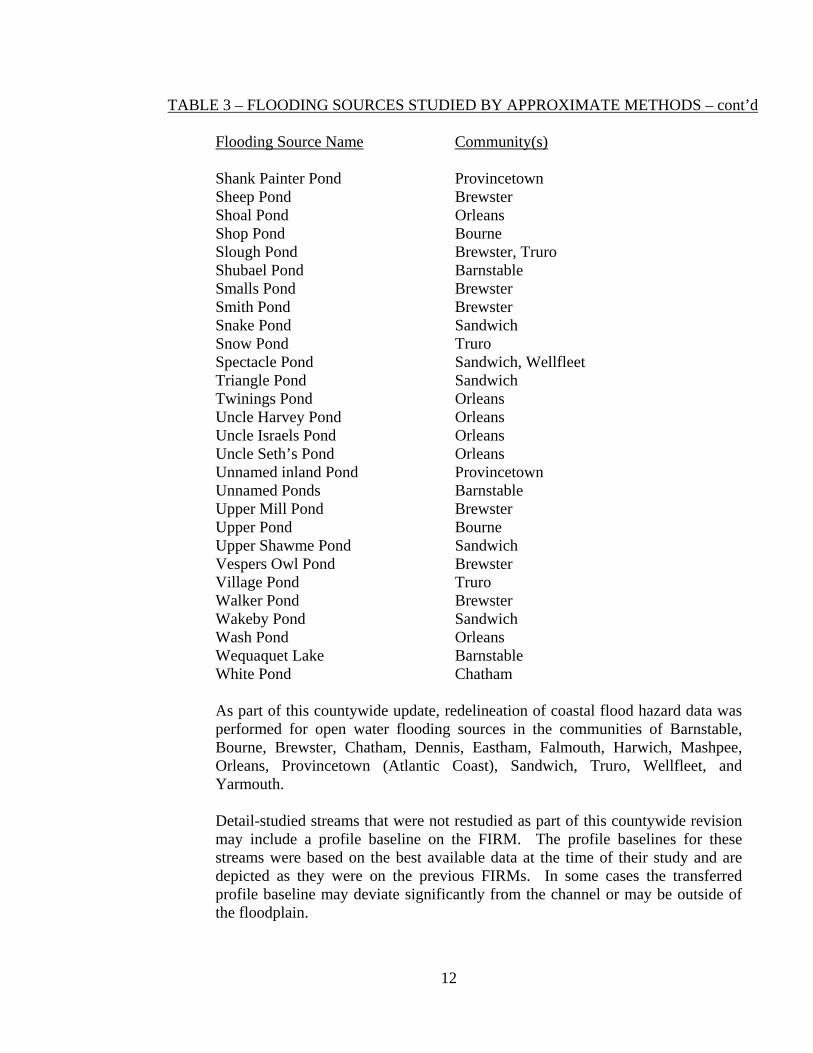
TABLE 3 – FLOODING SOURCES STUDIED BY APPROXIMATE METHODS – cont’d
Flooding Source Name Community(s) Shank Painter Pond Provincetown Sheep Pond Brewster Shoal Pond Orleans Shop Pond Bourne Slough Pond Brewster, Truro Shubael Pond Barnstable Smalls Pond Brewster Smith Pond Brewster Snake Pond Sandwich Snow Pond Truro Spectacle Pond Sandwich, Wellfleet
Triangle Pond Sandwich Twinings Pond Orleans Uncle Harvey Pond Orleans Uncle Israels Pond Orleans
Uncle Seth’s Pond Orleans Unnamed inland Pond Provincetown Unnamed Ponds Barnstable
Upper Mill Pond Brewster Upper Pond Bourne Upper Shawme Pond Sandwich Vespers Owl Pond Brewster
Village Pond Truro Walker Pond Brewster Wakeby Pond Sandwich Wash Pond Orleans Wequaquet Lake Barnstable White Pond Chatham As part of this countywide update, redelineation of coastal flood hazard data was performed for open water flooding sources in the communities of Barnstable, Bourne, Brewster, Chatham, Dennis, Eastham, Falmouth, Harwich, Mashpee, Orleans, Provincetown (Atlantic Coast), Sandwich, Truro, Wellfleet, and Yarmouth. Detail-studied streams that were not restudied as part of this countywide revision may include a profile baseline on the FIRM. The profile baselines for these streams were based on the best available data at the time of their study and are depicted as they were on the previous FIRMs. In some cases the transferred profile baseline may deviate significantly from the channel or may be outside of the floodplain.
13
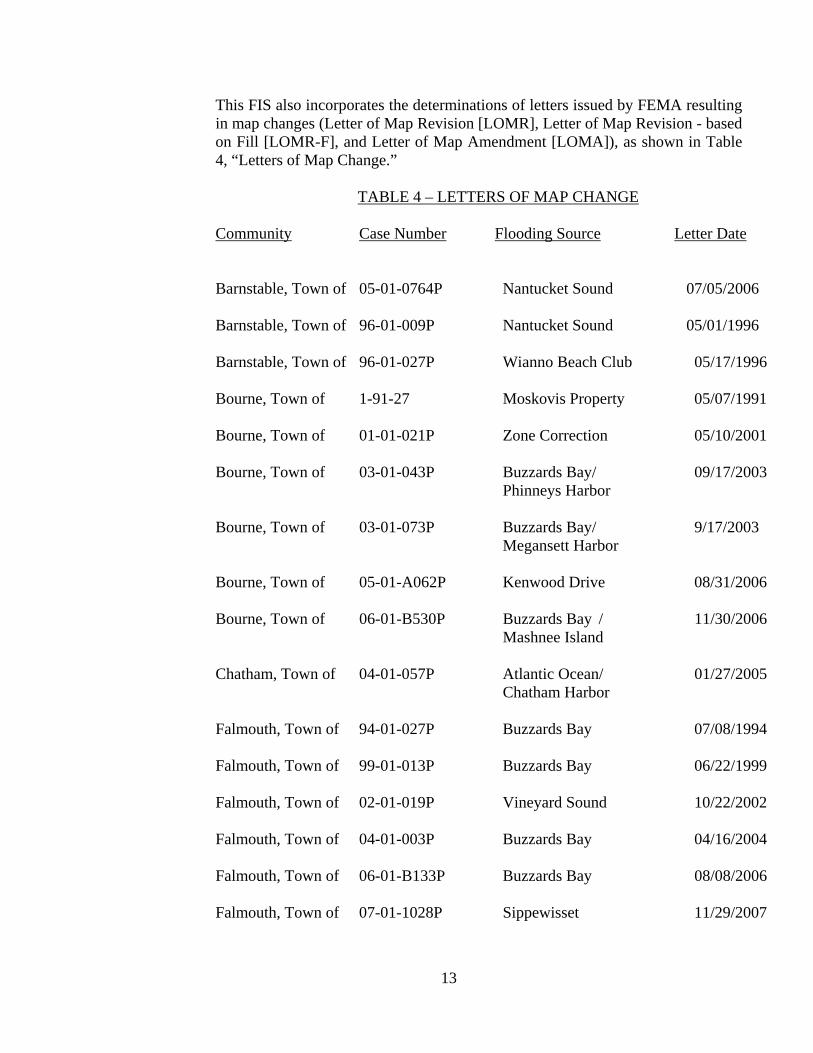
This FIS also incorporates the determinations of letters issued by FEMA resulting in map changes (Letter of Map Revision [LOMR], Letter of Map Revision - based on Fill [LOMR-F], and Letter of Map Amendment [LOMA]), as shown in Table 4, “Letters of Map Change.”
TABLE 4 – LETTERS OF MAP CHANGE
Community Case Number Flooding Source Letter Date Barnstable, Town of 05-01-0764P Nantucket Sound 07/05/2006 Barnstable, Town of 96-01-009P Nantucket Sound 05/01/1996
Barnstable, Town of 96-01-027P Wianno Beach Club 05/17/1996
Bourne, Town of 1-91-27 Moskovis Property 05/07/1991 Bourne, Town of 01-01-021P Zone Correction 05/10/2001 Bourne, Town of 03-01-043P Buzzards Bay/ 09/17/2003 Phinneys Harbor Bourne, Town of 03-01-073P Buzzards Bay/ 9/17/2003 Megansett Harbor
Bourne, Town of 05-01-A062P Kenwood Drive 08/31/2006
Bourne, Town of 06-01-B530P Buzzards Bay / 11/30/2006 Mashnee Island Chatham, Town of 04-01-057P Atlantic Ocean/ 01/27/2005 Chatham Harbor Falmouth, Town of 94-01-027P Buzzards Bay 07/08/1994 Falmouth, Town of 99-01-013P Buzzards Bay 06/22/1999 Falmouth, Town of 02-01-019P Vineyard Sound 10/22/2002 Falmouth, Town of 04-01-003P Buzzards Bay 04/16/2004 Falmouth, Town of 06-01-B133P Buzzards Bay 08/08/2006 Falmouth, Town of 07-01-1028P Sippewisset 11/29/2007
14
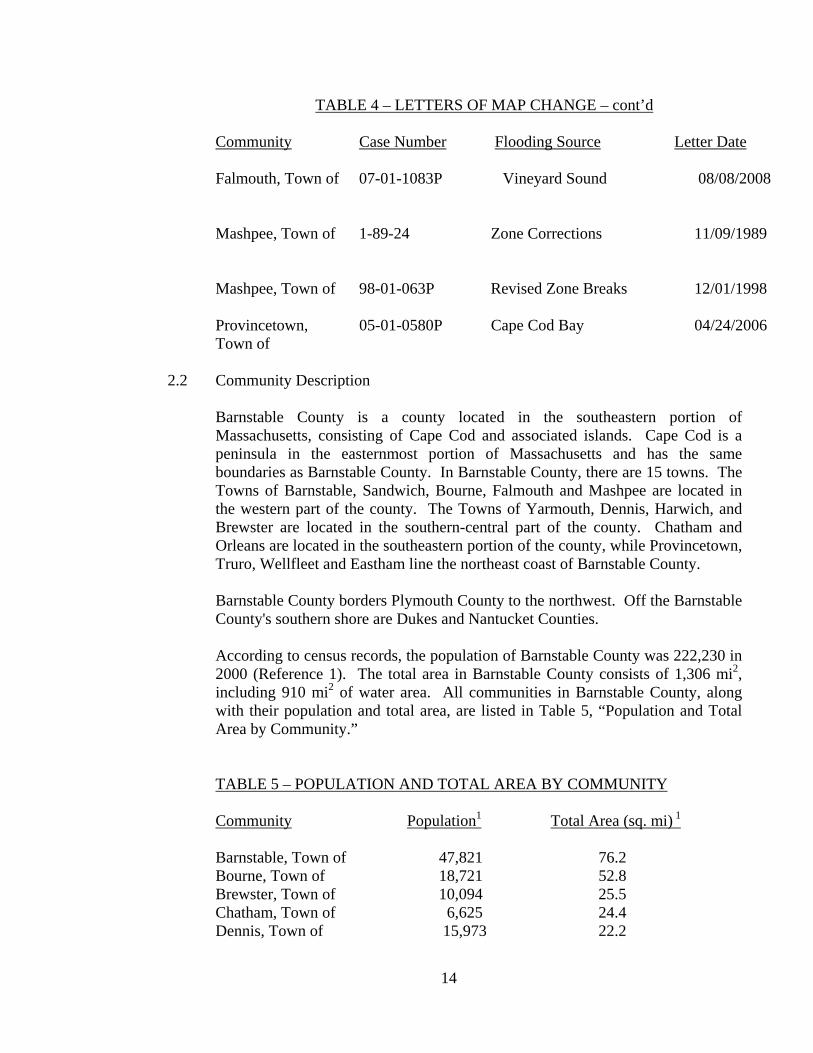
TABLE 4 – LETTERS OF MAP CHANGE – cont’d Community Case Number Flooding Source Letter Date
Falmouth, Town of 07-01-1083P Vineyard Sound 08/08/2008 Mashpee, Town of 1-89-24 Zone Corrections 11/09/1989 Mashpee, Town of 98-01-063P Revised Zone Breaks 12/01/1998
Provincetown, 05-01-0580P Cape Cod Bay 04/24/2006 Town of
2.2 Community Description
Barnstable County is a county located in the southeastern portion of Massachusetts, consisting of Cape Cod and associated islands. Cape Cod is a peninsula in the easternmost portion of Massachusetts and has the same boundaries as Barnstable County. In Barnstable County, there are 15 towns. The Towns of Barnstable, Sandwich, Bourne, Falmouth and Mashpee are located in the western part of the county. The Towns of Yarmouth, Dennis, Harwich, and Brewster are located in the southern-central part of the county. Chatham and Orleans are located in the southeastern portion of the county, while Provincetown, Truro, Wellfleet and Eastham line the northeast coast of Barnstable County. Barnstable County borders Plymouth County to the northwest. Off the Barnstable County's southern shore are Dukes and Nantucket Counties. According to census records, the population of Barnstable County was 222,230 in 2000 (Reference 1). The total area in Barnstable County consists of 1,306 mi2, including 910 mi2 of water area. All communities in Barnstable County, along with their population and total area, are listed in Table 5, “Population and Total Area by Community.” TABLE 5 – POPULATION AND TOTAL AREA BY COMMUNITY Community Population1 Total Area (sq. mi) 1
Barnstable, Town of 47,821 76.2 Bourne, Town of 18,721 52.8 Brewster, Town of 10,094 25.5 Chatham, Town of 6,625 24.4 Dennis, Town of 15,973 22.2
15
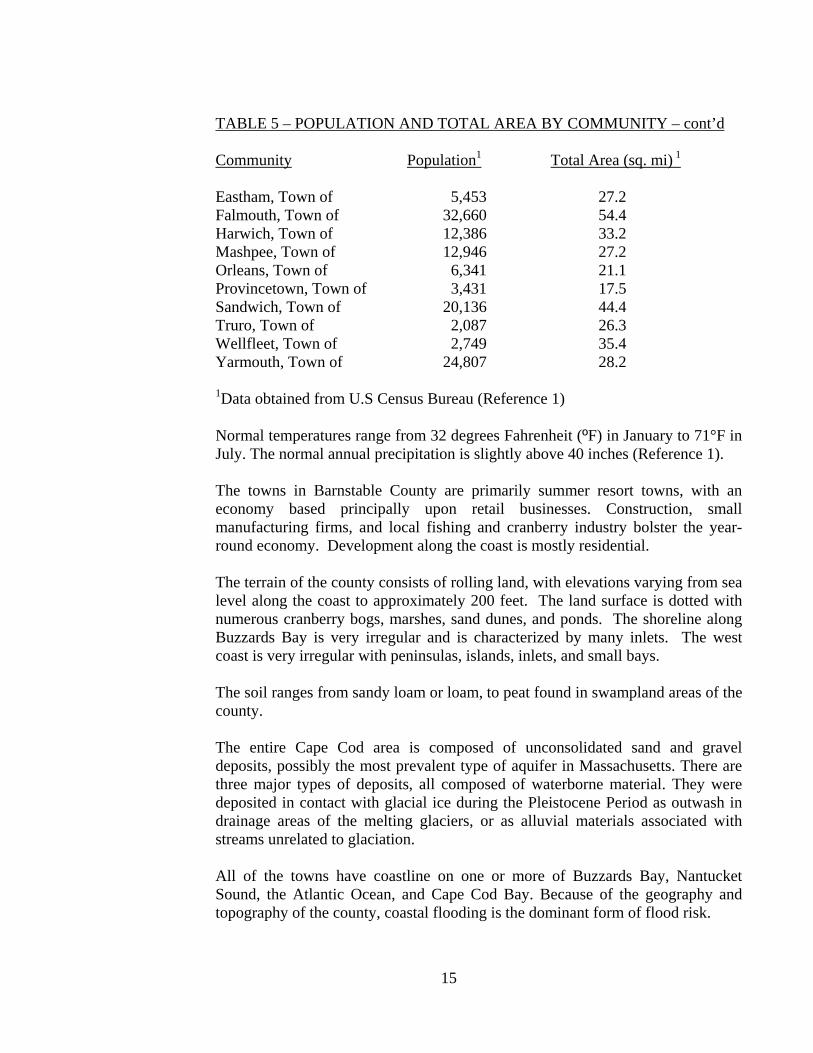
TABLE 5 – POPULATION AND TOTAL AREA BY COMMUNITY – cont’d Community Population1 Total Area (sq. mi) 1
Eastham, Town of 5,453 27.2 Falmouth, Town of 32,660 54.4 Harwich, Town of 12,386 33.2 Mashpee, Town of 12,946 27.2 Orleans, Town of 6,341 21.1 Provincetown, Town of 3,431 17.5 Sandwich, Town of 20,136 44.4 Truro, Town of 2,087 26.3 Wellfleet, Town of 2,749 35.4 Yarmouth, Town of 24,807 28.2 1Data obtained from U.S Census Bureau (Reference 1) Normal temperatures range from 32 degrees Fahrenheit (ºF) in January to 71°F in July. The normal annual precipitation is slightly above 40 inches (Reference 1). The towns in Barnstable County are primarily summer resort towns, with an economy based principally upon retail businesses. Construction, small manufacturing firms, and local fishing and cranberry industry bolster the year-round economy. Development along the coast is mostly residential. The terrain of the county consists of rolling land, with elevations varying from sea level along the coast to approximately 200 feet. The land surface is dotted with numerous cranberry bogs, marshes, sand dunes, and ponds. The shoreline along Buzzards Bay is very irregular and is characterized by many inlets. The west coast is very irregular with peninsulas, islands, inlets, and small bays. The soil ranges from sandy loam or loam, to peat found in swampland areas of the county. The entire Cape Cod area is composed of unconsolidated sand and gravel deposits, possibly the most prevalent type of aquifer in Massachusetts. There are three major types of deposits, all composed of waterborne material. They were deposited in contact with glacial ice during the Pleistocene Period as outwash in drainage areas of the melting glaciers, or as alluvial materials associated with streams unrelated to glaciation. All of the towns have coastline on one or more of Buzzards Bay, Nantucket Sound, the Atlantic Ocean, and Cape Cod Bay. Because of the geography and topography of the county, coastal flooding is the dominant form of flood risk.
16
2.3 Principal Flood Problems In Barnstable County, flooding generally occurs as a result of Hurricanes and Northeasters. Severe coastal storms commonly referred to as northeasters can occur at any time of the year but are more prevalent during the winter months. Past history has shown that although hurricanes occur less frequently than northeasters, they are capable of causing severe flooding. Hurricanes usually occur during the late summer and early fall months. High tides, rain runoff, tidal surges, storm surges, and wave action occur as a result of these storms. Flooding by higher than normal tides is usually the result of storm activity, either as a tropical hurricane or as a northeaster. Coastal areas on Cape Cod Bay suffer from exposure to northeasters, while those on Nantucket Sound are most affected by tropical hurricanes. The flood problems for the communities within Barnstable County have been compiled and are described below: Flooding in the Town of Barnstable is essentially limited to coastal areas where waters can inundate during high tide conditions. Between 1901 and 1960, a total of 16 hurricanes occurred on Cape Cod. Of these, the hurricanes of 1938, 1944, and 1954 resulted in severe flooding. Flooding along the northeast coast of the Town of Bourne generally results from the high tides and storm surges associated with New England northeasters. Serious flooding resulted in the Town of Bourne during the hurricanes of September 21, 1938, and August 31, 1954. The entire coastline of Brewster has been determined to be subject to wave action. The storm that affected Brewster in February 1978 was approximately a 1-percent-annual-chance event, as determined by elevation- frequency analyses. Flooding along the coast of Chatham generally results from storm tides caused by northeasters. The highest tide recorded at the Stage Harbor National Ocean Survey Subordinate Tide Gage was during the September 14-15, 1944, hurricane. An elevation of 8.45 feet was measured during this storm. This elevation is 0.65 foot below the 1-percent-annual-chance elevation of 9.1 feet assigned for the Chatham coastline by the USACE (References 2 and 3). Serious flooding has also occurred along the eastern coastline of Chatham as a result of northeasters. On January 2, 1987, large waves generated by a northeaster combined with an extreme high tide cut across one of several low and narrow points of the North Beach east of Chatham light. Within a week the channel was 100 yards wide. By the spring of 1987, the channel was a quarter mile wide, and by May 1988, the breach was over a mile wide. During the initial period of barrier beach breaching, severe erosion occurred along the eastern inner shoreline of Chatham, particularly between Water Street and Wilkey Way. Almost 250 feet of land was eroded at the Andrew Harding's Landing, resulted in losses of the
17
Landing parking lot and several water front homes. Portions of the eastern inner shoreline of Chatham facing the barrier beach opening will be subject to the direct storm surge and wave effects from the Atlantic Ocean. The February 1978 northeaster also caused serious flooding on Nauset Beach and inside Chatham Harbor. During this storm, substantial erosion occurred along the eastern inner shoreline of Chatham, particularly at Mataguasson Point. Several homes in Pleasant Bay were flooded out. Chatham police stated that high tides flooded one foot over Bridge Street and covered the road to Morris Island with several inches of water. The Harding Beach parking lot was also inundated by coastal flood water (Reference 4). Fortunately, Nauset Beach, which forms a barrier along the eastern shoreline of Chatham, absorbed the brunt of the storm waves created by the extremely high winds of this northeaster. As a result of the tremendous amount of wave energy absorbed during this and past storms, Nauset Beach has undergone significant changes. Flooding along the coast of Dennis is generally associated with tidal surges and is further aggravated by coincidental rain fall runoff. Relatively frequent tidal inundation and flooding is experienced in the various estuaries and their adjoining land areas. Salt marshes are naturally subjected to flooding by normal spring tides. Developed areas which have been subjected to flooding include Dr. Bottero Street in the vicinity of Taunton Avenue, Sea Street at Quivett Creek, the area north of State Route 28 and west of Cove Road at the Bass River, the northwest shore of Kelleys Pond, and the area between Weir Creek and Swan Pond River south of Lower County Road. Shore erosion due to wave action generally occurs along both the north and south coastlines of Dennis. The major estuaries in Dennis are Chase Garden Creek, Sesuit Harbor and Creek, Quivett Creek, Bass River, Weir Creek, and Swan Pond River. These estuaries are subject to tidal surges. Eastham is highly susceptible to northeasters as well. Both the eastern and western shorelines of Eastham are subject to wave action. The storm of February 1978 has been designated approximately a 1-percent-annual-chance, causing inundation along much of Eastham's shorelines below elevations of 9.1 to 11.1 feet. The strength of this storm was demonstrated by the loss of public beach area and the parking lot at Coast Guard Beach on the Atlantic Ocean. The dunes and bathhouse at Coast Guard Beach were also lost to the attacking waves, while the storm surge inundated the bike trail bridge. Storm waters washed over many locations on Nauset spit, carrying away houses and eroding dunes. At Nauset Beach, waves eroded the base of the cliffs, causing some damage to the parking lot. Many areas were inundated by the storm surge including the parking area at Rock Harbor, houses along Town Cove on Ellis Road, the Town Cove area, and portions of Bridge Road (Reference 5). During the storm of January 9, 1978, the bayside beaches suffered erosion due to gale force winds from the southwest occurring at the peak of the tide. These are as suffered further damage during the February storm from the tidal surge which elevated waters at least three feet
18
above the normal high tide. Winds, however, were from the north east at the time of the peak tides; therefore, waves were not generated that would damage south and west facing shorelines. Flooding can occur along the entire coast of Falmouth, principally as the result of hurricane storm surge. Major coastal flooding occurred several times in the past 100 years, the most notable of which were in 1938, 1944, and 1954. The flood of record on Nantucket and Vineyard Sounds in the Falmouth area was the 1944 flood, which had a recurrence interval of approximately 54 years. The most recent flood along the sounds occurred in 1954 and had a recurrence interval of approximately 54 years. The 1938 flood had a recurrence interval of approximately 30 years. The flood of record along Buzzards Bay was the 1938 flood, which had a recurrence interval of approximately 125 years near Sippewissett and 83 years near Megansett Harbor. The 1954 flood is also the most recent minor flood for Buzzards Bay. It had a recurrence interval of approximately 100 years near Sippewissett and 70 years near Megansett Harbor. Flooding along the Nantucket Sound coastline of Harwich is generally the result of hurricane-induced storm surges. The highest tide recorded at the Wychmere Harbor NOS Subordinate Tide Gage was during the September 14-12, 1944, Hurricane. An elevation of 8.9 feet was measured during this storm. This elevation is 0.2 foot below the 100-year elevation of 9.1 feet assigned for the Harwich coastline by the USACE from the Flood Insurance Study for the Town of Dennis and the report Hurricane Flood Levels, Profile No. 10 (References 6 and 7). Flooding along the small segment of tidal shoreline on Pleasant Bay, in the northeastern corner of the Town of Harwich, is usually the result of northeasters, although hurricanes may also cause serious flooding in this area. A flood elevation of 4.1 feet was measured at the southwest end of Pleasant Bay during the February 1978 northeaster (Reference 8).
Flooding in Mashpee is essentially limited to coastal areas where ocean waters can inundate under high-tide conditions. Flooding by higher than normal tides is usually the result of storm activity, often in the form of a tropical hurricane. The recurrence interval of a hurricane which will cause severe flooding is approximately 20 years, or a 5 percent chance of occurrence each year. The coastal areas in Mashpee most susceptible to flooding and subsequent flood damage are the Poponesset and Deans Pond development; the shorelines of Poponesset Bay and Ockway Bay; and the shoreline of Waquoit Bay, including Little River, Great River, Hamblin Pond, and Jehu Pond. The Town of Orleans is highly susceptible to northeasters as well. Northeasters often last long enough to be accompanied by at least one high tide, resulting in severe coastal flooding. In addition to flooding, damaging waves may accompany the tidal surge in coastal areas. The shorelines of both Namskaket and Nauset Beach are subject to wave action.
19
Provincetown is susceptible to northeasters and hurricanes. Two storms of high magnitude occurred in Provincetown in the winter of 1978. On Monday, January 9, strong southwest winds combined with high tides and a new moon to cause flooding of 70 east end homes. Business establishments along Bradford and Commercial Streets were also damaged (Reference 9). On Tuesday, February 8, 1978 the town experienced a northeaster that produced water levels higher than any others ever recorded (Reference 10). Unlike most northeasters, which tend to race up the Atlantic coast along a cold front, this storm stalled due to a large high pressure system over Labrador. Unable to continue northward as it intensified, the storm temporarily stood still over Cape Cod, causing severe flooding. The surge created by the storm combined with an already above normal spring tide to produce a still water elevation of 10 feet. Other storms that caused significant flooding in Provincetown were the hurricanes of 1954 and 1938 (Reference 11). Flooding along the coast of Sandwich generally results from storm tides caused by northeasters. The highest tide recorded at the Cape Cod Canal gage, which has been in operation since 1955, was the February 6 and 7, 1978, storm with a flood height of 9.2 feet (Reference 12). Prior to 1978, the flood of record had occurred on December 29, 1959, with a flood height of 7.97 feet. In February 1940, before the Cape Cod Canal gage was in operation, a northeaster caused damage throughout the Cape Cod area, especially in Sandwich. Most of the damage was to summer homes (Reference 11). Hurricanes, although rare, can also cause flooding within Cape Cod Bay. On September 11, 1954, Hurricane Edna caused waves as high as 15 feet in Sandwich (References 11 and 13). Each year, Truro is also subject to northeasters. In addition to northeasters, Truro is also susceptible to hurricanes that occasionally reach the outer cape. On February 8, 1978, Truro experienced a northeaster that produced the highest water levels ever recorded in the town (Reference 14). In low-lying areas adjacent to Ballston Beach, huge rollers poured over the dunes and in to the Pamet River valley, temporarily isolating Provincetown and North Truro Another storm that caused significant flooding in Truro was the hurricane of 1954 (Reference 15). During the hurricane of August 1954, the high-water elevation was 8.8 feet at Provincetown. The December 1959 northeaster produced estimated high-water marks of 9.5 feet at Wellfleet Harbor, 9 feet at Provincetown, and 8.5 feet at North Truro.
Wellfleet is highly susceptible to northeasters and has experienced severe flooding in the past, including the storm of February 1978, which was designated a 1-percent-annual-chance event throughout the Cape Cod Bay area, and on the coastlines of eastern Massachusetts, New Hampshire, and southern Maine. Historically, flooding in Yarmouth has resulted from high tides associated with severe coastal disturbances, primarily in the form of hurricanes and northeasters. Such was the case with the hurricane of 1944, which caused extensive flood damage throughout Yarmouth. Documentation exists for the storms of 1938,
20
1944, and 1954. The hurricane of September 14-15, 1944, is the storm of record and was also very close to the intensity of the statistically determined 1-percent-annual-chance flood for the south shore of Yarmouth. The north shore of Yarmouth can be expected to be somewhat less damage prone than the south shore for two reasons. There is relatively less development in terms of homes and other structures capable of sustaining damage on the north shore, and much of the shoreline is actually the edge of broad, flat, saltwater marsh inlets which may lessen damage, depending on the storm approach angle. Due to tidal influence, areas bordering the shore and certain inland water bodies can be expected to incur Damage. These areas are in the vicinities of Follins Pond, Tom Matthews’s pond, Mill pond, and Dinahs Pond. According to local residents, the effect of tidal inflow up the Bass River during the 1944 hurricane was as far inland as the Mill Pond area.
2.4 Flood Protection Measures
Flood protection measures for Barnstable County have been compiled and are summarized below: In Barnstable County, many coastal areas are protected by private seawalls and jetties. In most cases, these only provide minimum protection from damage caused by the 1-percent-annual-chance floods. In addition to these structures, efforts have been made to preserve or to improve existing coastal dunes through the use of snow fencing and control of pedestrian access. Also, many private landowners have placed seawalls and/or grouted stone slopes along the watersides of their properties. The heights and types of this construction vary greatly from site to site. The riverine areas are protected by restrictions that prohibit development within 100 feet of a stream. This same restriction applies to some extent in the area of cranberry bogs. The large number of cranberry bogs in the county constitutes a significant amount of potential flood-storage capacity; however, since the prime purpose of these bogs is to produce cranberries, the flood storage may not be available when needed. There is no formal means of public or private control of cranberry bog flow or water-surface elevations. Also, cranberry bogs are subject to development pressure and may be completely lost for flood storage as land-use patterns change. The zoning laws in Barnstable County have been amended to conform with FEMA requirements pertaining to the protection of new construction from flooding and waves resulting from the 1-percent-annual-chance flood. It may be the case that some of the communities within Barnstable County have instituted stricter flood protection measures. Most of eastern Eastham and portions of Orleans are part of the Cape Cod National Seashore, where development is prohibited and natural conditions

21
including natural flood storage areas are conserved. Outside of this Seashore District, the towns maintain a natural flood control measure in the wetlands district where protection is provided for flood storage areas. In Orleans, the town also has Conservancy Districts established by protective bylaws which regulate future development within floodplain areas. This not only protects against flood damages to new structures, but also assures that the natural flood storage areas in the town will be protected. A large portion of Wellfleet is within the Cape Cod National Seashore as well, but development is only limited, not prohibited, by the National Park Service program of land acquisition. Development still occurs when acquisition funding is limited. The western shoreline of Wellfleet is somewhat protected from damaging storm waves because of its location on Cape Cod Bay. Wellfleet Harbor is sheltered even further by the Great Island Peninsula. Structural flood protection measures include a breakwater near the town pier, seawalls along the Mayo Beach area, and a tide gate at Chequesset Neck Road on the Herring River. The seawalls and breakwater are designed primarily to dissipate wave energy, not for total flood protection. The tide gate is designed t o reduce flooding in low lying areas. To provide meaningful protection for the north and south Yarmouth coasts against tidal floods of the magnitude of the 1-percent-annual-chance and 0.2-percent-annual-chance-year events, structures would have to be placed around more than half the town. Along the south store, however, there is presently a good deal of construction designed to protect the shore from erosion. While these measures are not for flood protection, they do provide some protection against wave action associated with the 10-percent-annual-chance and 2-percent-annual-chance year floods. They are not generally sufficient to significantly impede the 1-percent-annual-chance and 0.2-percent-annual-chance year floods. Some degree of protection to the Lewis Bay area is naturally afforded by Great Island and the neck leading to it. Similar protection is provided to the Lewis Pond/Parkers River estuary by the beach on the land spit separating this area from the ocean. As with the erosion protection measures cited above, these offer only marginal protection against the larger floods. The Barnstable County communities have no major flood control structures planned or proposed at this time.
3.0 ENGINEERING METHODS
For the flooding sources studied by detailed methods in the community, standard hydrologic and hydraulic study methods were used to determine the flood-hazard data required for this study. Flood events of a magnitude that is expected to be equaled or exceeded once on the average during any 10-, 50-, 100-, or 500-year period (recurrence interval) have been selected as having special significance for floodplain management and for flood insurance rates. These events, commonly termed the 10-, 50-, 100-, and 500-year floods, have a 10-, 2-, 1-, and 0.2-percent chance, respectively, of being equaled
22
or exceeded during any year. Although the recurrence interval represents the long-term, average period between floods of a specific magnitude, rare floods could occur at short intervals or even within the same year. The risk of experiencing a rare flood increases when periods greater than 1 year are considered. For example, the risk of having a flood that equals or exceeds the 1-percent-annual-chance flood in any 50-year period is approximately 40 percent (4 in 10); for any 90-year period, the risk increases to approximately 60 percent (6 in 10). The analyses reported herein reflect flooding potentials based on conditions existing in the community at the time of completion of this study. Maps and flood elevations will be amended periodically to reflect future changes.
3.1 Precountywide Coastal Hydrologic Analyses
Hydrologic analyses were carried out to establish peak discharge-frequency relationships for floods of the selected recurrence intervals for each flooding source studied by detailed methods affecting the county. For each community within Barnstable County that has a previously printed FIS report, the hydrologic analyses described in those reports have been compiled and are summarized below. In New England, the flooding of low-lying areas is caused primarily by storm surges generated by extra tropical coastal storms called northeasters. Hurricanes also occasionally produce significant storm surges in New England, but they do not occur nearly as frequently as northeasters. Hurricanes in New England typically have a more severe impact on the south facing coastlines. Due to its geographic location, Barnstable County is susceptible to flooding from both hurricanes and northeasters.
To determine the Stillwater elevations for Cape Cod Bay in Barnstable, Brewster, Dennis, Eastham, Orleans, Provincetown, Sandwich and Wellfleet and Wellfleet Harbor in Wellfleet, a two-dimensional storm surge model was used to numerically simulate coastal storm surges (References 16, 17, 18, 19. and 20). The initial portion of the model is a simulation of meteorological conditions associated with storms. For coastal regions along Cape Cod Bay, the worst tidal flood peaks are caused by northeasters; therefore, only northeasters were modeled for these communities. The wind stress and barometric rise arrays were saved for input to the second portion of the model, which consists of a simulation of the physical characteristics of the study area. The entire shorelines mentioned above in were modeled. Input consisted of the arrays specified by the northeaster model and a two-dimensional grid system to define the study area, where depths are specified for every grid point, and land areas are defined. The model utilized an explicit, finite difference numerical scheme to solve the basic momentum equations in two dimensions. The output is a time series of storm surge elevations for every grid point.
23
A single ratio for each point was developed based on all storm models to relate tidal flooding at the point to tidal flooding at Boston, and these ratios were applied to the Boston gage curve to develop the elevation-frequency curve for the Cape Cod Bay shoreline in the Town of Bourne. Stillwater elevations for the Buzzards Bay coastline in the Town of Bourne were taken from a coastal surge profile developed by the USACE, New England Division, and another study by the USACE (References 20 and 21). Anderson-Nichols & Co., Inc., verified these elevations using meteorological parameters of hurricanes and northeasters typical of the latitudes of Cape Cod (References 22, 23, 24, and 25). For the previous study in Brewster, a traverse line ended off the south end of Nauset Beach. Results of this analysis verified the accuracy of the USACE surge elevations for the Chatham coastline. The USACE determination of surge elevations in Chatham were determined from a frequency analysis of the National Ocean Survey (NOS) tidal gage records for Boston and Woods Hole, Massachusetts, and Newport, Rhode Island (Reference 7). Stage-recurrence interval relationships at these locations served as control points for the coastal surge profiles. Stage-recurrence interval relationships at locations between control points were determined from an analysis of historical high water marks. This analysis consisted of a comparison of simultaneous observations at high water mark locations and control points. By this method, the stage-recurrence interval relationships at control points were transposed to high water mark locations, resulting in continuous coastal surge profiles for the 10-, 2-, 1- and 0.2-percent-annual-chance flood events. In the updated study, a two-dimensional storm surge model similar to the updated FEMA Coastal Flooding - Hurricane Storm Surge Model was used to simulate the storm surge level in the Chatham Harbor Pleasant Bay (References 26 and 27). Stillwater elevations for the Nantucket Sound coastline of Dennis and the coastline of Harwich were based on elevations determined by the USACE using a frequency analysis of National Ocean Survey tidal gage records for Boston and Woods Hole, Massachusetts, and Newport, Rhode Island (Reference 2) Stillwater elevations used in the Eastham study were taken from the original Flood Insurance Study for Falmouth (Reference 28). The analysis used in that study to determine coastal flood elevations consisted of a statistical analysis of the USGS tide gage records at Woods, Hole, located in Falmouth, and a correlation with high-water marks along the coastlines of the town (References 29 and 30). Two technical reviews of the previous study for Falmouth verified the reasonableness of flood elevations determined for the town (References 31 and 32). Additional checks were made throughout Cape Cod using meteorological parameters of hurricanes typical of the latitudes of Cape Cod (Reference 17).Resulting parameters were used to develop wind fields employed in coastal surge calculations (References 33 and 34). For this study, the traverse line terminated approximately 2 miles southeast of Great Harbor at Woods Hole.
24
Results of this analysis also verified the reasonableness of the elevations in the previous study for Falmouth. Stillwater elevations used for the Atlantic Ocean shoreline of Provincetown were taken from a coastal surge profile developed by the New England Division of the USACE (Reference 35). Hurricanes have had a very definite impact upon the south shore of Yarmouth. The same storms, however, have been of lesser consequence to the more sheltered north shore. Conversely, northeasters have had a greater impact upon the north shore from tidal surges which build in Cape Cod Bay. For this reason, the analyses for the north and south shores of Yarmouth were treated independently. It is important to note that the food levels determined do not necessarily occur simultaneously, but can and usually do result from separate and distinct events. Data used for the determination of the 1-percent-annaul-chance flood for this portion of Cape Cod consisted of 41 years of tide gage records at Woods Hole, 10 years of gage records at Yarmouth, and high-water marks for the 1938, 1944, and 1954 hurricanes recorded by the Massachusetts Geodetic Survey and the USACE. The hurricane of September 1938 produced an elevation of 4.4 feet at Great Island, South Yarmouth, and Parkers Neck. The September 1944 hurricane produced elevations of 9.3 feet at South Yarmouth and 8.6 feet at Parkers Neck. The hurricane of August 1954 produced an elevation of 6.7 feet at Parkers Neck. A statistical frequency analysis was performed by the New England Division of the USACE on annual peak stages recorded from 1932 at Woods Hole and adjusted to present-day levels assuming a rise in sea level of 0.1 foot per decade. These values were then compared and adjusted according to annual peak-tide data recorded at Yarmouth and also to the high-water mark data for the storms of 1938, 1944, and 1954. In summary, flood tides on the south shore usually result from the combination of high hurricane surges (6 to 10 feet) and relatively low astronomical tide ranges of 2 to 5 feet. Stillwater elevations for the Nantucket Sound coastline of Yarmouth were taken from USACE coastal surge profiles (References 35 and 36). The study contractor verified these elevations using meteorological parameters of hurricanes and northeasters typical of the latitudes of Cape Cod (References 17, 19, and 37). The resulting parameters were then used to develop wind fields subsequently employed in coastal surge calculations. Surge calculation methods were taken from the USACE Shore Protection Manual (Reference 38).
3.2 Precountywide Coastal Hydraulic Analyses
Analyses of the hydraulic characteristics of flooding from the sources studied were carried out to provide estimates of the elevations of floods of the selected recurrence intervals. Users should be aware that some flood elevations shown on the FIRM represent rounded whole-foot elevations and may not exactly reflect the
25
tables in the FIS report. For construction and/or floodplain management purposes, users are encouraged to use the flood elevation data presented in this FIS in conjunction with the data shown on the FIRM. For each community within Barnstable County that has a previously printed FIS report, the hydraulic analyses described in those reports have been compiled and are summarized below. In the Barnstable County, hydraulic analyses, considering storm characteristics and the shoreline and bathymetric characteristics of the flooding sources studied, were carried out to provide estimates of the elevations of floods of the selected recurrence intervals along each of the shorelines. For coastal regions along the Cape, the worst tidal flood peaks are caused by northeasters; therefore, only northeasters were modeled. Areas of coastline subject to significant wave attack are referred to as coastal high hazard zones. The USACE has established the 3-foot breaking wave as the criterion for identifying the limit of coastal high hazard zones (Reference 39). The 3-foot wave has been determined as the minimum size wave capable of causing major damage to conventional wood frame or brick veneer structures. A wave height analysis was performed to determine wave heights and corresponding wave crest elevations for the areas inundated by the tidal flooding. A wave runup analysis was performed to determine the height and extent of runup beyond the limit of tidal inundation. The results of these analyses were combined into a wave envelope, which was constructed by extending the maximum wave runup elevation seaward to its intersection with the wave crest profile. The methodology for analyzing wave heights and corresponding wave crest elevations was developed by the NAS (Reference 40). The NAS methodology is based on three major or concepts. First, a storm surge on the open coast is accompanied by waves. The maximum height of these waves is related to the depth of water by the following equation:
Hb = 0.78d where Hb, is the crest to trough height of the maximum or breaking wave and d is the still water depth. The elevation of the crest of an unimpeded wave is determined using the equation:
Zw = S* + 0.7H* = 0.55d where Zw, is the wave crest elevation, S* is the stillwater elevation at the site, and H* is the wave height at the site. The 0.7 coefficient is the portion of the wave height which reaches above the Stillwater elevation. Hb is the upper limit for H*.
26
The second major concept is that the breaking wave height may be diminished by dissipation of energy by natural or man-made obstructions. The wave height transmitted past a given obstruction is determined by the following equation:
Ht = BHi where Ht is the transmitted wave height, Hi is the incident wave height, and B is a transmission coefficient ranging from 0.0 to 1.0. The coefficient is a function of the physical characteristics of the obstruction. Equations have been developed by the NAS to determine B for vegetation, buildings, natural barriers such as dunes, and man-made barriers such as breakwaters and seawalls (Reference 41). The third concept deals with unimpeded reaches between obstructions. New wave generation can result from wind action. This added energy is related to distance and mean depth over the unimpeded reach. The methodology for analyzing wave runup was developed by Stone and Webster Engineering Corporation (Reference 41). The wave runup computer program operates using an ensemble of deepwater wave heights, Hi, the stillwater elevation, S*, a wave period, Ts, and beach slope, m. For Barnstable, wave heights range from 3 feet up to the significant wave height of 18.4 feet; the wave periods range from 6.0 to 7.8 seconds. For Brewster, wave heights range from 3 feet up to the significant wave height of 15 feet; the wave period equals 6.5 seconds. For Dennis, wave heights range from 3 feet up to the significant wave height of 18.4 feet; the wave periods range from 4.6 to 7.5 seconds. For Eastham, wave heights range from 3 feet up to the significant wave height of 19 feet; the wave period ranges from 6.0 to 12.5 seconds. For Falmouth and Harwich, wave heights range from 3 feet up to a maximum wave height of 17.6 feet; the wave periods range from 6.5 to 7.4 seconds. For Mashpee, wave heights range from 3 feet up to the significant wave height of 19.2 feet; the wave periods range from 5.4 to 7.2 seconds. For the Town of Orleans, wave heights range from 3 feet up to the significant wave height of 30 feet; the wave period equals 12.5 seconds. For Provincetown, wave heights range from 3 feet up to the significant wave height of 36.8 feet; the wave periods range from 6.9 to 14.4 seconds. For the Town of Sandwich, wave heights range from 3 feet up to the significant wave height of 35 feet; the wave period equals 13 seconds. For Truro, wave heights range from 3 feet up to the significant wave height of 36.8 feet; the wave periods range from 8.0 to 14.4 seconds. For Wellfleet, wave heights range from 3 feet up to the significant wave height of 23 feet; the wave period ranges from 3.5 to 12.5 seconds. For Yarmouth, wave heights· range from 3 feet up to the significant wave height of 21.6 feet; the wave periods range from 5.5 to 8.0 seconds. These concepts and equations were used to compute wave envelope elevations associated with the 1-percent-annual-chance storm surge. Accurate topographic, land-use, and land cover data are required for the coastal analyses. Maps of the study area, at a scale of 1:4,800 with a contour interval of 5 feet were used for the

27
topographic data (Reference 42). The land-use and land cover data were obtained by field surveys. The analysis of wave heights along the Chatham shorelines was complicated by the irregular shoreline configuration and the presence of barrier beach and islands. Different sections of the shoreline are subject to different wave heights depending on the orientation of the shoreline. For each section of the shoreline, considerations were given to the fetch length and the effects of shoaling, refraction, and diffraction of deepwater waves passing through Nantucket Sound and Nauset Beach opening. Nauset Beach which is a part of the Cape Cod National Seashore is subject to wave activities generated from the Atlantic Ocean. Based on the Wave Information studies of the U. S. Coastline by U. S. Army Engineer Waterways Experiment Station, the 1-percent-annual-chance significant wave height at a nearby station is calculated to be 30 feet and the wave period is up to 14 seconds (Reference 43). Before the Nauset Beach breaching, the Chatham Harbor and Pleasant Bay were well protected from the Atlantic Ocean surge and wave activities by the Nauset Beach. However, the tide level and wave climate inside the Chatham Harbor have been changed significantly since the breaching of the Nauset Beach had occurred. The inner shoreline of Chatham facing the mile-wide barrier beach opening is subject to severe wave activities. Unbroken waves of up to 17 feet high would pass through the deep channel portion of the breach opening during the 1-percent-annual-chance tidal flooding. The methodology for analyzing wave runup was developed by Stone and Webster Engineering Corporation (Reference 44). The wave runup computer program operates using an ensemble of deepwater wave heights, the stillwater elevation, a wave period, and beach slope. For Chatham, wave heights range from 3 feet up to the significant wave height 36.8 feet; the wave periods range from 7.0 to 14.4 seconds. Wave heights and wave runup were computed along transects which were located perpendicular to the average mean shoreline. The transects were located with consideration given to the physical and cultural characteristics of the land so that they would closely represent conditions in their locality. Transects were spaced close together in areas of complex topography and dense development. In areas having more uniform characteristics, the transects were spaced at larger intervals. It was also necessary to locate transects in areas where unique flooding existed and in areas where computed wave heights varied significantly between adjacent transects. Wave heights were calculated to the nearest 0.1 foot, and wave elevations were determined at whole foot increments along the transects. Initial wave parameters used in the wave height analysis for incident wave height (100-year significant wave height) and the associated wave period were derived from the USACE wave hindcast report (Reference 22) and the Automated Coastal Engineering System (ACES) (Reference 23) for Cape Cod Bay and Buzzards Bay, respectively. Utilizing criteria outlined in the Guidelines and Specifications for Wave Elevation
28
Determination and V Zone Mapping, the extent of the V Zone was also determined at each transect (Reference 21). Along each transect, wave envelope elevations were computed considering the combined effects of changes in ground elevation, vegetation, and physical features. Between transects, elevations were interpolated using the topographic maps, land-use and land cover data, and engineering judgment to determine the real extent of flooding. The stillwater elevations for the 1-percent-annual-chance flood were used as the starting elevations for these computations. The results of the calculations are accurate until local topography, vegetation, or cultural development within the communities undergo any major changes. Areas of shallow flooding are shown along portions of the shoreline. These areas are the result of wave runup overtopping dunes, seawalls, and berms.
3.3 Countywide Coastal Analysis
As part of this countywide update, redelineation of coastal flood hazard data was performed for open water flooding sources in the communities of Barnstable, Bourne, Brewster, Chatham, Dennis, Eastham, Falmouth, Harwich, Mashpee, Orleans, Provincetown (Atlantic Coast), Sandwich, Truro, Wellfleet, and Yarmouth. Redelineation of coastal flood hazards is defined as applying the results of the effective coastal analyses to new or more detailed topographic data. Revised coastal analyses were performed for the open water flooding source of Cape Cod Bay in the community of Provincetown. Provided below is a summary of the analyses performed. All revised coastal analyses and redelineation of coastal flood hazards were performed in accordance with Appendix D “Guidance for Coastal Flooding Analyses and Mapping,” (Reference 45) of the Guidelines and Specifications, as well as, the “Atlantic Ocean and Gulf of Mexico Coastal Guidelines Update”, (Reference 46).
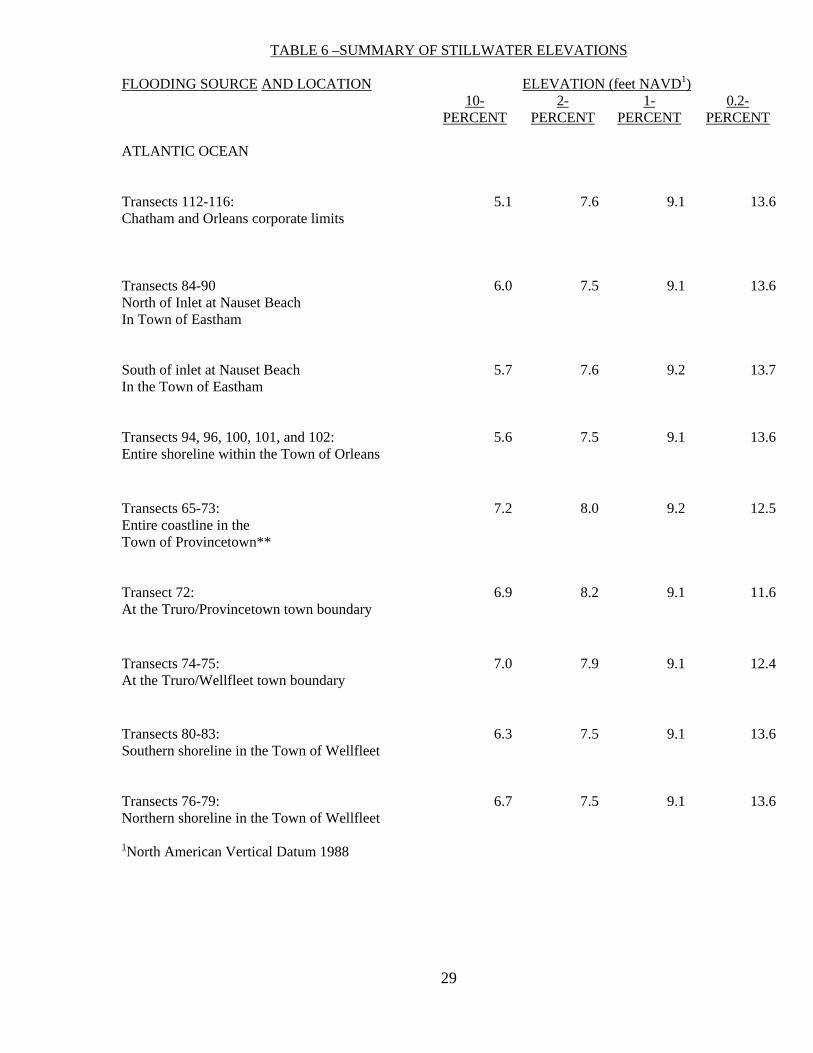
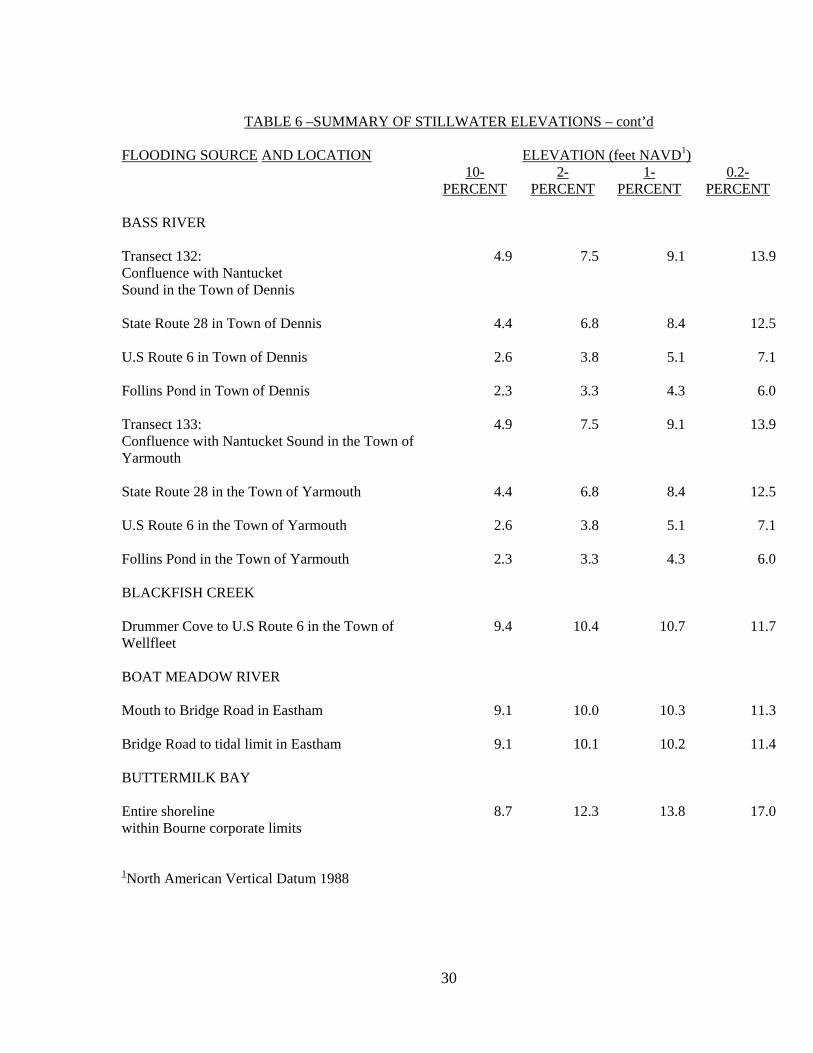
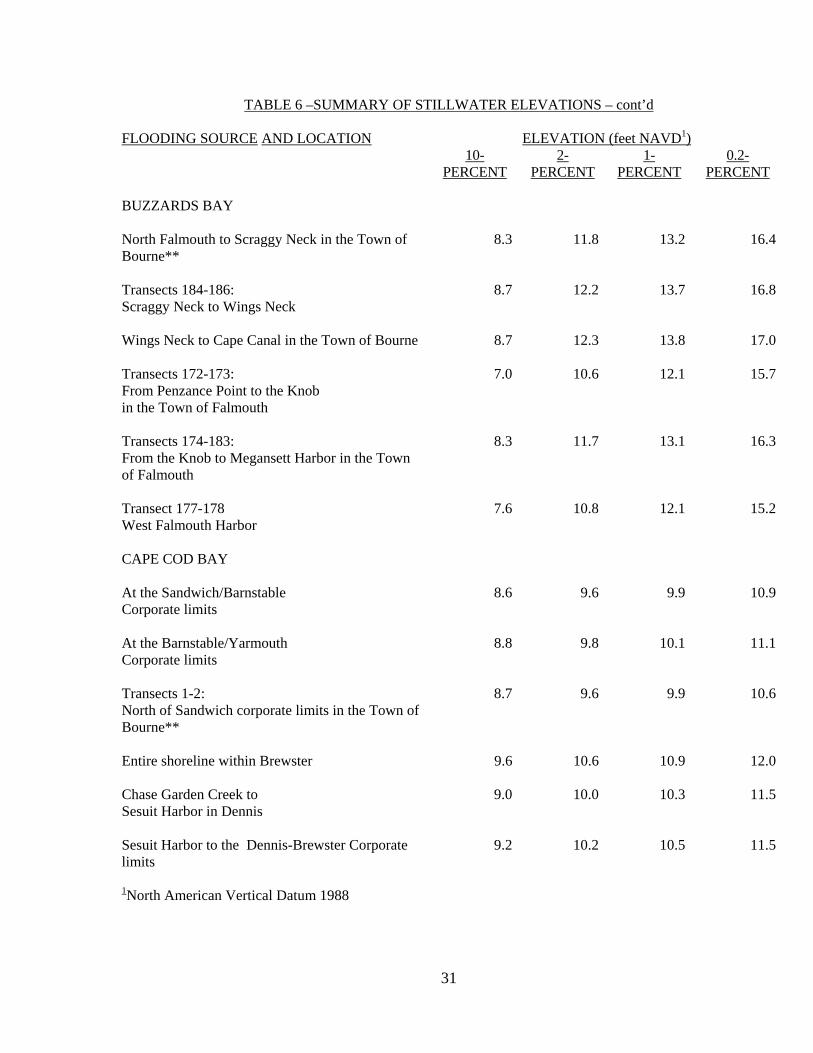
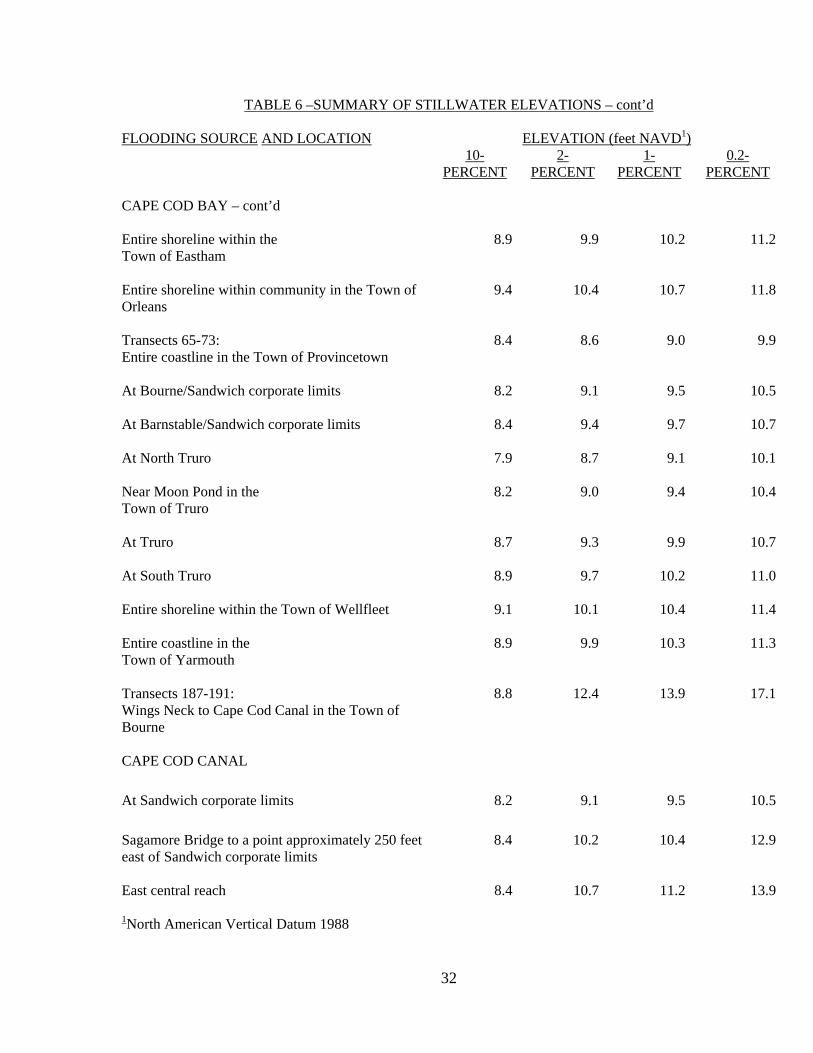
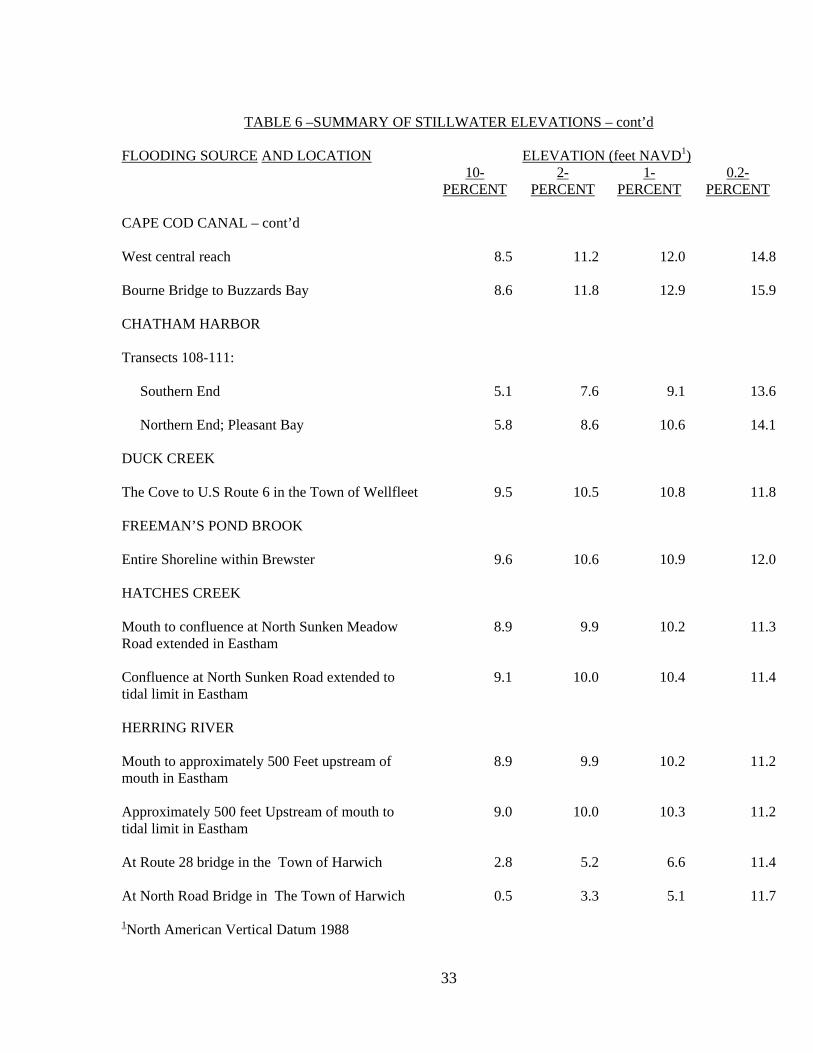
For communities with redelineation of coastal flood hazard data, the 10-, 2-, 1- and 0.2-percent-annual-chance stillwater elevations are the same as published in the previous effective Flood Insurance Studies. For the revised community, published values in the Tidal Flood Survey (Reference 47) were used to estimate the stillwater elevations for the 10-, 2-, and 1-percent-annual-chance floods for Cape Cod Bay. The 0.2-percent-annual-chance stillwater elevations for the revised flooding source was extrapolated based on the more the frequent stillwater elevations in the Tidal Flood Survey. Countywide Stillwater elevations for all communities, including the revised and redelineated flooding sources, are presented in Table 6.
29
TABLE 6 –SUMMARY OF STILLWATER ELEVATIONS
ELEVATION (feet NAVD1) FLOODING SOURCE AND LOCATION 10-
PERCENT 2-
PERCENT 1-
PERCENT 0.2-
PERCENT ATLANTIC OCEAN
Transects 112-116: Chatham and Orleans corporate limits
5.1 7.6 9.1 13.6
Transects 84-90 North of Inlet at Nauset Beach In Town of Eastham
6.0 7.5 9.1 13.6
South of inlet at Nauset Beach In the Town of Eastham
5.7 7.6 9.2 13.7
Transects 94, 96, 100, 101, and 102: Entire shoreline within the Town of Orleans
5.6 7.5 9.1 13.6
Transects 65-73: Entire coastline in the Town of Provincetown**
7.2 8.0 9.2 12.5
Transect 72: At the Truro/Provincetown town boundary
6.9 8.2 9.1 11.6
Transects 74-75: At the Truro/Wellfleet town boundary
7.0 7.9 9.1 12.4
Transects 80-83: Southern shoreline in the Town of Wellfleet
6.3 7.5 9.1 13.6
Transects 76-79: Northern shoreline in the Town of Wellfleet
6.7 7.5 9.1 13.6
1North American Vertical Datum 1988
30
TABLE 6 –SUMMARY OF STILLWATER ELEVATIONS – cont’d
ELEVATION (feet NAVD1) FLOODING SOURCE AND LOCATION
10-PERCENT
2-PERCENT
1-PERCENT
0.2-PERCENT
BASS RIVER Transect 132: Confluence with Nantucket Sound in the Town of Dennis
4.9 7.5 9.1 13.9
State Route 28 in Town of Dennis 4.4 6.8 8.4 12.5 U.S Route 6 in Town of Dennis 2.6 3.8 5.1 7.1 Follins Pond in Town of Dennis 2.3 3.3 4.3 6.0 Transect 133: Confluence with Nantucket Sound in the Town of Yarmouth
4.9 7.5 9.1 13.9
State Route 28 in the Town of Yarmouth 4.4 6.8 8.4 12.5 U.S Route 6 in the Town of Yarmouth 2.6 3.8 5.1 7.1 Follins Pond in the Town of Yarmouth 2.3 3.3 4.3 6.0 BLACKFISH CREEK Drummer Cove to U.S Route 6 in the Town of Wellfleet
9.4 10.4 10.7 11.7
BOAT MEADOW RIVER Mouth to Bridge Road in Eastham 9.1 10.0 10.3 11.3 Bridge Road to tidal limit in Eastham 9.1 10.1 10.2 11.4 BUTTERMILK BAY Entire shoreline within Bourne corporate limits
8.7 12.3 13.8 17.0
1North American Vertical Datum 1988
31
TABLE 6 –SUMMARY OF STILLWATER ELEVATIONS – cont’d
ELEVATION (feet NAVD1) FLOODING SOURCE AND LOCATION 10-
PERCENT 2-
PERCENT 1-
PERCENT 0.2-
PERCENT BUZZARDS BAY North Falmouth to Scraggy Neck in the Town of Bourne**
8.3 11.8 13.2 16.4
Transects 184-186: Scraggy Neck to Wings Neck
8.7 12.2 13.7 16.8
Wings Neck to Cape Canal in the Town of Bourne 8.7 12.3 13.8 17.0 Transects 172-173: From Penzance Point to the Knob in the Town of Falmouth
7.0 10.6 12.1 15.7
Transects 174-183: From the Knob to Megansett Harbor in the Town of Falmouth
8.3 11.7 13.1 16.3
Transect 177-178 West Falmouth Harbor
7.6 10.8 12.1 15.2
CAPE COD BAY At the Sandwich/Barnstable Corporate limits
8.6 9.6 9.9 10.9
At the Barnstable/Yarmouth Corporate limits
8.8 9.8 10.1 11.1
Transects 1-2: North of Sandwich corporate limits in the Town of Bourne**
8.7 9.6 9.9 10.6
Entire shoreline within Brewster 9.6 10.6 10.9 12.0 Chase Garden Creek to Sesuit Harbor in Dennis
9.0 10.0 10.3 11.5
Sesuit Harbor to the Dennis-Brewster Corporate limits
9.2 10.2 10.5 11.5
1North American Vertical Datum 1988
32
TABLE 6 –SUMMARY OF STILLWATER ELEVATIONS – cont’d
ELEVATION (feet NAVD1) FLOODING SOURCE AND LOCATION 10-
PERCENT 2-
PERCENT 1-
PERCENT 0.2-
PERCENT CAPE COD BAY – cont’d Entire shoreline within the Town of Eastham
8.9 9.9 10.2 11.2
Entire shoreline within community in the Town of Orleans
9.4 10.4 10.7 11.8
Transects 65-73: Entire coastline in the Town of Provincetown
8.4 8.6 9.0 9.9
At Bourne/Sandwich corporate limits 8.2 9.1 9.5 10.5 At Barnstable/Sandwich corporate limits 8.4 9.4 9.7 10.7 At North Truro 7.9 8.7 9.1 10.1 Near Moon Pond in the Town of Truro
8.2 9.0 9.4 10.4
At Truro 8.7 9.3 9.9 10.7 At South Truro 8.9 9.7 10.2 11.0 Entire shoreline within the Town of Wellfleet 9.1 10.1 10.4 11.4 Entire coastline in the Town of Yarmouth
8.9 9.9 10.3 11.3
Transects 187-191: Wings Neck to Cape Cod Canal in the Town of Bourne
8.8 12.4 13.9 17.1
CAPE COD CANAL At Sandwich corporate limits 8.2 9.1 9.5 10.5 Sagamore Bridge to a point approximately 250 feet east of Sandwich corporate limits
8.4 10.2 10.4 12.9
East central reach 8.4 10.7 11.2 13.9 1North American Vertical Datum 1988
33
TABLE 6 –SUMMARY OF STILLWATER ELEVATIONS – cont’d
ELEVATION (feet NAVD1) FLOODING SOURCE AND LOCATION
10-PERCENT
2-PERCENT
1-PERCENT
0.2-PERCENT
CAPE COD CANAL – cont’d West central reach 8.5 11.2 12.0 14.8 Bourne Bridge to Buzzards Bay 8.6 11.8 12.9 15.9 CHATHAM HARBOR Transects 108-111: Southern End 5.1 7.6 9.1 13.6 Northern End; Pleasant Bay 5.8 8.6 10.6 14.1 DUCK CREEK The Cove to U.S Route 6 in the Town of Wellfleet 9.5 10.5 10.8 11.8 FREEMAN’S POND BROOK Entire Shoreline within Brewster 9.6 10.6 10.9 12.0 HATCHES CREEK Mouth to confluence at North Sunken Meadow Road extended in Eastham
8.9 9.9 10.2 11.3
Confluence at North Sunken Road extended to tidal limit in Eastham
9.1 10.0 10.4 11.4
HERRING RIVER Mouth to approximately 500 Feet upstream of mouth in Eastham
8.9 9.9 10.2 11.2
Approximately 500 feet Upstream of mouth to tidal limit in Eastham
9.0 10.0 10.3 11.2
At Route 28 bridge in the Town of Harwich 2.8 5.2 6.6 11.4 At North Road Bridge in The Town of Harwich 0.5 3.3 5.1 11.7 1North American Vertical Datum 1988
34
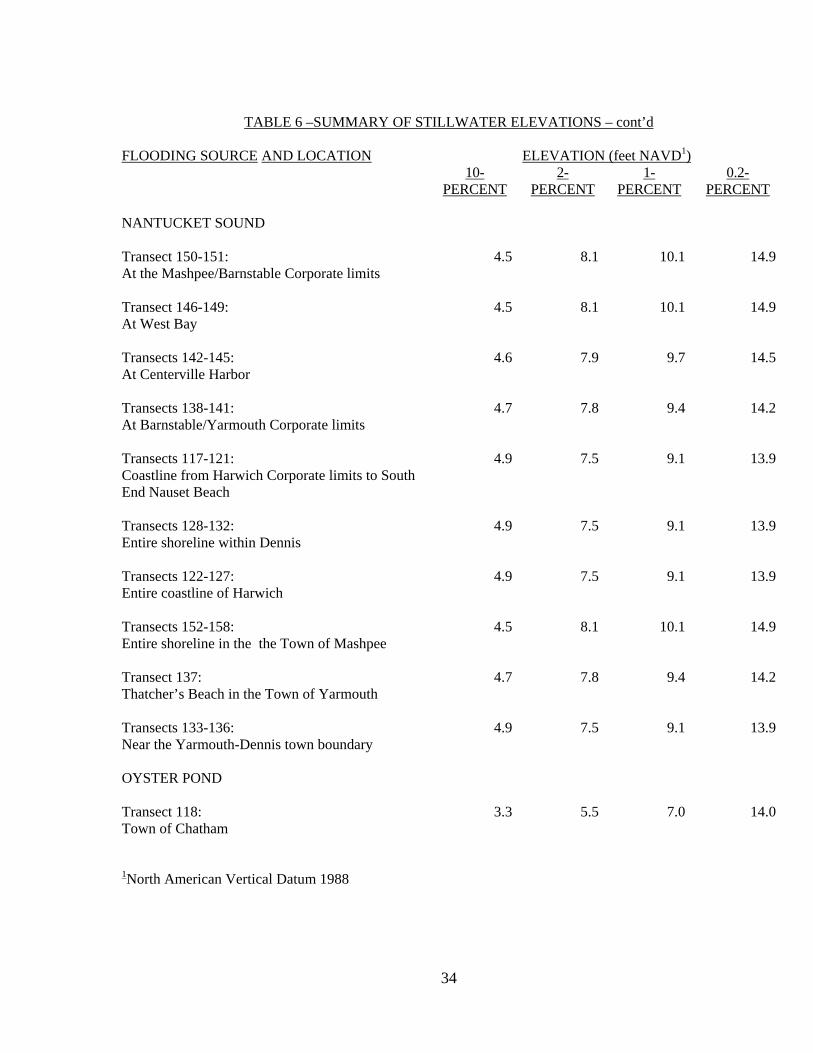
TABLE 6 –SUMMARY OF STILLWATER ELEVATIONS – cont’d
ELEVATION (feet NAVD1) FLOODING SOURCE AND LOCATION
10-PERCENT
2-PERCENT
1-PERCENT
0.2-PERCENT
NANTUCKET SOUND Transect 150-151: At the Mashpee/Barnstable Corporate limits
4.5 8.1 10.1 14.9
Transect 146-149: At West Bay
4.5 8.1 10.1 14.9
Transects 142-145: At Centerville Harbor
4.6 7.9 9.7 14.5
Transects 138-141: At Barnstable/Yarmouth Corporate limits
4.7 7.8 9.4 14.2
Transects 117-121: Coastline from Harwich Corporate limits to South End Nauset Beach
4.9 7.5 9.1 13.9
Transects 128-132: Entire shoreline within Dennis
4.9 7.5 9.1 13.9
Transects 122-127: Entire coastline of Harwich
4.9 7.5 9.1 13.9
Transects 152-158: Entire shoreline in the the Town of Mashpee
4.5 8.1 10.1 14.9
Transect 137: Thatcher’s Beach in the Town of Yarmouth
4.7 7.8 9.4 14.2
Transects 133-136: Near the Yarmouth-Dennis town boundary
4.9 7.5 9.1 13.9
OYSTER POND Transect 118: Town of Chatham
3.3 5.5 7.0 14.0
1North American Vertical Datum 1988

35
TABLE 6 –SUMMARY OF STILLWATER ELEVATIONS – cont’d
ELEVATION (feet NAVD1) FLOODING SOURCE AND LOCATION
10-PERCENT
2-PERCENT
1-PERCENT
0.2-PERCENT
PARKERS RIVER Transect 134: Confluence with Nantucket Sound in the Town of Yarmouth
4.7 7.5 9.1 13.9
Approximately 400 feet downstream Route 28 in the Town of Yarmouth
4.1 7.0 8.4 13.5
Approximately 400 feet upstream of State Route 28 in the Town of Yarmouth
1.8 6.1 8.1 13.5
Swan Pond in the Town of Yarmouth 1.8 6.1 8.1 13.6 PLEASANT BAY Town of Harwich 3.8 5.7 13.9 13.9 Transects 106-107: Harwich/Orleans corporate limits in the Town of Orleans
3.8 5.8 11.0 14.1
Sipson Island in the Town of Orleans 3.9 5.8 11.1 14.1 Transects 102-104: Namequit Point in the Town of Orleans
3.9 5.9 11.4 14.2
Transects 97-99: North End Pochet Island in the Town of Orleans
4.0 6.0 11.6 14.3
Frostfish Cove in the Town of Orleans 4.1 6.1 11.8 14.4 ROCK HARBOR CREEK Mouth to Rock Harbor In Orleans, Massachusetts
9.4 10.4 10.7 11.8
Rock Harbor Road to approximately 1300 feet downstream of Town Way in Eastham
9.5 10.5 10.8 20.9
Approximately 1300 feet downstream of Eastham Town Way to tidal limit
9.5 10.6 10.8 11.9
1North American Vertical Datum 1988
36
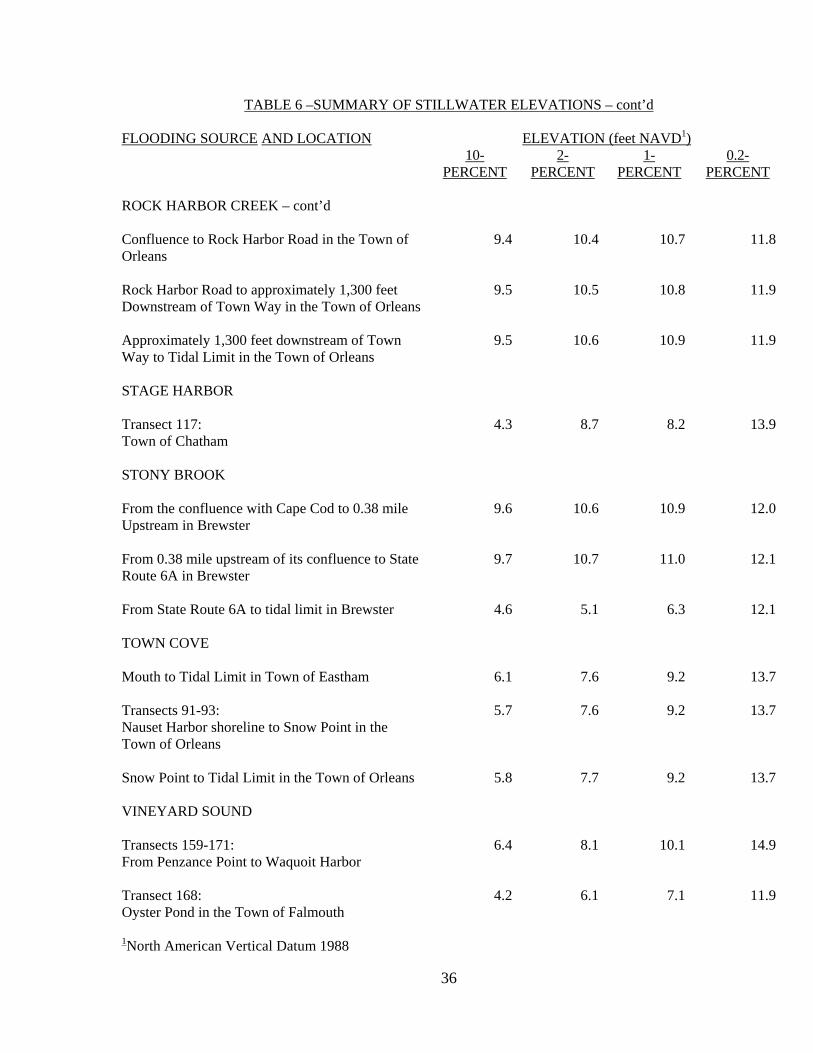
TABLE 6 –SUMMARY OF STILLWATER ELEVATIONS – cont’d
ELEVATION (feet NAVD1) FLOODING SOURCE AND LOCATION 10-
PERCENT 2-
PERCENT 1-
PERCENT 0.2-
PERCENT ROCK HARBOR CREEK – cont’d Confluence to Rock Harbor Road in the Town of Orleans
9.4 10.4 10.7 11.8
Rock Harbor Road to approximately 1,300 feet Downstream of Town Way in the Town of Orleans
9.5 10.5 10.8
11.9
Approximately 1,300 feet downstream of Town Way to Tidal Limit in the Town of Orleans
9.5 10.6 10.9 11.9
STAGE HARBOR Transect 117: Town of Chatham
4.3 8.7 8.2 13.9
STONY BROOK From the confluence with Cape Cod to 0.38 mile Upstream in Brewster
9.6 10.6 10.9 12.0
From 0.38 mile upstream of its confluence to State Route 6A in Brewster
9.7 10.7 11.0 12.1
From State Route 6A to tidal limit in Brewster 4.6 5.1 6.3 12.1 TOWN COVE Mouth to Tidal Limit in Town of Eastham 6.1 7.6 9.2 13.7 Transects 91-93: Nauset Harbor shoreline to Snow Point in the Town of Orleans
5.7 7.6 9.2 13.7
Snow Point to Tidal Limit in the Town of Orleans 5.8 7.7 9.2 13.7 VINEYARD SOUND Transects 159-171: From Penzance Point to Waquoit Harbor
6.4 8.1 10.1 14.9
Transect 168: Oyster Pond in the Town of Falmouth
4.2 6.1 7.1 11.9
1North American Vertical Datum 1988
37
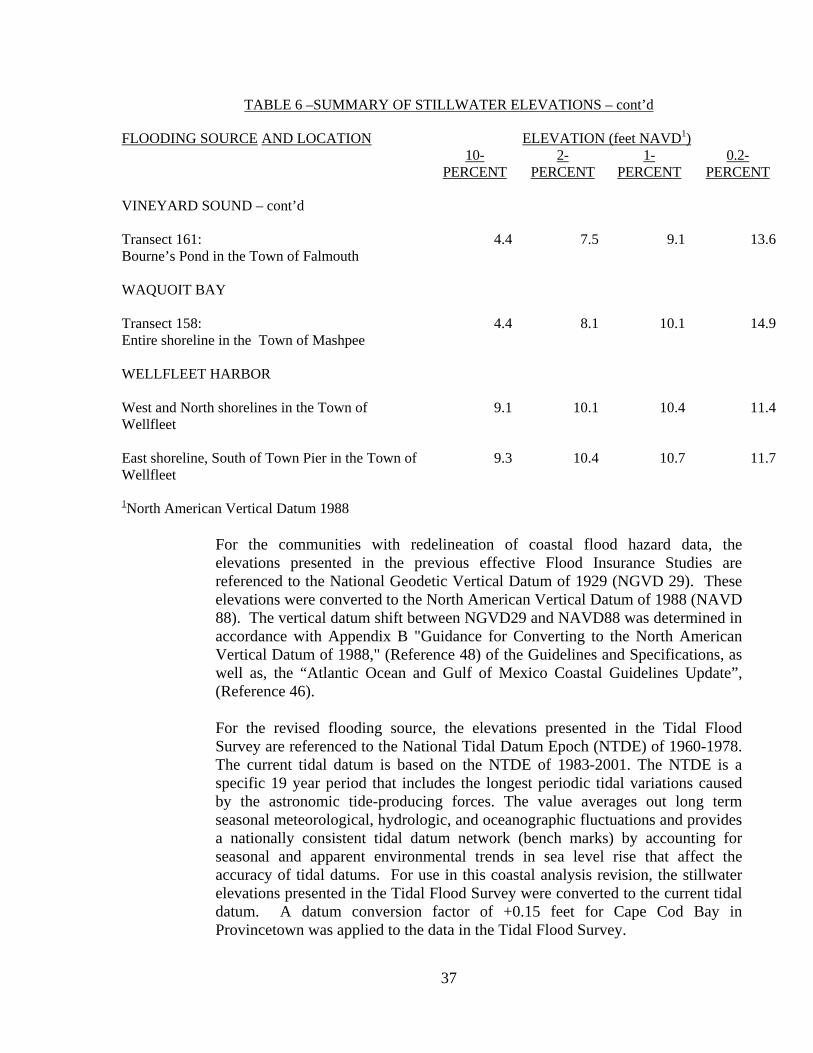
For the communities with redelineation of coastal flood hazard data, the elevations presented in the previous effective Flood Insurance Studies are referenced to the National Geodetic Vertical Datum of 1929 (NGVD 29). These elevations were converted to the North American Vertical Datum of 1988 (NAVD 88). The vertical datum shift between NGVD29 and NAVD88 was determined in accordance with Appendix B "Guidance for Converting to the North American Vertical Datum of 1988," (Reference 48) of the Guidelines and Specifications, as well as, the “Atlantic Ocean and Gulf of Mexico Coastal Guidelines Update”, (Reference 46). For the revised flooding source, the elevations presented in the Tidal Flood Survey are referenced to the National Tidal Datum Epoch (NTDE) of 1960-1978. The current tidal datum is based on the NTDE of 1983-2001. The NTDE is a specific 19 year period that includes the longest periodic tidal variations caused by the astronomic tide-producing forces. The value averages out long term seasonal meteorological, hydrologic, and oceanographic fluctuations and provides a nationally consistent tidal datum network (bench marks) by accounting for seasonal and apparent environmental trends in sea level rise that affect the accuracy of tidal datums. For use in this coastal analysis revision, the stillwater elevations presented in the Tidal Flood Survey were converted to the current tidal datum. A datum conversion factor of +0.15 feet for Cape Cod Bay in Provincetown was applied to the data in the Tidal Flood Survey.
TABLE 6 –SUMMARY OF STILLWATER ELEVATIONS – cont’d
ELEVATION (feet NAVD1) FLOODING SOURCE AND LOCATION 10-
PERCENT 2-
PERCENT 1-
PERCENT 0.2-
PERCENT VINEYARD SOUND – cont’d Transect 161: Bourne’s Pond in the Town of Falmouth
4.4 7.5 9.1 13.6
WAQUOIT BAY Transect 158: Entire shoreline in the Town of Mashpee
4.4 8.1 10.1 14.9
WELLFLEET HARBOR West and North shorelines in the Town of Wellfleet
9.1 10.1 10.4 11.4
East shoreline, South of Town Pier in the Town of Wellfleet
9.3 10.4 10.7 11.7
1North American Vertical Datum 1988
38
Wave setup along the open coast areas of Cape Cod Bay in Provincetown was calculated using the procedures detailed in the “Atlantic Ocean and Gulf of Mexico Coastal Guidelines Update”, (Reference 46). Specifically, the Direct Integration Method (DIM) was applied. Because much of the Barnstable County coastline has experienced historical flooding and damage above predicted surge and runup elevations, setup was assumed to be an important component of the analyses and was applied to the entire open coast shoreline in the revised community, except for areas inundated by wave runup. Wave setup was also considered in the effective analyses for the following communities Chatham, Harwich, Provincetown (Atlantic Coast), Truro and Yarmouth.
For the revised portion of Cape Cod Bay in Provincetown, wave characteristics representing a 1-percent-annual-chance storm were determined using a restricted fetch analysis and the US Army Corps of Engineers Automated Coastal Engineering System (ACES) software package. Mean wave characteristics were determined as specified in the FEMA guidance for V Zone mapping. Wave heights and wave runup in the revised portion of Cape Cod Bay in Provincetown were computed along transects that were located perpendicular to the average shoreline. The transects were located with consideration given to the physical and cultural characteristics of the land so that they would closely represent conditions in their locality. Transects were spaced close together in areas of complex topography and dense development. In areas having more uniform characteristics, the transects were spaced at larger intervals. It was also necessary to locate transects in areas where unique flooding existed and in areas where computer wave heights varied significantly between adjacent transects. Transect data for the communities with redelineation of coastal hazard data are referenced to each community's previous effective FIS. Countywide transect descriptions, including those for the restudied coastal analyses and for the communities with redelineation of coastal hazard data, are shown in Table 7 below. They have been re-numbered to conform to countywide standards.
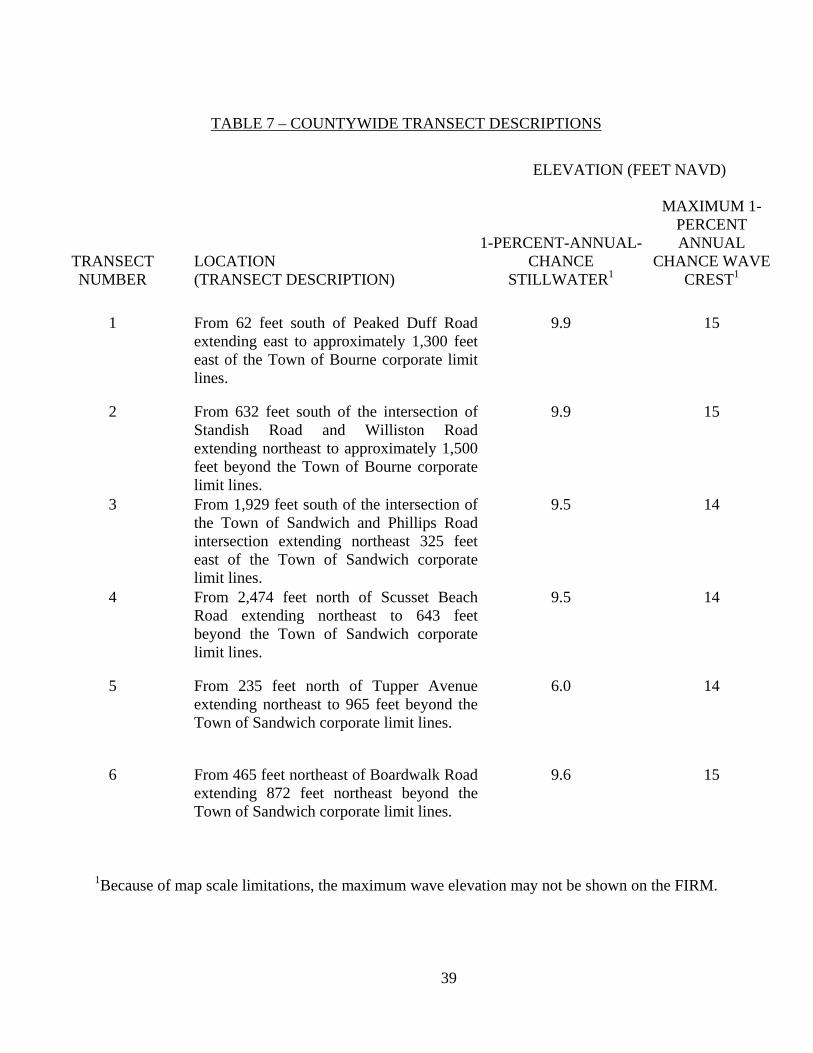
39
TABLE 7 – COUNTYWIDE TRANSECT DESCRIPTIONS
ELEVATION (FEET NAVD)
TRANSECT NUMBER
LOCATION (TRANSECT DESCRIPTION)
1-PERCENT-ANNUAL-CHANCE
STILLWATER1
MAXIMUM 1-PERCENT ANNUAL
CHANCE WAVE CREST1
1 From 62 feet south of Peaked Duff Road
extending east to approximately 1,300 feet east of the Town of Bourne corporate limit lines.
9.9 15
2 From 632 feet south of the intersection of Standish Road and Williston Road extending northeast to approximately 1,500 feet beyond the Town of Bourne corporate limit lines.
9.9 15
3 From 1,929 feet south of the intersection of the Town of Sandwich and Phillips Road intersection extending northeast 325 feet east of the Town of Sandwich corporate limit lines.
9.5 14
4 From 2,474 feet north of Scusset Beach Road extending northeast to 643 feet beyond the Town of Sandwich corporate limit lines.
9.5 14
5 From 235 feet north of Tupper Avenue extending northeast to 965 feet beyond the Town of Sandwich corporate limit lines.
6.0 14
6 From 465 feet northeast of Boardwalk Road extending 872 feet northeast beyond the Town of Sandwich corporate limit lines.
9.6 15
1Because of map scale limitations, the maximum wave elevation may not be shown on the FIRM.
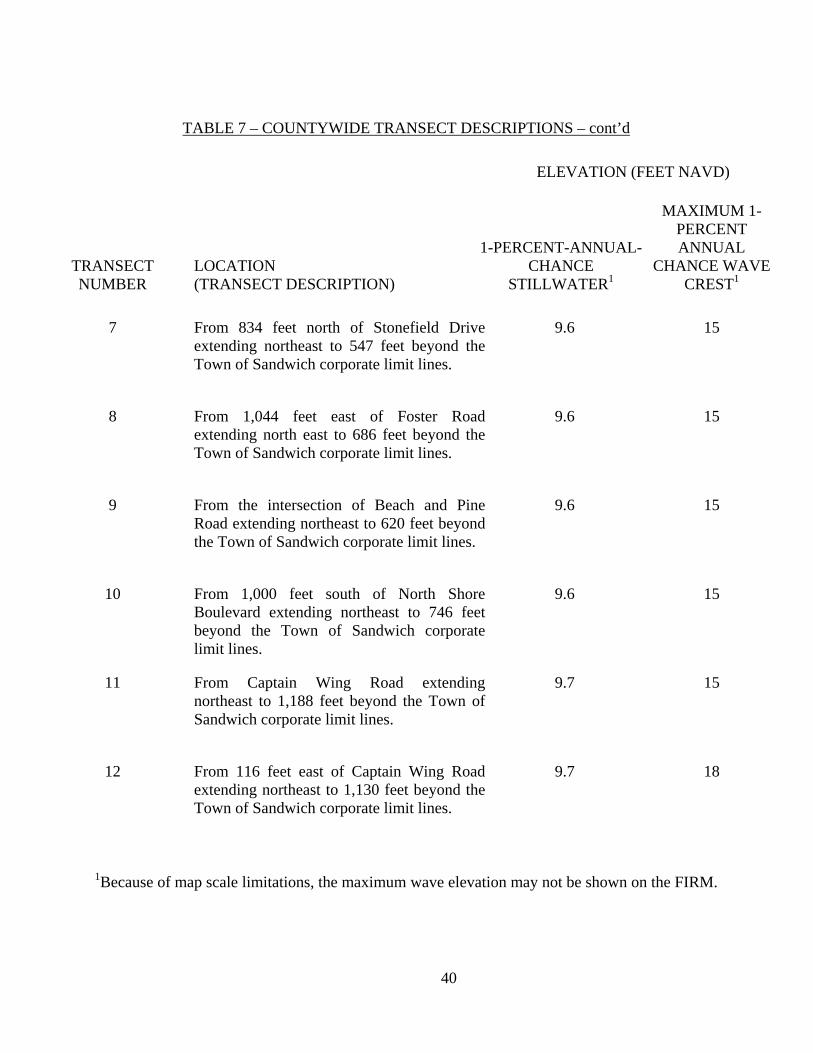
40
TABLE 7 – COUNTYWIDE TRANSECT DESCRIPTIONS – cont’d
ELEVATION (FEET NAVD)
TRANSECT NUMBER
LOCATION (TRANSECT DESCRIPTION)
1-PERCENT-ANNUAL-CHANCE
STILLWATER1
MAXIMUM 1-PERCENT ANNUAL
CHANCE WAVE CREST1
7 From 834 feet north of Stonefield Drive
extending northeast to 547 feet beyond the Town of Sandwich corporate limit lines.
9.6 15
8 From 1,044 feet east of Foster Road extending north east to 686 feet beyond the Town of Sandwich corporate limit lines.
9.6 15
9 From the intersection of Beach and Pine Road extending northeast to 620 feet beyond the Town of Sandwich corporate limit lines.
9.6 15
10 From 1,000 feet south of North Shore Boulevard extending northeast to 746 feet beyond the Town of Sandwich corporate limit lines.
9.6 15
11 From Captain Wing Road extending northeast to 1,188 feet beyond the Town of Sandwich corporate limit lines.
9.7 15
12 From 116 feet east of Captain Wing Road extending northeast to 1,130 feet beyond the Town of Sandwich corporate limit lines.
9.7 18
1Because of map scale limitations, the maximum wave elevation may not be shown on the FIRM.
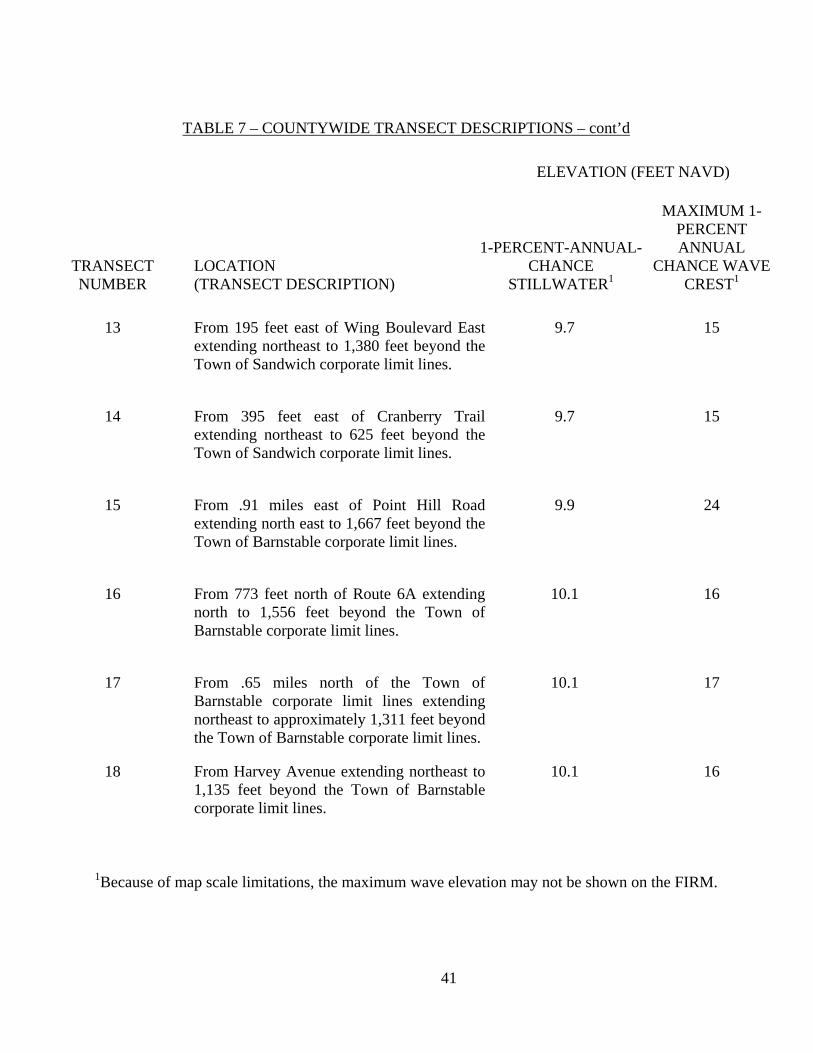
41
TABLE 7 – COUNTYWIDE TRANSECT DESCRIPTIONS – cont’d
ELEVATION (FEET NAVD)
TRANSECT NUMBER
LOCATION (TRANSECT DESCRIPTION)
1-PERCENT-ANNUAL-CHANCE
STILLWATER1
MAXIMUM 1-PERCENT ANNUAL
CHANCE WAVE CREST1
13 From 195 feet east of Wing Boulevard East
extending northeast to 1,380 feet beyond the Town of Sandwich corporate limit lines.
9.7 15
14 From 395 feet east of Cranberry Trail extending northeast to 625 feet beyond the Town of Sandwich corporate limit lines.
9.7 15
15 From .91 miles east of Point Hill Road extending north east to 1,667 feet beyond the Town of Barnstable corporate limit lines.
9.9 24
16 From 773 feet north of Route 6A extending north to 1,556 feet beyond the Town of Barnstable corporate limit lines.
10.1 16
17 From .65 miles north of the Town of Barnstable corporate limit lines extending northeast to approximately 1,311 feet beyond the Town of Barnstable corporate limit lines.
10.1 17
18 From Harvey Avenue extending northeast to 1,135 feet beyond the Town of Barnstable corporate limit lines.
10.1 16
1Because of map scale limitations, the maximum wave elevation may not be shown on the FIRM.
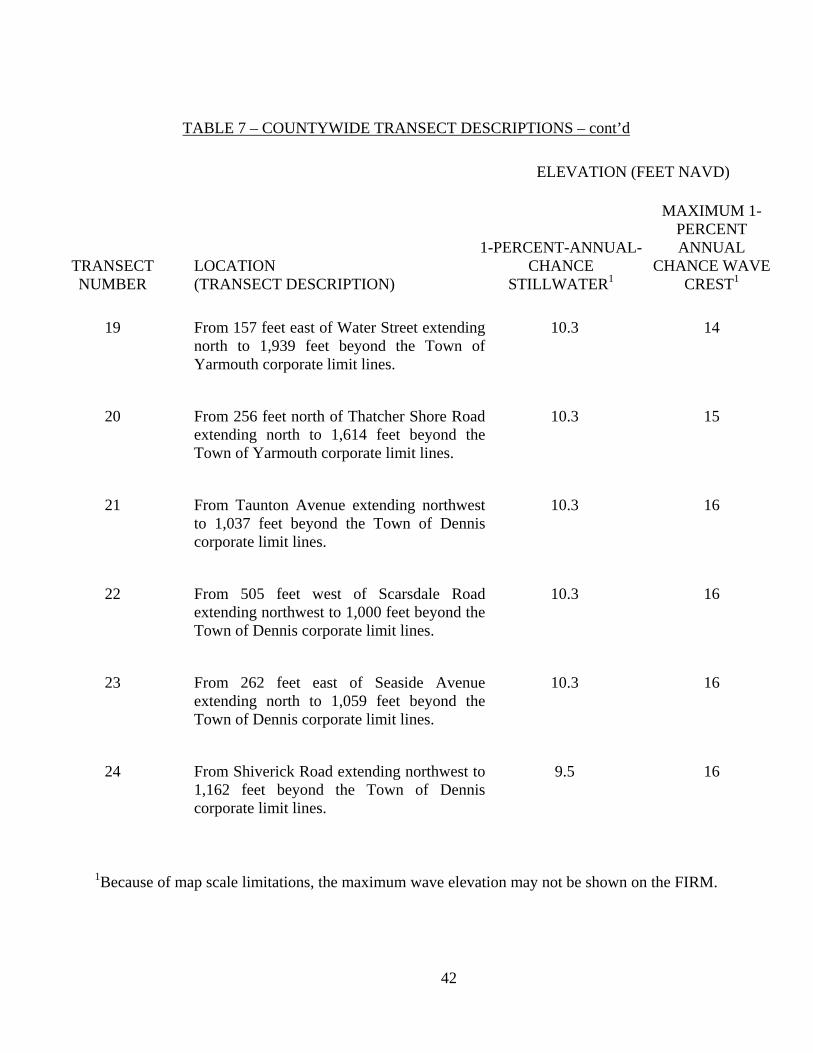
42
TABLE 7 – COUNTYWIDE TRANSECT DESCRIPTIONS – cont’d
ELEVATION (FEET NAVD)
TRANSECT NUMBER
LOCATION (TRANSECT DESCRIPTION)
1-PERCENT-ANNUAL-CHANCE
STILLWATER1
MAXIMUM 1-PERCENT ANNUAL
CHANCE WAVE CREST1
19 From 157 feet east of Water Street extending
north to 1,939 feet beyond the Town of Yarmouth corporate limit lines.
10.3 14
20 From 256 feet north of Thatcher Shore Road extending north to 1,614 feet beyond the Town of Yarmouth corporate limit lines.
10.3 15
21 From Taunton Avenue extending northwest to 1,037 feet beyond the Town of Dennis corporate limit lines.
10.3 16
22 From 505 feet west of Scarsdale Road extending northwest to 1,000 feet beyond the Town of Dennis corporate limit lines.
10.3 16
23 From 262 feet east of Seaside Avenue extending north to 1,059 feet beyond the Town of Dennis corporate limit lines.
10.3 16
24 From Shiverick Road extending northwest to 1,162 feet beyond the Town of Dennis corporate limit lines.
9.5 16
1Because of map scale limitations, the maximum wave elevation may not be shown on the FIRM.

43
TABLE 7 – COUNTYWIDE TRANSECT DESCRIPTIONS – cont’d
ELEVATION (FEET NAVD)
TRANSECT NUMBER
LOCATION (TRANSECT DESCRIPTION)
1-PERCENT-ANNUAL-CHANCE
STILLWATER1
MAXIMUM 1-PERCENT ANNUAL
CHANCE WAVE CREST1
25 From 674 feet east of Sea Street extending
northeast to 760 feet beyond the Town of Dennis corporate limit lines.
10.3 17
26 From 322 feet north of Route 6A extending northwest to 180 feet beyond the Town of Dennis corporate limit lines.
10.9 16
27 From 218 feet west of Cedar Hill Road extending north to 556 feet beyond the Town of Brewster corporate limit lines.
10.9 15
28 From 78 feet west of Ambergris Road extending northwest to 723 feet beyond the Town of Brewster corporate limit lines.
10.9 19
29 From Main Street extending northwest to 939 feet beyond the Town of Brewster corporate limit lines.
10.9 16
30 From 725 feet west of Foster Road extending north to 866 feet beyond the Town of Brewster corporate limit lines.
10.9 23
1Because of map scale limitations, the maximum wave elevation may not be shown on the FIRM.
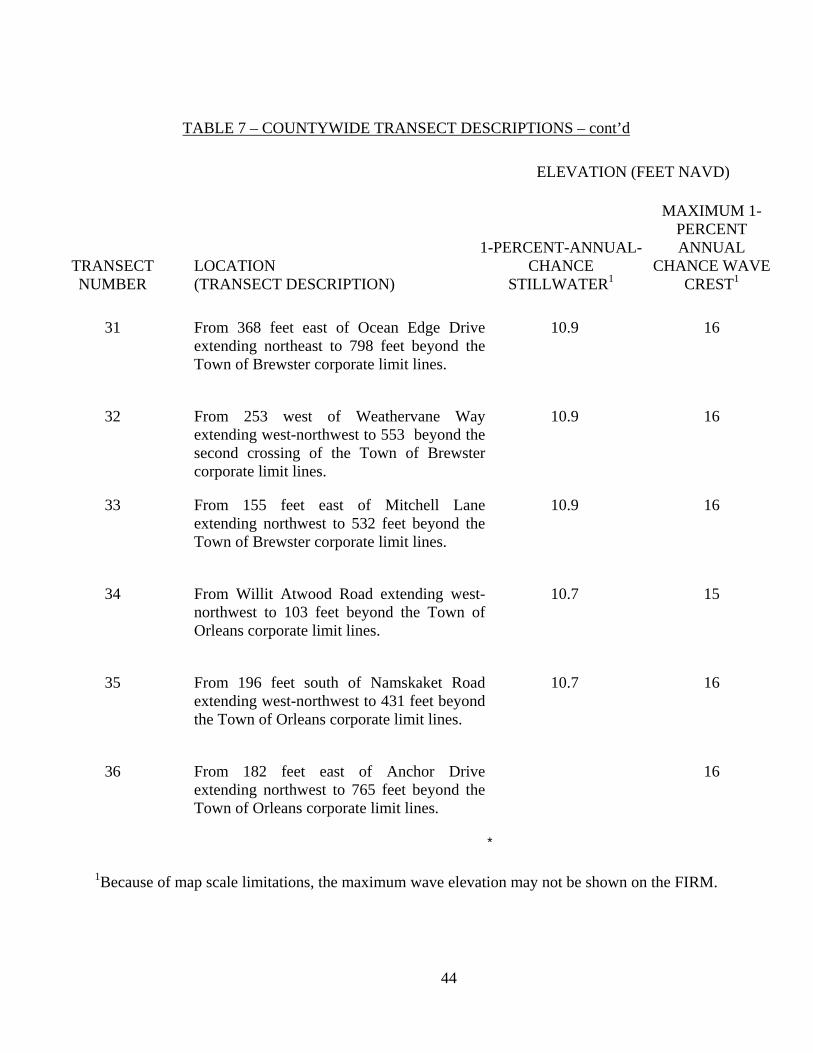
44
TABLE 7 – COUNTYWIDE TRANSECT DESCRIPTIONS – cont’d
ELEVATION (FEET NAVD)
TRANSECT NUMBER
LOCATION (TRANSECT DESCRIPTION)
1-PERCENT-ANNUAL-CHANCE
STILLWATER1
MAXIMUM 1-PERCENT ANNUAL
CHANCE WAVE CREST1
31 From 368 feet east of Ocean Edge Drive
extending northeast to 798 feet beyond the Town of Brewster corporate limit lines.
10.9 16
32 From 253 west of Weathervane Way extending west-northwest to 553 beyond the second crossing of the Town of Brewster corporate limit lines.
10.9 16
33 From 155 feet east of Mitchell Lane extending northwest to 532 feet beyond the Town of Brewster corporate limit lines.
10.9 16
34 From Willit Atwood Road extending west-northwest to 103 feet beyond the Town of Orleans corporate limit lines.
10.7 15
35 From 196 feet south of Namskaket Road extending west-northwest to 431 feet beyond the Town of Orleans corporate limit lines.
10.7 16
36 From 182 feet east of Anchor Drive extending northwest to 765 feet beyond the Town of Orleans corporate limit lines.
*
16
1Because of map scale limitations, the maximum wave elevation may not be shown on the FIRM.

45
TABLE 7 – COUNTYWIDE TRANSECT DESCRIPTIONS – cont’d
ELEVATION (FEET NAVD)
TRANSECT NUMBER
LOCATION (TRANSECT DESCRIPTION)
1-PERCENT-ANNUAL-CHANCE
STILLWATER1
MAXIMUM 1-PERCENT ANNUAL
CHANCE WAVE CREST1
37 From 576 feet north of Dyer Prence Road
extending west-northwest to 670 feet beyond the Town of Orleans corporate limit lines.
10.2 16
38 From 807 feet north of Charlie Noble Way extending northwest to 421 feet beyond the Town Eastham corporate limit lines.
10.2 16
39 From 185 feet south of Herring Brook Road to 927 feet east of Samoset Road.
10.2 13
40 From 1,438 feet southeast of the intersection of Samoset Road and Sherwood Road extending west 879 feet beyond the Town of Eastham corporate limit lines.
10.2 16
41 From 50 feet west of Beach Plum Lane extending west 565 feet beyond the Town of Eastham corporate limit lines.
10.2 19
42 From 30 north of Thumpertown Road extending east to 941 feet west of the Town of Eastham corporate limit lines.
10.2 24
1Because of map scale limitations, the maximum wave elevation may not be shown on the FIRM.
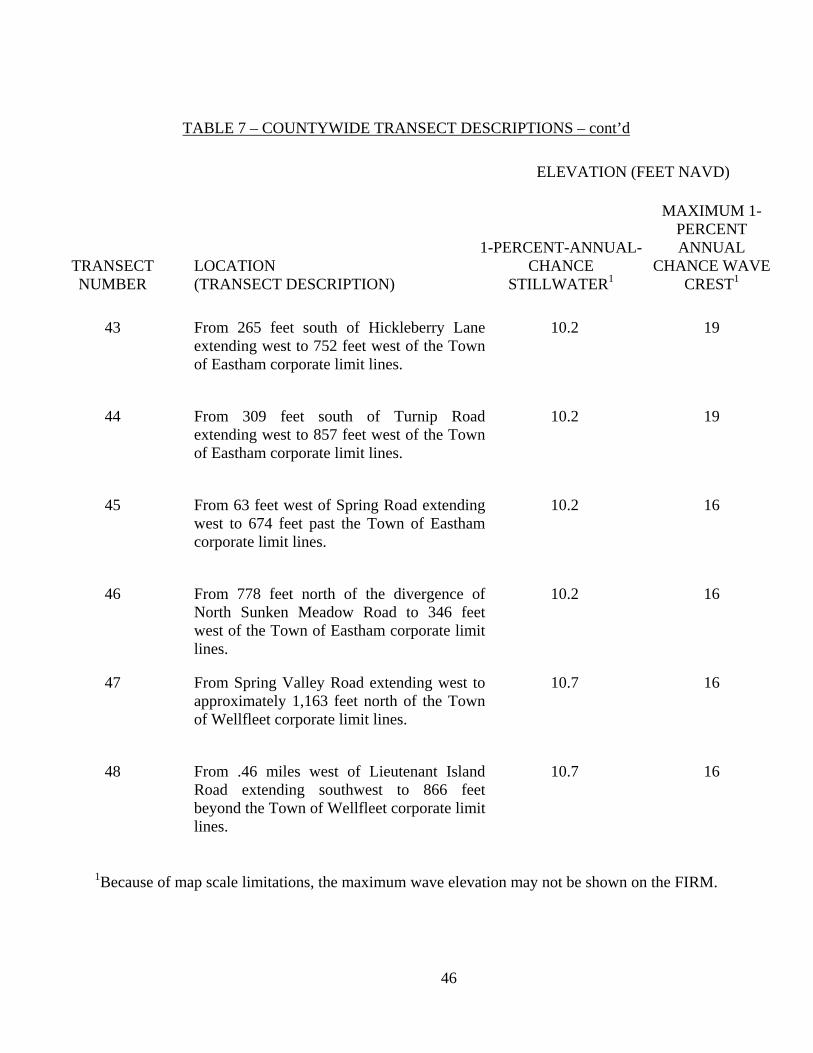
46
TABLE 7 – COUNTYWIDE TRANSECT DESCRIPTIONS – cont’d
ELEVATION (FEET NAVD)
TRANSECT NUMBER
LOCATION (TRANSECT DESCRIPTION)
1-PERCENT-ANNUAL-CHANCE
STILLWATER1
MAXIMUM 1-PERCENT ANNUAL
CHANCE WAVE CREST1
43 From 265 feet south of Hickleberry Lane
extending west to 752 feet west of the Town of Eastham corporate limit lines.
10.2 19
44 From 309 feet south of Turnip Road extending west to 857 feet west of the Town of Eastham corporate limit lines.
10.2 19
45 From 63 feet west of Spring Road extending west to 674 feet past the Town of Eastham corporate limit lines.
10.2 16
46 From 778 feet north of the divergence of North Sunken Meadow Road to 346 feet west of the Town of Eastham corporate limit lines.
10.2 16
47 From Spring Valley Road extending west to approximately 1,163 feet north of the Town of Wellfleet corporate limit lines.
10.7 16
48 From .46 miles west of Lieutenant Island Road extending southwest to 866 feet beyond the Town of Wellfleet corporate limit lines.
10.7 16
1Because of map scale limitations, the maximum wave elevation may not be shown on the FIRM.
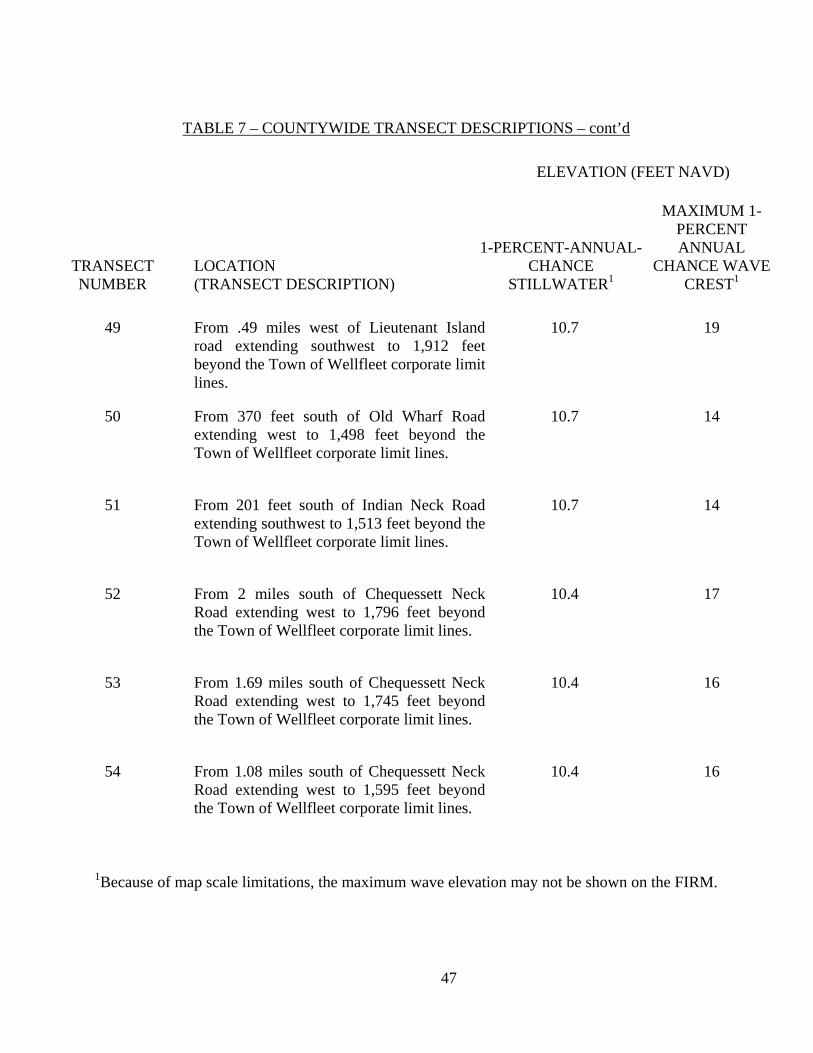
47
TABLE 7 – COUNTYWIDE TRANSECT DESCRIPTIONS – cont’d
ELEVATION (FEET NAVD)
TRANSECT NUMBER
LOCATION (TRANSECT DESCRIPTION)
1-PERCENT-ANNUAL-CHANCE
STILLWATER1
MAXIMUM 1-PERCENT ANNUAL
CHANCE WAVE CREST1
49 From .49 miles west of Lieutenant Island
road extending southwest to 1,912 feet beyond the Town of Wellfleet corporate limit lines.
10.7 19
50 From 370 feet south of Old Wharf Road extending west to 1,498 feet beyond the Town of Wellfleet corporate limit lines.
10.7 14
51 From 201 feet south of Indian Neck Road extending southwest to 1,513 feet beyond the Town of Wellfleet corporate limit lines.
10.7 14
52 From 2 miles south of Chequessett Neck Road extending west to 1,796 feet beyond the Town of Wellfleet corporate limit lines.
10.4 17
53 From 1.69 miles south of Chequessett Neck Road extending west to 1,745 feet beyond the Town of Wellfleet corporate limit lines.
10.4 16
54 From 1.08 miles south of Chequessett Neck Road extending west to 1,595 feet beyond the Town of Wellfleet corporate limit lines.
10.4 16
1Because of map scale limitations, the maximum wave elevation may not be shown on the FIRM.

48
TABLE 7 – COUNTYWIDE TRANSECT DESCRIPTIONS – cont’d
ELEVATION (FEET NAVD)
TRANSECT NUMBER
LOCATION (TRANSECT DESCRIPTION)
1-PERCENT-ANNUAL-CHANCE
STILLWATER1
MAXIMUM 1-PERCENT ANNUAL
CHANCE WAVE CREST1
55 From 2,476 feet south of Chequessett Neck
Road extending west to 1,302 feet beyond the Town of Wellfleet corporate limit lines.
10.4 16
56 From 158 feet north of Griffin Island Road extending northwest to 1,366 feet beyond the Town of Wellfleet corporate limit lines.
10.4 18
57 From 563 feet south of Duck Harbor Road extending west to 1,426 feet beyond the Town of Wellfleet corporate limit lines.
10.4 16
58 From 720 feet north of Bound Brook Island Road extending west to 1,898 feet beyond the Town of Wellfleet corporate limit lines.
10.4 18
59 From 2,062 feet north of Bound Brook Island Road extending west to 1,650 feet beyond the Town of Wellfleet corporate limit lines.
10.4 16
60 From 1,034 feet south of Ryder Beach Road extending west to 1,870 feet beyond the Town of Truro corporate limit lines.
10.2 23
1Because of map scale limitations, the maximum wave elevation may not be shown on the FIRM.
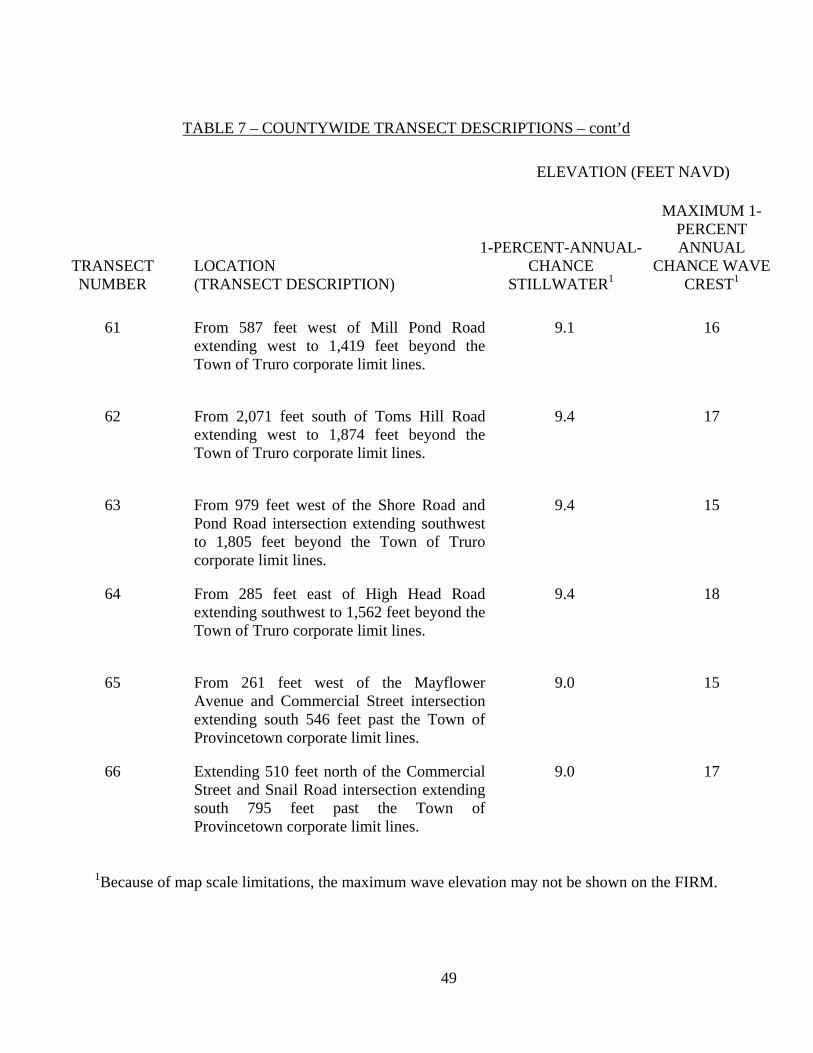
49
TABLE 7 – COUNTYWIDE TRANSECT DESCRIPTIONS – cont’d
ELEVATION (FEET NAVD)
TRANSECT NUMBER
LOCATION (TRANSECT DESCRIPTION)
1-PERCENT-ANNUAL-CHANCE
STILLWATER1
MAXIMUM 1-PERCENT ANNUAL
CHANCE WAVE CREST1
61 From 587 feet west of Mill Pond Road
extending west to 1,419 feet beyond the Town of Truro corporate limit lines.
9.1 16
62 From 2,071 feet south of Toms Hill Road extending west to 1,874 feet beyond the Town of Truro corporate limit lines.
9.4 17
63 From 979 feet west of the Shore Road and Pond Road intersection extending southwest to 1,805 feet beyond the Town of Truro corporate limit lines.
9.4 15
64 From 285 feet east of High Head Road extending southwest to 1,562 feet beyond the Town of Truro corporate limit lines.
9.4 18
65 From 261 feet west of the Mayflower Avenue and Commercial Street intersection extending south 546 feet past the Town of Provincetown corporate limit lines.
9.0 15
66 Extending 510 feet north of the Commercial Street and Snail Road intersection extending south 795 feet past the Town of Provincetown corporate limit lines.
9.0 17
1Because of map scale limitations, the maximum wave elevation may not be shown on the FIRM.
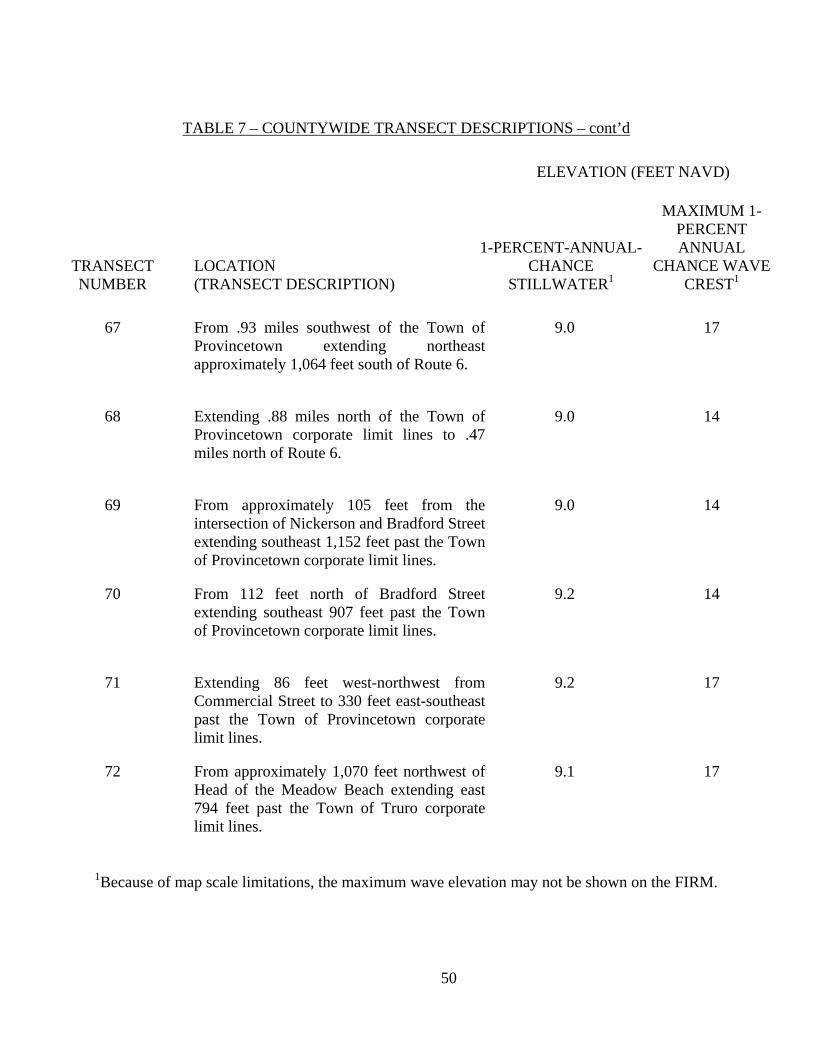
50
TABLE 7 – COUNTYWIDE TRANSECT DESCRIPTIONS – cont’d
ELEVATION (FEET NAVD)
TRANSECT NUMBER
LOCATION (TRANSECT DESCRIPTION)
1-PERCENT-ANNUAL-CHANCE
STILLWATER1
MAXIMUM 1-PERCENT ANNUAL
CHANCE WAVE CREST1
67 From .93 miles southwest of the Town of
Provincetown extending northeast approximately 1,064 feet south of Route 6.
9.0 17
68 Extending .88 miles north of the Town of Provincetown corporate limit lines to .47 miles north of Route 6.
9.0 14
69 From approximately 105 feet from the intersection of Nickerson and Bradford Street extending southeast 1,152 feet past the Town of Provincetown corporate limit lines.
9.0 14
70 From 112 feet north of Bradford Street extending southeast 907 feet past the Town of Provincetown corporate limit lines.
9.2 14
71 Extending 86 feet west-northwest from Commercial Street to 330 feet east-southeast past the Town of Provincetown corporate limit lines.
9.2 17
72 From approximately 1,070 feet northwest of Head of the Meadow Beach extending east 794 feet past the Town of Truro corporate limit lines.
9.1 17
1Because of map scale limitations, the maximum wave elevation may not be shown on the FIRM.
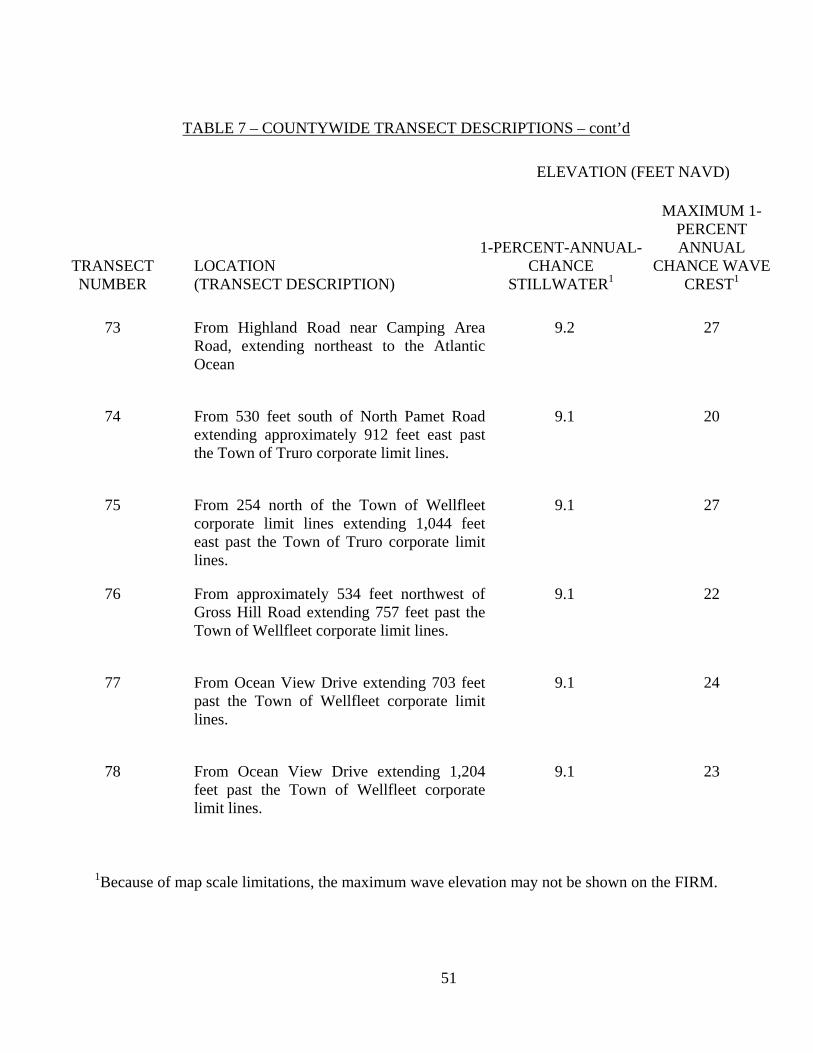
51
TABLE 7 – COUNTYWIDE TRANSECT DESCRIPTIONS – cont’d
ELEVATION (FEET NAVD)
TRANSECT NUMBER
LOCATION (TRANSECT DESCRIPTION)
1-PERCENT-ANNUAL-CHANCE
STILLWATER1
MAXIMUM 1-PERCENT ANNUAL
CHANCE WAVE CREST1
73 From Highland Road near Camping Area
Road, extending northeast to the Atlantic Ocean
9.2 27
74 From 530 feet south of North Pamet Road extending approximately 912 feet east past the Town of Truro corporate limit lines.
9.1 20
75 From 254 north of the Town of Wellfleet corporate limit lines extending 1,044 feet east past the Town of Truro corporate limit lines.
9.1 27
76 From approximately 534 feet northwest of Gross Hill Road extending 757 feet past the Town of Wellfleet corporate limit lines.
9.1 22
77 From Ocean View Drive extending 703 feet past the Town of Wellfleet corporate limit lines.
9.1 24
78 From Ocean View Drive extending 1,204 feet past the Town of Wellfleet corporate limit lines.
9.1 23
1Because of map scale limitations, the maximum wave elevation may not be shown on the FIRM.
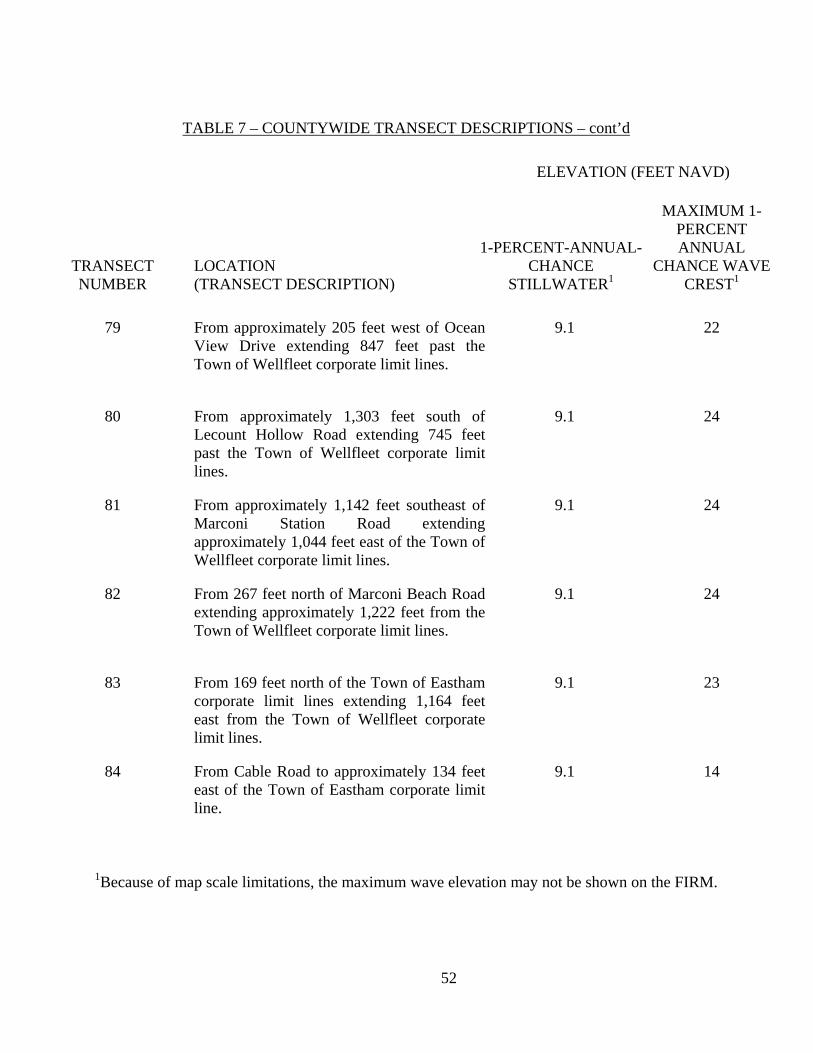
52
TABLE 7 – COUNTYWIDE TRANSECT DESCRIPTIONS – cont’d
ELEVATION (FEET NAVD)
TRANSECT NUMBER
LOCATION (TRANSECT DESCRIPTION)
1-PERCENT-ANNUAL-CHANCE
STILLWATER1
MAXIMUM 1-PERCENT ANNUAL
CHANCE WAVE CREST1
79 From approximately 205 feet west of Ocean
View Drive extending 847 feet past the Town of Wellfleet corporate limit lines.
9.1 22
80 From approximately 1,303 feet south of Lecount Hollow Road extending 745 feet past the Town of Wellfleet corporate limit lines.
9.1 24
81 From approximately 1,142 feet southeast of Marconi Station Road extending approximately 1,044 feet east of the Town of Wellfleet corporate limit lines.
9.1 24
82 From 267 feet north of Marconi Beach Road extending approximately 1,222 feet from the Town of Wellfleet corporate limit lines.
9.1 24
83 From 169 feet north of the Town of Eastham corporate limit lines extending 1,164 feet east from the Town of Wellfleet corporate limit lines.
9.1 23
84 From Cable Road to approximately 134 feet east of the Town of Eastham corporate limit line.
9.1 14
1Because of map scale limitations, the maximum wave elevation may not be shown on the FIRM.

53
TABLE 7 – COUNTYWIDE TRANSECT DESCRIPTIONS – cont’d
ELEVATION (FEET NAVD)
TRANSECT NUMBER
LOCATION (TRANSECT DESCRIPTION)
1-PERCENT-ANNUAL-CHANCE
STILLWATER1
MAXIMUM 1-PERCENT ANNUAL
CHANCE WAVE CREST1
85 From approximately 270 feet east of Ocean
View Drive to approximately 164 feet past the Town of Eastham corporate limit lines. Beach
9.1 14
86 From 190 feet east of Tomahawk Trail to approximately 165 feet west of the Town of Eastham corporate limit lines.
9.1 14
87 From 326 feet east of Salt Pond Bay extending northwest to approximately 1,620 feet south of Nauset Road.
9.1 12
88 From approximately 1,320 feet east of Grand Arm of the Republic Highway to Salt Pond Bay.
9.1 14
89 From approximately 137 feet east-southeast of Hemenway Road to approximately 977 feet south of Salt Pond Bay.
9.1 12
90 From approximately 513 feet northeast of Fort Hill Road to the Town of Eastham corporate limit lines.
9.1 14
1Because of map scale limitations, the maximum wave elevation may not be shown on the FIRM.
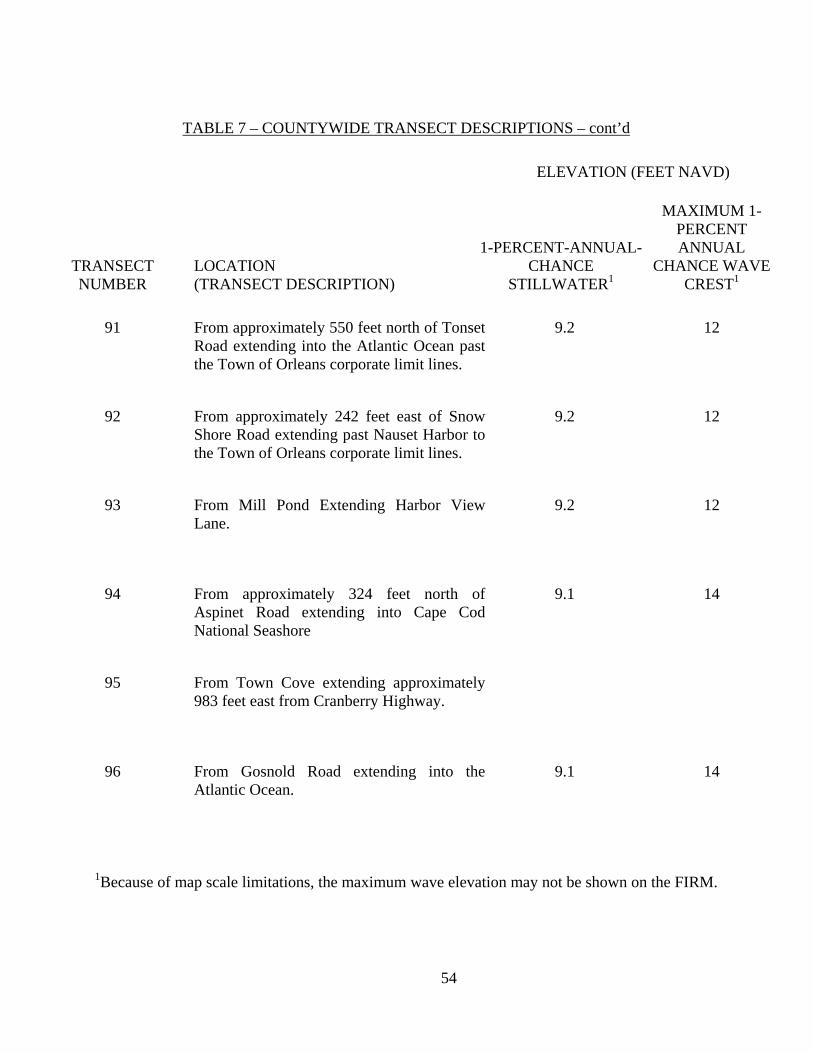
54
TABLE 7 – COUNTYWIDE TRANSECT DESCRIPTIONS – cont’d
ELEVATION (FEET NAVD)
TRANSECT NUMBER
LOCATION (TRANSECT DESCRIPTION)
1-PERCENT-ANNUAL-CHANCE
STILLWATER1
MAXIMUM 1-PERCENT ANNUAL
CHANCE WAVE CREST1
91 From approximately 550 feet north of Tonset
Road extending into the Atlantic Ocean past the Town of Orleans corporate limit lines.
9.2 12
92 From approximately 242 feet east of Snow Shore Road extending past Nauset Harbor to the Town of Orleans corporate limit lines.
9.2 12
93 From Mill Pond Extending Harbor View Lane.
9.2 12
94 From approximately 324 feet north of Aspinet Road extending into Cape Cod National Seashore
9.1 14
95 From Town Cove extending approximately 983 feet east from Cranberry Highway.
96 From Gosnold Road extending into the Atlantic Ocean.
9.1 14
1Because of map scale limitations, the maximum wave elevation may not be shown on the FIRM.
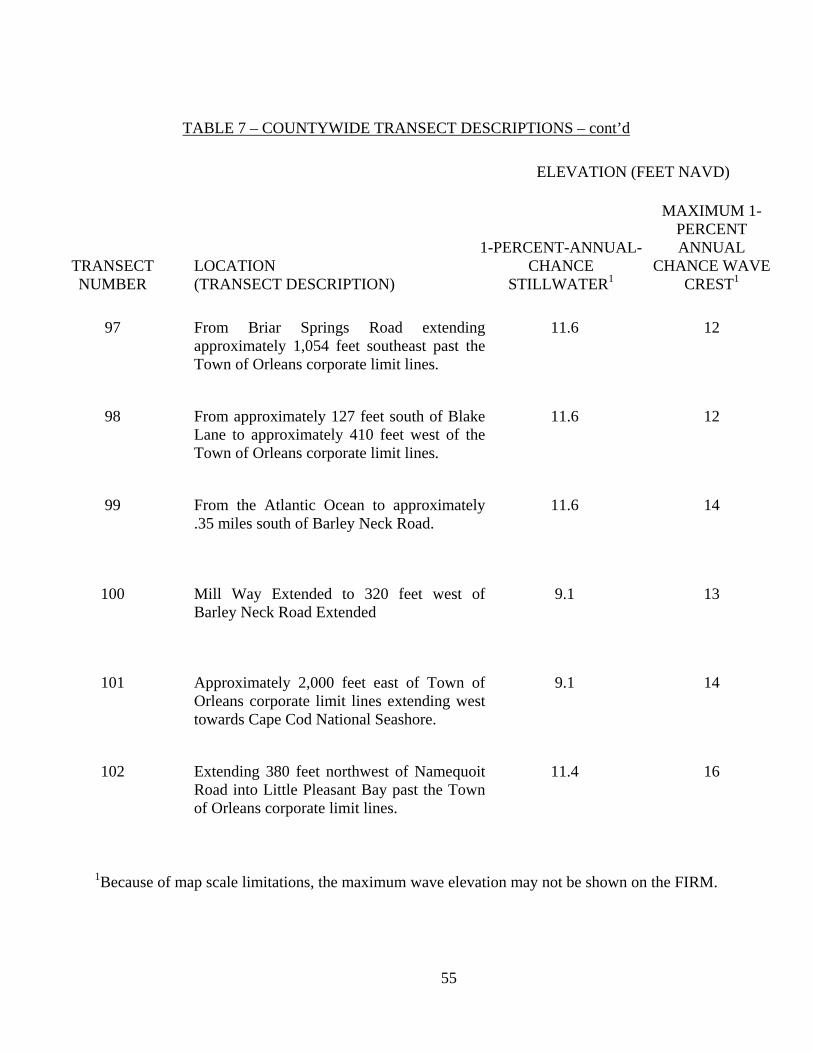
55
TABLE 7 – COUNTYWIDE TRANSECT DESCRIPTIONS – cont’d
ELEVATION (FEET NAVD)
TRANSECT NUMBER
LOCATION (TRANSECT DESCRIPTION)
1-PERCENT-ANNUAL-CHANCE
STILLWATER1
MAXIMUM 1-PERCENT ANNUAL
CHANCE WAVE CREST1
97 From Briar Springs Road extending
approximately 1,054 feet southeast past the Town of Orleans corporate limit lines.
11.6 12
98 From approximately 127 feet south of Blake Lane to approximately 410 feet west of the Town of Orleans corporate limit lines.
11.6 12
99 From the Atlantic Ocean to approximately .35 miles south of Barley Neck Road.
11.6 14
100 Mill Way Extended to 320 feet west of Barley Neck Road Extended
9.1 13
101 Approximately 2,000 feet east of Town of Orleans corporate limit lines extending west towards Cape Cod National Seashore.
9.1 14
102 Extending 380 feet northwest of Namequoit Road into Little Pleasant Bay past the Town of Orleans corporate limit lines.
11.4 16
1Because of map scale limitations, the maximum wave elevation may not be shown on the FIRM.
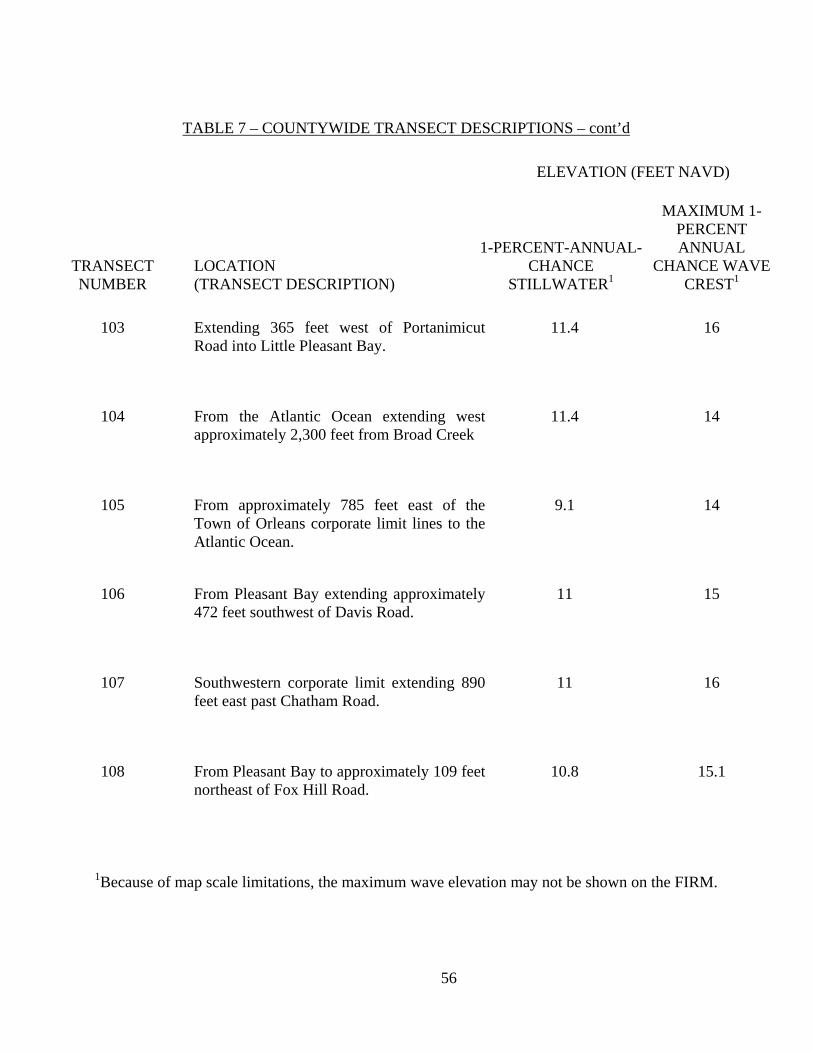
56
TABLE 7 – COUNTYWIDE TRANSECT DESCRIPTIONS – cont’d
ELEVATION (FEET NAVD)
TRANSECT NUMBER
LOCATION (TRANSECT DESCRIPTION)
1-PERCENT-ANNUAL-CHANCE
STILLWATER1
MAXIMUM 1-PERCENT ANNUAL
CHANCE WAVE CREST1
103 Extending 365 feet west of Portanimicut
Road into Little Pleasant Bay. 11.4 16
104 From the Atlantic Ocean extending west approximately 2,300 feet from Broad Creek
11.4 14
105 From approximately 785 feet east of the Town of Orleans corporate limit lines to the Atlantic Ocean.
9.1 14
106 From Pleasant Bay extending approximately 472 feet southwest of Davis Road.
11 15
107 Southwestern corporate limit extending 890 feet east past Chatham Road.
11 16
108 From Pleasant Bay to approximately 109 feet northeast of Fox Hill Road.
10.8 15.1
1Because of map scale limitations, the maximum wave elevation may not be shown on the FIRM.

57
TABLE 7 – COUNTYWIDE TRANSECT DESCRIPTIONS – cont’d
ELEVATION (FEET NAVD)
TRANSECT NUMBER
LOCATION (TRANSECT DESCRIPTION)
1-PERCENT-ANNUAL-CHANCE
STILLWATER1
MAXIMUM 1-PERCENT ANNUAL
CHANCE WAVE CREST1
109 From approximately 584 feet southwest of
Cotchpinicut Road to Chatham Harbor. 10.1 14.1
110 From Captains Walk to Allen Point including North Beach
9.7 14.1
111 From Chatham Harbor to approximately 529 feet east of Captain Walk
9.6 12.1
112 From Chatham Harbor to approximately 114 feet past Kettledrum Lane
9.5 12.1
113 From approximately 201 feet east of Holway Street to Chatham Harbor.
9.4 14.1
114 From Chatham Light to Main Street 9.3 14.1
1Because of map scale limitations, the maximum wave elevation may not be shown on the FIRM.
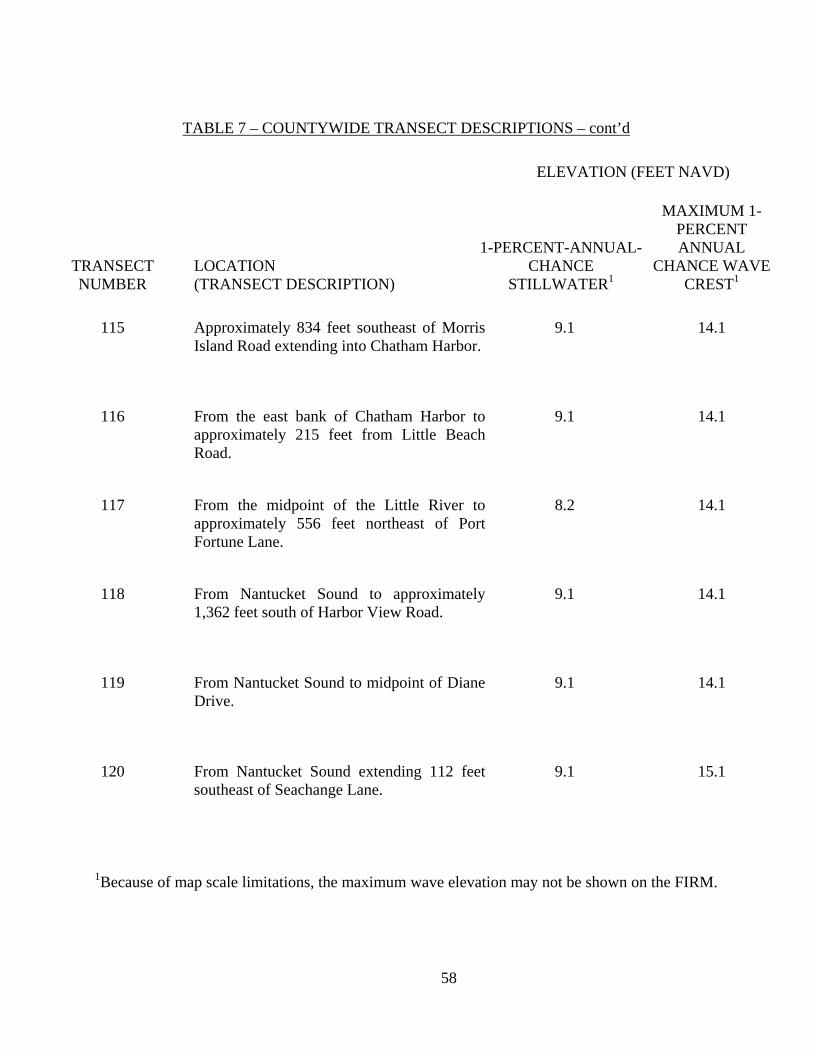
58
TABLE 7 – COUNTYWIDE TRANSECT DESCRIPTIONS – cont’d
ELEVATION (FEET NAVD)
TRANSECT NUMBER
LOCATION (TRANSECT DESCRIPTION)
1-PERCENT-ANNUAL-CHANCE
STILLWATER1
MAXIMUM 1-PERCENT ANNUAL
CHANCE WAVE CREST1
115 Approximately 834 feet southeast of Morris
Island Road extending into Chatham Harbor.9.1 14.1
116 From the east bank of Chatham Harbor to approximately 215 feet from Little Beach Road.
9.1 14.1
117 From the midpoint of the Little River to approximately 556 feet northeast of Port Fortune Lane.
8.2 14.1
118 From Nantucket Sound to approximately 1,362 feet south of Harbor View Road.
9.1 14.1
119 From Nantucket Sound to midpoint of Diane Drive.
9.1 14.1
120 From Nantucket Sound extending 112 feet southeast of Seachange Lane.
9.1 15.1
1Because of map scale limitations, the maximum wave elevation may not be shown on the FIRM.
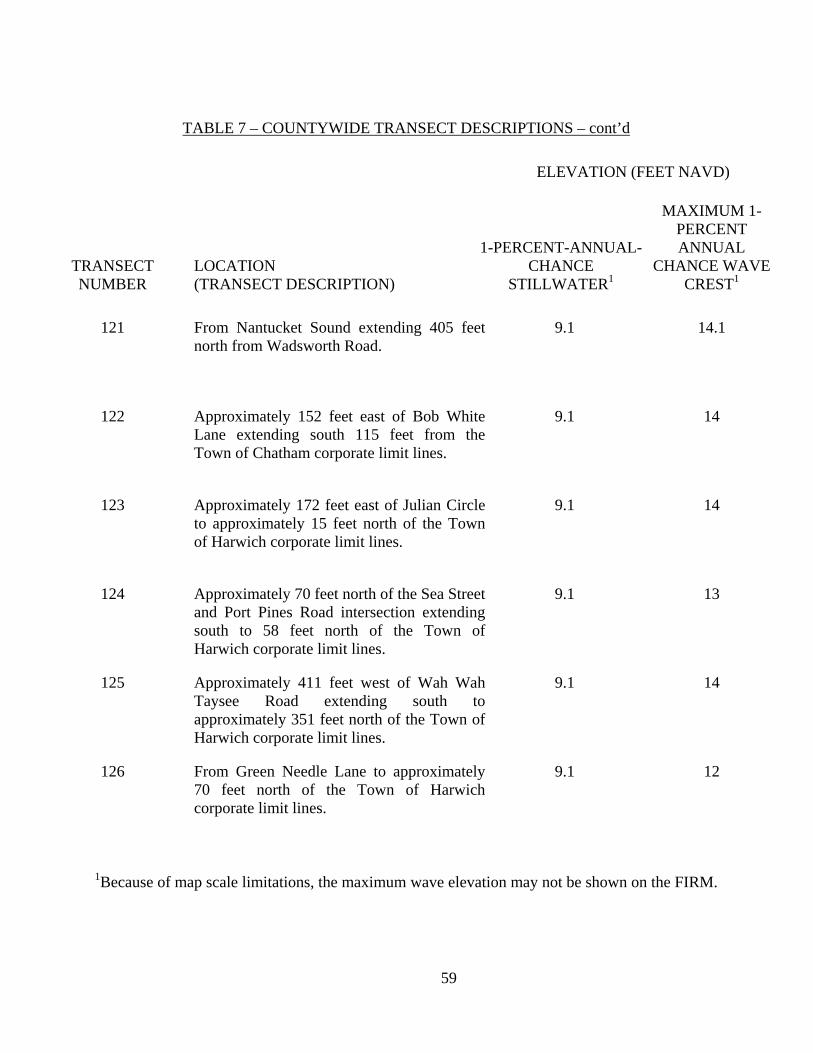
59
TABLE 7 – COUNTYWIDE TRANSECT DESCRIPTIONS – cont’d
ELEVATION (FEET NAVD)
TRANSECT NUMBER
LOCATION (TRANSECT DESCRIPTION)
1-PERCENT-ANNUAL-CHANCE
STILLWATER1
MAXIMUM 1-PERCENT ANNUAL
CHANCE WAVE CREST1
121 From Nantucket Sound extending 405 feet
north from Wadsworth Road. 9.1 14.1
122 Approximately 152 feet east of Bob White Lane extending south 115 feet from the Town of Chatham corporate limit lines.
9.1 14
123 Approximately 172 feet east of Julian Circle to approximately 15 feet north of the Town of Harwich corporate limit lines.
9.1 14
124 Approximately 70 feet north of the Sea Street and Port Pines Road intersection extending south to 58 feet north of the Town of Harwich corporate limit lines.
9.1 13
125 Approximately 411 feet west of Wah Wah Taysee Road extending south to approximately 351 feet north of the Town of Harwich corporate limit lines.
9.1 14
126 From Green Needle Lane to approximately 70 feet north of the Town of Harwich corporate limit lines.
9.1 12
1Because of map scale limitations, the maximum wave elevation may not be shown on the FIRM.
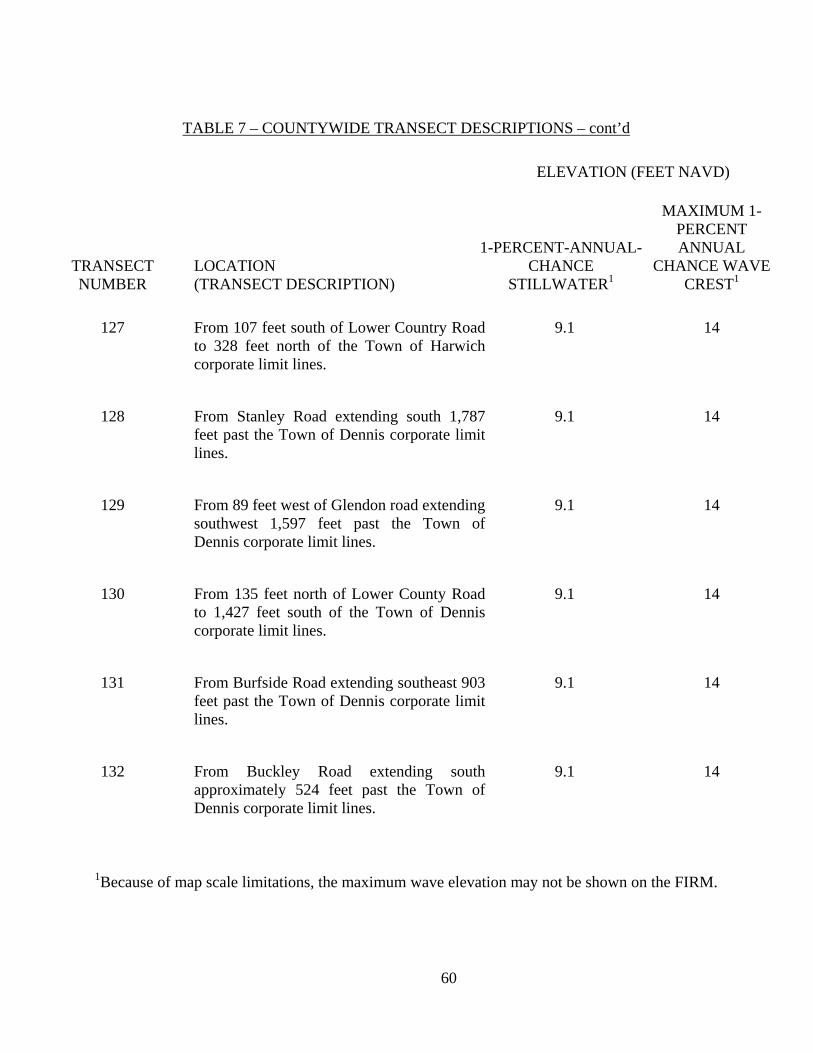
60
TABLE 7 – COUNTYWIDE TRANSECT DESCRIPTIONS – cont’d
ELEVATION (FEET NAVD)
TRANSECT NUMBER
LOCATION (TRANSECT DESCRIPTION)
1-PERCENT-ANNUAL-CHANCE
STILLWATER1
MAXIMUM 1-PERCENT ANNUAL
CHANCE WAVE CREST1
127 From 107 feet south of Lower Country Road
to 328 feet north of the Town of Harwich corporate limit lines.
9.1 14
128 From Stanley Road extending south 1,787 feet past the Town of Dennis corporate limit lines.
9.1 14
129 From 89 feet west of Glendon road extending southwest 1,597 feet past the Town of Dennis corporate limit lines.
9.1 14
130 From 135 feet north of Lower County Road to 1,427 feet south of the Town of Dennis corporate limit lines.
9.1 14
131 From Burfside Road extending southeast 903 feet past the Town of Dennis corporate limit lines.
9.1 14
132 From Buckley Road extending south approximately 524 feet past the Town of Dennis corporate limit lines.
9.1 14
1Because of map scale limitations, the maximum wave elevation may not be shown on the FIRM.
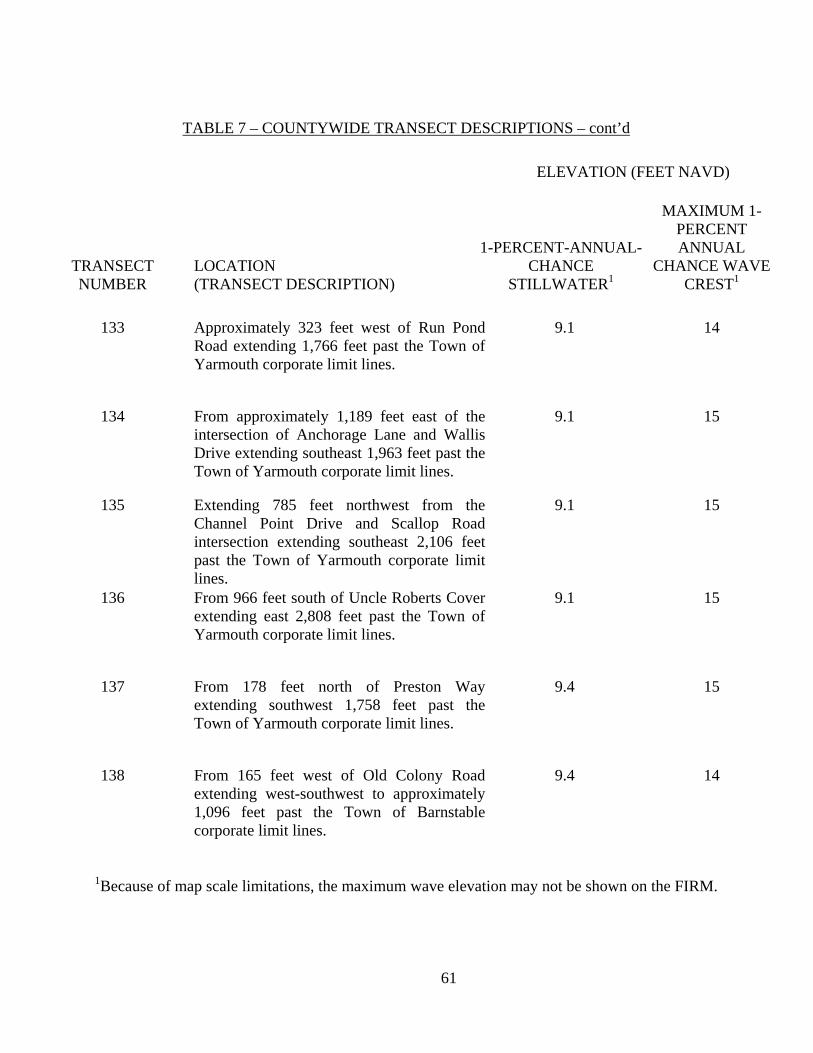
61
TABLE 7 – COUNTYWIDE TRANSECT DESCRIPTIONS – cont’d
ELEVATION (FEET NAVD)
TRANSECT NUMBER
LOCATION (TRANSECT DESCRIPTION)
1-PERCENT-ANNUAL-CHANCE
STILLWATER1
MAXIMUM 1-PERCENT ANNUAL
CHANCE WAVE CREST1
133 Approximately 323 feet west of Run Pond
Road extending 1,766 feet past the Town of Yarmouth corporate limit lines.
9.1 14
134 From approximately 1,189 feet east of the intersection of Anchorage Lane and Wallis Drive extending southeast 1,963 feet past the Town of Yarmouth corporate limit lines.
9.1 15
135 Extending 785 feet northwest from the Channel Point Drive and Scallop Road intersection extending southeast 2,106 feet past the Town of Yarmouth corporate limit lines.
9.1 15
136 From 966 feet south of Uncle Roberts Cover extending east 2,808 feet past the Town of Yarmouth corporate limit lines.
9.1 15
137 From 178 feet north of Preston Way extending southwest 1,758 feet past the Town of Yarmouth corporate limit lines.
9.4 15
138 From 165 feet west of Old Colony Road extending west-southwest to approximately 1,096 feet past the Town of Barnstable corporate limit lines.
9.4 14
1Because of map scale limitations, the maximum wave elevation may not be shown on the FIRM.

62
TABLE 7 – COUNTYWIDE TRANSECT DESCRIPTIONS – cont’d
ELEVATION (FEET NAVD)
TRANSECT NUMBER
LOCATION (TRANSECT DESCRIPTION)
1-PERCENT-ANNUAL-CHANCE
STILLWATER1
MAXIMUM 1-PERCENT ANNUAL
CHANCE WAVE CREST1
139 From Angell Road to approximately 1,027
feet southeast of the Town of Barnstable corporate limit lines.
9.4 14
140 From 272 feet south of Marston Avenue extending southeast to 175 north of the Town of Barnstable corporate limit lines.
9.4 14
141 From 2,743 feet northwest from Squaw Island Road to 580 feet southeast past the Town of Barnstable corporate limit lines.
9.4 21
142 From 225 feet northeast from Raymond street extending southwest to 1,032 feet past the Town of Barnstable corporate limit lines.
9.7 14
143 From 115 feet south of Bay Lane extending southeast to approximately 475 feet south of the Town of Barnstable corporate limit lines.
9.7 14
144 From 184 feet west of Deerfield Road extending southeast to the Town of Barnstable corporate limit lines.
9.7 14
1Because of map scale limitations, the maximum wave elevation may not be shown on the FIRM.
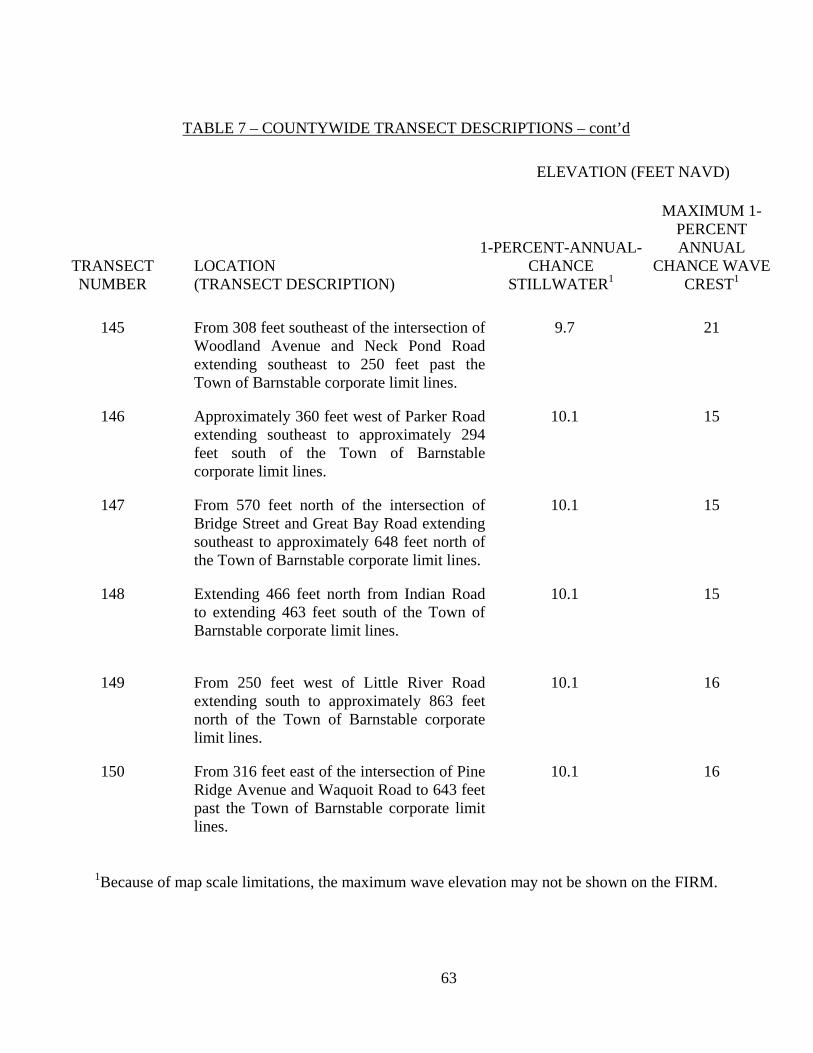
63
TABLE 7 – COUNTYWIDE TRANSECT DESCRIPTIONS – cont’d
ELEVATION (FEET NAVD)
TRANSECT NUMBER
LOCATION (TRANSECT DESCRIPTION)
1-PERCENT-ANNUAL-CHANCE
STILLWATER1
MAXIMUM 1-PERCENT ANNUAL
CHANCE WAVE CREST1
145 From 308 feet southeast of the intersection of
Woodland Avenue and Neck Pond Road extending southeast to 250 feet past the Town of Barnstable corporate limit lines.
9.7 21
146 Approximately 360 feet west of Parker Road extending southeast to approximately 294 feet south of the Town of Barnstable corporate limit lines.
10.1 15
147 From 570 feet north of the intersection of Bridge Street and Great Bay Road extending southeast to approximately 648 feet north of the Town of Barnstable corporate limit lines.
10.1 15
148 Extending 466 feet north from Indian Road to extending 463 feet south of the Town of Barnstable corporate limit lines.
10.1 15
149 From 250 feet west of Little River Road extending south to approximately 863 feet north of the Town of Barnstable corporate limit lines.
10.1 16
150 From 316 feet east of the intersection of Pine Ridge Avenue and Waquoit Road to 643 feet past the Town of Barnstable corporate limit lines.
10.1 16
1Because of map scale limitations, the maximum wave elevation may not be shown on the FIRM.

64
TABLE 7 – COUNTYWIDE TRANSECT DESCRIPTIONS – cont’d
ELEVATION (FEET NAVD)
TRANSECT NUMBER
LOCATION (TRANSECT DESCRIPTION)
1-PERCENT-ANNUAL-CHANCE
STILLWATER1
MAXIMUM 1-PERCENT ANNUAL
CHANCE WAVE CREST1
151 From 1,287 feet west of Peppercorn Lane
extending east-southeast 590 feet past the Town of Barnstable corporate limit lines.
10.1 16
152 From 115 feet east of the Town of Mashpee corporate limit lines extending southeast approximately 1,261 feet from Popponesset Island Road.
10.1 16
153 From 275 feet east-southeast of Popponesset Island Road extending east-southeast 75 feet past the Town of Mashpee corporate limit lines.
10.1 16
154 Approximately 265 fee east-southeast of Seaview Avenue to 376 feet from the Town of Mashpee corporate limit lines.
10.1 20
155 From 398 feet southeast of New Seabury Circle to 116 feet southeast of the Town of Mashpee corporate limit lines.
10.1 22
156 From the Town of Mashpee corporate limit lines extending north to 626 feet south of Amy Brown Road.
10.1 16
1Because of map scale limitations, the maximum wave elevation may not be shown on the FIRM.
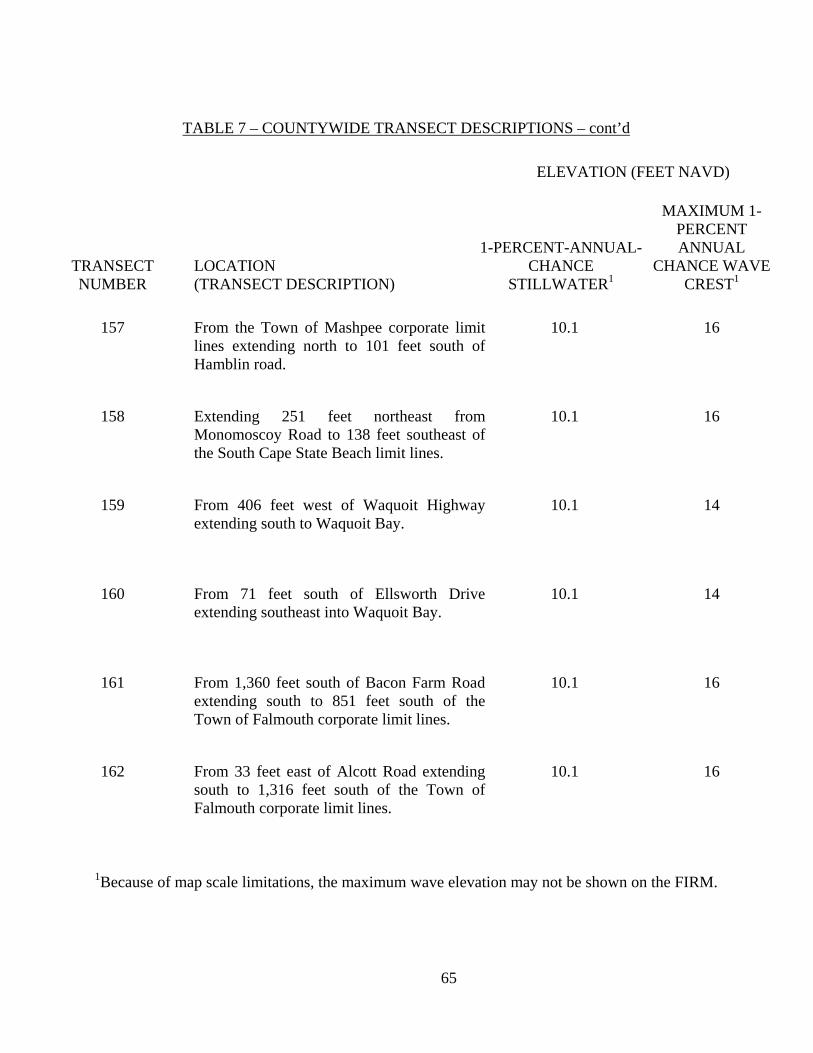
65
TABLE 7 – COUNTYWIDE TRANSECT DESCRIPTIONS – cont’d
ELEVATION (FEET NAVD)
TRANSECT NUMBER
LOCATION (TRANSECT DESCRIPTION)
1-PERCENT-ANNUAL-CHANCE
STILLWATER1
MAXIMUM 1-PERCENT ANNUAL
CHANCE WAVE CREST1
157 From the Town of Mashpee corporate limit
lines extending north to 101 feet south of Hamblin road.
10.1 16
158 Extending 251 feet northeast from Monomoscoy Road to 138 feet southeast of the South Cape State Beach limit lines.
10.1 16
159 From 406 feet west of Waquoit Highway extending south to Waquoit Bay.
10.1 14
160 From 71 feet south of Ellsworth Drive extending southeast into Waquoit Bay.
10.1 14
161 From 1,360 feet south of Bacon Farm Road extending south to 851 feet south of the Town of Falmouth corporate limit lines.
10.1 16
162 From 33 feet east of Alcott Road extending south to 1,316 feet south of the Town of Falmouth corporate limit lines.
10.1 16
1Because of map scale limitations, the maximum wave elevation may not be shown on the FIRM.
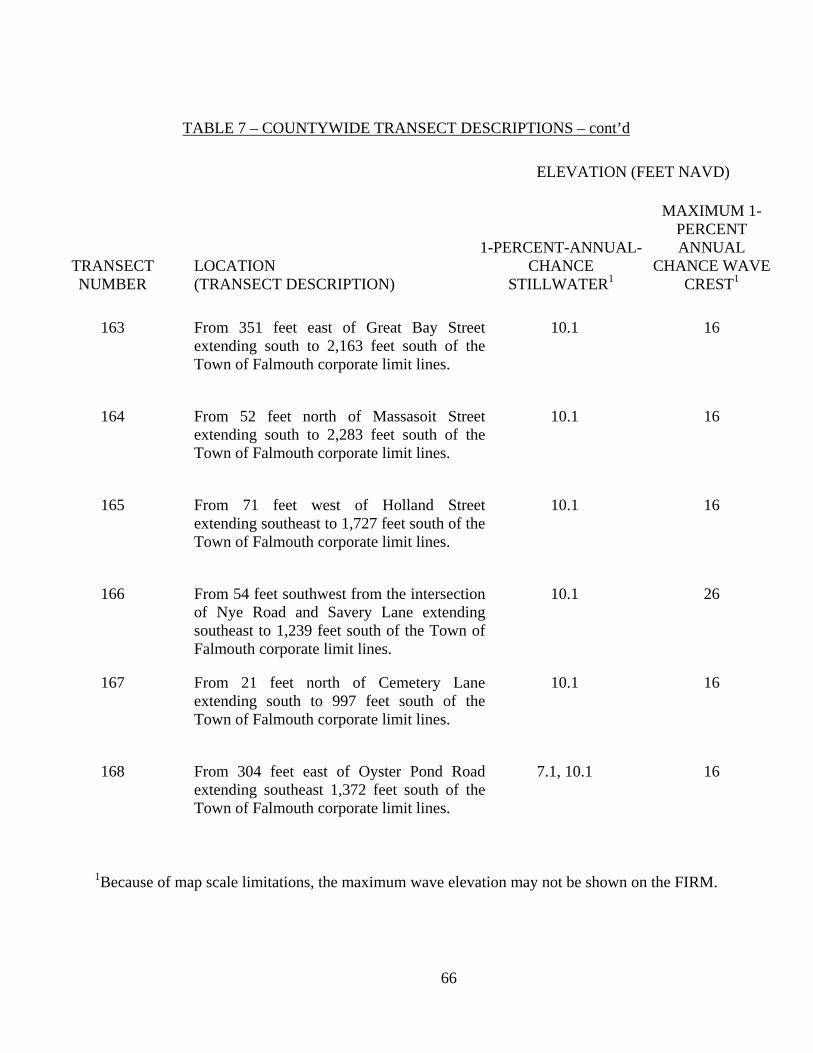
66
TABLE 7 – COUNTYWIDE TRANSECT DESCRIPTIONS – cont’d
ELEVATION (FEET NAVD)
TRANSECT NUMBER
LOCATION (TRANSECT DESCRIPTION)
1-PERCENT-ANNUAL-CHANCE
STILLWATER1
MAXIMUM 1-PERCENT ANNUAL
CHANCE WAVE CREST1
163 From 351 feet east of Great Bay Street
extending south to 2,163 feet south of the Town of Falmouth corporate limit lines.
10.1 16
164 From 52 feet north of Massasoit Street extending south to 2,283 feet south of the Town of Falmouth corporate limit lines.
10.1 16
165 From 71 feet west of Holland Street extending southeast to 1,727 feet south of the Town of Falmouth corporate limit lines.
10.1 16
166 From 54 feet southwest from the intersection of Nye Road and Savery Lane extendingsoutheast to 1,239 feet south of the Town of Falmouth corporate limit lines.
10.1 26
167 From 21 feet north of Cemetery Lane extending south to 997 feet south of the Town of Falmouth corporate limit lines.
10.1 16
168 From 304 feet east of Oyster Pond Road extending southeast 1,372 feet south of the Town of Falmouth corporate limit lines.
7.1, 10.1 16
1Because of map scale limitations, the maximum wave elevation may not be shown on the FIRM.
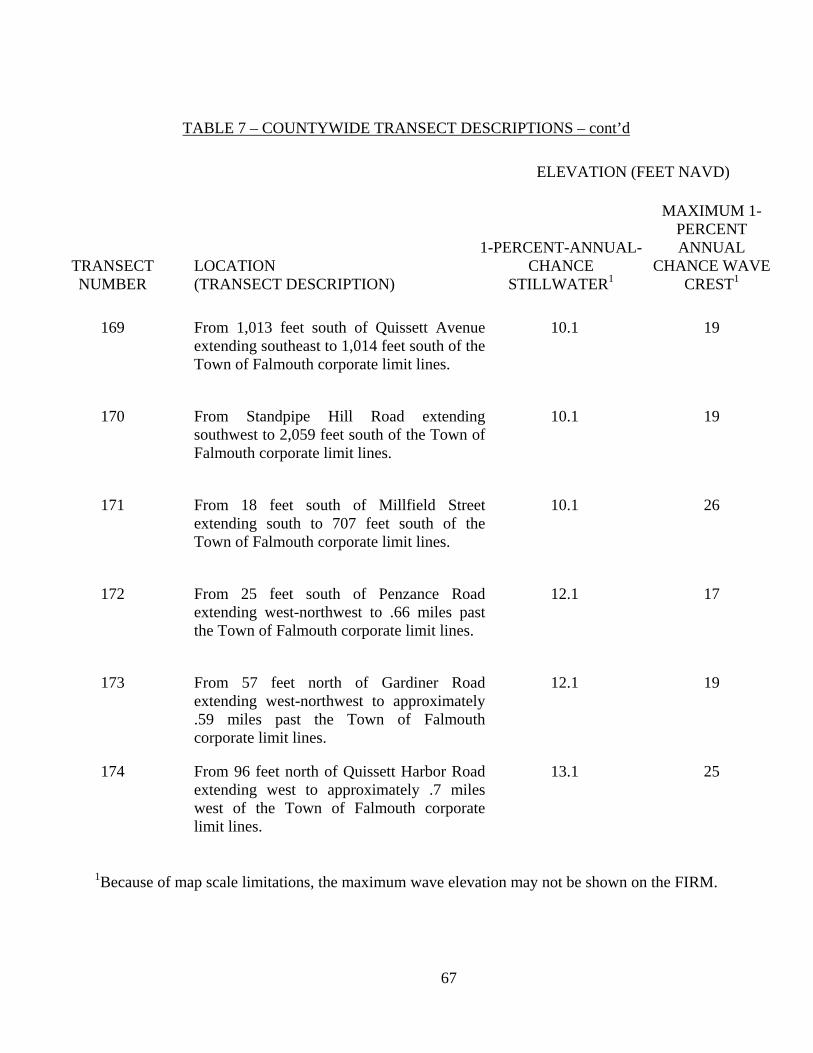
67
TABLE 7 – COUNTYWIDE TRANSECT DESCRIPTIONS – cont’d
ELEVATION (FEET NAVD)
TRANSECT NUMBER
LOCATION (TRANSECT DESCRIPTION)
1-PERCENT-ANNUAL-CHANCE
STILLWATER1
MAXIMUM 1-PERCENT ANNUAL
CHANCE WAVE CREST1
169 From 1,013 feet south of Quissett Avenue
extending southeast to 1,014 feet south of the Town of Falmouth corporate limit lines.
10.1 19
170 From Standpipe Hill Road extending southwest to 2,059 feet south of the Town of Falmouth corporate limit lines.
10.1 19
171 From 18 feet south of Millfield Streetextending south to 707 feet south of the Town of Falmouth corporate limit lines.
10.1 26
172 From 25 feet south of Penzance Road extending west-northwest to .66 miles past the Town of Falmouth corporate limit lines.
12.1 17
173 From 57 feet north of Gardiner Road extending west-northwest to approximately .59 miles past the Town of Falmouth corporate limit lines.
12.1 19
174 From 96 feet north of Quissett Harbor Road extending west to approximately .7 miles west of the Town of Falmouth corporate limit lines.
13.1 25
1Because of map scale limitations, the maximum wave elevation may not be shown on the FIRM.
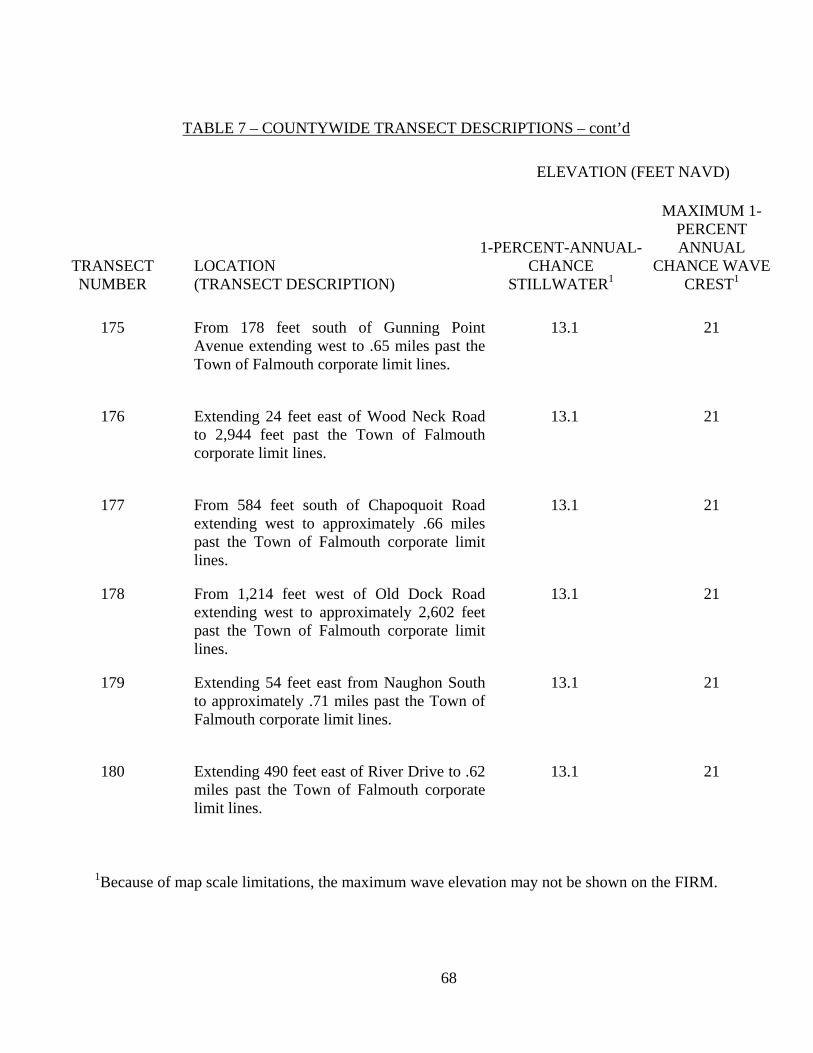
68
TABLE 7 – COUNTYWIDE TRANSECT DESCRIPTIONS – cont’d
ELEVATION (FEET NAVD)
TRANSECT NUMBER
LOCATION (TRANSECT DESCRIPTION)
1-PERCENT-ANNUAL-CHANCE
STILLWATER1
MAXIMUM 1-PERCENT ANNUAL
CHANCE WAVE CREST1
175 From 178 feet south of Gunning Point
Avenue extending west to .65 miles past the Town of Falmouth corporate limit lines.
13.1 21
176 Extending 24 feet east of Wood Neck Road to 2,944 feet past the Town of Falmouth corporate limit lines.
13.1 21
177 From 584 feet south of Chapoquoit Road extending west to approximately .66 miles past the Town of Falmouth corporate limit lines.
13.1 21
178 From 1,214 feet west of Old Dock Road extending west to approximately 2,602 feet past the Town of Falmouth corporate limit lines.
13.1 21
179 Extending 54 feet east from Naughon South to approximately .71 miles past the Town of Falmouth corporate limit lines.
13.1 21
180 Extending 490 feet east of River Drive to .62 miles past the Town of Falmouth corporate limit lines.
13.1 21
1Because of map scale limitations, the maximum wave elevation may not be shown on the FIRM.
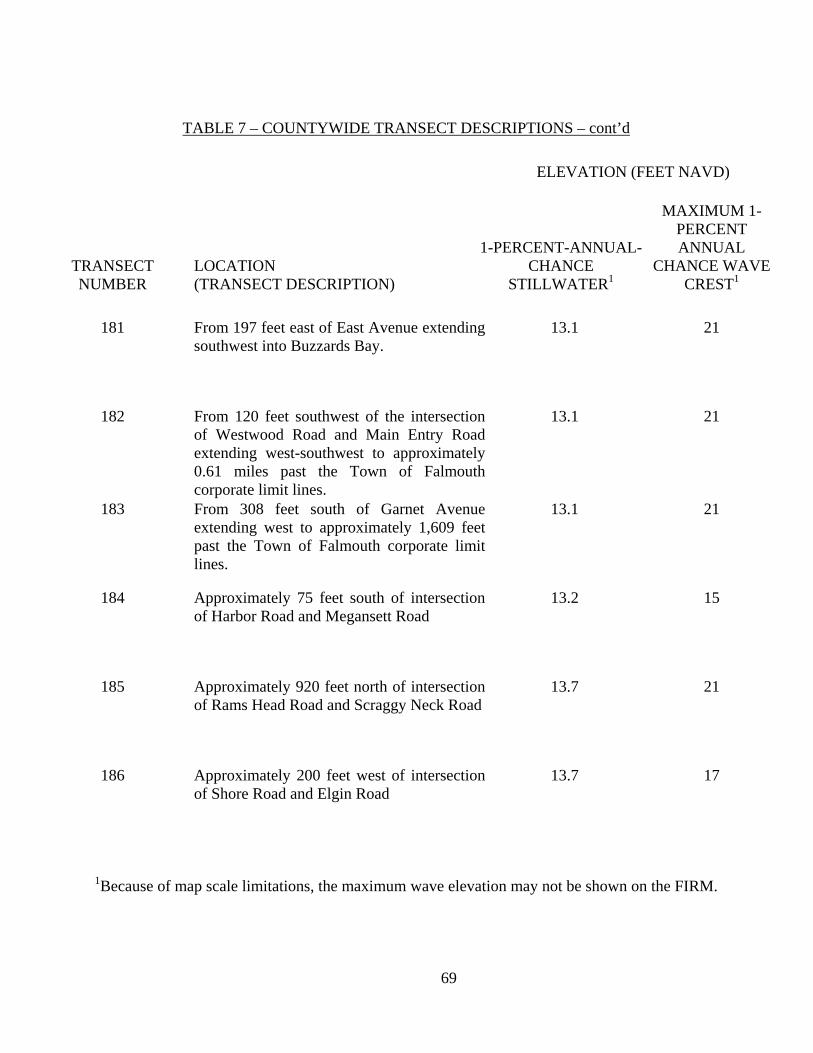
69
TABLE 7 – COUNTYWIDE TRANSECT DESCRIPTIONS – cont’d
ELEVATION (FEET NAVD)
TRANSECT NUMBER
LOCATION (TRANSECT DESCRIPTION)
1-PERCENT-ANNUAL-CHANCE
STILLWATER1
MAXIMUM 1-PERCENT ANNUAL
CHANCE WAVE CREST1
181 From 197 feet east of East Avenue extending
southwest into Buzzards Bay. 13.1 21
182 From 120 feet southwest of the intersection of Westwood Road and Main Entry Road extending west-southwest to approximately 0.61 miles past the Town of Falmouth corporate limit lines.
13.1 21
183 From 308 feet south of Garnet Avenueextending west to approximately 1,609 feet past the Town of Falmouth corporate limit lines.
13.1 21
184 Approximately 75 feet south of intersection of Harbor Road and Megansett Road
13.2 15
185 Approximately 920 feet north of intersection of Rams Head Road and Scraggy Neck Road
13.7 21
186 Approximately 200 feet west of intersection of Shore Road and Elgin Road
13.7 17
1Because of map scale limitations, the maximum wave elevation may not be shown on the FIRM.
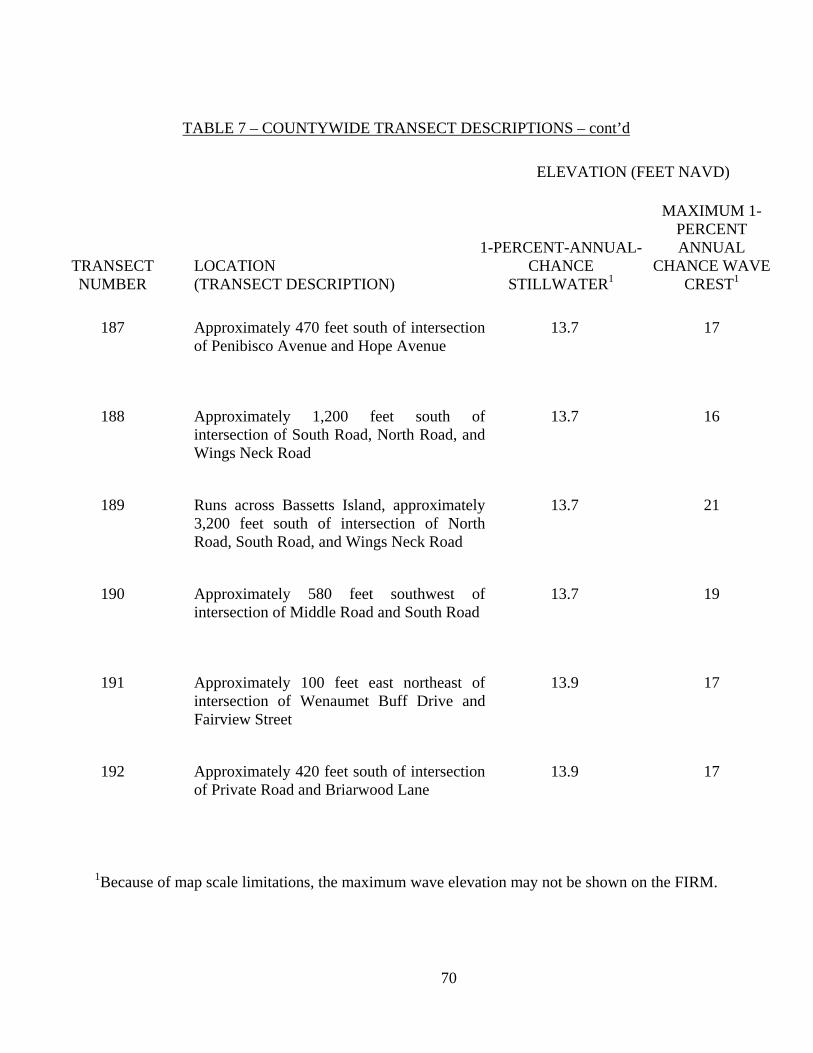
70
TABLE 7 – COUNTYWIDE TRANSECT DESCRIPTIONS – cont’d
ELEVATION (FEET NAVD)
TRANSECT NUMBER
LOCATION (TRANSECT DESCRIPTION)
1-PERCENT-ANNUAL-CHANCE
STILLWATER1
MAXIMUM 1-PERCENT ANNUAL
CHANCE WAVE CREST1
187 Approximately 470 feet south of intersection
of Penibisco Avenue and Hope Avenue 13.7 17
188 Approximately 1,200 feet south of intersection of South Road, North Road, and Wings Neck Road
13.7 16
189 Runs across Bassetts Island, approximately 3,200 feet south of intersection of North Road, South Road, and Wings Neck Road
13.7 21
190 Approximately 580 feet southwest of intersection of Middle Road and South Road
13.7 19
191 Approximately 100 feet east northeast of intersection of Wenaumet Buff Drive and Fairview Street
13.9 17
192 Approximately 420 feet south of intersection of Private Road and Briarwood Lane
13.9 17
1Because of map scale limitations, the maximum wave elevation may not be shown on the FIRM.

71
TABLE 7 – COUNTYWIDE TRANSECT DESCRIPTIONS – cont’d
ELEVATION (FEET NAVD)
TRANSECT NUMBER
LOCATION (TRANSECT DESCRIPTION)
1-PERCENT-ANNUAL-CHANCE
STILLWATER1
MAXIMUM 1-PERCENT ANNUAL
CHANCE WAVE CREST1
193 Approximately 600 feet west of intersection
of Evergreen Road and Railroad Avenue 13.9 17
194 Approximately at the intersection of Rope Walk Road and Captains Row
13.9 22
1Because of map scale limitations, the maximum wave elevation may not be shown on the FIRM.
For the revised open water flooding sources in Provincetown, the coastal transects were field surveyed. The survey data was supplemented with community supplied contour information. As appropriate, coastal protection structure details and 0.0 foot NAVD elevation were included and noted in the transect field surveys. Bathymetric data from NOAA Nautical Charts were used to extend the transects offshore for wave runup calculations. Coastal processes that may affect the transect profile, such as dune erosion and seawall scour and failure, were estimated in accordance with Appendix D “Guidance for Coastal Flooding Analyses and Mapping,” (Reference 45) of the Guidelines and Specifications, as well as, the “Atlantic Ocean and Gulf of Mexico Coastal Guidelines Update”, (Reference 46). Along each transect in the revised areas, wave envelopes were computed considering the combined effects of changes in ground elevation, vegetation, and physical features. Between transects, elevations were interpolated using topographic maps, land-use and land-cover data, and engineering judgment to determine the aerial extent of flooding. The results of the calculations are
72
accurate until local topography, vegetation, or land development within the community undergo major changes.
Wave height and runup calculations used in the revised coastal analysis follow the methodologies described in the FEMA guidance for V Zone mapping (Reference 45). WHAFIS 3.0 was used to predict wave heights. The FEMA Guidelines (Reference 46) allow for the following methods to be used to determine wave runup: RUNUP 2.0; “Technical Advisory Committee for Water Retaining Structures” (TAW); Automated Coastal Engineering System (ACES); and the Shore Protection Manual (Reference 49). Each of the aforementioned methods has an appropriate set of nearshore conditions for which it should be applied. For example, the methods described in the Shore Protection Manual are to be used to determine runup on vertical structures. These methods were applied for each of the restudied coastal transects, as appropriate.
These methodologies were used to compute wave envelope elevations associated with the 1-percent-annual-chance storm surge for the Cape Cod Bay shoreline in Provincetown. Accurate topographic, land-use, and land cover data are required for the coastal analyses. Community supplied data which meets the accuracy standards for flood hazard mapping were used for the topographic data (Reference 50). Depths below mean low water were determined from National Ocean Survey Coastal Charts (Reference 51). The land-use and land cover data were obtained by field surveys and aerial photographs (Reference 52). Areas of shallow flooding, designated AO zones, are shown along portions of the shoreline. These areas are the result of wave runup overtopping and ponding behind seawalls and berms with average depths of 1 to 3 feet. Two (2) primary topographic data sources were used in communities with redelineation of coastal flood hazard data: community supplied contour information; and 3 meter contour data supplied by the Massachusetts Office of Geographic and Environmental Information (MassGIS). The results of the previous effective coastal analyses were then applied to this topographic data to determine the coastal flood hazards. In accordance with the FEMA Guidelines (Reference 46) the effect of the Primary Frontal Dune (PFD) on coastal flood hazard mapping was evaluated for all communities. In areas that had appropriate topographic data, the extent of the PFD was calculated in accordance with the Massachusetts Office of Coastal Zone Management methodology (Reference 53), then field verified. For other areas, the extent of the PFD was determined from field survey. Figure 1, "Transect Schematic," represents a sample transect, which illustrates the relationship between the stillwater elevation, the wave crest elevation, the ground elevation profile, and the location of the A/V zone boundary.
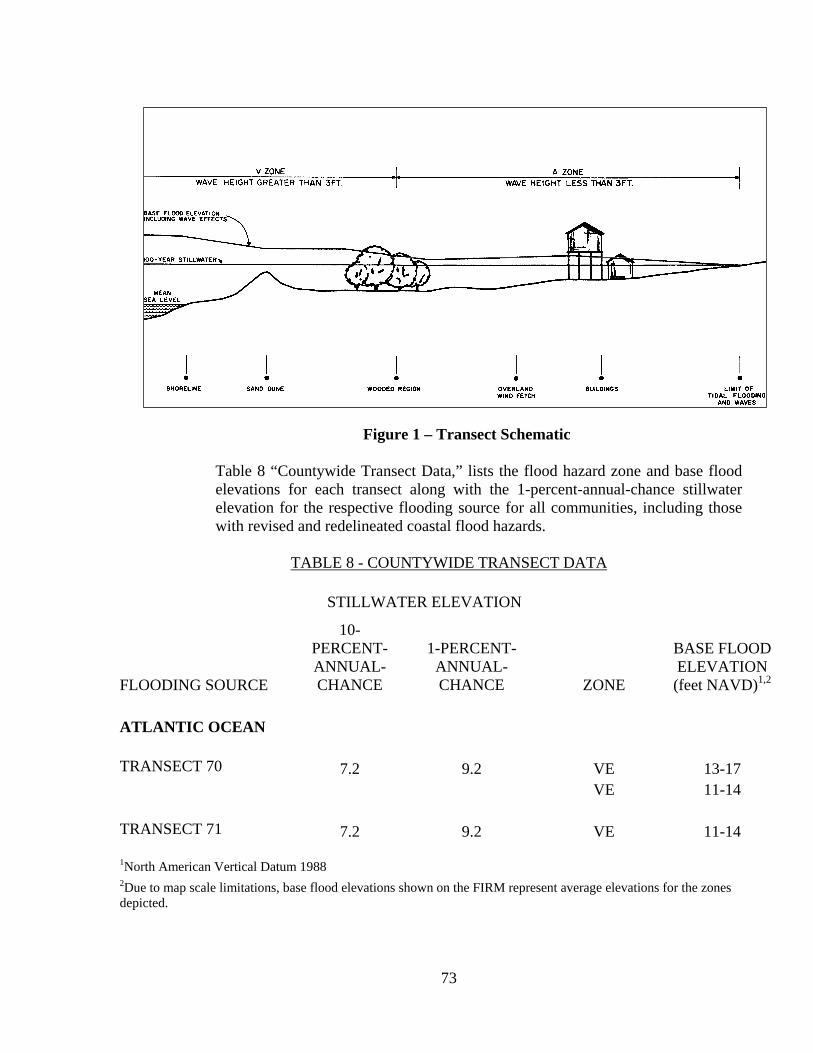
73
Figure 1 – Transect Schematic
Table 8 “Countywide Transect Data,” lists the flood hazard zone and base flood elevations for each transect along with the 1-percent-annual-chance stillwater elevation for the respective flooding source for all communities, including those with revised and redelineated coastal flood hazards.
TABLE 8 - COUNTYWIDE TRANSECT DATA
STILLWATER ELEVATION
FLOODING SOURCE
10-PERCENT-ANNUAL-CHANCE
1-PERCENT-ANNUAL-CHANCE ZONE
BASE FLOOD ELEVATION (feet NAVD)1,2
ATLANTIC OCEAN TRANSECT 70 7.2 9.2 VE 13-17 VE 11-14 TRANSECT 71 7.2 9.2 VE 11-14 1North American Vertical Datum 1988 2Due to map scale limitations, base flood elevations shown on the FIRM represent average elevations for the zones depicted.
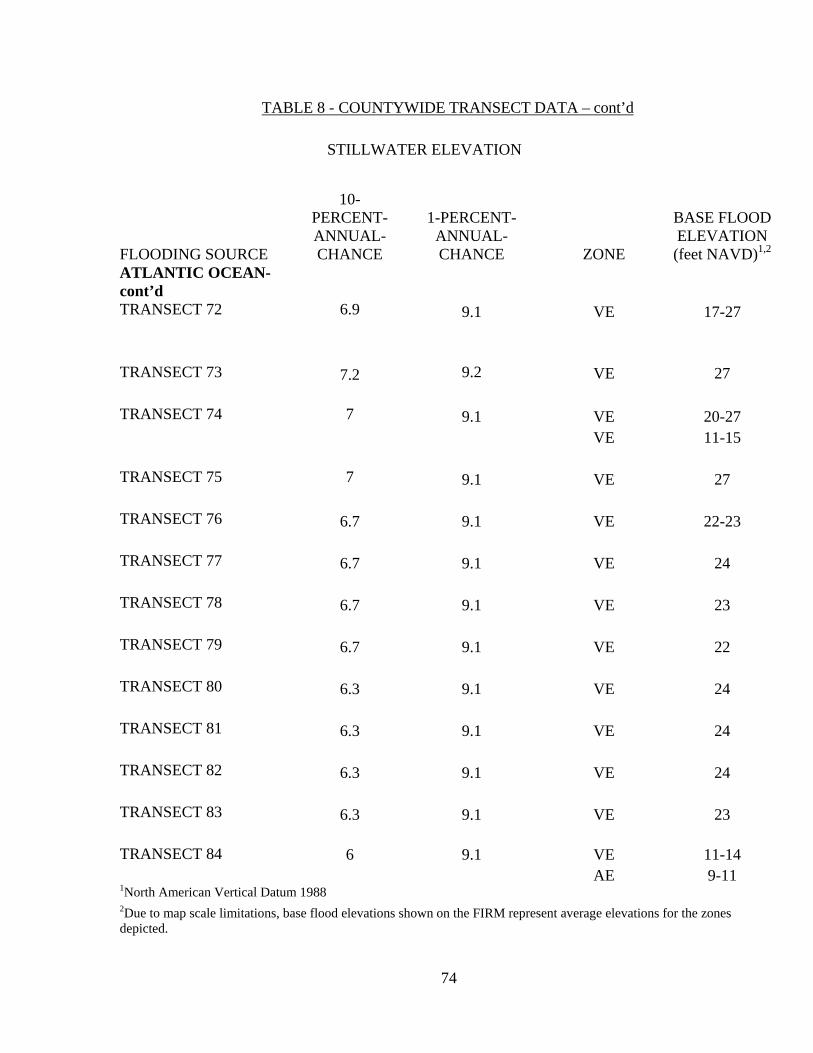
74
TABLE 8 - COUNTYWIDE TRANSECT DATA – cont’d
STILLWATER ELEVATION
FLOODING SOURCE
10-PERCENT-ANNUAL-CHANCE
1-PERCENT-ANNUAL-CHANCE ZONE
BASE FLOOD ELEVATION (feet NAVD)1,2
ATLANTIC OCEAN-cont’d TRANSECT 72 6.9 9.1 VE 17-27 TRANSECT 73 7.2 9.2 VE 27 TRANSECT 74 7 9.1 VE 20-27 VE 11-15 TRANSECT 75 7 9.1 VE 27 TRANSECT 76 6.7 9.1 VE 22-23 TRANSECT 77 6.7 9.1 VE 24 TRANSECT 78 6.7 9.1 VE 23 TRANSECT 79 6.7 9.1 VE 22 TRANSECT 80 6.3 9.1 VE 24 TRANSECT 81 6.3 9.1 VE 24 TRANSECT 82 6.3 9.1 VE 24 TRANSECT 83 6.3 9.1 VE 23 TRANSECT 84 6 9.1 VE 11-14 AE 9-11 1North American Vertical Datum 1988 2Due to map scale limitations, base flood elevations shown on the FIRM represent average elevations for the zones depicted.
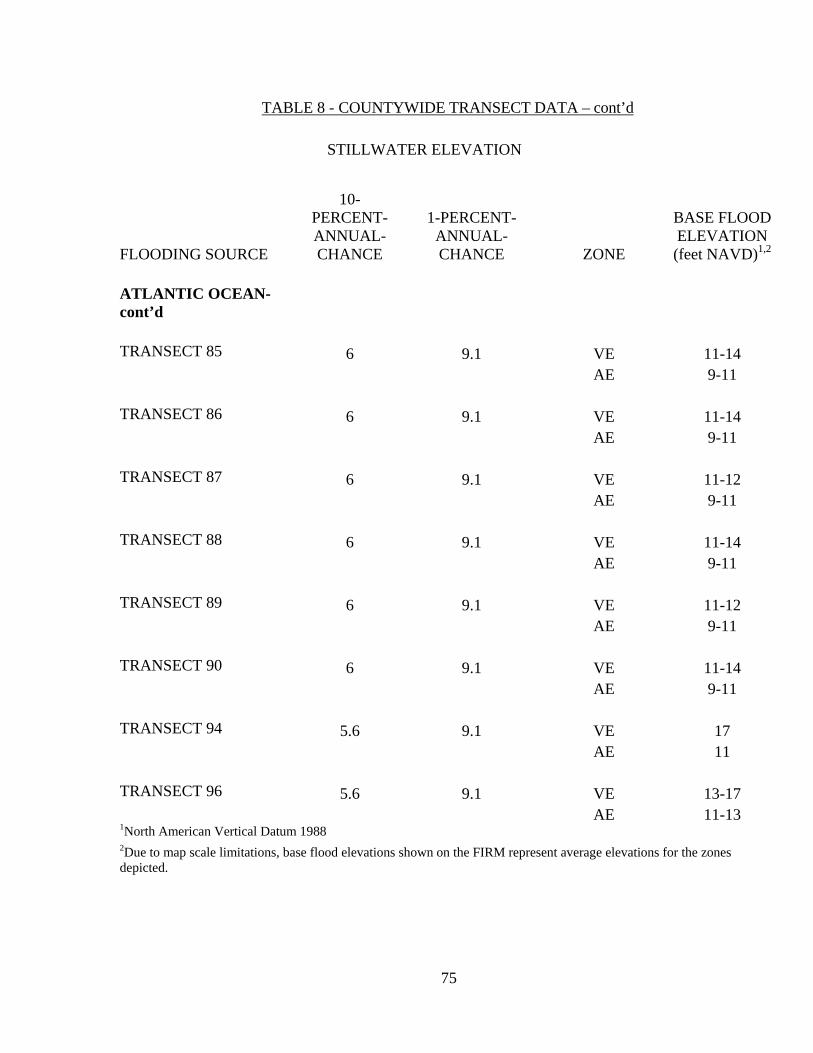
75
TABLE 8 - COUNTYWIDE TRANSECT DATA – cont’d
STILLWATER ELEVATION
FLOODING SOURCE
10-PERCENT-ANNUAL-CHANCE
1-PERCENT-ANNUAL-CHANCE ZONE
BASE FLOOD ELEVATION (feet NAVD)1,2
ATLANTIC OCEAN-cont’d TRANSECT 85 6 9.1 VE 11-14 AE 9-11 TRANSECT 86 6 9.1 VE 11-14 AE 9-11 TRANSECT 87 6 9.1 VE 11-12 AE 9-11 TRANSECT 88 6 9.1 VE 11-14 AE 9-11 TRANSECT 89 6 9.1 VE 11-12 AE 9-11 TRANSECT 90 6 9.1 VE 11-14 AE 9-11 TRANSECT 94 5.6 9.1 VE 17 AE 11 TRANSECT 96 5.6 9.1 VE 13-17 AE 11-13 1North American Vertical Datum 1988 2Due to map scale limitations, base flood elevations shown on the FIRM represent average elevations for the zones depicted.
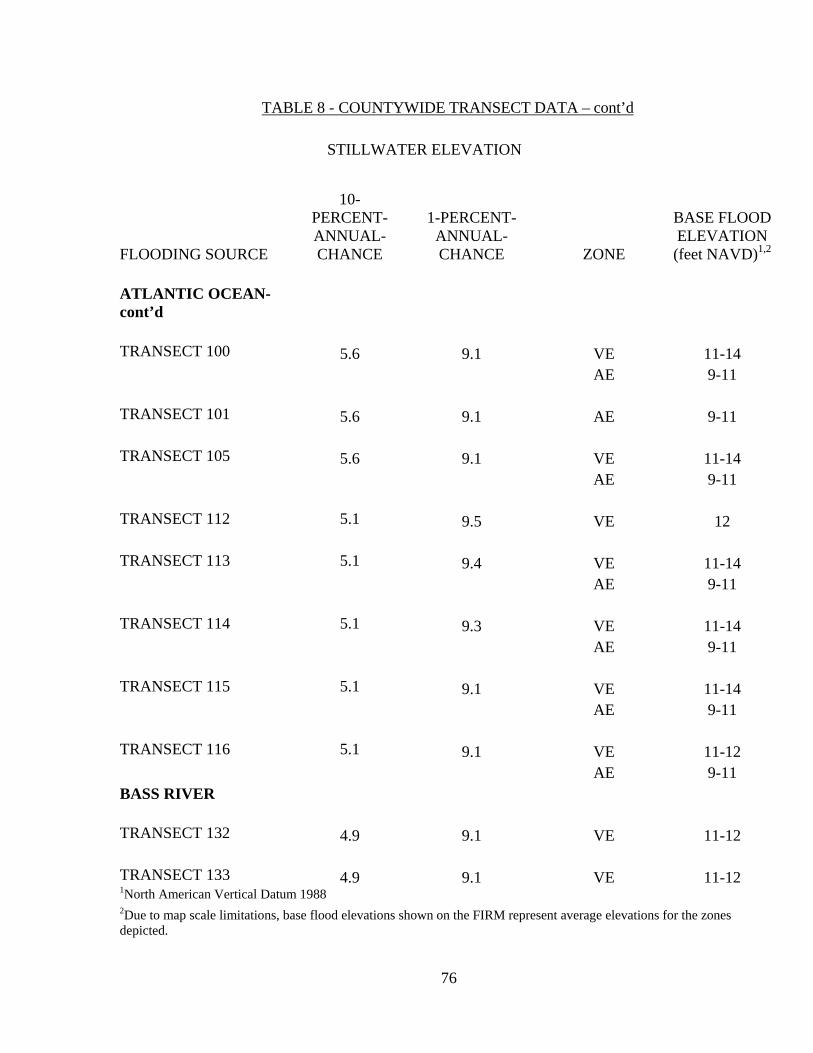
76
TABLE 8 - COUNTYWIDE TRANSECT DATA – cont’d
STILLWATER ELEVATION
FLOODING SOURCE
10-PERCENT-ANNUAL-CHANCE
1-PERCENT-ANNUAL-CHANCE ZONE
BASE FLOOD ELEVATION (feet NAVD)1,2
ATLANTIC OCEAN-cont’d TRANSECT 100 5.6 9.1 VE 11-14 AE 9-11 TRANSECT 101 5.6 9.1 AE 9-11 TRANSECT 105 5.6 9.1 VE 11-14 AE 9-11 TRANSECT 112 5.1 9.5 VE 12 TRANSECT 113 5.1 9.4 VE 11-14 AE 9-11 TRANSECT 114 5.1 9.3 VE 11-14 AE 9-11 TRANSECT 115 5.1 9.1 VE 11-14 AE 9-11 TRANSECT 116 5.1 9.1 VE 11-12 AE 9-11 BASS RIVER TRANSECT 132 4.9 9.1 VE 11-12 TRANSECT 133 4.9 9.1 VE 11-12 1North American Vertical Datum 1988 2Due to map scale limitations, base flood elevations shown on the FIRM represent average elevations for the zones depicted.

77
TABLE 8 - COUNTYWIDE TRANSECT DATA – cont’d
STILLWATER ELEVATION
FLOODING SOURCE
10-PERCENT-ANNUAL-CHANCE
1-PERCENT-ANNUAL-CHANCE ZONE
BASE FLOOD ELEVATION (feet NAVD)1,2
BOAT MEADOW RIVER TRANSECT 38 9.0 10.3 VE 13-16 9.1 10.4 AE 10 BUZZARDS BAY TRANSECT 172 7.0 12.1 VE 17 TRANSECT 173 7.0 12.1 VE 14-19 AE 12-15 TRANSECT 174 8.3 13.1 VE 15-21 AE 12-15 TRANSECT 175 8.3 13.1 VE 15-21 AE 12-15 TRANSECT 176 8.3 13.1 VE 15-21 AE 13-15 TRANSECT 177 8.3 13.1 VE 15-21 AE 12-15 TRANSECT 178 8.3 13.1 VE 15-21 AE 12-15 TRANSECT 179 8.3 13.1 VE 15-21 AE 13-15 1North American Vertical Datum 1988 2Due to map scale limitations, base flood elevations shown on the FIRM represent average elevations for the zones depicted.
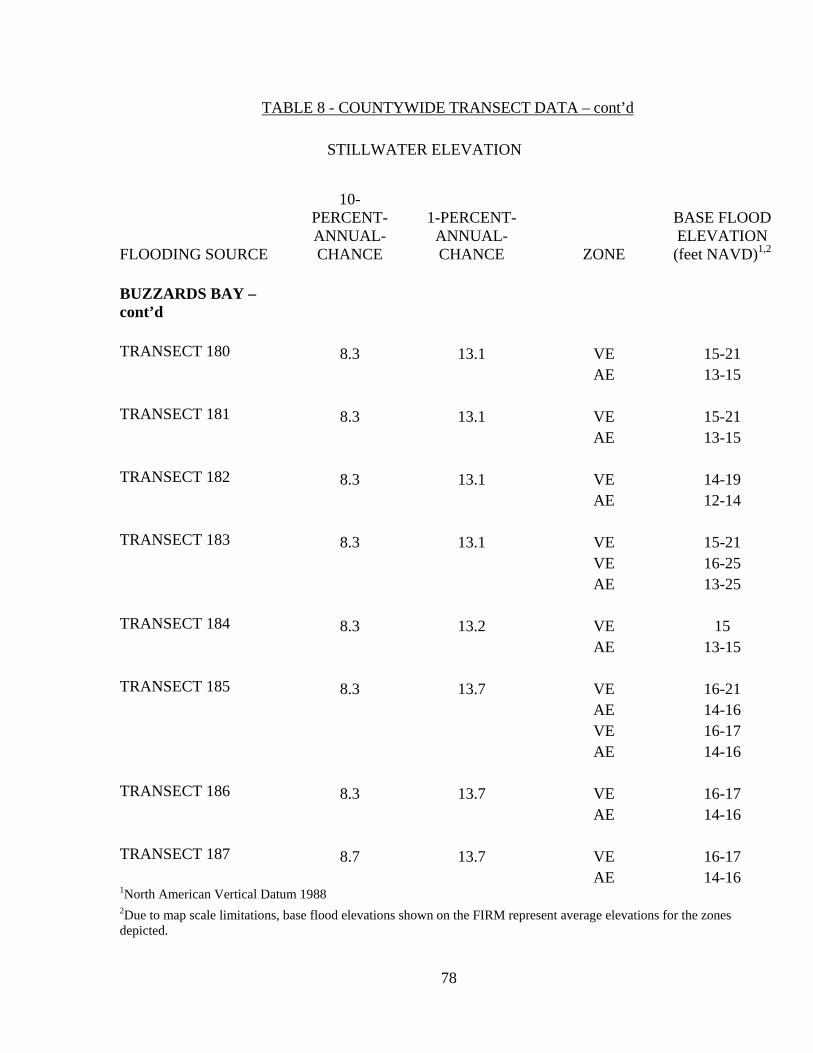
78
TABLE 8 - COUNTYWIDE TRANSECT DATA – cont’d
STILLWATER ELEVATION
FLOODING SOURCE
10-PERCENT-ANNUAL-CHANCE
1-PERCENT-ANNUAL-CHANCE ZONE
BASE FLOOD ELEVATION (feet NAVD)1,2
BUZZARDS BAY – cont’d TRANSECT 180 8.3 13.1 VE 15-21 AE 13-15 TRANSECT 181 8.3 13.1 VE 15-21 AE 13-15 TRANSECT 182 8.3 13.1 VE 14-19 AE 12-14 TRANSECT 183 8.3 13.1 VE 15-21 VE 16-25 AE 13-25 TRANSECT 184 8.3 13.2 VE 15 AE 13-15 TRANSECT 185 8.3 13.7 VE 16-21 AE 14-16 VE 16-17 AE 14-16 TRANSECT 186 8.3 13.7 VE 16-17 AE 14-16 TRANSECT 187 8.7 13.7 VE 16-17 AE 14-16 1North American Vertical Datum 1988 2Due to map scale limitations, base flood elevations shown on the FIRM represent average elevations for the zones depicted.
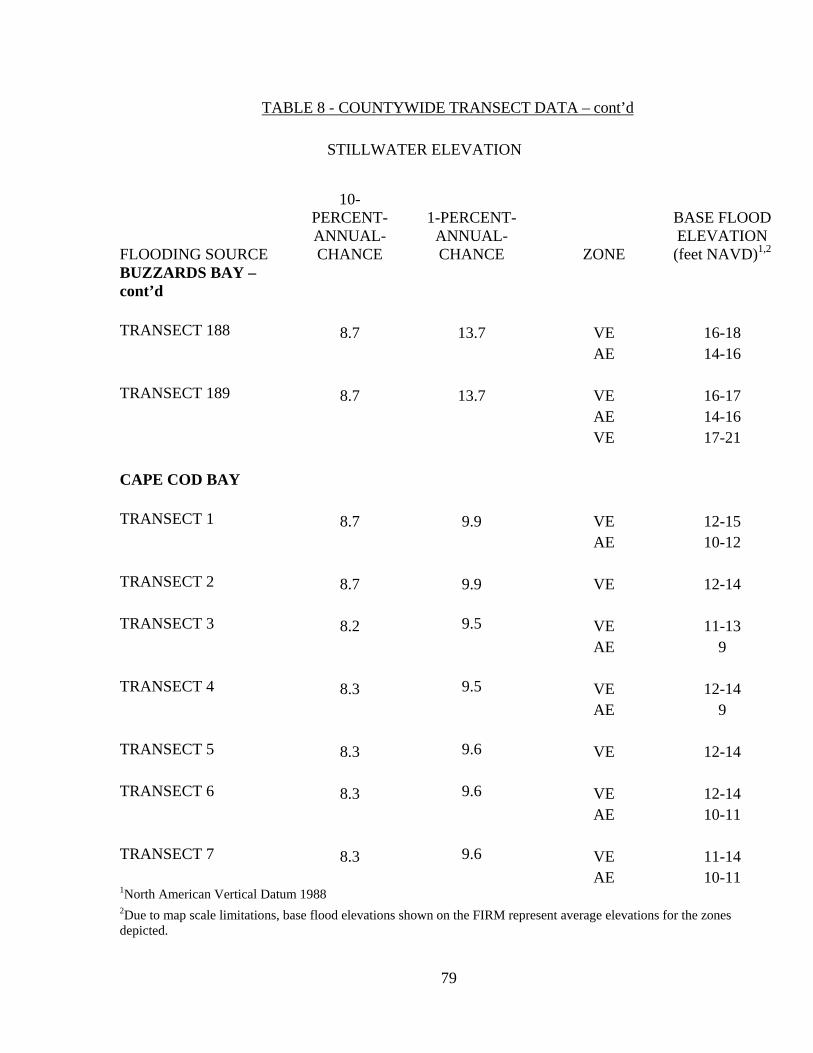
79
TABLE 8 - COUNTYWIDE TRANSECT DATA – cont’d
STILLWATER ELEVATION
FLOODING SOURCE
10-PERCENT-ANNUAL-CHANCE
1-PERCENT-ANNUAL-CHANCE ZONE
BASE FLOOD ELEVATION (feet NAVD)1,2
BUZZARDS BAY – cont’d TRANSECT 188 8.7 13.7 VE 16-18 AE 14-16 TRANSECT 189 8.7 13.7 VE 16-17 AE 14-16 VE 17-21 CAPE COD BAY TRANSECT 1 8.7 9.9 VE 12-15 AE 10-12 TRANSECT 2 8.7 9.9 VE 12-14 TRANSECT 3 8.2 9.5 VE 11-13 AE 9 TRANSECT 4 8.3 9.5 VE 12-14 AE 9 TRANSECT 5 8.3 9.6 VE 12-14 TRANSECT 6 8.3 9.6 VE 12-14 AE 10-11 TRANSECT 7 8.3 9.6 VE 11-14 AE 10-11 1North American Vertical Datum 1988 2Due to map scale limitations, base flood elevations shown on the FIRM represent average elevations for the zones depicted.
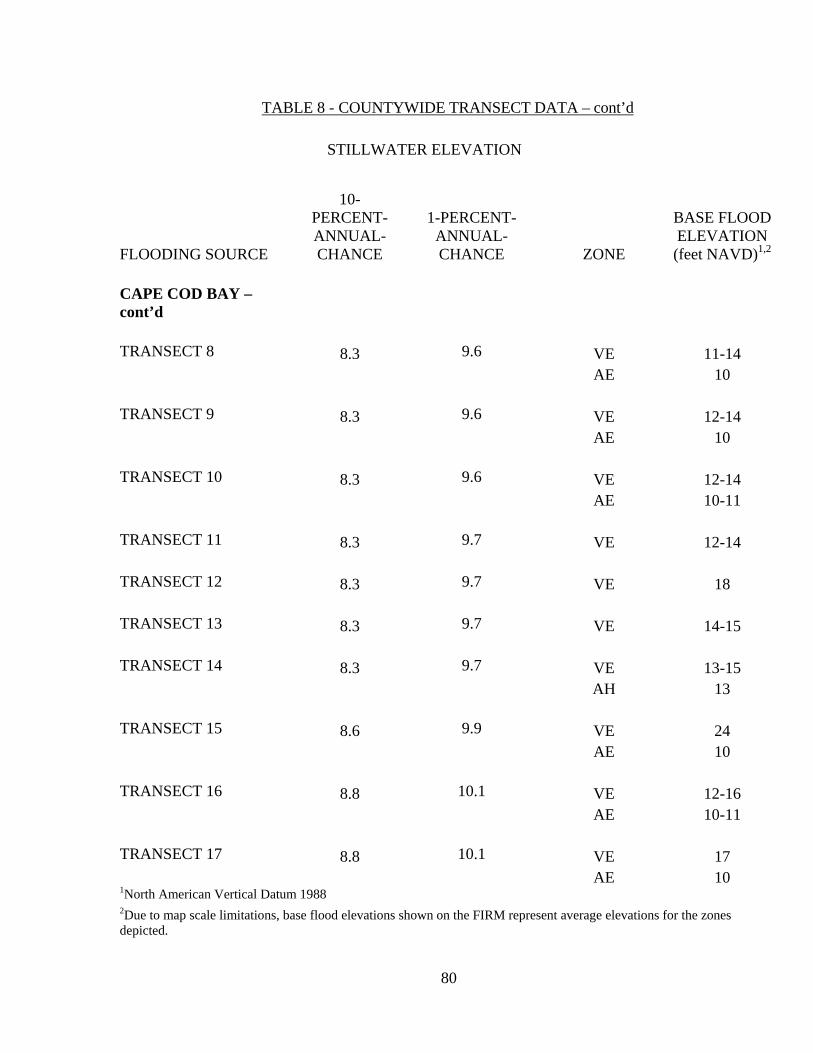
80
TABLE 8 - COUNTYWIDE TRANSECT DATA – cont’d
STILLWATER ELEVATION
FLOODING SOURCE
10-PERCENT-ANNUAL-CHANCE
1-PERCENT-ANNUAL-CHANCE ZONE
BASE FLOOD ELEVATION (feet NAVD)1,2
CAPE COD BAY – cont’d
TRANSECT 8 8.3 9.6 VE 11-14 AE 10 TRANSECT 9 8.3 9.6 VE 12-14 AE 10 TRANSECT 10 8.3 9.6 VE 12-14 AE 10-11 TRANSECT 11 8.3 9.7 VE 12-14 TRANSECT 12 8.3 9.7 VE 18 TRANSECT 13 8.3 9.7 VE 14-15 TRANSECT 14 8.3 9.7 VE 13-15 AH 13 TRANSECT 15 8.6 9.9 VE 24 AE 10 TRANSECT 16 8.8 10.1 VE 12-16 AE 10-11 TRANSECT 17 8.8 10.1 VE 17 AE 10 1North American Vertical Datum 1988 2Due to map scale limitations, base flood elevations shown on the FIRM represent average elevations for the zones depicted.
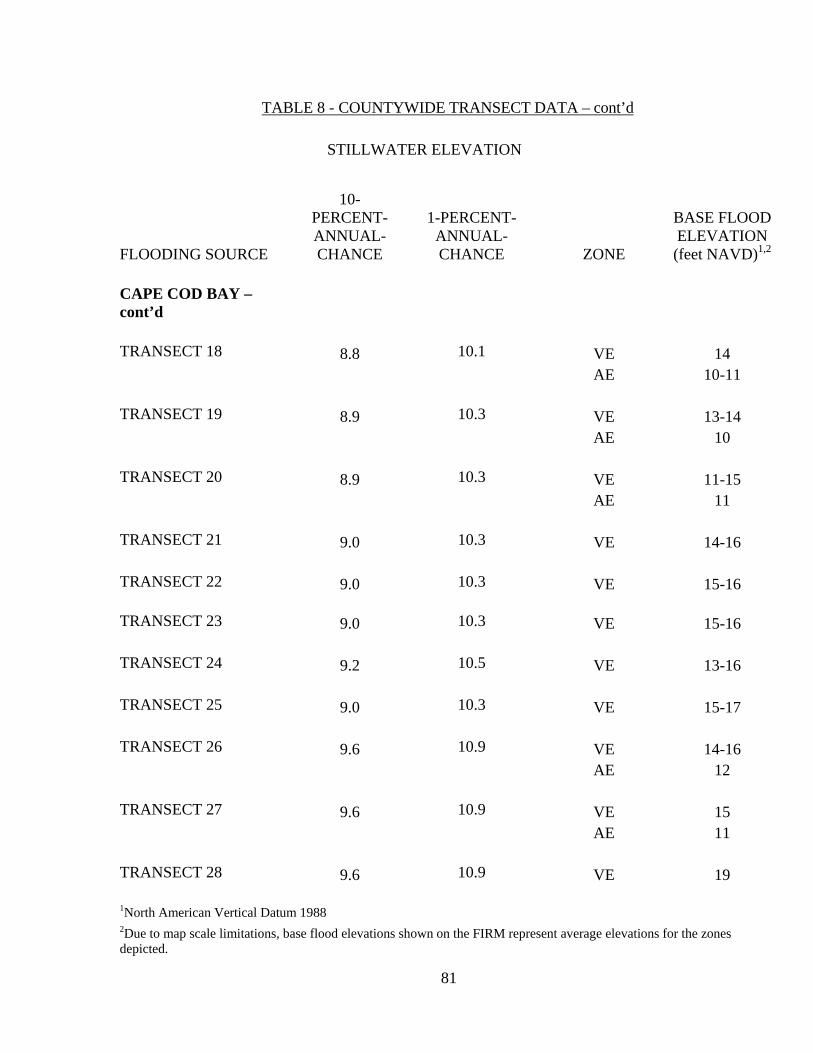
81
TABLE 8 - COUNTYWIDE TRANSECT DATA – cont’d
STILLWATER ELEVATION
FLOODING SOURCE
10-PERCENT-ANNUAL-CHANCE
1-PERCENT-ANNUAL-CHANCE ZONE
BASE FLOOD ELEVATION (feet NAVD)1,2
CAPE COD BAY – cont’d
TRANSECT 18 8.8 10.1 VE 14 AE 10-11 TRANSECT 19 8.9 10.3 VE 13-14 AE 10 TRANSECT 20 8.9 10.3 VE 11-15 AE 11 TRANSECT 21 9.0 10.3 VE 14-16 TRANSECT 22 9.0 10.3 VE 15-16 TRANSECT 23 9.0 10.3 VE 15-16 TRANSECT 24 9.2 10.5 VE 13-16 TRANSECT 25 9.0 10.3 VE 15-17 TRANSECT 26 9.6 10.9 VE 14-16 AE 12 TRANSECT 27 9.6 10.9 VE 15 AE 11 TRANSECT 28 9.6 10.9 VE 19
1North American Vertical Datum 1988 2Due to map scale limitations, base flood elevations shown on the FIRM represent average elevations for the zones depicted.
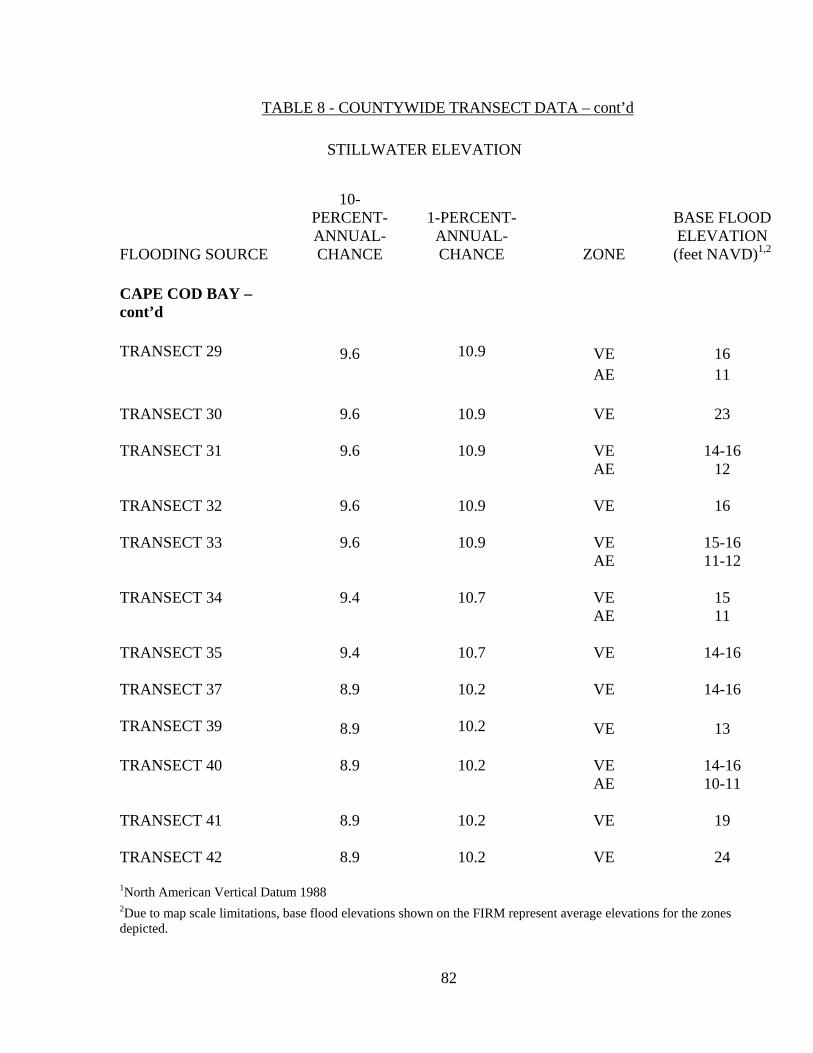
82
TABLE 8 - COUNTYWIDE TRANSECT DATA – cont’d
STILLWATER ELEVATION
FLOODING SOURCE
10-PERCENT-ANNUAL-CHANCE
1-PERCENT-ANNUAL-CHANCE ZONE
BASE FLOOD ELEVATION (feet NAVD)1,2
CAPE COD BAY – cont’d
TRANSECT 29 9.6 10.9 VE 16 AE 11 TRANSECT 30 9.6 10.9 VE 23 TRANSECT 31 9.6 10.9 VE 14-16 AE 12 TRANSECT 32 9.6 10.9 VE 16 TRANSECT 33 9.6 10.9 VE 15-16 AE 11-12 TRANSECT 34 9.4 10.7 VE 15 AE 11 TRANSECT 35 9.4 10.7 VE 14-16 TRANSECT 37 8.9 10.2 VE 14-16 TRANSECT 39 8.9 10.2 VE 13 TRANSECT 40 8.9 10.2 VE 14-16 AE 10-11 TRANSECT 41 8.9 10.2 VE 19 TRANSECT 42 8.9 10.2 VE 24 1North American Vertical Datum 1988 2Due to map scale limitations, base flood elevations shown on the FIRM represent average elevations for the zones depicted.

83
TABLE 8 - COUNTYWIDE TRANSECT DATA – cont’d
STILLWATER ELEVATION
FLOODING SOURCE
10-PERCENT-ANNUAL-CHANCE
1-PERCENT-ANNUAL-CHANCE ZONE
BASE FLOOD ELEVATION (feet NAVD)1,2
CAPE COD BAY – cont’d
TRANSECT 43 8.9 10.2 VE 13-19 AE 12 TRANSECT 44 8.9 10.2 VE 19 TRANSECT 45 8.9 10.2 VE 14-16 AE 11 TRANSECT 46 8.9 10.2 VE 14-16 AE 13 TRANSECT 47 9.3 10.7 VE 14-16 AE 11-13 TRANSECT 48 9.3 10.7 VE 14-16 AE 11 TRANSECT 49 9.3 10.7 VE 19 TRANSECT 50 9.3 10.7 VE 14 AE 11 TRANSECT 51 9.3 10.7 VE 14 TRANSECT 52 9.1 10.4 VE 17 TRANSECT 53 9.1 10.4 VE 16 AE 10 AO -- 1North American Vertical Datum 1988 2Due to map scale limitations, base flood elevations shown on the FIRM represent average elevations for the zones depicted.

84
TABLE 8 - COUNTYWIDE TRANSECT DATA – cont’d
STILLWATER ELEVATION
FLOODING SOURCE
10-PERCENT-ANNUAL-CHANCE
1-PERCENT-ANNUAL-CHANCE ZONE
BASE FLOOD ELEVATION (feet NAVD)1,2
CAPE COD BAY – cont’d
TRANSECT 54 9.1 10.4 VE 16 TRANSECT 55 9.1 10.4 VE 16 AE 10 TRANSECT 56 9.1 10.4 VE 18 TRANSECT 57 9.1 10.4 VE 15-16 AE 11 TRANSECT 58 9.1 10.4 VE 18 TRANSECT 59 9.1 10.4 VE 15-16 AE 10-12 TRANSECT 60 8.9 10.2 VE 23 TRANSECT 61 7.9 9.1 VE 15 AE 9 TRANSECT 62 8.2 9.4 VE 14-17 AE 11 TRANSECT 63 8.2 9.4 VE 14-15 TRANSECT 64 8.2 9.4 VE 15-18 AE 10-11 TRANSECT 65 8.4 9.0 VE 13-15 AE 9-13 1North American Vertical Datum 1988 2Due to map scale limitations, base flood elevations shown on the FIRM represent average elevations for the zones depicted.

85
TABLE 8 - COUNTYWIDE TRANSECT DATA – cont’d
STILLWATER ELEVATION
FLOODING SOURCE
10-PERCENT-ANNUAL-CHANCE
1-PERCENT-ANNUAL-CHANCE ZONE
BASE FLOOD ELEVATION (feet NAVD)1,2
CAPE COD BAY – cont’d
TRANSECT 66 8.4 9.0 VE 15-17 AE 9 TRANSECT 67 8.4 9.0 VE 15-17 AE 9 TRANSECT 68 8.4 9.0 VE 13-14 AE 9-13 TRANSECT 69 8.4 9.0 VE 13-14 TRANSECT 190 8.8 13.7 VE 16-19 TRANSECT 191 8.8 13.9 VE 16-17 AE 14-16 TRANSECT 192 8.8 13.9 VE 16-17 AE 14-16 TRANSECT 193 8.8 13.9 VE 16-17 AE 14-16 TRANSECT 194 8.8 13.9 VE 17-22 AE 17-22 1North American Vertical Datum 1988 2Due to map scale limitations, base flood elevations shown on the FIRM represent average elevations for the zones depicted.
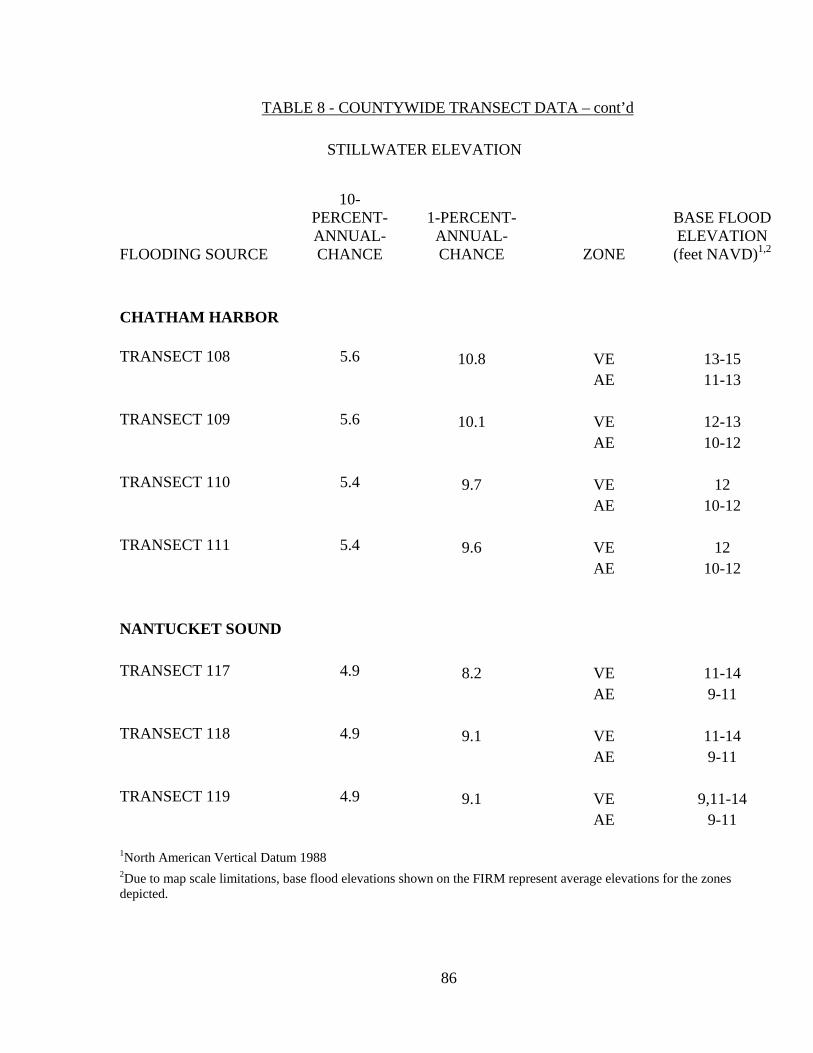
86
TABLE 8 - COUNTYWIDE TRANSECT DATA – cont’d
STILLWATER ELEVATION
FLOODING SOURCE
10-PERCENT-ANNUAL-CHANCE
1-PERCENT-ANNUAL-CHANCE ZONE
BASE FLOOD ELEVATION (feet NAVD)1,2
CHATHAM HARBOR TRANSECT 108 5.6 10.8 VE 13-15 AE 11-13 TRANSECT 109 5.6 10.1 VE 12-13 AE 10-12 TRANSECT 110 5.4 9.7 VE 12 AE 10-12 TRANSECT 111 5.4 9.6 VE 12 AE 10-12 NANTUCKET SOUND TRANSECT 117 4.9 8.2 VE 11-14 AE 9-11 TRANSECT 118 4.9 9.1 VE 11-14 AE 9-11 TRANSECT 119 4.9 9.1 VE 9,11-14 AE 9-11 1North American Vertical Datum 1988 2Due to map scale limitations, base flood elevations shown on the FIRM represent average elevations for the zones depicted.

87
TABLE 8 - COUNTYWIDE TRANSECT DATA – cont’d
STILLWATER ELEVATION
FLOODING SOURCE
10-PERCENT-ANNUAL-CHANCE
1-PERCENT-ANNUAL-CHANCE ZONE
BASE FLOOD ELEVATION (feet NAVD)1,2
NANTUCKET SOUND – cont’d
TRANSECT 120 4.9 9.1 VE 14-15 AE 9-10 TRANSECT 121 4.9 9.1 VE 14 AE 9-10 TRANSECT 122 4.9 9.1 VE 9 AE 7-9 TRANSECT 123 4.9 9.1 VE 11-14 AE 9-11 TRANSECT 124 4.9 9.1 VE 11-14 AE 9-11 TRANSECT 125 4.9 9.1 VE 11-14 AE 9-11 TRANSECT 126 4.9 9.1 VE 11-14 AE 9-11 TRANSECT 127 4.9 9.1 VE 12-17 VE 11-14 AE 9-17 TRANSECT 128 4.9 9.1 VE 14 AE 14 1North American Vertical Datum 1988 2Due to map scale limitations, base flood elevations shown on the FIRM represent average elevations for the zones depicted.
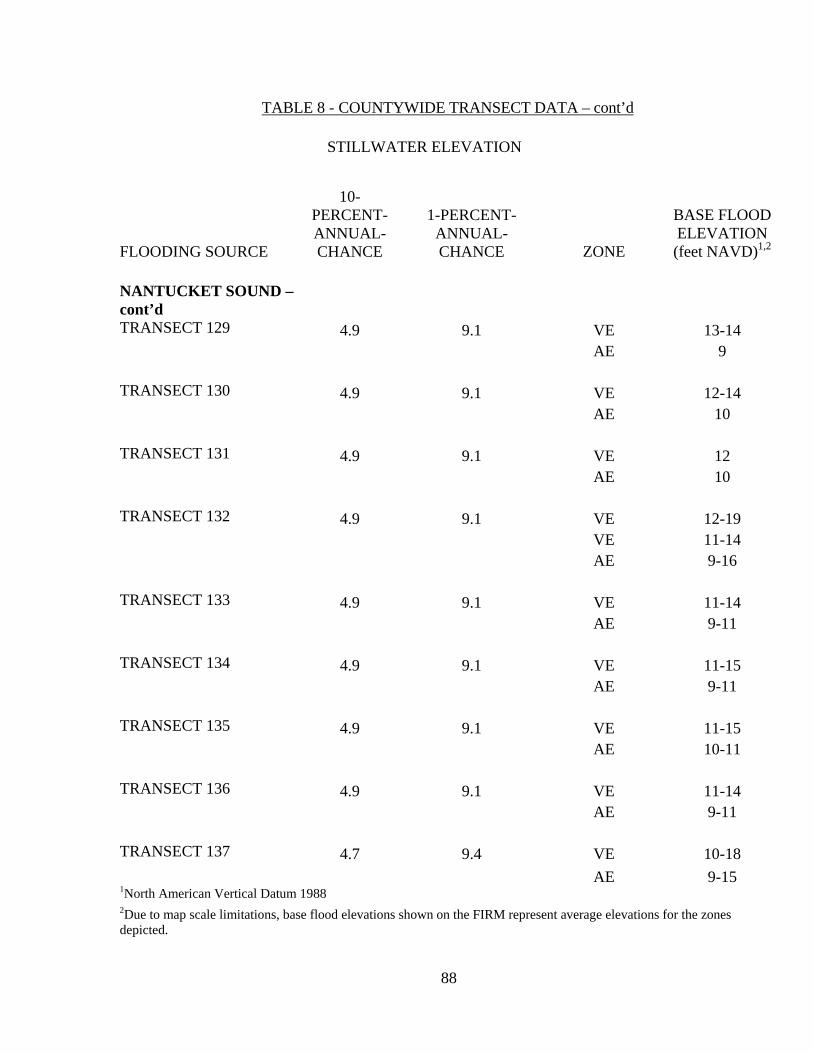
88
TABLE 8 - COUNTYWIDE TRANSECT DATA – cont’d
STILLWATER ELEVATION
FLOODING SOURCE
10-PERCENT-ANNUAL-CHANCE
1-PERCENT-ANNUAL-CHANCE ZONE
BASE FLOOD ELEVATION (feet NAVD)1,2
NANTUCKET SOUND – cont’d
TRANSECT 129 4.9 9.1 VE 13-14 AE 9 TRANSECT 130 4.9 9.1 VE 12-14 AE 10 TRANSECT 131 4.9 9.1 VE 12 AE 10 TRANSECT 132 4.9 9.1 VE 12-19 VE 11-14 AE 9-16 TRANSECT 133 4.9 9.1 VE 11-14 AE 9-11 TRANSECT 134 4.9 9.1 VE 11-15 AE 9-11 TRANSECT 135 4.9 9.1 VE 11-15 AE 10-11 TRANSECT 136 4.9 9.1 VE 11-14 AE 9-11 TRANSECT 137 4.7 9.4 VE 10-18 AE 9-15 1North American Vertical Datum 1988 2Due to map scale limitations, base flood elevations shown on the FIRM represent average elevations for the zones depicted.

89
TABLE 8 - COUNTYWIDE TRANSECT DATA – cont’d
STILLWATER ELEVATION
FLOODING SOURCE
10-PERCENT-ANNUAL-CHANCE
1-PERCENT-ANNUAL-CHANCE ZONE
BASE FLOOD ELEVATION (feet NAVD)1,2
NANTUCKET SOUND – cont’d
TRANSECT 138 4.7 9.4 VE 11-15 AE 9-11 TRANSECT 139 4.7 9.4 VE 12-16 AE 10-12 TRANSECT 140 4.7 9.4 VE 10-15 TRANSECT 141 4.7 9.4 VE 11-15 AE 9-11 TRANSECT 142 4.6 9.7 VE 12-15 AE 10-12 TRANSECT 143 4.6 9.7 VE 12-15 AE 10-12 TRANSECT 144 4.6 9.7 VE 15 AE 10-13 TRANSECT 145 4.6 9.7 VE 12-14 VE 13-21 AE 10-14 TRANSECT 146 4.5 10.1 VE 12-16 AE 12 1North American Vertical Datum 1988 2Due to map scale limitations, base flood elevations shown on the FIRM represent average elevations for the zones depicted.
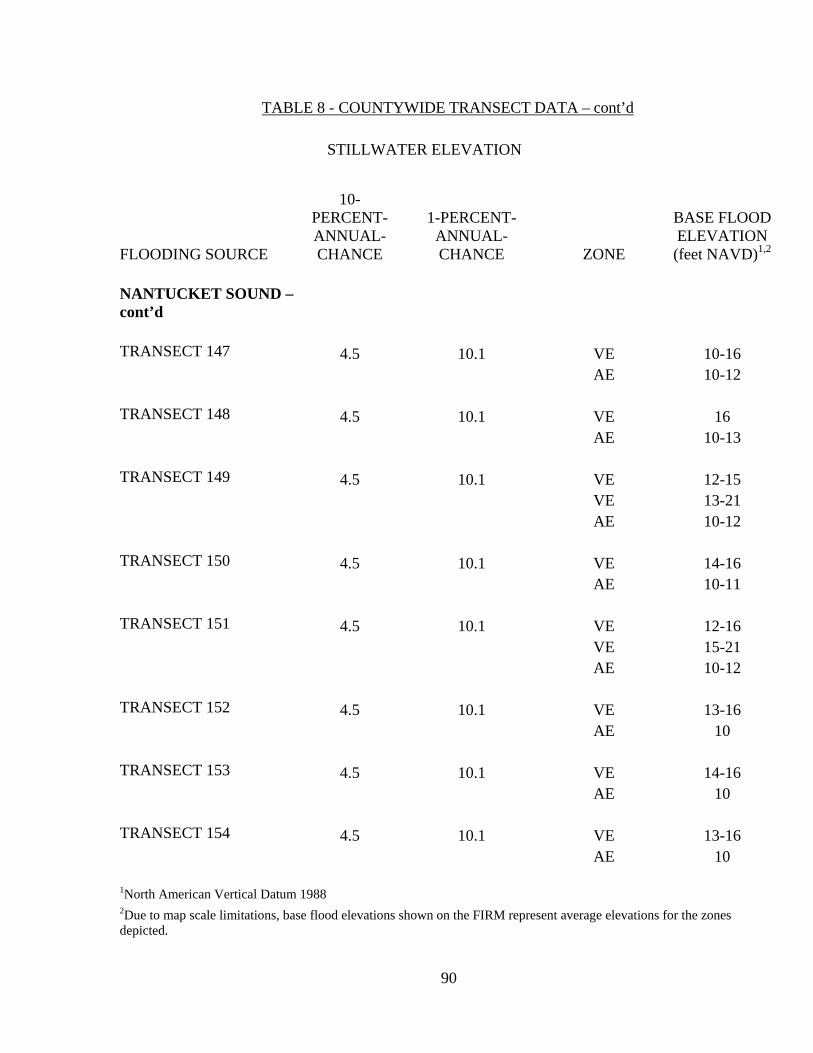
90
TABLE 8 - COUNTYWIDE TRANSECT DATA – cont’d
STILLWATER ELEVATION
FLOODING SOURCE
10-PERCENT-ANNUAL-CHANCE
1-PERCENT-ANNUAL-CHANCE ZONE
BASE FLOOD ELEVATION (feet NAVD)1,2
NANTUCKET SOUND – cont’d
TRANSECT 147 4.5 10.1 VE 10-16 AE 10-12 TRANSECT 148 4.5 10.1 VE 16 AE 10-13 TRANSECT 149 4.5 10.1 VE 12-15 VE 13-21 AE 10-12 TRANSECT 150 4.5 10.1 VE 14-16 AE 10-11 TRANSECT 151 4.5 10.1 VE 12-16 VE 15-21 AE 10-12 TRANSECT 152 4.5 10.1 VE 13-16 AE 10 TRANSECT 153 4.5 10.1 VE 14-16 AE 10 TRANSECT 154 4.5 10.1 VE 13-16 AE 10 1North American Vertical Datum 1988 2Due to map scale limitations, base flood elevations shown on the FIRM represent average elevations for the zones depicted.
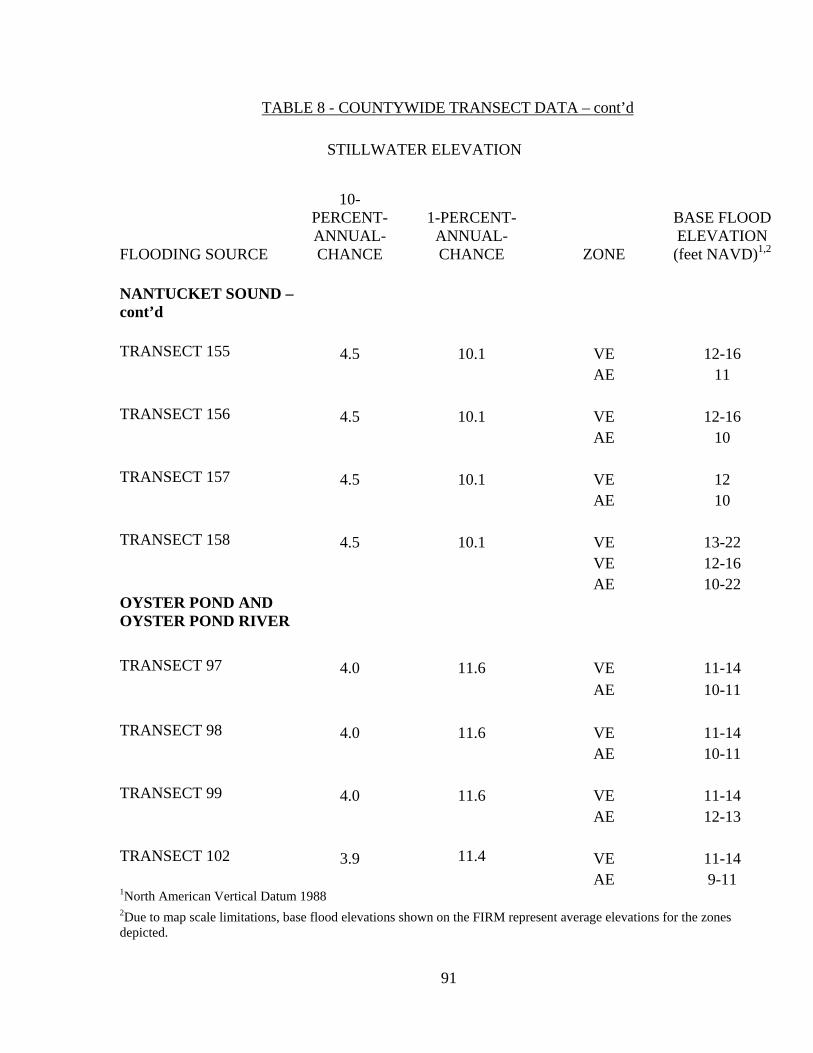
91
TABLE 8 - COUNTYWIDE TRANSECT DATA – cont’d
STILLWATER ELEVATION
FLOODING SOURCE
10-PERCENT-ANNUAL-CHANCE
1-PERCENT-ANNUAL-CHANCE ZONE
BASE FLOOD ELEVATION (feet NAVD)1,2
NANTUCKET SOUND – cont’d
TRANSECT 155 4.5 10.1 VE 12-16 AE 11 TRANSECT 156 4.5 10.1 VE 12-16 AE 10 TRANSECT 157 4.5 10.1 VE 12 AE 10 TRANSECT 158 4.5 10.1 VE 13-22 VE 12-16 AE 10-22 OYSTER POND AND OYSTER POND RIVER
TRANSECT 97 4.0 11.6 VE 11-14 AE 10-11 TRANSECT 98 4.0 11.6 VE 11-14 AE 10-11 TRANSECT 99 4.0 11.6 VE 11-14 AE 12-13 TRANSECT 102 3.9 11.4 VE 11-14 AE 9-11 1North American Vertical Datum 1988 2Due to map scale limitations, base flood elevations shown on the FIRM represent average elevations for the zones depicted.
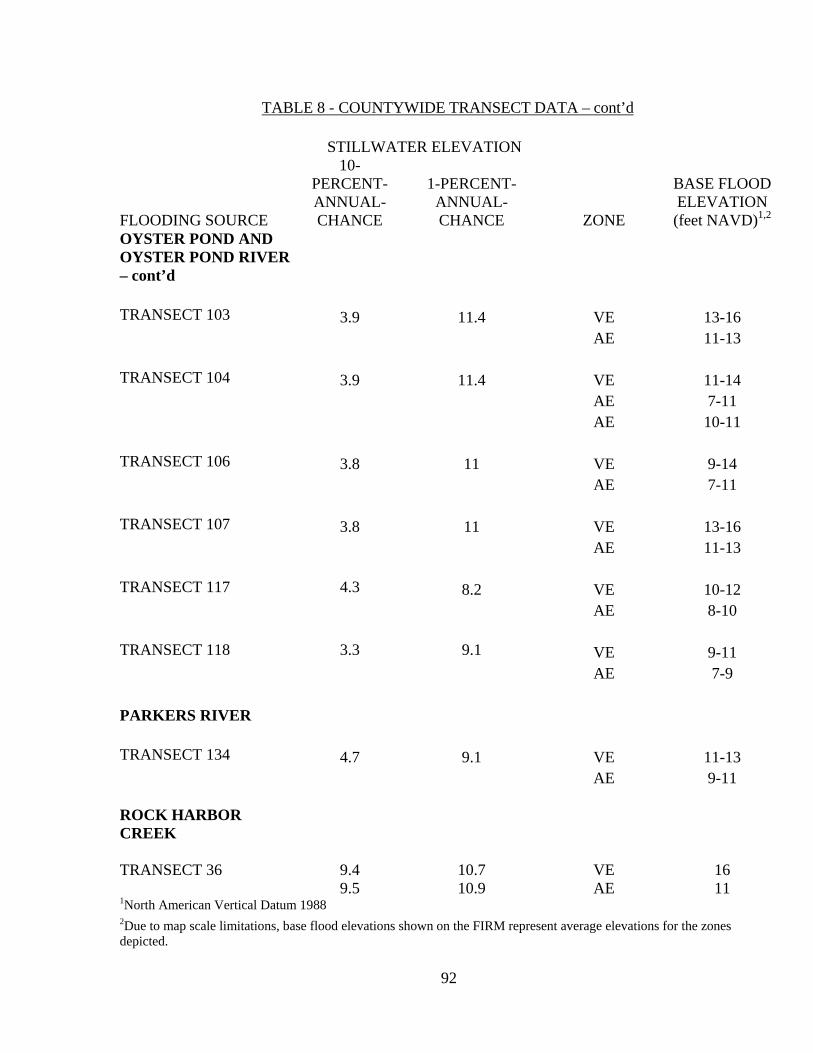
92
TABLE 8 - COUNTYWIDE TRANSECT DATA – cont’d
STILLWATER ELEVATION
FLOODING SOURCE
10-PERCENT-ANNUAL-CHANCE
1-PERCENT-ANNUAL-CHANCE ZONE
BASE FLOOD ELEVATION (feet NAVD)1,2
OYSTER POND AND OYSTER POND RIVER – cont’d
TRANSECT 103 3.9 11.4 VE 13-16 AE 11-13 TRANSECT 104 3.9 11.4 VE 11-14 AE 7-11 AE 10-11 TRANSECT 106 3.8 11 VE 9-14 AE 7-11 TRANSECT 107 3.8 11 VE 13-16 AE 11-13 TRANSECT 117 4.3 8.2 VE 10-12 AE 8-10 TRANSECT 118 3.3 9.1 VE 9-11 AE 7-9 PARKERS RIVER TRANSECT 134 4.7 9.1 VE 11-13 AE 9-11 ROCK HARBOR CREEK TRANSECT 36 9.4 10.7 VE 16 9.5 10.9 AE 11 1North American Vertical Datum 1988 2Due to map scale limitations, base flood elevations shown on the FIRM represent average elevations for the zones depicted.
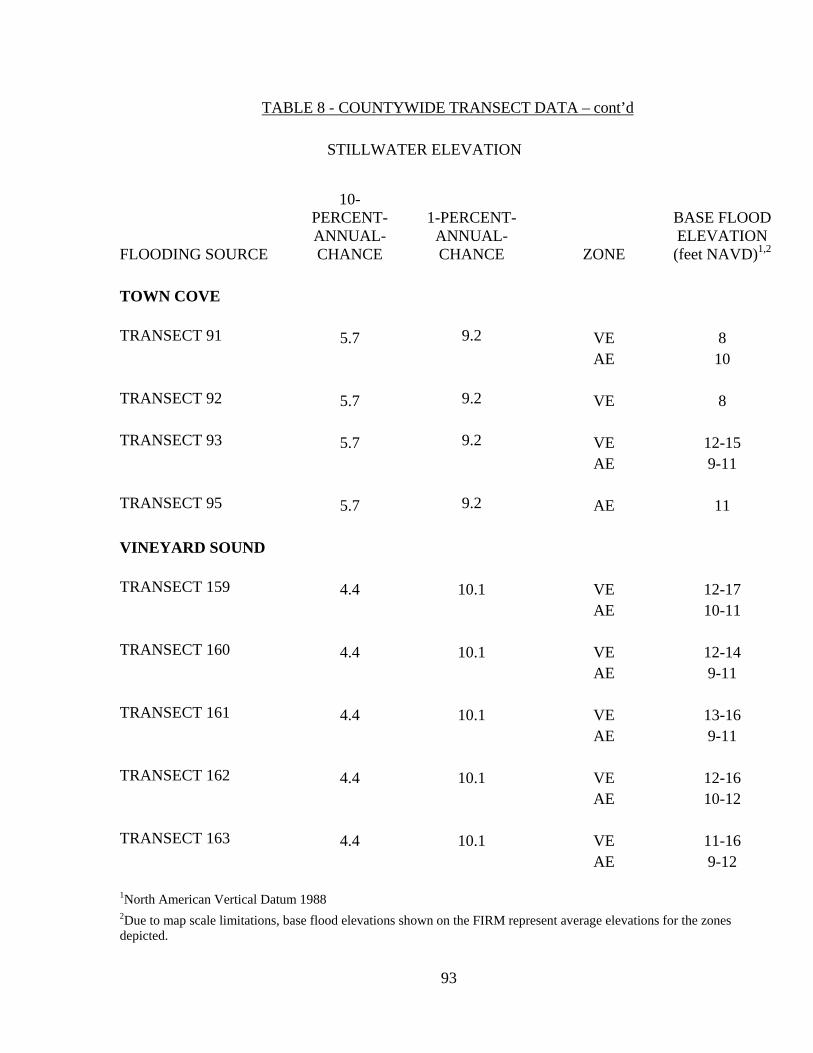
93
TABLE 8 - COUNTYWIDE TRANSECT DATA – cont’d
STILLWATER ELEVATION
FLOODING SOURCE
10-PERCENT-ANNUAL-CHANCE
1-PERCENT-ANNUAL-CHANCE ZONE
BASE FLOOD ELEVATION (feet NAVD)1,2
TOWN COVE TRANSECT 91 5.7 9.2 VE 8 AE 10 TRANSECT 92 5.7 9.2 VE 8 TRANSECT 93 5.7 9.2 VE 12-15 AE 9-11 TRANSECT 95 5.7 9.2 AE 11 VINEYARD SOUND TRANSECT 159 4.4 10.1 VE 12-17 AE 10-11 TRANSECT 160 4.4 10.1 VE 12-14 AE 9-11 TRANSECT 161 4.4 10.1 VE 13-16 AE 9-11 TRANSECT 162 4.4 10.1 VE 12-16 AE 10-12 TRANSECT 163 4.4 10.1 VE 11-16 AE 9-12 1North American Vertical Datum 1988 2Due to map scale limitations, base flood elevations shown on the FIRM represent average elevations for the zones depicted.

94
TABLE 8 - COUNTYWIDE TRANSECT DATA – cont’d
STILLWATER ELEVATION
FLOODING SOURCE
10-PERCENT-ANNUAL-CHANCE
1-PERCENT-ANNUAL-CHANCE ZONE
BASE FLOOD ELEVATION (feet NAVD)1,2
VINEYARD SOUND – cont’d TRANSECT 164 4.4 10.1 VE 12-16 AE 10-12 TRANSECT 165 4.4 10.1 VE 12-16 AE 10-12 TRANSECT 166 4.4 10.1 VE 12-16 AE 10-12 TRANSECT 167 4.4 10.1 VE 12-16 AE 10-12 TRANSECT 168 4.4 10.1 VE 10-16 AE 7-12 TRANSECT 169 4.4 10.1 VE 12-16 AE 10-12 TRANSECT 170 4.4 10.1 VE 12-16 AE 10-12 TRANSECT 171 4.4 10.1 VE 12-16 VE 13-26 AE 10-12 AE 10-26 1North American Vertical Datum 1988 2Due to map scale limitations, base flood elevations shown on the FIRM represent average elevations for the zones depicted.
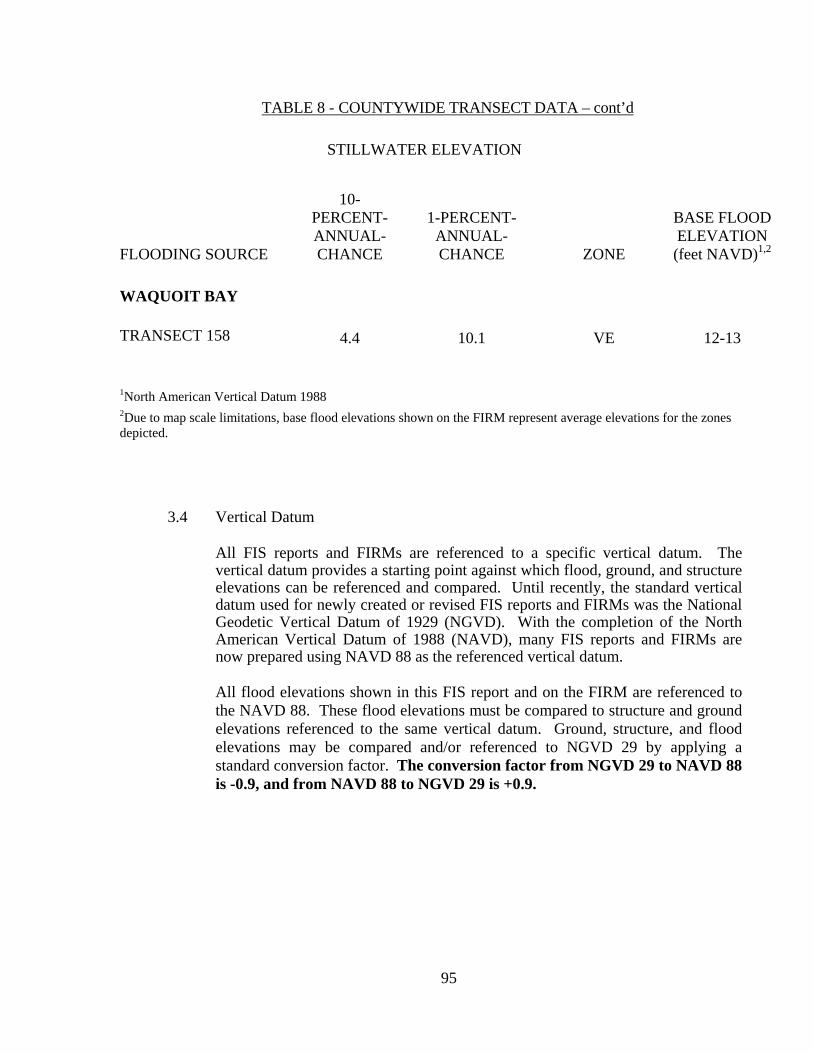
95
TABLE 8 - COUNTYWIDE TRANSECT DATA – cont’d
STILLWATER ELEVATION
FLOODING SOURCE
10-PERCENT-ANNUAL-CHANCE
1-PERCENT-ANNUAL-CHANCE ZONE
BASE FLOOD ELEVATION (feet NAVD)1,2
WAQUOIT BAY TRANSECT 158 4.4 10.1 VE 12-13 1North American Vertical Datum 1988 2Due to map scale limitations, base flood elevations shown on the FIRM represent average elevations for the zones depicted.
3.4 Vertical Datum All FIS reports and FIRMs are referenced to a specific vertical datum. The vertical datum provides a starting point against which flood, ground, and structure elevations can be referenced and compared. Until recently, the standard vertical datum used for newly created or revised FIS reports and FIRMs was the National Geodetic Vertical Datum of 1929 (NGVD). With the completion of the North American Vertical Datum of 1988 (NAVD), many FIS reports and FIRMs are now prepared using NAVD 88 as the referenced vertical datum. All flood elevations shown in this FIS report and on the FIRM are referenced to the NAVD 88. These flood elevations must be compared to structure and ground elevations referenced to the same vertical datum. Ground, structure, and flood elevations may be compared and/or referenced to NGVD 29 by applying a standard conversion factor. The conversion factor from NGVD 29 to NAVD 88 is -0.9, and from NAVD 88 to NGVD 29 is +0.9.
96
For information regarding conversion between the NGVD and NAVD, visit the National Geodetic Survey website at www.ngs.noaa.gov, or contact the National Geodetic Survey at the following address:
NGS Information Services NOAA, N/NGS12 National Geodetic Survey SSMC-3, #9202 1315 East-West Highway Silver Spring, Maryland 20910-3282 (301) 713-3242
Temporary vertical monuments are often established during the preparation of a flood hazard analysis for the purpose of establishing local vertical control. Although these monuments are not shown on the FIRM, they may be found in the Technical Support Data Notebook associated with the FIS report and FIRM for this county. Interested individuals may contact FEMA to access these data. The BFEs shown on the FIRM represent whole-foot rounded values. For example, a BFE of 102.4 will appear as 102 on the FIRM and 102.6 will appear as 103. Therefore, users that wish to convert the elevations in this FIS to NGVD 29 should apply the stated conversion factor to elevations shown on the Flood Profiles and supporting data tables in the FIS report, which are shown at a minimum to the nearest 0.1 foot. To obtain current elevation, description, and/or location information for benchmarks shown on this map, please contact the Information Services Branch of the NGS at (301) 713-3242, or visit their website at www.ngs.noaa.gov.
4.0 FLOODPLAIN MANAGEMENT APPLICATIONS
The NFIP encourages State and local governments to adopt sound floodplain management programs. To assist in this endeavor, each FIS report provides 1-percent-annual-chance floodplain data, which may include a combination of the following: 10-, 2-, 1-, and 0.2-percent-annual-chance flood elevations; delineations of the 1- and 0.2-percent-annual-chance floodplains; and a 1-percent-annual-chance floodway. For Barnstable County, this information is presented on the FIRM and in many components of the FIS report, including Flood Profiles and Summary of Stillwater Elevation tables. Users should reference the data presented in the FIS report as well as additional information that may be available at the local community map repository before making flood elevation and/or floodplain boundary determinations.
97
4.1 Floodplain Boundaries For unrevised streams in Barnstable County, data was taken from previously printed FISs for each individual community and are compiled below. To provide a national standard without regional discrimination, the 1-percent-annual-chance (100-year) flood has been adopted by FEMA as the base flood for flood plain management purposes. The 0.2-percent-annual-chance (500-year) flood is employed to indicate additional areas of flood risk in the community. For tidal areas without wave action, the l-percent-annual-chance and 0.2-percent-annual-chance boundaries were delineated using topographic maps at a scale of 1:4,800 with a contour interval of 5 feet (Reference 54). For the tidal areas with wave action, the flood boundaries were delineated wing the elevations determined at each transect; between transects, the boundaries were interpolated using engineering judgment, land-cover data, and the topographic maps referenced above. The 1-percent-annual-chance flood plain was divided into whole-foot elevation zones based on the average wave envelope elevation in that zone. Where the map scale did not permit these zones to be delineated at one foot intervals, larger increments were used. The approximate studied areas were delineated using the previous FISs for all communities of Barnstable County. (Reference 55, 56, 57, 58). The shallow flooding areas were delineated using aerial maps (Reference 59). In Bourne, approximate floodplain boundaries for Great Herring Pond were taken from the previous printed FIS for the Town of Plymouth and delineated using topographic maps (References 60 and 61). For the remaining flooding sources studied by approximate methods, the 1-percent-annual-chacne floodplain boundaries were taken from the previously printed January 2, 1976, FIS for the Town of Bourne (Reference 62).
In Sandwich, the flooding sources studied by approximate methods, designated as Zone X, are subject to 1-percent-annual-chance flooding with average depths of less than 1 foot, or where contributing drainage area is less than 1 square mile. Please note, however, that not all of the areas designated Zone X were studied by approximate methods; some of the areas were studied by detailed methods. The coastline shown on the maps should not be associated with a particular elevation. This line is the shoreline at the time of the aerial photography from which the maps were prepared. The coastline shown on the maps is not mean sea level; therefore, there is no relationship between the zero elevation shown on the transect profiles and the coastline shown on the maps. The 1- and 0.2-percent-annual-chance floodplain boundaries are shown on the FIRM (Exhibit 1). On this map, the 1-percent-annual-chance floodplain boundary corresponds to the boundary of the areas of special flood hazards (Zones A, AE,
98
AH, AO, and VE), and the 0.2-percent-annual-chance floodplain boundary corresponds to the boundary of areas of moderate flood hazards. In cases where the 1- and 0.2-percent-annual-chance floodplain boundaries are close together, only the 1-percent-annual-chance floodplain boundary has been shown. Small areas within the floodplain boundaries may lie above the flood elevations but cannot be shown due to limitations of the map scale and/or lack of detailed topographic data.
For the flooding sources studied by approximate methods, only the 1-percent-annual-chance floodplain boundary is shown on the FIRM (Exhibit 1).
5.0 INSURANCE APPLICATION
For flood insurance rating purposes, flood insurance zone designations are assigned to a community based on the results of the engineering analyses. These zones are as follows:
Zone A Zone A is the flood insurance rate zone that corresponds to the 1-percent-annual-chance floodplains that are determined in the FIS by approximate methods. Because detailed hydraulic analyses are not performed for such areas, no base flood elevations or depths are shown within this zone. Zone AE Zone AE is the flood insurance rate zone that corresponds to the 1-percent-annual-chance floodplains that are determined in the FIS by detailed methods. In most instances, whole-foot base flood elevations derived from the detailed hydraulic analyses are shown at selected intervals within this zone. Zone AH Zone AH is the flood insurance rate zone that corresponds to the areas of 1-percent-annual-chance shallow flooding (usually areas of ponding) where average depths are between 1 and 3 feet. Whole-foot base flood elevations derived from the detailed hydraulic analyses are shown at selected intervals within this zone. Zone AO Zone AO is the flood insurance rate zone that corresponds to areas of 1-percent-annual-chance shallow flooding (usually sheet flow on sloping terrain) where average depths are between 1 and 3 feet. Average whole-foot depths derived from the detailed hydraulic analyses are shown within this zone.
99
Zone V Zone V is the flood insurance rate zone that corresponds to the 1-percent-annual-chance coastal floodplains that have additional hazards associated with storm waves. Because approximate hydraulic analyses are performed for such areas, no base flood elevations are shown within this zone. Zone VE Zone VE is the flood insurance rate zone that corresponds to the 1-percent-annual-chance coastal floodplains that have additional hazards associated with storm waves. Whole-foot base flood elevations derived from the detailed hydraulic analyses are shown at selected intervals within this zone. Zone X Zone X is the flood insurance rate zone that corresponds to areas outside the 0.2-percent-annual-chance floodplain, areas within the 0.2-percent-annual-chance floodplain, and to areas of 1-percent-annual-chance flooding where average depths are less than 1 foot, areas of 1-percent-annual-chance flooding where the contributing drainage area is less than 1 square mile, and areas protected from the 1-percent-annual-chance flood by levees. No base flood elevations or depths are shown within this zone.
6.0 FLOOD INSURANCE RATE MAP
The FIRM is designed for flood insurance and floodplain management applications. For flood insurance applications, the map designates flood insurance rate zones as described in Section 5.0 and, in the 1-percent-annual-chance floodplains that were studied by detailed methods, shows selected whole-foot base flood elevations or average depths. Insurance agents use the zones and base flood elevations in conjunction with information on structures and their contents to assign premium rates for flood insurance policies. For floodplain management applications, the map shows by tints, screens, and symbols, the 1-percent-annual-chance and 0.2-percent-annual-chance floodplains where applicable. This countywide FIRM presents flooding information for the geographic area of Barnstable County, as outlined in Section 1. Previously, FIRMs were prepared for each incorporated community identified as flood-prone. Historical data relating to the maps prepared for each community are presented in Table 9, “Community Map History.”
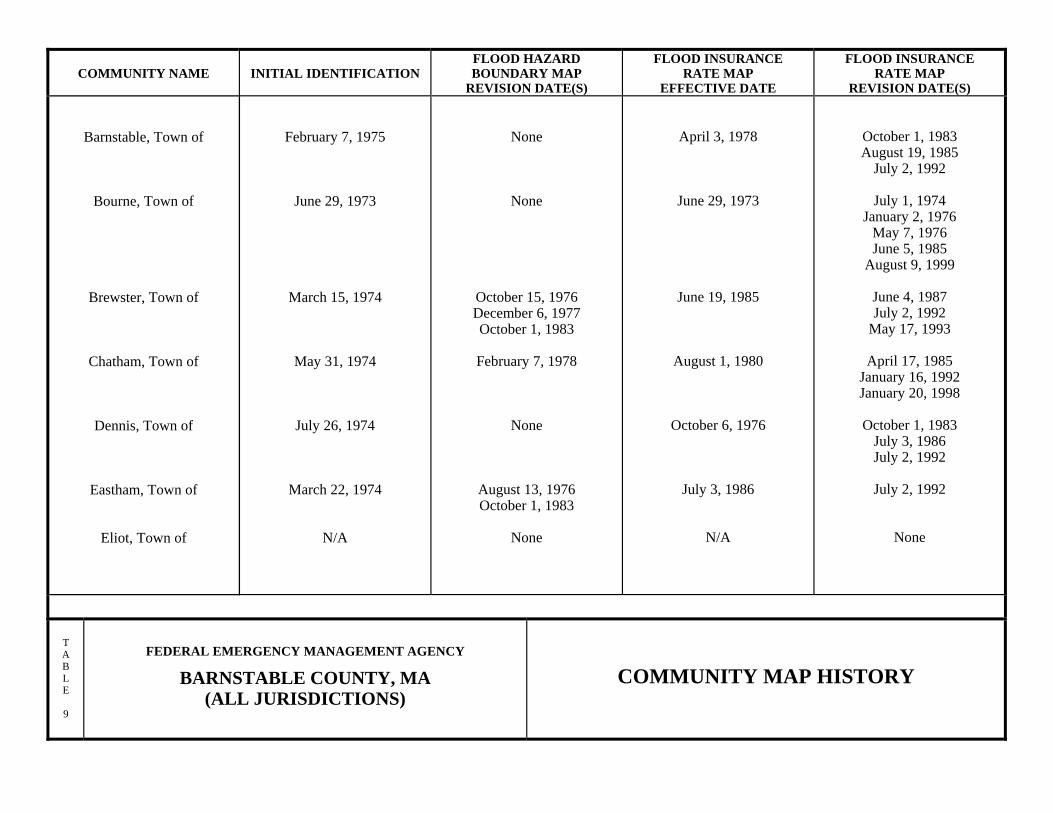
COMMUNITY NAME INITIAL IDENTIFICATION FLOOD HAZARD BOUNDARY MAP
REVISION DATE(S)
FLOOD INSURANCE RATE MAP
EFFECTIVE DATE
FLOOD INSURANCE RATE MAP
REVISION DATE(S)
Barnstable, Town of
Bourne, Town of
Brewster, Town of
Chatham, Town of
Dennis, Town of
Eastham, Town of
Eliot, Town of
February 7, 1975
June 29, 1973
March 15, 1974
May 31, 1974
July 26, 1974
March 22, 1974
N/A
None
None
October 15, 1976 December 6, 1977 October 1, 1983
February 7, 1978
None
August 13, 1976 October 1, 1983
None
April 3, 1978
June 29, 1973
June 19, 1985
August 1, 1980
October 6, 1976
July 3, 1986
N/A
October 1, 1983 August 19, 1985
July 2, 1992
July 1, 1974 January 2, 1976
May 7, 1976 June 5, 1985
August 9, 1999
June 4, 1987 July 2, 1992
May 17, 1993
April 17, 1985 January 16, 1992 January 20, 1998
October 1, 1983
July 3, 1986 July 2, 1992
July 2, 1992
None
T A B L E 9
FEDERAL EMERGENCY MANAGEMENT AGENCY
BARNSTABLE COUNTY, MA (ALL JURISDICTIONS)
COMMUNITY MAP HISTORY
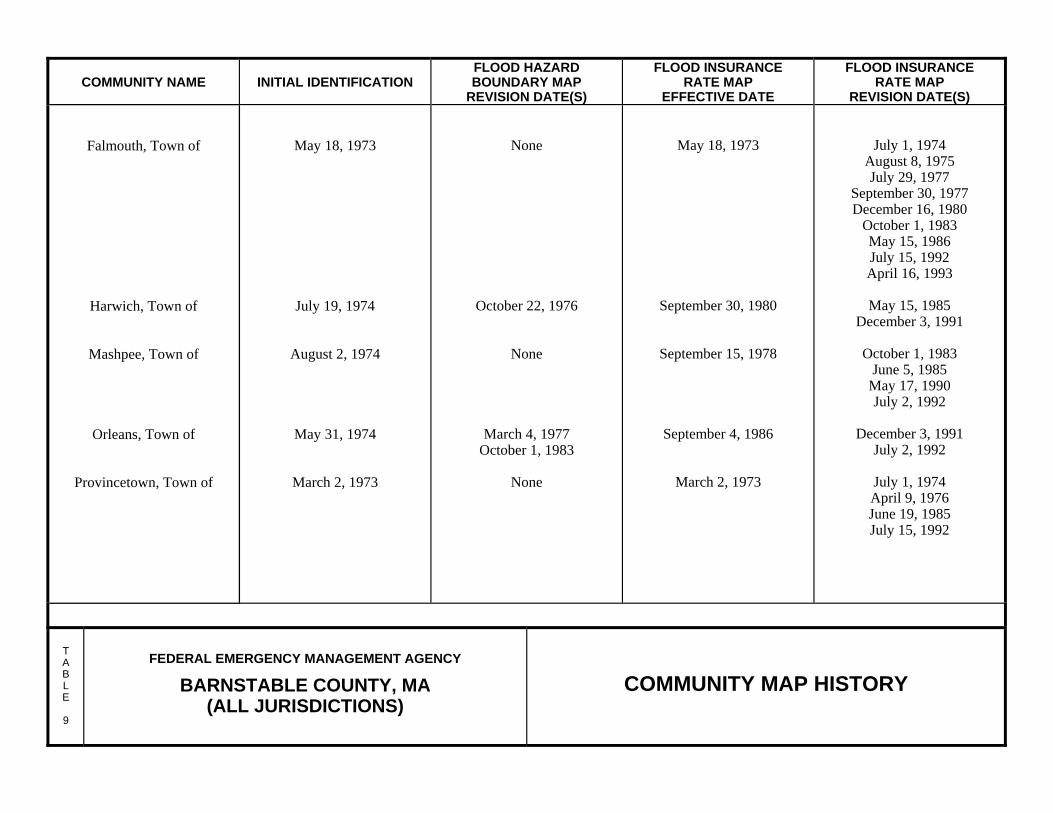
COMMUNITY NAME INITIAL IDENTIFICATION FLOOD HAZARD BOUNDARY MAP
REVISION DATE(S)
FLOOD INSURANCE RATE MAP
EFFECTIVE DATE
FLOOD INSURANCE RATE MAP
REVISION DATE(S)
Falmouth, Town of
Harwich, Town of
Mashpee, Town of
Orleans, Town of
Provincetown, Town of
May 18, 1973
July 19, 1974
August 2, 1974
May 31, 1974
March 2, 1973
None
October 22, 1976
None
March 4, 1977 October 1, 1983
None
May 18, 1973
September 30, 1980
September 15, 1978
September 4, 1986
March 2, 1973
July 1, 1974 August 8, 1975 July 29, 1977
September 30, 1977 December 16, 1980
October 1, 1983 May 15, 1986 July 15, 1992 April 16, 1993
May 15, 1985
December 3, 1991
October 1, 1983 June 5, 1985
May 17, 1990 July 2, 1992
December 3, 1991
July 2, 1992
July 1, 1974 April 9, 1976 June 19, 1985 July 15, 1992
T A B L E
9
FEDERAL EMERGENCY MANAGEMENT AGENCY
BARNSTABLE COUNTY, MA (ALL JURISDICTIONS)
COMMUNITY MAP HISTORY
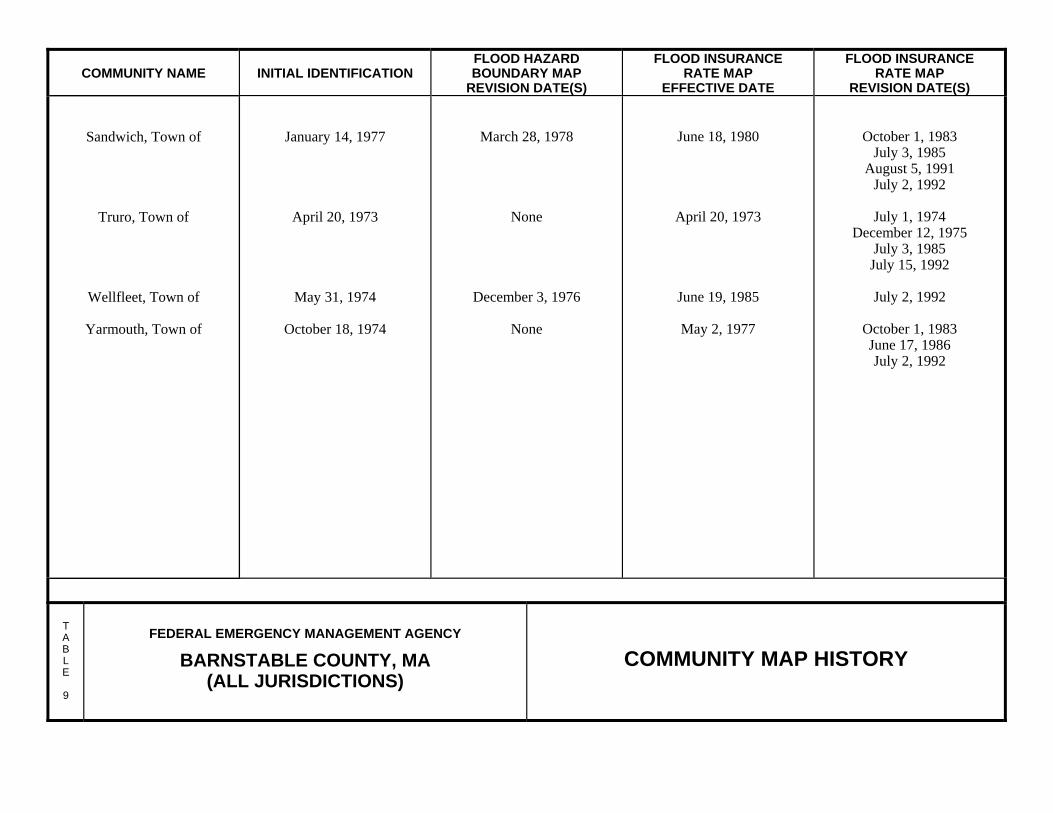
COMMUNITY NAME INITIAL IDENTIFICATION FLOOD HAZARD BOUNDARY MAP
REVISION DATE(S)
FLOOD INSURANCE RATE MAP
EFFECTIVE DATE
FLOOD INSURANCE RATE MAP
REVISION DATE(S)
Sandwich, Town of
Truro, Town of
Wellfleet, Town of
Yarmouth, Town of
January 14, 1977
April 20, 1973
May 31, 1974
October 18, 1974
March 28, 1978
None
December 3, 1976
None
June 18, 1980
April 20, 1973
June 19, 1985
May 2, 1977
October 1, 1983 July 3, 1985
August 5, 1991 July 2, 1992
July 1, 1974
December 12, 1975 July 3, 1985
July 15, 1992
July 2, 1992
October 1, 1983 June 17, 1986 July 2, 1992
T A B L E
9
FEDERAL EMERGENCY MANAGEMENT AGENCY
BARNSTABLE COUNTY, MA (ALL JURISDICTIONS)
COMMUNITY MAP HISTORY
103
7.0 OTHER STUDIES
Information pertaining to revised and unrevised flood hazards for each jurisdiction included in this countywide Barnstable County FIS has been compiled in this FIS. Therefore, this FIS supersedes all previously printed FIS reports, FIRMs, and/or FHBMs for all of the incorporated jurisdictions within Barnstable County listed in Section 1 and should be considered authoritative for the purposes of the NFIP. FISs have been prepared or are in the process of being prepared for the adjacent county of Plymouth, Massachusetts, and it is in agreement with this FIS.
8.0 LOCATION OF DATA
Information concerning the pertinent data used in the preparation of this study can be obtained by contacting FEMA Region I, 99 High Street, 6th Floor, Boston, MA 02110.
9.0 BIBLIOGRAPHY AND REFERENCES 1 Census 2000 Summary File 1 Massachusetts/prepared by the U.S. Census
Bureau, 2001. 2 U. S. Army Corps of Engineers, New England Division, Hurricane Flood
Levels, Profile No. 10, Waltham, Massachusetts, Revised 1977. 3 U. S. Army Corps of Engineers, New England Division, Tidal Flood Profiles,
New England Coastline, Waltham, Massachusetts, September 1988. 4 The Cape Codder, Massachusetts, p.31, May 30, 1978. 5 Eastham Illustrated, Eastham, Massachusetts, 1978. 6 Federal Emergency Management Agency, Flood Insurance Study, Town of
Dennis, Barnstable County, Massachusetts, Washington, D.C., July 3, 1986. 7 U. S. Army Corps of Engineers, New England Division, Hurricane Levels,
Profile No. 10, Waltham, Massachusetts, Revised 1977. 8 Nickerson & Berger, Inc., of Orleans, Massachusetts, Listing of Elevations of
Extreme High -Water Determined on March 31, -1978; Massachusetts, April 4, 1978.
9 Provincetown Advocate, Provincetown, Massachusetts, January 12, 1978.
10 Provincetown Advocate, Provincetown, Massachusetts, February 9, 1978.
104
11 Commonwealth of Massachusetts, Water Resources Commission, Coastal Flooding Barnstable County, Cape Cod, Massachusetts, Boston, Massachusetts, March 1963.
12 U. S. Army Corps of Engineers, New England Division, Stillwater Tide Levels
Along the Eastern New England Coast, Storm of February 6 and 7, 1978, Waltham, Massachusetts, February 1978.
13 U. S. Army Corps of Engineers, New England Division, High-Water Mark
Data for 1938, 1944, -and 1954 Hurricane Floods in Southern New England, Waltham, Massachusetts (Undated).
14 Provincetown Advocate, Provincetown, Massachusetts, February 8, 1978.
15 Commonwealth of Massachusetts, Water Resources Commission, Coastal Flooding Barnstable County, Cape Cod, Massachusetts, Boston, Massachusetts, March 1963.
16 Stone & Webster Engineering Corporation, Development and Verification of a
Synthetic Northeaster Model for Coastal Analysis, Boston, Massachusetts, 1978.
17 U.S. Department of Commerce, National Oceanic and Atmospheric
Administration, Hydro meteorological Branch, Off ice of Hydrology, Memorandum HUR 7-120, Revised Standard Project Hurricane Criteria for the Atlantic and Gulf Coasts of the United States, Washington, D. C., June 1972.
18 U.S. Department of Commerce, Report 68, Criteria for a Standard Project
Northeaster for New England North of Cape Cod, Washington, D. C., March 1964.
19 U.S. Department of Commerce, National Oceanic and Atmospheric
Administration, Hydro meteorological Branch, Office of Hydrology, Memorandum HUR 7-97, Meteorological Characteristics of the Probable Maximum Hurricane, Atlantic and Gulf Coasts of the United States, Washington, D. C., December 1968.
20 Stone and Webster Engineering Corporation, Development and Verification of
a Synthetic Northeaster Model for Coastal Flood Analysis, Boston, Massachusetts, 1978.
21 U.S. Army Corps of Engineers, New England Division, Interim Hurricane
Study of Wareham and Marion, Massachusetts, Waltham, Massachusetts, September 1962, Revised 1975.
105
22 U.S. Department of Commerce, National Oceanic and Atmospheric
Administration, National Weather Service, Memorandum HUR 7-120, Revised Standard Project Hurricane Criteria for the Atlantic and Gulf Coasts of the United States, Silver Spring, Maryland, June 1972.
23 U.S. Department of Commerce, National Oceanic and Atmospheric
Administration, Hydro meteorological Branch, Office of Hydrology, Report No. 68, Criteria for a Standard Project Northeaster for New England North of Cape Cod, Washington, D.C., March 1964.
24 U.S. Department of Commerce, National Oceanic and Atmospheric
Administration, National Weather Service, Memorandum HUR 7-97, Meteorological Characteristics of the Probable Maximum Hurricane, Silver Spring, Maryland, December 1968.
25 U.S. Army Corps of Engineers, Beach Erosion Board, Technical Report No. 4,
Shore Protection Planning and Design, Washington, D.C., 1961.
26 Federal Emergency Management Agency, Federal Insurance Administration, Coastal Flooding Hurricane Storm Surge Model, Washington, D.C, June 1985.
27 Stone & Webster Engineering Corporation, 2-D Hydrodynamic Model, Boston,
Massachusetts, July 1989.
28 U.S. Department of Housing and Urban Development, Federal Insurance Administration, Flood Insurance Study, Town of Falmouth, Barnstable County, Massachusetts, Washington, D. C., September 1975.
29 U.S. Army Corps of Engineers, New England Division, High Water Data for
1938, 1944, and 1954 Hurricanes, Waltham, Massachusetts (Unpublished).
30 U.S. Department of Commerce, National Oceanic and Atmospheric Administration, National Ocean Survey, Tidal Benchmarks for Massachusetts (Unpublished).
31 U.S. Department of Housing and Urban Development, Federal Insurance
Administration, Addendum to Falmouth, Massachusetts, Flood Insurance Study, Washington, D. C., October 1976.
32 Stone and Webster Engineering Corporation, Technical Review of the Appeal
Case of the Flood Insurance Study, Boston, Massachusetts, September 1977.
106
33 U.S. Department of Housing and Urban Development, Federal Insurance Administration, ODISTIM One-Dimensional Storm Surge Model, Washington, D.C., July 1977.
34 U.S. Army Corps of Engineers, -Shore Protection Planning and Design,
Washington, D. C., 1961.
35 U.S. Army Corps of Engineers, New England Division, Hurricane Flood Levels, Profile No. 10, Waltham, Massachusetts, Revised 1977.
36 U.S. Army Corps of Engineers, New England Division , Hurricane Flood Levels Profile No. 9, Waltham, Massachusetts, Revised 1937.
37 U.S. Department of Commerce, National Oceanic and Atmospheric
Administration, Report No. 68: Criteria for 5 Standard Project Northeaster for New England North of Cape Cod, Washington, D. C., March 1964.
38 U. S. Army Corps of Engineers, Coastal Engineering Research Center, Shore
Protection Manual, Volume 1, Fort Belvoir, Virginia, 1973.
39 U. S. Army Corps of Engineers, Galveston District, Guidelines for Identifying Coastal High Hazard Zones, Galveston, Texas, June 1975.
40 National Academy of Sciences, Methodology for Calculating Wave Action
Effects Associated with Storm Surges, Washington, D.C., 1977.
41 Stone & Webster Engineering Corporation, Manual for Wave Runup Analysis, Coastal Flood Insurance Studies, Boston, Massachusetts, November 1981.
42 Moore Survey and Mapping, Inc., of Shrewsbury , Massachusetts, Topographic
Maps, Scale 1 : 4,800, Contour Interval 5 Feet : Barnstable, Massachusetts, October 1978.
43 U. S. Army Engineer Waterways Experiment Station, Atlantic Coast Hind cast, Phase 11, Wave Information, Wave Information Studies of U.S. Coastlines, Office of Chief of Engineers, U. S. Army, Washington, D. C., March 1982.
44 Stone and Webster Engineering Corporation, Manual for Wave Runup
Analysis, Coastal Flood Insurance Studies, Boston, Massachusetts, November 1981.
107
45 Federal Emergency Management Agency. (April 2003). Guidelines and Specifications for Flood Hazard Mapping Partners. Appendix D: Guidance for Coastal Flooding Analyses and Mapping. Washington, D.C.
46 Federal Emergency Management Agency, Atlantic Ocean and Gulf of Mexico
Coastal Guidelines Update, February 2007
47 Federal Emergency Management Agency, Federal Insurance Administration, Flood Insurance Study, Town of Provincetown, Barnstable County, Massachusetts, Washington, D.C., Decmeber 19, 1984.
48 Federal Emergency Management Agency. (April 2003). Guidelines and
Specifications for Flood Hazard Mapping Partners. Appendix B: "Guidance for Converting to the North American Vertical Datum of 1988." Washington, D.C.
49 U.S. Army Corps of Engineers, Coastal Engineering Research Center. (1984).
Shore Protection Manual. (Volumes I and II, 4th Edition). Washington, D.C.
50 Town of Provincetown. 2' Topographic Data. AutoCAD.
51 U.S. Department of Commerce, Coast and Geodetic Survey, Boston Harbor Coastal Chart, #246, 37th Edition, February 10, 1973.
52 Geod Surveying and Aerial Mapping Corporation, of Oak Ridge, New Jersey,
Aerial Photographs, Scale 1” = 1,600’: Town of Hingham, Massachusetts, 1982.
53 Commonwealth of Massachusetts, Executive Office of Environmental Affairs,
and Office of Coastal Zone Management. "Massachusetts Coastal Zone Management Plan". March 2002.
54 Moore Survey and Mapping, Inc., of Shrewsbury , Massachusetts, Topographic
Maps, Scale 1:4,800, Contour Interval 5 Feet : Barnstable, Massachusetts, October 1978.
55 U. S. Department of Housing and Urban Development, Federal Insurance
Administration, Flood Hazard Boundary Map, Town of Barnstable, Barnstable County, Massachusetts, February 1975.
56 U. S. Department of Housing and Urban Development, Federal Insurance
Administration Flood Insurance Study, Town of Barnstable, Barnstable County, Massachusetts, Washington, D.C., October 3, 1977.
108
57 U. S. Department of Housing and Urban Development, Federal Insurance Administration, Flood Hazard Boundary Map, Town of Brewster, Barnstable County, Massachusetts, December 6, 1977.
58 Federal Emergency Management Agency, Flood Insurance Study, Town of
Sandwich, Barnstable County, Massachusetts, Washington, D.C, July 3, 1985.
59 Avis Airmap, Inc., of Braintree, Massachusetts, Aerial Maps, Scale 1:4,800, Contour Interval 5 Feet: Town of Eastham, Massachusetts, 1978.
60 Aero Service, Topographic Maps, Scale 1:2,400, Contour Interval 5 Feet:
Bourne, Massachusetts, 1972.
61 Federal Emergency Management Agency, Flood insurance Study. Town of Plymouth, Plymouth County, Massachusetts, Washington, D.C., July 17, 1986.
62 U.S. Department of Housing and Urban Development, Federal Insurance
Administration, Flood Insurance Study, Town of Bourne, Barnstable County. Massachusetts, Washington, D.C., January 2, 1976.