i jan 3 1 gold commissioner's office vanc0uver.b.c
TRANSCRIPT

I JAN 3 1 2007
Gold Commissioner's Office I VANC0UVER.B.C. / ASSESSMENTREPORT Airborne Geophysics
on the Mila Mineral Claims
(505096 and 530340)
Karnloops Mining Division, British Columbia, Canada
NTS 82Ml12 Latitude: 5 1 "36'N
Longitude: 1 19'38'W Owner: Christopher 0. Naas
Operator: Christopher 0. Naas
by Christopher 0. Naas, P. Geo.
January 3 1,2007

SUMMARY
The eastern portion of the Mila property covers an area that in 1991 returned a 11.28 metre instersection of 0.34% Cu from a east-west trending mineralized horizon. The style of mineralization was interpreted to be a VMS type deposit.
The current program consisted of undertaking an airborne geophysical survey over this mineralized zone. The purpose of the survey was to gain a geophysical signature which could be applied to 1989 Goldbank airborne survey.
Future work is recommended to consist of interpretation of the dataset and applying this to both the past geological dataset as well as the 1989 airborne survey. which covers the entire Mila property.

TABLE OF CONTENTS Page
SUMMARY ................................................................................................................................... I 1.0 INTRODUCTION ................................................................................................................... 1
1 . 1 LOCATION AND ACCESS ............................................................................................................. 1 1.2 TITLE ............................................................................................................................................... 1
2.0 REGIONAL GEOLOGY ...................................................................................................... 4 3.0 LOCAL GEOLOGY ............................................................................................................. 4
3.1 LITHOLOGY .................................................................................................................................... 4 3.2 STRUCTURE ................................................................................................................................ 6
WORK HISTORY ................................................................................................................. 6 .................................................................................................................. CURRENT WORK 7
CONCLUSIONS ................................................................................................................. 10 REFERENCES ................................................................................................................ 10 STATEMENT OF QUALIFICATIONS .............................................................................. 12 STATEMENT OF COSTS ............................................................................................... 13
LIST OF TABLES Page
Table 1 : Claim Status. Mila Property ........................................................................................... 1
LIST OF FIGURES Page
1 . Location Map (1 : 1.000. 000) .................................................................................................. 2 2 . Claim Location Map (-1 .35. 000) .......................................................................................... 3 3 . Regional Geology Map. Vavenby Area (1 : 100. 000) ............................................................. 5 4 . Airborne Mag Survey. Mila Property (1 .25. 000) .................................................................. 8 5 . Airborne EM Survey. Mila Property (1 .25. 000) ................................................................... 9
LIST OF APPENDICES
Aeroquest Limited's Logistics Report

1.0 INTRODUCTION
This report details the results of an helicopter-borne geophysical survey conducted on mineral claims with tenure numbers 505096 and 530340 of the Mila property on May 9,2006.
1.1 LOCATION AND ACCESS
The Mila property is located on NTS mapsheet 82W12 and geographically centred at 51°36'N and 1 1 g038'W.
Road access is gained to claims via the Yellowhead Highway (Highway 5) to the village of Vavenby. The claims are located on the south side of the North Thompson River. The Adams Lake Forest Service road passes through the claims (Figure 1 and 2).
The Canadian National Railway mainline also passes through this area.
Topography is moderate to steep with elevations ranging from 1,300 metres to 1,800 metres. The area is the site of active logging and consists of a thick coniferous forest cover with heavy underbrush to wide open clear cuts. At higher elevations, small marshy alpine meadows occur (Belik, 1 973).
1.2 TITLE
The Mila claims are owned 100% by Christopher 0. Naas (Figure 2). Table 1 lists the claims which make up the Mila property.
Table 1 : Claim Status, Mila Property Tenure Number - Area
505087 1306.65 505090 462.18 505095 28 1.46 505096 28 1.46 521428 80.39 530339 502.28 530340 502.20
Good To Date April 18,2007 April 18,2007 April 18,2007 April 18,2007 April 18,2007 April 18,2007 April 18,2007

LEGEND
0 Mila project claim group
LOCATION MAP
Mila Project 0 -
NAD83. UTM Zone l l N

1 0 Other tenure boundaries (as of August 25,2006)
Topography .... ........ Watercourse - Railway P Paved road
Rough road
Waterbody
I
I CLAIM LOCATION MAP
0 - Mila Prcject NAD83 UTM Zone 1 I N Kamloops M.D., British Columbia, Canada
NTS 82M121M5
Scale: 1:160,000 Drawn:
I Figure: 2 Date: F e b m q 2007

2.0 REGIONAL GEOLOGY
The Vavenby area is underlain by Paleozoic Eagle Bay Assemblage and Fennell Formation rocks, located within the Kootenay Terrane. The Eagle Bay Assemblage has been intruded by Devonian(?) and Cretaceous granitic rocks, and is overlain by Miocene basalts (Naas and Neale, 1991) (Figure 3).
3.0 LOCAL GEOLOGY
3.1 LITHOLOGY
Eagle Bay Assemblage The Eagle Bay Assemblage comprises four northwest-dipping thrust sheets (Schiarizza and Preto, 1987). Schiarizza (1985) divides the Eagle Bay Assemblage in the Vavenby area into eight units. At the base of the formation is a quartz-dominated succession (Unit 1) of unknown age. This is overlain by a succession of felsic to intermediate metavolcanic rocks (Units 2 and 3), and fine to coarse clastic metasedimentary rocks (Units 4 and 5) of Devonian and Mississippian age. Structurally above these rocks is a mafic metavolcanic-limestone division (Unit 6) of Cambrian age, overlain by intermediate metavolcanics (Unit 7). The carbonate member of Unit 6 is referred to as the Tshinakin limestone. The structurally highest division of the Eagle Bay Formation comprises clastic metasedimentary rocks of Unit 8. These rocks are overturned, however, and Unit 8 may be the oldest unit within the Eagle Bay succession.
Orthogn eiss The Devonian(?) Orthogneiss consists of quartzo-feldspathic orthogneiss. It is typically a weakly to moderately foliated rock, consisting of lenses and augen of quartzo-feldspathic material enclosed in "seams" of chlorite-sericite schist. Locally it grades to virtually massive granitic rock or conversely to strongly foliated chlorite-sericite schist containing large quartz augen. Biotite is an important component of the gneiss within the thermal aureole of the Baldy batholith.
Fennell Formation The Upper Permian-Lower Mississippian Fennell Formation in the Adams Plateau-Clearwater area, has been divided into two units by Schiarizza and Preto (1984). The lower unit is a heterogeneous assemblage of bedded chert, gabbro, diabase, and pillow basalt, which also includes units of sandstone and phyllite, Devonian aged quartz-feldspar porphyry rhyolite, and intraformational conglomerate. The upper unit is a succession of pillow and massive basalt with minor amounts of bedded chert, gabbro, basaltic breccia and tuff.
Schiarizza (1985) does not divide the Fennell Formation into two units in the Vavenby area, rather uses one unit containing rocks as previously described by Schiarizza and Preto (1 984).

LEGEND GEOLOGY
Alluv~um Baldy Batholith , Granadioritc Eagle Bay Formation
Sediments, i felsic Limestone Argillite Felsic valcanies Felsic flows Mafic voleanies
SYMBOLS 4- Syncline axis - Fault
Foliation
0 Mineral claim location and tenure number
UTM Zone 11 Norih NTS 82Ml5.12
I REGIONAL GEOLOGY MAP Vavenby Area I
Mila Project Kamlaops M.D., BC, Canada
Scale: 1:100,000 Drawn:
Figure: Date: February ZOO7

Granitic Roch Cretaceous granite and granodiorite of the Raft and Baldy batholiths intrude Eagle Bay Formation rocks. In contrast to the abrupt northern contact of the Baldy batholith, a broad zone of intermixed metasedimentary and granitic rocks marks the southern margin of the Raft batholith.
Basalt The flat-lying, undeformed Miocene basalt flows are the easternmost representatives of an extensive mass of Late Miocene to Pliocene plateau lavas which cover much of the area to the west and northwest of Vavenby (Campbell and Tipper, 197 1).
3.2 STRUCTURE
Schiarizza (1985) describes the four types of structures that exist in the Vavenby area: an early metamorphic foliation, axial planar to very rare small isoclinal folds, which is locally observed to be discordant to and/or folded about the dominant second generation schistosity. variably oriented, but most commonly north to east-plunging isoclinal folds; the dominant syn-metamorphic schistosity is axial planar. Throughout most of the area this schistosity is parallel to bedding. northwest-trending folds and crenulation with axial planar crenulation cleavage. Axial surfaces generally dip steeply to the northeast or southwest. east-west trending upright folds, kinks, and crenulations of probable Tertiary age. The folds are often most prominently developed adjacent to northerly trending faults.
4.0 WORK HISTORY
The Mila Mineral Claims are located 7 krn east of Vavenby on the south side of Reg Chnstie Creek. This area was first staked in 1969 by Nicanex Mines as a result of discovery of copper mineralization during a regional prospecting program. Subsequent geological, geochemical and geophysical surveys during 1970 outlines the copper mineralized zone (Nicanex zone).
In 1975, the ground was restaked by Greenwood Exploration. Greenwood conducted surface geological mapping, but allowed the claims to lapse the following year.
Bamer Reef Resources staked the area again in 1977 and carried out geological mapping and geochemical and geophysical surveys during 1978. As a result, a second zone, the AFR (Nicanex Road Showing) was located, which lies parallel to the Nicanex zone. Drilling was

carried out in 1979. Drilling results include 944 ppm Cu over 19.8 metres. Again the claims were allowed to lapse.
Cima Resources restaked the showings and conducted a small prospecting and soil sampling program. A rock sample returned 230 ppm Cu, 360 ppm Pb and 112 ppm Zn.
Newmont Exploration staked around the showings in 1984 and carried out geological mapping, prospecting, and geophysical surveying during 1985. The following year, Newmont drilled anomalous areas as defined by the previous year's work. This led to the definition of the Road showing.
In 1988, Goldbank Ventures Ltd. staked the JAR and MILA claims over the known showings. During 1989, an airborne geophysical survey was carried out over 492 line-kilometres.
In 1990 and 1991, Goldbank conducted a two phase program consisting of 32 km of ground magnetics, 28 km of MaxMin, 16 krn of IP, 24 km of soil sampling and 1794 metres of diamond drilling. The most significant drill result was 11.28 metres of 0.34% Cu (Naas and Neale, 1991).
The REG and MILA claims were staked by the author in 2002. The claims were differentially GPS surveyed in 2003.
In 2004, soil samples were collected along two main soil lines, both following the existing road network. Samples were collected at 50 metre intervals along both lines. No siginificant results were returned from this soil sampling program (Naas, 2004).
In 2005, 122 soils samples were collected, with no significant results (Naas, 2005).
5.0 CURRENT WORK
On May 9, 2006, Aeroquest Limited of Milton, ON conducted a 35.3 line-km helicopter-borne magnetic and electro-magnetic survey over the Nicanex Showing of the Mila property.
The geophysical sensor included Aeroquest's exclusive AeroTEM I1 time domain helicopter electromagnetic system that is employed in conjunction with a high-sensitivity cesium vapour magnetometer. Ancillary equipment included a real-time differential GPS navigation system, radar altimeter, video recorder and a base station magnetometer.
Line spacing was 100 metres over historical drill holes and 200 metres away from these drill holes.
Contoured results of total field magnetics and EM are presented in Figures 5 and 6 respectively. A copy of Aeroquest's report is presented in Appendix I.

LEGEND Topography 0 Mincral tenure / Paved Road / Plight line
1' Gravel Road (2WD)
/ Rough Road (4WD)
/ W,t,,",
/ contour (lorn intnval)
AIRBORNE MAG SURVEY
Mila Property
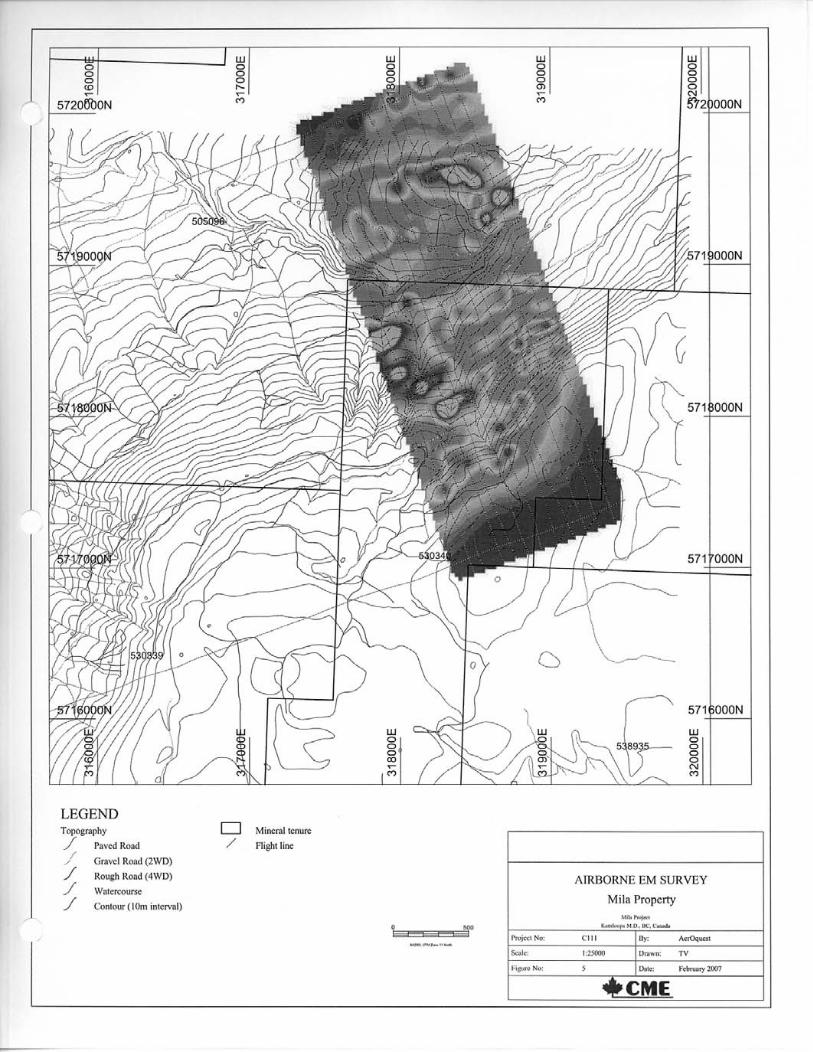
LEGEND To~ogra~hy 0 Mineral tenure / Paved Road / Flight l i e
. Gravel Road (2WD) / Rough Road (4WD)
/ Watercourse
/ Contour(1Om interval)
AIRBORNE EM SURVEY
Mila Property

The purpose of this survey was to obtain a geophysical signature over the rocks which host significant copper mineralization (1 1.28 metres of 0.34%). This could then be applied to the 1989 Goldbank airborne geophysical survey which covers the entire Mila property.
An intepretaion of the dataset was not undertaken by Aeroquest.
6.0 CONCLUSIONS
The Mila Mineral Claim covers historical showings that have returned impressive drilling results from east-west trending mineralized stratigraphic horizons from the eastern portion of the property.
The helicopter-borne geophysical survey prodcued high quality data that must be intetpreted with strong geological input. It is recommended to synthesis geological and geochemic a1 data from past regional geological mapping, prospecting and diamond drilling programs.
The results of this intepretaion should be applied to the 1989 Goldbank airborne geophysical survey, which covers the entire Mila property.
7.0 REFERENCES
Belik, G. 1973. Geology of the Harper Creek Copper Deposit, unpublished B.Sc. thesis,
University of British Columbia, Vancouver, BC, Canada.
Campbell and Tipper, 197 1. Geology of the Bonaparte Lake Map-area, British Columbia, Geological Survey
of Canada, Memoir 363.
Christopher, P. 1988. Report on the JAR and MILA Claims, unpublished report for Goldbank Ventures
Ltd.
Naas, C.O. 2004. Assessment Report, Prospecting, Rock Sampling and Soil Sampling on the Reg 1-
3 and Mila 9, 10 and 12 Claims 2005. Assessment Report, Sampling on the Mila Mineral Claims
Naas, C.O. and Neale, T. 1991. Report on the 199011991 Phase I and I1 Geological, Geochemical, Geophysical
and Diamond Drilling Exploration of the Mila Project, unpublished report for Goldbank Ventures Ltd. (3 volumes).

Schiarizza, P. 1985. Geology of the Eagle Bay Formation between the Raft and Baldy Batholiths
(82M5, 1 1, 1 2); in: Geological Fieldwork 1 985; Ministry of Energy Mines and Petroleum Resources Paper 1986- 1, p. 89-94.
Schiarizza P., and Preto V.A. 1987. Geology of the Adams Plateau-Cleanvater-Vavenby Area, British Columbia
Ministry of Energy Mines and Petroleum Resources Paper 1987-2. 1984. Geology of the Adams Plateau-Cleanvater Area, British Columbia Ministry of
Energy Mines and Petroleum Resources Prelim. Map 56.

8.0 STATEMENT OF QUALIFICATIONS
I, Christopher 0. Naas, P. Geo., do hereby certify that:
I am a member in good standing of the Association of Professional Engineers and Geoscientists of British Columbia (Registration Number 20082); I am a graduate in geology of Dalhousie University (B.Sc., 1984); and have practiced in my profession continuously since 1987; Since 1987, I have been involved in mineral exploration for precious andlor base metals in Canada, United States of America, Chile, Venezuela, Ghana, Mali, Nigeria, and Democratic Republic of the Congo (Zaire); for diamonds in Venezuela; and for rare metals in Nigeria. I have also been involved in the determination of base metal and gold resources for properties in Canada and Ghana, respectively, and the valuation of properties in Canada and Equatorial Guinea. I am presently a Consulting Geologist and have been so since November 1987; The opinions and conclusions contained herein are based on a review of previous records and the results of the exploration program conducted by myself;
Dated at Richmond, BC, Canada, this 3 1" day of January, 2007.
Christopher 0. Naas

9.0 STATEMENT OF COSTS
Personnel
Chris Naas Larry Cri t t enden
Equipment Costs
Truck
Disbursements
0.50 day @ $412.50 1.0 days @ $250.00
1.0 days @ 115.00
Room & Board
Fuel
Helicopter mobilization/demobilization
Helicopter-borne geophysical survey (35.3 km @ l2Ykm)
TOTAL: $7,153.75

APPENDIX I
Aeroquest Limited's Logistics Report

- Report on a Helicopter-Borne AeroTEM II Electromagnetic
& Magnetometer Survey
Aeroquest Job # 05105 Clearwater, BC 082M12152162
for
CME Managing Consultants Inc. 2130 - 21331 Gordon Way
Richmond B.C. Canada V6W-1 J9 (604) 248-2993
- A EROQUEST LIMITED 4-845 Main Street East Milton, Ontario, L9T 323
Tel: (905) 693-9129 Fax: (905) 693-9128 - www.aeroquestsurveys.com
June. 2006

Report on a Helicopter-Borne AeroTEM II Electromagnetic and Magnetic Survey
Aeroquest Job # 05105 Clearwater, BC O82M 1 2/52/62
for
CME Managing Consultants Inc. 21 30 - 21 331 Gordon Way
Richmond B.C. Canada V6W-1 J9 (604) 248-2993
- AEROQUEST LIMITED 4-845 Main Street East Milton, Ontario, L9T 323
Tel: (905) 693-9129 Fax: (905) 693-91 28 www.aeroquestsuweys.com
June, 2006

EAEROQUEST LIMITED 845 Main St . East . Unit #4 Milton . Ontario . Canada L9T 323
1 . TABLE OF CONTENTS
................................................................................................................. 1 . TABLE OF CONTENTS 1 ........................................................................................................................... 1.1. List of Figures 1
................................................................................................................................ 1.2. Appendices 2 ............................................................................................................ 1.3. List of Maps (1 : 10, 000) 2
2 . INTRODUCTION ........................................................................................................................... 3 3 . SURVEY AREA .............................................................................................................................. 3
.................................................................... 4 . SURVEY SPECIFICATIONS AND PROCEDURES 4 4.1. Navigation ................................................................................................................................ 5
.............................................................................................................................. 4.2. System Drift 5 .......................................................................................................... 4.3. Field QAIQC Procedures 5
.................................................................................................... 5 . AIRCRAFT AND EQUIPMENT 6 ...................................................................................................................................... 5.1. Aircraft 6
........................................................................................................................... 5.2. Magnetometer 7 .
............................................................................................................ 5.3. Electromagnetic System 7 ............................................................................................... 5.4. AERODAS Acquisition System 9
......................................................................................... 5.5. RMS DGR-33 Acquisition System 10 .................................................................................................... 5.6. Magnetometer Base Station 10
....................................................................................................................... 5.7. Radar Altimeter 11 .................................................................................. 5.8. Video Tracking and Recording System 11
.......................................................................................................... 5.9. GPS Navigation System 11 ..................................................................................................... 5.10. Digital Acquisition System 12
................................................................................................................................. 6 . PERSONNEL 12 .......................................................................................................................... 7 . DELIVERABLES 12
........................................................................... 8 . DATA PROCESSING AND PRESENTATION 13 8.1. BaseMap ................................................................................................................................. 13
............................................................................................. 8.2. Flight Path & Terrain Clearance 13 .............................................................................................................. 8.3. Electromagnetic Data 14
......................................................................................................................... 8.4. Magnetic Data 14
......................................................................................................................... 9 . General Comments 16
1 . 1. List of Figures . ................... Figure 1 . Regional location map of the project area Survey block location outlined in red 3
....................................................................................................... Figure 2 . Harper Creek survey block 4 Figure 3 . Survey helicopter C-GVDE ...................................................................................................... 6
..................................................... Figure 4 . The magnetometer bird (A) and AeroTEM I1 EM bird (B) 7 Figure 5 . AeroTEM I1 Instrument Rack ................................................................................................... 8
............................................................... Figure 6 . Schematic of Transmitter and Receiver waveforms 11 .................................................................. Figure 7 . AeroTEM response to a 'thin' vertical conductor 16
............................................................... Figure 8 . AeroTEM response for a 'thick' vertical conductor 17 .............................................................. Figure 9 . AeroTEM response over a 'thin' dipping conductor 17
Aeroquest Limited . Report on an AeroTEM II Airborne Geophysical Survey 1

845 Main St. East. Unit #4 Milton. Ontario. Canada L9T 323
1.2. Appendices
Appendix 1 : Survey Block Co-ordinates Appendix 2: Description of Database Fields Appendix 3 : Anomaly listing Appendix 4: Technical Paper: "AeroTEM Design Considerations" Appendix 5: Instrumentation Specification Sheet
1.3. List of Maps (1:10,000)
Map 1: Coloured total magnetic field with contours, flight path and EM anomaly picks Map 2: Plan profiles of Z-component (5-1 5) EM channels and EM anomaly picks Map 3: Coloured early time Z-component channel 5 and EM anomaly picks * Three plates per Map
Aeroquest Limited - Report on an AeroTEM 11 Airborne Geophysical Survey 2

=AEROQUEST LIMITED bi',, . . . , A. , - . . I, 1 .. . / 3
r 2. INTRODUCTION
This report describes a helicopter-borne geophysical survey carried out on behalf of CME Managing Consultants Inc. on the Harper Creek project in the Clearwater area, BC.
The principal geophysical sensor is Aeroquest's exclusive AeroTEM I1 time domain helicopter electromagnetic system which is employed in conjunction with a high-sensitivity cesium vapour magnetometer. Ancillary equipment includes a real-time differential GPS navigation system, radar altimeter, video recorder, and a base station magnetometer. Full-waveform streaming EM data is recorded at 38,400 samples per second. The streaming data comprise the transmitted waveform, and the X component and Z component of the resultant field at the receivers. A secondary acquisition system (RMS) records the ancillary data.
The total line kilometres flown are totaled at 1132.8 krn. The survey flying described in this report took place May 31d - loth, 2006.
3. SURVEY AREA
I . . . . .
Figure 1. Regional location map of the project area. Survey block location outlined in rr
Aeroquest Limited - Report on an AeroTEMll Airborne Geophysical Suwey 3

GAEROQUEST LIMITED , ' . . , 3 : f ! . ,. . - 3 , - : , I
The survey block was located approximately 40km east-northeast of Clearwater, BC. The area is accessible via several logging roads running through the block.
The field crew was based at the Clearwater Lodge in Clearwater, BC. The helicopter was provided by Hi-wood helicopters, Calgary, Alberta.
The Harper Creek project area (Figure 2) may be located on NTS 1:20,000 map sheet 082M12152162. Appendix 1 provides a tabulation of the UTM comer co-ordinates for the survey area.
4. SURVEY SPECIFICATIONS AND PROCEDURES
The survey specifications are summarized in the following table:
Aeroquest Limited - Report on an AeroTEM II Airborne Geophysical Survey 4
Survey Block
Nicanex
Harper Creek
Line Spacing (m)
100
100,200
Line direction
N-S (340")
N-S (340")
Survey Coverage (line-km)
35.3
1097.4
Dates Flown
May 9'4 2006 May 3rd - loth,
2006

EAEROQUEST LlMlTED 845 Main St. East, Unit #4 Milton, Ontario. Canada L9T 323
The survey coverage was calculated by adding up the along-line distance of the survey lines and control (tie) lines as presented in the final Geosoft database. The control (tie) lines were flown perpendicular to the survey lines with a spacing of 1000m.
The nominal EM bird terrain clearance is 30m, but in areas of rugged terrain and where tall trees are present, the terrain clearance is more typically 40 m to 45 m for safety considerations. The magnetometer sensor is located in a smaller bird connected to the tow rope 17 metres above the EM bird(Figure 7). Nominal survey speed over relatively flat terrain is 75 kmlhr but is significantly lower in rougher terrain. Scan rates for ancillary data acquisition is 0.1 second for the magnetometer and altimeter, and 0.2 second for the GPS determined position. The EM data is acquired as a data stream at a sampling rate of 38,400 samples per second and is processed to generate final data at 10 samples per second. The 10 samples per second translates to a geophysical reading about every 1.5 to 2.5 metres along the flight path.
4.1. Navigation
Navigation is carried out using a GPS receiver, an AGNAV2 system for navigation control, and an RMS DGR-33 data acquisition system which records the GPS coordinates. The x-y-z position of the aircraft, as reported by the GPS, is recorded at 0.2 second intervals. The system has a published accuracy of under 3 metres. A recent static ground test of the Mid-Tech WAAS GPS yielded a standard deviation in x and y of under 0.6 metres and for z under 1.5 metres over a two-hour period.
4.2. System Drift
Unlike frequency domain electromagnetic systems, the AeroTEM I1 system has negligible drift due to thermal expansion. The operator is responsible for ensuring the instrument is properly warmed up prior to departure and that the instruments are operated properly throughout the flight. The operator maintains a detailed flight log during the survey noting the times of the flight and any unusual geophysical or topographic features. Each flight included at least two high elevation 'background' checks. During the high elevation checks, an internal 5 second wide calibration pulse in all EM channels was generated in order to ensure that the gain of the system remained constant and within specifications.
4.3. Field QAIQC Procedures
On return of the pilot and operator to the base, usually after each flight, the AeroDAS streaming EM data and the RMS data are carried on removable hard drives and Flashcards, respectively and transferred to the data processing work station. At the end of each day, the base station magnetometer data on Flashcard is retrieved from the base station unit.
Data verification and quality control includes a comparison of the acquired GPS data with the flight plan; verification and conversion of the RMS data to an ASCII format XYZ data file; verification of the base station magnetometer data and conversion to ASCII format XYZ data; and loading, processing and conversion of the steaming EM data from the removable hard drive. All data is then merged to an ASCII XYZ format file which is then imported to an Oasis database for further QAIQC and for the production of preliminary EM, magnetic contour, and flight path maps.
Aeroquest Limited - Report on an AeroTEM II Airborne Geophysical Survey 5

F- Survey lines which show excessive deviation from the intended flight path are re-flown. Any line or portion of a line on which the data quality did not meet the contract specification was noted and reflown.
5. AIRCRAFT AND EQUIPMENT
5.1. Aircraft
A Eurocopter (Aerospatiale) AS350B2 "A-Star" helicopter - registration C-GPTY was used as survey platform (Figure 3). The helicopter was owned and operated by Hi-Wood helicopters, Calgary, Alberta. The survey aircraft was flown at a nominal terrain clearance of 328 ft (100 m).
Aeroquest Limited - Report on an AeroTEM II Airborne Geophysical Survey 6

EAEROQUEST LIMITED B,,.. ' .>~C, -1, 1 3 : 1.1 , . 3 I , . ' 2 ,
5.2. Magnetometer The Aeroquest airborne survey system employs the Geometrics G-823A cesium vapour magnetometer sensor installed in a two metre towed bird airfoil attached to the main tow line, 17 metres below the helicopter. The sensitivity of the magnetometer is 0.001 nanoTesla at a 0.1 second sampling rate. The nominal ground clearance of the magnetometer bird is 121 metres (397 ft.). The magnetic data is recorded at lOHz by the RMS DGR-33.
5.3. Electromagnetic System The electromagnetic system is an Aeroquest AeroTEM I1 time domain towed-bird system. The current AeroTEM transmitter dipole moment is 38.8 kNIA. The AeroTEM bird is towed 38 m (125 ft) below the helicopter. More technical details of the system may be found in Appendix 4.
Aeroquest Limited - Report on an AeroTEM II Airborne Geophysical Survey 7

/- The wave-form is triangular with a symmetric transmitter on-time pulse of 1.10 ms and a base frequency of 150 Hz. The current alternates polarity every on-time pulse. During every Tx on-off cycle (300 per second), 128 contiguous channels of raw x and z component (and a transmitter current monitor, itx) of the received waveform are measured. Each channel width is 26.04 microseconds starting at the beginning of the transmitter pulse. This 128 channel data is referred to as the raw streaming data. The AeroTEM system has two separate EM data recording streams, the conventional RMS DGR-33 and the AeroDAS system which records the full waveform.
Figure 5. AeroTEM II Instrument Rack
Aeroquest Limited - Report on an AeroTEM II Airborne Geophysical Survey 8

r 5.4. AERODAS Acquisition System
The 128 channels of raw streaming data are recorded by the AeroDAS acquisition system onto a removable hard drive. The streaming data are processed post-survey to yield 33 stacked and binned on-time and off-time channels at a 10 Hz sample rate. The timing of the final processed EM channels is described in the following table:
1 I Cl...., P-n&
3 ON 27 4 ON 28 5 ON 29 6 ON 30 7 ON 3 1 8 ON 32 9 ON 33
10 ON 34 11 ON 35 12 ON 36 13 ON 37 14 ON 38 15 ON 39 16 ON 40 0 OFF 44 1 OFF 45 2 OFF 46 3 OFF 47
10 OFF 11 OFF 12 OFF 13 OFF 14 OFF 15 OFF 16 OFF
Width 3
Aeroquest Limited - Report on an AeroTEM II Airborne Geophysical Survey 9
845 Main St. East. Unit #4 Milton, Ontario. Canada L9T 323
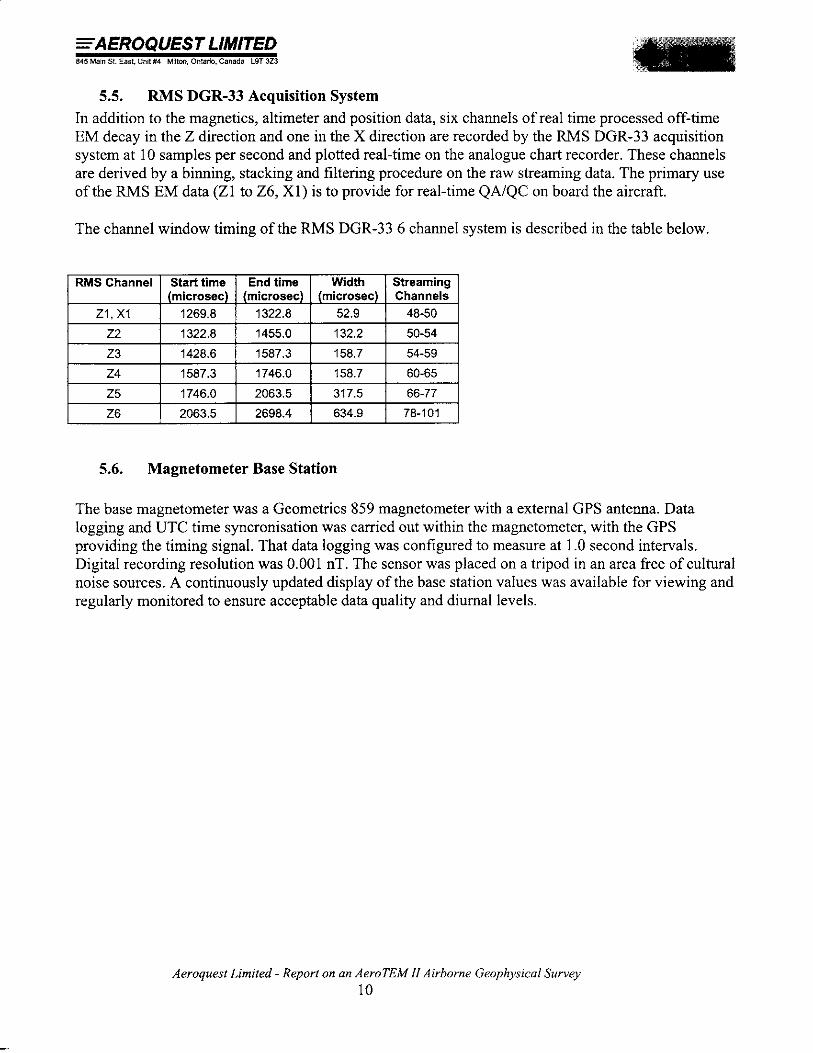
5.5. RMS DGR-33 Acquisition System In addition to the magnetics, altimeter and position data, six channels of real time processed off-time EM decay in the Z direction and one in the X direction are recorded by the RMS DGR-33 acquisition system at 10 samples per second and plotted real-time on the analogue chart recorder. These channels are derived by a binning, stacking and filtering procedure on the raw streaming data. The primary use of the RMS EM data (Z1 to 26, X1) is to provide for real-time QAIQC on board the aircraft.
The channel window timing of the RMS DGR-33 6 channel system is described in the table below.
5.6. Magnetometer Base Station
The base magnetometer was a Geometrics 859 magnetometer with a external GPS antenna. Data logging and UTC time syncronisation was carried out within the magnetometer, with the GPS providing the timing signal. That data logging was configured to measure at 1.0 second intervals. Digital recording resolution was 0.001 nT. The sensor was placed on a tripod in an area free of cultural noise sources. A continuously updated display of the base station values was available for viewing and regularly monitored to ensure acceptable data quality and diurnal levels.
RMS Channel
Z1, XI
Aeroquest Limited - Report on an AeroTEM II Airborne Geophysical Survey 10
Width (microsec)
52.9
Streaming Channels
48-50
Start time (microsec)
1269.8
End time (microsec)
1322.8

FAEROQUEST LIMITED a, L . e . , ., ..: ,! -, -n,>-. , I , . .' ,!,
16 On-time Channels
17 Off-time Channels
High Conductance Response
'LOW Conductance Response -1' . . . .... . .. . . . . - -. . - . . -. . igure 6. Schematic of Transmitter and Receiver waveforms
5.7. Radar Altimeter
3' Time (ins)
150Hz
A Terra TRA 3500lTRI-30 radar altimeter is used to record terrain clearance. The antenna was mounted on the outside of the helicopter beneath the cockpit. The recorded data represents the height of the antenna, i.e. helicopter, above the ground. The Terra altimeter has an altitude accuracy of +I- 1.5 metres.
5.8. Video Tracking and Recording System A high resolution colour digital video camera is used to record the helicopter ground flight path along the survey lines. The video is digitally annotated with GPS position and time and can be used to verify ground positioning information and cultural causes of anomalous geophysical responses.
5.9. GPS Navigation System The navigation system consists of an Ag-Nav Incorporated AG-NAV2 GPS navigation system comprising a PC-based acquisition system, navigation software, a deviation indicator in front of the aircraft to direct the flight, a full screen display with controls in front of the operator, a Mid-Tech RX400p WAAS-enabled GPS receiver mounted on the instrument rack and an antenna mounted on the magnetometer bird. WAAS (Wide Area Augmentation System) consists of approximately 25 ground reference stations positioned across the United States that monitor GPS satellite data. Two master stations, located on the east and west coasts, collect data from the reference stations and create a GPS correction message. This correction accounts for GPS satellite orbit and clock drift plus signal delays
.- caused by the atmosphere and ionosphere. The corrected differential message is then broadcast through one of two geostationary satellites, or satellites with a fixed position over the equator. The
Aeroquest Limited - Report on an AeroTEMN Airborne Geophysical Survey 11

FAEROQUEST LIMITED 845 Main St. East. Unit #4 Milton. Ontario. Canada L9T 323
corrected position has a published accuracy of under 3 metres. A recent static ground test of the Mid- Tech WAAS GPS yielded a standard deviation in x and y of under 0.6 metres and for z under 1.5 metres over a two-hour period.
Survey co-ordinates are set up prior to the survey and the information is fed into the airborne navigation system. The co-ordinate system employed in the survey design was WGS84 [World] using the UTM zone 11N projection. The real-time differentially corrected GPS positional data was recorded by the RMS DGR-33 in geodetic coordinates (latitude and longitude using WGS84) at 0.2 second intervals.
5.10. Digital Acquisition System The AeroTEM received waveform sampled during on and off-time at 128 channels per decay, 300 times per second, was logged by the proprietary AeroDAS data acquisition system. The channel sampling commences at the start of the Tx cycle and the width of each channel is 26.04 microseconds. The streaming data was recorded on a removable hard-drive and was later backed-up onto DVD-ROM from the field-processing computer.
The RMS Instruments DGR33A data acquisition system was used to collect and record the analogue data stream, i.e. the positional and secondary geophysical data, including processed 6 channel EM, magnetics, radar altimeter, GPS position, and time. The data was recorded on 128Mb capacity Flashcard. The RMS output was also directed to a thermal chart recorder.
6. PERSONNEL
The following AeroQuest personnel were involved in the project: Manager of Operations: Bert Simon Field Operators: Raf Starmach Manager of Processing: Jonathan Rudd . Field Data Processors: Sean Scrivens . Data Interpretation and Reporting: Sean Scrivens
The survey pilot Remi Fashanu was employed directly by the helicopter operator - Hi-Wood Helicopters.
7. DELIVERABLES
The report includes 3 geophysical maps (3 plates each) plotted at a scale of 1 : 10,000.
Map 1 : Coloured total magnetic field with contours, flight path and EM anomaly picks Map 2: Plan profiles of Z-component (5-1 5) EM channels and EM anomaly picks Map 3: Coloured early time Z-component channel 5 and EM anomaly picks
The coordinate/projection system for the maps is NAD83 Universal Transverse Mercator Zone 11N (for Canada; Central America; Mexico; USA (ex Hawaii Aleutian Islands)). For reference, the latitude
Aeroquest Limited - Report on an AeroTEM 11 Airborne Geophysical Survey 12

=A ERQQUEST LIMITED 845 Main St. East. Unit #4 Milton. Ontario. Canada L9T 323
and longitude in NAD83 are also noted on the maps. All the maps show flight path trace, skeletal topography, and conductor picks represented by an anomaly symbol classified according to calculated on-time conductance. The anomaly symbol is accompanied by postings denoting the calculated on- time conductance, a thick or thin classification and an anomaly identifier label. The anomaly symbol legend is given in the margin of the maps. The magnetic field data is presented as superimposed line contours with a minimum contour interval of 1 5 nT. Bold contour lines are separated by 1 OOI5OO nT.
The geophysical profile data is archived digitally in a Geosoft GDB binary format database. The database contains the processed streaming data, the RMS data, the base station data, and all processed channels. A description of the contents of the individual channels in the database can be found in Appendix 3. This digital data is archived at the Aeroquest head office in Milton.
8. DATA PROCESSING AND PRESENTATION
All in-field and post-field data processing was carried out using Aeroquest proprietary data processing software, and Geosoft Oasis montaj software. Maps were generated using 42-inch wide Hewlett Packard 4000ps ink-jet plotters.
8.1. Base Map The geophysical maps accompanying this report are based on positioning in the datum of NAD83 The survey geodetic GPS positions have been projected using the Universal Transverse Mercator projection in Zone 11N. A summary of the map datum and projection specifications are as follows:
. Ellipse: GRS 1980 . Ellipse major axis: 6378 137m eccentricity: 0.08 18 19 19 1 . Datum: North American 1983 - Canada Mean . Datum Shifts (x,y,z) : 0, 0, 0 metres . Map Projection: Universal Transverse Mercator Zone 1 1N (Central Meridian 1 17OW) . Central Scale Factor: 0.9996 . False Easting, Northing: 500,00Om, Om
The skeletal topography was derived from the Federal Government's 1: 50,000 NTS map series.
8.2. Flight Path & Terrain Clearance The position of the survey helicopter was directed by use of the Global Positioning System (GPS). Positions were updated five times per second (5Hz) and expressed as WGS84 latitude and longitude calculated from the raw pseudo range derived from the CIA code signal. The instantaneous GPS flight path, after conversion to UTM co-ordinates, is drawn using linear interpolation between the x/y positions. The terrain clearance was maintained with reference to the radar altimeter. The raw Digital Terrain Model (DTM) was derived by taking the GPS survey elevation and subtracting the radar altimeter terrain clearance values. The calculated topography elevation values are relative and are not tied in to surveyed geodetic heights.
Aeroquest Limited - Report on an AeroTEM II Airborne Geophysical Survey 13

845 Main St. East, Unit #4 Milton, Ontario. Canada L9T 323
Each flight included at least two high elevation 'background' checks. During the high elevation checks, an internal 5 second wide calibration pulse in all EM channels was generated in order to ensure that the gain of the system remained constant and within specifications.
8.3. Electromagnetic Data
The raw streaming data, sampled at a rate of 38,400 Hz (128 channels, 300 times per second) was reprocessed using a proprietary software algorithm developed and owned by Aeroquest Limited. Processing involves the compensation of the X and Z component data for the primary field waveform. Coefficients for this compensation for the system transient are determined and applied to the stream data. The stream data are then pre-filtered, stacked, binned to the 33 on and off-time channels and checked for the effectiveness of the compensation and stacking processes. The stacked data is then filtered, leveled and split up into the individual line segments. Further base level adjustments may be carried out at this stage.
The final field processing step was to merge the processed EM data with the other data sets into a Geosoft GDB file. The EM fiducial is used to synchronize the two datasets. The processed channels are mergered into 'array format; channels in the final Geosoft database as Zon, Zoff, Xon, and Xoff
The filtering of the stacked data is designed to remove or minimize high frequency noise that can not be sourced fkom the geology. Apparent bedrock EM anomalies were interpreted with the aid of an auto-pick from positive peaks and troughs in the on-time Z channel responses correlated with X channel responses. The auto-picked anomalies were reviewed and edited by a geophysicist on a line by line basis to discriminate between thin and thick conductor types. Anomaly picks locations were migrated and removed as required. This process ensures the optimal representation of the conductor centres on the maps.
At each conductor pick, estimates of the off-time conductance have been generated based on a horizontal plate source model for those data points along the line where the response amplitude is sufficient to yield an acceptable estimate. Some of the EM anomaly picks do not display a tau value; this is due to the inability to properly define the decay of the conductor usually because of low signal amplitudes. Each conductor pick was then classified according to a set of seven ranges of calculated off-time conductance values. For high conductance sources, the on-time conductance values may be used, since it provides a more accurate measure of high-conductance sources. Each symbol is also given an identification letter label, unique to each flight line. Conductor picks that did not yield an acceptable estimate of off-time conductance due to a low amplitude response were classified as a low conductance source. Please refer to the anomaly symbol legend located in the margin of the maps.
8.4. Magnetic Data Prior to any leveling the magnetic data was subjected to a lag correction of -0.1 seconds and a spike removal filter. The filtered aeromagnetic data were then corrected for diurnal variations using the magnetic base station and the intersections of the tie lines. No corrections for the regional reference field (IGRF) were applied. The corrected profile data were interpolated on to a grid using a random grid technique with a grid cell size of 25 metres. The final leveled grid provided the basis for threading the presented contours which have a minimum contour interval of 10 nT.
Aeroquest Limited - Report on an AeroTEM II Airborne Geophysical Survey 14
=A EROQUEST LIMITED 845 Main St. East, Unit #4 Milton, Ontario, Canada L9T 323
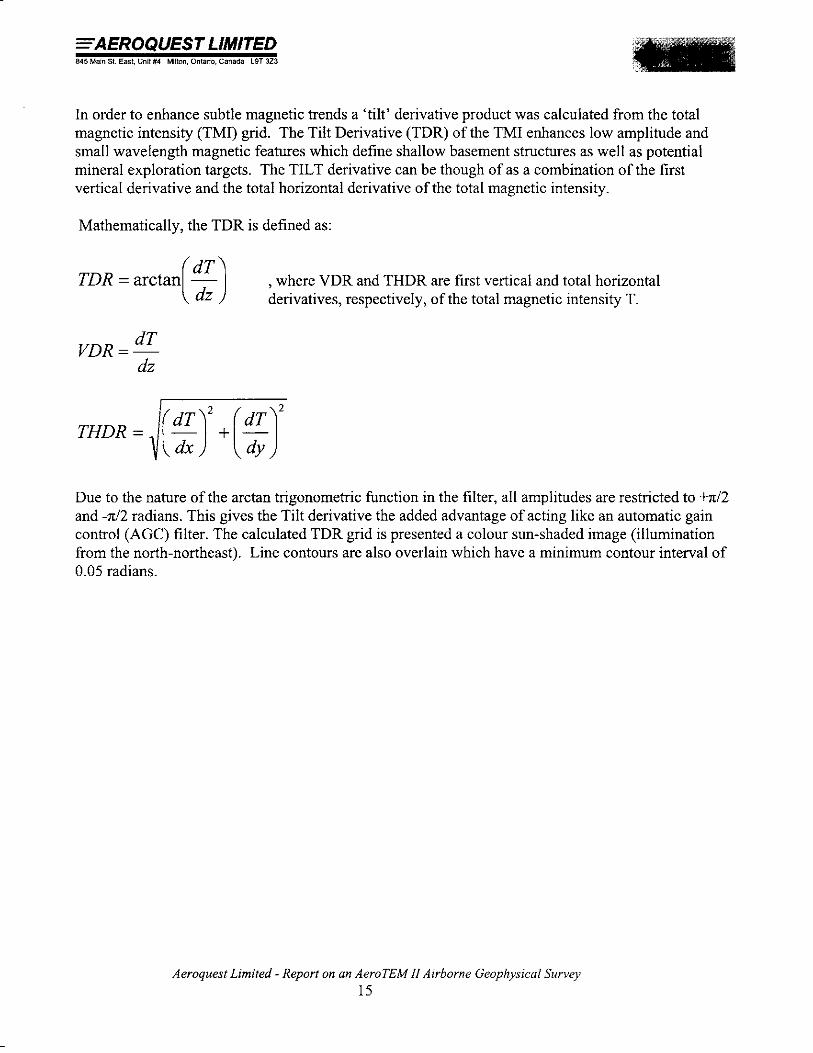
In order to enhance subtle magnetic trends a 'tilt' derivative product was calculated from the total magnetic intensity (TMI) grid. The Tilt Derivative (TDR) of the TMI enhances low amplitude and small wavelength magnetic features which define shallow basement structures as well as potential mineral exploration targets. The TILT derivative can be though of as a combination of the first vertical derivative and the total horizontal derivative of the total magnetic intensity.
Mathematically, the TDR is defined as:
, where VDR and THDR are first vertical and total horizontal derivatives, respectively, of the total magnetic intensity T.
dT VDR = -
2
THDR = /(%,' + (2) Due to the nature of the arctan trigonometric function in the filter, all amplitudes are restricted to W2 and -7d2 radians. This gives the Tilt derivative the added advantage of acting like an automatic gain control (AGC) filter. The calculated TDR grid is presented a colour sun-shaded image (illumination from the north-northeast). Line contours are also overlain which have a minimum contour interval of 0.05 radians.
Aeroquest Limited - Report on an AeroTEM II Airborne Geophysical Survey 15

r 9. General Comments
The survey was successful in mapping the magnetic and conductive properties of the geology throughout the survey area. Known conductive sources in the area are due to regional geological structures.
The EM anomalies on the maps are classified by conductance (as described earlier in the report) and also by the thickness of the source. A thin, vertically orientated source produces a double peak anomaly in the z-component response and a positive to negative crossover in the x-component response (Figure 7). For a vertically orientated thick source (say, greater than lorn), the response is a single peak in the z-component response and a negative to positive crossover in the x-component response (Figure 8). Because of these differing responses, the AeroTEM system provides discrimination of thin and thick sources and this distinction is indicated on the EM anomaly symbols (N = thin and K = thick). Where multiple, closely spaced conductive sources occur, or where the source has a shallow dip, it can be difficult to uniquely determine the type (thick vs. thin) of the source (Figure 9). This occurs on the southern margin of the central magnetic high. In these cases both possible source types may be indicated by picking both thick and thin response styles. For shallow dipping conductors the 'thin' pick will be located over the edge of the source, whereas the 'thick' pick will fall over the downdip 'heart' of the anomaly.
10
h
2 5
V
w In
0 g In
2 Distance (m) -5
-1 0
-1 5 Conductance 50 S
Figure 7. AeroTEM response to a 'thin' vertical conductor.
Aeroquest Limited - Report on an AeroTEM I1 Airborne Geophysical Survey 16

EAEROQUEST LIMITED 0 a l l . I ( - 5 , , . , ,' < . , . ,,
Length 300 m
Width 300 m Thickness 50 m
Depth 50 m Conductance 50 S
\ Dip 900
DISTANCE (rn)
u Figure 8. AeroTEM response for a 'thick' vertical conductor.
40
Length 300 m 30 Width 300 m
20 - Conductance 50 S In . % - 10 w V) Z
g 0 3
-10 - DISTANCE (m)
-20 -
-30 A
Figure 9. AeroTEM response over a 'thin' dipping conductor.
Aeroquest Limited - Report on an AeroTEM II Airborne Geophysical Survey 17

=A EROQUEST LlMITED 845 Main St. East. Unit #4 Milton, Ontario, Canada L9T 323
All cases should be considered when analyzing the interpreted picks and prioritizing for follow-up. Specific anomalous responses which remain as high priority should be subjected to numerical modeling prior to drill testing to determine the dip, depth and probable geometry of the source.
Respectfully submitted,
Sean Scrives, H.BSc. Aeroquest Limited May, 2006
Aeroquest Limited - Report on an AeroTEM 11 Airborne Geophysical Survey 18

=A EROQUEST LIMITED 845 Main St. East. Unit #4 Milton. Ontario. Canada L9T 323
APPENDIX 1 - PROJECT CORNER COORDINATES
The Harper Creek project consists of 2 individual survey blocks with boundaries as defined in the following table. All geophysical data presented in this report have been windowed to this outline. Positions are in UTM Zone 1 1N - NAD83.
Harper Creek Main (1 00m) Nicanex (1 00m) 200m Lines (200m) 301607.8 5717850.1 3 17423.8 5719872.4 30983 1.6 5717540.2 30983 1.6 5717540.2 3 18382.4 5720222.5 310528.7 5717515.3 3 12346.4 5710691.5 3 19409.2 5717396.3 3 12423.4 5712330.0 3 12260.4 5708280.5 318424.2 5717033.0 312346.4 5710691.5 302362.0 5708623.9 301348.9 571 1307.2
Tie Lines (1000m) Extensions (200m) 301544.4 5716320.0 310694.5 5717519.1 305483.4 5717710.4 311621.3 5717516.0 310528.7 5717515.3 312641.4 5715018.2 3 18360.5 5720280.6 312493.8 5712543.5 318416.7 5720130.1 3 10053.4 5717034.4 3 10624.4 5715467.7
Aeroquest Limited - Report on an AeroTEM 11 Airborne Geophysical Survey 19
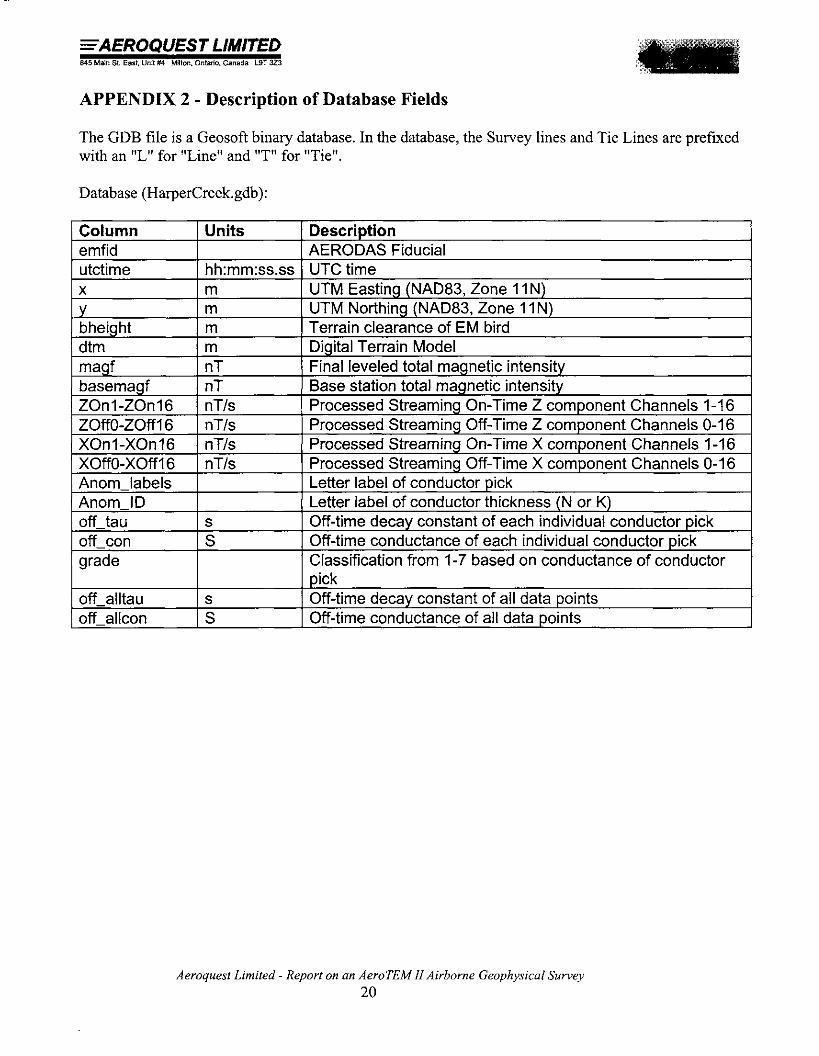
APPENDIX 2 - Description of Database Fields
The GDB file is a Geosoft binary database. In the database, the Survey lines and Tie Lines are prefixed with an "L" for "Line" and "T" for "Tie".
Database (HarperCreek.gdb):
Column emfid utctime x Y bheight dtm maaf
Units
basemagf ZOnl-ZOnl6 ZOffO-ZOff I 6 XOn 1 -XOn 16 XOffO-XOff I 6 Anom-la bels Anom-ID off-tau
I I I pick I
Description AERODAS Fiducial
hh:mm:ss.ss m m m m nT
off-con grade
UTC time UTM Easting (NAD83, Zone 11 N) UTM Northing (NAD83, Zone 11 N) Terrain clearance of EM bird Digital Terrain Model Final leveled total magnetic intensitv
nT nT/s nT/s nT/s nTls
s
Aeroquest Limited - Report on an AeroTEM II Airborne Geophysical Survey 20
Base station total magnetic intensity Processed Streaming On-Time Z component Channels 1-1 6 Processed Streaming Off-Time Z component Channels 0-1 6 Processed Streaming On-Time X component Channels 1-1 6 Processed Streaming Off-Time X component Channels 0-16 Letter label of conductor pick Letter label of conductor thickness (N or K) Off-time decav constant of each individual conductor pick
S
off-alltau off allcon
Off-time conductance of each individual conductor pick Classification from 1-7 based on conductance of conductor
s S
Off-time decay constant of all data points Off-time conductance of all data ~o ints
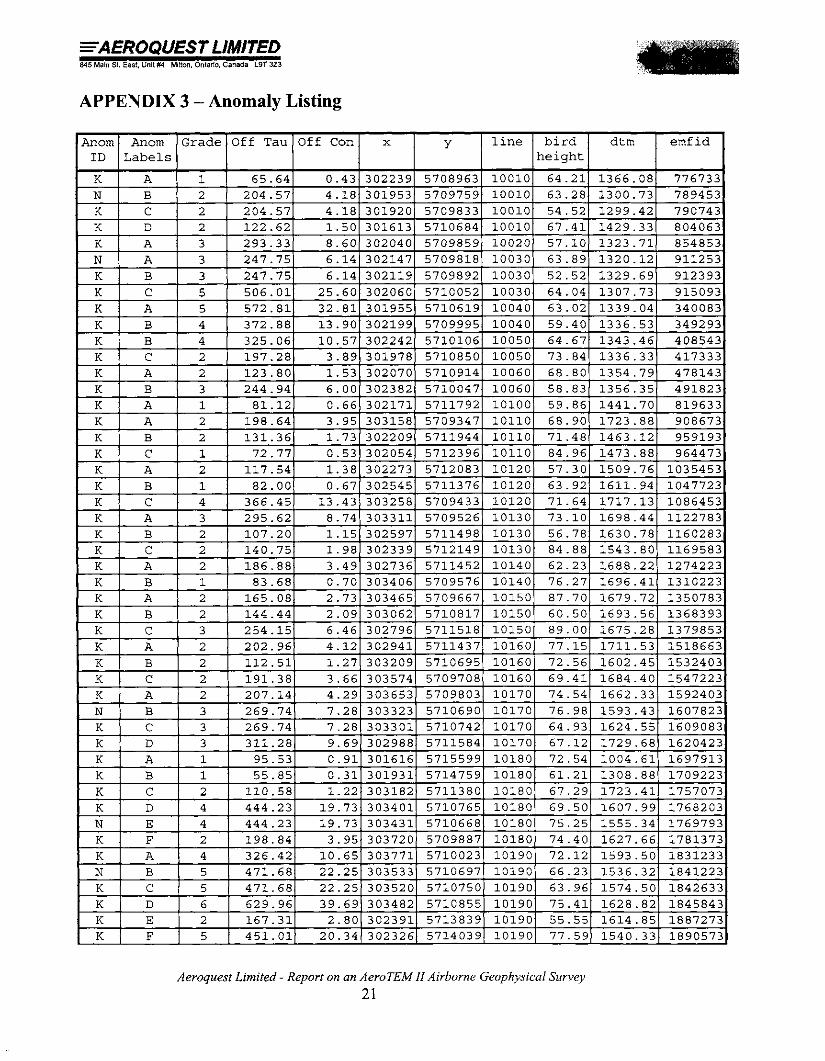
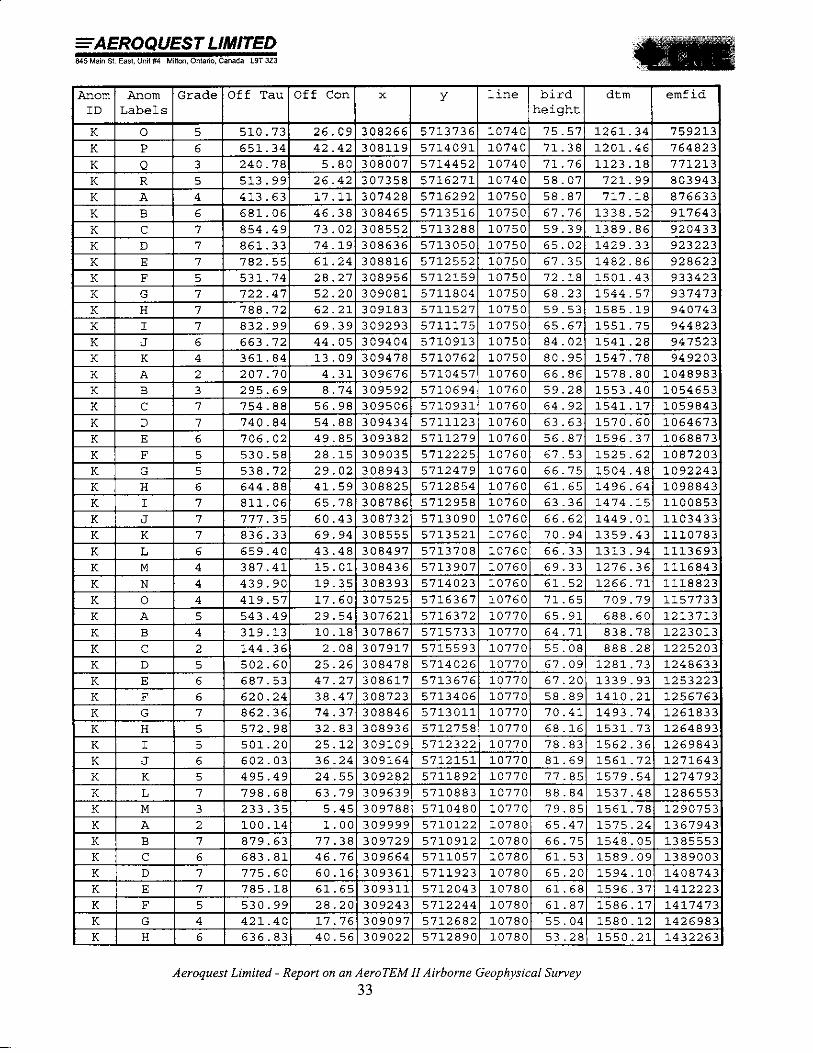
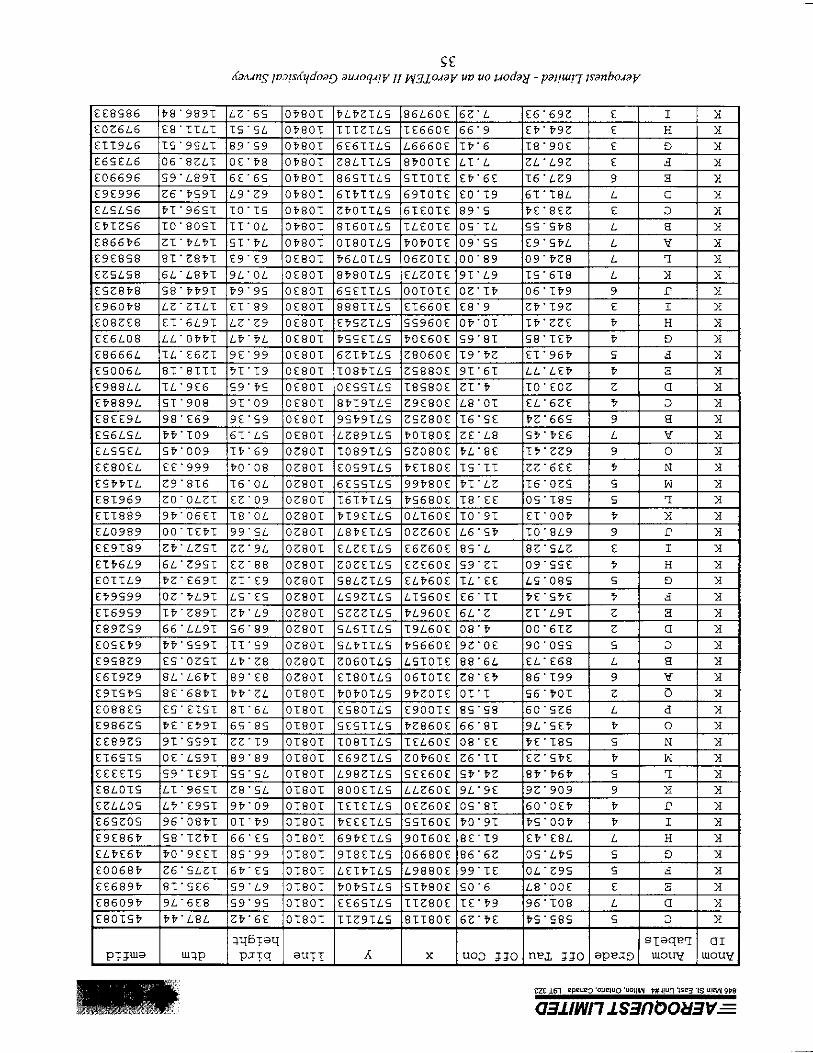
APPENDIX 3 - Anomaly Listing
Anom Grade Off Tau Off Con x ";~L,be,sI I I 1 y 1 line / bird 1 dtm 1 emf id
height
Aeroquest Limited - Report on an AeroTEM 11 Airborne Geophysical Survey 21

F A EROQUEST LIMITED 845 Main St. East. Unit #4 Milton, Ontario, Canada L9T 323
Anom Anom Grade Off Tau Off Con x Y line bird ID Labels height
Aeroquest Limited - Report on an AeroTEM II Airborne Geophysical Survey

EAEROQUEST LIMITED 845 Main St. East, Unit #4 Milton. Ontario, Canada L9T 323
h
Anom Anom Grade Off Tau Off Con x Y line bird dtm emf id ID Labels height
Aeroquest Limited - Report on an AeroTEM 11 Airborne Geophysical Survey 24

=A EROQUES T LIMITED 845 Main St. East. Unit #4 Milton, Ontario, Canada L9T 323
Anom Anom Grade Off Tau Off Con x Y line bird dtm emf id ID Labels height
Aeroquest Limited - Report on an AeroTEM 11 Airborne Geophysical Survey

=A ERQQUEST LIMITED 845 Main St. East. Unit #4 Milton, Ontario, Canada L9T 323
Anom Anom Grade Off Tau Off Con x Y line bird dtm emfid ID Labels height
Aeroquest Limited - Report on an AeroTEM II Airborne Geophysical Survey 26

FAEROQUES T LIMITED 845 Main St. East, Unit #4 Milton. Ontario, Canada L9T 323
I ~ n o m 1 Anom 1 ~ r a d e 1 off ~ a u 1 off con 1 x I Y I line I bird I dtm I emfid I ID Labels height
K L 2 193 .56 3 .75 305030 5717095 10550 57 .78 563 .77 1231113
Aeroquest Limited - Report on an AeroTEM II Airborne Geophysical Survey 27

=A EROQUEST LIMlTED 845 Main St. East. Unit #4 Milton, Ontario, Canada L9T 323
Anom Anom Grade Off Tau Off Con ID Labels
line 1 d t m emf id
Aeroquest Limited - Report on an AeroTEM II Airborne Geophysical Survey 28

845 Main St. East, Unit #4 Milton. Ontario, Canada L9T 323
Anom 1 Anom 1 Grade 1 Off Tau 1 Off Con 1 x I y I line I bird I dtm I emfid 1 ID 1 Labels 1 1 height 1
Aeroquest Limited - Report on an AeroTEM 11 Airborne Geophysical Survey

=A EROQUEST LlMlTED 845 Main St. East. Unit #4 Milton, Ontario. Canada L9T 323
Anom Anom Grade Off Tau Off Con x Y l i n e b i r d dtm emf i d I D Labels height
K T 6 6 2 8 . 2 5 3 9 . 4 7 306438 5 7 1 6 1 8 1 10650 5 2 . 3 2 6 7 3 . 1 0 959943 K U 6 6 8 9 . 7 8 4 7 . 5 8 306344 5716409 10650 5 8 . 9 9 6 5 8 . 1 0 965703
Aeroquest Limited - Report on an AeroTEM 11 Airborne Geophysical Survey 30

=A EROQUEST LIMITED 845 Main St. East. Unit #4 Milton. Ontario. Canada L9T 323
Aeroquest Limited - Report on an AeroTEM 11 Airborne Geophysical Survey 3 1
Y line dtm bird height
Off Con Off Tau Anom ID
emf id x Anom Labels
Grade

=A EROQUES T LIMITED 845 Main St. East, Unit #4 Milton. Ontario, Canada L9T 323
Anom Grade Off Tau Off Con x I I y I line 1 bird I dtm I emfid A ~ ~ m l L a b e l s l 1 height
Aeroquest Limited - Report on an AeroTEM 11 Airborne Geophysical Survey 32
F A EROQUEST LlMlTED 845 Main St. East. Unit #4 Milton, Ontario, Canada L9T 323
Anom Anom Grade Off Tau Off Con x Y line bird dtm emf id ID Labels height
Aeroquest Limited - Report on an AeroTEM II Airborne Geophysical Survey 33

=A ERQQUEST LIMITED 845 Main St. East. Unit #4 Milton, Ontario, Canada L9T 323
A n o m G r a d e O f f Tau O f f C o n Y l L a b e , , , s I I e m f i d
Aeroquest Limited - Report on an AeroTEM II Airborne Geophysical Survey
66'9 EP' P ~ Z E H X TP'6 T8'9OE E 3 X LT'L ZL' L9Z E d X OE' P8
ZPOTTLS 8T60TLS
89's PE'8EZ E 3 >f:
OS'TL SS'SP8 L 8 )I
09'51s E9'SPL L V X
ELZOTE OOTOTE ET660E
PSSETLS 6ZTPTLS
OESSTLS ZT'P TO' €02 Z U X L8'0T EL'6ZE P 3 X
EE80EL EE'999 ESPPTL Z9'8T6
T8'EE OS'T8S S 7I X T0'9T ET'OOP P X X L6'SP T0'8L9 9 r X
ELZETLS ZOZETLS
LS'ES SZZZTLS SL6TTLS
€95829 ES'OZST E6T9Z9 8LqL6PT
PP'ZL POPOTLS S6 ' POT
N P
SP'PZ 8P'P6P S 'T X 9 L S 9 E 92'909 9 )I X OS'8T 6O'OEP P .I? X
8 6 - 6 2 OS'LPS S 3 X 99'TE OL'Z9S S d X
POPSTLS

Aeroquest Limited - Report on an AeroTEM 11 Airborne Geophysical Survey 36
line x bird height
Y Off Tau Grade Anom ID
Off Con Anom Labels
dtm emf id

845 Main St. East. Unit #4 Milton, Ontario, Canada L9T 323
Anom Anom Grade Off Tau Off Con x Y line bird dtm emfid ID Labels height
Aeroquest Limited - Report on an Aero TEM II Airborne Geophysical Survey 37

=AEROQUEST LIMlTED 845 Main St. East. Unit #4 Milton, Ontario. Canada L9T 323
Anom Anom Grade Off Tau Off Con ID Labels
bird height I 1 ine
Aeroquest Limited - Report on an AeroTEM 11 Airborne Geophysical Survey 38

ESSP8TT E8ZT8TT E6ZLLTT ET6ZLTT E08S9TT E968STT E069PTT E5TLETT E8PTETT E06SZTT
8 Z S P P 6 8L.698 6E'SPL Z8'8P9 LT'PTS
ELOTZTT EZELTTT EZ6PTTT
ST'8PP EZ'9TS ST.999 TT'9SL 66'068
ESZ9LOT ESPTLOT EZL890T EETL.907: EL6P90T
TO'S9 P 9 - 1 9 00'8L 09'€9 1 2 - 9 9
6g9'TL6 69'266 SS'OPOT
EOPLL6 EZOOP6 EPTTE6
T8'88 6L.89 0P.69 ZS'69 SS'S9
90'90PT LT'S9PT Z0'69PT L6'99PT ET'T9PT
€26826 E8EZZ6
OTOTT OTOTT OTOTT OTOTT OTOTT
OL'L9 ZL'08 08'69
EO'ZEPT ZT-TSOT 88.588
EPPET6 E6LS06 ET9E68
OTOTT 000TT 000TT 000TT 000TT
TL'L9 8L'LS SL'T9 SL'T9 S8'E9
ZZ'SP8 96'LOL
E6TSL8 EPOZL8
6L6STLS OST9TLS OLE9TLS 8999TLS T8TLTLS
000TT 000TT 000TT
TO'LL 9 T - 2 9 2 2 - 0 9
OL'8ZS ZL'OSP 6 T m 0 0 S
€26898 €82998 EP8T98
E09LTLS SSTLTLS Z8S9TLS OSZ9TLS TL6STLS
000TT 000TT 000TT 000TT 000TT
5 5 - 8 5 6P'L9
OZ'ZPL 86'T6L
E06Z6L EZOO6L EPTL8L E6098L E6008L
9SEOTE 69ZOTE 9LTOTE POTOTE S8860E
PZLSTLS PTSSTLS Z9ESTLS
0660T 0660T 06607:
22.29 8 5 - 2 8 6
95.168 LE'T96 8E'gPOT
€25869 EZLE69
69L60E Z6L60E TTOOTE PTTOTE 6ZZOTE
6E8ZTLS 9PSZTLS S6EZTL.S P6ZZTLS ESTZTLS
0660T 06601
SL'Z8 T0'68
ZL'8ZPT OT'SPPT ZT'06PT L6'TOST EP'8ZST
€85269 E8T069
PS'ET 68-97: 9P"TT 0 T - 9 ZS'TT
9TEOTE 06EOTE ZSPOTE
PZ9ZTLS ZEESTLS P98STLS
0660T 0660T T860T
99'9L TS'09 9P'OL
6E'8EST 8S'TZST
€62259 EPS8P9
€0'5 25'8 OL'E 98'6 66'9E
OLETTE E9PTTE TZSTTE P9STTE OZ9TTE
PL6STLS LLL9TL.S
T860T T860T
E9'L9 T9'EL OE'9S OT'9S LO'P9
8E'POST ZP'SPPT
EE6SP9 EL9TP9 EL6LT9 EESET9 ETZ8SS
86'LgE ZO'TTP OS'8EE T6 ' 9PZ EP'6EE
PS'6 L6'6T EO'TE
OPETTE 9SEOTE ELTOTE
SZOLTLS 99LLTLS 8SZLTLS
T860T T860T T860T
12.89 9 T S 6 S
ZT'SPOT ES'PL6
OE'PZZ Z8"C6Z TP'Z6T P6'ETE 6T.809
6 T S 9 P 86'29 SO'LS 98'ST EE'ZT
8ZTOTE T8660E
T609TLS 968STLS
08607: 0860T 0860T 08601 08607:
€9'95 PO'Z8
TL-006 08'208 SE'88P P6'8PP 06'TZ8
P P P E P
E8'80E T6'9PP TO'LSS
TE'8Z 8E'EP OP'P9
SPL60E 9ZS60E 6P560E
OPLSTLS E09STLS 69ESTLS
OL60T OL60T
EP'TL ET'P9
E E Z E 9
99'6L9 Tg'E6L TE'SSL LZ'86E LT'TSE
66'SP OL'S
P9660E EPOOTE
69SZTLS ELEZTLS Z9TZTLS P60ZTL.S L69TTLS
OL60T OL60T
09'PL 8E'TL T6'TL L6'LL ZT'T8
d 3
a 3 8
E P S
60'ZES S9'8S9 6P.208
99'E 00'9 95'9
9600TE PPTOTE ZEZOTE
E09TTLS ETOZTLS
OL60T OL60T
X X X X X
V Id 7I
X L‘
9 L L P P
LT'8L9 TL'8EZ
ZZ'8E 8 S S 6 P
PLZTTE 6ZETTE POPTTE EEPTTE OLSTTE
P60ZTLS T8ZZTLS
OL60T OL60T OL60T OL60T Z960T
)I
X X X X
I H 3
S 9 L
TP'T6T 98 ' PPZ 60'9SZ
S6'T9 6S'LS 90'ZE
96PTTE ZPETTE
OLESTLS 6LSSTLS
X X X
d 3
a 3 8
9 E
6 T a 8 T 9 PT'POL
8 8 - 1 9 P8'TS 9L'TS 9L'TS 92'0
9TETTE OSZTTE
OOLSTLS 9P6STLS T9ELTLS 9Z9LTLS 6009TLS
X X )I
X X
3 d 3
Z E E
ZT'L8L L8'8SL 02'99s
LP'O LE'ZZ
OETOTE 0900TE
X X X
a 3
9 9
Z9'98L EO'OZL TP'6TL TP'6TL 8O'TS
LE'ZZ ET'8S
OEOOTE OP660E TOP60E Z8Z60E Z6L60E
X X
8
V
d
L L S
5 2 - 8 9 86'ZLP
E8'8E EP'Z8
X X X
3
a
L L L L T
86'ZLP SP'Z9L
06'TTT 96'ZP 80'P ET'E 00's
X X
3 8
V
T S
ETSEZ9 Z6'L06
X X X
3
a 3 8
V
S L
Z8'LSOT LP'SS9 68'TOZ 26' 9LT 0s' €22
X X X N X
!2 I
9 L
X N
H 3
L 9 Z Z Z
X X
d 3
X X
a 3 8
V
3
X X X X X

845 Main St. East. Unit #4 Milton. Ontario. Canada L9T 323
Anom Grade Off Tau Off Con x A:~mI,a,e,sl 1 1 1 y I line I bird 1 dtm 1 emfid I
height
Aeroquest Limited - Report on an AeroTEM II Airborne Geophysical Survey 40

845 Main St. East. Unit #4 Milton. Ontario. Canada L9T 323
Anorn Grade Off Tau Off Con x I I I I I y 1 line I bird 1 dtrn 1 emfid Labels height
Aeroquest Limited - Report on an AeroTEM I . Airborne Geophysical Survey 41

=A EROQUEST LIMITED 845 Main St. East, Unit #4 Milton. Ontario, Canada L9T 323
Anom Anom Grade Off Tau Off Con x ID Labels
Y line bird height
emf id 7
Aeroquest Limited - Report on an AeroTEM II Airborne Geophysical Survey 42

EAEROQUEST LIMlTED 845 Main St. East, Unit #4 Milton, Ontario, Canada L9T 323
Anom Anom Grade Off Tau Off Con x Y line bird dtm emf id ID Labels height
Aeroquest Limited - Report on an AeroTEM II Airborne Geophysical Survey 43

EAEROQUEST LlMlT'D 845 Main St. East. Unit #4 Milton. Ontario. Canada L9T 323
Anom Grade Off Tau Off Con L a b I I
Aeroquest Limited - Report on an AeroTEM /I Airborne Geophysical Survey 44

=A EROQUEST LIMITED 845 Main St. East, Unit #4 Milton, Ontario, Canada L9T 323
Anom Anom Grade Off Tau Off Con x Y line bird dtm emfid ID Labels height
Aeroquest Limited - Report on an AeroTEM II Airborne Geophysical Survey 45

A n o m G r a d e O f f T a u O f f C o n YlLa , , l s / 1 1 e m f i d
Aeroquest Limited - Report on an AeroTEM II Airborne Geophysical Survey 46

r APPENDIX 4: AEROTEM DESIGN CONSIDERATIONS
Helicopter-borne EM systems offer an advantage that cannot be matched from a fixed-wing platform. The ability to fly at slower speed and collect data with high spatial resolution, and with great accuracy, means the helicopter EM systems provide more detail than any other EM configuration, airborne or ground-based. Spatial resolution is especially important in areas of complex geology and in the search for discrete conductors. With the advent of helicopter-bome high-moment time domain EM systems the fixed wing platforms are losing their only advantage -depth penetration.
Advantage I -Spatial Resolution
The AeroTEM system is specifically designed to have a small footprint. This is accomplished through the use of concentric transmitter-receiver coils and a relatively small diameter transmitter coil (5 m). The result is a highly focused exploration footprint, which allows for more accurate "mapping" of discrete conductors Consider the transmitter primary field images shown in Figure 1, for AeroTEM versus a fixed-wing transmitter.
- The footprint of AeroTEM at the earth's surface is The footprint of a fixed-wing system is roughly roughly 50m on either side of transmitter 150 m on either side of the transmitter
Figure 7. A comparison o f the footprint between AemTEM and a fixed-wing system, highlights the greater resolution that is achievable with a transmitter located closer to the earth's surface. The AeroTEM footprint i s one third that o f a fixed-wing system and i s symmetric, while the fixed-wing system has even lower spatial resolution along the flight line because of the separated transmitter and receiver configuration.
At first glance one may want to believe that a transmitter footprint that is distributed more evenly over a larger area is of benefit in mineral exploration. In fact, the opposite is true; by energizing a larger surface area, the ability to energize and detect discrete conductors is reduced. Consider, for example, a comparison between AeroTEM and a fixed-wing system over the Mesamax Deposit (1,450,000 tonnes of 2.1% Ni, 2.7% Cu, 5.2 glt PtIPd). In a test survey over three flight lines spaced 100 m apart, AeroTEM detected the Deposit on all three flight lines. The fixed-wing system detected the Deposit only on two flight lines. In exploration programs that seek to expand the flight line spacing in an effort to reduce the cost of the airborne survey, discrete conductors such as the Mesamax Deposit can go undetected. The argument often put forward in favor of using fixed-wing systems is that because of their larger footprint, the flight line spacing can indeed be widened. Many fixed-wing surveys are flown at 200 m or 400 m. Much of the survey work performed by Aeroquest has been to survey in areas that were previouslv flown at these wider line spacings. One of the reasons for AeroTEM's impressive discovery record has been the strategyof flying closely spaced lines and &ding all the discrete near-surface condu6tors. These higher resolution surveys are being flown within existing mining camps, areas that improve the chances of discovery.
Aeroquest Limited - Report on an AeroTEM II Airborne Geophysical Survey 47

Figure 2. Fixed-wing (upper) and AeroTEM (lower) comparison over the eastern limit of the Mesamax Deposit, a Ni- CU-PGE zone located in the Raglan nickel belt and owned by Canadian Royalties. Both systems detected the Deposit further to the west where it is closer to surface.
Aeroquest Limited - Report on an AeroTEMll Airborne Geophysical Survey 48

The small footprint of AeroTEM combined with the high signal to noise ratio (SIN) makes the system more suitable to r surveying in areas where local infrastructure produces electromagnetic noise, such as power lines and railways. In 2002
Aemquest flew four exploration properties in the Sudbury Basin that were under option by FNX Mining Company Inc. from lnco Limited. One such property, the Victoria Property, contained three major power line corridors.
The resulting AeroTEM survey identified all the known zones of Ni-CU-PGE mineralization, and detected a response between two of the major power line corridors but in an area of favorable geology. Three boreholes were drilled to test the anomaly, and all three intersected sulphide. The third borehole encountered 1.3% Ni, 6.7% Cu, and 13.3 glt TPMs over 42.3 ft. The mineralization was subsequently named the Powerline Deposit.
The success of AeroTEM in Sudbury highlights the advantage of having a system with a small footprint, but also one with a high SIN. This latter advantage is achieved through a combination of a high-moment (high signal) transmitter and a rigid geometry (low noise). Figure 3 shows the Powerline Deposit response and the response from the power line corridor at full scale. The width of power line response is less than 75 m.
Figure 3. The Powerline Deposit is located between two major power line corridors, which make EM surveying problematic. Despite the strong response from the power line, the anomaly from the Deposit i s clearly detected. Note the thin formational conductor located to the south. The only way to distinguish this response from that of two closely spaced conductors is by interpreting the X-axis coil response.
Aeroquest Limited - Report on an AeroTEM I1 Airborne Geophysical Survey 49

Advantage 2 - Conductance Discrimination r
The AeroTEM system features full waveform recording and as such is able to measure the on-time response due to high conductance targets. Due to the processing method (primary field removal), there is attenuation of the response with increasing conductance, but the AeroTEM on-time measurement is still superior to systems that rely on lower base frequencies to detect high conductance targets, but do not measure in the on-time.
The peak response of a conductive target to an EM system is a function of the target conductance and the EM system base frequency. For time domain EM systems that measure only in the off-time, there is a drop in the peak response of a target as the base frequency is lowered for all conductance values below the peak system response. For example, the AeroTEM peak response occurs for a 10 S conductor in the early off-time and 100 S in the late off-time for a 150 Hz base frequency. Because base freauencv and conductance form a linear relationship when considering the peak response of any EM syslem, a drop in base f;equency of 50% will double the conductance at which an EM system shows ils peak response. If the base freauencv were lowereo from 150 Hz to 30 Hz there would be a fivefold increase in conductance at which the peak response of An EM occurred.
However, in the search for highly conductive targets, such as pyrrhotite-related Ni-CU-PGM deposits, a fivefold increase in conductance range is a high price to pay because the signal level to lower conductance targets is reduced by the same factor of five. For this reason, EM systems that operate with low base frequencies are not suitable for general exploration unless the target conductance is more than 100 S, or the target is covered by conductive overburden.
Despite the excellent progress that has been made in modeling software over the past two decades, there has been little work done on determining the optimum form of an EM system for mineral exploration. For example, the optimum configuration in terms of geometry, base frequency and so remain unknown. Many geophysicists would argue that there is no single ideal configuration, and that each system has its advantages and disadvantages. We disagree.
When it comes to detecting and discriminating high-conductance targets, it is necessary to measure the pure inphase response of the target conductor. This measurement requires that the measured primary field from the transmitter be subtracted from the total measured response such that the secondary field from the target conductor can be determined. Because this secondary field is in-phase with the transmitter primary field, it must be made while the transmitter is turned on - and the transmitter current is changing. The transmitted primary field is several orders of magnitude larger than the secondary field. AeroTEM uses a bucking coil to reduce the primary field at the receiver coils. The only practical way of removing the primary field is to maintain a rigid geometry between the transmitter, bucking and receiver coils. This is the main design consideration of the AeroTEM airframe and it is the only time domain airborne system to have this
The off-time AeroTEM response for the 18 channel The on-time response assumlng 100% removal of the conflguratlon measured primary field.
Figure 4. The off-time and on-time response nomogram o f AeroTEM for a base frequency o f 150 Hz The on-time response i s much stronger for higher conductance targets and this i s why on-time measurements are more important than lower frequencies when considering high conductance targets in a resistive environment.
Aeroquest Limited - Report on an AeroTEM II Airborne Geophysical Survey 50

Advantage 3 - Multiple Receiver Coils r
AeroTEM employs two receiver coil orientations. The Z-axis coil is oriented parallel to the transmitter coil and both are horizontal to the ground. This is known as a maximum coupled configuration and is optimal for detection. The X-axis coil is oriented at right angles to the transmitter coil and is oriented along the line-of-flight. This is known as a minimum coupled configuration, and provides information on conductor orientation and thickness. These two coil configurations combined provide important information on the position, orientation, depth, and thickness of a conductor that cannot be matched by the traditional geometries of the HEM or fixed-wing systems. The responses are free from a system geometric effect and can be easily compared to model type curves in most cases. In other words. AeroTEM data is very easy to interpret. Consider, for example, the following modeled profile:
Figure 5. Measured (lower) and modeled (upper) AeroTEM responses are compared for a thin steeply dipping conductor. The resaonse is characterized by two w a k s in the Z-axis coil, and a cross-over in the X-axis coil that is centered between ;he two Z-axis peaks. Th; conductor dips toward the higher amplitude Z-axis peak. Using the X- axis cross-over is the only way of differentiating the Z-axis response from being two closely spaced conductors.
Aeroquest Limited - Report on an AeroTEM 11 Airborne Geophysical Survey 51

HEM versus AeroTEM r-
Traditional helicopter EM systems operate in the frequency domain and benefit from the fact that they use narrowband as opposed to wide-band transmitters. Thus all of the energy from the transmitter is concentrated in a few discrete frequencies. This allows the systems to achieve excellent depth penetration (up to 100 m) from a transmitter of modest power. The Aeroquest Impulse system is one implementation of this technology.
The AeroTEM system uses a wide-band transmitter and delivers more power over a wide frequency range. This frequency range is then captured into 16 time channels, the early channels containing the high frequency information and the late time channels containing the low frequency information down to the system base frequency. Because frequency domain HEM systems employ two coil configurations (coplanar and coaxial) there are only a maximum of three comparable frequencies per configuration, compared to 16 AeroTEM off-time and 12 AeroTEM on-time channels.
Figure 6 shows a comparison between the Dighem HEM system (900 Hz and 7200 Hz coplanar) and AeroTEM (Zaxis) from surveys flown in Raglan, in search of highly conductive Ni-CU-PGM sulphide. In general, the AeroTEM peaks are sharper and better defined, in part due to the greater SIN ratio of the AeroTEM system over HEM, and also due to the modestly filtered AeroTEM data compared to HEM. The base levels are also better defined in the AeroTEM data. AeroTEM filtering is limited to spike removal and a 5-point smoothing filter. Clients are also given copies of the raw, unfiltered data.
Figure 6. Comparison between Dighem HEM (upper) and AeroTEM (lower) surveys flown in the Raglan area. The AeroTEM responses appear to be more discrete, suggesting that the data is not as heavily filtered as the HEM data. The SIN advantage o f AeroTEM over HEM is about 5:l.
Aeroquest Limited is grateful to the following companies for permission to publish some of the data from their respective surveys: Wolfden Resources, FNX Mining Company Inc, Canadian Royalties, Nova West Resources, Aurogin Resources, Spectrem Air. Permission does not imply an endorsement of the AeroTEM system by these companies.
Aeroquest Limited - Report on an AeroTEMIl Airborne Geophysical Survey 52

=A EROQUEST LIMlTED 845 Main St. East, Unit #4 Milton, Ontario, Canada L9T 323
APPENDIX 5: AeroTEM Instrumentation Specification Sheet
Tel: + I 905 878-5616. Fax: + I 905 876-0193. Email: [email protected]
AEROTEM Helicopter Electromagnetic System
System Characteristics
Transmitter: Triangular Pulse Shape Base Frequency 150 Hz Tx On Time - 1,150 ps Tx Off Time - 2,183 ps Loop Diameter - 5 m Peak Current - 250 A Peak Moment - 38,800 NIA Typical Z Axis Noise at Survey Speed = 10 nT peak Sling Weight: 270 Kg Length of Tow Cable: 40 m Bird Survey Height: 30 m or less nominal
Receiver
Two Axis Receiver Coils (x, z) positioned at centre of transmitter loop
Display & Acquisition
PROTODAS Digital recording at 128 samples per decay curve at a maximum of 300 curves per second (26.455 ps channel width) RMS Channel Widths: 52.9J32.3, 158.7, 158.7, 317.5, 634.9 ps Recording & Display Rate = 10 readings per second. On-board display - six channels Z-component and one X-component
System Considerations
Comparing a fixed-wing time domain transmitter with a typical moment of 500,000 NIA flying at an altitude of 120 m with a Helicopter TDEM at 30 m, notwithstanding the substantial moment loss in the airframe of the fixed wing, the same penetration by the lower flying helicopter system would only require a sixty-fourth of the moment. Clearly the AeroTEM system with nearly 40,000 NIA has more than sufficient moment. The airframe of the fixed wing presents a response to the towed bird, which requires dynamic compensation. This problem is non-existent for AeroTEM since transmitter and receiver positions are fixed. The AeroTEM system is completely portable, and can be assembled at the survey site within half a day.
Aeroquest Limited - Report on an AeroTEM 11 Airborne Geophysical Survey 53


