fracture liaison service database commissioner's report 2019
TRANSCRIPT
Fracture Liaison Service Database Commissioner's report 2019
Data from January to December 2017March 2019
In association with Commissioned by
© Healthcare Quality Improvement Partnership 2018 2
Fracture Liaison Service Database Commissioner’s report 2019 Falls and Fragility Fracture Audit Programme
The Fracture Liaison Service Database (FLS-DB) is commissioned by the Healthcare Quality Improvement Partnership (HQIP) and managed by the Care Quality Improvement Department of the Royal College of Physicians (RCP) as part of the Falls and Fragility Fracture Audit Programme (FFFAP) alongside the National Hip Fracture Database (NHFD) and the National Audit of Inpatient Falls. FFFAP aims to improve the delivery of care for patients having falls or sustaining fractures through effective measurement against standards and feedback to providers.
Healthcare Quality Improvement Partnership
The Healthcare Quality Improvement Partnership (HQIP) is led by a consortium of the Academy of Medical Royal Colleges, the Royal College of Nursing and National Voices. Its aim is to promote quality improvement in patient outcomes, and in particular, to increase the impact that clinical audit, outcome review programmes and registries have on healthcare quality in England and Wales. HQIP holds the contract to commission, manage and develop the National Clinical Audit and Patient Outcomes Programme (NCAPOP), comprising around 40 projects covering care provided to people with a wide range of medical, surgical and mental health conditions. The programme is funded by NHS England, the Welsh Government and, with some individual projects, other devolved administrations and crown dependencies (www.hqip.org.uk/national-programmes).
The Royal College of Physicians
The Royal College of Physicians (RCP) is a registered charity that aims to ensure high-quality care for patients by promoting the highest standards of medical practice. It provides and sets standards in clinical practice, education and training, conducts assessments and examinations, quality assures external audit programmes, supports doctors in their practice of medicine, and advises the government, the public and the profession on healthcare issues. Citation for this report: Royal College of Physicians. Fracture Liaison Service Database Commissioner’s report 2019. London: RCP, 2019.
Copyright
All rights reserved. Applications for the copyright owner’s written permission to reproduce significant parts of this publication (including photocopying or storing it in any medium by electronic means and whether or not transiently or incidentally to some other use of this publication) should be addressed to the publisher. Brief extracts from this publication may be reproduced without the written permission of the copyright owner, provided that the source is fully acknowledged. Copyright © Healthcare Quality Improvement Partnership 2019 ISBN 978-1-86016-759-1 eISBN 978-1-86016-760-7 Royal College of Physicians 11 St Andrews Place Regent’s Park, London NW1 4LE www.rcplondon.ac.uk Registered Charity No 210508
© Healthcare Quality Improvement Partnership 2018 3
Acknowledgements
Thank you to all the Fracture Liaison Service (FLS) teams that have contributed data to the audit; without your considerable effort, this report would not have been possible.
Fracture Liaison Service Database team
Kassim Javaid, clinical lead Bonnie Wiles, project manager Naomi Vasilakis, project manager Rosie Dickinson, programme manager
Nuffield Department of Orthopaedics, Rheumatology and Musculoskeletal Sciences (NDORMS), University of Oxford
Anjali Shah, epidemiologist/biostatistician Rafael Pinedo-Villanueva, health economist
Fracture Liaison Service Database advisory group
Kate Bennet, AGILE Rachel Bradley, British Geriatrics Society Will Carr, Royal Osteoporosis Society Andrew Judge, University of Bristol Gavin Clunie, British Society for Rheumatology Clare Cockill, Royal College of Nursing Neil Gittoes, Society for Endocrinology Celia Gregson, University of Bristol Xavier Griffin, British Orthopaedic Association Debbie Janaway, Royal College of Nursing Tim Jones, Royal Osteoporosis Society David Stephens, Royal College of General Practitioners Michael Stone, Cardiff and Vale University Health Board Alison Smith, Falls and Fragility Fracture Audit Programme, patient panel representative Kathleen Briers, Falls and Fragility Fracture Audit Programme, patient panel representative Jacky Macleod-Bridge, Falls and Fragility Fracture Audit Programme, patient panel representative Opinder Sahota, British Geriatrics Society
Crown Informatics
The FLS-DB data collection webtool is provided by Crown Informatics (http://crowninformatics.com).
© Healthcare Quality Improvement Partnership 2018 4
Contents
Acknowledgements ...................................................................................................................................... 2
The current challenge for clinical commissioning groups managing fracture prevention ........................... 5
The solution – Fracture Liaison Services ...................................................................................................... 5
Key messages from the 2018 annual report ……………………………………………………………………………………………7
National guidance for local commissioning leads ........................................................................................ 8
Recommendations for commissioners and local health boards .................................................................. 8
Publicly available real-time data .................................................................................................................. 9
National performance against KPIs: summary ........................................................................................... 10
FLS performance ......................................................................................................................................... 11
Further information .................................................................................................................................... 18
References and bibliography ...................................................................................................................... 18
© Healthcare Quality Improvement Partnership 2018 5
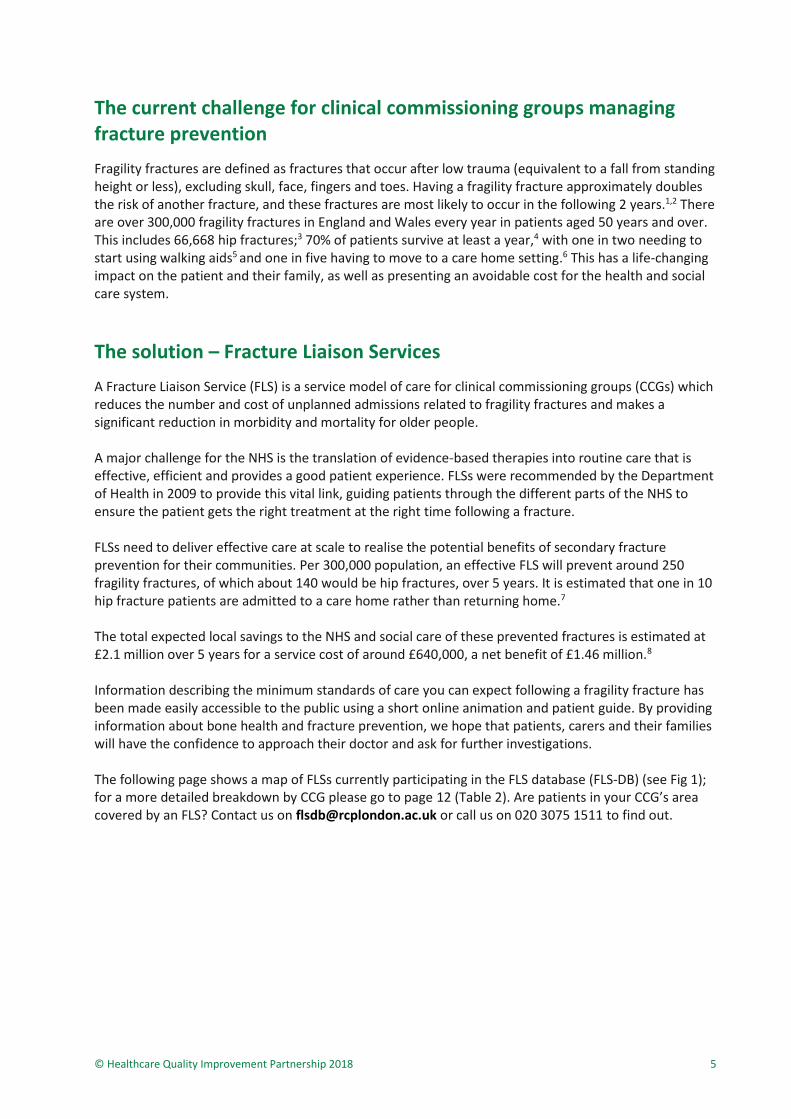
The current challenge for clinical commissioning groups managing fracture prevention
Fragility fractures are defined as fractures that occur after low trauma (equivalent to a fall from standing height or less), excluding skull, face, fingers and toes. Having a fragility fracture approximately doubles the risk of another fracture, and these fractures are most likely to occur in the following 2 years.1,2 There are over 300,000 fragility fractures in England and Wales every year in patients aged 50 years and over. This includes 66,668 hip fractures;3 70% of patients survive at least a year,4 with one in two needing to start using walking aids5 and one in five having to move to a care home setting.6 This has a life-changing impact on the patient and their family, as well as presenting an avoidable cost for the health and social care system.
The solution – Fracture Liaison Services
A Fracture Liaison Service (FLS) is a service model of care for clinical commissioning groups (CCGs) which reduces the number and cost of unplanned admissions related to fragility fractures and makes a significant reduction in morbidity and mortality for older people. A major challenge for the NHS is the translation of evidence-based therapies into routine care that is effective, efficient and provides a good patient experience. FLSs were recommended by the Department of Health in 2009 to provide this vital link, guiding patients through the different parts of the NHS to ensure the patient gets the right treatment at the right time following a fracture. FLSs need to deliver effective care at scale to realise the potential benefits of secondary fracture prevention for their communities. Per 300,000 population, an effective FLS will prevent around 250 fragility fractures, of which about 140 would be hip fractures, over 5 years. It is estimated that one in 10 hip fracture patients are admitted to a care home rather than returning home.7
The total expected local savings to the NHS and social care of these prevented fractures is estimated at £2.1 million over 5 years for a service cost of around £640,000, a net benefit of £1.46 million.8
Information describing the minimum standards of care you can expect following a fragility fracture has been made easily accessible to the public using a short online animation and patient guide. By providing information about bone health and fracture prevention, we hope that patients, carers and their families will have the confidence to approach their doctor and ask for further investigations. The following page shows a map of FLSs currently participating in the FLS database (FLS-DB) (see Fig 1); for a more detailed breakdown by CCG please go to page 12 (Table 2). Are patients in your CCG’s area covered by an FLS? Contact us on [email protected] or call us on 020 3075 1511 to find out.
© Healthcare Quality Improvement Partnership 2018 6
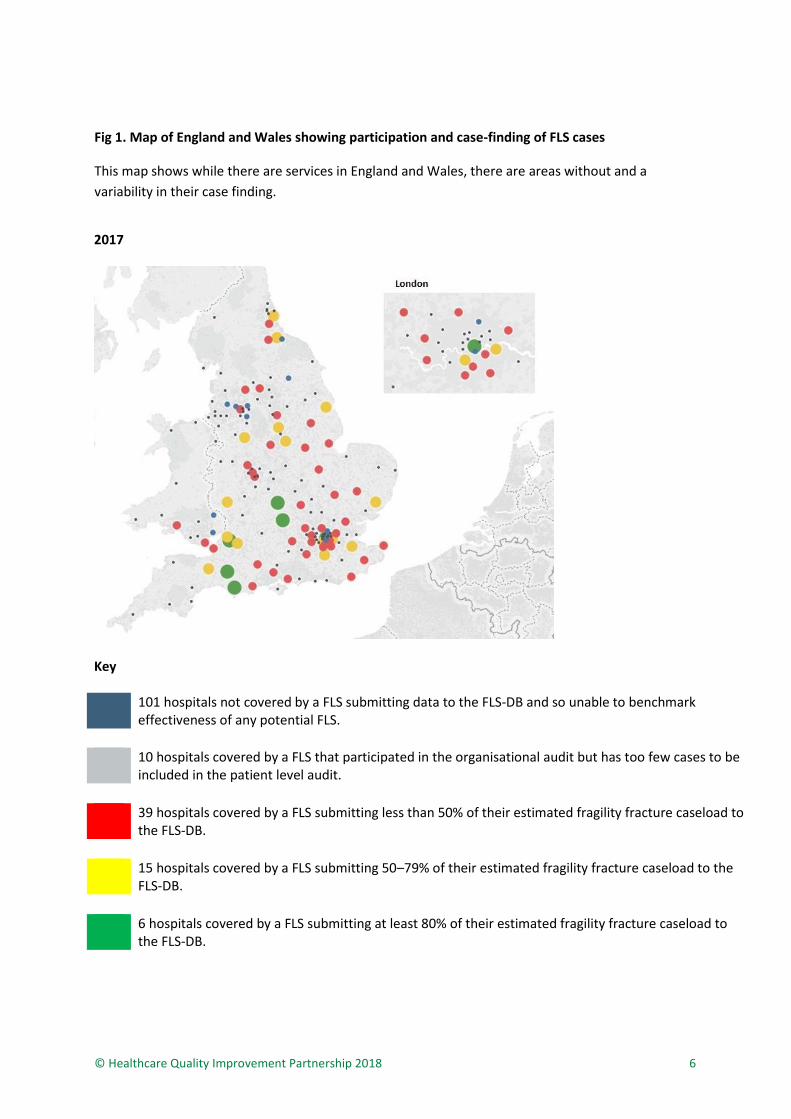
Fig 1. Map of England and Wales showing participation and case-finding of FLS cases
This map shows while there are services in England and Wales, there are areas without and a
variability in their case finding.
2017
Key 101 hospitals not covered by a FLS submitting data to the FLS-DB and so unable to benchmark
effectiveness of any potential FLS.
10 hospitals covered by a FLS that participated in the organisational audit but has too few cases to be included in the patient level audit.
39 hospitals covered by a FLS submitting less than 50% of their estimated fragility fracture caseload to the FLS-DB.
15 hospitals covered by a FLS submitting 50–79% of their estimated fragility fracture caseload to the FLS-DB.
6 hospitals covered by a FLS submitting at least 80% of their estimated fragility fracture caseload to the FLS-DB.
© Healthcare Quality Improvement Partnership 2018 7
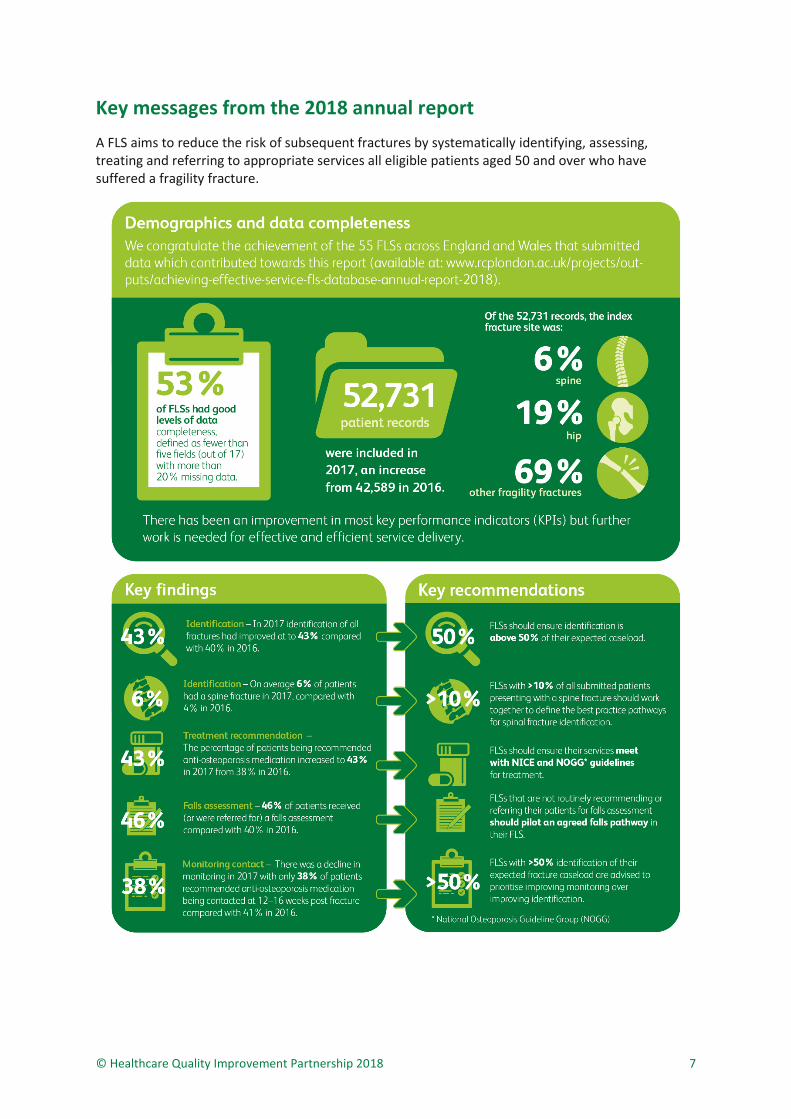
Key messages from the 2018 annual report
A FLS aims to reduce the risk of subsequent fractures by systematically identifying, assessing, treating and referring to appropriate services all eligible patients aged 50 and over who have suffered a fragility fracture.
© Healthcare Quality Improvement Partnership 2018 8
National guidance for local commissioning leads
Since 2015/16, improving recovery from fragility fractures has been included in the CCG Outcomes Indicator Set. In 2017, the National Falls Prevention Coordination Group, along with Public Health England (PHE), produced a falls and fracture consensus statement and resource pack with the aim of reducing falls and fracture risk and improving management of fractures, including secondary prevention. The guidance is aimed at local commissioning and strategic leads in England with a remit for falls, bone health and healthy ageing. Leading on from this, NHS RightCare, in collaboration with PHE and the Royal Osteoporosis Society (ROS), developed a Falls and Fragility Fractures Pathway which defines three priorities that commissioners responsible for falls and fragility fractures should deliver: 1. falls prevention 2. detecting and managing osteoporosis 3. optimal support after a fragility fracture.
Recommendations for commissioners and local health boards
Local commissioners and FLSs should use this report to improve the effectiveness in post-fracture care delivery through service improvement and/or additional commissioning to reduce the number of preventable subsequent fragility fractures. 1. Identify the secondary fracture prevention services available in your area.
2. If you do commission a FLS you should:
a. work with the local champion(s) to align the key performance indicators (KPIs) for your
FLS(s) with the 11 KPIs that are detailed on page 10 of this report, to reduce duplication and
improve transparency
b. review the FLSs performance and prioritise the improvement of KPIs with less than 50% case
attainment and review the commissioning of additional services to enable the FLS to
improve.
3. If you do not commission a FLS you should:
a. quantify the impact of effective secondary fracture prevention in your local population to
inform priority commissioning of FLSs, with support from the ROS and NHS RightCare
b. identify and engage with your local clinical champions and the ROS ([email protected]) to
co-develop a specification for a sustainable and effective FLS to prevent further avoidable
fractures and their significant consequences for your local patients.
© Healthcare Quality Improvement Partnership 2018 9
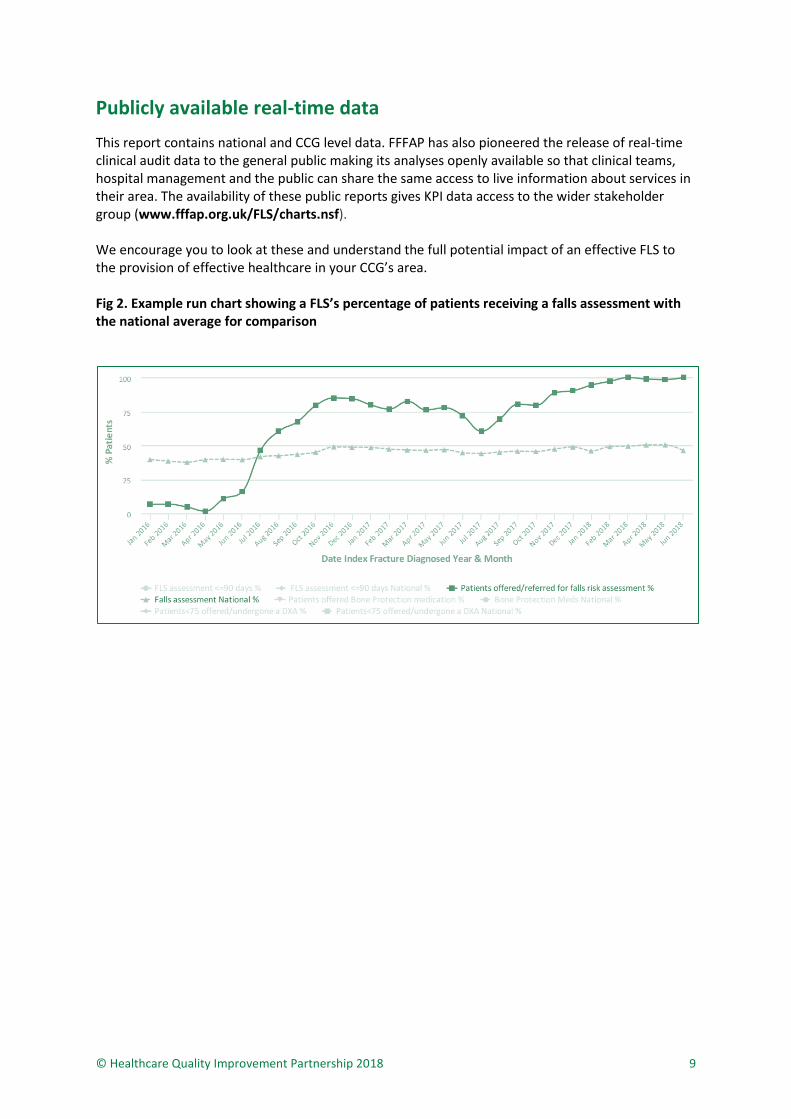
Publicly available real-time data
This report contains national and CCG level data. FFFAP has also pioneered the release of real-time clinical audit data to the general public making its analyses openly available so that clinical teams, hospital management and the public can share the same access to live information about services in their area. The availability of these public reports gives KPI data access to the wider stakeholder group (www.fffap.org.uk/FLS/charts.nsf). We encourage you to look at these and understand the full potential impact of an effective FLS to the provision of effective healthcare in your CCG’s area. Fig 2. Example run chart showing a FLS’s percentage of patients receiving a falls assessment with the national average for comparison
© Healthcare Quality Improvement Partnership 2018 10
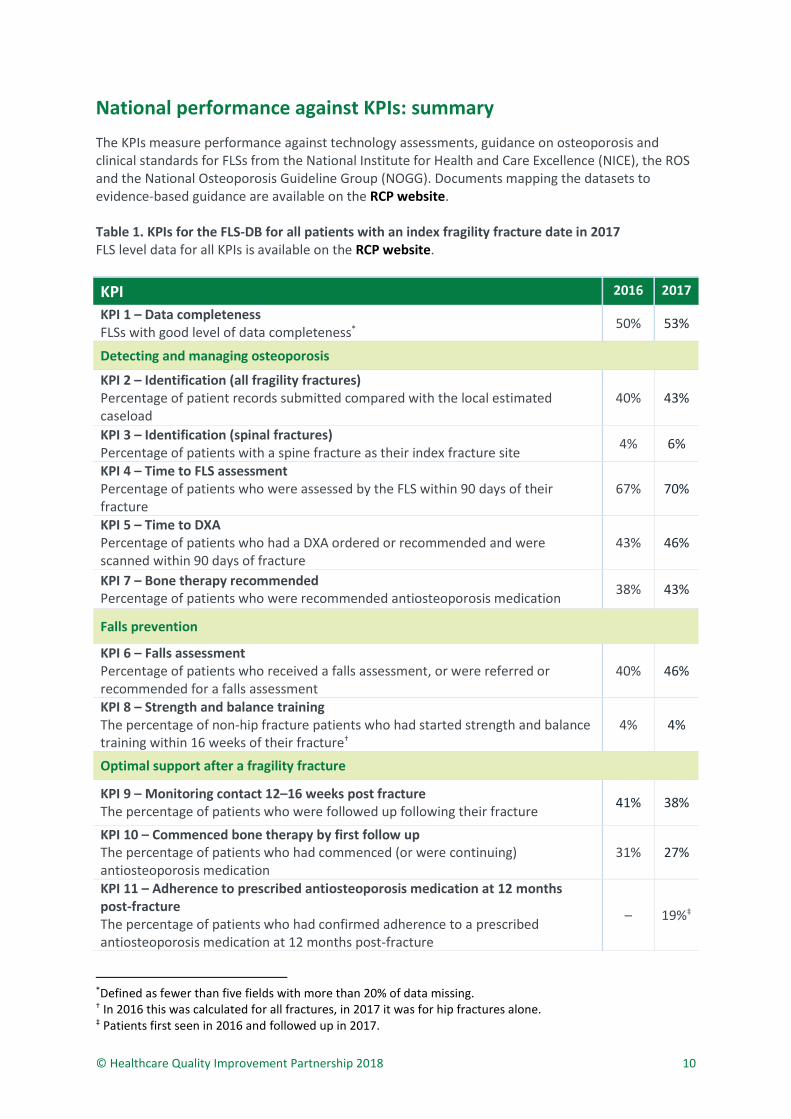
National performance against KPIs: summary
The KPIs measure performance against technology assessments, guidance on osteoporosis and clinical standards for FLSs from the National Institute for Health and Care Excellence (NICE), the ROS and the National Osteoporosis Guideline Group (NOGG). Documents mapping the datasets to evidence-based guidance are available on the RCP website. Table 1. KPIs for the FLS-DB for all patients with an index fragility fracture date in 2017 FLS level data for all KPIs is available on the RCP website.
KPI 2016 2017
KPI 1 – Data completeness FLSs with good level of data completeness*
50% 53%
Detecting and managing osteoporosis
KPI 2 – Identification (all fragility fractures) Percentage of patient records submitted compared with the local estimated caseload
40% 43%
KPI 3 – Identification (spinal fractures) Percentage of patients with a spine fracture as their index fracture site 4% 6%
KPI 4 – Time to FLS assessment Percentage of patients who were assessed by the FLS within 90 days of their fracture
67% 70%
KPI 5 – Time to DXA Percentage of patients who had a DXA ordered or recommended and were scanned within 90 days of fracture
43% 46%
KPI 7 – Bone therapy recommended Percentage of patients who were recommended antiosteoporosis medication
38% 43%
Falls prevention
KPI 6 – Falls assessment Percentage of patients who received a falls assessment, or were referred or recommended for a falls assessment
40% 46%
KPI 8 – Strength and balance training The percentage of non-hip fracture patients who had started strength and balance training within 16 weeks of their fracture†
4% 4%
Optimal support after a fragility fracture
KPI 9 – Monitoring contact 12–16 weeks post fracture
The percentage of patients who were followed up following their fracture 41% 38%
KPI 10 – Commenced bone therapy by first follow up The percentage of patients who had commenced (or were continuing) antiosteoporosis medication
31% 27%
KPI 11 – Adherence to prescribed antiosteoporosis medication at 12 months post-fracture The percentage of patients who had confirmed adherence to a prescribed antiosteoporosis medication at 12 months post-fracture
– 19%‡
*Defined as fewer than five fields with more than 20% of data missing. † In 2016 this was calculated for all fractures, in 2017 it was for hip fractures alone. ‡ Patients first seen in 2016 and followed up in 2017.
© Healthcare Quality Improvement Partnership 2018 11
FLS performance
Key findings
> The average rate of patient records submitted compared with the local estimated caseload has increased from 40% in 2016 to 43% in 2017, with 20 FLSs now identifying at least 50% of their expected caseload compared with 16 FLSs in 2016.
> The number of FLSs identifying at least 10% of patients with spinal fractures has increased from six in 2016 to 14 in 2017. However, across all FLSs identification rates remain low at 6%.
> The average rate of bone therapy recommendations being recorded has increased from 38% in 2016 to 43% in 2017 with 17 FLSs now recommending antiosteoporosis medication in at least 50% of patients with a fragility fracture.
> The percentage of patients who received a falls assessment or that were referred for falls assessments increased from 40% to 46% between 2016 and 2017. Twenty-six FLSs now record a falls assessment, or referral for one, in over 50% of their patients compared with 19 FLSs in 2016.
> Monitoring remains challenging for FLSs. The percentage of patients who were followed up following their fracture decreased from 41% to 38% between 2016 and 2017. Twenty FLSs submitted monitoring information in over 50% of patients in 2017 and 2016.
> The report highlighted monitoring remains challenging for FLSs, however from the organisational audit 46% of FLSs reported that they delegated monitoring patients to the primary care physician or other healthcare provider, in which case it becomes almost impossible for hospital-based FLSs to track individual patients. Thus, as a truer reflection on FLS performance only KPIs 1–7 have been reported on in Table 2.
© Healthcare Quality Improvement Partnership 2019
12
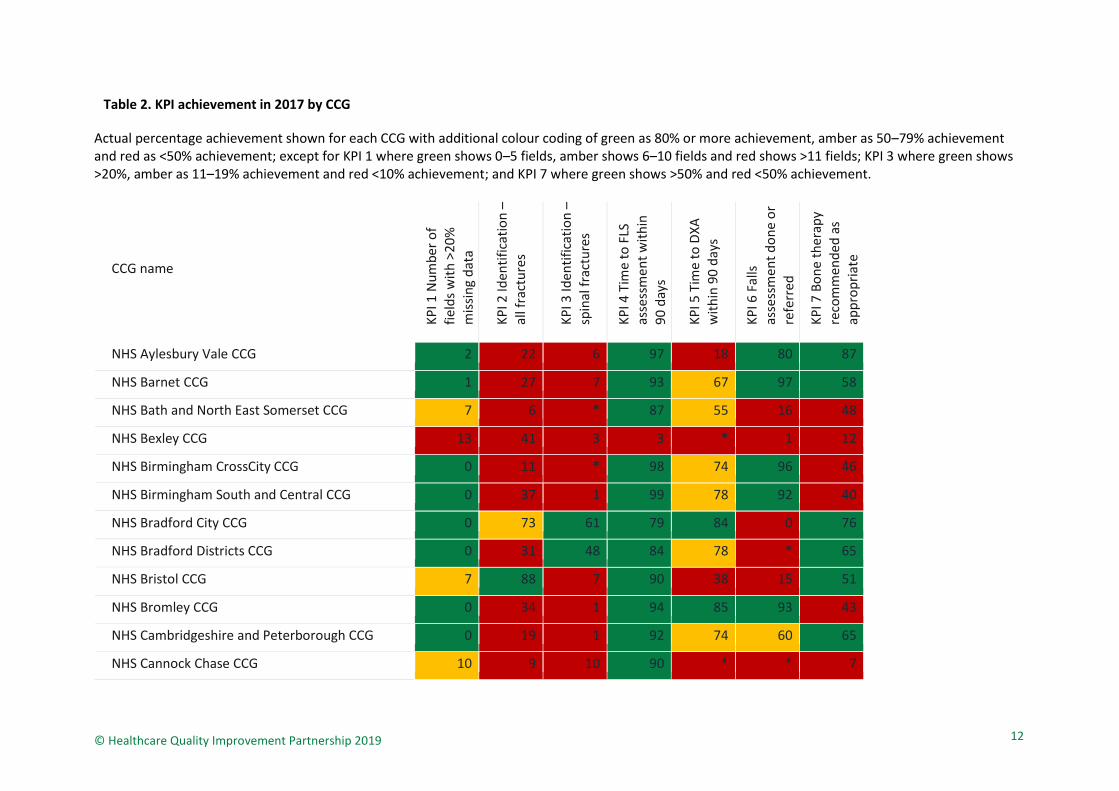
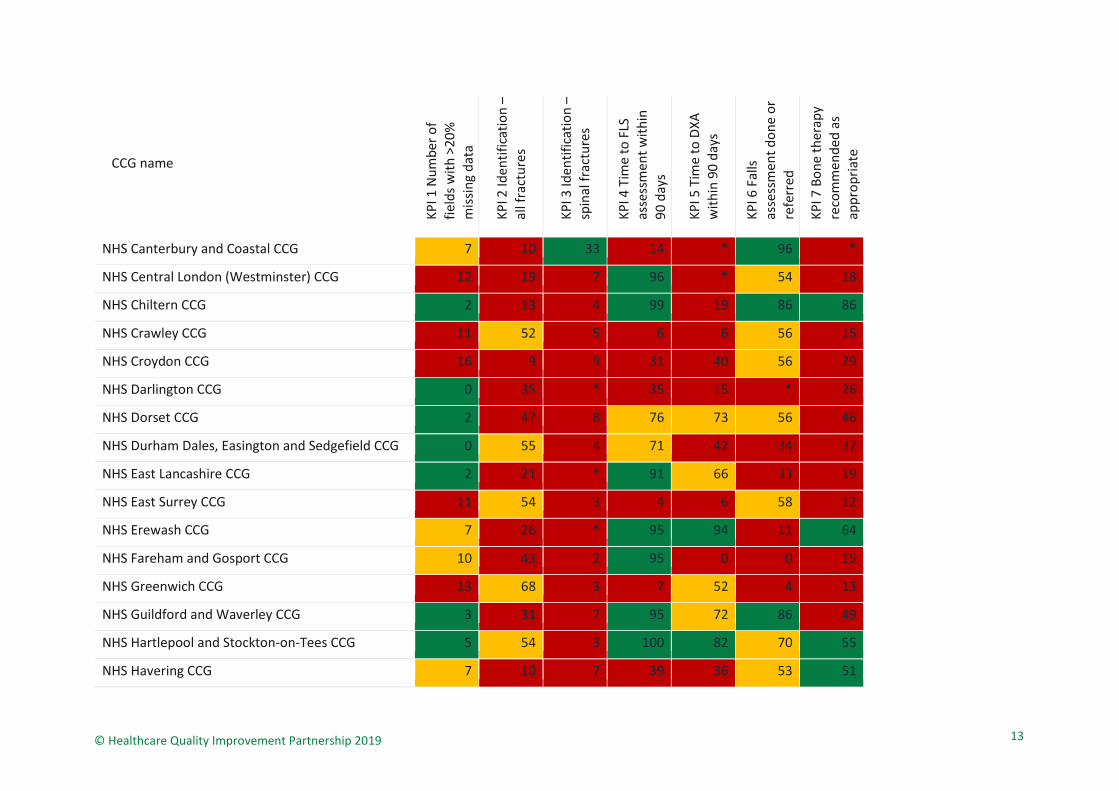
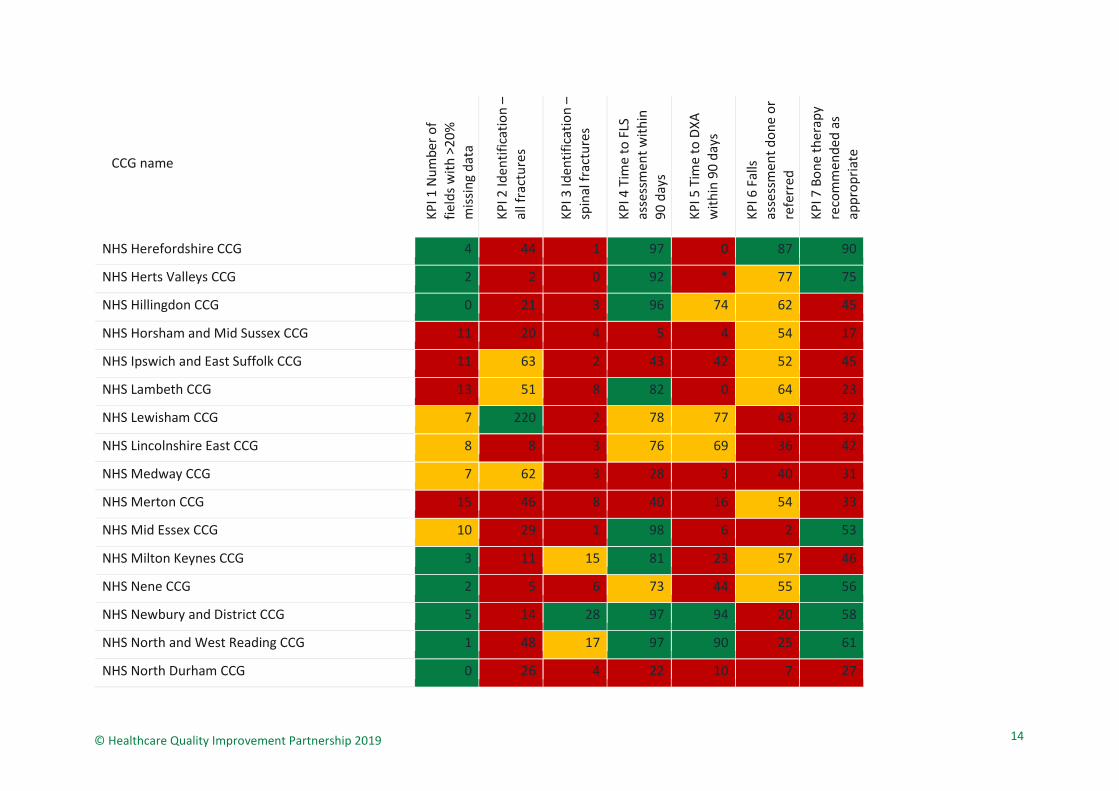
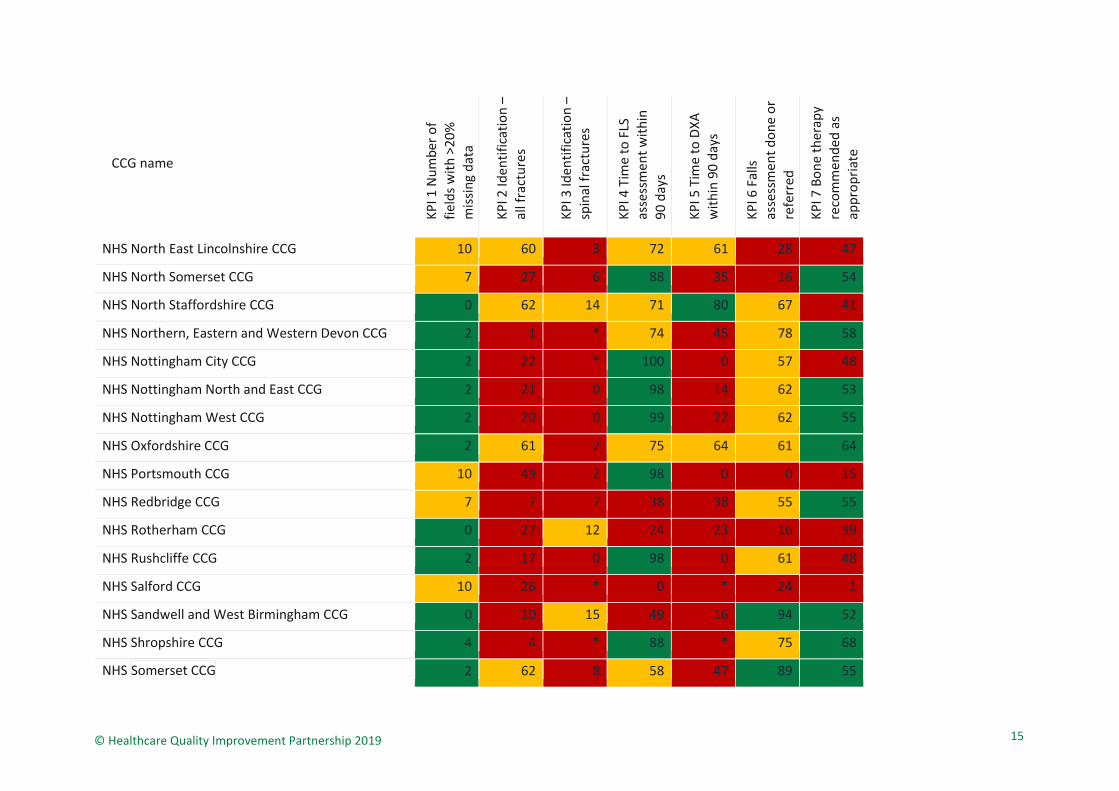
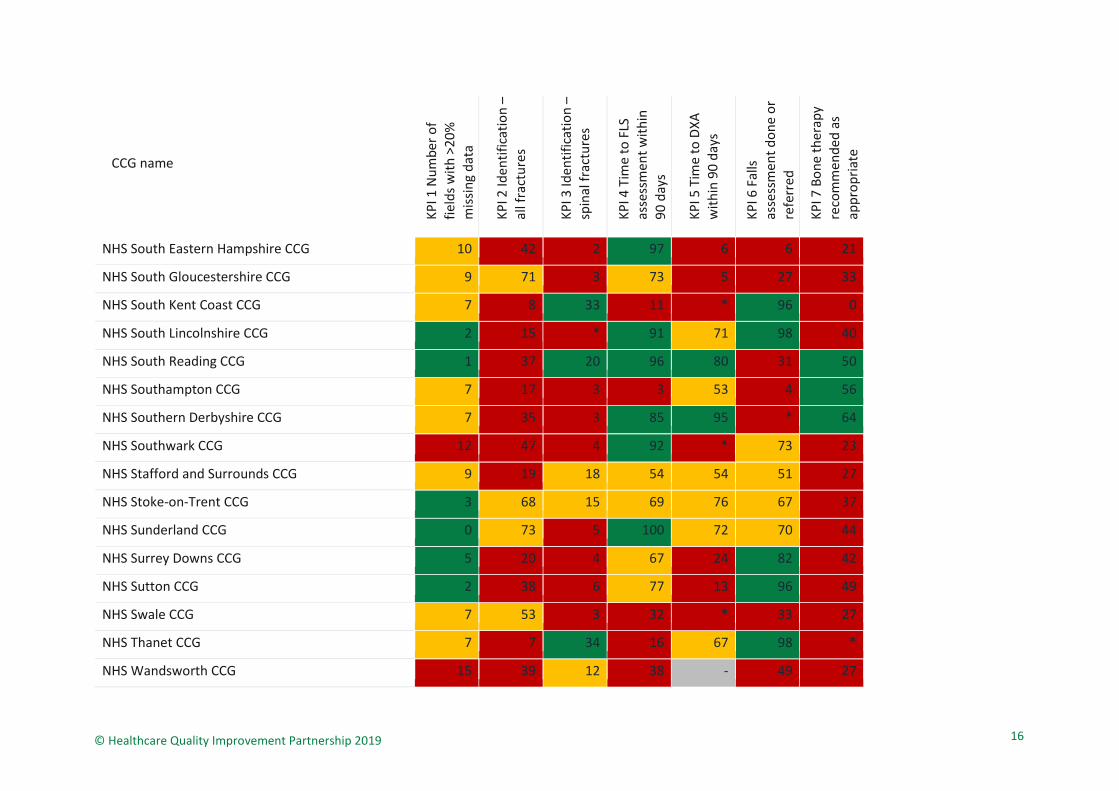
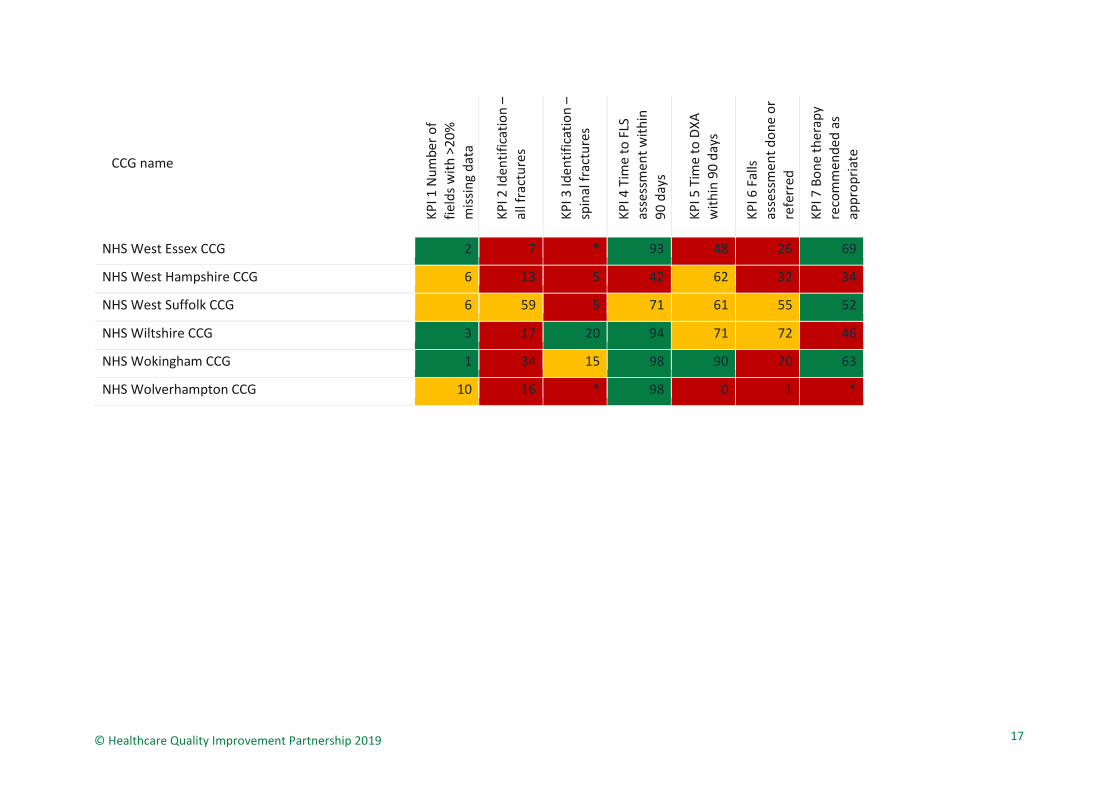
Table 2. KPI achievement in 2017 by CCG
Actual percentage achievement shown for each CCG with additional colour coding of green as 80% or more achievement, amber as 50–79% achievement and red as <50% achievement; except for KPI 1 where green shows 0–5 fields, amber shows 6–10 fields and red shows >11 fields; KPI 3 where green shows >20%, amber as 11–19% achievement and red <10% achievement; and KPI 7 where green shows >50% and red <50% achievement.
CCG name
KP
I 1 N
um
ber
of
fiel
ds
wit
h >
20
%
mis
sin
g d
ata
KP
I 2 Id
enti
fica
tio
n –
all f
ract
ure
s
KP
I 3 Id
enti
fica
tio
n –
sp
inal
fra
ctu
res
KP
I 4 T
ime
to F
LS
asse
ssm
ent
wit
hin
9
0 d
ays
KP
I 5 T
ime
to D
XA
w
ith
in 9
0 d
ays
KP
I 6 F
alls
as
sess
men
t d
on
e o
r re
ferr
ed
KP
I 7 B
on
e th
erap
y re
com
men
ded
as
app
rop
riat
e
NHS Aylesbury Vale CCG 2 22 6 97 18 80 87
NHS Barnet CCG 1 27 7 93 67 97 58
NHS Bath and North East Somerset CCG 7 6 * 87 55 16 48
NHS Bexley CCG 13 41 3 3 * 1 12
NHS Birmingham CrossCity CCG 0 11 * 98 74 96 46
NHS Birmingham South and Central CCG 0 37 1 99 78 92 40
NHS Bradford City CCG 0 73 61 79 84 0 76
NHS Bradford Districts CCG 0 31 48 84 78 * 65
NHS Bristol CCG 7 88 7 90 38 15 51
NHS Bromley CCG 0 34 1 94 85 93 43
NHS Cambridgeshire and Peterborough CCG 0 19 1 92 74 60 65
NHS Cannock Chase CCG 10 9 10 90 * * 7
© Healthcare Quality Improvement Partnership 2019
13
CCG name
KP
I 1 N
um
ber
of
fiel
ds
wit
h >
20
%
mis
sin
g d
ata
KP
I 2 Id
enti
fica
tio
n –
all f
ract
ure
s
KP
I 3 Id
enti
fica
tio
n –
sp
inal
fra
ctu
res
KP
I 4 T
ime
to F
LS
asse
ssm
ent
wit
hin
9
0 d
ays
KP
I 5 T
ime
to D
XA
w
ith
in 9
0 d
ays
KP
I 6 F
alls
as
sess
men
t d
on
e o
r re
ferr
ed
KP
I 7 B
on
e th
erap
y re
com
men
ded
as
app
rop
riat
e
NHS Canterbury and Coastal CCG 7 10 33 14 * 96 *
NHS Central London (Westminster) CCG 12 19 7 96 * 54 18
NHS Chiltern CCG 2 13 4 99 19 86 86
NHS Crawley CCG 11 52 5 6 6 56 15
NHS Croydon CCG 16 9 9 31 40 56 29
NHS Darlington CCG 0 35 * 35 15 * 26
NHS Dorset CCG 2 47 8 76 73 56 46
NHS Durham Dales, Easington and Sedgefield CCG 0 55 4 71 42 34 37
NHS East Lancashire CCG 2 21 * 91 66 33 19
NHS East Surrey CCG 11 54 3 4 6 58 12
NHS Erewash CCG 7 26 * 95 94 11 64
NHS Fareham and Gosport CCG 10 43 2 95 0 0 15
NHS Greenwich CCG 13 68 3 7 52 4 13
NHS Guildford and Waverley CCG 3 31 7 95 72 86 49
NHS Hartlepool and Stockton-on-Tees CCG 5 54 3 100 82 70 55
NHS Havering CCG 7 10 7 39 36 53 51
© Healthcare Quality Improvement Partnership 2019
14
CCG name
KP
I 1 N
um
ber
of
fiel
ds
wit
h >
20
%
mis
sin
g d
ata
KP
I 2 Id
enti
fica
tio
n –
all f
ract
ure
s
KP
I 3 Id
enti
fica
tio
n –
sp
inal
fra
ctu
res
KP
I 4 T
ime
to F
LS
asse
ssm
ent
wit
hin
9
0 d
ays
KP
I 5 T
ime
to D
XA
w
ith
in 9
0 d
ays
KP
I 6 F
alls
as
sess
men
t d
on
e o
r re
ferr
ed
KP
I 7 B
on
e th
erap
y re
com
men
ded
as
app
rop
riat
e
NHS Herefordshire CCG 4 44 1 97 0 87 90
NHS Herts Valleys CCG 2 2 0 92 * 77 75
NHS Hillingdon CCG 0 21 3 96 74 62 45
NHS Horsham and Mid Sussex CCG 11 20 4 5 4 54 17
NHS Ipswich and East Suffolk CCG 11 63 2 43 42 52 45
NHS Lambeth CCG 13 51 8 82 0 64 23
NHS Lewisham CCG 7 220 2 78 77 43 32
NHS Lincolnshire East CCG 8 8 3 76 69 36 42
NHS Medway CCG 7 62 3 28 3 40 31
NHS Merton CCG 15 46 8 40 16 54 33
NHS Mid Essex CCG 10 29 1 98 6 2 53
NHS Milton Keynes CCG 3 11 15 81 23 57 46
NHS Nene CCG 2 5 6 73 44 55 56
NHS Newbury and District CCG 5 14 28 97 94 20 58
NHS North and West Reading CCG 1 48 17 97 90 25 61
NHS North Durham CCG 0 26 4 22 10 7 27
© Healthcare Quality Improvement Partnership 2019
15
CCG name
KP
I 1 N
um
ber
of
fiel
ds
wit
h >
20
%
mis
sin
g d
ata
KP
I 2 Id
enti
fica
tio
n –
all f
ract
ure
s
KP
I 3 Id
enti
fica
tio
n –
sp
inal
fra
ctu
res
KP
I 4 T
ime
to F
LS
asse
ssm
ent
wit
hin
9
0 d
ays
KP
I 5 T
ime
to D
XA
w
ith
in 9
0 d
ays
KP
I 6 F
alls
as
sess
men
t d
on
e o
r re
ferr
ed
KP
I 7 B
on
e th
erap
y re
com
men
ded
as
app
rop
riat
e
NHS North East Lincolnshire CCG 10 60 3 72 61 28 47
NHS North Somerset CCG 7 27 6 88 35 16 54
NHS North Staffordshire CCG 0 62 14 71 80 67 41
NHS Northern, Eastern and Western Devon CCG 2 1 * 74 45 78 58
NHS Nottingham City CCG 2 22 * 100 0 57 48
NHS Nottingham North and East CCG 2 21 0 98 14 62 53
NHS Nottingham West CCG 2 20 0 99 22 62 55
NHS Oxfordshire CCG 2 61 2 75 64 61 64
NHS Portsmouth CCG 10 49 2 98 0 0 15
NHS Redbridge CCG 7 7 7 38 38 55 55
NHS Rotherham CCG 0 27 12 24 23 16 39
NHS Rushcliffe CCG 2 17 0 98 0 61 48
NHS Salford CCG 10 26 * 0 * 24 1
NHS Sandwell and West Birmingham CCG 0 10 15 49 16 94 52
NHS Shropshire CCG 4 4 * 88 * 75 68
NHS Somerset CCG 2 62 8 58 47 89 55
© Healthcare Quality Improvement Partnership 2019
16
CCG name
KP
I 1 N
um
ber
of
fiel
ds
wit
h >
20
%
mis
sin
g d
ata
KP
I 2 Id
enti
fica
tio
n –
all f
ract
ure
s
KP
I 3 Id
enti
fica
tio
n –
sp
inal
fra
ctu
res
KP
I 4 T
ime
to F
LS
asse
ssm
ent
wit
hin
9
0 d
ays
KP
I 5 T
ime
to D
XA
w
ith
in 9
0 d
ays
KP
I 6 F
alls
as
sess
men
t d
on
e o
r re
ferr
ed
KP
I 7 B
on
e th
erap
y re
com
men
ded
as
app
rop
riat
e
NHS South Eastern Hampshire CCG 10 42 2 97 6 6 21
NHS South Gloucestershire CCG 9 71 3 73 5 27 33
NHS South Kent Coast CCG 7 8 33 11 * 96 0
NHS South Lincolnshire CCG 2 15 * 91 71 98 40
NHS South Reading CCG 1 37 20 96 80 31 50
NHS Southampton CCG 7 17 3 3 53 4 56
NHS Southern Derbyshire CCG 7 35 3 85 95 * 64
NHS Southwark CCG 12 47 4 92 * 73 23
NHS Stafford and Surrounds CCG 9 19 18 54 54 51 27
NHS Stoke-on-Trent CCG 3 68 15 69 76 67 37
NHS Sunderland CCG 0 73 5 100 72 70 44
NHS Surrey Downs CCG 5 20 4 67 24 82 42
NHS Sutton CCG 2 38 6 77 13 96 49
NHS Swale CCG 7 53 3 32 * 33 27
NHS Thanet CCG 7 7 34 16 67 98 *
NHS Wandsworth CCG 15 39 12 38 - 49 27
© Healthcare Quality Improvement Partnership 2019
17
CCG name
KP
I 1 N
um
ber
of
fiel
ds
wit
h >
20
%
mis
sin
g d
ata
KP
I 2 Id
enti
fica
tio
n –
all f
ract
ure
s
KP
I 3 Id
enti
fica
tio
n –
sp
inal
fra
ctu
res
KP
I 4 T
ime
to F
LS
asse
ssm
ent
wit
hin
9
0 d
ays
KP
I 5 T
ime
to D
XA
w
ith
in 9
0 d
ays
KP
I 6 F
alls
as
sess
men
t d
on
e o
r re
ferr
ed
KP
I 7 B
on
e th
erap
y re
com
men
ded
as
app
rop
riat
e
NHS West Essex CCG 2 7 * 93 48 26 69
NHS West Hampshire CCG 6 13 5 42 62 32 34
NHS West Suffolk CCG 6 59 5 71 61 55 52
NHS Wiltshire CCG 3 17 20 94 71 72 46
NHS Wokingham CCG 1 34 15 98 90 20 63
NHS Wolverhampton CCG 10 16 * 98 0 1 *
Further informationFor full details of local FLS results, please refer to the latest FLS-DB annual report published in December 2018.
For further information please contact us – we look forward to hearing from you.
[email protected] 020 3075 1511
www.rcplondon.ac.uk/flsdb @RCP_FFFAP
Need help implementing a new FLS?
The Royal Osteoporosis Society (ROS) can assist with this. Find out more about how the ROS can support you:
[email protected] 471771
References and bibliography
The references cited in this report can be accessed here on our website.