hyspiri · pdf file• conduct internal reviews • conduct mission concept review...
TRANSCRIPT

Copyright 2009 California Institute of Technology. Government sponsorship acknowledged
HyspIRI
Presented by Simon J. Hook
Jet Propulsion Laboratory, California Institute of TechnologyWith contributions from the HyspIRI Steering Committee and Science
Study Group

Copyright 2009 California Institute of Technology. Government sponsorship acknowledged
HyspIRI Outline
• HyspIRI and the NRC Decadal Survey • HyspIRI Study Groups• HyspIRI Science• HyspIRI Measurements and Mission • More information on the HyspIRI Mission• 2009 HyspIRI Science Workshop

Copyright 2009 California Institute of Technology. Government sponsorship acknowledged
Background
• January 2007: NRC releases Earth Science & Applications from Space report (the Decadal Survey) to NASA, NOAA, & USGS
• Calls for 17 satellite missions as an integrated set of space measurements in the decade 2010-2020 (14 NASA, 2 NOAA, 1 both)
• NRC places missions in 3 temporal tiers (2010-2013, 2013-2016, 2016- 2020)
• Tier 2 contains a Hyperspectral Infrared Imager or HyspIRI mission: hyperspectral imager in visible to SWIR & thermal multispectral scanner
• Targets: – Global ecosystem (terrestrial & aquatic) condition & change – Global surface temperature & emissivity measures for hazards, water use &
availability, urbanization, & land surface composition & change• Decadal Survey recommendations set boundary conditions for mission
design efforts & discussions. We rarely stray from them & only do so for the most compelling reasons of science, cost, mission design, etc.

Copyright 2009 California Institute of Technology. Government sponsorship acknowledged
Mission Mission Description Orbit Instruments
HyspIRI Land surface composition for agriculture and mineral characterization; vegetation types for ecosystem health
LEO, SSO Hyperspectral spectrometerTIR multispectral scanner
ASCENDS Day/night, all-latitude, all- season CO2 column integrals for climate emissions
LEO, SSO Multifrequency laser
SWOT Ocean, lake, and river water levels for ocean and inland water dynamics
LEO Ka-band wide swath radarC-band radar
GEO-CAPE Atmospheric gas columns for air quality forecasts; ocean color for coastal ecosystem health and climate emissions
GEO High and low spatial resolution hyperspectral imagers
ACE Aerosol and cloud profiles for climate and water cycle; ocean color for open ocean biogeochemistry
LEO, SSO Backscatter lidarMultiangle polarimeterDoppler radar
NRC Recommended Mid-Term Missions (Tier 2)

Copyright 2009 California Institute of Technology. Government sponsorship acknowledged
ESD Execution of Decadal Survey Missions
• All Decadal Survey Missions concepts studies are directed by the ESD and will be managed by the Earth Systematic Missions (ESM) Program Office at GSFC
• All mission development will have a study management team, led from HQ ESD by the HQ Program Scientist and Program Executive, and including representatives from ESTO, data systems, applied sciences, and the ESM program office
ESTOPrimary Backup Technology
ICESat II Martin Wickland Yuhas Turner SavinellSMAP Entin Kakar Ianson Haynes LoiaconoDESDynI Labrecque Wickland Volz Ambrose Smith WalkerCLARREO Anderson Kakar Carson Friedl Parminder G SmithSWOT Lindstrom Entin HaynesHyspIRI Turner LaBrecque HaynesASCENDS Jucks Emanuel TurnerGEO-CAPE Jucks Bontempi FriedlACE Maring Bontempi FriedlLIST Wickland Emanuel AmbrosePATH Kakar Maring HaynesGRACE-II LaBrecque Martin AmbroseSCLP Entin Martin AmbroseGACM Jucks Hilsenrath Friedl3D-Winds Kakar Anderson Ambrose
Tier 2
Applied Science
TBD
ESM PO
BoltonSmith
Pasciuto
Black
Maiden
Bauer
Black
Maiden
LindsayTier 1
Data Systems
Tier 3
Neeck
Mission ResourcesProgram Scientist Program Executive

Copyright 2009 California Institute of Technology. Government sponsorship acknowledged
Mission Requirements for Pre-Phase A
Headquarters• Approve a Formulation Authorization Document• Develop DRAFT Level 1 Requirements• Conduct Acquisition Strategy Planning MeetingTechnical Activities:• Develop and document preliminary mission
concepts• Conduct internal Reviews• Conduct Mission Concept Review Project
Planning, Costing and Scheduling• Develop and document a DRAFT Integrated
Baseline, including:– High level WBS– Assessment of Technology Readiness Levels– Assessment of Infrastructure and Workforce needs– Identification of potential partnerships– Identification of conceptual acquisition strategies for
proposed major procurementsKDP Readiness• Obtain KDP A Readiness products• Approval through the governing PMC
• Development of DRAFT Level 1 Science Requirements
• Support development of preliminary mission concepts
• Support the assessment of Technical Readiness Levels
• Identify potential partnerships
Areas the Science Community must work:
Scope of Major Pre-Phase A Activities:

Copyright 2009 California Institute of Technology. Government sponsorship acknowledged
HyspIRI Outline
• HyspIRI and the NRC Decadal Survey • HyspIRI Study Groups• HyspIRI Science• HyspIRI Measurements and Mission • More information on the HyspIRI Mission• 2009 HyspIRI Science Workshop

Copyright 2009 California Institute of Technology. Government sponsorship acknowledged
NRC Decadal Survey HyspIRIVisible ShortWave InfraRed (VSWIR) Imaging Spectrometer
+ Multispectral Thermal InfraRed (TIR) Scanner
VSWIR: Plant Physiology andFunction Types (PPFT)
Multispectral TIR Scanner
Red tide algal bloom in Monterey Bay, CA
Map of dominant tree species, Bartlett Forest, NH
Copyright 2009 California Institute of Technology. Government sponsorship acknowledged
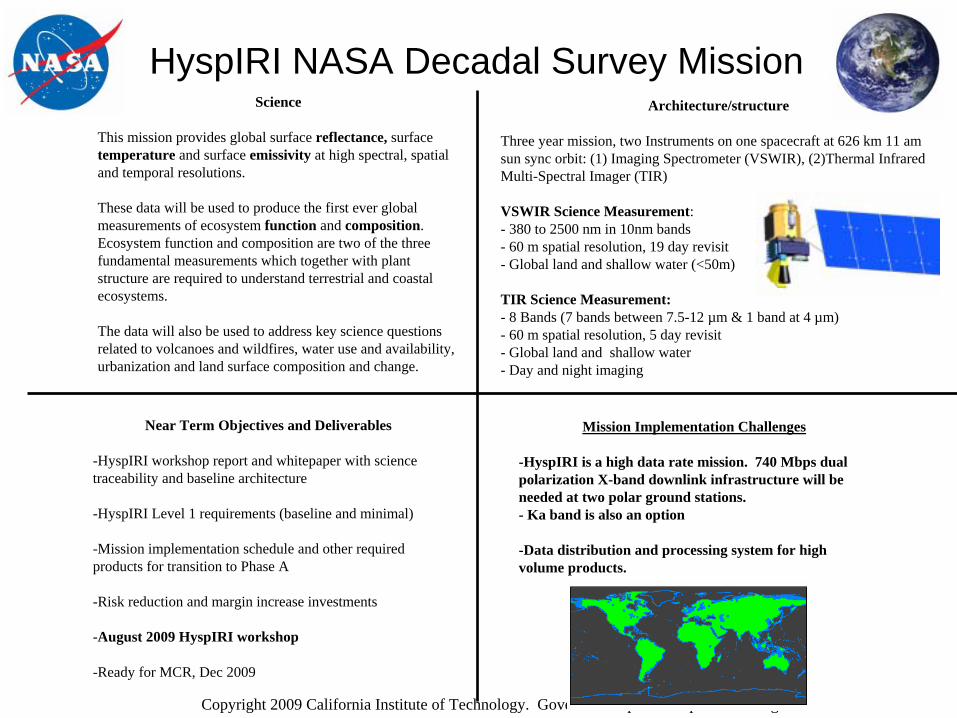
Architecture/structure
Three year mission, two Instruments on one spacecraft at 626 km 11 am sun sync orbit: (1) Imaging Spectrometer (VSWIR), (2)Thermal Infrared Multi-Spectral Imager (TIR)
VSWIR Science Measurement:- 380 to 2500 nm in 10nm bands- 60 m spatial resolution, 19 day revisit- Global land and shallow water (<50m)
TIR Science Measurement:- 8 Bands (7 bands between 7.5-12 µm & 1 band at 4 µm)- 60 m spatial resolution, 5 day revisit - Global land and shallow water- Day and night imaging
HyspIRI NASA Decadal Survey MissionScience
This mission provides global surface reflectance, surface temperature and surface emissivity at high spectral, spatial and temporal resolutions.
These data will be used to produce the first ever global measurements of ecosystem function and composition. Ecosystem function and composition are two of the three fundamental measurements which together with plant structure are required to understand terrestrial and coastal ecosystems.
The data will also be used to address key science questions related to volcanoes and wildfires, water use and availability, urbanization and land surface composition and change.
Near Term Objectives and Deliverables
-HyspIRI workshop report and whitepaper with science traceability and baseline architecture
-HyspIRI Level 1 requirements (baseline and minimal)
-Mission implementation schedule and other required products for transition to Phase A
-Risk reduction and margin increase investments
-August 2009 HyspIRI workshop
-Ready for MCR, Dec 2009
Mission Implementation Challenges
-HyspIRI is a high data rate mission. 740 Mbps dual polarization X-band downlink infrastructure will be needed at two polar ground stations.- Ka band is also an option
-Data distribution and processing system for high volume products.

Copyright 2009 California Institute of Technology. Government sponsorship acknowledged
HyspIRI Science Study Group
Mike Abrams, JPL Heidi Dierssen, U. Conn.
John "Lyle" Mars,USGS
Vince Realmuto, JPL
Rick Allen, UID Friedmann Freund, Ames
David Meyer,USGS-EROS
Dar Roberts, UCSB
Martha Anderson, USDA
John Gamon, UA; Betsy Middleton, GSFC;
Dave Siegel, UCSB
Greg Asner, Stanford Louis Giglio, UMD Peter Minnett, U. Miami Phil Townsend,U. Wisconsin
Bryan Bailey, USGS EROS
Greg Glass, JHU Frank Muller Karger, U. Mass
Kevin Turpie, GSFC
Paul Bissett, FERI Robert Green, JPL Scott Ollinger, UNH Steve Ungar, GSFC
Alex Chekalyuk, Lamont-Doherty
Simon Hook, JPL; Anupma Prakash, UAF Susan Ustin, UCD
James Crowley, USGS James Irons, GSFC Dale Quattrochi, MSFC Rob Wright UHI
Ivan Csiszar, NOAA Bob Knox, GSFC Mike Ramsey, U. Pitt

Copyright 2009 California Institute of Technology. Government sponsorship acknowledged 11
Science Study Group:
2008 HsypIRI Science Study Group

Copyright 2009 California Institute of Technology. Government sponsorship acknowledged
HyspIRI Outline
• HyspIRI and the NRC Decadal Survey • HyspIRI Study Groups• HyspIRI Science• HyspIRI Measurements and Mission • More information on the HyspIRI Mission• 2009 HyspIRI Science Workshop

Copyright 2009 California Institute of Technology. Government sponsorship acknowledged
HyspIRI VSWIR - PPFT Science Questions
13

Copyright 2009 California Institute of Technology. Government sponsorship acknowledged 14
HyspIRI Imaging Spectroscopy (VSWIR) Science Measurements
Science Questions:• What is the composition, function, and health of
land and water ecosystems? • How are these ecosystems being altered by
human activities and natural causes? • How do these changes affect fundamental
ecosystem processes upon which life on Earth depends?
Red tide algal bloom in Monterey Bay, CA
Map of dominant tree species, Bartlett Forest, NH
Imaging spectrometer: 87kg / 38W
Schedule: 4 year phase A-D, 3 years operations
All components have flown in space
Measurement:• 380 to 2500 nm in 10nm bands• Accurate location 60m spatial• 19 days revisit • Global land and shallow water
Aquatic Terrestrial

Copyright 2009 California Institute of Technology. Government sponsorship acknowledged
HyspIRI Decadal Survey Mission
In its Decadal Survey Earth Science and Applications from Space: National Imperatives for the Next Decade and Beyond, the National Research Council of the National Academies recommended a satellite mission to produce global observations of multiple Earth surface attributes for a variety of terrestrial and aquatic studies, the management of terrestrial and coastal natural resources, and forecasting ecological changes and natural hazards.
Currently known as HyspIRI, this mission is in the conceptual design phase at NASA. It consists of an imaging spectrometer in the visible to shortwave infrared (VSWIR) regions of the electromagnetic spectrum and a multispectral imager in the thermal infrared (TIR) portion of the electromagnetic spectrum.
15

Copyright 2009 California Institute of Technology. Government sponsorship acknowledged16
• Plant and phytoplankton functional types and species have biochemical and biophysical properties that are expressed as reflectance and absorption features spanning the spectral region from 380 to 2500 nm.
• Individual bands do not capture the diversity of biochemical and biophysical signatures of plant functional types or species.
• Changes in the chemical and physical configuration of ecosystems are often expressed as changes in the contiguous spectral signatures that relate directly to plant functional types, vegetation health, and species distribution.
• Important atmospheric correction information and calibration feedback is contained within the spectral measurement.
Basis for Continuous Spectral Measurement

Copyright 2009 California Institute of Technology. Government sponsorship acknowledged
VSWIR Overarching Science Questions
• VQ1. Pattern and Spatial Distribution of Ecosystems and their Components, (DR,JG)– What is the global spatial pattern of ecosystem and diversity distributions and how do ecosystems differ in their
composition or biodiversity? [DS 195]
• VQ2. Ecosystem Function, Physiology and Seasonal Activity, (EM,JG) – What are the seasonal expressions and cycles for terrestrial and aquatic ecosystems, functional groups and diagnostic
species? How are these being altered by changes in climate, land use, and disturbances? [DS 191, 195, 203]
• VQ3. Biogeochemical Cycles (SO, SU)– How are biogeochemical cycles for carbon, water and nutrients being altered by natural and human-induced
environmental changes?
• VQ4. Changes in Disturbance Activity (RK,GA)– How are disturbance regimes changing and how do these changes affect the ecosystem processes that support life on
Earth?
• VQ5. Ecosystem and Human Health, (PT,GG)– How do changes in ecosystem composition and function affect human health, resource use, and resource management?
• VQ6. Earth Surface and Shallow Water Substrate Composition (RG, HD)– What is the land surface soil/rock and shallow water substrate composition?

Copyright 2009 California Institute of Technology. Government sponsorship acknowledged
VQ1. Pattern and Spatial Distribution of Ecosystems and their Components, What is the global spatial pattern of ecosystem and diversity distributions and how do ecosystems differ in
their composition or biodiversity? [DS 195]
• VQ1a. How are ecosystems organized within different biomes associated with temperate, tropical, and boreal zones, and how are these changing? [DS 191, 203]
• VQ1b: How do similar ecosystems differ in size, species composition, fractional cover and biodiversity across terrestrial and aquatic biomes and on different continents? [DS 195]
• VQ1c: What is the current spatial distribution of ecosystems, functional groups, or key species within major biomes including agriculture, and how are these being altered by climate variability, human uses, and other factors? [DS 191, 203]
• VQ1d: What are the extent and impact of invasive species in terrestrial and aquatic ecosystems? [DS 192, 194, 196, 203, 204, 214]
• VQ1e: What is the spatial structure and species distribution in a phytoplankton blooms? [DS 201, 208]
• VQ1f: How do changes in coastal morphology and surface composition impact coastal ecosystem composition, diversity and function [DS 41]?

Copyright 2009 California Institute of Technology. Government sponsorship acknowledged
Science Issue:•Ecosystems play a critical role in the cycling of water, carbon, nitrogen and nutrients and by providing critical habitats to many organisms. While our knowledge of the large scale distribution of ecosystems is good, knowledge of their distributions at finer scales is generally poorer. Furthermore, the rate at which they are changing in response to multiple stressors, including anthropogenic disturbance and climate change is insufficient. •Tools:•Satellite observations from HyspIRI. Requires fine spectral sampling (~ 10 nm) from the ultra-violet to Short-Wave-Infrared (380-2500 nm) to discriminate functional types and species in terrestrial and aquatic ecosystems, correct for atmospheric impacts and retrieve bi-directional reflectance. Requires high signal to noise for aquatic systems (300:1 at 45Z, 0.01 reflectance target) and fine spatial resolution (at least 60 m) to map uniform patches in the landscape. Requires high frequency repeat sampling (19 days) to provide a minimum of one acquisition per season globally and improve discrimination of species through phenology.•Requires radiometric stability for multi-year monitoring.•Requires supplemental spectral libraries to inform mapping.•Approach:•Retrieve bi-directional reflectance and surface spectral radiance using atmospheric radiative transfer•Develop seasonal compositing approaches to generate a seamless global product for terrestrial systems and coastal waters. •Apply standard and developed classification algorithms for mapping ecosystems in terrestrial and coastal aquatic or inland water systems.•Utilize mixing algorithms to estimate sub-pixel fractions of ecosystems•Link to well established calibration/validation sites for validation•Develop products that are readily assimilated in to models.
VQ1a: How are ecosystems organized within different biomes associated with temperate, tropical, and boreal zones, and how are these changing? [DS 191, 203]
~
~
~
ASTER
Classification of dominant plant functional types in the Pacific Northwest using Landsat, Hyperion and AVIRIS. From Goodenough et al., 2003.
Map of the distribution of important reef communities. From Hochberg.

Copyright 2009 California Institute of Technology. Government sponsorship acknowledged
VQ1b: How do similar ecosystems differ in size, species composition, fractional cover and biodiversity across terrestrial and aquatic biomes and on different continents? [DS 195]
~
~
~
Phytoplankton functional groups can be discriminatedbased on spectroscopic dif-ferences due to pigments.From Dierssen et al., 2006.
Spectral variability is directly related to canopy species diversityFrom Carlson et al., 2007
Thermal data show large upwelling jet of cool water transported from west to east
Science Issue:•Ecosystems differ in spatial extent, biophysical properties and in the types of organisms within them. The manner in which an ecosystem responds to changing environmental conditions and disturbance is, in part, dependent upon the organisms within the ecosystem. The resilience of an ecosystem to external stressors is also dependent upon organisms within the ecosystem. Biophysical attributes, such as fractional cover, and biodiversity measures are critical elements that quantify ecosystem function and response to environmental change.•Tools:•Satellite observations from HyspIRI. Requires fine spectral sampling (~ 10 nm) from the ultra-violet to Short-Wave-Infrared (380-2500 nm) to discriminate functional types and species in terrestrial and aquatic ecosystems, correct for atmospheric impacts and retrieve bi-directional reflectance. Requires high signal to noise for aquatic systems (300:1 at 45Z, 0.01 reflectance target) and fine spatial resolution (at least 60 m) to map uniform patches in the landscape. Requires high frequency repeat sampling (19 days) to provide at least one acquisition per season globally, with preferably multiple acquisitions within a season.•Requires radiometric stability for multi-year monitoring.•Requires supplemental spectral libraries to inform mapping.•Approach:•Retrieve bi-directional reflectance and surface spectral radiance using atmospheric radiative transfer•Develop seasonal compositing approaches to generate a seamless global product for terrestrial systems and coastal waters. •Utilize mixing algorithms to estimate sub-pixel fractions of cover, including exposed soil, photosynthetic and non-photosynthetic components•Develop spectroscopic means for quantifying biodiversity•Link to well established calibration/validation sites for validation
400 500 600 7000
0.005
0.01
L w (W m
-2 n
m-1
sr-1
)
Wavelength (nm)
C1

Copyright 2009 California Institute of Technology. Government sponsorship acknowledged
VQ1c: What is the current spatial distribution of ecosystems, functional groups, or key species within major biomes including agriculture, and how are these being altered by climate variability, human uses, and other factors? [DS 191, 203]
~
Map showing the distribution of dominant species within the Santa Barbara front range. Edaphic controls are strongly evident. Chaparral species shown differ in their effects on fire spread and post-fire response. Ceanothus is a nitrogen fixinggenus, while Quercus, Arctostaphylos and Adenostoma are genera that do not fix nitrogen. From Dennison and Roberts, 2003.
Science Issue:•Ecosystem response to anthropogenic disturbance and climate variability depends upon ecosystem spatial extent, factors that govern ecosystem distribution and the species or functional groups within them. Current space-borne assets are incapable of discriminating numerous critical functional groups, such as nitrogen and non-nitrogen fixing plants, C3 and C4 grasses, fire resistant vs intolerant species and coastal reef communities. •Tools:•Satellite observations from HyspIRI. Requires fine spectral sampling (~ 10 nm) from the ultra-violet to Short-Wave-Infrared (380-2500 nm) to discriminate functional types and species in terrestrial and aquatic ecosystems, correct for atmospheric impacts and retrieve bi-directional reflectance. Requires high signal to noise for aquatic systems (300:1 at 45Z, 0.01 reflectance target) and fine spatial resolution (at least 60 m) to map uniform patches in the landscape. Requires high frequency repeat sampling (19 days) to provide a minimum of one acquisition per season globally and improve discrimination of species through phenology.•Requires radiometric stability for multi-year monitoring.•Requires supplemental spectral libraries to inform mapping.•Approach:•Retrieve bi-directional reflectance and surface spectral radiance using atmospheric radiative transfer•Develop seasonal compositing approaches to generate a seamless global product for terrestrial systems and coastal waters. •Apply standard and developed classification algorithms for mapping ecosystems in terrestrial and coastal aquatic or inland water systems.•Develop new tools that leverage phenological information for species/functional group discrimination.•Link to well established calibration/validation sites for validation•Develop products that are readily assimilated in to models.
Adenostoma fasciculatumCeanothus megacarpusArctostaphylos spp.
Quercus agrifoliaGrassSoil

Copyright 2009 California Institute of Technology. Government sponsorship acknowledged
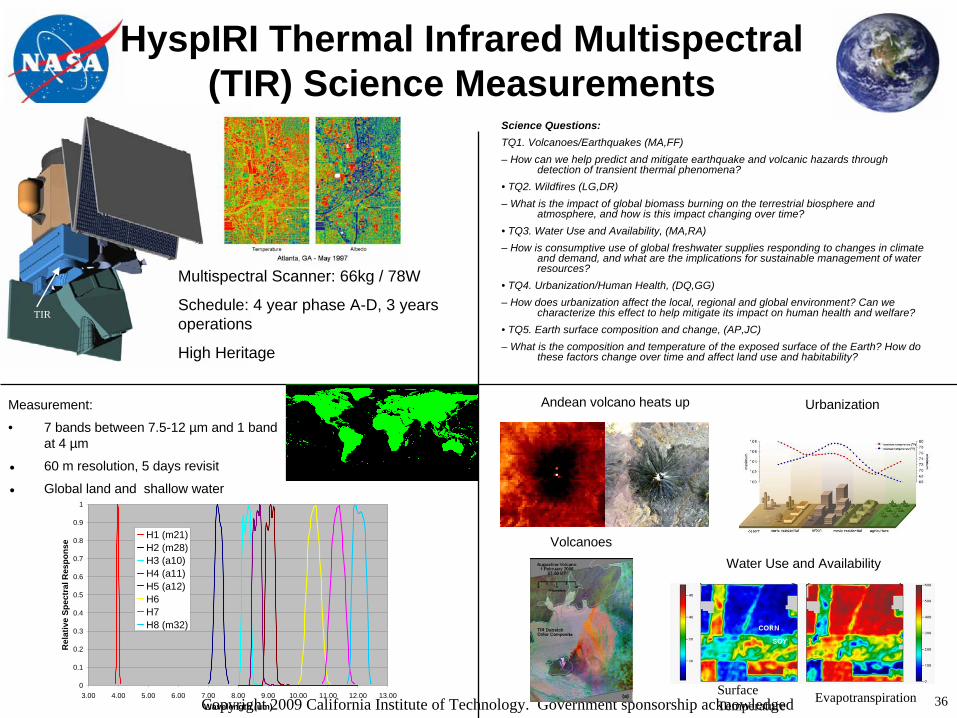
HyspIRI TIR Science Questions
22

Copyright 2009 California Institute of Technology. Government sponsorship acknowledged 23
HyspIRI Thermal Infrared Multispectral (TIR) Science Measurements
Science Questions:TQ1. Volcanoes/Earthquakes (MA,FF)– How can we help predict and mitigate earthquake and volcanic hazards through
detection of transient thermal phenomena?• TQ2. Wildfires (LG,DR)– What is the impact of global biomass burning on the terrestrial biosphere and
atmosphere, and how is this impact changing over time?• TQ3. Water Use and Availability, (MA,RA)– How is consumptive use of global freshwater supplies responding to changes in climate
and demand, and what are the implications for sustainable management of water resources?
• TQ4. Urbanization/Human Health, (DQ,GG)– How does urbanization affect the local, regional and global environment? Can we
characterize this effect to help mitigate its impact on human health and welfare?• TQ5. Earth surface composition and change, (AP,JC)– What is the composition and temperature of the exposed surface of the Earth? How do
these factors change over time and affect land use and habitability?
Measurement:
• 7 bands between 7.5-12 µm and 1 band at 4 µm
• 60 m resolution, 5 days revisit
• Global land and shallow water
Volcanoes
Urbanization
Water Use and Availability
Surface Temperature Evapotranspiration
Andean volcano heats up
0
0.1
0.2
0.3
0.4
0.5
0.6
0.7
0.8
0.9
1
3.00 4.00 5.00 6.00 7.00 8.00 9.00 10.00 11.00 12.00 13.00Wavelength (um)
Rel
ativ
e Sp
ectr
al R
espo
nse
H1 (m21)H2 (m28)H3 (a10)H4 (a11)H5 (a12)H6H7H8 (m32)
Multispectral Scanner: 66kg / 78W
Schedule: 4 year phase A-D, 3 years operations
High Heritage
TIR

Copyright 2009 California Institute of Technology. Government sponsorship acknowledged
HyspIRI Decadal Survey Mission
24
The National Academy of Sciences Decadal Survey (2007) placed “critical priority” on a:
“Mission to observe surface composition and thermal properties: Changes in mineralogical composition affect the optical reflectance spectrum of the surface, providing information on the distribution of geologic materials and also the condition and types of vegetation on the surface. Gases from within the Earth, such as CO2 or SO2, are sensitive indicators of impending volcanic hazards, and plume ejecta themselves pose risk to aircraft and to those downwind. These gases also have distinctive spectra in the optical and near IR regions.”
“A multispectral imager similar to ASTER is required in the thermal infrared region. Volcano eruption prediction are high thermal sensitivity, on the order of 0.2 K, and a pixel size of less than 90 m. An opto-mechanical scanner, as opposed to a pushbroom scanner, would provide a wide swath of as much as 400 km at the required sensitivity and pixel size..”

Copyright 2009 California Institute of Technology. Government sponsorship acknowledged
TIR Overarching Science Questions
• TQ1. Volcanoes/Earthquakes (MA,FF)– How can we help predict and mitigate earthquake and volcanic hazards through detection
of transient thermal phenomena?• TQ2. Wildfires (LG,DR)
– What is the impact of global biomass burning on the terrestrial biosphere and atmosphere, and how is this impact changing over time?
• TQ3. Water Use and Availability, (MA,RA)– How is consumptive use of global freshwater supplies responding to changes in climate
and demand, and what are the implications for sustainable management of water resources?
• TQ4. Urbanization/Human Health, (DQ,GG)– How does urbanization affect the local, regional and global environment? Can we
characterize this effect to help mitigate its impact on human health and welfare?• TQ5. Earth surface composition and change, (AP,JC)
– What is the composition and temperature of the exposed surface of the Earth? How do these factors change over time and affect land use and habitability?

Copyright 2009 California Institute of Technology. Government sponsorship acknowledged 26
TQ1. Volcanoes/Earthquakes:• TQ1a. Do volcanoes signal impending eruptions through changes in
surface temperature or gas emission rates, and are such changes unique to specific types of eruptions?
• TQ1b: What do changes in the rate of lava effusion tell us about the maximum lengths that lava flows can attain, and the likely duration of lava flow-forming eruptions?
• What do the transient thermal infrared anomalies that may precede earthquakes tell us about changes in the geophysical properties of the crust?
• TQ1d: What are the characteristic dispersal patterns and residence times for volcanic ash clouds and how long do such clouds remain a threat to aviation?
Science Questions Topic Areas

Copyright 2009 California Institute of Technology. Government sponsorship acknowledged 27
Volcanoes and Earthquakes: Do volcanoes signal impending eruptions through changes in
surface temperature or gas emission rates and are such changes unique to specific types of eruptions?
MODIS TIR (1 km)
ASTER TIR (90 m)
Anatahan, Marianas. Erupted in 2002, no ground instrumentation, caught people by surprise. Upper right image is a nighttime MODIS TIR image, 1 km resolution. Note that elevated thermal radiance in the vicinity of the east crater is not apparent (hydrothermal activity too small/too cool to show up at this resolution). Below is an ASTER TIR image. The hydrothermal activity is clearly visible (although in this case partially cloud obscured).
HyspIRI will provide frequent (weekly) data for volcano studies

Copyright 2009 California Institute of Technology. Government sponsorship acknowledged
Science Issue:•Volcanoes can exhibit idiosyncratic behaviors leading up to eruptions. For example, SO2 production can increase dramatically, or decrease dramatically. Thermal anomalies manifest themselves in many forms: crater lakes, fumaroles, domes, etc. Systematic monitoring can provide potentially effective information to aid in predicting possible eruptions.Tools:•Satellite observations from HyspIRI TIR; requires multispectral capability to separate plume constituents; requires bands in 3-5um and 8-12um for temperature determinations in range -20 to 100C• Historical baseline of characteristic thermal and gas emission behavior for each volcano to compare with HyspIRI observations.Approach:•Schedule systematic day & night TIR observations with HyspIRI over several hundred up to 1000 active volcanoes.• Implement automatic analysis algorithms to flag anomalous thermal or gas emission activity.Results:• Unique, high spatial resolution TIR data from HyspIRI will improve our understanding of pre-eruption volcanic behavior• This will in turn lead to improvements in our ability to predict volcanic eruptions.
TQ1a. Do volcanoes signal impending eruptions through changes in surface temperature or gas emission rates, and are
such changes unique to specific types of eruptions?
~
~
Kliuchevskoy and Bezymianny volcanoes in Siberia, observed by ASTER. 15 clear-sky nighttime observations in 5 months show changes in thermal behavior of summit domes, development of lava flows and pyroclastic flows, and presence of ash and SO2 plumes. Courtesy of M. Ramsey, U. Pittsburgh.

Copyright 2009 California Institute of Technology. Government sponsorship acknowledged
TQ1b: What do changes in the rate of lava effusion tell us about the maximum lengths that lava flows can attain, and the likely duration of
lava flow-forming eruptions?
Science Issue:• After lava composition, the volumetric effusion rate (modulated by surface cooling) determines how far a lava flow can extend from the vent before it solidifies. Effusion rates vary dramatically during eruptions, but can be quantified using infrared satellite data (top left; AVHRR, ATSR and TM data). By acquiring high spatial resolution TIR data, HyspIRI will allow us to determine effusion rates twice every five days during a lava flow forming eruption for any volcano on Earth. These data can be used to drive numerical models that predict the hazards that these flows will poseTools:• Satellite observations from HyspIRI TIR; requires band at ~4 m (saturation temperature of ~1600 K) with moderate-high spatial resolution (<100 m) for determining the area of active lava at any given time during as eruption and estimating the radiant energy flux from the flow surface.• Pre-HyspIRI DEMs (e.g. SRTM) of all volcanoes likely to erupt basaltic lava flows• Time-series of effusion rates determined using higher temporal resolution MODIS data for calibration.Approach:• Implement automatic analysis algorithms to flag anomalous thermal activity, determine active lava area and thermal flux, and, subsequently, a HyspIRI-derived effusion rate. Using this, a DEM, the vent location as recorded in the HyspIRI data, and a numerical lava flow model, generate simulations of likely lava flow paths for the given effusion rate. Autonomously update the hazard simulation as most recent HyspIRI derived effusion rates become available (lower left). Results:• A global, near-real-time lava flow hazard assessment tool, driven by HyspIRI TIR data.
Wright et al. (2008). Geophysical Research Letters, 35, L19307.

Copyright 2009 California Institute of Technology. Government sponsorship acknowledged
TQ1d: What are the characteristic dispersal patterns and residence times for volcanic ash clouds and how long do such
clouds remain a threat to aviation?
~
~
Detection of Eruption Plumes in the Thermal Infrared (TIR)
(a) MODIS true-color composite of data acquired over Mount Etna illustrating the difficulty of distinguishing a plume from surrounding meteorological clouds; (b) False-color composite of MODIS TIR data (Ch. 29, 31, 32 displayed in blue, green, and red, respectively) illustrating the unique spectral signatures of the eruption plume (silicate ash), jet contrails (ice), and windborne sand; (c) Model transmission spectra for silicate ash, sulfate aerosol, ice, and quartz powder (representing sand). The blue, green, and red color bars represent MODIS Ch. 29, 31, and 32, respectively; the shaded bars represent the proposed HyspIRI TIR channels. HyspIRI will have three channels in place of MODIS Ch. 29 and three channels in place of MODIS Ch. 31 and 32, enhancing our ability to detect and track eruption plumes and clouds.
Science IssueThe ash plumes generated by explosive volcanic eruptions pose a significant hazard to jet aircraft. Current air traffic protocol is to clear the airspace in the vicinity of the erupting volcano, but the ash plumes may be transported hundreds to thousands of kilometers from their sources. The use of true-color images to discriminate volcanic plumes from meteorological (met) clouds, and other suspended aerosols and particulates, is problematic (Panel (a), at left).Tools•HyspIRI multispectral TIR image data, 5-day revisit cycle (daytime acquisitions) at equator, spatial resolution of 60 m, and spectral channels as shown in Panel (c) (at left).•Profiles of atmospheric temperature and water vapor, measured with radiosondes and spaceborne sounding instruments or model predictions. •Radiative transfer model to predict radiance at the sensor given atmospheric profiles, length of optical path, and surface temperature, emissivity, and elevation (provided by DEM).Approach•Develop Internet portal to provide interactive plume analysis tools and on-demand modeling.•Statistics-based enhancement of spectral contrast to discriminate eruption plume from met clouds (Panel (b), at left).•Radiative transfer-based analysis tools to confirm presence of eruption plume and materials derived from plumeResultsOn-demand detection and tracking of eruption plumes via Internet portal, with 2 (1 day + 1 night) HyspIRI revisits per 5 day cycle at equator, and more frequent coverage at higher latitudes.
Copyright 2009 California Institute of Technology. Government sponsorship acknowledged 31
Q2. Wildfires:
• How are global fire regimes (fire location, type, frequency, and intensity) changing in response to changing climate and land use practices? [DS 198]
• Are regions becoming more fire prone? [DS 196]
• What is the role of fire in global biogeochemical cycling, particularly atmospheric composition? [DS 195]
• Are there regional feedbacks between fire and climate change?
Science Questions Topic Areas

Copyright 2009 California Institute of Technology. Government sponsorship acknowledged
TQ2a: How are global fire regimes (fire location, type, frequency, and intensity)
changing in response to changing climate and land use practices? [DS 198]
Science issue Fire regimes vary considerably on a regional and global scale. Mapping fire location, type, frequency, and intensity at different times can contribute to an understanding of how they are affected by a changing climate and land use patterns.
Tools Requires long-term regional or global data sets of thermal infrared imagery (low and normal gain channels at 4 and 11 µm). HyspIRI TIR data has a significantly improved capability of mapping flaming and smoldering fires. HyspIRIs greatly expanded spatial and temporal coverage can provide large sample sizes. Requires further pre-fire and post-fire thematic maps of climate variables and land use.
Approach The HyspIRI thermal infrared data will provide large samples of detailed fire characteristics that are useful for statistical modeling of fires and their behavior. The database of fire detections can be analyzed in conjunction with thematic data sets of climate and land use.
MODIS active fire detections 2000-2006 for Southern California
2001-2004 mean annual burned area derived from Terra MODIS active fire observations (top) and accompanying one-sigma uncertainties (bottom), expressed as fraction of grid cell that burns each year. From Giglio et al. (2005), Atmos. Chem. Phys. Discuss., 5, 11091-11141

Copyright 2009 California Institute of Technology. Government sponsorship acknowledged 33
Wildfires: How are global fire regimes changing?
Central Siberia
30 May 2001
30 m ASTER scene with
MODIS pixels superimposed (black squares)
High resolution thermal instrument can distinguish between the forest and non-forest parts of the flaming front allowing the fire type, intensity, etc., to be determined which indicates fire regime.
White squares show fire pixels detected by MODIS. Insufficient information to detect fire type
MIR band provides radiant flux to estimate rate at which biomass combusted and instantaneous emission estimate
HyspIRI will provide high spatial resolution mid to thermal infrared data for determining the fire regime and allowing flux estimation on a weekly basis

Copyright 2009 California Institute of Technology. Government sponsorship acknowledged 34
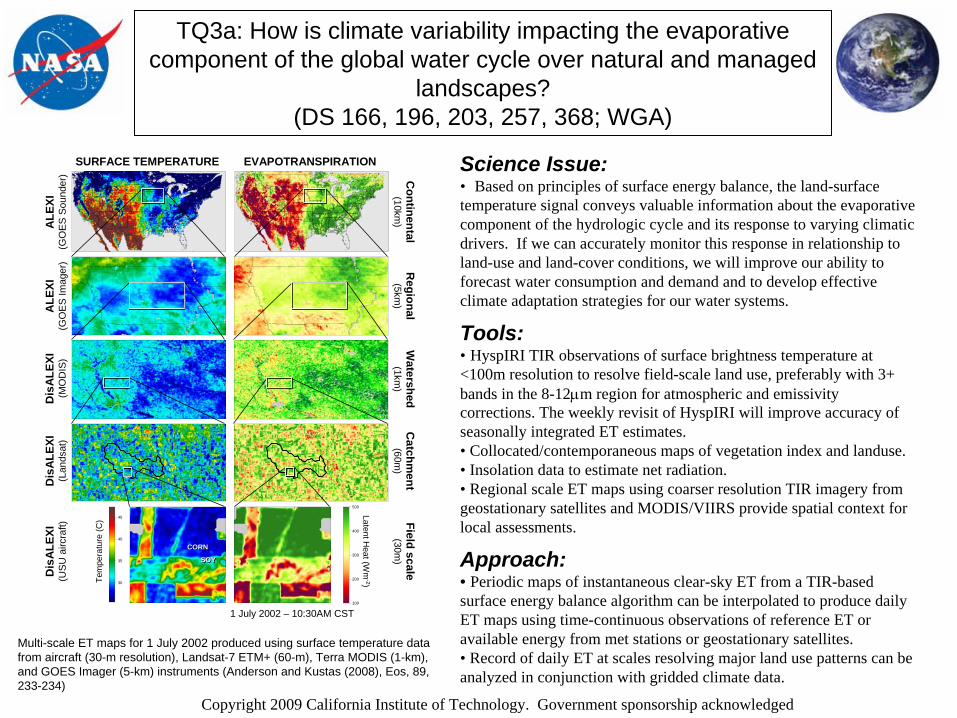
Q3. Water Use and Availability:
• How is climate variability impacting the evaporative component of the global water cycle over natural and managed landscapes? (DS 166, 196, 203, 257, 368; WGA)
• How can information about evapotranspiration and its relationship to land- use/land-cover be used to facilitate better management of freshwater resources? [DS 196, 203, 368]
• How can we improve early detection, mitigation, and impact assessment of droughts at local to global scales? [DS 166, 196, 203, 368]
• What is the current global irrigated acreage, how is it changing with time, and are these changes in a sustainable balance with regional water availability? [DS 196, 368]
• Can we increase food production in water-scarce agricultural regions while improving or sustaining environmental access to water? [DS 196, 368]
Science Questions Topic Areas
Copyright 2009 California Institute of Technology. Government sponsorship acknowledged
Science Issue:• Based on principles of surface energy balance, the land-surface temperature signal conveys valuable information about the evaporative component of the hydrologic cycle and its response to varying climatic drivers. If we can accurately monitor this response in relationship to land-use and land-cover conditions, we will improve our ability to forecast water consumption and demand and to develop effective climate adaptation strategies for our water systems.
Tools:• HyspIRI TIR observations of surface brightness temperature at <100m resolution to resolve field-scale land use, preferably with 3+ bands in the 8-12m region for atmospheric and emissivity corrections. The weekly revisit of HyspIRI will improve accuracy of seasonally integrated ET estimates. • Collocated/contemporaneous maps of vegetation index and landuse.• Insolation data to estimate net radiation.• Regional scale ET maps using coarser resolution TIR imagery from geostationary satellites and MODIS/VIIRS provide spatial context for local assessments.
Approach:• Periodic maps of instantaneous clear-sky ET from a TIR-based surface energy balance algorithm can be interpolated to produce daily ET maps using time-continuous observations of reference ET or available energy from met stations or geostationary satellites.• Record of daily ET at scales resolving major land use patterns can be analyzed in conjunction with gridded climate data.
TQ3a: How is climate variability impacting the evaporative component of the global water cycle over natural and managed
landscapes? (DS 166, 196, 203, 257, 368; WGA)
30
35
40
45
100
200
300
400
500
1 July 2002 – 10:30AM CST
Dis
ALE
XI(L
ands
at)
Dis
ALE
XI(U
SU a
ircra
ft)
Catchm
ent(60m
)Field scale
(30m)
CORNCORN
SOYSOY
SURFACE TEMPERATURE EVAPOTRANSPIRATION
ALE
XI(G
OE
S Im
ager
) Regional(5km
)
ALE
XI(G
OES
Sou
nder
) Continental
(10km)
Tem
pera
ture
(C)
Latent Heat (W
m-2)
Dis
ALE
XI(M
OD
IS)
Watershed
(1km)
Multi-scale ET maps for 1 July 2002 produced using surface temperature data from aircraft (30-m resolution), Landsat-7 ETM+ (60-m), Terra MODIS (1-km), and GOES Imager (5-km) instruments (Anderson and Kustas (2008), Eos, 89, 233-234)
Copyright 2009 California Institute of Technology. Government sponsorship acknowledged 36
HyspIRI Thermal Infrared Multispectral (TIR) Science Measurements
Science Questions:TQ1. Volcanoes/Earthquakes (MA,FF)– How can we help predict and mitigate earthquake and volcanic hazards through
detection of transient thermal phenomena?• TQ2. Wildfires (LG,DR)– What is the impact of global biomass burning on the terrestrial biosphere and
atmosphere, and how is this impact changing over time?• TQ3. Water Use and Availability, (MA,RA)– How is consumptive use of global freshwater supplies responding to changes in climate
and demand, and what are the implications for sustainable management of water resources?
• TQ4. Urbanization/Human Health, (DQ,GG)– How does urbanization affect the local, regional and global environment? Can we
characterize this effect to help mitigate its impact on human health and welfare?• TQ5. Earth surface composition and change, (AP,JC)– What is the composition and temperature of the exposed surface of the Earth? How do
these factors change over time and affect land use and habitability?
Measurement:
• 7 bands between 7.5-12 µm and 1 band at 4 µm
• 60 m resolution, 5 days revisit
• Global land and shallow water
Volcanoes
Urbanization
Water Use and Availability
Surface Temperature Evapotranspiration
Andean volcano heats up
0
0.1
0.2
0.3
0.4
0.5
0.6
0.7
0.8
0.9
1
3.00 4.00 5.00 6.00 7.00 8.00 9.00 10.00 11.00 12.00 13.00Wavelength (um)
Rel
ativ
e Sp
ectr
al R
espo
nse
H1 (m21)H2 (m28)H3 (a10)H4 (a11)H5 (a12)H6H7H8 (m32)
Multispectral Scanner: 66kg / 78W
Schedule: 4 year phase A-D, 3 years operations
High Heritage
TIR
Copyright 2009 California Institute of Technology. Government sponsorship acknowledged
HyspIRI Outline
• HyspIRI and the NRC Decadal Survey • HyspIRI Study Groups• HyspIRI Science• HyspIRI Measurements and Mission• More information on the HyspIRI Mission• 2009 HyspIRI Science Workshop

Copyright 2009 California Institute of Technology. Government sponsorship acknowledged
HyspIRI Science Measurements- VSWIR (aka PPFT)
38

Copyright 2009 California Institute of Technology. Government sponsorship acknowledged 39
HyspIRI Imaging Spectroscopy Science Measurements
Science Questions:• What is the composition, function, and health of
land and water ecosystems? • How are these ecosystems being altered by
human activities and natural causes? • How do these changes affect fundamental
ecosystem processes upon which life on Earth depends?
Red tide algal bloom in Monterey Bay, CA
Map of dominant tree species, Bartlett Forest, NH
Imaging spectrometer: 87kg / 38W
Schedule: 4 year phase A-D, 3 years operations
All components have flown in space
Measurement:• 380 to 2500 nm in 10nm bands• Accurate location 60 m spatial• 19 days revisit • Global land and shallow water
Aquatic Terrestrial

Copyright 2009 California Institute of Technology. Government sponsorship acknowledged 40
HyspIRI VSWIR Science Measurements
• Measure the global land and coastal/shallow water (> -50m).
• 19 day equatorial revisit to generate seasonal and annual products.
Spatial 1000 m
• Measure the molecular absorption and constituent scattering signatures in the spectral range from 380 to 2500 nm at 10 nm, and at 60 m spatial sampling.
PPFT at 60 m

Copyright 2009 California Institute of Technology. Government sponsorship acknowledged 41
SpectralRange 380 to 2500 nm in the solar reflected spectrumSampling <= 10 nm {uniform over range}Response <= 10 nm (full-width-at-half-maximum) {uniform over range}Accuracy <0.5 nm
RadiometricRange & Sampling 0 to 1.5 X max benchmark radiance, 14 bits measuredAccuracy >95% absolute radiometric, 98% on-orbit reflectance, 99.5% stabilityPrecision (SNR) See spectral plots at benchmark radiancesLinearity >99% characterized to 0.1 %Polarization <2% sensitivity, characterized to 0.5 %Scattered Light <1:200 characterized to 0.1%
SpatialRange >145 km (12 degrees at ~700 km altitude)Cross-Track Samples >2400Sampling <=60 mResponse <=60 m sampling (FWHM)
UniformitySpectral Cross-Track >95% cross-track uniformity {<0.5 nm min-max over swath}Spectral-IFOV-Variation >95% spectral IFOV uniformity {<5% variation over spectral range}
HyspIRI VSWIR Science Measurement Characteristics

Copyright 2009 California Institute of Technology. Government sponsorship acknowledged 42
TemporalOrbit Crossing 11 am sun synchronous descendingGlobal Land Coast Repeat 19 days at equatorRapid Response Revisit 3 days (cross-track pointing)
Sunglint AvoidanceCross Track Pointing 4 degrees in backscatter direction
OnOrbit CalibrationLunar View 1 per month {radiometric}Solar Cover Views 1 per week {radiometric}Surface Cal Experiments 3 per year {spectral & radiometric}
Data CollectionLand Coverage Land surface above sea level excluding ice sheetsWater Coverage Coastal zone -50 m and shallowerSolar Elevation 20 degrees or greaterOpen Ocean Averaged to 1km spatial samplingCompression >=3.0 lossless
HyspIRI VSWIR Science Measurements Characteristics
Copyright 2009 California Institute of Technology. Government sponsorship acknowledged 43
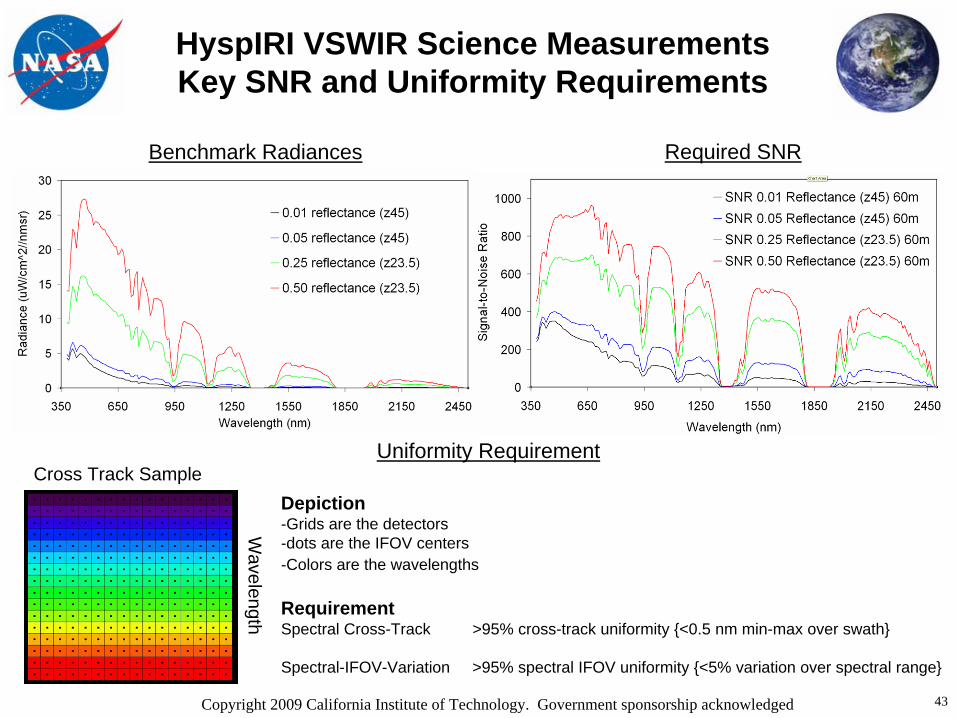
HyspIRI VSWIR Science Measurements Key SNR and Uniformity Requirements
Wavelength
Cross Track SampleDepiction-Grids are the detectors-dots are the IFOV centers-Colors are the wavelengths
RequirementSpectral Cross-Track >95% cross-track uniformity {<0.5 nm min-max over swath}
Spectral-IFOV-Variation >95% spectral IFOV uniformity {<5% variation over spectral range}
Benchmark Radiances
Uniformity Requirement
Required SNR

Copyright 2009 California Institute of Technology. Government sponsorship acknowledged 44
Mission Concept Heritage: NASA Moon Mineralogy Mapper (M3)
Called for in the NRC Decadal Survey
Passed Preship review 3 May 2007- Mouroulis Offner Design (PPFT)- Convex e-beam grating (PPFT)- 6604a MCT full range detector array, multiplexor & signal chain (PPFT)- Uniform slit (PPFT)- 0.5 micron adjustment mounts lockable for flight- Aligned to 95% cross-track uniformity (PPFT)- Aligned to 95% spectral IFOV uniformity (PPFT)- Meets high SNR requirements (PPFT)- Passive radiator (PPFT)
Mass 8 kg, Power 15 Watts
First spectrum 18 Months from funding start
M3 Spectrometer
Cross-track uniformity > 95%

Copyright 2009 California Institute of Technology. Government sponsorship acknowledged
HyspIRI Science Measurements- Thermal Infrared (TIR)
45

Copyright 2009 California Institute of Technology. Government sponsorship acknowledged 46
Science Measurements Summary Measurement Characteristics
SpectralBands (8) µm 3.98 µm, 7.35 µm, 8.28 µm, 8.63 µm, 9.07 µm, 10.53 µm, 11.33 µm, 12.05 Bandwidth 0.084 µm, 0.32 µm, 0.34 µm, 0.35 µm, 0.36 µm, 0.54 µm, 0.54 µm, 0.52 µmAccuracy <0.01 µm
RadiometricRange Bands 2-8= 200K – 400K; Band 1= 1400KResolution < 0.05 K, Linear Quantization to 14 bitsAccuracy < 0.5 K 3-sigma at 250KPrecision (NEdT) < 0.2KLinearity >99% characterized to 0.1 %
SpatialIFOV 60 mMTF >0.65 at FNyScan Type Push-WhiskSwath Width 600 km (±25.5° at 623 km altitude)Cross-Track Samples 10,000Swath Length 15.4 km (+/- 0.7-degrees at 623km altitude)Down-Track Samples 256
Band-to-Band Co-registraion 0.2 pixels (12 m)Pointing Knowledge 1.5 arcsec (0.1 pixels)

Copyright 2009 California Institute of Technology. Government sponsorship acknowledged 47
TemporalOrbit Crossing 11 am sun synchronous descendingGlobal Land Repeat 5 days at equator
OnOrbit CalibrationLunar View 1 per month {radiometric}Blackbody Views 1 per scan {radiometric}Deep Space Views 1 per scan {radiometric}Surface Cal Experiments 2 (d/n) every 5 days {radiometric}Spectral Surface Cal Experiments 1 per year
Data CollectionTime Coverage Day and NightLand Coverage Land surface above sea levelWater Coverage Coastal zone -50 m and shallowerOpen Ocean Averaged to 1km spatial samplingCompression 2:1 lossless
Science Measurements Characteristics Continued

Copyright 2009 California Institute of Technology. Government sponsorship acknowledged 48
Mission Concept Operational Scenario
• Following arrival at science orbit, the baseline data acquisition plan is established. Collect data for entire land surface excluding sea ice (Arctic and Antarctic) every 5 days at 60 m spatial resolution in 8 spectral bands
• Data are downlinked and transferred to the science data processing center where calibration and baseline processing algorithms are applied.
• Level 1, 2 products are delivered to the scientific community and general users to pursue the science questions– With appropriate cloud screening, compositing, spatial, and temporal subsetting
Land and coastal acquisition

Copyright 2009 California Institute of Technology. Government sponsorship acknowledged 49
TIR TRL is High
Subsystem TRL Comments
Scanner 9 Flight Proven on Numerous Designs
Telescope 9 Flight Proven on Galileo SSI, MGS-TES, CZCS, Cassini VIMS, HiRISE
Optical Filters 9 Flight Proven on MODIS, ASTER, Landsat
Focal Plane Assembly 6-7 Similar Detector Materials and ROIC’s Demonstrated on Ground and in Space
Active Cooler 9 Proven on Numerous Flight Programs
Passive Cryocoolers 9 Proven on M3, AIRS. More advanced forms flown on many programs.
Blackbody 9 Proven on MODIS
Mechanical / Thermal Systems 9 Proven on numerous flight missions
Scan Line Corrector N/A There is no scan line corrector!
Electronic Subsystems 6, 9 Exact form proven in Lab, Similar Designs flown on other Space Programs
Copyright 2009 California Institute of Technology. Government sponsorship acknowledged 50
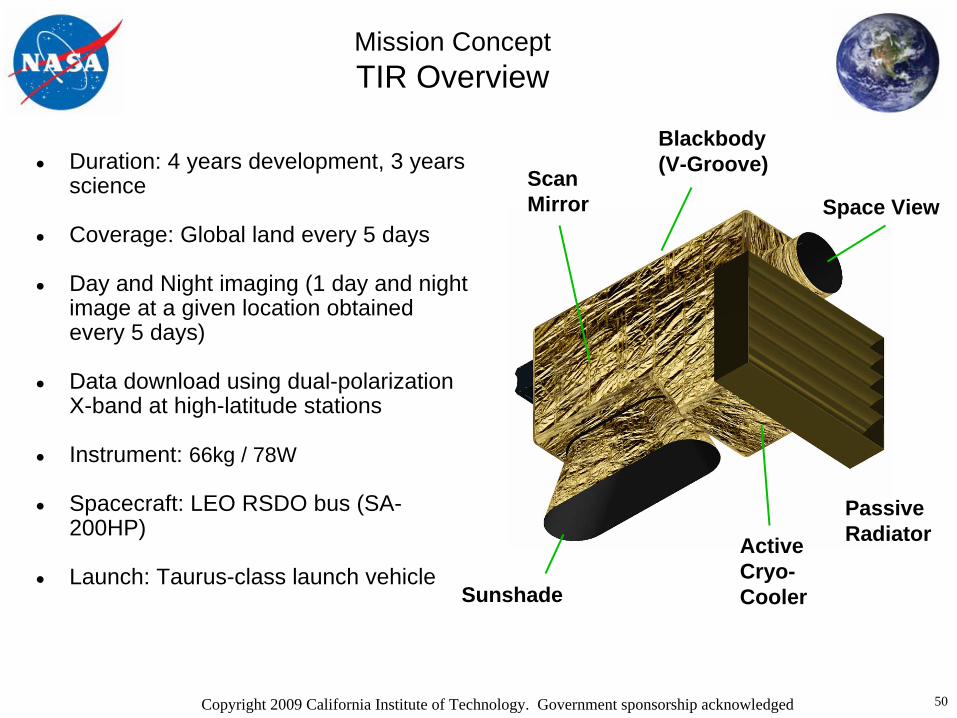
Mission Concept TIR Overview
• Duration: 4 years development, 3 years science
• Coverage: Global land every 5 days
• Day and Night imaging (1 day and night image at a given location obtained every 5 days)
• Data download using dual-polarization X-band at high-latitude stations
• Instrument: 66kg / 78W
• Spacecraft: LEO RSDO bus (SA- 200HP)
• Launch: Taurus-class launch vehicleSunshade
ScanMirror
Blackbody(V-Groove)
Space View
ActiveCryo-Cooler
PassiveRadiator
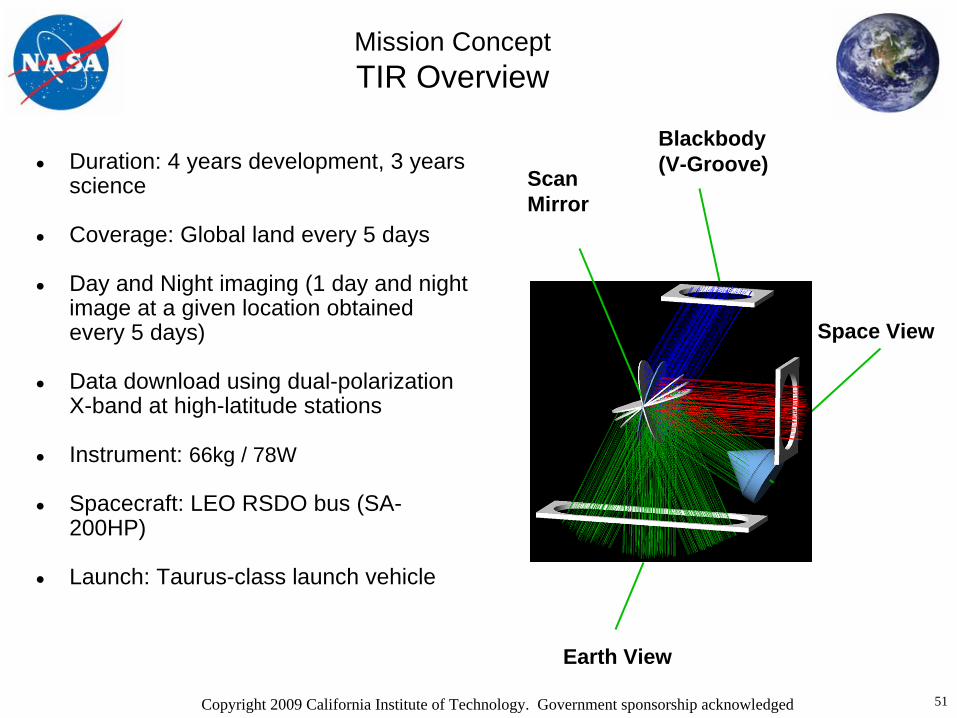
Copyright 2009 California Institute of Technology. Government sponsorship acknowledged 51
Mission Concept TIR Overview
• Duration: 4 years development, 3 years science
• Coverage: Global land every 5 days
• Day and Night imaging (1 day and night image at a given location obtained every 5 days)
• Data download using dual-polarization X-band at high-latitude stations
• Instrument: 66kg / 78W
• Spacecraft: LEO RSDO bus (SA- 200HP)
• Launch: Taurus-class launch vehicle
Earth View
ScanMirror
Blackbody(V-Groove)
Space View

Copyright 2009 California Institute of Technology. Government sponsorship acknowledged
HyspIRI Outline
• HyspIRI and the NRC Decadal Survey • HyspIRI Study Groups• HyspIRI Science• HyspIRI Measurements and Mission • More information on the HyspIRI Mission• 2009 HyspIRI Science Workshop

Copyright 2009 California Institute of Technology. Government sponsorship acknowledged

Copyright 2009 California Institute of Technology. Government sponsorship acknowledged
2009 HyspIRI Science Workshop
NASA will convene a science community workshop on August 11-13, 2009, in Pasadena, CA.
The primary goal of this workshop will be to review the science goals and measurement requirements and also present precursor science results related to the HyspIRI mission concept.
HTTP://HYSPIRI.JPL.NASA.GOV
Sheraton Pasadena Hotel (HyspIRI Science Workshop August 11-13 ) 303 Cordova St. Pasadena, CA 91101 (626) 449-4000 or 1-800-457-7940 Ask for the Reservations Department Request the group rate for the HYSPIRI Meeting